

Page 1

4411-0039-CE
Version 6.C
April 18, 2006
*4411-0039-CE*
Page 2

©Copy
3660 Quakerbridge Rd
Trenton, NJ 08619
TEL: 800-874-9789 / 609-587-9797
FAX: 609-587-1970
right 2003-2006 division of Roper Scientific, Inc. Princeton Instruments, a
All rights reserved. No part of this publication
permission of Princeton Instruments, a division of Roper Scientific, Inc. ("Princeton Instruments").
Printed in the United States of America.
IPLab is a trademark of Scanalytics, Inc.
Macintosh is a registered trademark of Apple Computer, Inc.
Microsoft, Windows, and Windows NT are registered tradem
Pentium is a registered trademark of Intel Corporation.
PVCAM is a registered trademark of Photometrics, Ltd.
Radio Shack is a registered trademark of TRS Quality, Inc.
TAXI is a registered trademark of AMD Corporation
The information in this publication is believed to be accurate as of the publication release date. However,
Princeton Instrum
resulting from the use thereof. The information contained herein is subject to change without notice.
Revision of this publication may be issued to incorporate such change.
ents does not assume any responsibility for any consequences including any damages
may be reproduced by any means without the written
arks of Microsoft Corporation.
Page 3

Table of Contents
Chapter 1 Introduction........................................................................................ 9
Introduction......................................................................................................................... 9
MicroMAX System Components ....................................................................................... 9
About this Manual ............................................................................................................ 12
Environmental Conditions ................................................................................................ 13
Grounding and Safety ....................................................................................................... 13
Precautions........................................................................................................................ 14
Repairs .............................................................................................................................. 14
Cleaning............................................................................................................................ 14
Princeton Instruments Customer Service.......................................................................... 14
Chapter 2 System Component Descriptions.................................................. 15
MicroMAX Camera.......................................................................................................... 15
ST-133 Controller ............................................................................................................. 18
Cables................................................................................................................................ 23
Interface Card ................................................................................................................... 23
Application Software ........................................................................................................ 23
User Manuals ....................................................................................................................24
Chapter 3 Installation Overview....................................................................... 25
Chapter 4 System Setup................................................................................... 27
Unpacking the System ...................................................................................................... 27
Checking the Equipment and Parts Inventory .................................................................. 27
System Requirements........................................................................................................ 28
Verifying Controller Voltage Setting................................................................................ 29
Installing the Application Software .................................................................................. 30
Setting up the Communication Interface .......................................................................... 30
Mounting the Camera ....................................................................................................... 34
Selecting the Shutter Setting............................................................................................. 39
Connecting the Interface (Controller-Computer) Cable ................................................... 39
Connecting the Detector-Controller Cable ....................................................................... 40
Entering the Default Camera System Parameters into WinX (WinView/32,
WinSpec/32, or WinXTest/32)..................................................................................... 40
Chapter 5 Operation.......................................................................................... 43
Introduction....................................................................................................................... 43
EMF and Xenon or Hg Arc Lamps................................................................................... 44
USB 2.0 System On/Off Sequences.................................................................................. 44
Imaging Field of View...................................................................................................... 45
RS-170 or CCIR Video..................................................................................................... 45
First Light (Imaging) ........................................................................................................ 47
First Light (Spectroscopy) ................................................................................................ 52
Exposure and Signal ......................................................................................................... 55
Readout .............................................................................................................................60
Digitization .......................................................................................................................71
iii
Page 4

iv MicroMAX System User Manual Version 6.C
Chapter 6 Advanced Topics............................................................................. 73
Introduction....................................................................................................................... 73
Standard Timing Modes.................................................................................................... 74
Frame Transfer Operation................................................................................................. 78
Interline Operation............................................................................................................ 80
Fast and Safe Speed Modes ..............................................................................................83
TTL Control...................................................................................................................... 85
Kinetics Mode...................................................................................................................89
Chapter 7 MicroMAX DIF Camera (Double Image Feature)........................... 93
Introduction....................................................................................................................... 93
Timing Modes................................................................................................................... 94
Tips and Tricks ...............................................................................................................100
Chapter 8 Virtual Chip Mode .......................................................................... 103
Chapter 9 Troubleshooting ............................................................................ 111
Introduction..................................................................................................................... 111
Baseline Signal Suddenly Changes................................................................................. 112
Camera Stops Working................................................................................................... 112
Camera1 (or similar name) in Camera Name field ......................................................... 112
Changing the ST-133's Line Voltage and Fuses............................................................. 113
Controller Is Not Responding ......................................................................................... 114
Cooling Troubleshooting ................................................................................................ 114
Data Loss or Serial Violation.......................................................................................... 115
Data Overrun Due to Hardware Conflict message.......................................................... 116
Data Overrun Has Occurred message ............................................................................. 116
Demo is only Choice on Hardware Wizard:Interface dialog (Versions 2.5.19.0
and earlier)................................................................................................................ 117
Demo, High Speed PCI, and PCI(Timer) are Choices on Hardware
Wizard:Interface dialog (Versions 2.5.19.0 and earlier) .......................................... 118
Detector Temperature, Acquire, and Focus are Grayed Out (Versions 2.5.19.0
and earlier)................................................................................................................ 120
Error Creating Controller message ................................................................................. 121
Error Occurs at Computer Powerup................................................................................ 121
No CCD Named in the Hardware Wizard:CCD dialog (Versions 2.5.19.0 and
earlier) ...................................................................................................................... 124
Program Error message................................................................................................... 124
Removing/Installing a Plug-In Module .......................................................................... 125
Securing the Detector-Controller Cable Slide Latch ...................................................... 127
Serial violations have occurred. Check interface cable. ................................................. 128
Shutter Malfunctions....................................................................................................... 128
Appendix A Specifications............................................................................. 129
CCD Arrays .................................................................................................................... 129
Temperature Control....................................................................................................... 130
Cooling ........................................................................................................................... 130
Mounting......................................................................................................................... 130
Shutters ........................................................................................................................... 131
Inputs .............................................................................................................................. 131
Outputs............................................................................................................................ 131
Page 5

Table of Contents v
Programmable Interface.................................................................................................. 132
A/D Converter................................................................................................................. 132
Computer Requirements ................................................................................................. 132
Miscellaneous ................................................................................................................. 132
Appendix B Outline Drawings........................................................................ 133
Detectors ......................................................................................................................... 133
ST-133B Controller ........................................................................................................139
ST-133A Controller ........................................................................................................ 139
Appendix C Repumping the Vacuum............................................................ 141
Introduction..................................................................................................................... 141
Requirements .................................................................................................................. 141
Vacuum Pumpdown Procedure....................................................................................... 142
Appendix D Spectrometer Adapters ............................................................. 145
Acton (NTE with or without shutter).............................................................................. 146
Chromex 250 IS (NTE with or without shutter) ............................................................. 147
ISA HR 320 (NTE with or without shutter).................................................................... 148
ISA HR 640 (NTE with or without shutter).................................................................... 149
JY TRIAX family (NTE without shutter)....................................................................... 150
SPEX 270M (NTE with or without shutter) ................................................................... 151
SPEX 500M (NTE with or without shutter) ................................................................... 152
SPEX TripleMate (NTE with or without shutter)........................................................... 153
Appendix E USB 2.0 Limitations.................................................................... 155
Declarations of Conformity ............................................................................ 157
Warranty & Service ......................................................................................... 161
Limited Warranty............................................................................................................ 161
Contact Information........................................................................................................ 164
Index ................................................................................................................. 165
Page 6

vi MicroMAX System User Manual Version 6.C
Figures
Figure 1. MicroMAX Cameras and Controller.................................................................. 9
Figure 2. Power Switch Location (ST-133A and ST-133B)........................................... 18
Figure 3. ST-133 Rear Panel Callouts............................................................................. 19
Figure 4. Shutter Compensation Times ........................................................................... 22
Figure 5. Standard System Diagram ................................................................................ 26
Figure 6. Controller Power Input Module........................................................................ 29
Figure 7. WinView Installation: Interface Card Driver Selection ................................... 30
Figure 8. Bottom Clamps................................................................................................. 37
Figure 9. Bottom Clamp secured to Relay Lens .............................................................. 38
Figure 10. Shutter Setting for 25 mm Internal Shutter .................................................... 39
Figure 11. Camera Detection Wizard - Welcome dialog box.......................................... 41
Figure 12. RSConfig dialog box ...................................................................................... 41
Figure 13. Hardware Setup wizard: PVCAM dialog box ................................................ 42
Figure 14. Block Diagram of Light Path in System........................................................ 43
Figure 15. Imaging Field of View.................................................................................... 45
Figure 16. Monitor Display of CCD Image Center Area................................................. 46
Figure 17. Standard System Connection Diagram........................................................... 47
Figure 18. F-mount Focus Adjustment ............................................................................51
Figure 19. CCD Exposure with Shutter Compensation ................................................... 57
Figure 20. WinView/WinSpec Detector Temperature dialog box.................................. 58
Figure 21. Full Frame at Full Resolution......................................................................... 61
Figure 22. Frame Transfer Readout ................................................................................. 63
Figure 23. Overlapped Mode Exposure and Readout...................................................... 65
Figure 24. Non-Overlapped Mode Exposure and Readout.............................................. 66
Figure 25. 2 × 2 Binning for Full Frame CCD ................................................................ 68
Figure 26. 2 × 2 Binning for Interline CCD .................................................................... 69
Figure 27. Timing tab page.............................................................................................. 73
Figure 28. Free Run Timing Chart (part of the chart in Figure 40) ................................. 74
Figure 29. Free Run Timing Diagram.............................................................................. 75
Figure 30. Showing Shutter "Preopen" & "Normal" Modes in External Sync Operation76
Figure 31. External Sync Timing Diagram (- edge trigger)............................................. 76
Figure 32. Continuous Cleans Flowchart......................................................................... 77
Figure 33. Continuous Cleans Timing Diagram .............................................................. 78
Figure 34. Frame Transfer where tw1 + t
Figure 35. Frame Transfer where tw1 + t
Figure 36. Frame Transfer where Pulse arrives after Readout......................................... 80
Figure 37. Overlapped Mode where tw1 + t
Figure 38. Overlapped Mode where tw1 + t
Figure 39. Overlapped Mode where Pulse arrives after Readout ....................................82
Figure 40. Chart of Safe and Fast Mode Operation ......................................................... 84
Figure 41. TTL In/Out Connector.................................................................................... 87
Figure 42. TTL Diagnostics dialog box........................................................................... 87
Figure 43. Kinetics Readout ............................................................................................ 89
Figure 44. Hardware Setup dialog box ............................................................................ 90
Figure 45. Experiment Setup dialog box ......................................................................... 90
Figure 46. Free Run Timing Diagram.............................................................................. 91
Figure 47. Single Trigger Timing Diagram ..................................................................... 91
Figure 48. Multiple Trigger Timing Diagram.................................................................. 92
+ tc < tR................................................... 79
exp
+ tc > tR................................................... 79
exp
+ tc < tR............................................... 82
exp
+ tc > tR..................................................... 82
exp
Page 7

Table of Contents vii
Figure 49. Free Run Mode Timing Diagram ................................................................... 95
Figure 50. Setup using to Trigger an Event....................................................... 95
Figure 51. Timing for Experiment Setup shown in Figure 50......................................... 95
Figure 52. Timing Diagram for Typical IEC Measurement ............................................ 97
Figure 53. Setup for IEC Experiment with Two Lasers .................................................. 97
Figure 54. Timing Diagram for IEC Experiment with Two Lasers................................. 97
Figure 55. Another Hardware Setup for an IEC Measurement........................................ 98
Figure 56. EEC Timing Example with Exposure Time in Software Set to t
Figure 57. ESABI Timing Example: Image Exposure time = t
Figure 58. Virtual Chip Functional Diagram................................................................. 103
Figure 59. System Diagram ...........................................................................................105
Figure 60. Virtual Chip dialog box................................................................................ 108
Figure 61. Camera1 in Camera Name Field................................................................... 112
Figure 62. Power Input Module..................................................................................... 113
Figure 63. Fuse Holder .................................................................................................. 113
Figure 64. Data Overrun Due to Hardware Conflict dialog box.................................... 116
Figure 65. Hardware Wizard: Interface dialog box ....................................................... 117
Figure 66. RSConfig dialog box .................................................................................... 117
Figure 67. Hardware Wizard: PVCAM dialog box .......................................................118
Figure 68. Hardware Wizard: Interface dialog box ....................................................... 118
Figure 69. RSConfig dialog box: Two Camera Styles .................................................. 119
Figure 70. Hardware Wizard: PVCAM dialog box .......................................................119
Figure 71. RSConfig dialog box: Two Camera Styles .................................................. 120
Figure 72. Error Creating Controller dialog box ........................................................... 121
Figure 73. Hardware Wizard: Detector/Camera/CCD dialog box ................................. 124
Figure 74. Program Error dialog box............................................................................. 124
Figure 75. Module Installation....................................................................................... 125
Figure 76. Serial Violations Have Occurred dialog box................................................ 128
Figure 77. Rectangular Camera Head: C-Mount ........................................................... 133
Figure 78. Rectangular Camera Head: F-Mount............................................................ 134
Figure 79. Rectangular Camera Head: Spectroscopy Mount with Shutter .................... 135
Figure 80. Rectangular Camera Head: Spectroscopy Mount without Shutter ............... 136
Figure 81. 1 MHz and 100kHz/1MHz Round Head Camera: C-Mount Adapter and
Shutter..................................................................................................................... 137
Figure 82. 1 MHz Round Head Camera: F-Mount Adapter .......................................... 138
Figure 83. ST-133B Controller Dimensions.................................................................. 139
Figure 84. ST-133A Controller Dimensions.................................................................. 139
Figure 85. Vacuum Connector Required for Pumping .................................................. 142
Figure 86. Removing the Back Panel ............................................................................ 142
Figure 87. Attaching the Vacuum Connector ................................................................ 143
Figure 88. Opening the Camera to the Vacuum System................................................ 143
set in software ....... 100
exp
............. 99
exp
Tables
Table 1. ST-133 Shutter Drive Selection.........................................................................
Table 2. PCI Driver Files and Locations ......................................................................... 31
Table 3. USB Driver Files and Locations........................................................................ 34
Table 4. Bottom Clamps for Different Microscopes........................................................ 37
Table 5. ST-133 Shutter Setting Selection....................................................................... 39
Table 6. Approximate Readout Time for the Full-Frame CCD Array............................. 62
21
Page 8

viii MicroMAX System User Manual Version 6.C
Table 7. Approximate Readout Time for the Frame-Transfer CCD Array...................... 63
Table 8. Approximate Readout Time for the Interline CCD Arrays................................ 67
Table 9. Readout Rates for PI 1300 × 1030 Array at 1 MHz .......................................... 67
Table 10. Well Capacity for some CCD Arrays .............................................................. 70
Table 11. Detector Timing Modes ................................................................................... 74
Table 12. Bit Values with Decimal Equivalents: 1 = High 0 = Low .............................. 86
Table 13. TTL In/Out Connector Pinout.......................................................................... 87
Table 14. MicroMAX:512BFT: Virtual Chip Size, Exposure Time, and Frames per
Second..................................................................................................................... 104
Table 15. I/O Address & Interrupt Assignments before Installing Serial Card ............. 122
Table 16. I/O Address & Interrupt Assignments after Installing Serial Card................ 122
Table 17. MicroMAX Model and CCD Types Cross Reference ................................... 129
Table 18. Shutter Compensation Times......................................................................... 131
Table 19. Features Supported under USB 2.0................................................................ 156
Page 9
Chapter 1 Introduction
Introduction
The Princeton Instruments MicroMAX system is a high-speed, low-noise CCD camera
system designed for demanding imaging applications and is an optimal system for use in
fluorescence microscopy applications such as high-resolution immunofluorescence, FISH
or GFP imaging. The MicroMAX system incorporates a compact camera head, cooled
CCD, advanced exposure-control timing, video output, and sophisticated readout
capabilities.
Among the advantages of the MicroMAX concept are the range of CCD arrays available
and the built-in video output m
interline CCDs to provide true 12-bit images at a readout rate of up to 5 million pixels per
second or with a variety of front or back-illuminated CCDs to provide true 16-bit images.
The built-in video output mode simplifies setup and focusing on the microscope. The
combination of the MicroMAX system with one of a variety of specialty software
packages results in a powerful digital imaging system that can meet most experimental
needs.
Note: "WinView/32" and "WinView" are used throughout this manual when referring to
the application software. Unless otherwise indicated, the information associated with
these terms also applies to Princeton Instruments' WinSpec/32 spectroscopy software.
ode. The system can be configured with a variety of
MicroMAX System Components
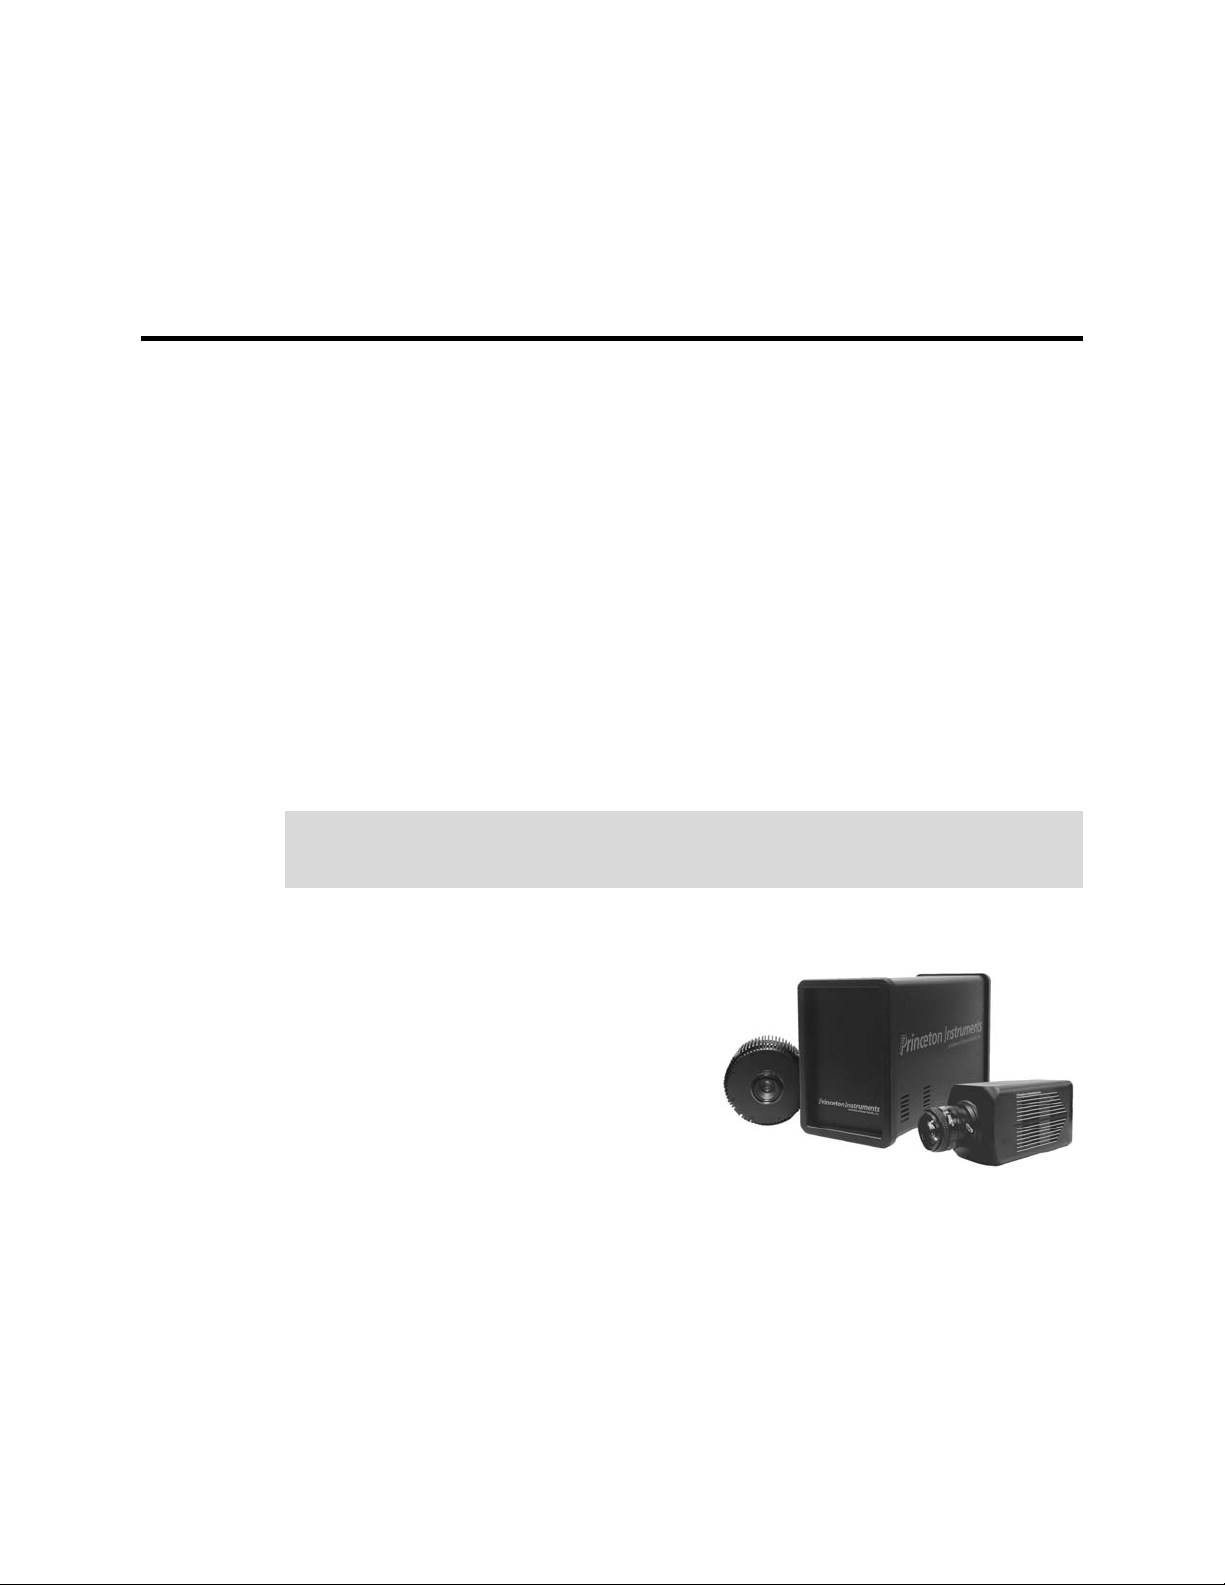
Overview
The MicroMAX imaging system consists of a
camera (either a round head or a rectangular
head depending on application), controller,
digital interface card, a computer, cables,
manuals, and application software. Together,
these components allow you to acquire
quantitative digital data under very low light
imaging conditions. Each component is
optimized for its specific function. In
operation, data acquired by the
camera is routed to the controller and from there to the computer for processing and
display. A composite video output allows immediate viewing of the acquired images on a
separate monitor. The application software (for example, Princeton Instruments
WinView/32) allows the computer to control both the system configuration and data
acquisition.
9
Figure 1. MicroMAX Cameras and
Controller
Page 10

10 MicroMAX System User Manual Version 6.C
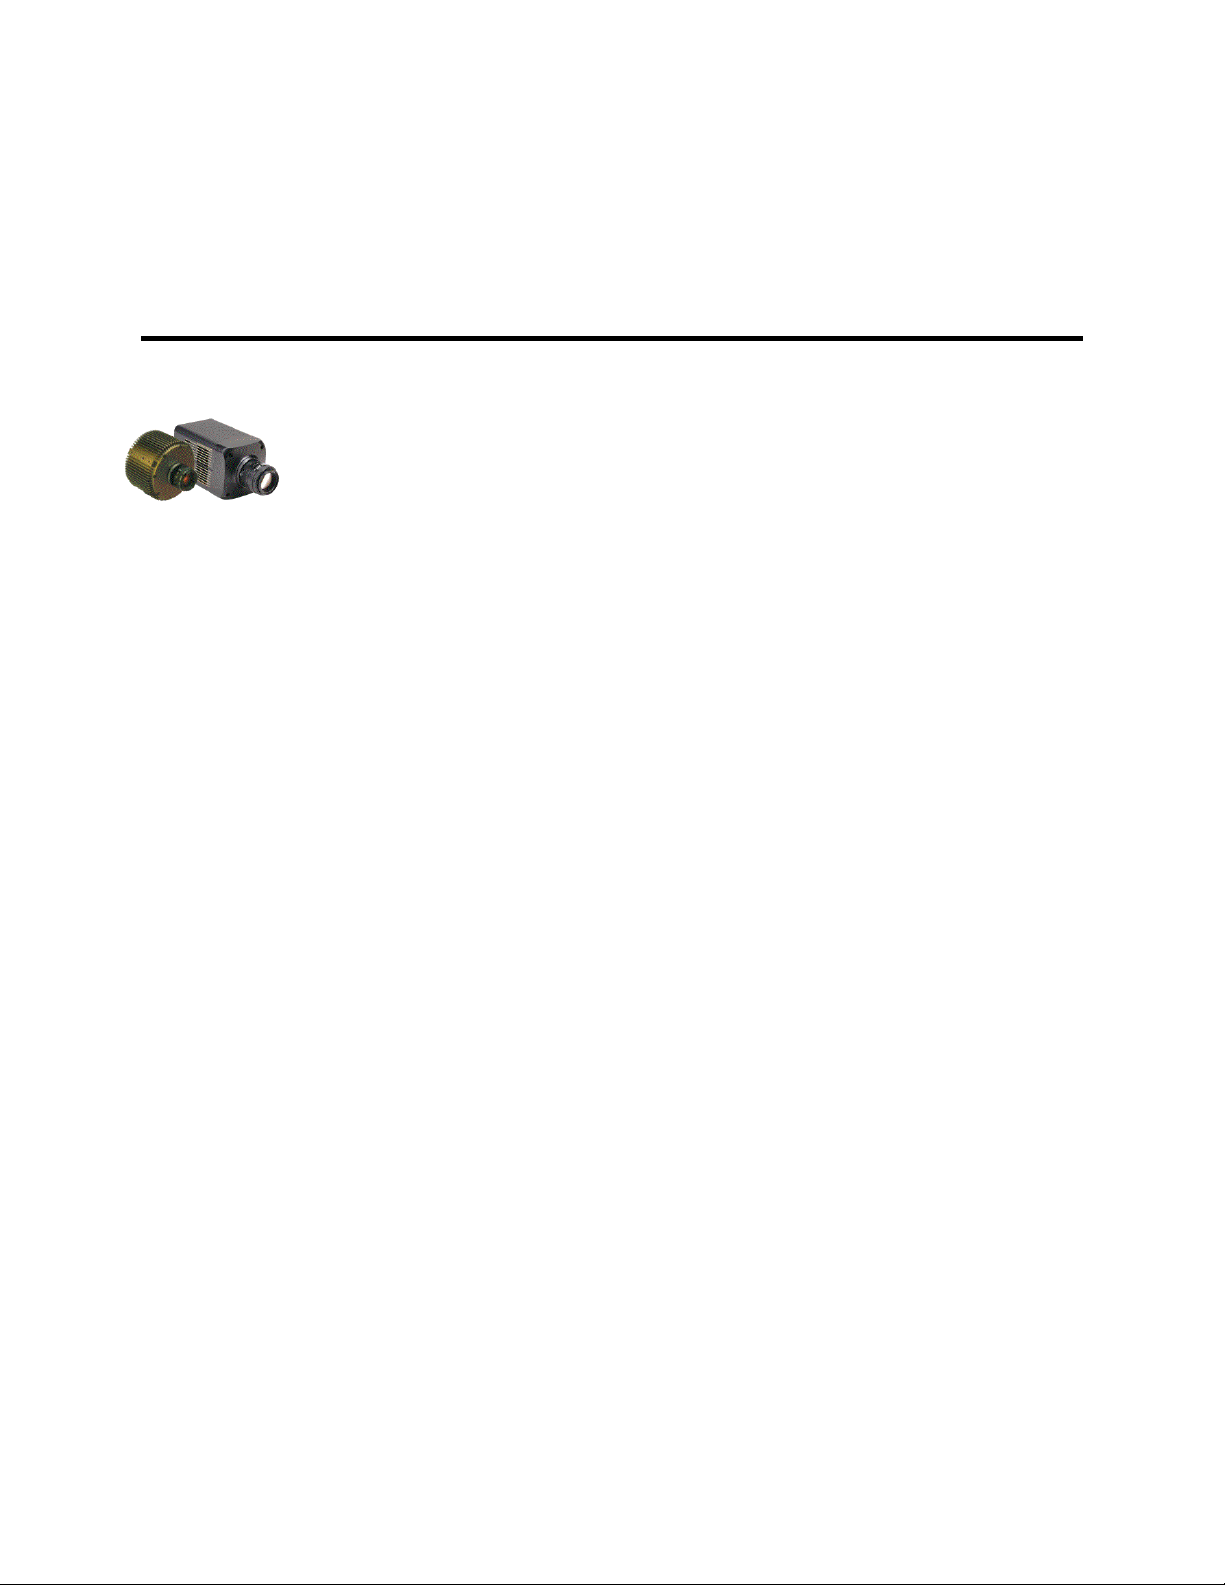
Camera
Introduction: The function of the camera is to collect very low intensity light and
convert the energy into a quantitative, electronic signal (photo-electrons) over a two
dimensional space. To do this, light from the subject is focused onto a CCD array, which
accumulates photoelectrons for the exposure time. At the end of the exposure time, the
image thus formed is read out. The accumulated charge on each cell of the array is
transferred out of the CCD array, amplified, and sent to the controller as an analog signal,
where it is digitized prior to transfer to the computer.
The camera is highly integrated, containing the shutter (if applicable) and thermoelectric
cooler with optional forced-air supplem
Surface mount electronic technology is used wherever possible, giving a compact
package with uncompromising performance.
Depending on your application, the camera included in your MicroMAX system will be
either a com
pact round camera head or a high performance, cooled, rectangular camera
head. The round head features interline CCDs; its small size ensures that the camera can
be mounted on virtually any microscope port, including those found on inverted
microscopes. The rectangular head features back-illuminated CCDs with frame transfer
readout.
ental cooling in a single, shielded housing.
At the heart of the camera is the CCD array centered on the optic axis. Available form
ats
include the:
• EEV CCD57-10, 512×512, 13×13µm pixels for the MicroMAX:512BFT
• EEV CCD47-10, 1024×1024, 13×13µm pixels for the MicroMAX:1024B
• Sony ICX075, 782×582, 8.3× 8.3µm pixels for the MicroMAX:782Yand the
MicroMAX:782YHS systems
• Sony ICX061,1300×1030, 6.7× 6.7µm pixels for the MicroMAX:1300Y, the
MicroMAX:1300YHS, and MicroMAX:1300YHS-DIF systems
A special clocking mode to minimize background signal is supported. See the Princeton
Instruments brochures and data sheets for detailed specifications.
Cooling System: MicroMAX cam
eras have a multi-stage Peltier type cooler that is
thermally coupled to the CCD surface. Heat is sequentially transferred through the Peltier
stages and from there to the outer shell of the camera via a heat transfer block. This
cooling system allows the camera to maintain CCD temperature of typically -15°C for
round cameras head and -45°C for rectangular camera heads. Cameras equipped with a
fan assembly can reach lower CCD temperatures for reduced thermal noise and extended
exposure times.
Low Noise Readout: In order to achieve a low-noise readout of the CCD, several
design features have been im
plemented. These include cooling the preamplifier on the
CCD, isolating circuits to prevent electronic crosstalk and minimizing the path lengths of
critical electronic circuits. The net result of these design features is the lowest available
readout noise at the highest speed possible for these CCDs.
Controller
Data Conversion: The controller accepts the analog data and converts it to digital data
using specially designed, low-noise electronics supporting scientific grade 12- or 16-bit
Analog to Digital (A/D) converters.
Page 11

Chapter 1 Introduction 11
The standard MicroMAX Controller enables both high-speed and high-precision readout
capabilities. It can collect 16-bit images at a readout rate of up to 1 million pixels per
second (1 MHz) in the high-speed mode or at 100 thousand pixels per second (100 kHz)
in the optional precision mode (16-bit). Switching between the two modes is under
software control for total experiment automation.
Modular Design: In addition to containing the power supplies, the controller contains
the analog and digital electronics, scan contro
I/O connectors, all mounted on user-accessible plug-in modules. The design is highly
modularized for flexibility and convenient servicing.
l and exposure timing hardware, and system
Flexible Readout: There is provision for extrem
Readout modes supported include full resolution, simultaneous multiple subimages, and
nonuniform binning. Single or multiple software-defined regions of interest can also be
tested without having to digitize all the pixels of the array
High Speed Data Transfer: Data is transferred directly to the host computer memory
via a high-speed serial link. A proprietary
controller directly into the host computer RAM using Direct Memory Access (DMA).
The DMA transfer process ensures that the data arrives at sufficiently high speed to
prevent data loss from the controller. Since the data transfer rate is much higher than the
output rate from the A/D, the latter becomes the data acquisition rate-limiting factor.
Once the digital data is in RAM, the image acquisition program can transfer the image
into its own working RAM for viewing and further processing.
Note: A frame buffer with standard composite video, either RS-170 (EIA) or CCIR,
whichever was ordered, is also provided.
Interface card places the data from the
ely flexible readout of the CCD.
Applications
With its small size, fully integrated design, cooled CCD and temperature control,
advanced exposure control timing, and sophisticated readout capabilities, the MicroMAX
system is well suited to both general macro imaging and microscopy applications.
Page 12

12 MicroMAX System User Manual Version 6.C
About this Manual
Manual Organization
This manual provides the user with all the information needed to install a MicroMAX
camera and place it in operation. Topics covered include a detailed description of the
camera, installation, cleaning, specifications and more.
Notes:
1. The general identifier "ST-133" is used for both the ST-133A Controller and the
ST-133B Controller. Where there is a difference, the specific identifier is used.
2. "WinX" is a generic term for WinView, WinSpec, and WinXTest application
software.
Chapter 1,
details the structure of this manual; and documents environmental, storage, and
cleaning requirements.
Chapter 2, System Component Descriptions provides descriptions of each
sy
Chapter 1, Installation Overview cross-references sy
relevant manuals and/or manual pages. It also contains system layout diagrams.
Chapter 4, System Setup provides detailed directions for interconnecting the
sy
Chapter 5, Operation discusses num
vacuum degradation, and sensitivity to damage from EMF spikes generated by
Xenon or Hg arc lamps. Includes step-by-step directions for verifying system
operation.
Chapter 6, Advanced Topics discusses standard tim
External Sync, and Continuous Cleans), frame transfer operation, interline
operation, Fast and Safe speed modes, TTL control, and Kinetics mode.
Chapter 7, MicroMAX DIF Camera (Double Image Feature) describes DIF
(Dual Im
Chapter 8, Virtual Chip Mode describes how to set up and use the Virtual Chip
option, a special fast-acquisition technique.
Introduction briefly describes the MicroMAX family of cameras;
stem component.
stem setup actions with
stem components.
ber of topics, including temperature control,
ing modes (Free Run,
age Feature) camera and its operation.
Chapter 9, Troubleshooting provides courses of action to take if y
have problems with your system.
Appendix A, Specifications includes controller and camera specifications.
Appendix B, Outline Drawings includes outline drawings of the MicroMAX
eras and the ST-133A and ST-133B Controllers.
cam
Appendix C, Repumping the Vacuum explains how to restore the 1 MHz or
100kHz/1MHz round head cam
time.
Appendix D, Spectrometer Adapters provides m
spectrometer adapters available for MicroMAX rectangular head (NTE) cameras.
era's vacuum if that vacuum has deteriorated over
ounting instructions for the
ou should
Page 13
Chapter 1 Introduction 13
Appendix E, USB 2.0 Limitations covers the currently known limitations
associated with operating under the USB 2.0 interface.
Declarations of Conformity contains the Declaration of Conform
(includes 100 kHz/1MHz) MicroMAX systems.
Warranty and Service provides warranty and customer support contact
inform
ation.
Safety Related Symbols Used in This Manual
Caution! The use of this symbol on equipment indicates that one or more
nearby
items should not be operated without first consulting the manual. The
same symbol appears in the manual adjacent to the text that discusses the
hardware item(s) in question.
Caution! Risk of electric shock! The use of this sy
indicates that one or more nearby items pose an electric shock hazard and
should be regarded as potentially dangerous. This same symbol appears in the
manual adjacent to the text that discusses the hardware item(s) in question.
Environmental Conditions
• Storage temperature: < 55°C
• Operating environm
• Relative hum
ent: 0°C to 30°C
idity: ≤50%, non-condensing.
ity for 1 MHz
mbol on equipment
Grounding and Safety
The apparatus described in this manual is of the Class I category as defined in IEC
Publication 348 (Safety Requirements for Electronic Measuring Apparatus). It is
designed for indoor operation only. Before turning on the controller, the ground prong of
the power cord plug must be properly connected to the ground connector of the wall
outlet. The wall outlet must have a third prong, or must be properly connected to an
adapter that complies with these safety requirements.
WARNING
WARNING
If the equipment is damaged, the protective grounding could be disconnected. Do not use
damaged equipment until its safety has been verified by authorized personnel.
Disconnecting the protective earth terminal, inside or outside the apparatus, or any
tampering with its operation is also prohibited.
Inspect the supplied power cord. If it is not compatible with the power socket, replace the
cord with one that has suitable connectors on both ends.
Replacement power cords or power plugs must have the same polarity as that of the
original ones to avoid hazard due to electrical shock.
Page 14

14 MicroMAX System User Manual Version 6.C
Precautions
To prevent permanently damaging the system, please observe the following precautions:
• Always switch off and unplug the ST-133 Controller before changing your system
configuration in any way.
• Never remove the camera’s front window, as it is necessary to maintain vacuum (or
to maintain a dry nitrogen environment).
• The CCD array is very sensitive to static electricity. Touching the CCD can destroy
it. Operations requiring contact with the device can only be performed at the factory.
• Never operate the camera cooled without proper evacuation or backfill. This could
damage the CCD!
• Never connect or disconnect any cable while the MicroMAX system is powered on.
Reconnecting a charged cable may damage the CCD.
• Never prevent the free flow of air through the equipment by blocking the air vents.
Repairs
Cleaning
WARNING!
Repairs must be done by Princeton Instruments. If your system hardware needs repair,
contact Princeton Instruments Customer Service. Please save the original packing
material so you can safely ship the system to another location or return it for repairs.
Turn off all power to the equipment and secure all covers before cleaning the units.
Otherwise, damage to the equipment or personal injury could occur.
Camera and Controller
Although there is no periodic maintenance that must be performed on the camera or the
ST-133 Controller, you may clean these components from time to time by wiping them
down with a clean damp cloth. This operation should only be done on the external
surfaces and with all covers secured. In dampening the cloth, use clean water only. No
soap, solvents or abrasives should be used. Not only are they not required, but they could
damage the finish of the surfaces on which they are used.
Optical Surfaces
Optical surfaces may need to be cleaned due to the accumulation of atmospheric dust. We
advise that the drag-wipe technique be used. This involves dragging a clean cellulose
lens tissue dampened with clean anhydrous methanol over the optical surface to be
cleaned. Do not allow any other material to touch the optical surfaces.
Princeton Instruments Customer Service
Refer to the contact information located on page 164 of this manual.
Page 15
Chapter 2 System Component Descriptions
MicroMAX Camera
CCD Array: MicroMAX offers a choice of CCD technologies to improve quantum
efficiency (QE) and blue/green sensitivity. Arrays are available in full-frame, interline,
and frame-transfer formats. Thinned, back-illuminated devices have a higher QE across
the entire visible spectrum and far superior sensitivity in the blue/ green region than
front-illuminated CCDs. The MicroMAX combines back-illumination technology with
frame-transfer readout to provide high sensitivity with nonshuttered operation. Interlinetransfer CCDs contain alternate columns of imaging and storage cells.
Because the charge on each image pixel never has to transfer m
transfer can be made very quickly without smearing. By attaching microlenses to an
interline-transfer CCD, incident light is directed to the photosensitive areas of the sensor.
As a result, lens-on-chip formats dramatically improve the QE in the blue/green region of
the spectrum while still allowing fast imaging. Since no shutter is required, high-speed
gating and faster focus are possible.
CCD Chamber: The vacuum
contamination as well as insulates it from the warmer air in the camera body. The
inherent low humidity prevents condensation on the cooled surface of the array. The
thermal barrier provided by the vacuum isolates the window from the cooled CCD, keeps
the window from cooling below the dewpoint, and thereby prevents condensation on the
outside of the window.
MicroMAX cameras are normally shipped with a vacuum level of ~10 mTorr or better.
Because this vacuum
components, round head MicroMAX cameras are designed with a built-in vacuum port
that can be used to restore the vacuum to its original level. Instructions for repumping the
vacuum are provided in Appendix C.
Window: The cam
quartz window is integral to the vacuum chamber. By having only one window, the
MicroMAX camera reduces the chance of image degradation due to multiple reflections,
stray light, and interference patterns that may occur with a multiple-window design.
may deteriorate over time due to outgassing of electrical
era has one window in the optical path. The high-quality optical
-sealed CCD chamber protects the CCD from
ore than one row, the
Thermoelectric Cooler: While the CCD accum
electrons, generating dark current. Cooling the CCD enhances the low-light sensitivity by
reducing thermally generated charge. With forced-air assistance the MicroMAX camera’s
thermoelectric cooler is capable of cooling the CCD to -35°C with ±0.04°C stability at
temperature lock.
Cooling is accomplished by mounting the CCD on a cold finger, which in turn is seated
on a therm
stages to the camera body where the heat is then radiated via a fins and removed by
15
oelectric (Peltier-effect) cooler, and then transferring heat through the Peltier
ulates charge, thermal activity releases
Page 16

16 MicroMAX System User Manual Version 6.C
forced air. CCD temperature is controlled and monitored by via the host computer and
the ST-133 Controller.
Shutter: Rectangular head cam
A shutter drive signal is available at the Remote shutter connector on the rear of the
ST-133 Controller or on the rear of the cam
Electronics: The camera electronics enclosure contains the preamplifier and array
driver board. This design keeps all signal leads to the pream
and also provides complete RF shielding.
Speed of data acquisition and dynamic range is determ
converter used (binning on the array is also a factor). MicroMAX cameras are available
with 100 kHz (16-bit A/D), 100 kHz /1 MHz (16-bit A/D), 1 MHz (12-bit A/D), or
1 MHz (16-bit A/D). The dual 16-bit digitizers give you the choice of the 100 kHz A/D
for the better signal-to-noise ratio or the 1 MHz, 16-bit A/D for increased data acquisition
speed.
Connectors: Power, control signals, and data are transm
MicroMAX camera via the 25-pin D connector located on the rear of the 1 MHz or
100kHz/1 MHz camera. The cables and connectors are keyed so that they cannot be
connected incorrectly.
Lens Mount Housing: At the front of the cam
mount or F-mount. The C-mount employs a standard size thread to make the connection
while an F-mount uses a tongue and groove type mechanism to secure the lens or
microscope adapter to the camera. The details of the housing will vary depending on the
type of mount.
eras are available with an internal 25 mm shutter.
era.
plifier as short as possible
ined primarily by the A/D
itted between the ST-133 and the
era is the lens mount housing, either C-
Caution
Note: C-mount cameras are shipped with a dust cover lens installed. Although this lens
is capable of providing surprisingly good images, its throughput is low and the image
quality is not as good as can be obtained with a high-quality camera lens. Users should
replace the dust-cover lens with their own high-quality laboratory lens before making
measurements.
If you have a camera with a UV scintillator coated CCD, protect it from excessive
exposure to UV radiation. This radiation slowly bleaches the scintillator, reducing
sensitivity.
Mounting Holes: The round head camera has four ¼″ x 20 UNC threaded holes on the
camera body at 90° intervals. These holes are provided for flexibility in mounting the
camera to your system optics. The rectangular head camera can be ordered with an
optional tripod mount kit.
Fan: Depending on the cam
camera's back panel. Its purpose is:
• to rem
• to cool the electronics.
An internal Peltier device directly cools the cold finger on which the CCD is m
The heat produced by the Peltier device is then removed by the air drawn into the camera
by the internal fan and exhausted through the back panel. The fan is always in operation
and air cooling of both the Peltier and the internal electronics takes place continuously.
ove heat from the Peltier device that cools the CCD array
era, there may be an internal fan located inside or on the
ounted.
Page 17

Chapter 2 System Component Descriptions 17
The fan is designed for low-vibration and does not adversely affect the image. For the fan
to function properly, free circulation must be maintained between the rear of the camera
and the laboratory atmosphere.
WARNING
Shutter: In imaging applications an adapter is m
either C-mount or F-mount, is mounted to the adapter. An F-mount adapter and a
C-mount adapter differ not only in their lens-mounting provisions, but also in depth
because the focal plane of F-mount lenses is deeper than that of C-mount lenses.
Nevertheless, rectangular head cameras can be ordered with an internal 25 mm shutter
and the appropriate lens mount adapter already installed.
Shutter Life: Note that shutters are m
on the order of a million cycles, although some individual shutters may last a good deal
longer. How long a shutter lasts in terms of experimental time will, of course, be strongly
dependent on the operating parameters. High repetition rates and short exposure times
will rapidly increase the number of shutter cycles and decrease the time when the shutter
will have to be replaced. Possible shutter problems include complete failure, in which the
shutter no longer operates at all, or the shutter may stick open or closed causing
overexposed or smeared images. It may even happen that one leaf of the shutter will
break and no longer actuate.
Shutter replacement is usually done at the factory. If you find that the shutter on your
cam
era is malfunctioning, contact the factory to arrange for a shutter-replacement repair.
Disconnecting or connecting the shutter cable to the camera while the controller is on can
destroy the shutter or the shutter drive circuitry. Always power off the controller before
adjusting the shutter cable.
echanical devices with a finite lifetime, typically
ounted to the camera and then the lens,
Page 18
18 MicroMAX System User Manual Version 6.C
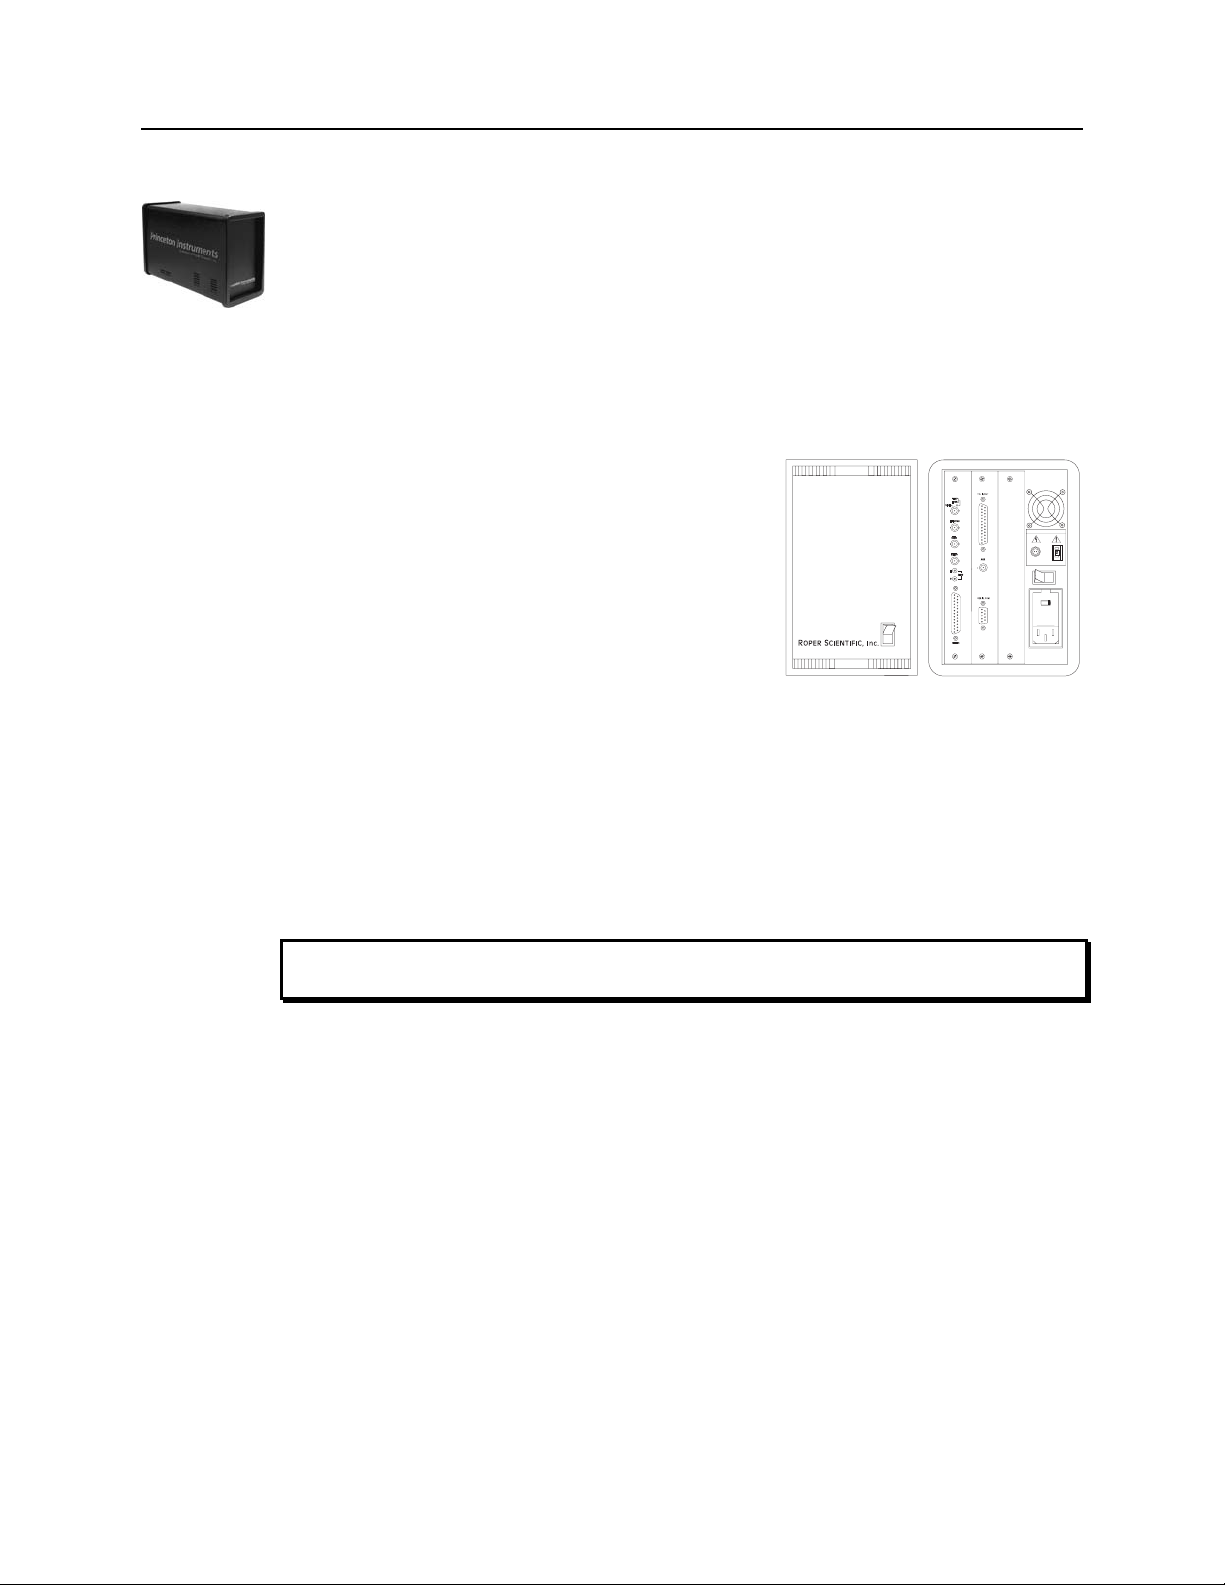
ST-133 Controller
Electronics: The Model ST-133 is a compact, high performance CCD Camera
Controller for operation with Princeton Instruments cameras. Designed for high speed
and high performance image acquisition, the ST-133 offers data transfer at speeds up to 5
Megapixel per second, standard video output for focusing and alignment. A variety of
A/D converters are available to meet different speed and resolution requirements.
In addition to containing the power supply, the controller contains the analog and digital
electronics, scan control and exposure timing hardware, and controller I/O connectors, all
mounted on user-accessible plug-in modules. This highly modularized design gives
flexibility and allows for convenient servicing.
WARNING
POWER Switch and Indicator: The power s
witch
location (see Figure 2) and characteristics depend on the
version of ST-133 Controller that was shipped with y
system. In some versions, the power switch is on the
front and has an integral indicator LED that lights
whenever the ST-133 is powered. In other versions, the
power switch is located on the back of the ST-133 and
does not include an indicator LED.
our
SHUTTER CONTROL
REMOTE
l
~
|
O
120Vac
LEFT: FUSES: RIGHT:
0.75A - T 100 - 120V
1.25 A - T 220 - 240 V
50-60Hz 420 W MAX
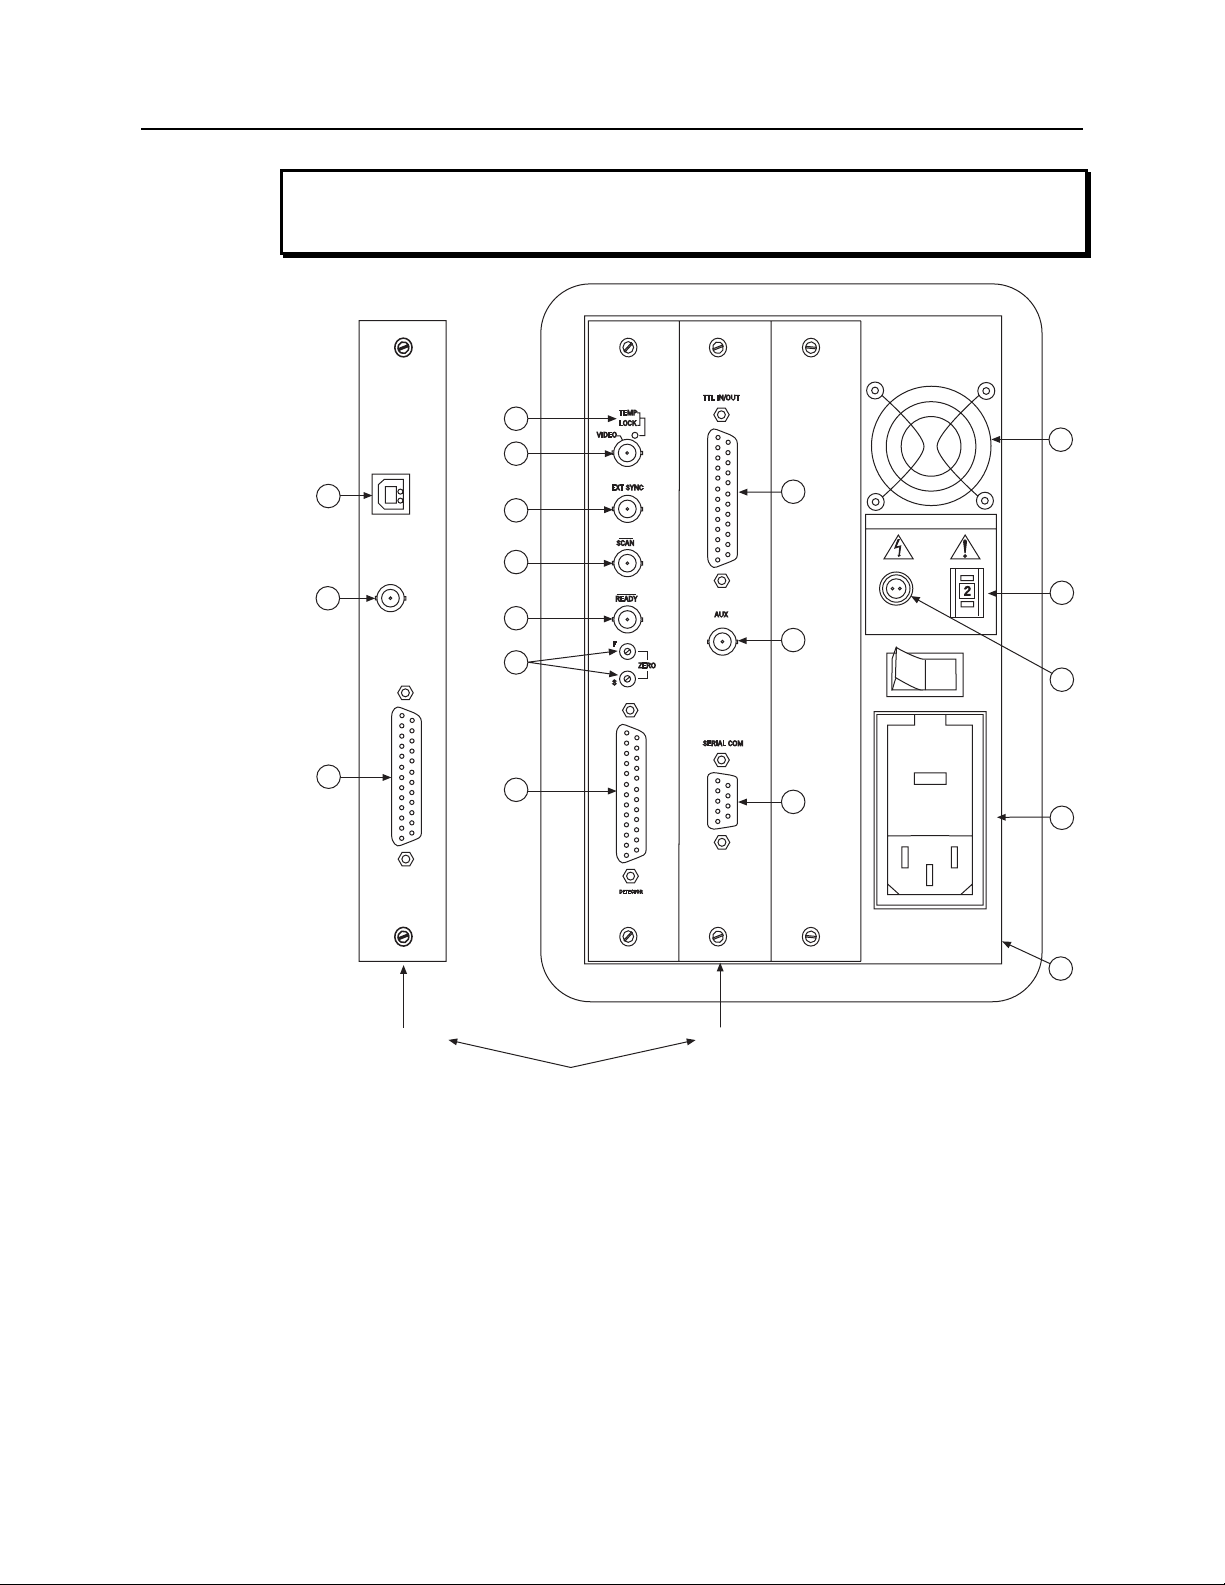
Rear Panel Connectors: There are three controller
board slots. Two are occupied by
the plug-in cards that
provide various controller functions. The third,
Figure 2. Power Switch Location
(ST-133A and ST-133B)
covered with a blank panel, is reserved for future development. The left-most plug-in
card is the Analog/Control module. Adjacent to it is the Interface Control module. Both
modules align with top and bottom tracks and mate with a passive back-plane via a 64pin DIN connector. For proper operation, the location of the modules should not be
changed. Each board is secured by two screws that also ground each module’s front
panel. Removing and inserting boards is described in Chapter 9, pages
125-126.
To minimize the risk of equipment damage, a module should never be removed or
installed when the system is powered.
The Analog/Control Module, which should always be located in the left-most slot,
provides the following functions.
• Pixel A/D conversion • Tim
• CCD scan control • Tem
ing and synchronization of readouts
perature control
• Exposure control • Video output control
SETTING
O
~
3.50A - T
~
1.80A - T
The Interface Control Module, which should alway
provides the following functions.
• TTL In/Out Program
• Com
munications Control (TAXI or USB 2.0 protocol)
mable Interface
s be located in the center slot,
Page 19
Chapter 2 System Component Descriptions 19
WARNING
Always turn the power off at the Controller before connecting or disconnecting any cable
that interconnects the camera and controller or serious damage to the CCD may result.
This damage is NOT covered by the manufacturer’s warranty.
1
11
12
13
14
16
USB 2.0
2
8
3
SHUTTER CONTROL
4
9
AUX
5
REMOTE
SETTING
9
TTL
IN/OUT
8
6
7
10
l
120Vac
O
~
USB 2.0
Interface Control Module
Figure 3. ST-133 Rear Panel Callouts
TAXI
LEFT: FUSES: RIGHT:
0.75A - T 100 - 120V
1.25 A - T 220 - 240 V
50-60Hz 420 W MAX
~
3.50A - T
~
1.80A - T
15
Page 20

20 MicroMAX System User Manual Version 6.C
The descriptions of the rear panel connectors are keyed to the accompanying figure.
Depending on your system, either the TAXI or the USB 2.0 Interface Control Module will be
installed in the second from the left slot (as you face the rear of the ST-133). In
TAXI m
odule is shown in that position.
Figure 3, the
# Feature
1. Temperature Lock LED: Indicates that the temperature control loop has locked and that
the temperature of the CCD array will be stable to within ± 0.05°C.
2. Video/Aux Output: Composite video output is provided at this connector; if labeled Aux,
this output is reserved for future use. The Video output amplitude is 1 V pk-pk and the
source impedance is 75 Ω. Either RS-170 (EIA) or CCIR standard video can be provided
and must be specified when the system is ordered. The video should be connected to the
monitor via 75 Ω coaxial cable and it must be terminated into 75 Ω.
Note that video output is not currently supported under USB 2.0.
3. External Sync Input: TTL input that has a 10 kΩ pullup resistor. Allows data acquisition
and readout to be synchronized with external events. Through software, positive or negative
(default) triggering can be selected.
4. Output WinX/32 (ver. 2.4 and higher) software-selectable NOT SCAN or
SHUTTER signal. Default is SHUTTER. NOT SCAN reports when the controller is
finished reading out the CCD array. NOT SCAN is high when the CCD array is not being
scanned, then drops low when readout begins, returning to high when the process is
finished. The second signal, SHUTTER, reports when the shutter is opened and can be
used to synchronize external shutters. SHUTTER is low when the shutter is closed and
goes high when the shutter is activated, dropping low again after the shutter closes. See
Figure 4 for timing diagram.
5. Output: Initially HIGH. After a Start Acquisition command, this output changes
state on completion of the array cleaning cycles that precede the first exposure. Initially
high, it goes low to mark the beginning of the first exposure. In free run operation it
remains low until the system is halted. If a specific number of frames have been
programmed, it remains low until all have been taken, then returns high.
6. Zero Adjustment: (1 MHz and 100kHz/1 MHz systems) Control the offset values of the
Fast (F) and Slow (S) A/D converters; if potentiometers are not present, bias may be
software-settable. Preadjusted at factory. The offset is a voltage that is added to the signal to
bring the A/D output to a non-zero value, typically 50-100 counts. This offset value
ensures that all the true variation in the signal can really be seen and not lost below the A/D
“0” value. Since the offset is added to the signal, these counts only minimally reduce the
range of the signal from 4095 to a value in the range of 50-100 counts lower. Adjusting a
potentiometer clockwise increases the counts while rotating it counterclockwise decreases
the counts. If potentiometers are not present, bias may be software-settable.
CAUTION: Do not adjust the offset values to zero, or some low-level data will be missed.
7. Detector Connector: (1MHz and 1 MHz/100kHz systems) Transmits control information
to the camera and receives data back from the camera via the Detector-Controller cable.
8. TTL In/Out: User-programmable interface with eight input bits and eight output bits that
can be written to or polled for additional control or functionality. Output is not currently
supported under USB 2.0. See Chapter 6.
9. AUX Output: Reserved for future use.
Page 21
Chapter 2 System Component Descriptions 21
# Feature
10. Serial COM Connector: Provides two-way serial communication between the controller and
the host computer. Uses TAXI protocol. Contact the factory if an application requires use of
the optional fiber-optic data link to increase the maximum allowable distance between the
camera and the computer.
11. Fan: Cools the controller electronics. Runs continuously when the controller is turned on. Do
not block the side vents or the fan exhaust port.
12. Shutter Setting Selector: Sets the shutter hold voltage. Dial is correctly set at the factory
for the camera’s internal shutter if one is present. Refer to Table 1 for setting selection.
13. Remote Shutter Connector: Provides shutter-hold pulses for a 25 mm Princeton
Instruments-supplied external shutter (typically an entrance slit shutter).
WARNING:
connector. To avoid shock hazard, the Controller power should be OFF when connecting
or disconnecting a remote shutter.
Dangerous live potentials are present at the Remote Shutter Power
WARNING: If t
not be used to drive a second external shutter. This configuration will result in under-
powering both shutters and may cause damage to the system In a system which requires
both an internal and an external shutter, use the Shutter signal (provided at the
connector when selected by an internal jumper or by software parameter selection) to
control the external shutter. Suitable driver electronics will additionally be required.
Contact the factory Technical Support Dept. for information.
14. Power Input Module: Contains the powercord socket and two fuses. Depending on the
ST-133 version, the power switch may be located directly above the power module.
15. Fuse/Voltage Label: Displays the controller’s power and fuse requirements. This label
may appear above the power module.
16. USB 2.0 Connector: Provides two-way serial communication between the controller and the
host computer. Uses USB 2.0 protocol.
he camera has an internal shutter, then the Shutter Power connector should
WARNING
: Dangerous live potentials are present at the Remote Shutter Power
connector. To avoid shock hazard, the Controller power should be OFF when connecting
or disconnecting a remote shutter.
Shutter Setting* Shutter Type
1 25 mm Princeton Instruments supplied External shutter
(typically an Entrance slit shutter)
2 25 mm Princeton Instruments Internal shutter
4 35 mm Princeton Instruments Internal shutter (requires
70 V Shutter option), supplied with rectangular head
camera having 1300 × 1340 CCD
5 40 mm Princeton Instruments Internal shutter
* Shutter settings 0, 3, and 6-9 are unused and are reserved for future use.
Table 1. ST-133 Shutter Drive Selection
Page 22
22 MicroMAX System User Manual Version 6.C
WARNING
Selecting the wrong shutter setting will result in improper functioning of the shutter and
may cause premature shutter failure.
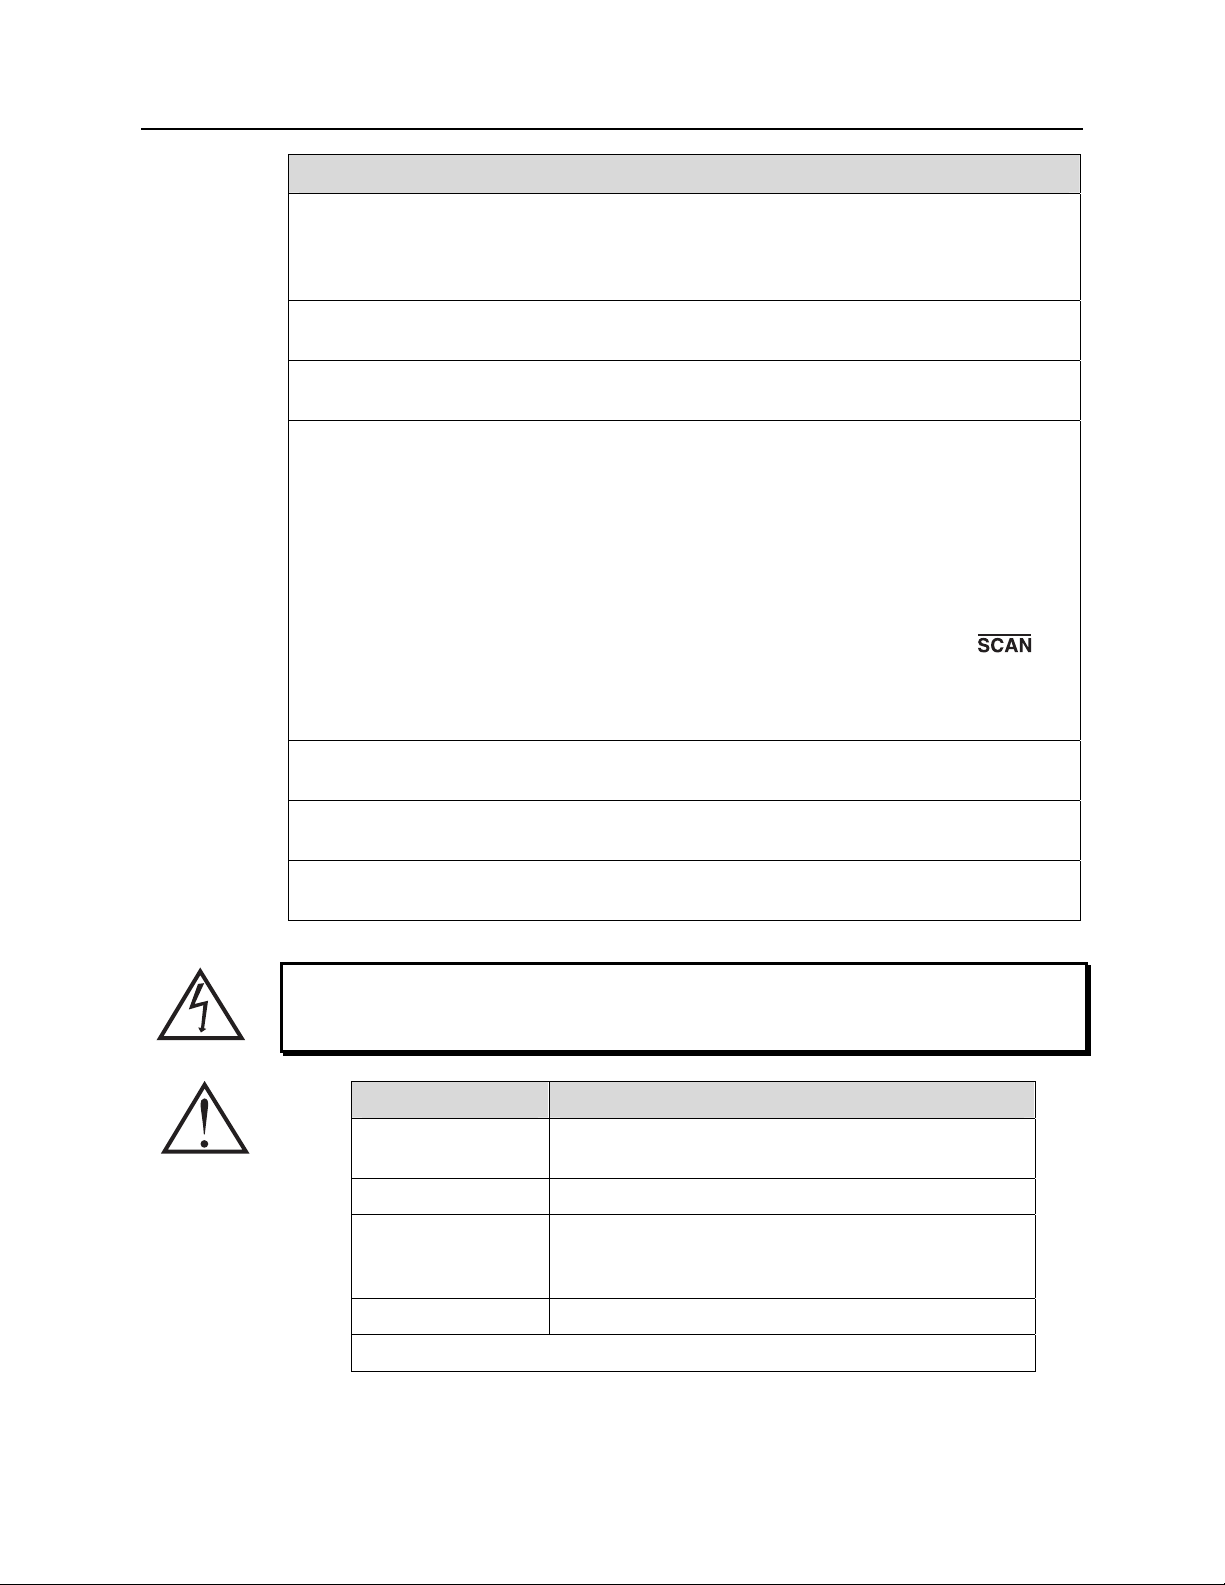
t
exp
Shutter
t
NOTSCAN
t
c
t
= Exposure Time
exp
t
= Readout Time
R
t
= Shutter Compensation Time
c
Shutter Type Compensation Time
NONE 200 nsec
Electronic 6.0 msec
Remote (Roper Scientific 23 mm, External, 8.0 msec
typically a slit shutter)
Small (Roper Scientific 25 mm, Internal) 8.0 msec
Large (Roper Scientific 35/40 mm, External) 28.0 msec
Figure 4. Shutter Compensation Times
R
Page 23
Chapter 2 System Component Descriptions 23
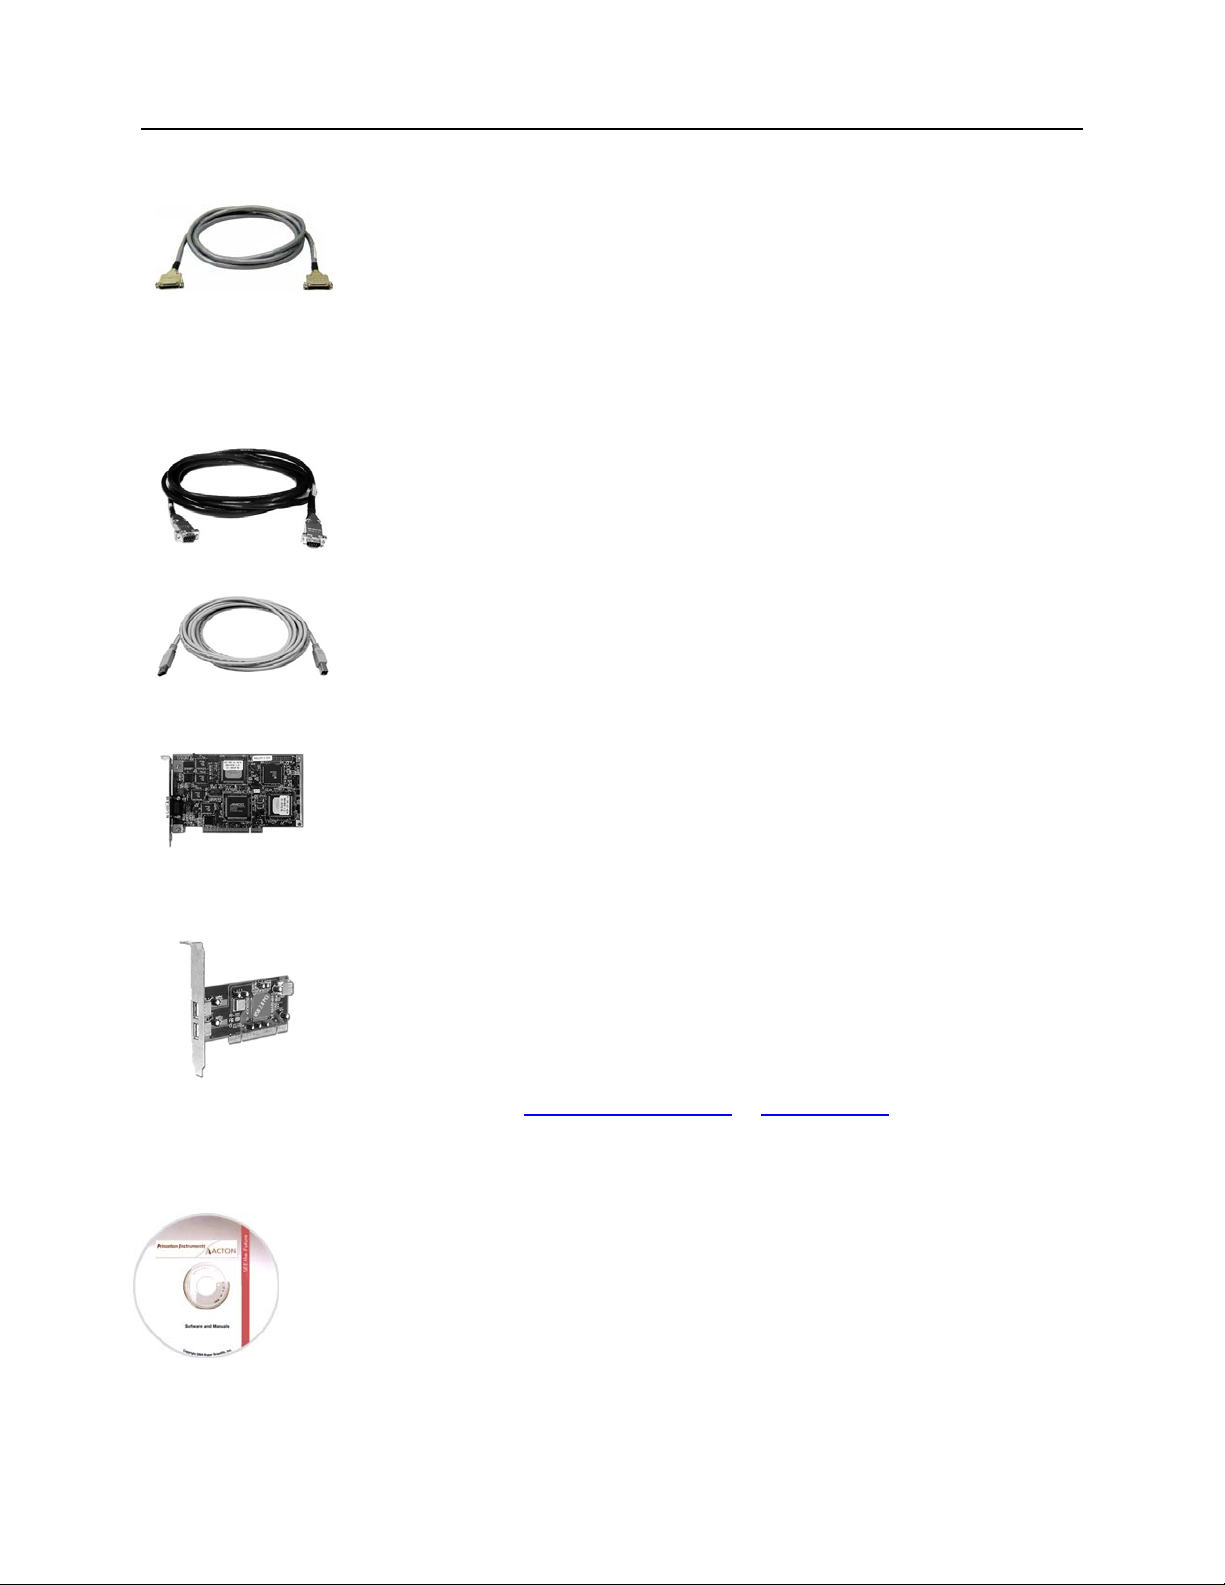
Cables
Detector-Controller: 1 MHz or 100kHz/1MHz systems. The standard 10' cable
(6050-0321) has DB-25 Male connectors with
cable interconnects the Detector connector on the rear of the ST-133 with the
Detector connector on the back of the MicroMAX camera. The Detector-Controller
cable is also available in 6', 15', 20', and 30' lengths.
Interface Cable: Depending on the system configuration, either a TAXI or a USB
cable will be shipped.
slide-latch locking hardware. This
Interface Card
PCI Card: This interface card is required when the system interface uses the TAXI
protocol rather than USB 2.0. The PCI card plugs-into the host computer's
motherboard and provides the serial communication interface between the host
computer and the ST-133. Through WinView/32, the card can be used in either
Speed PCI
interrupt-driven and can give higher performance in some situations.
allows data transfer to be controlled by a polling timer.
USB 2.0 Card: This interface card is required when the system interface uses the
USB 2.0 protocol rather the TAXI protocol and the computer does not have native
USB 2.0 support. The USB 2.0 card plugs-into the host computer's motherboard and
provides the communication interface between the host computer and the ST-133.
The USB 2.0 PCI card (70USB90011) by Orange Micro is recommended for desktop
computers; the SIIG, Inc. USB 2.0 PC Card, Model US2246 is recommended for
laptop computers. See
more information.
TAXI: The standard 25' (7.6 m) cable (6050-0148-CE) has DB-9 Male
connectors with screw-down locking hardware. The TAXI (Serial
munication) cable interconnects the "Serial Com" connector on the rear of
com
the ST-133 with the PCI card installed in the host computer. In addition to the
standard length, this cable is available in 10', 50', 100', and 165' lengths. Also
available are fiber optic adapters with fiber optic cables in 100, 300, and 1000
meter lengths.
USB 2.0: The standard 16.4'
that interconnect the "USB 2.0" connector on the rear of the ST-133 with a
USB card installed in the host computer.
or PCI(Timer) mode. High Speed PCI allows data transfer to be
www.orangemicro.com
(5 m) cable (6050-0494) has USB connectors
High
PCI(Timer)
or www.siig.com, respectively, for
Application Software
The Princeton Instruments WinView/32 software package provides comprehensive image
acquisition, display, processing, and archiving functions so you can perform complete data
acquisition and analysis without having to rely upon third-party software. WinView/32
provides reliable control over all Roper Scientific detectors, regardless of array format
and architecture, via an exclusive universal programming interface (PVCAM
WinView/32 also features snap-ins and macro record functions to permit easy user
customization of any function or sequence.
®
).
Page 24

24 MicroMAX System User Manual Version 6.C
PVCAM is the standard software interface for cooled CCD cameras from Roper
Scientific. It is a library of functions that can be used to control and acquire data from the
camera when a custom application is being written. For example, in the case of Windows,
PVCAM is a dynamic link library (DLL). Also, it should be understood that PVCAM is
solely for camera control and image acquisition, not for image processing. PVCAM
places acquired images into a buffer, where they can then be manipulated using either
custom written code or by extensions to other commercially available image processing
packages.
User Manuals
MicroMAX System User Manual: This manual describes how to install and use the
MicroMAX system components.
WinView/32 User Manual: This manual describes how to install and use the
WinView/32 application program. A PDF version of this manual is provided on the
installation CD. Additional information is available in the program's on-line help.
Page 25

Chapter 3 Installation Overview
The list and diagrams below briefly describe the sequence of actions required to
hookup your system and prepare to gather data. Refer to the indicated references
for more detailed information. This list assumes that the application software is
Princeton Instruments WinView/32.
Action Reference
1. If the system components have not already been unpacked, unpack
them and inspect their carton(s) and the system components for intransit damage. Store the packing materials.
2. Verify that all system components have been received. Chapter 4 System Setup,
3. If the components show no signs of damage, verify that the
appropriate voltage settings have been selected for the Controller.
4. If WinView/32 software is not already installed in the host
computer, install it. In addition to installing the WinView/32
software, this operation will load all of the interface card drivers.
5. If the appropriate interface card is not already installed in the host
computer, shut down the computer and install the interface card.
6. Depending on the application, attach a lens to the camera, mount the
camera to a microscope, or mount the camera to a spectrometer.
7. With the Controller and computer power turned OFF, connect the
interface cable (TAXI or USB) to the Controller and the interface
card in the host computer. Then tighten down the locking hardware.
8. With the Controller power turned OFF, make the camera-to-
controller connections to the back of the Controller. Secure the
latch(es) to lock the cable connection(s).
Chapter 4 System Setup,
27
page
27
page
Chapter 4 System Setup,
29
page
Chapter 4 System Setup,
30
page
WinView/32 manual
Chapter 4 System Setup,
30 or page 32
page
Chapter 4 System Setup,
34, 35, or 38
page
Chapter 4 System Setup,
39
page
Chapter 4 System Setup,
40
page
9. With the Controller power turned OFF, make the camera-to-
controller connections to the back of the Camera. Secure the
latch(es) to lock the cable connection(s).
10. With the Controller power turned OFF, connect the Controller
power cable to the rear of the controller and to the power source.
11. If using a microscope Xenon or an Hg arc lamp, turn it on before
turning on the controller and host computer.
12. Turn the Controller ON.
25
Chapter 4 System Setup,
40
page
Chapter 5 Operation,
44
page
Page 26
26 MicroMAX System User Manual Version 6.C
Action Reference
13. Turn on the computer and begin running the WinX application. WinView/32 manual
14. Run the Camera Detection wizard or load the defaults from the
controller.
Chapter 5 Operation,
40, 48, or 53
page
WinView/32 or
WinSpec/32 m
anual
15. Set the target array temperature. Chapter 5 Operation,
48, 53, or 58
page
16. When the system reaches temperature lock, begin acquiring data in
focus mode.
Chapter 5 Operation,
50 or page 54
page
17. Adjust the focus for the image. Chapter 5 Operation,
50 or page 54
page
Detector-Controller
Camera
Microscope
Detector
Controller
Interface cable
(TAXI or USB 2.0)
110/220
Serial Com
or USB 2.0
110/220
Computer
EXPERIMENT
Figure 5. Standard System Diagram
Page 27

Chapter 4 System Setup
Unpacking the System
During the unpacking, check the system components for possible signs of shipping
damage. If there are any, notify Princeton Instruments and file a claim with the carrier. If
damage is not apparent but camera or controller specifications cannot be achieved,
internal damage may have occurred in shipment. Please save the original packing
materials so you can safely ship the camera system to another location or return it to
Princeton Instruments for repairs if necessary.
Checking the Equipment and Parts Inventory
Confirm that you have all of the equipment and parts required to set up the system. A
complete MicroMAX system consists of a camera, a controller, a computer and other
components as follows.
• Camera to Controller cable: D
this cable are available, one having an external shield and the other not. The shielded
version offers superior noise performance and is required by regulation in some
countries.
• Computer Interface Dependent Components:
• Controller-Computer Interface cable:
• TAX
• USB cable: Five (5) m
• Interface Card:
• TAXI:
• USB 2.0: Native on m
• Vacuum
necessary to refresh the vacuum for round camera heads. Contact the factory
Technical Support Dept. for information on refreshing the vacuum. See page
contact information.
I cable: 25 ft DB9 to DB9 cable (6050-0148-CE) is standard. Lengths
up to 165 ft (50 m) are available. Optional fiber-optic transducers can be
used to extend this distance to as much as 1000 meters or
High Speed PCI Interface board or
(Orange Micro 70USB90011 USB2.0 PCI is recommended for desktop
computers and the SIIG, Inc. USB 2.0 PC Card, Model US2246 is
recommended for laptop computers).
Pumpdown connector (2550-0181): This item is required if it becomes
B25 to DB25, 10 ft (6050-0321). Two versions of
eter cable (6050-0494) is standard.
otherboard or user-provided USB 2.0 Interface Card
164 for
• WinView/32 CD-ROM
• User Manual
27
Page 28

28 MicroMAX System User Manual Version 6.C
System Requirements
Power
Detector: The MicroMAX detector receives its power from the controller, which in turn
plugs into a source of AC power.
Caution
ST-133: The ST-133 Controller can operate from
any one of four different nominal line
voltages: 100, 120, 220, or 240 V AC. Refer to the Fuse/Voltage label on the
back of the ST-133 for fuse, voltage, and power consumption information.
The plug on the line cord supplied with the system
should be compatible with the linevoltage outlets in common use in the region to which the system is shipped. If the line
cord plug is incompatible, a compatible plug should be installed, taking care to maintain
the proper polarity to protect the equipment and assure user safety.
Host Computer
Note: Computers and operating systems all undergo frequent revision. The following
information is only intended to give an approximate indication of the computer
requirements. Please contact the factory to determine your specific needs.
Requirements for the host computer depend on the type of interface, TAXI or USB 2.0,
that will be used for com
requirements are a listed below according to protocol.
TAXI Protocol:
• AT-com
• Windows
patible computer with 200 MHz Pentium
®
2000, or Windows
munication between the ST-133 and the host computer. Those
®
II (or better).
95, Windows® 98SE, Windows® ME, Windows NT®, Windows®
®
XP operating system.
• High speed PCI serial card (or an unused PCI card slot). Com
puters purchased
from Princeton Instruments are shipped with the PCI card installed if High speed
PCI was ordered.
• Minim
um of 32 Mbytes of RAM for CCDs up to 1.4 million pixels. Collecting
multiple spectra at full frame or high speed may require 128 Mbytes or more of
RAM.
• CD-ROM drive.
• Hard disk with a m
inimum of 80 Mbytes available. A complete installation of the
program files takes about 17 Mbytes and the remainder is required for data
storage, depending on the number and size of images or spectra collected. Disk
level compression programs are not recommended.
• Super VGA m
onitor and graphics card supporting at least 256 colors with at least
1 Mbyte of memory. Memory requirement is dependent on desired display
resolution.
• IEEE-488 GPIB port (required by
DG535 Timing Generator, if present). May
also be required by Spectrograph.
• Two-button Microsoft com
patible serial mouse or Logitech three-button
serial/bus mouse.
Page 29

Chapter 4 System Setup 29
USB 2.0 Protocol:
• AT-com
better.
• Windows 2000 (with Service Pack 4), Windows XP (with Service Pack 1) or
later operating sy
• Native USB 2.0 support on the m
Micro 70USB90011 USB2.0 PCI is recommended for desktop; SIIG, Inc. USB
2.0 PC Card, Model US2246 for laptop)
• Minim
• CD-ROM drive.
• Hard disk with a m
program files takes about 17 Mbytes and the remainder is required for data
storage, depending on the number and size of images or spectra collected. Disk
level compression programs are not recommended.
• Super VGA m
1 Mbyte of memory. Memory requirement is dependent on desired display
resolution.
• IEEE-488 GPIB port (required by
also be required by Spectrograph.
• Two-button Microsoft com
serial/bus mouse.
patible computer with Pentium 3 or better processor and runs at 1 GHz or
stem.
other board or USB Interface Card (Orange
um of 256 Mb of RAM.
inimum of 80 Mbytes available. A complete installation of the
onitor and graphics card supporting at least 256 colors with at least
DG535 Timing Generator, if present). May
patible serial mouse or Logitech three-button
Verifying Controller Voltage Setting
The Power Module on the rear of the Controller contains the
voltage selector drum, fuses and the powercord connector. The
appropriate voltage setting is set at the factory and can be seen on
the back of the power module.
Each setting actually defines a range and the setting that is closest
to the actual line voltage should have been selected. The fuse and
power requirem
module. The correct fuses for the country where the ST-133 is to be
shipped are installed at the factory.
Note: On ST-133s, the voltage ranges and fuse ratings may be
printed above or below the power module (Figure 6).
To Check the Controller's Voltage Setting:
1. Look at the lower righthand corner on the rear of the Controller. The current voltage
setting (100, 120, 220, or 240 VAC) is display
2. If the setting is correct, continue with the installation. If it is not correct, follow the
instructions on page
ents are printed on the panel above the power
113 for changing the voltage setting and fuses.
Figure 6. Controller
Power Input Module
ed on the Power Module.
Page 30
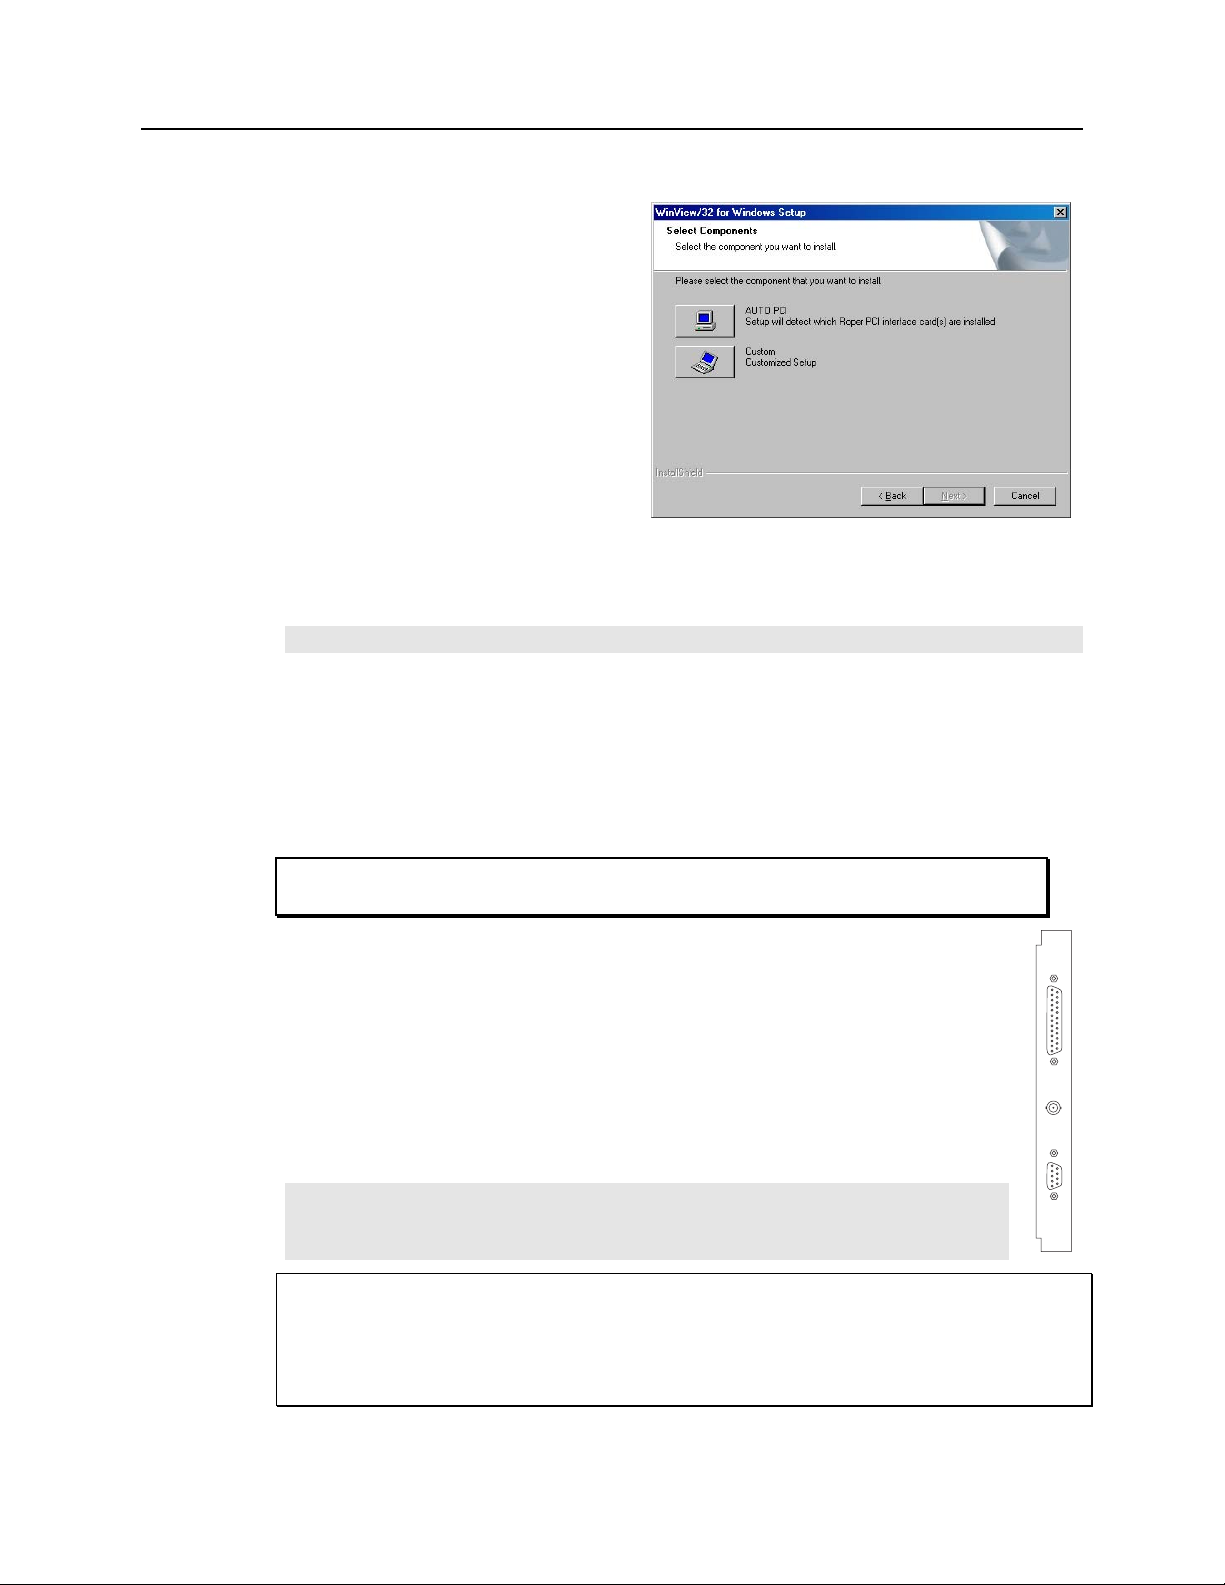
30 MicroMAX System User Manual Version 6.C
Installing the Application Software
Installation is performed via the
WinView/32 installation process. If
you are installing WinView or
WinSpec for the first time, you
should run the installation before
installing the Princeton Instruments
(RSPI) PCI or USB2.0 card in the
host computer. On the
Components
dialog box (see
Figure 7), click on the
button to install the interface card
drivers (the Princeton Instruments
(RSPI) PCI and the USB drivers) and
the most commonly installed
program files. Select the
button if you would like to choose among the available program files.
Note: WinView/32 (versions 2.6.0 and higher) do not support the ISA interface.
Select
AUTO PCI
Custom
Figure 7. WinView Installation: Interface Card
Driver Selection
Setting up the Communication Interface
MicroMAX camera systems require either an installed Princeton Instruments (RSPI) PCI
card or an installed USB2.0 interface card in the host computer. The type of interface
card is dictated by the Interface Control Module installed in the ST-133 controller.
Setting up a PCI Interface
Administrator privileges are required under Windows NT®, Windows® 2000,
and Windows® XP to install software and hardware.
A Princeton Instruments (RSPI) PCI card must be installed in the host computer if
the communication between computer and controller uses the TAXI protocol (i.e.,
Interface Control Module installed in the ST-133 has a 9-pin SERIAL COM
the
connector as shown in the figure at right). With TAXI protocol, the standard cable
provided with an ST-133 is 7.6 meters (25 feet). Cable lengths up to 50 meters
(164 feet) are available and the digitization rate may be as high as 2 MHz.
A computer purchased from Princeton Instruments will be shipped with the PCI card
already
will have to install it in the host computer at your location.
Note: The PCI card can be installed and operated in any Macintosh having a
PCI bus, allowing the ST-133 to be controlled from the Macintosh via IPLab™
software and the PI Extension.
installed. Otherwise, a PCI card will be shipped with the system and you
TTL IN/OUT
AUX
SERIAL COM
Caution
If using WinX software, Select either
High Speed PCI or PCI(Timer) as the Interface
type. This selection is accessed on the Hardware Setup|Interface tab page. High Speed
PCI allows data transfer to be interrupt-driven and gives the highest performance in some
situations. PCI(Timer) allows data transfer to be controlled by a polling timer. This
selection is recommended when there are multiple devices sharing the same interrupt.
Page 31

Chapter 4 System Setup 31
To Install a PCI Serial Buffer Card in the Host Computer:
1. Review the docum
entation for your computer and PCI card before continuing
with this installation.
2. To avoid risk of dangerous electrical shock and dam
age to the computer, verify
that the computer power is OFF.
3. Remove the computer cover and verify that there is an available PCI slot.
Install the PCI card in the slot.
4.
Make sure that the card is firmly seated and secure it.
5.
6. Replace and secure the computer cover and turn on the computer only. If an error
occurs at bootup, either the PCI card was not installed properly or there is an address
or interrupt conflict. Refer to Chapter 9 "Troubleshooting", page
121 for
instructions.
Note: The PCI card has no user-changeable jumpers or switches.
To Install the PCI Card Driver
The following information assumes that you have already installed the WinView/32 or
WinSpec/32 software.
1. After y
ou have secured the PCI card in the computer and replaced the cover, turn
the computer on.
2. At bootup, Windows will try
to install the new hardware. If it cannot locate the
driver, you will be prompted to enter the directory path, either by keyboard entry
or by using the browse function.
If you selected AUTO PCI during the application software installation,
WinView/32 or WinSpec/32 autom
atically put the required INF file into the
Windows/INF directory and put the PCI card driver file in the
"Windows"/System32/ Drivers directory. Refer to
nam
es and locations.
Windows
Version
Windows® 2000
and XP
Windows NT® N/A pi_pci.sys
Windows® 95, 98,
and Windows
®
ME
PCI INF Filename
Located in
"Windows"/INF
directory*
rspi.inf (in WINNT/INF, for
example)
pii.inf pivxdpci.vxd
rspipci.sys (in WINNT/System32/Drivers,
for example)
Table 2 for the appropriate file
PCI Device Driver Name
"Windows"/System32/Drivers
* The INF directory may be hidden.
Table 2. PCI Driver Files and Locations
Located in
directory
Page 32

32 MicroMAX System User Manual Version 6.C
Setting up a USB 2.0 Interface
Administrator privileges are required under Windows NT®, Windows® 2000,
and Windows® XP to install software and hardware.
Your system has been configured to use the USB communication protocol if the Interface
Control Module
right). The advantages to the USB 2.0 interface are that it uses a much higher data transfer
rate than many common serial data formats (such as the TAXI protocol) and it simplifies the
connection to external devices. USB supports "plug and play" -- you do not need to be
heavily involved in the setup process.
USB 2.0 Limitations
• Maxim
• 1 MHz is currently
Controller. Large data sets and/or long acquisition times may be subject
to data overrun because of host computer interrupts during data acquisition.
installed in the ST-133 has a USB 2.0 connector as shown in the figure at
um cable length is 5 meters (16.4 feet)
the upper digitization rate limit for the ST-133
• USB 2.0 is not supported by
DLLS).
• Som
Note: If you are installing the USB 2.0 interface on a laptop, you will need to perform all
of the operations described in this section. In addition, if you are using the recommended
USB Interface Card (SIIG, Inc. USB 2.0 PC Card, Model US2246), you must replace the
OrangeUSB USB 2.0 Host Controller driver installed for that card with the appropriate
Microsoft driver. Instructions for making the replacement are included in "To Update the
OrangeUSB USB 2.0 Driver".
To Update the OrangeUSB USB 2.0 Driver:
This procedure is highly recommended when a laptop computer will be used to
com
municate with the ST-133. As stated before, we recommend the SIIG, Inc. USB 2.0
PC Card, Model US2246 if USB 2.0 is not native to the laptop's motherboard. To reduce
the instances of data overruns and serial violations, the OrangeUSB USB 2.0 Host
Controller installed for the SIIG card, should be replaced by the appropriate Microsoft
driver (Windows 2000 or Windows XP, depending on the laptop's operating system.)
Note: This procedure may also be performed for desktop computers that use the Orange
Micro 70USB90011 USB2.0 PCI.
1. Download and install Microsoft Service Pack 4 (for Windows 2000) or Service
e WinView and WinSpec 2.5.X features are not fully supported with
USB 2.0. Refer to Appendix E, page
Pack 1 (for Windows XP) if the service
the Princeton Instruments PC Interface Library (Easy
155, for more information.
pack has not been installed.
2. From
3. Select System and then System Properties.
4. Select the Hardware tab and click on Device Manager button.
5. Expand Universal Serial Bus Controllers
6. Right-m
the Windows Start menu, select Settings|Control Panel.
.
ouse click on OrangeUSB USB 2.0 Host Controller and select
Properties.
Page 33

Chapter 4 System Setup 33
7. On the Driver tab, click on the Update Driver… button. You may have to wait
a minute or so before you will be allowed to click on the button.
8. When the Upgrade Device Driver wizard appears, click on Next
. Select the
Search for a suitable driver … radio button.
9. On the next screen select the Specify a location
checkbox.
10. Browse and select the location. Click on OK.
11. In the Driver Files Search Results
window, check the Install one of the
other drivers check box.
12. Select the NEC PCI to USB Enhanced Host Controller B1 driver. Click on
and the installation will take place. When the Completing the Upgrade
Next
Device Driver wizard window appears, click on Finish. You will then be
given the choice of restarting the computer now or later. According to the
window text, the hardware associated with the driver will not work until you
restart the computer.
To Install the Princeton Instruments USB2 Interface:
The following information assumes that:
• You have verified that the host computer meets the required specifications
for USB 2.0 communication with the MicroMAX system (see page
• A USB 2.0 board and its driver are installed in the host com
• The ST-133 has an installed USB 2.0 Interface Control m
• You have already
installed the WinX software (versions 2.5.15 and higher).
puter.
odule.
Versions 2.5.15 and higher automatically install the driver and INF files
required to support the USB 2.0 Interface Control module.
29).
1. Before installing the Princeton Instruments USB2 Interface, we recommend
that you defragment the host computer's hard disk. This operation reduces the
time the computer spends locating files. Typically, the "defrag" utility "Disk
®
Defragmenter" can be accessed from the Windows
Start menu and can
usually accessed from the Programs/Accessories/System Tools subdirectory.
2. After defragm
enting the hard disk, turn off the computer and make the USB
cable connections between the host computer and the ST-133. Then, turn the
ST-133 on before turning on the host computer.
3. At bootup, Windows will detect the Princeton Instrum
ents USB2 Interface
hardware (i.e., the USB 2.0 Interface Control module). You may be prompted
to enter the directory path(s) for the apausbprop.dll and/or the apausb.sys
file(s), either by keyboard entry or by using the browse function.
If you selected AUTO PCI during the application software installation, WinX
atically put the required INF, DLL, and USB driver file in the
autom
"Windows" directories shown below. Refer to the
Table 3 for the file
locations.
Page 34

34 MicroMAX System User Manual Version 6.C
Windows
Version
Located in
"Windows"/IN
F directory*
Windows
®
2000
and XP
rsusb2k.inf (in
W
INNT/INF, for
example)
* The INF directory may be hidden.
Mounting the Camera
General
The MicroMAX camera can be mounted either horizontally or vertically (nose up or nose
down). The camera can rest on any secure surface. For mounting flexibility, the round
head camera is equipped with four standard ¼″ x 20 UNC threaded 3/8″ deep holes
spaced at 90° intervals around the body; in some situations it may prove convenient to
secure the camera with a suitable mounting bracket. An optional tripod mount is available
for the rectangular head camera.
USB INF
Filename
Table 3. USB Driver Files and Locations
USB Properties DLL
Located in
"Windows"/System3
2 directory
apausbprop.dll (in
W
INNT/System32, for
example)
USB Device Driver Name
Located in
"Windows"/System32/Driver
s directory
apausb.sys (in
W
INNT/System32/Drivers, for
example)
WARNING
In the case of cameras equipped with F-mount, do not mount the camera in the nose-up
operation where the lens mount would be required to hold the camera’s weight. The
F-mount is not designed to sustain the weight of the camera in this orientation and the
camera could pull free. Contact the factory for special mounting options that enable
operation in this orientation.
Should the camera be mounted in the nose-up position beneath a table, take care to
protect the mounting components from lateral stresses, such as might occur should
someone accidentally bump the camera with a knee while working at the table. Two
possible approaches to this problem would be to install a securely mounted bracket to the
camera or to install a barrier between the camera and operator so as to prevent any
accidental contact.
There are no special constraints on nose-down operation. Again, however, good
operating practice m
ight make it advisable to use a securing bracket to prevent accidental
contact from unduly stressing the mounting components.
If the camera is going to be mounted to a microscope, the lens mounting instructions that
follow will not apply
discussion and instead review "Mounting to a Microscope", beginning on page
. Where this is the case, users are advised to skip the following
35.
Mounting the Lens
The MicroMAX camera is supplied with the lens mount specified when the system was
ordered, normally either a screw-type C-mount lens or a bayonet type F-mount lens,
allowing a lens of the corresponding type to be mounted quickly and easily.
C-mount lenses simply screw clockwise into the threaded lens mount at the front of the
era. In mounting a C-mount lens, tighten it securely by hand (no tools).
cam
Page 35

Chapter 4 System Setup 35
Note: C-mount cameras are shipped with a dust cover lens installed (identifiable by its
red rim). Although this lens is capable of providing images, its throughput is low and the
image quality is not as good as can be obtained with a high quality camera lens. You
should replace the dust cover lens with your own high quality laboratory lens before
making measurements.
To mount an F-mount lens on the camera, locate the large indicator dot on the side of the
lens. There is a corresponding dot on the front side of the cam
dots and slide the lens into the mount. Then turn the lens counterclockwise until a click is
heard. The click means that the lens is now locked in place.
era lens mount. Line up the
Removing either type lens is equally simple. In the case of a C-m
the lens counterclockwise until it is free of the mount. In the case of an F-mount lens,
press the locking lever on the mount while rotating the lens clockwise until it comes free
and can be pulled straight out.
Both types of lenses typically have provision for focusing and aperture adjustment, with
the details vary
the F-mount, there is provision for adjusting the focus of the lens mount itself, if
necessary, to bring the focus within range of the lens focus. See the discussion on
51 for more detailed information.
page
Mounting procedures are more complex when mounting to a microscope and vary
according to the m
Microscope, which follows.
ing according the make and model of the lens. In addition, in the case of
ake and model of the microscope as discussed in Mounting to a
ount lens, simply rotate
Mounting to a Microscope
This section discusses the setup and optimization of your digital imaging system as
applied to microscopy. Since scientific grade cooled CCD imaging systems are usually
employed for low light level microscopy, the major goal is to maximize the light
throughput to the camera. In order to do this, the highest Numerical Aperture (NA)
objectives of the desired magnification should be used. In addition, you should carefully
consider the transmission efficiency of the objective for the excitation and emission
wavelengths of the fluorescent probe employed. Another way to maximize the
transmission of light is to choose the camera port that uses the fewest optical surfaces in
the pathway, since each surface results in a small loss in light throughput. Often the
trinocular mount on the upright microscope and the bottom port on the inverted
microscope provide the highest light throughput. Check with the manufacturer of your
microscope to determine the optimal path for your experiment type.
A rule of thumb employed in live cell fluorescence microscopy is “if you can see the
fluorescence by
universally applicable, it is a reasonable goal to aim for. In doing this, the properties of
the CCD in your camera should also be considered in the design of your experiments. For
instance, if you have flexibility in choosing fluorescent probes, then you should take
advantage of the higher Quantum Efficiency (QE) of the CCD at longer wavelengths
(contact factory for current CCD specifications). Another feature to exploit is the high
resolution offered by cameras with exceptionally small pixel sizes (6.7 µm for
MicroMAX:1300Y, 1300YHS, and 1300YHS-DIF or 8.3µm for MicroMAX:782Y and
782YHS). Given that sufficient detail is preserved, you can use 2x2 binning (or higher) to
increase the light collected at each “super-pixel” by a factor of 4 (or higher). This will
eye, then the illumination intensity is too high”. While this may not be
Page 36

36 MicroMAX System User Manual Version 6.C
allow the user to reduce exposure times, increasing temporal resolution and reducing
photodamage to the living specimen.
Another method to minimize photodamage to biological preparations is to synchronize a
shutter on the excitation pathway to the exposure
exposure of the sample to the potentially damaging effects of the excitation light. Ti
nchronization are explained in Chapter 6.
and sy
The camera is connected to the microscope via a standard type mount coupled to a
microscope specific adapter piece. There are two basic camera mounting designs, the
C-mount and the F-mou
camera to th
make the connection.
e adapter while the F-mount uses a tongue and groove type mechanism to
nt. The C-mount employs a standard size thread to connect to the
period of the camera. This will limit
m
ing
C-Mount
For a camera equipped with a C-mount thread, use the standard C-mount adapter supplied
by the microscope manufacturer to attach the camera to the microscope. The adapter can
be screwed into the camera and then the assembly can be secured to the microscope using
the standard setscrews on the microscope. The camera can be mounted on the trinocular
output port, the side port, or the bottom port of the inverted microscope. When mountin
the larger cameras perpendicular to the microscope on the side port, it is ADVISED that
you provide some additional support for your camera to reduce the possibility of
vibrations or excessive stress on the C-mount nose. For the bottom port of the inverted
microscope, the C-mount is designed to support the full weight of the camera, however,
IT IS ADVISED that you provide some additional support for the larger cameras since
the camera is in a pos
kind of lateral force could damage the alignm
imaging conditions.
Most output ports of the microscope do not require additional optical elements to collect
an image, however please check with your microscope manual to determine if the chosen
output port requ
and fingerp
image quality.
F-Mount
For a camera with the F-mount type design, you will need two elements to mount the
camera on your microscope. The first element is a Diagnostic Instruments Relay Lens.
This lens is usually a 1X relay lens that performs no magnification. Alternatively, you
may use a 0.6X relay lens to partially demagnify the image and to increase the field of
view. There is also a 2X relay lens available for additional magnification. The second
element is a microscope specific Diagnostic Instruments Bottom Clamp. shows
which bottom clamps are routinely used with each of the microscope types. They are
illustrated in Figure 8. If you feel that you have received the wrong type of clamp, of if
y
ou need a clamp for a microscope other than those listed, please contact the factory.
ition where it could be deflected by
ent of the nose and result in sub-optimal
ires a relay lens. In addition, all optical surfaces should be free from dust
rints, since these will appear as blurry regions or spots and hence degrade the
the operator’s knee or foot. This
Table 4
g
To assemble the pieces, first pick up the camera and look for the black dot on the fron
surface. Match this dot with the red dot on the side of the relay lens. Then engage the two
surfaces and rotate them until the F-mount is secured as evidenced by a soft clicking
sound. Next place the long tube of the relay lens into the bottom clamp for your
microscope, securing it to the relay lens with the three setscrews at the top of the clamp
as shown in
Figure
. This whole assembly can now be placed on the microscope, using
9
t
Page 37

Chapter 4 System Setup 37
the appropriate setscrews on the microscope to secure th ut port
e bottom clamp to the outp
of the microscope.
Microscope Type
Leica DMR L-clamp
Leitz All types NLW-clamp
Nikon Optiphot, Diaphot, Eclipse O-clamp
Olympus BH-2, B-MAX, IMT-2 V-clamp
Zeiss Axioscope, Axioplan, Axioplan 2, Axiophot Z-clamp
Zeiss Axiovert ZN-clamp
Table 4. Bottom Clamps for Different Microscopes
Diagnostic Instruments
Bottom Clamp Type
The F-mount is appropriate for any trinocular output port or any side port. When
mounting the camera perpendicular to the microscope on the side port, it is ADVISED
that you provide some additional support for your camera to reduce the possibility of
vibrations or excessive stress on the F-mount nose. Princeton Instruments D
OES NOT
advise using an F-mount to secure the camera to a bottom port of an inverted microscope
due to possible failure of the locking m
echanism of the F-mount. Contact the factory for
information about a special adapter for operating in this configuration.
Focusing information for a camera and a camera lens mount is included in the First Li
section of Chapter 5 (page
the lens m
adjustm
ount adjustment in operation with a m
ent would normally suffice), it could be used if necessary. The procedure for
51). Although it is unlikely that you would ever
icroscope (the relay-lens focus
need to use
using the adjustment is provided in Chapter 5 and illustrated in Figure 18.
1X
HRP 100-NIK
L
ZN
O
NLW
Z
ght
V
Figure 8. Bottom Clamps
Page 38

38 MicroMAX System User Manual Version 6.C
1X
HRP 100-NIK
"L" bottom clamp
Figure 9. Bottom Clamp secured to Relay Lens
Caution
Microscope optics have very high transmission efficiencies in the infrared region of the
spectrum. Since typical microscope light sources are very good emitters in the infrared,
some microscopes are equipped with IR blockers or heat filters to prevent heating of
optical elements or the sample. For those microscopes that do not have the better IR
blockers, the throughput of infrared light to the CCD can be fairly high. In addition,
while the eye is unable to see the light, CCD cameras are particularly efficient in
detecting infrared wavelengths. As a result, the contaminating infrared light will cause a
degradation of the image quality due to a high background signal that will be invisible to
the eye. Therefore, it is recommended that you add an IR blocker in the light path if you
encounter this problem with the microscope.
Mounting to a Spectrometer
The camera must be properly mounted to the
spectrometer to achieve maximum spectral
resolution across the array. Depending on the
spectrometer and camera type, special adapters
may be required to mount the camera to the
spectrometer. The appropriate adapters should
have been included with your system if the
spectrometer type was indicated when the system was ordered.
Because of the many possible camera and spectrom
mounting instructions are located in Appendix D. Refer to the table at the beginning of
that appendix to find the instruction set appropriate to your system.
eter combinations, all of the adapter
The distance to the focal plane from the front of the mechanical assembly depends on the
specific configuration. Refer to the outline drawings in Appendix B for the focal plane
distance inform
ation.
Page 39

Chapter 4 System Setup 39
Selecting the Shutter Setting
Caution
The Shutter Setting push switch on the rear of the Controller sets the shutter hold voltage.
Each shutter type, internal or external, requires a different setting. Consult the table
below for the proper setting for your shutter. The Shutter Setting is correctly set at the
factory for the camera’s internal shutter if one is present.
Shutter Setting* Shutter Type
1 25 mm Princeton Instruments supplied External shutter
(typically an Entrance slit shutter)
2 25 mm Princeton Instruments Internal shutter
4 35 mm Princeton Instruments Internal shutter (requires 70
V Shutter option)
5 40 mm Princeton Instruments Internal shutter (supplied
with LN camera having a 1340 × 1300 or larger CCD)
* Shutter settings 0, 3, and 6-9 are unused and are reserved for future use.
Table 5. ST-133 Shutter Setting Selection
To Select the Shutter Setting:
1. Verify
that the Controller power is OFF.
2. Refer to Table 5 when looking at the rear of the
Controller.
3. If the setting is not correct, press the "-" or the "+"
button until the correct setting is display
ed in the
window.
SHUTTER CONTROL
-
2
+
REMOTE
Figure 10. Shutter Setting for
25 mm Internal Shutter
SETTING
Connecting the Interface (Controller-Computer) Cable
TAXI® Cable (6050-0148-CE)
Caution
Turn the Controller power OFF (OFF = 0, ON = |) and the Computer power OFF before
connecting or disconnecting the Controller-Computer (TAXI) cable.
To Connect the TAXI Cable:
1. Verify
2. Verify
that the Controller power is OFF.
that the Computer power is OFF.
3. Connect one end of the TAXI cable to the 9-pin port on the Interface card in the
host com
puter.
4. Tighten down the screws to lock the connector in place.
5. Connect the other end of the cable to the "Serial Com
" port on the rear of the
Controller.
6. Tighten down the screws to lock the connector in place.
Page 40

40 MicroMAX System User Manual Version 6.C
USB 2.0 Cable (6050-0494)
Caution
Turn the Controller power OFF (OFF = 0, ON = |) and the Computer power OFF before
connecting or disconnecting the Controller-Computer (TAXI) cable.
To Connect the USB 2.0 Cable:
1. Verify
2. Verify
3. Connect one end of the USB cable to the USB port on the host com
4. Connect the other end of the cable to the USB 2.0 port on the rear of the
that the Controller power is OFF.
that the Computer power is OFF.
puter.
Controller.
Connecting the Detector-Controller Cable
Caution
Turn the Controller power OFF (OFF = 0, ON = |) before connecting or disconnecting the
Detector-Controller cable.
To Connect the Detector-Controller Cable:
1. Verify
2. Connect m
3. Move the slide latch over to lock the connector in place.
4. Connect the fem
5. Move the slide latch over to lock the connector in place.
that the Controller power is OFF.
ale end of the Detector-Controller cable to the “Detector” port on the back
of the Controller.
ale end of the cable to the Camera.
Entering the Default Camera System Parameters into WinX (WinView/32, WinSpec/32, or WinXTest/32)
Software changes implemented in WinX version 2.15.9.6 affected the way in which
default parameters were entered for camera systems. Therefore, two sets of instructions
are included. Follow the instructions appropriate to the software version that you
installed. Note that these instructions assume that you have performed the computer
interface installation.
WinX Versions 2.5.19.6 and later
1. Make sure the ST-133 is connected to the host com
2. Run the WinX application. The Camera Detection wiz
this is the first time you have installed a Princeton Instruments WinX application
(WinView/32, WinSpec/32, or WinXTest/32) and a supported camera. Otherwise, if
you installing a new camera type, click on the Launch Camera Detection
Wizard… button on the Controller/CCD tab page to start the wizard.
3. On the Welcome
.
Next
dialog (Figure 11), leave the checkbox unselected and click on
puter and that it is turned on.
ard will automatically run if
Page 41

Chapter 4 System Setup 41
Figure 11. Camera Detection Wizard - Welcome dialog box
4. Follow the instructions on the dialog boxes to perform the initial hardware setup: this
wizard enters default parameters on the Hardware Setup dialog box tab pages and
gives you an opportunity to acquire a test image to confirm the system is working.
WinX Versions before 2.5.19.6: Run RSConfig.exe
1. Make sure the ST-133 is connected to the host com
Windows|Start|Programs|PI Acton menu or from the
2. Run RSConfig from
the
puter and that it is turned on.
directory where you installed WinView, WinSpec, or WinXTest.
3. When the RSConfig dialog box (Figure 12) appears, you can change the camera
nam
e to one that is more specific or you can keep the default name "Camera1".
When you have finished, click on the Done button.
Note: If the first camera in the list is not the "Princeton Style (USB2)", you will
need to edit the PVCAM.INI file created by RSConfig. See the instructions in
"Demo, High Speed PCI, and PCI(Timer) are Choices on Hardware
Wizard:Interface dialog (Versions 2.5.19.0 and earlier)", page 118.
Figure 12. RSConfig dialog box
4. Open the WinX application and, from Setup|Hardware…, run the Hardware
Setup wizard.
Page 42

42 MicroMAX System User Manual Version 6.C
5. When the PVCAM dialog box (Figure 13) is displayed, click in the Yes radio
button, click on
finished, the
PVCAM
checkbox selected. You should now be able to set up experiments and
Next and continue through the wizard. After the wizard is
Controller/Camera tab card will be displayed with the Use
acquire data.
Figure 13. Hardware Setup wizard: PVCAM dialog box
6. Run the software in focus mode to verify communication between the ST-133
and the host computer.
Page 43

Chapter 5 Operation
Introduction
Once the MicroMAX camera has been installed, camera operation is basically
straightforward. In most applications you simply establish optimum performance using
the Focus mode (WinView/32 or WinSpec/32), set the target detector temperature, wait
until the temperature has stabilized at the set temperature (see the "Setting the
Temperature" section in this chapter), and then do actual data acquisition in the
Acquire mode. Additional considerations regarding experiment setup and equipment
configuration are addressed in the software manual.
During data acquisition,
the CCD array is exposed
to a source and charge
accumulates in the pixels.
After the defined exposure
time, the accumulated
signal is readout of the
array, digitized, and then
transferred to the host
computer. Upon data
transfer, the data is data is displayed and/or stored
via the application software. This sequence is
Incoming photons
CCD
Preamp
Cable driver
Camera
Up/down integrator
Slow A/D
Digital processor
Interface module
TAXI or USB 2.0
Fast A/D
Controller
Computer
Video
display
illustrated by the block diagram shown in
Interface
Figure
14.
Whether or not the data is displayed and/or stored
Display Storage
board
RS PCI or USB 2.0
depends on the data collection operation (Focus or
Acquire
software. In WinView and WinSpec, these operations
) that has been selected in the application
Figure 14. Block Diagram of
Light Path in System
use the Experiment Setup parameters to establish the
exposure time (the period when signal of interest is allowed to accumulate on the CCD).
As might be inferred from the names, Focus is more likely to be used in setting up the
system (see the "First Light" discussions) and Acquire is then used for the collection
and storage of data. Briefly:
• In Focus mode, the number of frames and accumulations settings are ignored. A
single frame is acquired and displayed, another frame is acquired and overwrites the
currently displayed data, and so on until Stop is selected. Only the last frame
acquired before Stop is selected can be stored. When Stop is selected, the File Save
function can be used to save the currently displayed data. This mode is particularly
convenient for familiarization and setting up. For ease in focusing, the screen refresh
rate should be as rapid as possible, achieved by operating with axes and crosssections off, and with Zoom 1:1 selected.
43
Page 44

44 MicroMAX System User Manual Version 6.C
• In Acquire mode, every frame of data collected can be automatically stored (the
completed dataset may include multiple frames with one or more accumulations).
This mode would ordinarily be selected during actual data collection. One limitation
of Acquire mode operation is that if data acquisition continues at too fast a rate for it
to be stored, data overflow will eventually occur. This could only happen in Fast
Mode operation.
The remainder of this chapter is organized to first talk about the system on/off sequences.
Then "First Light" procedures for im
procedures provide step-by-step instruction on how to initially verify system operation.
The last three sections discuss factors that affect exposure, readout, and digitization of the
incoming signal. By understanding these factors and making adjustments to software
settings you can maximize signal-to-noise ratio. For information about synchronizing
data acquisition with external devices, please refer to Chapter 6, Advanced Topics.
aging and spectroscopy applications follow: these
EMF and Xenon or Hg Arc Lamps
WARNING
USB 2.0 S
Before You Start, if your imaging system includes a microscope Xenon or Hg arc lamp,
it is CRITICAL to turn off all electronics adjacent to the arc lamp, especially your
digital camera system and your computer hardware (monitors included) before turning on
the lamp power.
Powering up a microscope Xenon or Hg arc lamp causes a large EMF spike to be
produced that can cause damage to electronics that are running in the vicinity of the lam
We advise that you place a clear warning sign on the power button of your arc lamp
reminding all workers to follow this procedure. While Princeton Instruments has taken
great care to isolate its sensitive circuitry from EMF sources, we cannot guarantee that
this protection will be sufficient for all EMF bursts. Therefore, in order
the performance of your system, you must
follow this startup sequence.
to fully guarantee
ystem On/Off Sequences
If your system is configured for the USB 2.0 communication interface, you must follow
the system on/off sequences as stated below. These sequences ensure that
is established and maintained between the camera and the host computer:
1.
The MicroMAX camera must be powered ON before WinView/32 or WinSpec/32 is
opened to ensure communication between the camera and the computer. If WinView
or WinSpec is opened and the MicroMAX is not powered ON, many of the function
will be disabled and you will only be able to retrieve and examine previously
acquired and stored data. You must close WinView or WinSpec, power the camera
ON, and re
new data.
open WinView or WinSpec before you can set up experiments and acquire
communication
p.
s
2.
WinView/32 or WinSpec/32 must be closed before powering the camera OFF. If you
power the camera OFF before closing WinView or WinSpec, the communication link
with the camera will be broken. You can operate the program in a playback mode
(i.e., examine previously acquired data) but will be unable to acquire new data until
you have closed WinVie
WinView or WinSpec.
w or WinSpec, powered the camera ON, and then re-opened
Page 45

Chapter 5 Operation 45
Imaging Field of View
When used for two-dimensional imaging applications, the MicroMAX camera closely
imitates a standard 35 mm camera. Since the CCD is not the same size as the film plane
of a 35 mm camera, the field of view at a given distance is somewhat different. The
imaging field of view is indicated in
Figure 15.
O
D = distance between the object and the CCD
B = 46.5 mm for F-mount; 17.5 mm for C-mount
F = focal length of lens
S = CCD horizontal or vertical dimension
O = horizontal or vertical field of view covered at a distance D
M = magnification
The field of view is:
RS-170 or CCIR Video
Object
D
Figure 15. Imaging Field of View
CCD
Lens
S
B
One of the limitations of scientific non-video rate cameras has been their difficulty in
focusing and locating fields of view. The MicroMAX solves this problem by its
combination of high speed operation with the implementation of true video output. The
high-speed image update on the video monitor (via the VIDEO BNC connector on the
rear of the Controller) makes focusing and field location as simple as with a video
camera. This video output also makes possible archiving an experiment on a VCR,
producing hardcopy data on a video printer, or even implementing autofocusing stages.
Note: If more than one device is connected to the video output, the last device is the one
that should to be terminated in 75Ω. For example, to connect the video output to a VCR
as well as to a monitor, the cable from the controller video output should be connected to
the video input connector of the VCR, and another 75 Ω cable should extend from the
video output connector of the VCR to the 75Ω input of the monitor. Do not use a BNC
TEE to connect the controller video output to multiple devices.
The video output is selected by the Application software. In the case of a WinX
application, this is done by
selecting Video from the Acquisition menu. There is also
provision in the WinX applications for intensity-scaling the video output, that is,
selecting the specific gray levels to be displayed on the 8-bit video output.
Page 46

46 MicroMAX System User Manual Version 6.C
In addition to intensity-scaling, you also need to be concerned about how the array pixels
map to the video display. The 756×486 resolution of a typical video monitor corresponds
well with the array size of a MicroMAX:782Y, MicroMAX:782YHS or
MicroMAX:512BFT
In the case of a MicroMAX:1300YHS or a MicroMAX:1300YHS-DIF, the number of
pixels far exceeds the number of monitor pixels and mapping must be considered
array
more carefully. The WinX software’s Video Focus mode (accessed from the
Acquisition Menu) provides a Pan function that allows any one of nine different subsets
of the array image to be selected for viewing on the video monitor with only a singleframe delay. An associated zoom function provides 1x, 2x, or 4x viewing. At 1x, the
entire array image is displayed, but at reduced resolution (pixels are discarded and fine
detail could be lost). At 2x, the mapping is 1:1 and the image portion selected by the Pan
function is provided. The regions overlap, allowing the entire array image to be examined
with no loss of resolution. At 4x, array pixels are enlarged so that a smaller part of the
array image is displayed as selected by the Pan function.
Once proper focus has been achieved, the user can transfer to norm
al data-acquisition
operation. The video output remains operative, but with a more limited and fixed view
because of the resolution limitation of RS-170 video. Although this view is sufficient to
cover the image from a small CCD array in its entirety, it will not cover all the pixels
from a large array. Instead, a subset from the center of the image will be shown. For
example, in the case of the MicroMAX:1300YHS, the monitor would display the
756×486 area from the center of the CCD image as shown in
1300 × 1030
Figure 16.
756 × 486 RS-170
(EIA) monitor
image from center
of CCD image
Figure 16. Monitor Display of CCD Image Center Area
Note: With a 16-bit A/D converter (not a standard option), the composite video output is
disabled during data acquisition.
In post-acquisition processing the WinView/32 ROI (Region of Interest) capability
allows any
portion of an acquired image to be displayed on the computer monitor.
Again, note that the described video output behavior applies specifically
for the
WinView/32 software only. Other application software may provide different video
output capabilities.
Page 47

Chapter 5 Operation 47
First Light (Imaging)
The following paragraphs provide step-by-step instructions for placing your MicroMAX
system in operation the first time. The intent of this simple procedure is to help you gain
basic familiarity with the operation of your system and to show that it is functioning
properly. Once basic familiarity has been established, then operation with other operating
configurations, ones with more complex timing modes, can be performed. An underlying
assumption for the procedure is that the camera is to be operated with a microscope on
which it has been properly installed (see "
m
ounting instructions) and that a video monitor is available. Although it is possible to
dispense with the monitor and simply view the images on the computer monitor’s screen,
operations such as focusing may be easier with a video monitor because the displayed
data is updated much more quickly and will be as close to current as possible.
Once the MicroMAX camera has been installed and its optics adjusted, operation of the
era is basically straightforward. In most applications you simply establish optimum
cam
performance using the Focus mode (WinView/32), set the target camera temperature,
wait until the temperature has stabilized, and then do actual data acquisition in the
Acquire mode. Additional considerations regarding experiment setup and equipment
configuration are addressed in the software manual.
Mounting to a Microscope", page 35, for
Detector-Controller
Camera
Detector
Microscope
EXPERIMENT
Figure 17. Standard System Connection Diagram
Assumptions
The following procedure assumes that
1. You have already
Chapter 4.
set up your system in accordance with the instructions in
Serial Com
or USB 2.0
Controller
Interface cable
(TAXI or USB 2.0)
110/220
110/220
Computer
2. You have read the previous sections of this chapter.
3. You are fam
4. The sy
5. The sy
iliar with the application software.
stem is air-cooled.
stem is being operated in imaging mode.
Page 48

48 MicroMAX System User Manual Version 6.C
Cabling
If the system cables haven’t as yet been installed, make sure that the ST-133 and the host
computer are turned off and then make the cable connections as follows: See
1. Connect the 25-pin camera-to-controller cable from the DETECTOR connector on
the Analog/Control module panel to the mating connector at the back of the camera.
Secure the cable at both ends with the slide-lock latch
2. Connect one end of the 9-pin serial cable to the SERIAL COM connector on the
Interface Control module panel. Connect the other end to the computer interface as
described in Chapter 4. Be sure to secure both ends of the cable with the cableconnector screws.
.
Figure 17.
3. Connect a 75
the video monitor’s 75 Ω input. This cable must be terminated in 75 Ω. Many
monitors have a switch for selecting the 75 Ω termination.
4. Connect the line cord from
a suitable source of AC power.
Ω BNC cable from the VIDEO connector on the back of the camera to
the Power Input assembly on the back of the controller to
Getting Started
1. If you haven’t already done so, install a lens on the camera. The initial lens settings
aren’t important but it may prove convenient to set the focus to approximately the
anticipated distance and to begin with a small aperture setting. In the case of
operation with a microscope, review "Mounting to a Microscope", beginning on
35, and mount the camera on the microscope.
page
2. Turn on the sy
controller.
Note: The camera overload alarm may sound briefly and then stop. This is normal
and is not a cause for concern. However, if the alarm sounds continuously, even with
no light entering the camera, something is wrong. Turn off the power and contact the
factory for guidance.
3. Turn on the power at the com
for example).
stem power. The Power On/Off switch is located on the front of the
puter and start the application software (WinView/32,
Setting the Parameters
Note: The following procedure is based on WinView/32: you will need to modify it if
you are using a different application. Basic familiarity with the WinView/32 software is
assumed. If this is not the case, you may want to review the software manual or have it
available while performing this procedure.
Set the software parameters as follows:
Controller|Camera tab page (Setup|Hardware)
• Use PVCAM: 100 kHz or 1 MHz sy
2.5.19.0 and lower, verify that the box is checked if you are using the
USB 2.0 interface.
Note: This check box is not present on software versions 2.5.19.6 and
higher.
• Controller type:
ST-133
stems only. For software versions
Page 49

Chapter 5 Operation 49
• Controller version: 4 or higher
• Camera type:
MicroMAX:512FT = EEV 512×512 FT C
MicroMAX:512BFT = EEV 512×512 FT C
MicroMAX:782Y = PID 582×782
MicroMAX:782YHS = PID 582×782
MicroMAX:1024 = EEV 1024×1024 C
MicroMAX:1024B = EEV 1024×1024 C
MicroMAX:1024FT = EEV 1024×1024 C
MicroMAX:1024BFT = EEV 1024×1024 C
MicroMAX:1300Y = PID 1030×
MicroMAX:1300YHS = PID 1030×
MicroMAX:1300YHS-DIF = PID 1030×
• Shutter type: None or Rem
• Readout mode: Full fram
Detector Temperature (Setup|Detector Temperature…): -15°
round camera heads or -45°C for rectangular camera heads. The temperature
should drop steadily, reaching the set temperature in about ten minutes
(typical). At that point the green Temp Lock LED on the rear of the ST-133
will light and there will be a locked indication at the computer monitor,
indicating that temperature lock has been established. Note that some
overshoot may occur. This could cause temperature lock to be briefly lost
and then quickly re-established. If you are reading the actual temperature
reported by the application software, there may be a small difference between
the set and reported temperature when lock is established. This is normal and
does not indicate a system malfunction. Once lock is established, the
temperature will be stable to within ±0.05°C.
Select array installed in your camera.
CD57
CD57
CD47_10
CD47_10
CD47_20
CD47_20
1300
1300
1300
ote.
e, Interline or DIF depending on array type.
C for
Note: If you are using the USB 2.0 interface, the Detector Temperature dialog
box will not display temperature information while you are acquiring data.
Interface tab page (Setup|Hardware): High Speed PCI (or PCI(Timer))
Note: This tab page is not available if you are using the USB 2.0 interface.
Cleans and Skips tab page (Setup|Hardware): Default
Experiment Setup Main tab page (Acquisition|Experiment Setup…):
• Exposure Time: 100 m
• Accumulations & Number of Images:
Experiment Setup ROI tab page (Acquisition|Experiment Setup…):
Use this function to define the region of interest (ROI).
• Imaging Mode: Selected if y
• Clicking on Full loads the full size of the chip into the edit boxes.
• Clicking on Store will store the Pattern so it can be reused at another
e.
tim
s
1
ou are using WinSpec/32.
Page 50

50 MicroMAX System User Manual Version 6.C
Experiment Setup Timing tab page (Acquisition|Experiment Setup…):
• Timing Mode: Free Run
• Shutter Control: Norm
al
• Safe Mode vs. Fast Mode: Safe
Acquisition Menu: Select
Video if you have connected an RS-170 (or a CCIR)
video monitor to the system and plan to use it for focusing or other operations.
There will be a check next to “
Video” to indicate that it is selected
Focusing
1. If you are using WinView/32 (or WinSpec/32 in Imaging Mode) and the computer
monitor for focusing, select
present, will open and successive images will be sent to the monitor as quickly as
they are acquired. Because the time to acquire and read out an image varies directly
with the size of the CCD, the observed frame rate will vary greatly depending on the
CCD installed. With a short exposure time, it is not uncommon for the frame readout
time to be significantly longer than the exposure time.
Note: If you are using WinView/32 (or WinSpec/32 in Imaging Mode) and a video
monitor for focusing, select the Video Focus… mode from the Acquisition menu.
Then select a short exposure time (0.1 s), an Intensity Scaling setting of 4096, and 2x
Zoom. With an MicroMAX:1300Y camera (1030×1300 pixels), set the Pan selector
as required for the 756×486 subset of the array image you wish to use for focusing
purposes. Select the center pan position if the camera is a MicroMAX:782Y
(782×582 pixels) or a MicroMAX:512BFT (512×512 pixels). Begin data collection
by selecting RUN on the Interactive Camera Operation dialog box. The shutter, if
present, will open and successive images will be sent to the monitor as quickly as
they are acquired, giving as close to continuous video as possible.
Focus from the Acquisition menu. The shutter, if
2. Adjust the lens aperture, intensity
scaling, and focus for the best image as viewed on
the monitor. Some imaging tips follow.
a. Begin with the lens blocked off. Set the lens at the sm
allest possible aperture
(largest f-stop number).
b. Place a suitable target in front of the lens. An object with text or graphics works
best. If working with a m
icroscope, use any easily viewed specimen. It is
generally not advisable to attempt fluorescence imaging during this Getting
Started phase of operation.
c. Adjust the intensity
scaling and lens aperture until a suitable setting is found. The
initial intensity scaling setting of 4096 assures that the image won’t be missed
altogether but could be dim. Once you’ve determined that the image is present,
select a lower setting for better contrast. Check the brightest regions of the image
to determine if the A/D converter is at full-scale. The A/D converter is at full-
scale when any part of the image is as bright as it can be. Adjust the aperture to
where it is just slightly smaller (higher f stop) than the setting where maximum
brightness on any part of the image occurs.
Page 51

Chapter 5 Operation 51
d. Set the focus adjustment of the lens for maximum sharpness in the viewed image.
e.
If the camera is mounted to a microscope, first be sure to have a clear, focused
image through the eyepiece. T
illuminating light intensity.
hen divert the light to the camera and lower the
To adjust the parfocality on an F-mount system, begin collecting images wit
o
a short exposure time and focus the light on the camera by rotating the ring
on the Diagnostic Instrume
knobs on the microscope.
o is normally
In the case of a camera with an F-mount lens adapter, focusing
nts relay lens without touching the main focusing
done by means a focus adjustment on the relay-lens adapter.
o ugh
On a C-m
some C-mounts will be adjustable using setscrews on th
ount system, the camera should be very close to parfocal, altho
e microscope to
secure the adapter slightly higher or lower in position.
In the case of a cam
f.
era with an F-mount, the adapter itself also has a focus
adjustment. If necessary, this focus can be changed to bring the image into ra
of the lens focus adjustment. The lens-mount adjustment is secured by four
setscrews as shown in Figure 18. To change the focus setting, proceed as follows.
o the screws;
Loosen the setscrews with a 0.050" Allen wrench. Do not rem
loosen them just enough to allow the lens mount to be adjusted.
Rotate the lens mou
o
focus adjustment.
Tighten the setscrews loosened above.
o
nt as required to bring the focus within range of the lens
Set screws to lock front
part of adapter in place
ove
h
nge
Lens release lever
Front part of adapter
for adjusting focus
Figure 18. F-mount Focus Adjustment
Acquiring Data
Once optimum focus and aperture have been achieved, you can switch from Focus
Video Focus
Experiment Setup dialog box. (In WinView/32, you might wan
(Safe Mode) operation while gaining basic system familiarity.)
This com
as described, you can be reasonably sure it has arrived in good working order. In
) mode to standard data-acquisition operation as determined via the
t to begin with Free Run
pletes First Light for imaging applications. If the MicroMAX system functio
(or
ned
Page 52

52 MicroMAX System User Manual Version 6.C
addition, you should have a basic understanding of how the system hardware is used.
Other topics, which could be quite important in certain situations, are discussed in the
following chapters. See the appropriate ap
using the software to control the system.
plication software m
anual for information on
First Light
(Spectroscopy)
The following paragraphs provide step-by-step instructions for placing your spectroscopy
system in operation the first time. The intent of this simple procedure is to help you g
basic familiarity with the operation of your system and to show that it is functioning
properly. Once basic familiarity has been established, then operation with other operating
configurations, ones with more complex timing modes, can be performed. An underlying
assumption for the procedure is that the detector is to be operated with a spectrograph s
™
as the Acton SpectraPro
suitable light source, such as a mercury pen-ray lamp, should be mounted in front of the
entrance slit of the spectrograph. Any light source with line output can be used. Standa
fluorescent overhead lamps have good calibration lines as well. If there are no “lin
sources available, it is possible to use a broadband source such as tungsten for the
alignment. If this is the case, use a wavelength setting of 0.0 nm for alignment purposes.
2300i (SP2300i) on which it has been properly installed. A
Assumptions
The following procedure assumes that
You have a
1. lready set up your system in accordance with the instructions in
Chapter 4.
2. You have read the previous sections of this chap
3. You are fam
4. The sy
5. The sy
6. An entrance slit shutter is not being controlled by the ST-133.
iliar with the a
stem is air-cooled.
stem is being operated in spectroscopy mode.
pplication software.
ter.
ain
uch
rd
e”
Cabling
If the system cables haven’t as yet been installed, make sure that the ST-133 and the host
computer a
this page.
re turned off and then follow the cabling instructions on page 48. Then, return to
Getting Started
1. Set the spectrometer entrance sl
Turn on the controller power.
2.
Note: A detector overload alarm may sound briefly and then stop. This is normal and
is not a cause for concern. However, if the alarm sounds continuously, even with no
light entering the detector, something is wrong. Turn off the power and contact the
factory for guidance.
3. Turn on the com
4. Start the application software.
puter power.
it width to minimum (10 µm if possible).
Page 53

Chapter 5 Operation 53
Setting the Parameters
Note: The following procedure is based on WinSpec/32: you will need to modify it if
you are using a different application. Basic familiarity with the WinSpec/32 software is
assumed. If this is not the case, you may want to review the software manual or have it
available while performing this procedure.
Set the software parameters as follows:
Environment dialog (Setup|Environment): Verify
size is 8 Mbytes (min.). Large arrays may require a larger buffer size. If you
change the buffer size, you will have to reboot the computer for this memory
allocation to be activated, and then restart WinSpec.
Controller|Camera tab page (Setup|Hardware): Controller and Detector
eters should be set automatically to the proper values for your system.
param
However, you can click on the
this tab page to load the default settings.
• Use PVCAM: 100 kHz or 1 MHz sy
2.5.19.0 and lower, verify that the box is checked if you are using the
USB 2.0 interface.
Note: This check box is not present on software versions 2.5.19.6 and
higher.
• Controller type:
• Controller version:
• Camera type:
MicroMAX:512FT = EEV 512×512 FT C
MicroMAX:512BFT = EEV 512×512 FT C
MicroMAX:782Y = PID 582×782
MicroMAX:782YHS = PID 582×782
MicroMAX:1024 = EEV 1024×1024 C
MicroMAX:1024B = EEV 1024×1024 C
MicroMAX:1024FT = EEV 1024×1024 C
MicroMAX:1024BFT = EEV 1024×1024 C
MicroMAX:1300Y = PID 1030×
MicroMAX:1300YHS = PID 1030×
MicroMAX:1300YHS-DIF = PID 1030×1300
• Shutter type: None or Rem
ST-133
Select the array installed in your detector.
Load Defaults From Controller button on
stems only. For software versions
3 or higher
1300
1300
ote.
that the DMA Buffer
CD57
CD57
CD47_10
CD47_10
CD47_20
CD47_20
• Readout mode: Full fram
Detector Temperature (Setup|Detector Temperature…): -15°
round camera heads or -45°C for rectangular camera heads. When the array
temperature reaches the set temperature, the green Temp Lock LED on the
rear of the ST-133 will light and there will be a locked indication at the
computer monitor. Note that some overshoot may occur. This could cause
temperature lock to be briefly lost and then quickly re-established. If you are
reading the actual temperature reported by the application software, there
may be a small difference between the set and reported temperature when
lock is established. This is normal and does not indicate a system
e.
C for
Page 54

54 MicroMAX System User Manual Version 6.C
malfunction. Once lock is established, the temperature will be stable to
within ±0.05°C.
Note: If you are using the USB 2.0 interface, the Detector Temperature
dialog box will not display temperature information while you are acquiring
data.
Interface tab page (Setup|Hardware): High Speed PCI (or PCI(Tim
Note: This tab page is not available if you are using the USB 2.0 interface.
Cleans and Skips tab page (Setup|Hardware): Default
Experiment Setup Main tab page (Acquisition|Experiment Setup…):
• Exposure Time: 100 m
• Accumulations & Number of Images:
Experiment Setup ROI tab page (Acquisition|Experiment Setup…):
Use this function to define the region of interest (ROI).
• Spectroscopy Mode: Selected
• Clicking on Full loads the full size of the chip into the edit boxes.
Experiment Setup Timing tab page (Acquisition|Experiment Setup…):
• Timing Mode: Free Run
• Shutter Control: Normal
• Safe Mode vs. Fast Mode: Safe
s
1
er))
Focusing
The mounting hardware provides two degrees of freedom, focus and rotation. In this
context, focus means to physically move the detector back and forth through the focal
plane of the spectrograph. The approach taken is to slowly move the detector in and out
of focus and adjust for optimum while watching a live display on the monitor, followed
by rotating the detector and again adjusting for optimum. The following procedure,
which describes the focusing operation with an Acton 2300I spectrograph, can be easily
adapted to other spectrographs.
1. Mount a light source such as a m
the spectrograph. Any light source with line output can be used. Standard fluorescent
overhead lamps have good calibration lines as well. If there are no “line” sources
available, it is possible to use a broadband source such as tungsten for the alignment.
If this is the case, use a wavelength setting of 0.0 nm for alignment purposes.
2. With the spectrograph properly
for the spectrograph to initialize. Then set it to 435.8 nm if using a mercury lamp or
to 0.0 nm if using a broadband source.
Hint: Overhead fluorescent lights produce a mercury spectrum. Use a white card
tilted at 45 degrees in front of the entrance slit to reflect overhead light into the
spectrograph. Select 435.833 as the spectral line.
3. Set the slit to 25 µm
(near full-scale) signal intensity.
. If necessary, adjust the Exposure Time to maintain optimum
ercury pen-ray type in front of the entrance slit of
connected to the controller, turn the power on, wait
Page 55

Chapter 5 Operation 55
4. Slowly move the detector in and out of focus. You should see the spectral line go
from broad to narrow and back to broad. Leave the detector set for the narrowest
achievable line. You may want to use the Focus Helper function (Process|Focus
Helper…) to determine the narrowest line width: it can automatically locate peaks
and generate a report on peak characteristics during live data acquisition (see the
WinSpec/32 on-line help for more information).
Note that the way focusing is accomplished depends on the spectrograph, as follows:
• Long focal-length spectrographs such as the Acton 2300i: The
mounting adapter includes a tube that slides inside another tube to move the
detector in or out as required to achieve optimum focus.
• Short focal-length spectrographs: There is generally
mechanism on the spectrograph itself which, when adjusted, will move the
optics as required to achieve proper focus.
• No focusing adjustment: If there is no focusing adjustm
provided by the spectrograph or by the mounting hardware, then the only
recourse will be to adjust the spectrograph’s focusing mirror.
5. Next adjust the rotation. You can do this by
live display of the line. The line will go from broad to narrow and back to broad.
Leave the detector rotation set for the narrowest achievable line.
Alternatively, take an image, display the horizontal and vertical cursor bars, and
pare the vertical bar to the line shape on the screen. Rotate the detector until the
com
line shape on the screen is parallel with the vertical bar.
Note: When aligning other accessories, such as fibers, lenses, optical fiber adapters,
first align the spectrograph to the slit. Then align the accessory without disturbing the
detector position. The procedure is identical to that used to focus the spectrograph
(i.e., do the focus and alignment operations while watching a live image).
rotating the detector while watching a
a focusing
ent, either
Acquiring Data
Once optimum focus and aperture have been achieved, you can switch from Focus (or
Video Focus) mode to standard data-acquisition operation as determined via the
Experiment Setup dialog box. (In WinSpec/32, you might want to begin with Free Run
(Safe Mode) operation while gaining basic system familiarity.)
This completes First Light for spectroscopy
functioned as described, you can be reasonably sure it has arrived in good working order.
In addition, you should have a basic understanding of how the system hardware is used.
Other topics, which could be quite important in certain situations, are discussed in the
following chapters. See the appropriate application software manual for information on
using the software to control the system.
Exposure and Signal
Introduction
The following topics address factors that can affect the signal acquired on the CCD array.
These factors include array architecture, exposure time, CCD temperature, dark charge,
and saturation.
applications. If the MicroMAX system
Page 56

56 MicroMAX System User Manual Version 6.C
CCD Array Architecture
Charge coupled devices can be roughly thought of as a two-dimensional grid of
individual photodiodes (called pixels), each connected to its own charge storage “well.”
Each pixel senses the intensity of light falling on its collection area, and stores a
proportional amount of charge in its associated “well”. Once charge accumulates for the
specified exposure time, the charge in the image pixels are moved to a different location.
Depending on the CCD array type, the pixels are read out to a serial register or they are
shifted under a masked area (or into storage cells) and then read out to a serial register.
CCD arrays perform three essential functions: photons are transduced to electrons,
integrated and stored, and finally
Unintensified, uncoated CCDs can withstand direct exposure to relatively high light
levels, magnetic fields and RF radiation. They are easily cooled and can be precisely
temperature controlled to within a few tens of millidegrees.
Because CCD arrays, like film and other media, are always sensitive to light, light must not
be allowed to fall on the array
MicroMAX use a mechanical shutter to prevent light from reaching the CCD during readout.
The software allows you to set the length of time the camera is allowed to integrate the
incoming light. This is called the exposure time. During each scan, the shutter is enabled
for the duration of the exposure period, allowing the pixels to register light.
read out. CCDs are very compact and rugged.
during readout. Unintensified full-frame CCD cameras like the
Exposure Time
Exposure time (set on the Experiment Setup|Main
tab page) is the time between start and stop
acquisition commands sent by the application
software to the camera. In combination with
triggers, these commands control when continuous
cleaning of the CCD stops and when the
accumulated signal will be read out. The continuous
cleaning prevents buildup of dark current and
unwanted signal before the start of the exposure
time. At the end of the exposure time, the CCD is
read out and cleaning starts again.
Exposure with a Mechanical Shutter
For some CCD arrays, the MicroMAX uses a
mechanical shutter to control exposure of the CCD.
The diagram in
period is m
Analog/Control panel can be used to monitor the exposure and readout cycle (t
signal is also shown in
configured automatically for MicroMAX systems shipped with an internal shutter.
Figure 19 shows how the exposure
easured. The NOT SCAN signal at the
Figure 19. The value of t
c
BNC on the ST-133
). This
R
is shutter type dependent, and will be
Page 57

Chapter 5 Operation 57
Mechanical Shutter
NOT SCAN
Acquire Readout
t
exp
Exposure time
Figure 19. CCD Exposure with Shutter Compensation
t
c
Shutter compensation
ClosedOpen
Note that NOT SCAN is low during readout, high during exposure, and high during
shutter compensation time.
Since most shutters behave like an iris, the opening and closing of the shutter will cause
the center of the CCD to be exposed slightly
longer than the edges. It is important to
realize this physical limitation, particularly when using short exposures.
Exposure with an Interline Array
Interline transfer CCDs contain alternate columns of imaging and storage cells that work
in pairs. Light impinging on the imaging cells cause a charge buildup. As previously
explained, the operating mode is always overlapped unless the exposure time is shorter
than the readout time, in which case non-overlapped operation is automatically selected.
Note: The storage cells of an interline array are quite light-insensitive (the ratio of the
light sensitivity of the storage cells, which are masked, to the light sensitivity of the
imaging cells is ~4000:1). However, even with a rejection ratio of ~4000:1, there may be
situations where this may not be sufficient to prevent light leakage from significantly
affecting the data. That this is so becomes apparent when the on/off time factors are
considered. In an experiment with a very short exposure compared to the readout rate, the
ratio of the readout time to the exposure time may easily be of the same order as the
rejection ratio of the interline array storage cells. Where this is the case, the signal
buildup in the storage cells during the readout time may equal the signal transferred from
the imaging cells to the storage cells at the end of the exposure time. The effect of this
signal will be to cause data smearing. The only solutions to this problem at this time are
to increase the exposure time to where the effect is insignificant, use a shutter, or to use a
gated light source.
Continuous Exposure (no shuttering)
Unlike video rate CCD cameras, slow scan scientific cameras require a shutter to prevent
“smearing” of features during readout or transfer to a masked area or storage cells.
Smearing occurs during readout because charge is moved horizontally or vertically across
the surface of the CCD while charge continues to accumulate on the array. As the result,
the image will be blurred along one direction only.
The fraction of total signal due to smearing is the ratio of the amount of time spent
shifting divided by
exposure times will minimize this effect. Note that while 1% smear is insignificant in an
8-bit camera (256 gray levels), in a 12-bit camera (over 4,000 gray levels) 1% smearing
is over 40 counts, enough to obscure faint features in a high dynamic range image.
the exposure time between frames. Faster shifting and/or longer
Page 58

58 MicroMAX System User Manual Version 6.C
Full-Frame
For full-frame CCDs, the MicroMAX camera is usually
If a full-frame MicroMAX is being operated without a shutter, smearing can be avoided
by ensuring that no light falls on the CCD during readout. If the light source can be
controlled electronically via the NOT SCAN or SHUTTER signal at the
CCD can be read out in darkness.
equipped with an integral shutter.
BNC, the
Frame Transfer
For frame transfer CCDs, image smearing may occur, depending on the exact nature of
the experim
case of lens-coupled intensified cameras (ICCDs), this effect can be eliminated by using a
fast phosphor and gating the intensifier at the same frame rate as the CCD.
Interline
For interline CCDs, image smearing may occur due to a small amount of light leaking
through to the storage cells during the readout tim
intensified cameras (ICCDs), this effect can be eliminated by using a fast phosphor and
gating the intensifier at the same frame rate as the CCD.
ent. Smearing occurs only if the CCD is illuminated during shifting. In the
e. In the case of lens-coupled
Cooling the CCD
Most MicroMAX cameras must be cooled during operation. A Peltier-effect
thermoelectric cooler, driven by closed-loop proportional-control circuitry, cools the
CCD. A thermal sensing diode attached to the cooling block of the camera monitors its
temperature. Heat generated at the exhaust plate of the cooler is conducted to the
enclosure of the camera. Fins on the round head camera shell radiate the heat outward to
the surrounding atmosphere. The fan inside the rectangular head camera draws air
through the vents in the camera shell, blows it through the internal fins, and exhausts it
back into the atmosphere through the vents.
Note: Temperature regulation does not reach its ultimate stability for at least 30 minutes
after temperature lock is established.
Cautions
The MicroMAX camera requires the ST-133 Controller that has been shipped with it. Do
not use a controller for a TE-cooled system with an LN-cooled camera. Do not use a
controller for an LN-cooled system with a TE-cooled camera.
CCD Temperature Control
As stated before, lowering the temperature of the
CCD will generally enhance the quality of the
acquired signal. When WinView or WinSpec is
the controlling software, temperature control is
done via the
(see Figure 20) accessed from the Setup
Once the target array temperature has been set,
the software controls the circuits in the camera
so the array temperature is reduced to the set
value. On reaching that temperature, the control loop locks to that temperature for stable
and reproducible performance.
When temperature lock has been reached (temperature within 0.25°C of set value) the
Detector Temperature dialog box reports that the current temperature is
Detector Temperature dialog box
menu.
Figure 20. WinView/WinSpec
Detector Temperature dialog box
Locked. This
Page 59

Chapter 5 Operation 59
on-screen indication allows easy verification of temperature lock. In addition, the TEMP
LOCK indicator on the back of the controller lights GREEN to indicate that lock has
been achieved (for more information, refer to the description of the ST-133 rear panel
features, page
The deepest operating temperature for a system depends on the CCD array size, the CCD
packaging, the am
achieve lock can vary over a considerable range, depending on such factors as the camera
type, CCD array type, ambient temperature, etc. Typically, the larger the array or the
warmer the ambient temperature, the longer the time to reach lock. Once lock occurs, it is
okay to begin focusing. However, you should wait an additional twenty minutes before
taking quantitative data so that the system has time to achieve optimum thermal stability.
MicroMAX CCDs typically have the following temperature ranges:
20).
bient temperature, and the type of cooling. The time required to
• Better than -15°C with passive cooling and under vacuum
• Better than -30°C with the optional forced air accessory
Note: If you are using the USB 2.0 interface, the Detector Temperature dialog box will
not display temperature information while you are acquiring data.
and under vacuum
ADC Offset (Bias)
With the camera completely blocked, the CCD will collect a dark charge pattern,
dependent on the exposure time and camera temperature. The longer the exposure time
and the warmer the camera, the larger and less uniform this background will appear. This
background can be dealt with in a couple of ways: background subtraction, in which a
background image is acquired and then subtracted from an illuminated image, or by
offsetting the baseline so that much of the background is ignored during analog-to-digital
conversion (ADC).
The baseline offset is a voltage that is added to the signal to bring the A/D output to a
non-zero value, ty
variation in the signal can really be seen and not lost below the A/D “0” value. Since the
offset is added to the signal, these counts only minimally reduce the range of the signal
from 65535 (16-bit ADC) to a value in the range of 50-100 counts lower.
Notes:
1. Do not be concerned about either the DC level of this background or its shape unless
it is very high (i.e., 400 counts). What you see is not noise. It is a fully subtractable
readout pattern. Each CCD has its own dark charge pattern, unique to that particular
device. Every device has been thoroughly tested to ensure its compliance with
Princeton Instruments' demanding specifications.
pically 50-100 counts. This offset value ensures that all the true
2. The baseline can be adjusted by using the F and S Zero pots located on the rear panel
of the controller. If these pots are not present, the baseline may be softwareadjustable.
3. Do not adjust the offset values to zero or some low-level data will be missed.
Page 60

60 MicroMAX System User Manual Version 6.C
Caution
If you observe a sudden change in the baseline signal you may have excessive humidity
in the vacuum enclosure of the camera. Turn off the controller and have the camera
repumped before resuming normal operation. Contact the factory Technical Support
Dept. for information on how to refresh the vacuum. See page 164 for contact
information.
Dark Charge
Dark charge (or dark current) is the thermally induced buildup of charge in the CCD over
time. The statistical noise associated with this charge is known as dark noise. Dark charge
values vary widely from one CCD array to another and are exponentially temperature
dependent. At the typical operating temperature of a round head camera, for example,
dark charge is reduced by a factor of ~2 for every 6º reduction in temperature.
With the light into the camera completely blocked, the CCD will collect a dark charge
pattern, dependent on the exposure tim
exposure time and the warmer the camera, the larger and less uniform this background
will appear. Thus, to minimize dark-charge effects, you should operate with the lowest
CCD temperature possible.
Note: Do not be concerned about either the DC level of this background or its shape
unless it is very high, i.e., > 1000 counts. What you see is not noise. It is a fully
subtractable readout pattern. Each CCD has its own dark charge pattern, unique to that
particular device. Simply acquire and save a dark charge “background image” under
conditions identical to those used to acquire the “actual” image. Subtracting the
background image from the actual image will significantly reduce dark-charge effects.
e and camera temperature. The longer the
Caution
Readout
If you observe a sudden change in the baseline signal, y
in the camera's vacuum enclosure. Immediately turn off the system and contact Princeton
Instruments Customer Support for instructions. See page 164 for contact information.
ou may have excessive humidity
Saturation
When signal levels in some part of the image are very high, charge generated in one pixel
may exceed the “well capacity” of the pixel, spilling over into adjacent pixels in a process
called “blooming.” In this case a more frequent readout is advisable, with signal
averaging to enhance S/N (Signal-to-Noise ratio) accomplished through the software.
For signal levels low enough to be readout-noise lim
therefore longer signal accumulation in the CCD, will improve the S/N ratio
approximately linearly with the length of exposure time. There is, however, a maximum
time limit for on-chip averaging, determined by either the saturation of the CCD by the
signal or the loss of dynamic range due to the buildup of dark charge in the pixels.
ited, longer exposure times, and
Introduction
After the exposure time has elapsed, the charge accumulated in the array pixels needs to
be read out of the array, converted from electrons to digital format, and transmitted to the
application software where it can be displayed and/or stored. Readout begins by moving
charge from the CCD image area to the shift register or to a masked area (or storage cells)
and then toward the shift register. The charge in the shift register pixels, which typically
have twice the capacity of the image pixels, is then shifted into the output node and then
Page 61

Chapter 5 Operation 61
to the output amplifier where the electrons are grouped as electrons/count. This result
leaves the CCD and goes to the preamplifier where gain is applied.
WinView and WinSpec allow you to specify the type of readout, binning, the output
am
plifier, and the gain (the number of electrons required to generate an ADU).
Note: The type of readout (full frame, frame transfer, or interline) depends on the CCD
array installed in the camera.
The upper left drawing in Figure 21 represents a CCD after exposure but before the
beginning of readout. The capital letters repr
esent different amounts of charge, including
both signal and dark charge. This section explains readout at full resolution, where every
pixel is digitized separately.
12
Empty Readout Register Readout Register with charge
from first line.
A1 B1 C1 D1
B1C2C1D2D1
A2A1B2
D3
A4A3B4B3C4C3D4
B5
C5D6D5
A6A5B6
Charge from first cell shifted
into Output Node.
A2A1B2B1C2C1D2
A4A3B4B3C4C3D4
A5 B5 C5 D5 A5 B5 C5 D5
A6 B6
C6
D1
C6
D3
D6
Figure 21. Full Frame at Full Resolution
A2 B2 C2 D2
D3
A4A3B4B3C4C3D4
A5 B5 C5 D5
C6
C6
D6
D3
D6
A6 B6
After first line is read out,next line
43
can be shifted into empty
Readout Register.
A2 B2 C2 D2
A4A3B4B3C4C3D4
A6 B6
Readout of the CCD begins with the simultaneous shifting of all pixels one row toward
the "shift register", in this case the row at top. The shift register is a single line of pixels
along one edge of the CCD, not sensitive to light and used for readout only. Typically the
shift register pixels hold twice as much charge as the pixels in the imaging area of the
CCD.
After the first row is moved into the shift register, the charge now in the shift register is
shifted toward the output node, located at one end of the shift register. As each value is
ptied" into this node it is digitized. Only after all pixels in the first row are digitized is
"em
the second row moved into the shift register. The order of shifting in our example is
therefore A1, B1, C1, D1, A2, B2, C2, D2, A3....
Page 62

62 MicroMAX System User Manual Version 6.C
After charge is shifted out of each pixel the remaining charge is zero, meaning that the
array is immediately ready for the next exposure.
Below are the equations that determine the rate at which the CCD is read out. Tables of
values for CCDs supported at the tim
e of the printing of this manual also appear below.
The time needed to take a full frame at full resolution is:
t
R
+ t
exp
+ t
(1)
c
where
is the CCD readout time,
t
R
is the exposure time, and
t
exp
is the shutter compensation time.
t
c
The readout time is approximately given by:
t
= [Nx · Ny · (tsr + tv)] + (Nx · ti) (2)
R
where
Nx is the smaller dimension of the CCD
Ny is the larger dimension of the CCD
tsr is the time needed to shift one pixel out of the shift register
tv is the time needed to digitize a pixel
ti is the time needed to shift one line into the shift register
(ts, the time needed to discard a pixel, appears below and in later equations)
The readout time for a 1024x1024 full-frame CCD array is provided in Table 6 below.
CCD Array 1 MHz Readout Time
MicroMAX:1024B
1.1 sec. for full frame
EEV CCD47-10 1024x1024
Table 6. Approximate Readout Time for the Full-Frame CCD Array
A subsection of the CCD can be read out at full resolution, sometimes dramatically
increasing the readout rate while retaining the highest resolution in the region of interest
(ROI). To approximate the readout rate of an ROI, in Equation 2 substitute the x and y
dimensions of the ROI in place of the dimensions of the full CCD. Some overhead time,
however, is required to read out and discard the unwanted pixels.
Page 63

Chapter 5 Operation 63
Frame Transfer
The MicroMAX fully supports frame transfer readout. Operation in this mode is very
similar to the operation of video rate cameras. Half of the CCD is exposed continuously,
raising the exposure duty cycle to nearly 100%. The other half of the CCD is masked to
prevent exposure, and it is here that the image is “stored” until it can be read out.
shows the readout of a m
asked version of our sample 4 × 6 CCD. The shading represents
the masked area (masking is on the array).
12
Charge accumulates in
unmasked cells during
exposure.
Accumulated charge in
exposed cells is quickly
transferred under mask.
3
Charge from cells A1-D1 shifted
to serial register. Exposed cells
accumulate new charge.
Figure 22
B1C2C1D2D1
A2A1B2
A3 B3 C3 D3
A4 B4 C4 D4
A5 B5 C5 D5
C6
C6
D6
D6
A6 B6
A3 B3 C3 D3
A4 B4 C4 D4
A4 B4 C4 D4
A5 B5 C5 D5
A6 B6
B1C2C1D2D1
A2A1B2
A3 B3 C3 D3
Charges in serial register shift into
Output Node, emptying the register
so the next line can be transferred in.
B1 C1 D1
C2 D2
A2A1B2
A3 B3 C3 D3
A4 B4 C4 D4
A5 B5 C5 D5
C6
A6 B6
D6
B1C2C1D2D1
A2A1B2
A3 B3 C3 D3
Shifting continues until all masked
54
data has been shifted into serial
register and from there to the Output
Node.
B3
C3 D3
A3 B3 C3 D3
A4 B4 C4 D4
A4 B4 C4 D4
A5 B5 C5 D5
C6
A6 B6
D6
6
All data from first exposure has been
shifted out. Second exposure continues.
Initial conditions are restored.
Figure 22. Frame Transfer Readout
Only the exposed region collects charge. At the end of the exposure, the charge is quickly
shifted into the masked region. Since the shifting is accomplished in a short time, i.e., a
few milliseconds, the incident light causes only minimal “smearing” of the signal. While
the exposed region continues collecting data, the masked region is read out and digitized.
The percentage of smearing can be determined by dividing the time needed to shift all
rows from the imaging area by the exposure time. See the equation below.
(3)
CCD Array 1 MHz Readout Time
MicroMAX:512BFT
0.35 sec. for full frame
EEV CCD57-10 512 x 512
Table 7. Approximate Readout Time for the Frame-Transfer CCD Array
Page 64

64 MicroMAX System User Manual Version 6.C
Interline
In this section, a simple 6 × 3 pixel interline CCD is used to demonstrate how charge is
shifted and digitized. As described below, two different types of readout, overlapped and
non-overlapped can occur. In overlapped operation, each exposure begins while the
readout of the previous one is still in progress. In non-overlapped operation (selected
automatically if the exposure time is shorter than the readout time) each readout goes to
completion before the next exposure begins.
Overlapped Operation Exposure and Readout
Figure 23 illustrates exposure and readout when operating in the overlapped m
Figure 23 contains four parts, each depicting a later stage in the exposure-readout cy
Eight columns of cells are shown. Columns 1, 3, and 5 contain imaging cells while
columns 2, 4, and 6 contain storage cells. The readout register is shown above the array.
Part 1 of the figure shows the array early in the exposure. The im
proportional to the amount of light integrated on each of them. The storage cells are empty
because no charge has been transferred to them. The arrows between adjacent imaging and
storage cells indicate the direction the charge will be shifted when the transfer occurs.
Part 2 of Figure 23 shows the situation early in the readout. The charge in the imaging
cells has been transferred to the adjacent storage cells and up-shifting to the readout
register has started. Note that a new exposure begins im
Part 3 of Figure 23 shows the transfer to the output node. The lowermost cell in each
n is shown empty. Each row of charges is moved in turn into the readout register,
colum
and from there to the output node and off of the array for further processing. The process
continues until all charges have been completely transferred out of the array. The imaging
cells continue accumulating charge throughout the readout process. Integrating in this
way while the readout takes place achieves the maximum possible time efficiency.
Part 4 of Figure 23 illustrates the situation at the end of the readout. The storage cells and
readout register are em
continues until the end of the programmed exposure.
pty, but the ongoing accumulation of charge in the imaging cells
ode.
cle.
aging cells contain charge
mediately.
Page 65

Chapter 5 Operation 65
12
Empty Readout Register. Exposure
has ended and image is being
transferred to storage cells.
Image has been shifted to storage cells, first
line has been shifted to Readout Register,
and second exposure begins.
A1 B1
C1
A1
A2
A3
A4
A5
A6
Charge from first cell has been
shifted to the Output Node.
A1 B1
A2 B2
D1
A3
D2
D3
A4
A5
D4
D5
A6
D6
C1
B3
B4
B5
B6
B1
B2
B3
B4
B5
B6
E1
E2
E3
E4
E5
E6
Figure 23. Overlapped Mode Exposure and Readout
C2
C3
C4
C5
C6
C1
C2
C3
C4
C5
C6
After first image is read out,storage cells are
43
empty. Second exposure continues.
F1
F2
F3
F4
F5
F
6
A2 B2
D1
A3
A4
A5
A6
D2
D3
D4
D5
D6
D1
D2
D3
D4
D5
D6
B3
B4
B5
B6
E1
E2
E3
E4
E5
E6
E1
E2
E3
E4
E5
E6
C2
C3
C4
C5
C6
F1
F2
F3
F4
F5
F
F1
F2
F3
F4
F5
F
6
6
Non-Overlapped Operation Exposure and Readout
Figure 24 illustrates exposure and readout when operating in the non-overlapped m
ode.
Non-overlapped operation occurs automatically any time the exposure time is shorter
than the readout time.
exposure-readout cy
Part 1 of the figure shows the array early in the exposure. The im
Figure 24 contains four parts, each depicting a later stage in the
cle.
aging cells contain charge
proportional to the amount of light integrated on each of them. The storage cells are empty
because no charge has been transferred to them. The arrows between adjacent imaging and
storage cells indicate the direction the charge will be shifted when the transfer occurs.
Part 2 of Figure 24 shows the situation early in the readout cycle. The charge in the imaging
cells has been transferred to the adjacent storag
e cells and up-shifting to the readout register
has started. Note that a second exposure doesn’t begin while the readout is in progress.
Part 3 of Figure 24 shows the transfer to the output node. The lowermost cell in each
n is shown empty. Each row of charges is moved in turn into the readout register,
colum
and from there to the output node and off of the array for further processing. The process
continues until all charges have been completely transferred out of the array. The imaging
cells are electronically switched off and do not accumulate any charge as the readout
takes place. Because this scheme is less time efficient than that used in the overlapped
mode, the frame rate may be lower in non-overlapped operation than it is in overlapped
operation with the some exposure time settings.
Page 66

66 MicroMAX System User Manual Version 6.C
Part 4 of Figure 24 illustrates the situation at the end of the readout. Both the imaging and
storage cells are empty. In Free Run operation, the imaging cells will be switched back on
immediately, allowing charge accumulation to begin. In Ext Sync operation with no
PreOpen, they are not switched back on until after the External Sync pulse is detected.
12
Empty Readout Register. Exposure
has ended and image is being
transferred to storage cells.
Image has been shifted to storage cells and
first line has been shifted to Readout Register.
A1 B1
C1
A1
A2
A3
A4
A5
A6
Charge from first cell has been
shifted to the Output Node.
A1 B1
A2 B2
A3
A4
A5
A6
B1
B2
B3
B4
B5
B6
C1
B3
B4
B5
B6
Figure 24. Non-Overlapped Mode Exposure and Readout
C2
C3
C4
C5
C6
C1
C2
C3
C4
C5
C6
After first image are read out, storage cells are
43
empty. Second exposure begins if in Freerun
mode. Otherwise, waits for Ext Sync.
A2 B2
A3
A4
A5
A6
B3
B4
B5
B6
C2
C3
C4
C5
C6
A subsection of the CCD can be read out at full resolution, sometimes increasing the
readout rate while retaining the highest resolution in the region of interest (ROI).
Readout Rate for Interline
Below are the equations that determine the rate at which the CCD is read out. Tables of
values for CCDs supported at the tim
Assuming the shutter selection is None
e of the printing of this manual also appear below.
, the time needed to take a full frame at full
resolution in non-overlapped timing mode is:
t
R
+ t
(1)
exp
where
is the CCD readout time,
t
R
t
is the exposure time.
exp
Page 67

Chapter 5 Operation 67
The readout time is approximately given by:
t
= [Nx · Ny · (t
R
+ tv)] + (Nx · ti) (2)
sr
where
is the smaller dimension of the CCD
N
x
N
is the larger dimension of the CCD.
y
t
is the time needed to shift one pixel out of the shift register
sr
t
is the time needed to digitize a pixel
v
t
is the time needed to shift one line into the shift register
i
CCD Array 1 MHz Readout
MicroMAX:782Y Sony ICX075
782 x 582
MicroMAX:782YHS
Sony ICX075 782 x 582
MicroMAX:1300Y Sony ICX061
1300x1030
MicroMAX:1300YHS
Sony ICX061 1300x1030
Table 8. Approximate Readout Time for the Interline CCD Arrays
0.5 sec. for full frame
N/A
1.43 sec. for full frame
N/A
The readout rate in frames per second for the PI 1300 × 1030 interline array running at
1 MHz is shown in
Table 9.
Region of Interest Size
Binning
1 × 1
2 x 2
3 × 3
4 × 4
1300 × 1030 400 × 400 200 × 200 100 × 100
0.7 2.6 5.4 9
1.9 5.4 9 14
3.2 7.5 12 17
4.3 9 14 19
Table 9. Readout Rates for PI 1300 × 1030 Array at 1 MHz
A subsection of the CCD can be read out at full resolution, sometimes increasing the
readout rate while retaining the highest resolution in the region of interest (ROI).
Binning
Binning is the process of adding the data from adjacent pixels together to form a single
pixel (sometimes called a super pixel), and it can be accomplished in either hardware or
software. Rectangular groups of pixels of any size may be binned together, subject to
some hardware and software limitations.
Page 68

68 MicroMAX System User Manual Version 6.C
On-Chip Binning
Binning is the process of adding the data from adjacent pixels together to form a single
pixel (som
etimes called a super-pixel), and it can be accomplished in either hardware or
software. Rectangular groups of pixels of any size may be binned together, subject to
some hardware and software limitations.
Hardware binning is performed before the signal is read out by
the preamplifier. For
signal levels that are readout noise limited this method improves S/N ratio linearly with
the number of pixels grouped together. For signals large enough to render the camera
photon shot noise limited, the S/N ratio improvement is roughly proportional to the
square-root of the number of pixels binned.
Figure 25 shows an example of 2 × 2 binning for a full fram
e CCD array. Each pixel of
the image displayed by the software represents 4 pixels of the array. Rectangular bins of
any size are possible
12
Empty Readout Register. Exposure has
ended and image is about to be shifted
into the Readout Register.
.
B1
A2A1B2
B3
A4A3B4
B5
A6A5B6
D1
C2C1D2
C3D4D3
C4
C5D6D5
C6
Charges from two lines in each column have
been shifted to Readout Register and added.
B5
C1 D1
D3
C5D6D5
C6
A1 B1
++++
A2 B2 C2 D2
A4A3B4B3C4C3D4
A6A5B6
Four charges have been shifted to the
Output Node and added.
A1 B1
+
+
A2 B2
+
C1 D1
++
C2 D2
D3
A4A3B4B3C4C3D4
B5
C5D6D5
A6A5B6
C6
After sum of first four charges have been
43
transferred from Output Node, next four
charges are shifted into Output Node and added.
C1 D1
+
+
+
C2 D2
D3
A4A3B4B3C4C3D4
B5
C5D6D5
A6A5B6
C6
Figure 25. 2 × 2 Binning for Full Frame CCD
Binning also reduces readout time and the burden on computer memory, but at the
expense of resolution. Since shift register pixels typically hold only twice as much charge
as image pixels, the binning of large sections may result in saturation and “blooming”, or
spilling of charge back into the image area.
Page 69

Chapter 5 Operation 69
The readout rate for n × n binning is approximated using a more general version of the
full resolution equation. The modified equation is:
(3)
On-Chip Binning for Interline
Binning is the process of adding the data from adjacent cells together, and it can be
plished in either hardware or software. Rectangular groups of cells of any size may
accom
be binned together, subject to some hardware and software limitations.
Hardware binning is performed before the signal is read out by
the preamplifier. For
signal levels that are readout noise limited this method improves S/N ratio linearly with
the number of cells grouped together. For signals large enough to render the camera
photon shot noise limited, the S/N ratio improvement is roughly proportional to the
square-root of the number of pixels binned.
Figure 26 shows an example of 2 × 2 binning. Each cell of the im
age displayed by the
software represents 4 cells of the CCD array. Rectangular bins of any size are possible.
12
Empty Readout Register. Exposure has ended
and image has been shifted to storage cells.
A1 B1 C1
A2 B2
A3
A4
A5
A6
B3
B4
B5
B6
C2
C3
C4
C5
C6
D1
D2
D3
D4
D5
D
6
Charges from two storage cells in each column has
been shifted to Readout Register. and added.
A1
A2
A3
A4
A5
A6
+
B1
+
B2
B3
B4
B5
B6
C1
+
C2
C3
C4
C5
C6
D1
D2
D3
D4
D5
D
+
6
Four charges have been shifted to the Output
Node and added.
A1
A2
B1
+
+
B2
C1
+
+
C2
A3
A4
A5
A6
D1
D2
B3
B4
B5
B6
+
C3
C4
C5
C6
Figure 26. 2 × 2 Binning for Interline CCD
D3
D4
D5
D
After sum of first four charges have been transferred
43
from Output Node, next four charges are shifted into
Output Node and added.
D1
C1
+
+
+
D2
C2
A3
A4
A5
6
A6
B3
B4
B5
B6
C3
C4
C5
C6
D3
D4
D5
D
6
Page 70

70 MicroMAX System User Manual Version 6.C
Software Binning
One limitation of hardware binning is that the shift register pixels and the output node are
pically only 2-3 times the size of imaging pixels as shown in Table 10. Consequently, if
ty
the total charge binned together exceeds the capacity
of the shift register or output node,
the data will be corrupted.
This restriction strongly limits the number of pixels that may be binned in cases where there
all signal superimposed on a large background, such as signals with a large
is a sm
fluorescence. Ideally, one would like to bin many pixels to increase the S/N ratio of the weak
peaks but this cannot be done because the fluorescence would quickly saturate the CCD.
CCD Array
EEV CCD-37
512 x 512
Imaging/Storage
Cells Well Capacity
100 x 10
3
electrons 200 x 103 electrons
Readout Register
Well Capacity
Output Node
Well Capacity
3
400 x 10
electrons
PID 582 x 782 18 x 103 electrons 40 x 103 electrons 40 x 103 electrons
PID 1030 x 1300 34 x 103 electrons 34 x 103 electrons 65 x 103 electrons
Table 10. Well Capacity for some CCD Arrays
The solution is to perform the binning in software. Limited hardware binning may be
used when reading out the CCD. Software binning allows you to perform additional
binning during the data acquisition process, producing a result that represents many more
photons than was possible using hardware binning.
Software averaging can improve the S/N ratio by as much as the square root of the
ber of scans. Unfortunately, with a high number of scans (i.e., above 100) camera 1/f
num
noise may reduce the actual S/N ratio to slightly below this theoretical value. Also, if the
light source used is photon-flicker limited rather than photon shot-noise limited, this
theoretical signal improvement cannot be fully realized. Again, background subtraction
from the raw data is necessary.
This technique is also useful in high light level experiments, where the camera is again
photon shot-noise lim
ited. Summing multiple pixels in software corresponds to collecting
more photons, and results in a better S/N ratio in the measurement.
Analog Gain Control
Analog gain control is used to change the number of electrons required to generate an
Analog-to-Digital Unit (ADU, also known as a count). In WinView/32, the choice of
analog gain settings varies depending on the CCD array and the number of output
amplifiers. If your camera is not designed for analog gain selection, these settings will not
be accessible in the software.
In WinView (version 2.X and higher), analog gain selection is made on the
Experiment Setup…|ADC
tab card. If there is no Analog Gain parameter on that tab
card, analog gain may not be selectable or it may be controlled by a gain switch on the
camera. When software-selection of Analog Gain is available, the software selection will
override any hardware setting that may be selected at the camera.
The analog gain of the camera should generally be set so that the overall noise is ~1
count RMS. In m
ost instances this will occur with the switch set to Medium. In
situations where the A/D range exceeds that of the array, it will generally be better to set
Acquisition|
Page 71

Chapter 5 Operation 71
the Analog Gain to High so that the signal can be spread over as much of the A/D range
as possible. Users who consistently measure low-level signals may wish to select High,
which reduces some sources of noise. Users who measure high-level signals may wish to
select Low to allow digitization of larger signals. Customized values of gain can be
provided. Contact the factory for additional information.
Example: The following descriptions assum
identical in all three instances. The numbers used illustrate the effect of changing
an analog gain setting and do not reflect actual performance: gain at the Low,
Medium, and High settings depends on the CCD installed.
Note: The baseline level may require adjustment if you change the analog gain. See
"ADC Offset", page 59, for more information.
Digitization
e that the actual incoming light level is
Low requires eight electrons to generate one ADU. Strong signals can be acquired
without flooding the CCD array
appear weak, you may want to change the gain setting to Medium or High.
Medium requires four electrons to generate one ADU. If the gain is set to Medium
and the im
array, you may want to change the gain setting to High. If the CCD array appears to
be flooded with light, you may want to change the setting to Low.
High requires two electron to generate one ADU and som
Because fewer electrons are needed to generate an ADU, weaker signals can be more
readily detected. Lower noise further enhances the ability to acquire weak signals. If
the CCD array appears to be flooded with light, you may want to change the setting
to Medium or Low.
ages or spectra do not appear to take up the full dynamic range of the CCD
. If the gain is set to Low and the images or spectra
e noise sources are reduced.
Introduction
After gain has been applied to the signal, the Analog-to-Digital Converter (ADC)
converts that analog information (continuous amplitudes) into a digital data (quantified,
discrete steps) that can be read, displayed, and stored by the application software. The
number of bits per pixel is based on both the hardware and the settings programmed into
the camera through the software (see "Readout", page
60).
Digitization Rate
During readout, an analog signal representing the charge of each pixel (or binned group of
pixels) is digitized. The number of bits per pixel is based on both the hardware and the
settings programmed into the camera through the software. Depending on the MicroMAX
system, single, dual (100 kHz/1 MHz), or multiple digitization rates may be available.
Dual and multiple digitization provide optimum
speeds. Because the readout noise of CCD arrays increases with the readout rate, it is
sometimes necessary to trade off readout speed for high dynamic range. In the most
common ST-133 configurations, there will be a 1 MHz conversion speed for the fastest
possible data collection and a 100 kHz conversion speed for use where noise performance
is the paramount concern. Switching between the conversion speeds is completely under
software control for total experiment automation.
signal-to-noise ratios at all readout
Page 72

72 MicroMAX System User Manual Version 6.C
Note: In WinView and WinSpec, the ADC rate can be changed on the Experiment
Setup|ADC tab page.
Page 73

Chapter 6 Advanced Topics
Introduction
Previous chapters have discussed setting up the
hardware and the software for basic operation. This
chapter discusses topics associated with experiment
synchronization (set up on the
Timing
Kinetics mode option.
"Standard Timing Modes", the first topic, discusses
Tim
included under this topic is a discussion of the
SYNC
tab page in WinView), TTL control, and the
ing Modes, Shutter Control, and Edge Trigger. Also
connector, the input connector for a trigger pulse.
Experiment Setup|
EXT
"Frame Transfer Operation" discusses the two tim
modes available for frame transfer operation, Free Run
and External Sync.
"Interline Operation"
operating modes, overlapped or non-overlapped.
"Fast and Safe Modes" discusses the Fast and the
Safe m
and Safe is used when coordinating acquisition with external devices or when the
computer speed is not fast enough to keep pace with the acquisition rate.
"TTL Control" discusses the
In/Out levels can be set and read via the WinX32 Automation language to automate data
acquisition and processing functions.
"Kinetics Mode" discusses the Kinetics m
on mechanical or optical masking of the CCD array for acquiring time-resolved
images/spectra.
odes. Fast is used for real-time data acquisition
discusses the two interline chip
TTL IN/OUT connector on the rear of the ST-133. TTL
ode option. This form of data acquisition relies
ing
Figure 27. Timing tab page
73
Page 74

74 MicroMAX System User Manual Version 6.C
Standard Timing Modes
Overview
The Princeton Instruments ST-133 Controller has been designed to allow the greatest
possible flexibility when synchronizing data collection with an experiment.
The chart to the right lists the timing mode
combinations (selected on the
Setup|Timing
tab page). These timing
Experiment
modes are combined with the Shutter
options to provide the widest variety of
timing modes for precision experiment
synchronization.
Free Run Normal
External Sync Normal
External Sync PreOpen
External Sync with
Continuous Cleans
Mode Shutter
Normal
The shutter options available include
al, PreOpen, Disable Opened or
Norm
Disable Closed. Disable simply means that
the shutter will not operate during the
experiment. Disable closed is useful for
External Sync with
Continuous Cleans
Table 11. Detector Timing Modes
PreOpen
making dark charge measurements, or when no shutter is present. PreOpen, available in
the External Sync and External Sync with Continuous Cleans modes, opens the shutter as
soon as the ST-133 is ready to receive an External Sync pulse. This is required if the time
between the External Sync pulse and the event is less than a few milliseconds, the time it
takes the shutter to open.
The shutter timing is shown in the timing diagrams that follow. Except for Free Run,
where the m
odes of shutter operation are identical, both Normal and PreOpen lines are
shown in the timing diagrams and flowchart.
The timing diagrams are labeled indicating the exposure tim
e (texp), shutter
compensation time (tc), and readout time (tR). For more information about these
parameters, see the discussion of frame readout, starting on page
60.
Free Run
In the Free Run mode the controller does not synchronize
with the experiment in any way. The shutter opens as soon as
the previous readout is complete, and remains open for the
exposure time, t
This mode is useful for experiments with a constant light
source, such as a CW laser or a DC lamp. Other experiments
that can utilize this mode are high repetition studies, where
the number of shots that occur during a single shutter cycle is
so large that it appears to be continuous illumination.
Other experimental equipment can be synchronized to the
detector by
using the output signal (software-selectable
SHUTTER or NOT SCAN) from the
the back of the ST-133. Shutter operation and the NOT
SCAN output signal are shown in
. Any External Sync signals are ignored.
exp
connector on
Figure 29.
Figure 28. Free Run Timing Chart
Shutter opens
Shutter remains open
for preprogrammed
exposure time
System waits while
shutter closes
(part of the chart in Figure 40)
Page 75

Chapter 6 Advanced Topics 75
Shutter Open Close Open Close Open Close
NOT SCAN
t
exp
First exposure
Read Read Read
t
ctR
Data
stored
Figure 29. Free Run Timing Diagram
Second
exposure
Data
stored
Third
exposure
Data
stored
External Sync
In this mode all exposures are synchronized to an external source. As shown in the
flowchart,
Shutter operation. In Norm
pulse, then opens the shutter for the programmed exposure period. As soon as the
exposure is complete, the shutter closes and the CCD array is read out.
External synchronization depends on an edge trigger (negative- or positive-going) which
m
ust be supplied to the Ext Sync connector on the back of the camera. The type of edge
must be identified in the application software to ensure that the shutter opening is
initiated by the correct edge (in WinView/WinSpec, this is done on the
Setup|Timing
open. Therefore, the External Sync pulse provided by the experiment should precede the
actual signal by at least that much time. If not, the shutter may not be open for the
duration of the entire signal, or the signal may be missed completely.
Also, since the amount of time from initialization of the experiment to the first External
Sy
nc pulse is not fixed, an accurate background subtraction may not be possible for the
first readout. In multiple-shot experiments this is easily overcome by simply discarding
the first frame.
Figure 30, this mode can be used in combination with Normal or PreOpen
al Shutter mode, the controller waits for an External Sync
Experiment
tab page). Depending on the shutter, it may require up to 28 msec to fully
In the PreOpen Shutter mode, on the other hand, shutter operation is only partially
sy
nchronized to the experiment. As soon as the controller is ready to collect data, the
shutter opens. Upon arrival of the first External Sync pulse at the ST-133, the shutter
remains open for the specified exposure period, closes, and the CCD is read out. As soon
as readout is complete, the shutter reopens and waits for the next frame.
Page 76

76 MicroMAX System User Manual Version 6.C
(shutter preopen)
Shutter opens
Controller waits for
External Sync pulse
Shutter remains open
for preprogrammed
exposure time
System waits while
shutter closes
(shutter normal)
Controller waits for
External Sync pulse
Shutter opens
Figure 30. Showing Shutter "Preopen" & "Normal" Modes in External Sync Operation
Shutter (Normal)
Open Close Open Close Open Close
Shutter (Preopen)
NOT SCAN
External Sync
(negative polarity shown)
Open Close Open
Read Read Read
t
exp
t
c
t
R
Data
stored
t
w1
First wait
and exposure
Second wait
and exposure
Close
Data
stored
Open Close
Third wait
and exposure
Data
stored
Figure 31. External Sync Timing Diagram (- edge trigger)
The PreOpen mode is useful in cases where an External Sync pulse cannot be provided
5-28 msec before the actual signal occurs. Its main drawback is that the CCD is exposed
to any ambient light while the shutter is open between frames. If this ambient light is
constant, and the triggers occur at regular intervals, this background can also be
subtracted, providing that it does not saturate the CCD. As with the Normal Shutter
mode, accurate background subtraction may not be possible for the first frame.
Also note that, in addition to signal from ambient light, dark charge accumulates during
). Any variation in the external sync frequency also affects the amount
the “wait” tim
e (t
w
of dark charge, even if light is not falling on the CCD during this time.
Note: If EXT SYNC is still active at the end of the readout, the hardware will interpret
this as a second sync pulse, and so on.
Page 77

Chapter 6 Advanced Topics 77
External Sync with Continuous Cleans
The third timing mode available with the MicroMAX camera is called Continuous
Cleans. In addition to the standard “cleaning” of the array, which occurs after the
controller is enabled, Continuous Cleans will remove any charge from the array until the
moment the External Sync pulse is received.
(shutter preopen)
Shutter opens
CCD is continuously
cleaned until External Sync
pulse is received
Shutter remains open
for preprogrammed
exposure time
System waits while
shutter closes
(shutter normal)
CCD is continuously
cleaned until External Sync
pulse is received
Shutter opens
Figure 32. Continuous Cleans Flowchart
Once the External Sync pulse is received, cleaning of the array stops as soon as the
current row is shifted, and frame collection begins. With Normal Shutter operation the
shutter is opened for the set exposure time. With PreOpen Shutter operation the shutter is
open during the continuous cleaning, and once the External Sync pulse is received the
shutter remains open for the set exposure time, then closes. If the vertical rows are shifted
midway when the External Sync pulse arrives, the pulse is saved until the row shifting is
completed, to prevent the CCD from getting “out of step.” As expected, the response
latency is on the order of one vertical shift time, from 1-30 μsec depending on the array.
This latency does not prevent the incoming signal from being detected, since photo
generated electrons are still collected over the entire active area. However, if the signal
arrival is coincident with the vertical shifting, image smearing of up to one pixel is
possible. The amount of smearing is a function of the signal duration compared to the
single vertical shift time.
Note: If EXT SYNC is still active at the end of the readout, the hardware will interpret
this as a second sync pulse, and so on.
Page 78

78 MicroMAX System User Manual Version 6.C
Shutter (Normal)
Shutter (Preopen)
NOT SCAN
External Sync
Open Close Open Close Open Close
Figure 33. Continuous Cleans Timing Diagram
Frame Transfer Operation
In frame transfer operation, half the CCD is used for sensing light and the other half for
storage and readout. Not all CCD arrays are capable of readout in this mode, as it requires
that charge be shifted independently in the two halves of the array. See Chapter 5 for a
detailed discussion of readout in the frame-transfer mode operation; the primary focus of
this section is frame-transfer timing.
There are two timing options available in frame transfer mode, Free Run and External
nc. Both are similar to their counterparts in full frame (standard) operation, except that
Sy
in frame transfer operation a shutter is not generally used. Because there is no shutter (or
the shutter is only closed after the camera has collected a series of frames), shutter
Normal, PreOpen, or Disable have no physical meaning here. The exposure half of the
array sees light continuously. The actual exposure time is the time between data transfers
from the exposure half of the array to the storage half of the array, and may be longer
than the programmed exposure, t
the storage half occurs very quickly at the start of each read. During the read, the stored
data is shifted to the array’s output port, the same as in standard operation.
Open Close Open Close Open Close
Read
. Data transfer from the exposure half of the array to
exp
Read Read
In Free Run frame-transfer mode operation, half of the array
exposure time (t
). Then the data transfer to the storage half of the array takes place,
exp
is exposed for the set
marking the start of the read and the beginning of a new exposure.
In External Sync frame-transfer mode operation, the cam
era reads out one frame for
every External Sync pulse received, providing the frequency of the External Sync pulse
doesn’t exceed the maximum rate possible with the system. Other than for the first
readout, initiated by starting acquisition, a Sync Pulse must be detected before the
subsequent readout can occur.
Note: If EXT SYNC is still active at the end of the readout, the hardware will interpret
this as a second sync pulse, and so on.
If operating without a shutter, the actual exposure tim
e is set by the period of the sync
signal. There is one exception, if the programmed exposure time is less than the readout
time, then the actual exposure time is simply equal to t
NOT SCAN low). More specifically, if the readout time, t
the time the controller waits for the first External Sync pulse, plus t
the shutter compensation time, then the actual exposure time will
exposure time, plus t
equal t
. If an External Sync pulse is detected during each read, frames will follow one
R
,
c
, the readout time (marked by
R
, is greater than the sum of tw1,
R
, the programmed
exp
Page 79

Chapter 6 Advanced Topics 79
another as rapidly as possible as shown in Figure 34. In these figures, Shutter indicates
the programmed exposure time. If a shutter were present and active, it would also be the
actual exposure time.
Prior to the first readout, clean cycles are performed on the array. When the software issues a
Start Acquisition com
mand, the first readout is generated in hardware and the rapid data
transfer from the exposure half of the array to the storage half of the array occurs (marking
the beginning of the first exposure). The initial data read are discarded because they are not
meaningful. The first exposure continues until the next data transfer, which occurs at the
beginning of the next readout, 50 ns after the first readout ends. The data acquired during the
first exposure is then read out. This pattern continues for the duration of the experiment so
that, during each frame, the data acquired during the previous frame is read out.
t
exp
Shutter
NOT SCAN
External Sync
(negative polarity shown)
cleans
actual exposure time
t
R
t
w1
acquisition
50ns min.pulse between frames
t
R
Figure 34. Frame Transfer where t
w1
+ t
t
R
+ tc < tR
exp
t
R
Figure 35 shows the case where the programmed storage time is greater than the time
+ t
required to read out the storage half of the array, that is, where t
w1
+ tc > tR. In this
exp
case, the programmed exposure time will dominate in determining the actual exposure
time. In the situation depicted in
readout. As alway
s, the External Sync pulse must be detected before the next readout can
Figure 35, the External Sync pulse arrives during the
occur. However, there is no requirement as to when it must be applied or even that it be
periodic. The timing of the External Sync pulse is entirely at the user’s discretion. In
Figure 36, the External Sync pulse is shown arriving after the read. Detection of the
External Sy
nc pulse enables a new readout to occur on completion t
t
exp
Shutter
actual exposure time
exp
+ tc.
NOT SCAN
External Sync
(negative polarity shown)
t
R
t
t
R
c
cleans
t
R
t
w1
acquisition
Figure 35. Frame Transfer where t
w1
+ t
t
R
+ tc > tR
exp
t
R
Page 80

80 MicroMAX System User Manual Version 6.C
t
exp
Shutter
actual exposure time
NOT SCAN
External Sync
(negative polarity shown)
Interline Operation
Operating Modes
It is important to note that an interline chip can operate in either of two operating modes,
overlapped or non-overlapped. The operating mode is always overlapped unless the
exposure time is shorter than the readout time, in which case non-overlapped operation is
automatically selected by the controlling software. Because overlapped operation is
faster, to achieve the fastest possible operation, it is generally preferable to operate
overlapped if possible. Thus there may be situations where increasing the exposure time
slightly will cause the camera to switch from non-overlapped to overlapped operation.
When this happens, the video may blank for a moment as the unit is reprogrammed, and
then reappear with approximately double the frame rate that was available when it was
operating non-overlapped. Detailed discussions of how the interline camera works and
the implications for operation follow.
t
R
t
c
t
R
cleans
t
R
acquisition
t
w1
Figure 36. Frame Transfer where Pulse arrives after Readout
t
R
As stated before, there are two basic operating m
• Overlapped: When the cam
era is operated in the overlapped mode, readout
odes, overlapped and non-overlapped:
begins at the end of the exposure time and a new exposure is initiated
immediately. This mode allows the fastest possible speed. And, because the
charge only has to transfer to the adjacent row, there is no smearing.
• Non-overlapped: This operation m
ode is automatically selected by the
controlling software when the exposure time is less than the readout time. In nonoverlapped operation, the image is transferred to the storage cells at the end of
the exposure time and no further accumulation occurs (the imaging cells are
switched off). The accumulated charge on each storage cell is transferred out of
the CCD array, amplified, and sent to the controller as an analog signal, where it
is digitized prior to transfer to the computer.
Timing Options in Overlapped Readout Mode
Interline CCD arrays have columns of imaging cells alternating with columns of storage
cells. During readout, the charge stored in the photo-sensitive imaging cells move only
one row to the adjacent storage cells. From there they move downwards to the readout
register and from there to the output node. This scheme serves to allow high speeds, no
smearing and shutterless operation, a distinct advantage over frame-transfer sensors
Page 81

Chapter 6 Advanced Topics 81
where the cell contents can be contaminated by the charge in other cells as data is move
across the CCD and under the mask.
There are two timing options available in the overlapped mode, Free Run and External
Sync. (None should be the Shutter Type selection if using WinView/32 software and
operating without a shutter.) In both Free Run and External Sync operation, the array
photosensors see light continuously. The actual exposure time is the time between data
transfers from a photo-sensitive imaging cell to the adjacent storage cell, and may be
longer than the programmed exposure, t
imaging cells t
the d
rea , the stored data is shifted to the array
output n
• ed for the set
o the storage cells occurs very quickly
ode.
In Free Run overlapped mode operation, the imaging cells are expos
exposure time (t
). Then the data transfer to the storage cells takes place,
exp
. Data transfer from the photo-sensitive
exp
at the start of each readout. During
’s readout register and from there to the
marking the start of the read and the beginning of a new exposure.
In the External Sync mode, overlapped operation only is provided. The camera
•
reads out one frame for every External Sync pulse received, providing the
frequency of the External Sync pulse does not exceed the maximum rate possib
with the system. A sync pulse must be detected bef
ore the subsequent readout
can occur. If operating without a shutter, the actual exposure time is set by the
period of the sy
nc signal. There is one exception.
If the programmed exposure time is less than the readout time in the External Sync
mode, then the actual exposure time is simply equal to t
by NOT SCAN low). More specifically, if the readout time, t
sum of t
the programmed exposure time, plus t
, the time the controller waits for the first External Sync pulse, plus t
w1
the shutter compensation time (zero with
,
c
None selected as the Shutter type), then the actual exposure time will equal t
, the readout time (marked
R
, is greater than the
R
exp
. If
R
an External Sync pulse is detected during each read, frames will follow one another
as rapidly as possible as sh
programmed exposure tim
own in Figure 37. In these figures, Shutter indicates the
e. If a shutter were present and active, it would al
so be
the actual exposure time.
d
le
,
Before the first readout, clean cycles are performed on the array. When the
software issues a Start Acquisition command, the first exposure begins. Time
counting of the programmed Exposure Time begins when the sync pulse arrives
at the Ext Sync connector. The exposure ends on completion of the programmed
Exposure Time. Then the data acquired during the first exposure is read ou
the next frame of data is bei
ng acquired. This pattern continues for the duration
t while
of the experiment so that, during each frame, the data acquired during the
previous frame is read out.
Page 82

82 MicroMAX System User Manual Version 6.C
t
exp
Shutter
NOT SCAN
External Sync
(negative polarity shown)
Figure 38 shows the case where the programmed exposure time is greater than
the time required to read out the storage half of the array, that is, where t
> tR. In this case, the programmed exposure time will dominate in
+ t
c
determining the actual exposure time. In the situation depicted in
External Sy
pulse must be detected before the next readout can occur. However, there is no
requirement as to when it must be applied or even that it be periodic. The timing
of the External Sync pulse is entirely at the user’s discretion. In
xternal Sync pulse is shown arriving after the read. Detection of the External
E
Sync pulse enables a new readout to occur on completion t
actual exposure time
t
R
t
cleans
w1
acquisition
Figure 37. Overlapped Mode where t
50ns min.pulse between frames
t
R
+ t
w1
exp
t
R
+ tc < tR
t
R
Figure 38, the
nc pulse arrives during the readout. As always, the External Sync
Figure 39, the
+ tc.
exp
t
exp
w1
+ t
exp
Shutter
NOT SCAN
External Sync
(negative polarity shown)
Shutter
NOT SCAN
External Sync
(negative polarity shown)
Figure 39. Overlapped Mode where Pulse arrives after Readout
actual exposure time
t
R
t
t
R
c
cleans
t
R
t
w1
acquisition
Figure 38. Overlapped Mode where t
t
exp
actual exposure time
t
R
t
c
cleans
t
R
acquisition
t
w1
t
R
t
R
+ t
w1
+ tc > tR
exp
t
R
t
R
Page 83

Chapter 6 Advanced Topics 83
Fast and Safe Speed Modes
The WinSpec/32 Experiment Setup Timing tab page allows the user to choose Fast or
Safe Mode. Figure 40 is a flowchart comparing the two modes. In Fast Mode operation,
the MicroMAX runs according to the tim
the computer. In Safe Mode operation, the computer processes each frame as it is received.
The MicroMAX cannot collect the next frame until the previous frame has been completely
processed.
Fast Mode operation is primarily for collecting "real-time" sequences of experimental
data, where tim
the Start Acquisition command by the computer, all frames are collected without further
intervention from the computer. The advantage of this timing mode is that timing is
controlled completely through hardware. A drawback to this mode is that the computer
will only display frames when it is not performing other tasks. Image display has a lower
priority, so the image on the screen may lag several images behind. A video monitor
connected to the VIDEO output will always display the current image. A second
drawback is that a data overrun may occur if the number of images collected exceeds the
amount of allocated RAM or if the computer cannot keep up with the data rate.
ing is critical and events cannot be missed. Once the MicroMAX is sent
ing of the experiment, with no interruptions from
Safe Mode operation is primarily useful for experim
focusing, when it is necessary to have the most current image displayed on the screen. It
is also useful when data collection must be coordinated with external devices such as
external shutters and filter wheels. As seen in
com
puter controls when each frame is taken. After each frame is received, the camera
sends the Stop Acquisition command to the camera, instructing it to stop acquisition.
Once that frame is completely processed and displayed, another Start Acquisition
command is sent from the computer to the camera, allowing it to take the next frame.
Display is therefore, at most, only one frame behind the actual data collection.
One disadvantage of the Safe mode is that events m
since the MicroMAX is disabled for a short time after each frame.
ent setup, including alignment and
Figure 40, in Safe Mode operation, the
ay be missed during the experiment,
Page 84

84 MicroMAX System User Manual Version 6.C
Safe Mode
Star
t
Computer programs
camera with exposure
and binning parameters
Start acquisition
command sent from
computer to camera
Cleans performed
1 frame collected
as per timing mode
Stop acquisition
command sent from
computer to camera
Fast Mode
Start
Computer programs
camera with exposure
and binning parameters
Start acquisition
command sent from
computer to camer
Cleans performed
1 frame collected
as per timing mode
Background or
flatfield on?
a
No
Background or
flatfield on?
Ye s
Background and/or
flatfield correction
performed
Frame displayed
Frames
complete?
Ye s
Stop
Figure 40. Chart of Safe and Fast Mode Operation
No
No
Background and/or
flatfield correction
performed
Ye s
frames are displayed as
Frames
complete?
During next acquisition
time permits
Stop acquisition
command sent from
computer to camera
Stop
Ye s
No
Page 85

Chapter 6 Advanced Topics 85
TTL Control
Fully supported by WinView/WinSpec Version 2.5 when the communication protocol
is TAXI (PCI), this feature is not supported when the protocol is USB 2.0.
Introduction
This connector provides 8 TTL lines in, 8 TTL lines out and an input control line.
Figure 41
illustrates the connector and Table 13 lists the signal/pin assignments.
Princeton Instruments WinView/32 software packages incorporate WinX32 Autom
a programming language that can be used to automate performing a variety of data
acquisition and data processing functions, including use of the TTL IN/OUT functions.
WinX32 Automation can be implemented in programs written in Vision Basic or Visual
C++. See the WinX32 documentation for more detailed information.
ation,
TTL In
The user controls the 8 TTL Input lines, setting them high (+5 V; TTL 1) or low (0 V;
TTL 0). When the lines are read, the combination of highs and lows read defines a
decimal number which the computer can use to make a decision and initiate actions as
specified in the user’s program. If a TTL IN line is low, its numeric value is 0. If a TTL
IN line is high, its numeric value is as follows.
TTL IN Value TTL IN Value
1 1 5 16
2 2 6 32
3 4 7 64
4 8 8 128
This coding allows any
different sets of conditions can be specified, at the user’s discretion, using the TTL IN
lines. Any unused lines will default to TTL high (+5 V). For example, to define the
number three, the user would simply set the lines TTL IN 1 and TTL IN 2 both high
(+5 V). It would be necessary to apply TTL low to the remaining six lines because they
would otherwise default to TTL high as well.
decimal value from 0 to 255 to be defined. Thus, as many as 256
TTL IN Value TTL IN Value
1 High (1) 5 Low (0)
2 High (2) 6 Low (0)
3 Low (0) 7 Low (0)
4 Low (0) 8 Low (0)
Page 86

86 MicroMAX System User Manual Version 6.C
Table 12 illustrates this coding for decimal values 0 through 7. Obviously this table could
easily be extended to show the coding for values all the way to 255.
Decimal
Equiv.
0 0 0 0 0 0 0 0 0
1 0 0 0 0 0 0 0 1
2 0 0 0 0 0 0 1 0
3 0 0 0 0 0 0 1 1
4 0 0 0 0 0 1 0 0
5 0 0 0 0 0 1 0 1
6 0 0 0 0 0 1 1 0
7 0 0 0 0 0 1 1 1
TTL
IN/OUT 8
1= dec 128
TTL
IN/OUT 7
1=dec 64
TTL
IN/OUT 6
1=dec 32
TTL
IN/OUT 5
1=dec 16
TTL
IN/OUT 4
1=dec 8
TTL
IN/OUT 3
1=dec 4
TTL
IN/OUT 2
1=dec 2
TTL
IN/OUT 1
1=dec 1
Table 12. Bit Values with Decimal Equivalents:
1 = High
0 = Low
Buffered vs. Latched Inputs
In controlling the TTL IN lines, users also have the choice of two input-line states,
buffered or latched. In the buffered state, the line levels must remain at the intended
levels until they are read. With reference to the preceding example, the high level at TTL
IN 1 and TTL IN 2 would have to be maintained until the lines are read. In the latched
state, the applied levels continue to be available until read, even if they should change at
the TTL In/Out connector.
This control is accomplished using the EN/CLK TTL input (pin 6). If EN/CLK is open or
high, buffered operation is established and the levels reported to the m
acro will be those
in effect when the READ is made. With reference to our example, if pin 6 were left
unconnected or a TTL high applied, TTL IN 1 and TTL IN 2 would have to be held high
until read. If, on the other hand, EN/CLK were made to go low while TTL IN 1 and TTL
IN 2 were high, those values would be latched for as long as EN/CLK remained low. The
levels actually present at TTL IN 1 and TTL IN 2 could then change without changing
the value that would be read by software.
TTL Out
The state of the TTL OUT lines is set from WinView/32. Typically, a program monitoring
the experiment sets one or more of the TTL Outputs. Apparatus external to the MicroMAX
system interrogates the lines and, on detecting the specified logic levels, takes the action
appropriate to the detected condition. The coding is the same as for the input lines. There
are eight output lines, each of which can be set low (0) or high (1). The combination of
states defines a decimal number as previously described for the TTL IN lines.
Page 87

Chapter 6 Advanced Topics 87
Pin # Assignment Pin # Assignment
1 IN 1 14 IN 2
2 IN 3 15 IN 4
3 IN 5 16 IN 6
4 IN 7 17 IN 8
5 GND 18 GND
6 EN/CLK 19 Reserved
7 (future use) 20 GND
8 GND 21 OUT 2
9 OUT 1 22 OUT 4
10 OUT 3 23 OUT 6
11 OUT 5 24 OUT 8
12 OUT 7 25 GND
13 Reserved
Table 13. TTL In/Out Connector Pinout Figure 41. TTL In/Out
Connector
TTL Diagnostics Screen
WinView/32 provides a TTL Diagnostics
screen (located in WinView/32 under
Hardware Setup|Diagnostics) that
can be used to test and analyze the TTL
In/Out lines.
Note: In WinView software versions
prior to 1.6, Output Lines 5, 6, 7, and 8
are shown checked in the default state,
incorrectly indicating that their default
state is logic 1 in the MicroMAX.
Hardware Interface
A cable will be needed to connect the
TTL In/Out connector to the experiment.
The design will vary widely according to
each user’s needs, but a standard 25-pin
female type D-subminiature connector will
be needed to mate with the TTL In/Out connector at the ST-133. The hardware at the
other end of the cable will depend entirely on the user’s requirements. If the individual
connections are made using coaxial cable for maximum noise immunity (recommended),
the center conductor of the coax should connect to the proper signal pin and the cable
shield should connect to the nearest available ground (grounds are conveniently provided
at pins 5, 8, 18 and 20). Connector hardware and cables of many different types are
Figure 42. TTL Diagnostics dialog box
Page 88

88 MicroMAX System User Manual Version 6.C
widely available and can often be obtained locally, such as at a nearby Radio Shack®
store. A list of possibly useful items follows. Note that, although the item
appropriate in many situations, they might not meet your specific needs.
•
male type D-subminiature solder type connector (Radio Shack part no 276-
25-pin fe
1548B).
• RG/58U coaxial cable.
• Shielded Metalized hood (Radio Shack part no 276-1536A).
• BNC connector(s) type UG-88 Male BNC connector (Radio Shack part no 278-103).
s listed may be
Example
Suppose you needed to build a cable to monitor the line TTL OUT 1. One approach
would be to build a cable assembly as described in the
procedure could easily be adapted to other situations.
following paragraphs. This
Begin with a 25-pin fem
1. o Shack
part no 276-1548B). This connector has 25 solder points open on the bac
2. Referring to Figure 41, note that pin 8 = GND and pin 9 = TTL OUT 1.
3.
Using coaxial cable ty
outer sheath to pin 8 (GND) and the inn
shielding to the lines to insulate them.
Mount the
4. connector in a Shielded Metalized hood (Radio Shack part no 276-
1536A).
5. Build up the cable (y
Connect a B
6. NC connector (UG-88 Male BNC connector) to the free end of the cable
following the instructions supplied by Radio Shack on the box (Radio Shack part no
278-103).
7. To use this cable, connect the DB-25 to the TTL In/Out connector on the back of the
Controller.
8. d
To check the cable, start WinView/32 and open the TTL Diagnostics screen (locate
in WinView under
Then click the Output Line 1 box. Next click the OK button to actually
OUT 1 high. Once you set the voltage, it stays until you send a new command.
ale type D-subminiature solder type connector (Radi
k.
pe RG/58U (6 feet length), strip out the end and solder the
er line to pin 9 (TTL OUT 1). Then apply
ou can use electrical tape) to where the strain relief clamp holds.
Hardware Setup|Diagnostics). Click the Write radio button
set TTL
.
Measure the voltage at the BNC connector with a standard voltmeter (red on the
9.
central pin, black on the surrounding shielding). Before clicking OK at the TTL
Diagnostics screen y
Note that adding a second length of coaxial cable and another BNC connector would be
straightforward. However, as you increase the num
becomes more convenient to consider using a multiple conductor shielded cable rather
than individual coaxial cables.
ou should read 0 V. After clicking OK you should read +5
ber of lines to be monitored, it
V.
Page 89

Chapter 6 Advanced Topics 89
Kinetics Mode
Kinetics operation requires that the Kinetics option has been installed. Additionally,
WinView (or WinSpec), version 2.5.18.1 or higher, is required when operating under
USB 2.0.
Introduction
Kinetics mode uses the CCD to expose and store a limited number of images in rapid
succession. The time it takes to shift each line (or row) on the CCD is as short as a few
hundred nanoseconds to few microseconds, depending on the CCD. Therefore the time
between images can be as short as a few microseconds. Kinetics mode allows frame
transfer CCDs to take time-resolved images/spectra.
Note: Kinetics mode is an option, so the controller must be programmed before your
order is shipped. If the Kinetics option has been installed in the ST-133, this readout
mode will be made available when you select the appropriate camera type on the
Hardware Setup dialog box.
Below is a simplified illustration of kinetics mode. Returning to our 4 × 6 CCD example,
in this case 2/3 of the array
to expose a 4 × 2 region. While the shutter remains open, charge is quickly shifted just
under the mask, and the exposure is repeated. After a third image is collected the shutter
is closed and the CCD is read out. Since the CCD can be read out slowly, very high
dynamic range is achieved. Shifting and readout are shown in
is masked, either mechanically or optically. The shutter opens
Figure 43.
D1
B1
C2C1D2
A2A1B2
D1
A2A1B2
A2A1B2
A4A3B4
B1
C2C1D2
A1
D1
B1
C2C1D2
D3
B3
C4C3D4
A2A1B2
A4A3B4
56
A6A5B6
D1
B1
C2C1D2
D3
B3
C4C3D4
C5D6D5
B5
D6
12
4
Figure 43. Kinetics Readout
D1
B1
C2C1D2
A2A1B2
D3
B3
3
A4A3B4
B1
A2
A4A3B4
A6A5B6
B2
B3
B5
C4C3D4
D1
C2C1D2
D3
C4C3D4
C5D6D5
C6
Page 90

90 MicroMAX System User Manual Version 6.C
Kinetic Timing Modes
Kinetics mode operates with three timing modes: Free Run, Single Trigger, and Multiple
Trigger.
Figure 44. Hardware Setup dialog box Figure 45. Experiment Setup dialog box
Free Run
In the Free Run Kinetics mode, the controller takes a series of im
ages, each with the
Exposure time set through the software (in WinView32, the exposure time is set on the
Experiment Setup|Main tab page). The time between image frames, which may be as
short as a few microseconds, is limited by the time required to shift an image under the mask:
this interimage time equals the Vertical Shift rate (specified in
μsec/row) multiplied by the
Window Size (the number of rows allocated for an image frame). The exact number of
frames depends on the selected Window Size and is equal to the number of pixels
perpendicular to the shift register divided by the Window Size.
Example: Referring to the readout shown in Figure 43, there are 6 pixels perpendicular to
the shift register and the Window Size is 2 pixels high. The num
Vertical Shift Rate for the CCD is 1.6
μsec/row, the Shift time will be 3.2 μsec per frame.
ber of frames is 3. If the
Integrate signals (SHUTTER) or Readout signals (NOT SCAN) are provided at the
BNC for timing measurements
Page 91

Chapter 6 Advanced Topics 91
START ACQUIRE command from the software issent automatically
START ACQUIRE
SHUTTER Signal
when ACQUIRE or FOCUS is clicked on in the software.
Exposure
Shift
NOT SCAN Signal
Shutter
opening
time
Shutter
closing
time
Readout
Figure 46. Free Run Timing Diagram
Single Trigger
Single Trigger Kinetics mode takes an entire series of images with each External Trigger
Pulse (applied at the Ext. Sy
nc BNC on the control board of the ST-133). After the series is
complete the shutter closes and the CCD is read out at normal speeds. Once the readout is
complete the camera is ready for the next series of exposures. This timing is shown in
Figure 47, where a single External trigger pulse is used to collect a burst of 6 frames.
START ACQUIRE command from the software issent automatically
START ACQUIRE
External Trigger
SHUTTER Signal
when ACQUIRE or FOCUS is clicked on in the software.
Exposure
Shift
NOT SCAN Signal
Shutter
opening
time
Shutter
closing
time
Readout
Figure 47. Single Trigger Timing Diagram
Multiple Trigger
Multiple Trigger Kinetics mode takes a single im
age in the series for each External Sync
pulse received by the controller. Once the series is complete the shutter closes and
readout begins. Since the shutter is open during the entire series of images, if the External
Sync pulses are irregularly spaced then the exposures will be of different lengths. Once
the series has been read out the camera is ready for the next series. This timing is shown
Figure 48, where a series of 6 frames is collected with 6 External Sync pulses.
in
Page 92

92 MicroMAX System User Manual Version 6.C
START ACQUIRE command from the software issent automatically
START ACQUIRE
External Triggers
SHUTTER Signal
when ACQUIRE or FOCUS is clicked on in the software.
Exposure
Shift
NOT SCAN Signal
Shutter
opening
time
Figure 48. Multiple Trigger Timing Diagram
Shutter
closing
time
Readout
Page 93

Chapter 7 MicroMAX DIF Camera (Double Image Feature)
Supported by WinView/WinSpec Version 2.5 when the communication protocol is
TAXI (PCI), this feature is not supported when the protocol is USB 2.0.
Introduction
This chapter describes operation of the MicroMAX DIF system. Both the Controller and
a MicroMAX Interline camera must have factory modifications installed for DIF
operation. In addition to the internal changes, a camera modified for DIF operation would
ordinarily include a mechanical shutter. Execution of the DIF functions is done via the
WinView/32 software (v2.2 or higher), which, when controlling a DIF system, provides
three timing modes unique to DIF systems.
Basically, a DIF system is one that has been factory
in pairs with very short exposure times (as small as 1 µs). This capability makes it ideal
for use in experiments where the goal is to obtain two fast successive images for the
purpose of characterizing a time-differentiated laser-strobed process. LIF and velocity
measurements are specific measurements that can be easily performed using the DIF
system.
The ability of the interline chip to quickly transfer an im
and hold it there makes this method of acquiring images possible. As soon as the first
image is acquired, it is shifted under the masked area and held. The second exposure
begins and is continuously held in the photodiode region until the mechanical shutter
closes. Light entering the camera while waiting for the shutter to close is small compared
to that captured during the strobed event and has little effect on the acquired data.
In addition to the Free Run mode, which allows single image acquisitions, three DIF
ing modes, IEC (Internal Exposure Control), EEC (External Exposure Control) and
tim
ESABI (Electronic Shutter Active Between Images) are provided. Each works basically
as follows.
IEC: Allows two successive fast im
image acquisition taking place immediately after the first. Acquisition is initiated by
applying a single externally derived trigger to the controller's Ext. Sync connector.
EEC
: Allows two successive fast images of differing duration to be acquired, with the
second image acquisition taking place immediately after the first. Acquisition is
initiated by applying a single externally de
connector, the same as in IEC operation.
ages of equal duration to be acquired, with the second
modified to allow images to be taken
age under the masked columns
rived trigger to the controller'
s Ext. Sync
93
Page 94

94 MicroMAX System User Manual Version 6.C
ESABI: Allows two fast images of equal duration to be acquired. Unlike the IEC and
EEC modes, in the ESABI mode, two pulses are applied to the Ext. Sync.
connector. Each initiates a separate acquisition, allowing the user to set the time
between acquisitions by externally adjusting the time between the two applied pulses.
When the data is saved, both images are saved in a single *.spe file. The header is
followed by
Notes:
1. ra tab page (Hardware on the Setup The Readout Mode set on the Controller/Came
menu) must be set to DIF for DIF operation.
2. SABI timing mode, set the Number of Images to 2 and In the IEC, EEC or E
Accumulations to 1.
3. ry Values button. On the Setup Hardware Cleans/Skips tab page, click the Load Facto
This step is necessary for proper operation of the interline camera.
4. For most of the MicroMAX DIF cameras, the ESABI timing mode is activated and
deactivated via the application software. If a MicroMAX DIF camera has a switch on
its back panel, this switch must be set to the ACTIVE position for operation in the
ESABI timing mode. At all other times it must be set to INACTIVE.
frame 1 and then immediately afterwards by frame 2. This system m
t to later load the im
ages from the file for post-processing analysis. convenien
akes it
Timing Mo
des
The timing mode selections provided on the Acquisition Experiment Setup Tim
are ndard systems. The provided timing modes are:
different from those in sta
FREERUN (single shot)
IEC: Internal Exposure Control (two shot)
EEC: External Exposure Control (two shot)
ESABI: Electronic Shutter Activ
A discussion of each mode follows.
e Between Images (two shot)
Free Run
The Free Run mode allows the user to capture single images. The exposure time is set on
the Experiment Setup Main tab page, the same as in non-DIF systems, with the
difference that the exposure time can be as short as one 1 µs (maximum exposure time is
14.3 minutes). It often proves convenient to simply disable the mechanical shutter open
in Free Run operation. The shutter requires ~8 ms to open and 8 ms to close. The camera
waits until the shutter is completely open before acquiring the image, and in a typical
experiment, the second image acquisition will be
Readout doesn’t occur until the shutter closes.
The
such as the laser. As soon as the shutter is completely opened and all of the cleans have
been performed,
image. As soon as the first exposure actually be
Figure 49. Thus the positive going edge of the
signal output of the controller can be used to trigger external equipment,
goes low to indicate that th era is ready to capture an
over long before the shutter closes.
e cam
gins,
returns high, as shown in
output marks the start of the first
ing page
Page 95

Chapter 7 MicroMAX DIF Camera 95
exposure. In Free Run operation, the time that remains low will ty
pically be in
the range of 400 to 600 ns.
READY
400 ns
EXPOSURE
Figure 49. Free Run Mode Timing Diagram
Example: Figure 50 shows an experiment where signal is
the rising edge of the
and used to trigger a DG-535 Delay Generator, which provides the required delay
triggers a laser source, Q switch, or other device.
Computer DG-535
Camera
Head
Controller
READY
Q Switch
Figure 50. Setup using to Trigger an Event
illustrates the timing for a typical experiment like that shown in Figure 51 Figure 50.
READY
400 ns
EXPOSURE
To Q Switch
1 μs
2 μs
Figure 51. Timing for Experiment Setup shown in Figure 50
Page 96

96 MicroMAX System User Manual Version 6.C
Summary of Free Run Timing mode
• Allows you to capture single images.
• Requires that the switch, if present on the back of the camera, be set to INACTIVE.
• Uses Exposure Time set via software Experiment Setup.
• Exposure time range is 1 µs < Exp. Time < 14.3 minutes
• Exposure does not occur until the mechanical shutter is completely open and readout
does not begin until the mechanical shutter is completely closed.
• The mechanical shutter may, however, be disabled open.
The
external hardware.
signal on the back of the controller may be used as a trigger to other
goes low when the system is ready to capture an image, then
is reset high once exposure begins. In the FREERUN timing mode, this will be a short
(400 ns to 600 ns) TTL 0 pulse.
IEC (Internal Exposure Control)
In this mode, a single external trigger applied to Ext Sync initiates two successive image
acquisitions of equal duration. The Exposure Time is set in software (Experiment Setup
Main tab page and elsewhere) the same as in a standard system and can be as short as 1
µs. On initiating the acquisition (ACQ button or Acquire on the Acquisition menu), the
initialization routine runs and the shutter opens. When the shutter is completely open,
drops low and remains in that state until an external trigger is applied to Ext
Sync. Continuous cleaning takes place until the trigger is applied. When the trigger is
sensed, the first exposure begins and the first image is captured (shifted under the masked
columns and held there). The exposure for capture of the second image begins. This
sequence is illustrated in
If an external trigger is applied before
trigger source could be running continuously at some repetition rate (as long as that rep
rate is fairly slow), but capture wouldn’t occur until
comes in, it begins exposure of the first image. The exposure time is that set on the
Experiment Setup Main tab page. For example, if the exposure time is set to 5 µs, the
first image will be 5 µs. After an additional 5 µs (second exposure), the shutter will begin
to close. Even though the shutter takes ~8 ms to close, the presumption is that the strobe
will be timed to occur during the 5 µs second exposure time. It would also be possible to
strobe and capture while the shutter is in the act of closing. However, that would
generally not be advisable because it would introduce non-linearity effects from the
closing shutter. It is better to have capture occur during the time allotted for it. Once the
shutter is closed, the readout begins. The first image captured is the first one read out.
Figure 52.
goes low, it will be ignored. Thus the
goes low. Once that trigger
Example 1: An external trigger initiates the im
the system is ready. Once
is low, an external trigger applied to Ext
Sync initiates the double image capture. Figure 52 illustrates the timing for a
ty
pical IEC experiment with an exposure time of 5 µs.
aging process.
goes low when
Page 97

Chapter 7 MicroMAX DIF Camera 97
READY
EXT. SYNC.
Images
200 ns
~200 ns
Image1 Image 2
5 μs
5 μs
NOTSCAN
Mechanical
Shutter
8 ms
>200 ns
8 ms
Laser Output
Laser 1 Laser 2
Figure 52. Timing Diagram for Typical IEC Measurement
Figure 53 illustrates the interconnections that might be used for such an experiment with two
Figure 54 shows the timing for the two-laser experiment.
lasers.
Computer
Controller
EXT SYNC
A DG535 can run at a
fairly slow rep rate or
use READY signal as
a trigger.
Delay Generator
(i.e.,DG535)
ABC
Laser 2Laser 1
READY
EXT. SYNC.
Images
NOTSCAN
Mechanical
Shutter
Laser Output
Figure 54. Timing Diagram for IEC Experiment with Two Lasers
Camera
Head
Sample
Volume
STOP
Figure 53. Setup for IEC Experiment with Two Lasers
200 ns
Image 1 Image 2
5 μs 5 μs
8 ms
>200 ns
Laser 1 Laser 2
8 ms
Page 98

98 MicroMAX System User Manual Version 6.C
Example 2: As shown in Figure 55, the signal from the controller can be used
to trigger the controller by connecting it back into the EXT SYNC connector. At
the same time, it can be used to trigger a DG-535.
Computer
EXT SYNC
READY
Camera
Head
Controller
Delay Generator
(i.e.,DG535)
AB
Ext.
Laser 1
Laser 2
Figure 55. Another Hardware Setup for an IEC Measurement
Note: This setup will not work in the EEC mode or the ESABI mode.
Summary of IEC Timing mode
• Gives the user the ability to capture two images before readout.
• Requires that the switch, if present on the back of the camera, be set to INACTIVE.
• The Exposure Time set in software on the Experiment Setup Main tab page becomes
the exposure time of the first image and also the wait before closing the mechanical
shutter.
• An external trigger is required to initiate the imaging process. The goes low
when the system is ready. Once
is low, an external trigger applied to the
EXT SYNC connector initiates the double image capture.
EEC (External Exposure Control)
Gives the user the ability to capture two images before readout with a different exposure
time for each. EEC uses the external trigger to control the exposure time of the first
image and the exposure time set in software to control the exposure time of the second
image. When the external trigger applied to Ext Sync is detected, the first exposure
begins. The end of the trigger marks the end of the first image and the start of the second.
After an interval equal to the exposure time set on the Experiment Setup Main page, the
shutter closes. As in the IEC mode, the system is receptive to an applied trigger when
goes low. Note that the shutter can be disabled open. With the shutter disabled
open, if reading out a full array, the second exposure time would actually last ~1.4 s. If
reading out a single strip, the readout time (and hence the second exposure) would be
much shorter, on the order of a few hundred microseconds. Generally though, the
experiment timing would be set up so that the second strobed event would occur during
the second image time as set by the Exposure Time parameter on the Experiment Setup
Main page.
Example: The exposure tim
the EXT. SYNC connector. The exposure time for the second image is the
exposure time set in software under Experiment Setup. An external trigger
supplied by the user is required to initiate the imaging process and control the
e for the first image is controlled with the signal applied to
Page 99

Chapter 7 MicroMAX DIF Camera 99
first image exposure time. The controller signal goes low when the
camera is ready to begin imaging.
READY
EXT. SYNC. (A)
Figure 56 illustrates an EEC timing example.
200 ns
Images
NOT SCAN
Mechanical
Shutter
8 ms
Image 1
t
sync
Figure 56. EEC Timing Example with Exposure Time in Software Set to t
Image 2
t
exp
8 ms
exp
Summary of EEC Timing mode
• Enables double image capture under external control.
• Requires that the switch, if present on the back of the camera, be set to INACTIVE.
• The width of the pulse applied to Ext Sync sets the exposure time of the first image.
The Exposure Time set in software on the Experiment Setup Main tab page sets the
second image time, at the end of which the shutter begins to close.
• An external trigger is required to initiate the imaging process. The goes low
when the system is ready. Once
is low, an external trigger applied to the
Ext Sync connector initiates the double image capture.
ESABI (Electronic Shutter Active Between Images)
The last timing mode, ESABI, allows separation time between the two images. This
mode gives the user the ability to capture two images and use the interline chip’s
electronic shutter feature between images so that no signal is integrated in the time
between. The exposure time for both images is the same but they can be separated in
time. Each time the camera is ready to receive a trigger,
goes low twice during each ESABI cycle and the controller can be triggered
once by a sync pulse applied to Ext Sync each time. Thus two sync pulses are required,
one for each image, during each double capture. The programmed Exposure Time as set
on the Experiment Setup Main tab page sets the first image time and the time after the
start of the second image time when the shutter begins to close.
ESABI m
ode timing.
goes low. Thus
Figure 57 illustrates
Note that charge produced by light impinging on the photosensors during the interval
between the two im
ages is discarded and does not affect the second image. The time
between the first and second image can be as long as required according to the
experimental requirements. This can be particularly useful in fluorescence measurements.
By doing captures with different intervals between the two images, the fluorescence
decay characteristics can be easily measured.
Page 100

100 MicroMAX System User Manual Version 6.C
READY
EXT. SYNC. (A)
Images
NOT SCAN
Mechanical
Shutter
8 ms
Figure 57. ESABI Timing Example: Image Exposure time = t
Note: The input trigger pulse, t
t
trig
Image 1
t
exp
, must be shorter than the exposure time t
trig
No Signal
Integration
200 ns200 ns
t
trig
Image 2
t
exp
set in software
exp
8 ms
. Otherwise
exp
the second image will occur immediately after the first.
Summary of ESABI Timing mode
• The exposure time selected in Experiment Setup sets the exposure time of both the
first and second image.
• Requires that the switch, if present on the back of the camera, be set to ACTIVE.
• An externally derived trigger edge applied to Ext Sync is required to begin each
image exposure period.
• goes low when the system is ready to capture each image.
Tips and Tricks
Lab Illumination
In DIF measurements, it is necessary to remain mindful of the possibility of laboratory
light affecting the images. Because the first image can be timed with precision, laboratory
light that reaches the camera would generally not be a problem in the first image,
particularly if the capture time is short (few microseconds). The second image, on the
other hand, is much more susceptible to degradation from laboratory illumination
because, even though the second image time may be set to just a few microseconds, the
time to close the shutter, ~8 ms, must be added to that value. Light impinging on the
photosensors during that time will be integrated with the second image. Unless the
experiment is arranged so that background light can’t reach the camera, or unless the
signal is quite bright, the possibility of the second image becoming degraded must be
considered. Where this is source of degradation is a problem, the solution may be to
sharply reduce the laboratory illumination. It should be noted though, that the signal from
many strobed measurements will be sufficiently bright to allow normal laboratory
illumination to be maintained.
Background Subtraction
In any of the double imaging modes, a good idea would be to block both of your light
sources and go ahead and take two images in the same DIF mode and with the same
settings as will be used for the real measurements. That result will be two background
images that can later be subtracted from the experimental data images.
 Loading...