


Revision 01/2018 EN
PRIMES
BeamMonitor BM+
BM+ 60, BM+ 100
LaserDiagnosticsSoftware LDS 2.98
Translation of the original instructions
Operating Manual


IMPORTANT!
READ CAREFULLY BEFORE USE.
KEEP FOR FUTURE USE.

PRIMES
BeamMonitor BM+ with LDS 2.98
4
Revision 01/2018 EN
Table of contents
1 BASIC SAFETY INSTRUCTIONS 8
2 SYMBOL EXPLANATIONS 10
3 ABOUT THIS OPERATING MANUAL 11
4 INTRODUCTION 12
4.1 Laser beam measurement .....................................................................................................12
5 SYSTEM DESCRIPTION 13
6 CONDITIONS AT THE INSTALLATION SITE 13
7 INSTALLATION 14
7.1 Preparation .............................................................................................................................14
7.2 Installation position .................................................................................................................14
7.3 Alignment ...............................................................................................................................14
7.4 Mounting ................................................................................................................................15
8 ELECTRICAL CONNECTIONS 16
8.1 Connection BeamMonitor BM+ with the standard power supply and the PC (example) ........18
8.2 Operation of two measuring devices .....................................................................................19
9 STATUS DISPLAY 20
10 SOFTWARE 21
10.1 System requirements .............................................................................................................21
10.2 Installing the software ............................................................................................................21
10.3 Starting the software .............................................................................................................. 22
10.3.1 Graphical user interface ..........................................................................................22
10.3.1 The menu bar .........................................................................................................24
10.3.2 The tool bar ............................................................................................................. 25
10.3.3 Menu overview ........................................................................................................26
10.4 Establishing an Ethernet Connection ..................................................................................... 28
10.4.1 Establishing a connection to PC .............................................................................28
10.4.2 Changing the IP address ........................................................................................29
11 SOFTWARE FUNCTIONS IN DETAIL 31
11.1 Settings ..................................................................................................................................31
11.1.1 Sensor parameter ...................................................................................................31
11.1.2 Measuring Environment (menu Measuring>>Environment) ............................. 33
11.1.3 Beam find (Menu Measurement>>BeamFind settings) ..................................34
11.1.4 Single measurement (menu Measurement>>Single measurement) ...............35
11.1.5 Adjustment mode .................................................................................................. 39
11.2 Presentation and documentation of the measuring results .................................................... 42
11.2.1 Tool bar of the LDS .................................................................................................42
11.2.2 False colors .............................................................................................................43
11.2.3 False colors (filtered) ..............................................................................................44
11.2.4 Isometry .................................................................................................................. 44
11.2.5 Caustic display (2D-display) ...................................................................................45
11.2.6 Isometry 3D ............................................................................................................ 49
11.2.7 Review 86 % or 2
nd
Moment....................................................................................50
11.2.8 Symmetry Check ....................................................................................................51
11.2.9 Fixed Contour Lines ................................................................................................52

PRIMES
BeamMonitor BM+ with LDS 2.98
5
Revision 01/2018 EN
11.2.10 Variable Contour Lines............................................................................................53
11.2.11 Graphical Review ....................................................................................................54
11.2.12 Color Tables ............................................................................................................54
11.2.13 Evaluation (option) ..................................................................................................55
11.3 File .........................................................................................................................................56
11.3.1 New .........................................................................................................................56
11.3.2 Open .......................................................................................................................56
11.3.3 Save ........................................................................................................................56
11.3.4 Save As... ................................................................................................................ 56
11.3.5 Export .....................................................................................................................56
11.3.6 Load measurement preferences .............................................................................56
11.3.7 Save measurement preferences .............................................................................56
11.3.8 Protocol ...................................................................................................................56
11.3.9 Print ........................................................................................................................57
11.3.10 Print preview... .........................................................................................................57
11.3.11 Recently opened files .............................................................................................57
11.3.12 Exit ..........................................................................................................................57
11.4 Edit .........................................................................................................................................57
11.4.1 Copy ........................................................................................................................57
11.4.2 Clear plane .............................................................................................................57
11.4.3 Clear all planes ....................................................................................................... 57
11.5 Communication ......................................................................................................................58
11.5.1 Free Communication ...............................................................................................58
11.5.2 Scan device list .......................................................................................................58
11.6 Script ...................................................................................................................................... 59
11.6.1 Editor ......................................................................................................................59
11.6.2 List ..........................................................................................................................59
11.6.3 Python .....................................................................................................................59
12 MEASURING 60
12.1 Special safety instructions ......................................................................................................60
12.2 Requirements .........................................................................................................................60
12.3 Possible Types of Measurement .............................................................................................61
12.3.1 Single Measurement ............................................................................................... 61
12.3.2 Caustic measurement ............................................................................................. 61
12.4 Brief Instruction for a first Single Measurement .....................................................................61
12.5 Measurement with a DBY-PS+ Detector ................................................................................65
13 DISCUSSION OF THE MEASURING RESULTS AND ERROR ANALYSIS 67
14 TROUBLESHOOTING 68
15 DETECTORS 69
15.1 Changing the Detector ...........................................................................................................70
16 MAINTENANCE AND SERVICE 72
17 TRANSPORT 72
18 MEASURES FOR THE PRODUCT DISPOSAL 72
19 DECLARATION OF CONFORMITY 73
20 TECHNICAL DATA 74

PRIMES
BeamMonitor BM+ with LDS 2.98
6
Revision 01/2018 EN
21 DIMENSIONS 75
21.1 BeamMonitor BM+ 60 ............................................................................................................75
21.2 BeamMonitor BM+ 100 ..........................................................................................................76
22 APPENDIX 77
22.1 System control (option) ..........................................................................................................77
22.2 Description of the MDF file format..........................................................................................77
23 BASIS OF BEAM DIAGNOSIS 79
23.1 Laser beam parameter ..........................................................................................................79
23.1.1 Rotationally symmetric beams ................................................................................ 79
23.1.2 Non rotationally symmetric beams: .........................................................................80
23.2 Calculation of beam data .......................................................................................................81
23.2.1 Determination of the zero level ...............................................................................81
23.2.2 Determination of the beam position ........................................................................ 82
23.2.3 Radius determination with the 2
nd
moment method of the
power density distribution .......................................................................................82
23.2.4 Radius determination with the method of the 86 % power inclusion .....................83
23.2.5 Further radius definitions (option) ........................................................................... 84

PRIMES
BeamMonitor BM+ with LDS 2.98
7
Revision 01/2018 EN
PRIMES - the company
PRIMES is a manufacturer of measuring devices used for the characterization of laser beams. These devices
are used for the diagnostics of high power lasers that range from high power CO2-lasers and solid-state
to fiber lasers and diode lasers. A great variety of measuring devices for the determination of the following
parameters is available:
• The laser power
• The beam dimensions and the beam position of an unfocussed beam
• The beam dimensions and the beam position of a focussed beam
• The diffraction index M²
Both the development and the production of the measuring devices are effected by PRIMES. This is how we
ensure an optimal quality, excellent service and a short reaction time which is the basis to meet our customers‘ requirements fast and reliably.
Max-Planck-Str. 2 - 64319 Pfungstadt -Germany- info@primes.de - www.primes.de
35,0(6

PRIMES
BeamMonitor BM+ with LDS 2.98
8
Revision 01/2018 EN
1 Basic safety instructions
Intended use
The BeamMonitor BM+ has been designed exclusively for measurements carried out in or near the optical
path of high-power lasers. Please observe and adhere to the specifications and limit values given in Chapter
„20 Technical Data“ on page 74. Other uses are considered to be improper. The information contained in
this operating manual must be strictly observed to ensure proper use of the device.
Using the device for unspecified use is strictly prohibited by the manufacturer. By usage other than intended
the device can be damaged or destroyed. This poses an increased health hazard up to fatal injuries. When
operating the device, it must be ensured that there are no potential hazards to human health.
The device itself does not emit any laser radiation. During the measurement, however, the laser beam is
guided onto the device which causes reflected radiation (laser class 4). That is why the applying safety
regulations are to be observed and necessary protective measures need to be taken.
Observing applicable safety regulations
Personal protection is required when humans are present in a dangerous zone with uncovered visible or
invisible laser radiation or particularly uncovered laser beam systems, beam guiding systems or process
regions. This holds true for any application of this equipment. During measurement procedures there is
always an unavoidable risk of laser radiation through direct or reflected emissions. The applicable safety
regulations are stipulated in ISO/CEN/TR standards as well as in the IEC-60825-1 regulation, in ANSI Z
136 “Laser Safety Standards” and ANSI Z 136.1 “Safe Use of Lasers”, published by the American National
Standards Institute, and additional publications, such as the “Laser Safety Basics”, the “LIA Laser Safety
Guide”, the “Guide for the Selection of Laser Eye Protection” and the “Laser Safety Bulletin”, published by
the Laser Institute of America, as well as the “Guide of Control of Laser Hazards” by ACGIH.
Taking necessary safety measures
If there are people present within the danger zone of visible or invisible laser radiation, for example near
laser systems that are only partly covered, open beam guidance systems or laser processing areas, the
following safety measures need to be taken:
• Please wear safety goggles (OD 6) adapted to the power, power density, laser wave length and
operating mode of the laser beam source in use.
• Please protect yourself from direct laser radiation, scattered radiation as well as from beams
generated from laser radiation (for example by using appropriate shielding walls or by weakening the
radiation to a harmless level).
• Please use beam guidance – or beam absorber elements which do not emit any hazardous particles
as soon as they get in contact with laser radiation and which resist the beam sufficiently.
• Please install safety switches and / or emergency safety mechanisms which enable an immediate
closure of the laser shutter.
• Ensure that the device is mounted securely to prevent any movement of the device relative to the
beam axis and thus reduce the risk of scattered radiation. This in the only way to ensure optimum
performance during the measurement.
Employing qualified personnel
Das Gerät darf ausschließlich durch Fachpersonal bedient werden. Das Fachpersonal muss in die Montage
und Bedienung des Gerätes eingewiesen sein und grundlegende Kenntnisse über die Arbeit mit Hochleistungslasern, Strahlführungssystemen und Fokussiereinheiten haben.
Modifications
The manufacturer and the distributor of the measuring devices do not claim liability for damages or injuries
of any kind resulting from an improper use or handling of the devices or the associated software. Neither the

PRIMES
BeamMonitor BM+ with LDS 2.98
9
Revision 01/2018 EN
manufacturer nor the distributor can be held liable by the buyer or the user for damages to people, material
or financial losses due to a direct or indirect use of the measuring devices.
Liability disclaimer
The manufacturer and the distributor of the measuring devices do not claim liability for damages or injuries
of any kind resulting from an improper use or handling of the devices or the associated software. Neither
the manufacturer nor the distributor can be held liable by the buyer or the user for damages to people or
material or financial losses due to a direct or indirect use of the measuring devices.

PRIMES
BeamMonitor BM+ with LDS 2.98
10
Revision 01/2018 EN
2 Symbol explanations
The following symbols and signal words indicate possible residual risks:
DANGER
means that death or serious physical injuries will occur if necessary safety precautions are not taken.
WARNING
means that death or serious physical injuries can occur if necessary safety precautions are not taken.
CAUTION
means that a slight physical injury can occur if necessary safety precautions are not taken.
NOTICE
means that property damages can occur if necessary safety precautions are not taken.
The device itself or the packing bears the following symbols to indicate requirements and possible
dangers:
Warning of hand injuries
Read and observe the operating instructions and safety guidelines before the
start-up!
Further symbols that are not security relevant:
i
Here you can find useful information and helpful tips.
With the CE designation, the manufacturer guarantees that its product meets the requirements of
the relevant EC guidelines.
Call for action

PRIMES
BeamMonitor BM+ with LDS 2.98
11
Revision 01/2018 EN
3 About this operating manual
This documentation describes the work with the BeamMonitor BM+ and the operation with the “LaserDiagnosticsSoftware” (in the following called “LDS”).
As far as the description of the software is concerned, the focus lies upon the configuration- and communication settings as well as the measuring operation.
i
This operating manual describes the software version v2.98.8, which is applicable at the time of
printing. Due to the fact that the user software is continuously advanced, it may be possible that
the attached installation CD bears a different version number. The correct functioning of the device,
however, is ensured with the software.
Should you have any questions, please be so kind as to provide us with the software version installed on
your computer. The software version, the creation date as well as the Windows® version our LaserDiagnosticsSoftware was programmed for can be found in the following menu item: Help>>About LaserDiag-
nosticsSoftware.
Fig. 3.1: Information regarding the latest software version

PRIMES
BeamMonitor BM+ with LDS 2.98
12
Revision 01/2018 EN
4 Introduction
4.1 Laser beam measurement
Laser beams in industrial applications, whether they be CO2, Nd:YAG- diode or fibre lasers, work with invisible beams in the infra-red or near infra-red spectral range (NIR). Hence changes in beam quality or power
cannot be detected visually, and only become evident from the outcome of their application. Under some
circumstances, this results in very expensive rejects being produced.
If the deterioration in quality is not recognised in the manufacturing process, this usually results in the subsequent failure of the product in use, with consequences for the manufacturer of rectification, replacement
and loss of image.
This is where PRIMES beam diagnostics devices for measuring beam quality, focusability and laser power
come in. Process monitoring in production with laser beam diagnostics devices by PRIMES enables consistent quality assurance and allows the timely detection and elimination of malfunctions of laser beams.
PRIMES measuring devices allow the reliable recording of current beam parameters, and enable ongoing
documentation of beam properties for quality assurance purposes. This is a requirement that should not be
underestimated in many industrial areas, such as automotive or medical technology.
With PRIMES devices for beam diagnostics, troubleshooting of laser applications is simplified considerably.
The beam intensity profile, beam diameter, beam caustic before and after focusing, and laser power to be
applied are directly measured and analysed. Based on the readings and their evaluation, maintenance and
servicing personnel can work in a targeted way on repair. Loss of time and system downtimes due to “trying
out” possible causes of the problem are effectively avoided.
The same applies to process optimisation and approval of process windows in laser material processing.
Only if the focal position and focal dimension and also the intensity profile of the laser beam are known, can
processes such as laser beam cutting, welding or drilling be adjusted to the particular component geometry,
materials be selected and the breadth of process windows be determined reliably.
PRIMES
BeamMonitor BM+ with LDS 2.98
13
Revision 01/2018 EN
5 System description
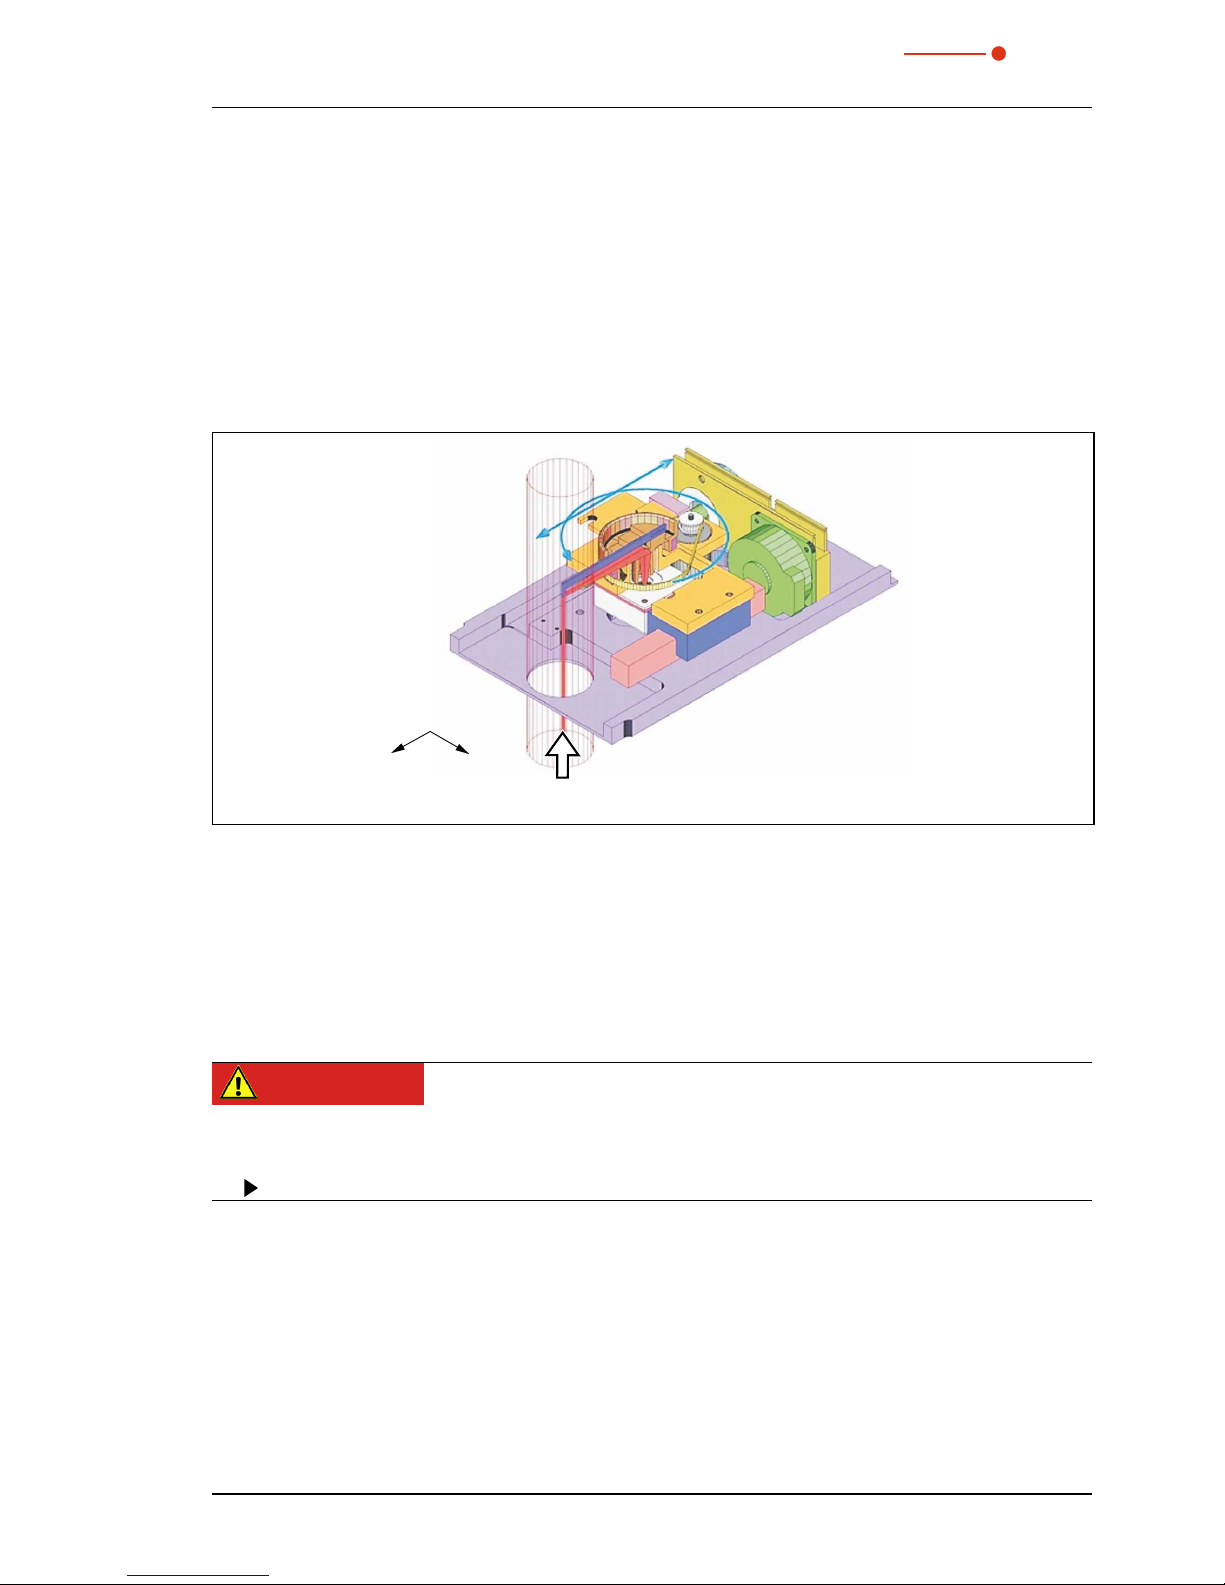
The BeamMonitor BM+ (see Fig. 5.1) is a device to analyze the spatial power density distribution of the
raw beam of CO2 or NIR lasers. Results of the measurements are beam radius, beam position and power
density profile.
The BeamMonitor BM+ is using the scanning measuring principle. Its dimensions are adapted to the rawbeam diameter which needs a larger aperture. The BeamMonitor BM+ has no z-axis. Due to the availability
of different detectors, it is possible to use the BeamMonitor BM+ with a wide range of wavelengths and
power densities.
Laser beam
x
y
Fig. 5.1: Optomechanical assembly of the BeamMonitor BM+
6 Conditions at the installation site
• The measuring devices must not be operated in a condensing atmosphere.
• The ambient air must be free of organic trace gases.
• Please protect the devices from water and dust.
• Operate the measuring devices in closed rooms only.
DANGER
Fire an explosion hazards due to laser radiation
Scattered radiation is developed during the measurement.
Do not store ammable materials or highly ammable substances in the area of measurement.

PRIMES
BeamMonitor BM+ with LDS 2.98
14
Revision 01/2018 EN
7 Installation
7.1 Preparation
The measuring device must be assembled stably and must be affixed by means of screws (see chapterl
7.4 on page 15).
DANGER
Fire hazard; Damaging/Destruction of the device
After passing the device, the laser beam has to be absorbed completely. Fire bricks or other
partly-absorbing surfaces are not suitable!
Please use an adequate absorber, e.g. the PRIMES PowerMonitor.
7.2 Installation position
The BeamMonitor BM+ can also be mounted horizontally or vertically.
Mounting surface
BeamMonitor BM+
Mounting surface
BeamMonitor BM+
Mounting surface
BeamMonitor BM+
Mounting surface
BeamMonitor BM+
Horizontal mounting Vertikal mounting
Beam incidence
Fig. 7.1: Mounting options for the BeamMonitor BM+
7.3 Alignment
The BeamMonitor BM+ has to be positioned correctly and a solid assembly needs to be ensured. The beam
has to hit the measuring aperture perpendicular and centrally.
DANGER
Serious eye or skin injury due to laser radiation
If the proportion of the laser beam diameter with regard to the diameter of the aperture is
too large, scattered radiation could occur during the measurement operation.
The laser beam diameter must not exceed 0.7 times the aperture diameter.
Especially in case of a high beam quality, we would recommend to remain below 0.6. Otherwise, a falsification
of the measuring results due to the cutting off of border fields is to be expected. Especially when it comes
to the determination of radii according to the 2nd-moments-method, problems are possible. Moreover, there
is a danger of a heating up of the housing.

PRIMES
BeamMonitor BM+ with LDS 2.98
15
Revision 01/2018 EN
7.4 Mounting
DANGER
Serious eye or skin injury due to laser radiation
If the appropriate position of the measuring device is changed, this could cause increased
scattered radiation during the measurement.
When mounting the device, please ensure that it cannot be moved, neither due to an unintended push or a pull on the cables and hoses.
NOTICE
Damage/Destruction of the device
Due to screws which are too long, internal components could be destroyed.
Please consider, that the fastening screws must only extend up to 10 mm into the housing.
There are four tapped holes M6 in the mounting surface of the housing intended for the customer’s mounting. Please use at least four screws to fasten the device. The total length of the screws depends on the
dimensions of the customer’s mounting. The dimensioned order of the fixing holes can be found in chapter
19 on page 73.

PRIMES
BeamMonitor BM+ with LDS 2.98
16
Revision 01/2018 EN
8 Electrical connections
The BeamMonitor BM+ require a supply voltage of 24 V ±10 % (DC) for the operation. A fitting power supply
is part of the scope of delivery. Only use cables with an equipment grounding conductor in order to connect
the power supply unit with the local electricity network.
A further device, such as a PowerMonitor PM, can be connected to the BeamMonitor BM+ via the RS485
interface (PRIMES bus). The signal from the PM is forwarded through the BeamMonitor BM+ to the PC via
the Ethernet interface. The additional measuring device is electrically supplied via the power supply of the
BeamMonitor BM+.
i
Before connecting the PC via the Ethernet interface, you must install the LDS software on the
computer (see chapter 9.2 on page 20).
Power On/Off
Power In
BM
+
BeamMonitor
Ethernet
PRIMES-Bus
RS 485
RS485
On/Off-Switch
Status display Ethernet connection
Power supply connection
Fig. 8.1: Connections of the BeamMonitor BM+
i
Please ensure that all electrical connections are established before starting the software!

PRIMES
BeamMonitor BM+ with LDS 2.98
17
Revision 01/2018 EN
Power supply connection
Harting M12-P-PCB-THR-2PC-5P-LCOD-M-STR
Pin Function
1 +24 V
2 Not assigned
3 GND
4 Not assigned
5 FE
Tab. 8.1: Connection socket for the power supply
PRIMES Bus
Pole arrangement D-Sub-socket, 9 pole (view of plug-in side)
15
6
9
Pin Function
1 GND
2 RS 485 (+)
3 +24 V
4 Trigger RS 485 (+)
5 Not assigned
6 GND
7 RS 485 (–)
8 +24 V
9 Trigger RS 485 (–)
Tab. 8.2: D-Submin-socket, PRIMES-Bus
In case you would like to use self-configured cables, please keep the following aspects in mind:
• The length of the cable reaching from the power supply to the measuring device must not exceed 1.8 m.
Otherwise the voltage drop of the cable would be too high.
• Please use shielded cable only and observe, that the shielding is efficient continuously.
• The cable length between the BeamMonitor BM+ and the second device (via RS485) must neither
exceed 2 m.

PRIMES
BeamMonitor BM+ with LDS 2.98
18
Revision 01/2018 EN
8.1 Connection BeamMonitor BM+ with the standard power supply and the PC (example)
Power On/Off
Power In
BM
+
BeamMonitor
Ethernet
PRIMES-Bus
RS 485
Ethernet Crossover Cable
Ethernet
PC
BeamMonitor BM+
PRIMES Power Supply
Fig. 8.2: Connection of the BeamMonitor BM+
Connect the BeamMonitor BM+ via a cross over cable with the PC or via a patch cable with the network.

PRIMES
BeamMonitor BM+ with LDS 2.98
19
Revision 01/2018 EN
8.2 Operation of two measuring devices
Power On/Off
Power In
BM
+
BeamMonitor
Ethernet
PRIMES-Bus
RS 485
Ethernet
PC
BeamMonitor BM+
PRIMES Power Supply
Error
Power
Interlock
PRIMES-Bus
RS 485
RS 485
RS 485
Analog
Out
USB
Clean
Compressed Air
Water Out
Water In
PM100
PowerMonitor
PowerMonitor 100
PRIMES Bus
RS485
Fig. 8.3: Connection of the BeamMonitor BM+ and the PowerMonito
i
For connection of several devices please use only one power supply (typically PRIMES power
supply).
NOTICE
There is a danger of damage
When disconnecting the bus connections during the operation (when the system is connected with the supply voltage), voltage peaks can develop which could destroy communication modules of the measuring devices.
Please turn off the power supply before disconnecting the bus cables.

PRIMES
BeamMonitor BM+ with LDS 2.98
20
Revision 01/2018 EN
9 Status display
The status display consists of a light ring, which indicates different states of the BeamMonitor BM+ by different colors and static or rotating light.
Color Lighting state Meaning
White The entire ring illumi-
nates
The supply voltage is applied
Yellow Rotating light The measuring tip rotates
Red Rotating light The measuring tip rotates and the y-axis is moved
-->measurement is running
Fig. 9.1: States of the status display

PRIMES
BeamMonitor BM+ with LDS 2.98
21
Revision 01/2018 EN
10 Software
In order to operate the measuring devices, the “PRIMES LaserDiagnosticsSoftware” (LDS) has to be installed
on the computer. The program can be found on the enclosed medium.
10.1 System requirements
Operating system: Windows® XP,/Vista/7/10
Processor: Intel® Pentium® 1 GHz (or comparable processor)
Free disc space: 15 MB
Monitor: 19“ screen diagonal is recommended, resolution at least 1024x768
i
When operating on a notebook, please deactivate all power saving functions. Otherwise problems
could occur due to the fast serial data transmission.
10.2 Installing the software
The installation of the software is menu driven and is effected by means of the enclosed medium. Please
start the installation by double-clicking the file “Setup LDS v.2.98.8.exe” and follow the instructions.
þ
Fig. 10.1: Setup of the PRIMES Software
If not stipulated differently, the installation software stores the main program “LaserDiagnosticSoftware.exe” in
the directory “Programs/PRIMES/LDS”. Moreover, the settings file “laserds.ini” is also copied into this directory.
In the file “laserds.ini” the setting parameters for the PRIMES-measuring devices are stored.

PRIMES
BeamMonitor BM+ with LDS 2.98
22
Revision 01/2018 EN
10.3 Starting the software
i
Please do not start the software before all devices are connected and turned on.
Please start the program by double-clicking the PRIMES symbol
in the new start menu group or the
desktop link.
10.3.1 Graphical user interface
Firstly, a start window is opened in which you can choose, whether you would like to measure or whether
you would just like to depict an existing measurement (factory setting “measurement”).
Fig. 10.2: Start window of the LaserDiagnosticsSoftware
After the detection of the connected device, the graphical user interface and several important dialogue
windows are opened.
In order to ensure that corresponding information can be assigned quickly, special markups for menu items,
menu paths and texts of the user interface will be used in the following chapters.
Markup Description
Text
Marks menu items.
Example: Dialogue window Sensor parameters
Text1>>Text2
Marks the navigation to certain menu items. The Order of the menus is depicted
by means of the Sign “>>”
Example: Presentation>>Caustic...
Text
Marks buttons, options and fields.
Example: With the button Start ....

PRIMES
BeamMonitor BM+ with LDS 2.98
23
Revision 01/2018 EN
The graphical user interface mainly consists of the menu as well as the tool bar by means of which different
dialogue or display windows can be called up.
Menu bar
Tool bar
Dialogue window
Fig. 10.3: The main elements of the user interface
It is possible to open different measuring and dialogue windows simultaneously. In this case, windows that
are basically important (for the measurement or the communication) remain in the foreground. All other
dialogue windows are overwritten as soon as a new window is opened.
Fig. 10.4: The main dialogue windows

PRIMES
BeamMonitor BM+ with LDS 2.98
24
Revision 01/2018 EN
10.3.1 The menu bar
In the menu bar, all main and sub menus offered by the program can be opened.

PRIMES
BeamMonitor BM+ with LDS 2.98
25
Revision 01/2018 EN
10.3.2 The tool bar
By clicking the symbols in the tool bar, the following program menus can be reached immediately.
File administration Presentation File selection Plane selection
1 2 3 4 5 6 7 8 9 10 11
1 - Create a new data record
2 - Open an existing data record
3 - Save the current data record
4 - Open the isometric view of the selected data record
5 - Open the variable contours line view
6 - Open review (86%)
7 - Open false color presentation
8 - Caustic presentation 2D
9 - List with all data records opened
10 - Display of the selected measuring plane
11 - Display of the measuring devices available for the bus by means of graphical symbols
All measuring results are always written into the document selected in the tool bar (item 9).
It is only possible to display documents chosen here. After opening, the data set has to be explicitly selected
(please see also chapter „11.2 Presentation and documentation of the measuring results“ on page 42).
i
Only the device selected in the tool bar is ready for the measurement.
Example:
A BeamMonitor BM+ as well as a PowerMonitor are connected with each other via a PRIMES bus. Both
devices are turned on and the LaserDiagnosticsSoftware is started. Then, the symbol of the device detected
first is activated, e.g. of the BeamMonitor BM+. For a power measurement with the PowerMonitor it is sufficient, to click on the device symbol (PM) in the tool bar. Then you can activate the power measurement via
Measurement>>Power measurement.
Fig. 10.5: Activating the PowerMonitor for a power measurement

PRIMES
BeamMonitor BM+ with LDS 2.98
26
Revision 01/2018 EN
10.3.3 Menu overview
File
New Opens a new file for the measuring data.
Open Opens a measuring file with the extensions “.foc” or “.mdf”.
Close Closes the file selected in the tool bar.
Close all Closes all files opened.
Save Saves the current file in foc- or mdf format.
Save as Opens the menu for the storage of the files selected in the tool bar. Only files with the
extensions “.foc” or “.mdf” can be imported safely
Export Exports all current data in protocol format “.xls” and “.pkl”.
Load measurement
preferences
Opens a file with measurement settings with the extension “.ptx”.
Save measurement
preferences
Opens the menu to save the settings of the last program run. Only files with the
extension “.ptx” can be opened.
Protocol Starts a protocol of the numeric results. They can either be written into a file or a
data base.
Print Opens the standard print menu.
Print preview Shows the content of the printing order.
Recently opened files Shows the file opened before.
Exit Terminates the program.
Edit
Copy Copies the current window to the clipboard.
Clear plane Deletes the data of the plane selected in the tool bar.
Clear all planes Deletes all data of the file selected in the tool bar
Change user level... By entering a password a different user level is activated.
Measurement
Environment Here, different system parameters can be entered, e.g.
- Reference value for the laser power
- Focal length
- Wave length
- Remarks
Sensor parameters The following device parameters can be e.g. set here:
- The spatial resolution
- The mechanical movement limits in z-direction
- Selection of one of the measuring devices connected with the bus
- The manual settings of the z-axis
LQM-Adjustment Not relevant for BeamMonitor BM+
Beamfind settings Setting parameter for a beamfind procedure. Relevant for BeamMonitor BM+ only.
CCD info Not relevant for BeamMonitor BM+
CCD
settings
Not relevant for BeamMonitor BM+
Power measurement Opens the measuring window power measurement.
Single... This menu item enables the start of single measurements, of the monitor mode and
the video mode.
Caustic... Enables the start of a caustic measurement. Not only automatic measurements but
also serial measurements of manually set parameters are possible. The automatic
measurement starts with a beam search and then caries out the entire measuring
procedure independently. Only the z-range that is to be examined as well as the
desired measuring plane have to entered.
Start adjustment mode Starts a special monitor mode optimized for the application of the BeamMonitor BM+
for the alignment of laser resonators.

PRIMES
BeamMonitor BM+ with LDS 2.98
27
Revision 01/2018 EN
Options Enables the setting of device parameters (advanced users only)
Presentation
False colors... False color display of the spatial power density distribution.
False colors (filtered)... Usage of a spatial filtration (spline-function) on the false color display of the power
density distribution.
Isometry... 3-dimensional presentation of the spatial power density distribution.
Isometry 3D... Allows a 3D presentation of caustic and power density distribution with spatial rota-
tion as well as an optional isophote display.
Review (86%)... Numerical overview of measuring results in the different layers basing on the 86%
beam radius definition.
Review (2. Moments)... Numerical overview of the measuring results in the different layers basing on the 2nd
moment beam radius definition.
Caustic... Results of the caustic measurement and the results of the caustic fit – such as beam
propagation ratio K, focus position and focus radius.
Raw beam... Not relevant for BeamMonitor BM+
Symmetry check... Analysis tool to check the beam symmetry especially for the alignment of laser reso-
nators. No standard feature of the devices.
Fixed contour lines… Display of the spatial laser density distribution with fixed intersection lines for 6 differ-
ent power levels.
Variable contour lines… Display of the spatial power density distribution with freely selectable intersection
lines.
Graphical review Enables a selection of graphical displays – among them the radius, the x- and y-
position above the z-position and the time.
System state Not relevant for BeamMonitor BM+.
Evaluation parameter Loading stored evaluation parameters.
Color tables... Different color charts are available in order to analyse e.g. diffraction phenomena in
detail.
Tool bar In order to display or to hide the tool bar.
Position Not relevant for BeamMonitor BM+
Evaluation Comparison of the measured values with defined limit values and evaluation (option-
ally).
Communication
Rescan bus The system searches the bus for the different device addresses. This is necessary
whenever the device configuration at the PRIMES bus was changed after starting the
software.
Free Communication Darstellung der Kommunikation auf dem PRIMES-Bus. Display of the communication
on the PRIMES bus
Scan device list Lists the device addresses of the single PRIMES devices.
Script
Editor Opens the script generator, a tool, by means of which complex measuring proce-
dures are controlled automatically (with a script language developed by PRIMES).
List Shows a list of the opened windows.
Python Opens the script generator in order to control complex measuring procedures auto-
matically (script language Python).
Help
Activation Enables the activation of special functions
About LaserDiagnosticSoftware Provides information regarding the software version
PRIMES
BeamMonitor BM+ with LDS 2.98
28
Revision 01/2018 EN
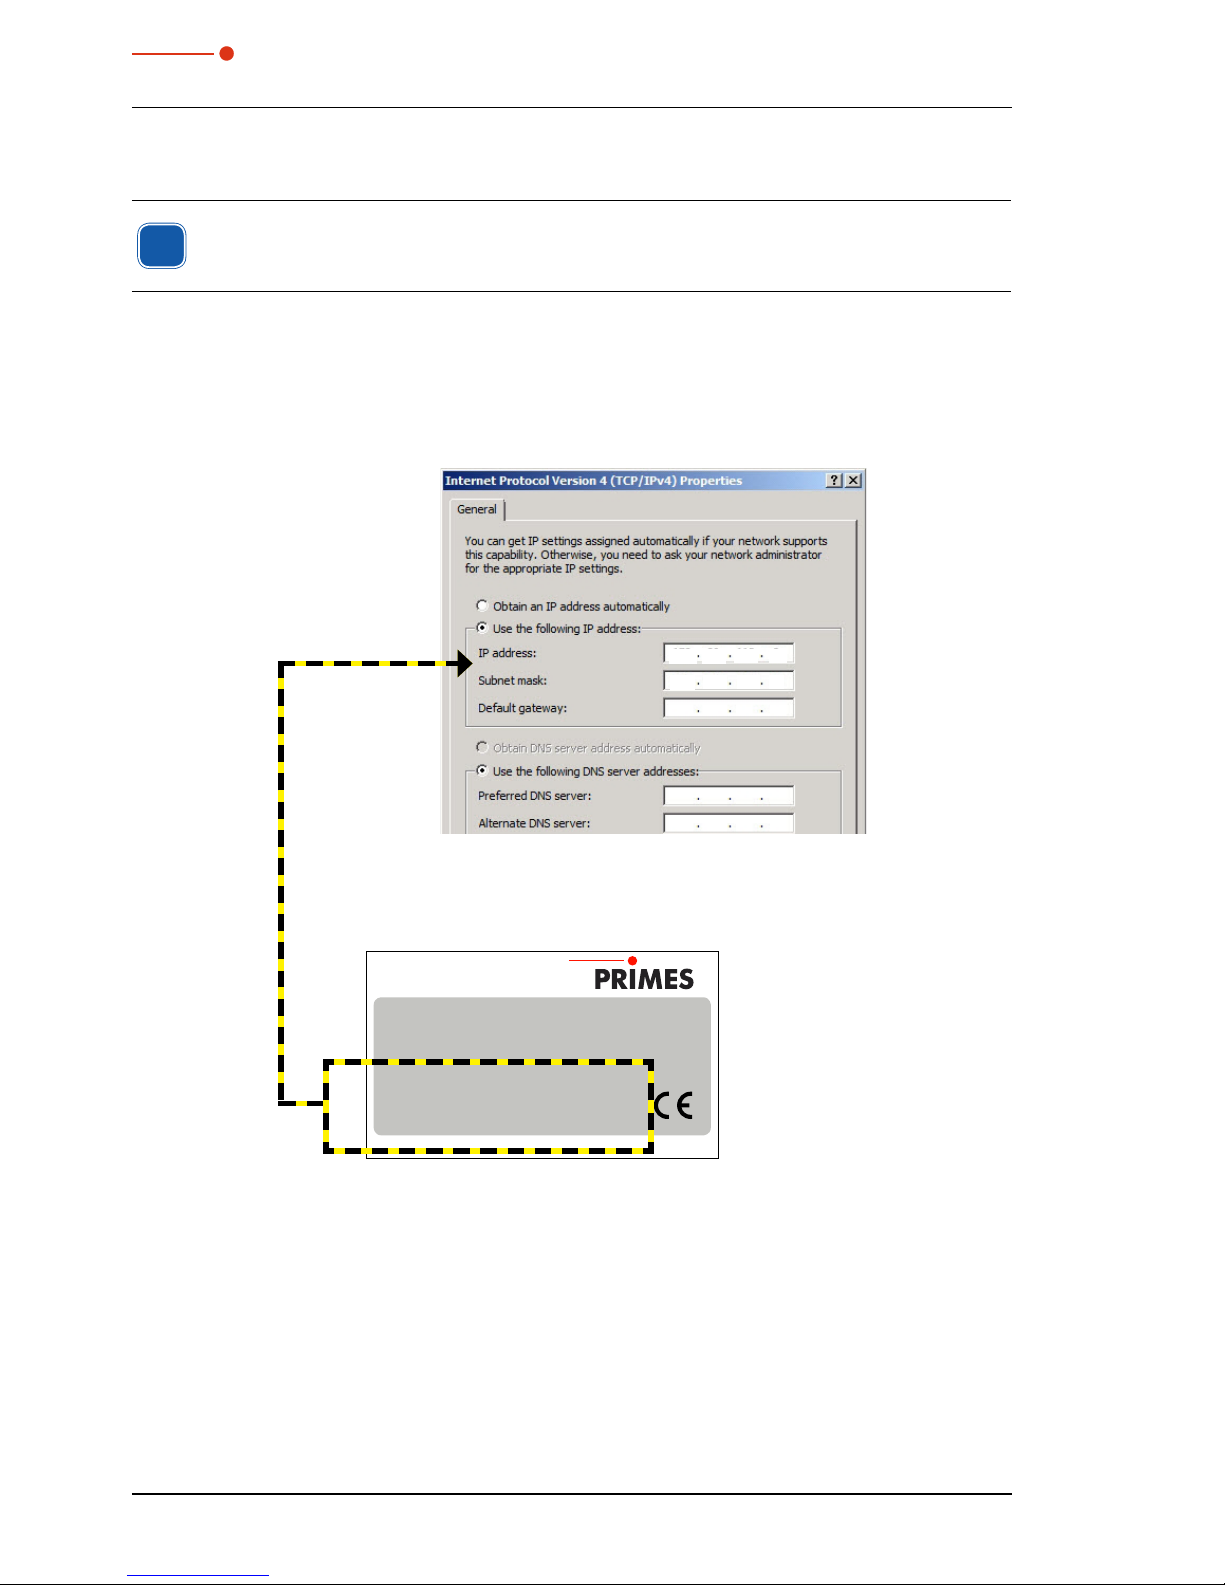
10.4 Establishing an Ethernet Connection
i
The BeamMonitor BM+ has a stipulated IP address which is given on the identification
plate. If the BeamMonitor BM+ is switched on before the network is connected, the static
IP address is used.
The PC must also have an IP address in the same subnet, for example:
IP Address: 192.168.116.80
Subnet mask: 255.255.255.0
The first three blocks of the IP address must match the IP of the BeamMonitor BM+!
192
255
168
255
116
255800
Identification Plate BeamMonitor BM+
www.primes.de
Type
S/N
2017
8285
BeamMonitor
BM+
DHCP enabled
MAC-Address
IP-Address
Static IP-Address
192.168.116.84
00 03 F4 07 6C E3
Built
10.4.1 Establishing a connection to PC
1. Please start the PRIMES LaserDiagnosticsSoftware.
2. Choose the mode TCP in the menu Communication>>Free communication (the option “second IP”
must not be activated!).
3. Enter the IP in the field “TCP”.
4. Click on the “connect” button (“connected” appears in the bus monitor).
5. Click on the “save” button (the configuration is saved and does not have to be repeated after a
restart).

PRIMES
BeamMonitor BM+ with LDS 2.98
29
Revision 01/2018 EN
192 168 116 84
Fig. 10.6: Establishing a connection in the menu Free Communication
10.4.2 Changing the IP address
You can change the preset IP address in the menu Communication>>Free communication by means of
the following commands:
IP-address
(Sample address)
192. 168. 116. 84
Commands
se0328
xyz se0329xyz se0330xyz se0331xyz
In this case xyz are place holders of the four IP-address bytes (values 1 - 255) which always have to be
entered with three digits!
For example, the number 84 has to be entered like this: 084.
For reasons of clarity the symbol marks a space.
Example: You will change the IP address from 192.168.116.85 to 192.168.116.86.
1. Please start the PRIMES LaserDiagnosticsSoftware.
2. Open the menu Communication>>Free Communication.
3. Choose the mode “TCP” (the option “second IP” must not be activated!).
4. Enter the IP in the field “TCP”.
5. Click on the “connect” button (“connected” appears in the bus monitor).
6. Activate the check box Write bus protocol (the protocol can be helpful in case of problems).
7. Enter the following in the field Command (please make sure that the blank character is entered cor-
rectly):
se0331086
8. Click to Send and wait for the confirmation in the bus monitor (in Fig. 10.7 „-> Adr:0331 Wert: 086“)
9. Please turn off the device and turn it on again. After this restart the IP-address is updated.

PRIMES
BeamMonitor BM+ with LDS 2.98
30
Revision 01/2018 EN
Confirmation
se0331 086
Adr: 0331 Wert:086
Fig. 10.7: Changing the IP address in the menu Free Communication

PRIMES
BeamMonitor BM+ with LDS 2.98
31
Revision 01/2018 EN
11 Software functions in detail
The LaserDiagnosticsSoftware is the control centre for all PRIMES measuring devices which measures the
beam distribution as well as focus geometries by means of which the beam propagation characteristics can
be determined. The LDS includes all functions necessary for the control of measurements and displays the
measuring results graphically.
Moreover, the systems uses the measured data to carry out an evaluation in order to give the operator of
the beam diagnosis an information regarding the reliability of the measuring results.
11.1 Settings
Due to the fact that the LDS is designed multifunctionally for all PRIMES devices, a few device-specific settings have to be made before a measurement. Moreover, the system and beam geometry provided by the
customer are to be considered.
11.1.1 Sensor parameter
Mechanical limits
This function is not relevant for the BeamMonitor BM+.
Fig. 11.1: Dialogue window Sensor parameters
Device
By means of this option, you can select the device which is supposed to be operated. Depending on the
number of devices connected, additional device numbers are assigned.
RPM (rotations per minute)
The rotational speed of the BeamMonitor BM+ can not be changed.

PRIMES
BeamMonitor BM+ with LDS 2.98
32
Revision 01/2018 EN
Resolution
Possible settings:
• 32 x 32 up to 1024 x 1024
Generally, 128 pixels per line and a total of 128 lines is sufficient. The resolution in y-direction stipulates the
number of lines and the resolution in x-direction the number of scanning points per line. The measuring time
gets longer if the number of measuring tracks increase. In case of 128 x 128 pixels the minimum distance
between two measurements with regard to the time is 8 to 9 seconds.
The time for the data transfer depends on the amount of data and on the interface. The amount of data
increases with a higher resolution. The performance of the computer also has an influence on the data
transfer time.
Detector
When the device is connected with the PC, the software will set the correct detector automatically. A manual
selection is not possible.
Manual z-axis
Please activate this option if the z-position of the measuring plane is not run by the internal z-axis.
In this case, please enter the z-values for each plane manually in the menu Measurement settings >>
single measurement. The software then carries out a caustic analysis on the basis of the determined
beam radii and the z-values.
The beam propagation ratio can also be determined this way, using the measured data of the unfocused
beam in different distances from the beam source.
Input field z-position
Fig. 11.2: Manual entry of the z-position
Twisted tip
Not relevant for the BeamMonitor BM+, this function must not be activated.
Radius correction
Activate the radius correction when measuring rectangular or linear laser beams. This option compensates
the curvature of the scanning tracks.

PRIMES
BeamMonitor BM+ with LDS 2.98
33
Revision 01/2018 EN
11.1.2 Measuring Environment (menu Measuring>>Environment)
Fig. 11.3: Dialogue window Measuring environment
In the dialogue window Measuring Environment data such as the laser type, information on the focusing
optic etc. can be stored (the input field Device-laser distance is not relevant for BeamMonitor BM+. These
data can be read via Presentation>>Review.
i
Please note that the symbol # must not be entered in the comment field. This symbol is used as a
separator in the software. If it is entered in the comment field, problems could occur when it comes
to storing or activating measuring data..
A line break can be enforced by means of the following key combination:
<Ctrl> + <Enter>
Entering the laser power is a reference value for the relative power position in the menu point Single
measurement or Caustic measurement. Stating the focal length is relevant for the evaluation of the
caustic measurements. From the caustic process and the entered focal length the raw beam diameter on
the focussing optic can be calculated.
Furthermore, a z-axes offset as well as a coordinate rotation angle can be entered. The wave-length is the
basis for a correct determination of the beam propagation ratio.
There are the following options:
• 10.6 µm for die CO
2
- laser radiation
• 1.06 µm for Nd:YAG - laser radiation
• 0.632 µm for HeNe - laser radiation.
A µm-value can also be typed in numerically.
By means of the button Apply the entries can also be changed after a measurement. With the button Ap-
ply all planes the entered values are inserted and settled, while the button Apply only refers to the value
in the current plane.

PRIMES
BeamMonitor BM+ with LDS 2.98
34
Revision 01/2018 EN
11.1.3 Beam find (Menu Measurement>>BeamFind settings)
Here, the parameters for the automated beam find are set. The general presetting is helpful for many standard applications.
Fig. 11.4: Dialogue window BeamFind settings
The Beam find parameters can be set as follows:
Pixel X, Pixel Y
The selection of the spatial resolution. Search problems can occur with regard to very small beams with 64
x 64 pixels in a 8 mm x 8 mm window, as the pixel distance is about 120 µm. In this case we recommend
the enlargement of resolution.
Trigger
The signal threshold (Trigger) is dependant on the zero level of the measuring system.
Percent
The percentage value indicates by how much the signal has to exceed the zero level in order to be recognized
as a beam. This value is determined by means of the signal-to-noise ratio of the detector.
Window Size Factor
The window size factor determines the size of the measuring window when it comes to the beam search.
The factor indicates how big the measuring window has to be in relation to the beam diameter.

PRIMES
BeamMonitor BM+ with LDS 2.98
35
Revision 01/2018 EN
11.1.4 Single measurement (menu Measurement>>Single measurement)
1
2
3
4
5
6
7
8
9
10
11
12
13
141516171819
21
22
20
23
1 Single
Monitor
LineScan (option)
Starts a measurement in the chosen plane
Starts repeated measurements in the chosen plane automatically
Starts a measurement of a single trace with fixed y-axis
2 Start
Starts a measurement in the currently chosen plane
3 Stop
Finishes the measurement in the currently chosen plane
4 Reset
The measuring device is reset
5 Stop Motor
Stops the rotating measuring tip after the measurement is finished
6 Plane
Selection of the measuring plane (0-49) either explicit or by means of the buttons (+/-)
7 Entry field
Numerical entry of the z-position
8 Copy
Copies all settings (window size and – position; x, y, z; etc.) from the former plane to the current plane
(e.g. 1>>2)
9 Find beam
Starts an automatic beam search in the current measuring plane
10 Scan
Not relevant for BeamMonitor BM+
11 Ampl.
Slide control in order to adjust the electrical amplification
12 Power
Slide control in order to adjust the laser power to save it in the software
13 Entry field Power Numerical input of the laser power to save it in the software
14 Entry field Ampl. Numerical input of the electrical amplification
15 Averaging
Analysis of the serial measurements. Averaging algorithms: average value, values of the maximum
pixels and the value of the maximum trace
16 Averaging
Selectable number (1 – 50) of single measurements for the averaging
17 LED symbol and
bar graph display
Display for the degree of the signal saturation (LED green≙ok, red≙not ok)
18
False color Activates the option of the false color presentation
19 Zoom
Magnification settings for the measuring window
20 Symmetric
This option enforces the usage of square measurement windows, whose size is only adjustable via x.
21 X/Y
Setting of the size of the measuring window
22 Display
Measuring window shows the current measuring result.
23 Z
Slide control in order to set the z-position

PRIMES
BeamMonitor BM+ with LDS 2.98
36
Revision 01/2018 EN
With this dialogue window either single measurements or repeated measurements can be carried out.
The measuring mode Monitor starts a continuously repeating measurement with current settings. The repetition rate is dependant on the spatial resolution as well as the rpm. With 64 x 64 pixels the measuring time
is about 10 seconds.
The monitor operation can be terminated by clicking the button Cancel in the status window (in the bottom
right corner of the screen).
Fig. 11.5: Status window
The measuring window position can be set either manually or automatically.
With the button FindBeam the measuring window of the BeamMonitor BM+ is set automatically. In this case,
the system only searches in the range given in the currently set window in the set z-position. Afterwards the
window FindBeam appears.
In case the beam search is completed successfully, a measurement window with the found beam in the
measuring field of the single measurement window appears. However, at that point the window size is not
yet optimized. With the button Start the beam can then be recorded.
As far as the manual beam search is concerned the position as well as the size of the measuring window
within the mechanical limits can be stipulated by the operator. The choices can be made in a pop-up menu,
where [x] for square measuring windows or respectively [x] and [y] for rectangular are to be stipulated. The
maximum size of the measuring windows is - in case of the BeamMonitor BM+ – in the standard configuration 8 mm x 8 mm (optional up to 24 mm x 12 mm).
The position of the measuring window is changed by clicking on the frame and moving it by means of the
mouse. The position of the window in z-direction (height) can be stipulated by means of the z-slide control or
by means of a numerical entry. The zoom function enables a detail enlargement in the measuring window.
Size of the measuring window
In order to minimize the measurement errors, we recommend a measuring window size which ensures that
the beam diameter equals 30 % to 70 % of the base side length of the measuring window. The distribution
has to be preserved at full extent without a restriction by the border of the measuring window.
Electrical amplification
The power density distribution is measured by a detector. Its analogue output signal is amplified and then
digitalized. There are different detectors available (see Tab. 15.1 on page 69)
In case the detector oversaturated (red LED symbol in the display for the signal saturation or – respectively
– a ADC value of 4095 in the presentation Variable Contour Lines), please reduce the amplification
by means of the slide control “ampl.” and repeat the measurement.
Not only an oversaturation but also a low amplification lead to unsecured or false results. We recommend
the readjustment of the amplification in order to receive correct results.
Laser power
The laser power can not only be set by means of the slide control but by entering it numerically. The reference
value for the laser power is entered in the dialogue window Measurement>>Environment. The calculation
of power densities refers to the power values set here.
Please click on the button Start to start the measurement.
Up to 50 single measurement planes can be part of one measuring file. This is relevant for measurements
of the beam caustic as well as for time or power series. It is possible to switch for presentation between the
individual measuring planes.

PRIMES
BeamMonitor BM+ with LDS 2.98
37
Revision 01/2018 EN
With the button Copy the measurement settings (window size and position, power and amplification) can
be copied from the previous measuring plane.
By means of the option Averaging the average of the results of up to 50 single measurements per each
plane is determined. There are different analysis algorithms available:
Selection Function
Average determines the average value of the distributions measured
Max. pixel
determines the pointwise maxima of the distributions measured
Max. trace
determines the maximum traces of the distributions measured
The selection Max. pixel, Max. trace are especially helpful when it comes to pulsed laser radiation. The radii
determined in case of Max. pixel are not always reliable due to zero point uncertainties.
During a measurement, the status of the measurement system is constantly displayed. These are:
• the current measuring plane
• the run of the reference cycle
• positioning the measuring head
• the measurement
• the data transmission – the progress is shown by means of the bar display
By means of the button Stop you can cancel a running measurement which also ends the monitor operation.
Please click on the Reset button afterwards.
With the button Stop Motor the rotation of the measuring tip is stopped after the completion of the current
measurement. Please click the Reset button afterwards.
CAUTION
Danger of injury due to rotating parts
The measuring tips of the BeamMonitor BM+ keep rotating for a short period of time after
the supply voltage was turned off.
Do not reach into the entrance of the measuring device and do not hold any items into it, as
long as the measuring tip is rotating.

PRIMES
BeamMonitor BM+ with LDS 2.98
38
Revision 01/2018 EN
Options
This menu should be used only by advanced users. Please keep in mind that most of the items are not
relevant for BeamMonitor BM+.
The only exception is the presentation of the beam dimensions, which allows to switch from radius to diameter (see Fig. 11.6).
Fig. 11.6: Setting for the display of the diameter

PRIMES
BeamMonitor BM+ with LDS 2.98
39
Revision 01/2018 EN
11.1.5 Adjustment mode
This measurement and display menu is intended for the specific requirements as far as the adjustment of
laser resonators with the BeamMonitor BM+ is concerned. The beam symmetry of the power density distribution measured last is presented.
Typical measuring procedure:
Automatic beam search with the button FindBeam, afterwards a monitor operation is started by means of
the Continuous button. With regard to this, the succeeding measurements are cyclically typed in into the
planes 0 to 19 (whereas 19 is then again followed by 0).
By means of the keys >>AdjustingPanel and >>MeasuringPanel you can choose between two different
kinds of notation. In the measurement menu of the adjustment mode a false color presentation of the last
two measurements together with the values of the beam position as well as the beam radius are displayed.
Fig. 11.7: The measuring menu of the adjustment mode
The second notation is the symmetry menu.
The symmetry menu compares the results of the last three measurements with regard to their beam symmetry in different power ranges.
Moreover, the following is displayed: the radius ratio between Rx to Ry (calculated by means of the 2nd moment
method) as well as the volume of the power density distribution (as a relative measure for the laser power).
The results are displayed numerically and emphasized visually by means of colored squares.
Green stands for a minimum deviation from the cyclical symmetry and red for the maximum deviation. Yellow
(white) indicates a medium value.

PRIMES
BeamMonitor BM+ with LDS 2.98
40
Revision 01/2018 EN
Fig. 11.8: Symmetry menu of the adjustment mode
The measuring results can be documented automatically. Either via the record of the measured beam radii
and the beam position in a log file with the button Log (please see Fig. 11.10 on page 41) or by storing
the entire measuring data with the button Document. In the menu item Document the temporal distance of
two measurements (Delay) can be set upon request.
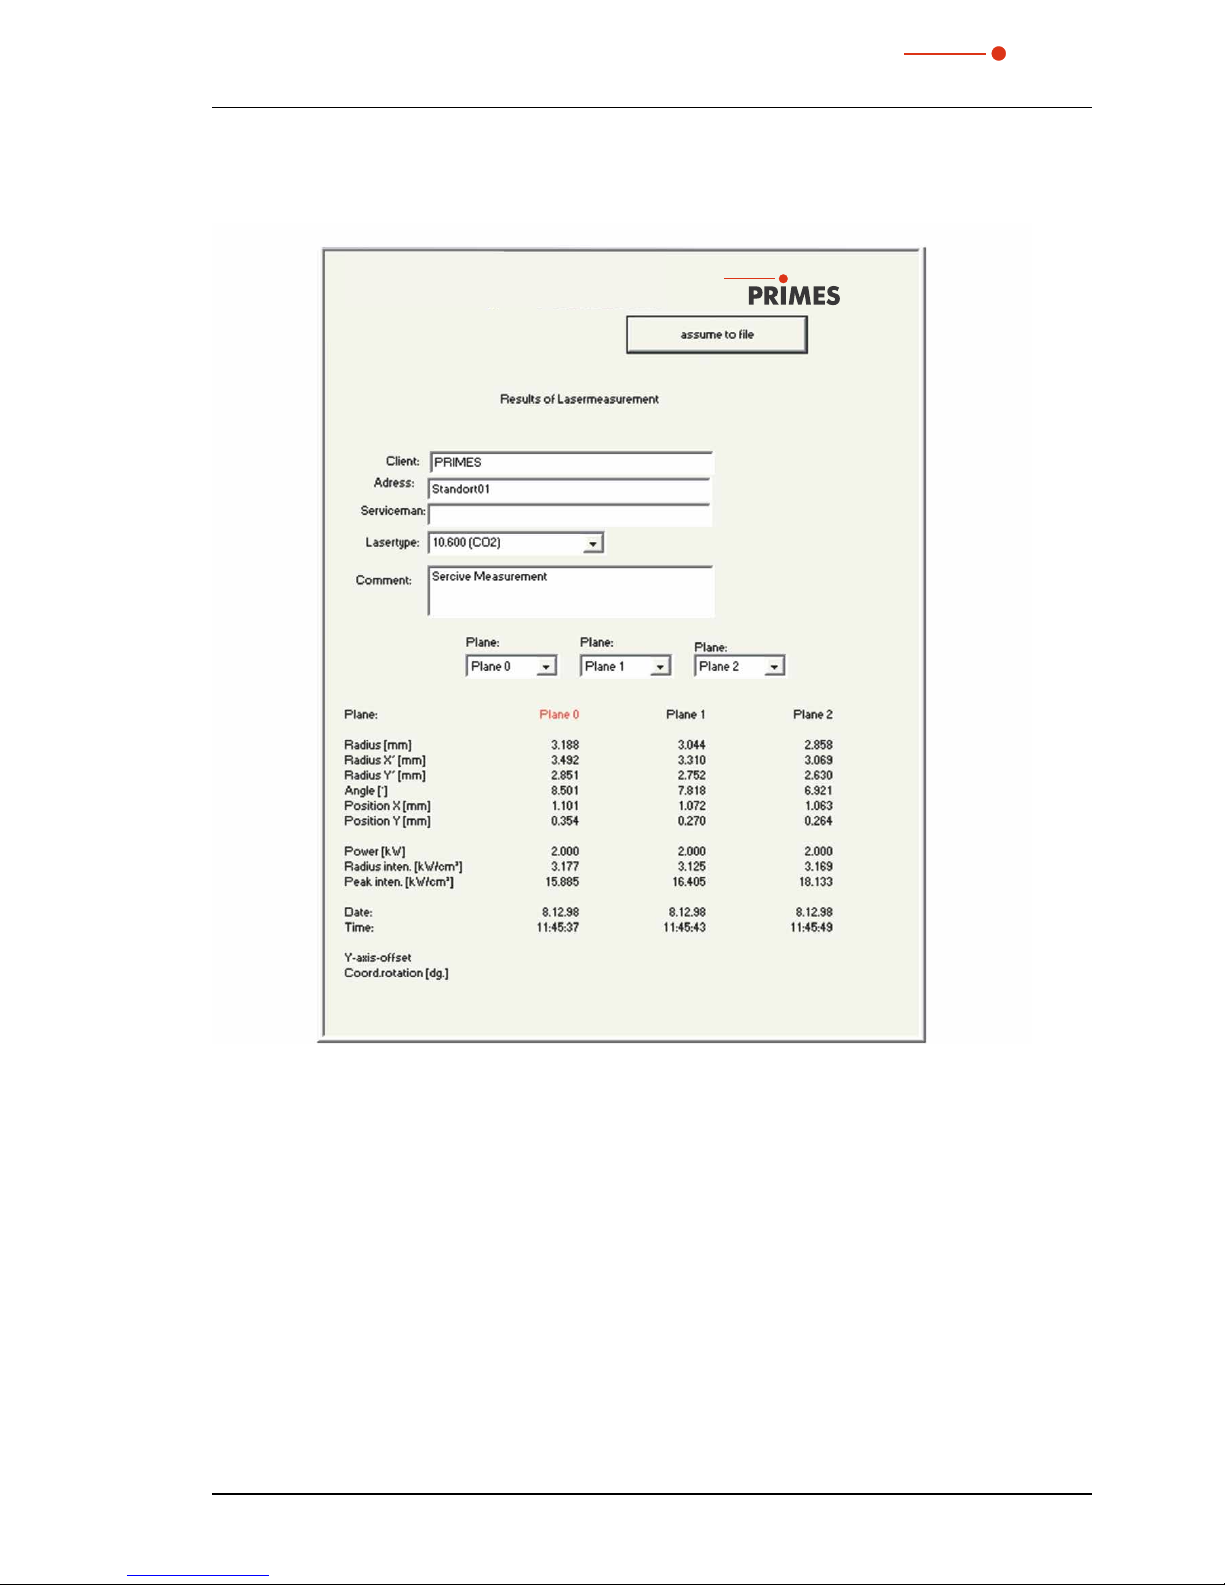
With the menu item Report exemplary results can be stored, e. g. as a service report (please see
Fig. 11.10 on page 41) and can later be printed.
Fig. 11.9: Document window
PRIMES
BeamMonitor BM+ with LDS 2.98
41
Revision 01/2018 EN
With the button Assume to file the report page in the data set is stored as well. Upon request, the name
of the service technician or the company name can be stored permanently in the settings file “laserds.ini”.
John Miller
Fig. 11.10: Example of a report page

PRIMES
BeamMonitor BM+ with LDS 2.98
42
Revision 01/2018 EN
11.2 Presentation and documentation of the measuring results
This chapter describes the presentation, analysis and storage of measuring results.
In order to carry out comparisons between different measurements, the program can manage several
measuring data sets simultaneously. The opened data sets are shown in the tool bar. In order to open one
presentation, the data which is to be examined is selected in the list of the data selection and afterwards
the desired kind of presentation is chosen.
By clicking on the symbols of the tool bar the following program menus can be reached.
11.2.1 Tool bar of the LDS
Data administration Notation Data selection Plane selection
1 2 3 4 5 6 7 8 9 10 11
1. Create a new data set
2. Open existing data set
3. Save data set
4. Open isometry presentation of selected data set
5. Open variable contour lines display
6. Open review (86 %)
7. Open false color presentation
8. Caustic presentation
9. List containing all data sets opened
10. Display of the chosen measuring plane
11. Display of the devices available at the bus by means of graphical symbols
In the menus for the notation of single measurements (Variable contour lines, Isometry and
False color presentation) the option Autoscale effects the usage of the entire display range for the
measuring values.
Moreover, you have the possibility of switching between different image memories of series of measurements
by means of the plane selection. Switching is also possible by means of the cursor keys up/down if the
plane selection is selected. If the plane selection in the display menus is set on Global, switching simultaneously between the planes is possible via the selection in the tool bar.
The title of the dialogue window indicates the name of the data sets shown.
For the parallel evaluation of several measurements the program has 50 image memories which can record
one measurement each. These image memories (measuring plane) can also be used in order to record
changed measurement values in case of a parameter variation.
Due to the variation of the z-position in the different planes a caustic measurement is realized. Due to a
change of the laser power it is possible to simulate, e.g. the thermal inflow-behavior of the system. Similarly,
time series are possible. Respective displays are, for instance, possible by means of the menu item Graphi-
cal review.

PRIMES
BeamMonitor BM+ with LDS 2.98
43
Revision 01/2018 EN
11.2.2 False colors
Here, a false color presentation of the measured power density distribution is generated.
Fig. 11.11: Dialogue window False colors
The used color scale is shown on the left. For a higher sensitivity, e.g. for the analysis of diffraction figures,
it is possible to switch the used color scale in the menu Presentation>>Color Tables.
By means of the slide control on the right hand side of the color scale you can display the sections of different ADC values with the corresponding radii.
Apart from the automatic scaling, there are three more types of scaling.
Scale on density
All planes of a caustic measurement are scaled on the maximum measured power density. This is supposed
to help comparing the different planes more easily.
Pixel scale
This scaling is only interesting when it comes to the usage of asymmetric measuring windows. In this case
the axis of the windows are no longer a function of the measuring window size but of the number of pixels
measured.
Window scale
With regard to this function, all measuring windows of a caustic measurement are enlarged to the size of
the maximum measuring window. This function, too, is supposed to help comparing the different measuring
planes of a caustic measurement more easily.
Beam axis
The beam axes can be displayed.

PRIMES
BeamMonitor BM+ with LDS 2.98
44
Revision 01/2018 EN
11.2.3 False colors (filtered)
The special function of the filter is called spline – function. It is characterized by the fact that the position of
the maximum is maintained. The single pixels in the matrix are weighed by means of a 1-2-1 filter in order
to reduce the noise.
This filter can also be used multiple times without the position of the maxima being moved.
Fig. 11.12: Dialogue window False colors (ltered)
11.2.4 Isometry
This menu item generates a spatial display of the measured power density distribution of a plane. The false
color display can be deactivated.
A turn of the distribution by 90°, 180° and 270° each is possible.
Fig. 11.13: Dialogue window Presentation>>Isometry (on the left with a deactivated color display)

PRIMES
BeamMonitor BM+ with LDS 2.98
45
Revision 01/2018 EN
11.2.5 Caustic display (2D-display)
The results of the caustic measurement can be displayed by means of the menu item Presentation>>Caustic.
On the left Fig. 11.14 shows the measured beam parameter either on the basis of the 86%-radii or the moment evaluation according to ISO 11146. In the middle of the picture the graphic shows the caustic profile.
The beam radii are depicted on the beam spread direction. On the right the false color presentation of one
measurement plane each – among other things selectable with the mouse - is shown together with numerical results of this single plane.
Fig. 11.14: Dialogue window Presentation>>Caustic
The red line depicts a compensating curve according to the calculated fits which can be displayed via the
check box Fit in the 2D presentation
Compensating curve
In order to evaluate the caustic, a hyperbolic compensating curve (ISO 11146) is adapted to the measuring values. This compensating curve describes the propagation of an ideal laser beam mathematically. The
development of the compensating curve is theoretically determined by means of the following parameters:
• standardized beam propagation factor M² or respectively beam propagation ratio
• z-position
• focus radius
• rayleigh length
Standardized beam propagation factor M² (or respectively the beam propagation ratio K=
)
The standardized beam propagation ratio describes how well the respective laser beam can be focused in
relation to the single mode. The single mode is the best beam which is theoretically possible and has a beam
propagation factor of 1. All other beams have higher values. For welding lasers (CO
²
) the values range from
2 to 5. With regard to cutting lasers (CO²) values from 1.1 to 2.5 are common. In case of beam sources with
a higher laser power the beam propagation factors are generally smaller than those of sources with lower
laser powers.
Z-Position
This value provides the position of the focus points in the z-position. As the compensation curve takes the
measurement points into consideration, the calculated z-position is not necessarily located at the beam
radius, which has measured the smallest position.
The device coordinates are given. Information with regard to the absolute position in space can be found in
chapter 23.2.4 on page 83. Possibly also on basis of a TCP calibration (option).

PRIMES
BeamMonitor BM+ with LDS 2.98
46
Revision 01/2018 EN
Focus radius
The focus radius is the smallest beam radius in the caustic. Generally, this value is similar to the smallest
value measured.
Due to different reasons it may occur that the adaption to the measurement values was not carried out.
This is the case if the compensation curve does not lie close to the measurement values. In this case the
parameters of the adapted compensation curve are to be discarded.
The review function (please see chapter page 36) provides more information on this topic.
Rayleigh length
The Rayleigh length is a derived parameter and describes the distance in z-direction with regard to which
the beam radius has increased by the factor
2
(=1.41) and concerning which the beam area has increased
by the factor 2. The Rayleigh-length increases with the beam propagation ratio and the focal width of the
focusing optic (please see chapter 21 on page 76). The doubled Rayleigh length is an approximate point
of reference, up to which material thickness (metal) a procession is possible with the optic employed.
In order to make sure that the adapted values have a high significance, the measurement is to be carried
out in a z-range of at least two Rayleigh-lengths. A range of four Rayleigh lengths – as demanded in the
ISO 11146 would be even better. 5 to 6 Rayleigh lengths would be ideal. However, this demand is often
confronted with the problem of quickly sinking power densities of the laser beam which is to be measured.
In case of a distance of two Rayleigh-lengths from the focus the power density has sunk to just a quarter.
In this case the caustic measurement consists of a compromise between the desired measurement range
in z-direction and the power density (signal-to-noise ratio) necessary for a perfect measurement.
Fig. 11.15: Result window Caustic>>Advanced
For the examination of asymmetric beams the dimensions of the main axes of the beam can be determined.
On the basis of these values the program also calculates direction dependent beam propagation factors as
well as beam position values. The related curves are shown via the two check boxes radius x, y while the
numerical values are provided by the detail menu.

PRIMES
BeamMonitor BM+ with LDS 2.98
47
Revision 01/2018 EN
Review
This function checks whether the results and settings of the caustic measurement are within the reliable range.
OK
Not OK
(in the measuring planes
5 and 15)
Fig. 11.16: Result window of the evaluation function
Under “spread” the average standard deviation of the caustic fit according to the 2nd moment method radii
is stated. A “tick” () is set if the standard deviation is smaller than 3.5 % and if all of the measuring values
lie within a range of ± 3 * standard deviation.
Valued functions Test criterion
Positive evaluation
Spread Average relative standard devia-
tion of the caustic fit according
to the 2nd moment method
Standard deviation < 3.5 %, all measurement values
within a range of ± 3 * standard deviation
Fill factor The proportion beam diameter
to the measuring window size
In the range 0.3 – 0.6
Z-range Measuring range in z-direction At least 4 Rayleigh-lengths
Measurement planes Number of measurement planes
per Rayleigh length
At least 3 measurement planes per Rayleigh length
(Z
Min+Zr
) < Z0 < (Z
Max−Zr
) Minimum measurement range
above and below the focusing
plane
The focus lies within the minimum measurement
range and this range accounts for at least one Rayleigh length in every z-direction
Signal/noise ratio Examines the signal-to-noise
ratio
FocusMonitor: S/N > 40
Signal override Examines the maximum power
density value
Below 4000 Counts
Tab. 11.1: Criteria for the evaluation
If all criteria are fulfilled, the measuring results have a high reliability. The absolute accuracy can not be stated
from the standard deviation from the fits as all the systematic measuring errors as well as the accuracy of
the calibration are additionally taken into account when it comes to the absolute error.

PRIMES
BeamMonitor BM+ with LDS 2.98
48
Revision 01/2018 EN
As far as the BeamMonitor BM+ is concerned different detectors can be used. Therefore, not the amplitude
but the signal-to-noise ratio (S/N ratio) is evaluated as different detectors can have a different noise.
For the evaluation the detector set in the menu Measurement>>Sensor parameter is used. In case
the S/N ratio lies above 40:1 a green tick (
) is displayed. A red cross () indicates a S/N ratio lower than
25:1; in this case noise components can increase the measurement inaccuracy for the beam diameter as
well as derived sizes.
In case only the last, outermost plane of a caustic shows a bad signal-to-noise ratio, it is often still possible
to receive strong results. If several planes are affected, a measuring tip – detector combination which is accurately adapted to the application can lead to a higher signal-to-noise ratio.

PRIMES
BeamMonitor BM+ with LDS 2.98
49
Revision 01/2018 EN
11.2.6 Isometry 3D
This function generates three-dimensional displays of the power density distribution of a plane and all planes
in false colors.
The presentation window is divided. On the left the caustic, on the right the power density distribution in a
plane is displayed. The horizontal size of the single windows can be changed by drawing the separating bar
by means of your mouse.
The graphics can be rotated along all three axes with the left mouse button, with the right mouse button they
can be positioned in the window.
Change window size
1 2 3 4 5 6 7
Fig. 11.17: Presentation in 3D
1
3D presentation of the
plane
Inserts the 3D presentation of the power density distribution in the plane in
the display window.
2
3D presentation of the
caustic
Additionally inserts the 3D presentation of the caustic in the presentation
window.
3
Magnification in the plane
In the left part of the presentation window a magnification of the plane displayed on the right is inserted (the desired area can be clicked by means of
the left mouse button in the right window).
4 Rotation
Causes a rotation of both graphics along the z-axis.
5
Plane selection
Here the plane, which is to be displayed, can be chosen (you can also choose
the desired plane in the 3D caustic by means of the left mouse button).
6 Zoom
Slide control for a continuous magnification of the presentation
7 Contour
Slide control for a contour trimming along the power density.

PRIMES
BeamMonitor BM+ with LDS 2.98
50
Revision 01/2018 EN
11.2.7 Review 86 % or 2nd Moment
For the radius definition there are two basic determination possibilities:
• Determination of the beam radii according to the 86% - power definition (chapter 21.2.5 on page 80)
• Determination of the beam radii according to the 2
nd
moment method (ISO 11146), (chapter 21.2.4 on
page 79)
Further possibilities are provided additionally by the software (please see chapter „21.2.6 Further radius
definitions“ on page 81).
Fig. 11.18: Result window Presentation>>Review(86%)
Fig. 11.19: Result window Presentation>>Sec.Moments
If the measuring signal exceeds the zero level by only a bit, the measuring results are not displayed in black
but in grey. In this case it has to be checked whether the measuring values are caustic trusted or have to be
deleted and if the measurement has to be repeated with other settings. The entries power, focal length and
wave length, especially in the comment lines, can still be changed after a measurement. For this purpose
there is the push button Update in the menu item Measurement >> Environment.

PRIMES
BeamMonitor BM+ with LDS 2.98
51
Revision 01/2018 EN
11.2.8 Symmetry Check
This display menu checks the rotational symmetry of the power density distribution of a laser beam. It can,
for instance in connection with the monitor operation, be used for the alignment of laser resonators.
In the following, the figures Fig. 11.21 and Fig. 11.22 show two examples for the possible results of a symmetry check at an elliptic beam.
Fig. 11.20: Power density distribution of an elliptic beam
Together with the Symmetry check the power density distribution of an elliptic beam as displayed in Fig.
11.20 comes to the following results:
Fig. 11.21: Presentation in Cartesian coordinates
The abscissa in Fig. 11.21 shows the angle and the ordinate of the beam radius with the intersection lines
at different powers between 86 % and 10 % of the total power.
On the screen the curves appear in different colors. The radius is indicated in pixel coordinates. The minimum as well as the maximum of the radius values can be chosen. On the right side the standard deviation
of the different radius values is indicated. These values give detailed information on the symmetry of the
beam distribution.
Well aligned resonators reach standard deviations in the range of 3 % to 5 %. Partially, values in a 1 % and
2 % range are possible.

PRIMES
BeamMonitor BM+ with LDS 2.98
52
Revision 01/2018 EN
A presentation in polar coordinates is also possible (Fig. 11.22). The drawn in lines contain 86 % up to 10 %
of the detected power. On the screen the graphs have different colors. X- and y-axis scale in pixel values.
Fig. 11.22: Symmetry check in polar coordinates
11.2.9 Fixed Contour Lines
The contour lines are displayed with different power levels. Intersection lines are selected with: 86 %, 80 %,
60 %, 40 %, 20 % and 10 % of the total power.
In this presentation it is also possible to measure distances by clicking the start and end points with the mouse.
Fig. 11.23: Display window Fixed contour lines
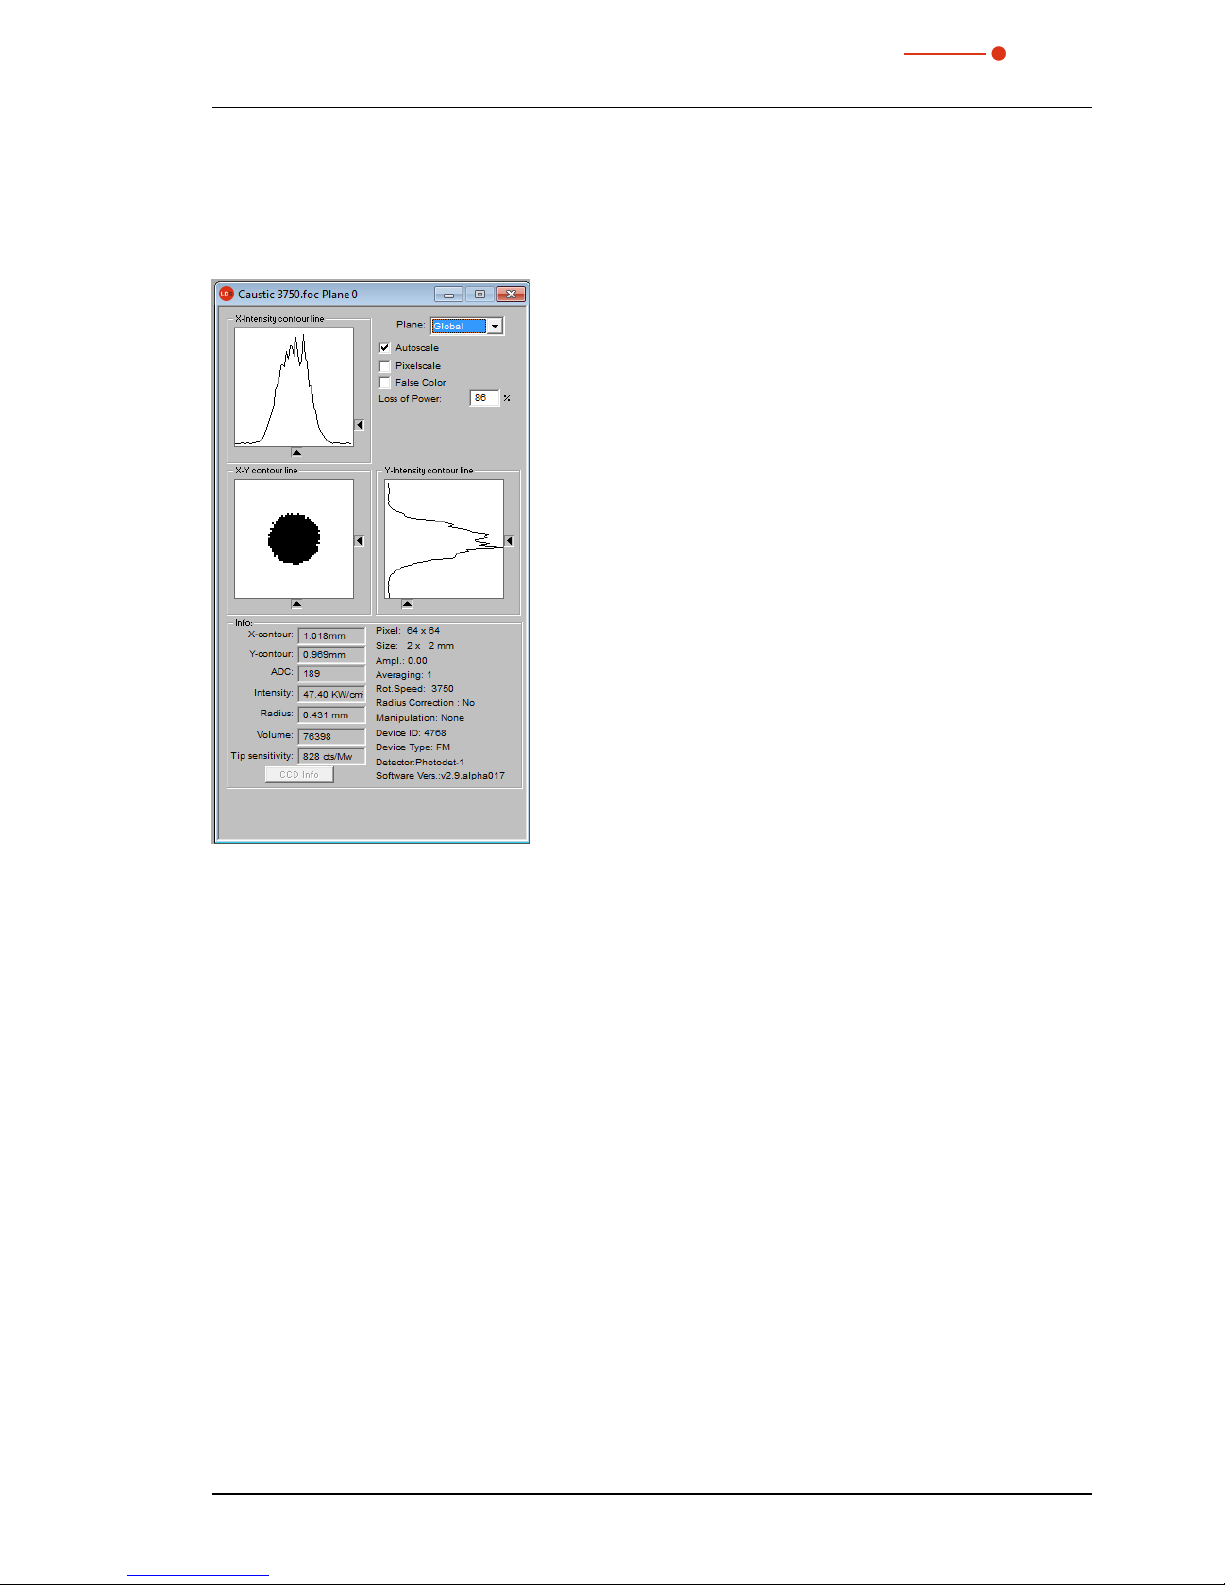
PRIMES
BeamMonitor BM+ with LDS 2.98
53
Revision 01/2018 EN
11.2.10 Variable Contour Lines
Here the spatial power density distribution is displayed by means of freely selectable contour lines. Not only
intersections in x- and y- direction but also in power density coordinates (A/D-converter-counts) can be carried out. The position of the intersections is settable by means of a slide control or the keyboard.
Fig. 11.24: Display window Variable contour lines
Setting by means of the keyboard:
• For the x-direction by means of the key x in order to increase the value and <shift> x in order to decrease it.
• For the y-direction by means of the key y in order to increase the value and <shift> y in order to decrease it.
• For the power density (intensity) by means of the key i in order to increase the value and <shift> i in
order to decrease it.
In the range of the left hand lower corner the current intersection coordinates, the power densities, the radius
generated by the intersection as well as the relative volume are displayed. In the lowest line the measuring
tip sensitivity is displayed. The values are calculated basing on the correctly entered laser power.
In the right hand upper corner it is possible to switch to the scaling mentioned in chapter 11.2.2. Below it,
there is an input field where the desired power loss (-inclusion) can be entered.
Beside these functions this window offers many more information regarding the conditions under which the
measurements were carried out.
Moreover, the amplification, the number of average determinations as well as the revolution speed is displayed.

PRIMES
BeamMonitor BM+ with LDS 2.98
54
Revision 01/2018 EN
11.2.11 Graphical Review
The display window Graphical review offers many possibilities to display the measurement values of
the single measurement planes.
Above the x-axis the power, time and planes or the z-position can be applied. For the y-axis the radius data,
the x or, respectively, y-position, the angle and the ellipticity are available. In total this window can present
16 different graphs.
Fig. 11.25: Graphical review - example radius versus plane
11.2.12 Color Tables
Different color charts are available. It is possible to switch back and forth between the color charts. Thus the
assignment of A/D converter values and different color scales can be varied. This is important for the false
color presentation.
Three settings are possible:
• Linear color table (basic setting)
• Color table analogue to the root function
• Color table analogue to the fourth root function
These functions can especially be helpful as far as the analysis of slight variations near the zero level are
concerned; e.g. the analysis of diffraction phenomena.

PRIMES
BeamMonitor BM+ with LDS 2.98
55
Revision 01/2018 EN
11.2.13 Evaluation (option)
By means of this evaluation function, you can compare and evaluate different parameters of the measured
caustic (.foc-file) with specified limit values (.pro-file). The evaluation result is displayed optically with an LED
symbol (red=bad, green=good). The overall result (field Conclusion) is only considered as good provided
that all results are within the critical parameters (
).
Fig. 11.26: Dialogue window Evaluation
The parameters, the limit values and the identification of critical values are purported in a profile file (text
file, please see the example file in Fig. 11.27).
Fig. 11.27: Example for a profile file

PRIMES
BeamMonitor BM+ with LDS 2.98
56
Revision 01/2018 EN
An evaluation is carried out as follows:
1. Click the button Open Doc… and choose your measuring file (.foc-file).
2. Click the button Open Profile… and choose your profile file (.pro-file).
3. Choose the desired radius definition in the selection Caustic.
4. Click on the button Evaluate.
11.3 File
This menu includes – among others – the administration of measurement and setting data.
11.3.1 New
By means of New a new file is created.
11.3.2 Open
By means of Open a selected file is opened.
11.3.3 Save
The file currently opened is stored. The standard type of file is a binary file format with a minimal memory
requirements. The file ending for a measuring file of this type is “.foc”. As an alternative, it is possible to store
the data in a ASCII format with the extension “.mdf”. Information regarding the file format “.mdf” can be found
enclosed. Only files with this formats can be opened by the program (see also chapter 20.1 on page 74).
11.3.4 Save As...
You have to assign a file name, choose the storage location and the file format.
i
Only save the measurement data with the extensions “.foc” or “.mdf”. You can only view measurement data if the respective file was explicitly selected in the tool bar.
11.3.5 Export
Exports the pixel information of the power density distribution to a Excel table (*.xls). As an alternative, the
numeric results from a “.foc” file can be stored in a tab-separated text file (*.pkl) which can be imported into
Microsoft Excel.
11.3.6 Load measurement preferences
Stored settings can be resorted to with Load measurement preferences. The standardized extension for
a setting file of the BeamMonitor BM+ is “.ptx”.
11.3.7 Save measurement preferences
The current measurement settings are stored (.ptx-file).
11.3.8 Protocol
The calculated measurement results from a single plane can directly be written into a text file.
The following is stored:
• Date and time of the measurement
• Beam position and beam radius (according to 86 %- and 2
nd
moment definition)

PRIMES
BeamMonitor BM+ with LDS 2.98
57
Revision 01/2018 EN
Therefore please activate the check box Write. Then you can directly enter the name in the field File name
or you can use the standard selection menu with the button Select.
11.3.9 Print
You can print directly from the program. The current window can be printed with the menu point Print in the
menu File. With the menu point Settings it is also possible to change the settings as far as the formats etc.
are concerned.
11.3.10 Print preview...
Shows a preview of your printing order.
11.3.11 Recently opened files
Selection of the files processed before.
11.3.12 Exit
Terminates the program.
11.4 Edit
11.4.1 Copy
By means of the copy function a direct export of graphics to other programs is possible. In this case the
content of the current window is transmitted to the Windows clipboard.
11.4.2 Clear plane
The content of the actual displayed measurement plane of the measurement data set selected in the tool
bar is deleted.
11.4.3 Clear all planes
The content of all measurement planes of the measurement data set selected in the tool bar is deleted.

PRIMES
BeamMonitor BM+ with LDS 2.98
58
Revision 01/2018 EN
11.5 Communication
11.5.1 Free Communication
By means of this menu you can control the communication via the PRIMES bus. Moreover, the settings
for the communication are made here. Further information can be found in chapter „10.4 Establishing an
Ethernet Connection“ on page 28.
Fig. 11.28: Dialogue window Communication>>Free Communication
11.5.2 Scan device list
Every PRIMES device has a certain bus address. If a device is supposed to be controlled by means of the
LaserDiagnosticsSoftware, the address has to be entered here. Moreover addresses can also be added or
deleted in this menu

PRIMES
BeamMonitor BM+ with LDS 2.98
59
Revision 01/2018 EN
11.6 Script
By means of scripts complex measurement procedures can be controlled automatically.
Scripts are programs which are written in several script languages. Scripts are almost exclusively provided
as source files in order to enable an easy editing and adjustment of the program.
11.6.1 Editor
By means of the script editor you can draw up scripts which can control, for example, complex measuring
procedures automatically. An example is given in Fig. 11.29 – the beam find procedure with the BeamMonitor BM+.
In order to open the script, the Open symbol has to be clicked, then a file can be chosen and played by using
the button
. The button stops and ends the script.
Fig. 11.29: Script for the beam find procedure of the BeamMonitor BM+
11.6.2 List
Here all available scripts are listed
Fig. 11.30: List of the available scripts
11.6.3 Python
Starts the Python editor. The graphical user interface is identical to the one depicted in Fig. 11.29. Python is
a programming language with efficient abstract data structures and a simple but effective approach for an
object-oriented programming. Python is not only suitable for scripts but also for a fast application development.
For detailed information about the script control, see the separate description “Documentation for the Python
Script Control of the PRIMES LaserDiagnosticsSoftware”.

PRIMES
BeamMonitor BM+ with LDS 2.98
60
Revision 01/2018 EN
12 Measuring
This chapter describes the manual control of the PRIMES laser diagnostics system.
An automatic measurement with the BeamMonitor BM+ can be started via the PRIMES-PLC-interface of the
system control. In this case, the system control deals with the entire measuring operation e.g. via a script.
The work with the script control is explained in the corresponding documentation.
DANGER
Serious eye or skin injury due to laser radiation
Scattered radiation is developed during the measurement.
Please always wear laser safety goggles (OD 6) adapted to the power, power density, laser wave
length and operating mode of the laser beam source in use. and appropriate safety clothing.
Please ensure an adequate shielding of the scattered radiation and the complete absorption
of the radiation passing the device.
Please ensure a vertical beam incidence into the measuring device.
12.1 Special safety instructions
CAUTION
There is a danger of injuries due to rotating parts
The measuring tip of the BeamMonitor BM+ is rotating at high speed during the measuring
operation.
Do not reach into the beam entrance of the measuring device, neither with your hand nor
with any items. Even after end of measurement the tip rotate for a while.
The device bears the following pictogram to indicate possible dangers:
Hand injuries warning
12.2 Requirements
The following description takes as granted that
• the safety measures stipulated in chapter 1 on page 7 were obeyed
• the measuring devices were aligned and mounted correctly and solidly according to chapter 6 on
page 13.
• all components of the measuring system are connected according to chapter 7 on page 15
• the software (LDS) is installed according to chapter 10.2 on page 21.

PRIMES
BeamMonitor BM+ with LDS 2.98
61
Revision 01/2018 EN
12.3 Possible Types of Measurement
12.3.1 Single Measurement
Only one measurement in one plane is carried out. The single measurement can be adjusted automatically
or manually. The position and the size of the measuring window can be adjusted relatively to the maximum
measurement range. The amplification is adjustable separately. A false color presentation is possible.
i
When measuring with the DBY-PS+ Detector you have to carry out a manual single measurement
before the caustic measurement can be started (please see chapter 12.5 on page 65).
12.3.2 Caustic measurement
Several measurements in different planes of the z-axis are carried out. The parameters can be adjusted
automatically or manually in the menu item Measurement, Measurement Settings. The measurement
enables the direct determination of the beam propagation ratio M² (beam propagation factor K).
12.4 Brief Instruction for a first Single Measurement
i
Please turn on the supply voltage of the device and wait for about 20 seconds. Then the software
can be started.
When turning the supply voltage on and off a reset cycle is started within the device. During this
time no measurements are possible!
1. Please turn on the supply voltage. Wait for approximately 20 seconds until the boot process is finished.
2. Please start the LaserDiagnosticsSoftware. The connected devices are recognized within 20 seconds
and in the upper right hand corner the device symbols are displayed.
Device symbols
In case the device is not recognized:
Please open the dialogue window Communication>>Free Communication and make the following
settings:
• Select the mode TCP (the option „Second IP“ must not be activated).
• Type in the IP address of the device in the field „TCP“.
• Click the button „Connect“ („Connected“ appears in the bus monitor).
• Click the button “Save” (this configuration will be stored and needs not to be typed in after restart of
the software).

PRIMES
BeamMonitor BM+ with LDS 2.98
62
Revision 01/2018 EN
3. Please open the dialogue window Measurement >> Environment and enter the following:
A The focal length
B Select the wave length
A
B
4. Please open the dialogue window Measurement>Sensor parameter and choose:
A The resolution X: 128 (recommended)
B The resolution Y: 128 (recommended)
A
B
i
i
In case of rectangular or linear laser beams we recommend the activation of the radius correction.

PRIMES
BeamMonitor BM+ with LDS 2.98
63
Revision 01/2018 EN
5. Please open the dialogue window Measurement>>Single... and select
C Window size in x-direction: recommended setting X=0.8 mm
Window size in y-direction: recommended setting Y=0.8 mm
D False colors
C
D
E
F
i
E In the range “Power” the laser power of the beam which is to be measured has to be typed in.
F Please turn on the laser and click on the “Start” button.
i
With regard to the BeamMonitor BM+ the button Beam Find automatically deals with the positioning
and the selection of the measuring window. With regard to this, the z-position remains unchanged
and the search is limited to the window range. In case the search was successful, the measuring
window found is displayed. It is only a search function. The measuring window size is not optimized.
Signal saturation (for detectors of NIR- and CO
2
-Lasers):
In case the signal is too big, the amplification can be reduced.
Detector type Adjustable sensitivity
DBY-PS+ Yes (automatically)
DBIG-PS+ Yes (automatically)
DBCM+ No

PRIMES
BeamMonitor BM+ with LDS 2.98
64
Revision 01/2018 EN
The measuring results can be visualized by means of the menu item Presentation>>Variable Contour Lines (please see Fig. 12.1). Here the contour lines of the spatial power density distribution in x- and
y-direction are displayed.
Fig. 12.1: Display of the measuring result by means of variable contour lines
In Measurement>>Measuring Environment>>Comment specific details regarding the beam source,
the used focusing optic etc. can be entered.
In the menu item File>>Save the measuring data can be saved.

PRIMES
BeamMonitor BM+ with LDS 2.98
65
Revision 01/2018 EN
12.5 Measurement with a DBY-PS+ Detector
By means of this new detector for the NIR a high dynamic range is available, even without a mechanical switch.
Due to a high dynamic range it needs a manual single measurement before the caustic measurement when
measuring with a DBY-PS+ detector.
1. Please open the dialogue window Measurement>>Single... and choose
A The measuring mode Single
B The Plane 0
C The window size in x- and y- direction
A
B
E
C
D
F
-50
1
D In the section Ampl. the amplification –50 dB has to be entered.
E In the section Power the laser power has to be entered.
F Turn on the laser and click on the Start button.
If the beam is not detected, repeat the measurement with stepwise increased amplification (e.g. 5 dB or
10 dB steps) until the beam is found.
After the detection and the measurement in this plane you can start your caustic measurement.

PRIMES
BeamMonitor BM+ with LDS 2.98
66
Revision 01/2018 EN
2. Please open the dialogue window Measurement >> Caustic... and choose
A Start plane Plane 0.
B Mode Automatic.
C If active, please deactivate the option Maximize Window.
D Please turn on the laser and click on the Measurement button.
-50800
A
B
C
D

PRIMES
BeamMonitor BM+ with LDS 2.98
67
Revision 01/2018 EN
13 Discussion of the measuring results and error analysis
For the correct interpretation of the measured values as well as the evaluation of the calculated results, the
specific characteristics of the BeamMonitor BM+ have to be considered.
By default, the program uses two different methods for the determination of the radius simultaneously (further
ones are optionally available).
86%-definition:
The beam radius is calculated by means of the beam area into which 86 % of the overall laser power are
irradiated. By means of this the radius of a circle can be determined which encloses the same area. This is
what the beam radius definition used here is based on (please also see chapter „23.2.4 Radius determina-
tion with the method of the 86 % power inclusion“ on page 83).
This definition does only make sense, however, if it a rotation-symmetric laser beam without modulation area
(partially low beam intensity) in the beam area is in hand.
2
nd
Moment method definition:
The radius of the laser beam is calculated by means of the 2
nd
moment of the power density distribution of
the beam according to ISO 11146 (please also see chapter „23.2.3 Radius determination with the 2nd mo-
ment method of the power density distribution“ on page 82).
Sometimes it is helpful to determine the beam radius manually by means of the 10 – 90 % power density in
the Variable Contour Lines display. See the optional methods below.
Optional radius definitions:
• Knife edge method according to ISO 11146
• Slit method according to ISO 11146
• Gauss fit method
• 1/e² power density loss method
• Power inclusion method with freely definable 1
st
power value
• Power inclusion method with freely definable 2nd power value
Beam position in the measuring window
When positioning the measuring window it has to be ensured that it encloses the complete beam. This is
necessary for a correct calculation of the beam radius and the beam position.
Possible maximum window sizes are 8 mm x 8 mm, as an option 16 mm x 8 mm or 24 mm x 12 mm.
Temporal stability
The BeamMonitor BM+ is designed for the measurement of continuous laser beams. Temporal fluctuations
of the laser power or changes of the spatial power density distribution might not be measured exactly as
soon as the time constant of the fluctuations is smaller than the measuring time of approximately 3 seconds.
Low Signal-to-noise ratio
In case the measured signals only slightly exceed the zero level and the signal-to-noise ratio is low, the
calculated beam parameter are displayed in grey instead of black in the overview. In this case it is not sure
whether the calculated values for the radius and the position are reliable. Please check the relevance of the
measuring values carefully.
Averaging can generally improve the signal-to-noise ratio.

PRIMES
BeamMonitor BM+ with LDS 2.98
68
Revision 01/2018 EN
14 Troubleshooting
Error Possible Reason Remedy
Error during a measurement
• Error in the data transmission
• Processor crash in the
measuring system
• Error in the programme
execution
1. Please restart the system (button Reset in the
menu Measurement>>Single Measurement).
2. Turn off the supply voltage and turn it on again and
start another reset cycle.
3. Restart the computer.
Beside an ambient noise
and the zero offset
1)
no
measuring signal is available.
The device is not set up correctly.
Please check the device alignment to the laser beam.
The power density in the focus
is too low.
Please increase the laser power. The absolute power
density in the focus typically has to be several hundred
kW/cm² in order to achieve a significant measuring signal
with a standard measuring tip.
For smaller focus spots
(e.g. rf = 80 µm) and a maximum measuring window the
resolution is too low.
First measure outside the direct focusing range. If no result
is achieved, please increase the resolution (e.g. 256 x 256).
The signal enhancement is
too low.
Please set the maximum enhancement and choose
the maximum measuring range in the dialogue window
Measurement>>Single... For the presentation please
choose the option Autoscale.
For the measurement of
small beams an offset of
the measuring track to
each other is monitored.
Fluctuations in the synchronism of the rotation disc as
well as delays as far as the
triggering of the trigger signal
is concerned.
The beam position should possible be as close to the left
edge of the window as possible. The temporal distance
between the trigger signal and the start of the measurement then gets smaller and errors can be reduced. In
this case, an averaging is often helpful.
1) ) In case of the BeamMonitor BM+ typically 800 counts (the current number of “Counts” can be found in the menu item
Presentation>>Variable Contour Lines).

PRIMES
BeamMonitor BM+ with LDS 2.98
69
Revision 01/2018 EN
15 Detectors
Depending on the application different detectors are used (please see Tab. 15.1). In order to compensate
the varying time performance of the systems, the detectors used are to be selected explicitly in the menu
Measurement>>Sensor Parameter.
Detector
type
Laser Type of Sensor Amplification Wavelength range
in µm
DBCM+ CO
2 Pyro-detector 1 9 − 12
DBY-PS+ NIR/VIS Photodiode Automatic adaption of the sensitivity 0.4 − 1.1
DBIG-PS+ NIR Photodiode Automatic adaption of the sensitivity 1 − 2.1
Tab. 15.1: Variety of detectors

PRIMES
BeamMonitor BM+ with LDS 2.98
70
Revision 01/2018 EN
15.1 Changing the Detector
You just have to open the inspection opening in the bottom of the housing which is fastened by means of
four Torx screws (T8).
T8
Fig. 15.1: Inspection opening of the BeamMonitor BM+
NOTICE
Danger of damage for the detector sensor
The detector sensor must not be damaged and has to be protected from contaminations
of any kind.
Do not touch the detector sensor with your fingers and do not put it down on the sensor
surface.
Sensor surface
i
Please only use isolating plastic screws in order to fasten the detector in order to prevent noise
signals. Do not forget the foam rubber plate during the installation. Otherwise the rotational disc
could be mechanically blocked by the screws. The foam rubber plate also ensures a mechanical
decoupling and electrical isolation of the detector.

PRIMES
BeamMonitor BM+ with LDS 2.98
71
Revision 01/2018 EN
Assembly Order:
X Please turn off the voltage supply.
X Remove the plastic screws (D) on the detector.
D
D
Bild 1
X Take the detector carefully out of the position and first
loosen the golden angle plug (A), then the black plug (B)
on the backside of the detector.
X Please do not pull the cables!
Do not compress
here!
Touch here
Touch here
A
B
Bild 2
X For the installation of the new detector, please first place
the foam rubber spacer (C) on the mounting surface of
the detector (picture 3). Then the cables are connected.
X Please fasten the detector with the two plastic screws (D).
X
If the screws are tightened too firmly, they might
block the rotary disc!
X Only tighten the screws hand-tight.
X The foam rubber spacer may be compressed to the half
of its original thickness only!
C
D
Bild 3

PRIMES
BeamMonitor BM+ with LDS 2.98
72
Revision 01/2018 EN
16 Maintenance and service
The operator is responsible for determining the maintenance intervals for the measuring device.
PRIMES recommends a maintenance interval of 12 months for inspection and validation or calibration.
If the device is used only sporadically, the maintenance interval can also be extended up to 24 months.
17 Transport
To prevent damages, we recommend transporting the BeamMonitor BM+ either in its original packaging or
in a PRIMES transport box.
18 Measures for the product disposal
Due to the Electrical and Electronic Equipment Act (Elektro-G) PRIMES is obliged to dispose PRIMES
measuring devices manufactured after August 2005 free of charge.
PRIMES is registered in the German “Used Appliance Register “ (Elektro-Altgeraete-Register EAR) as a
manufacturer with the number WEEE-Reg.-Nr. DE65549202.
Within the EU you are welcome to send your PRIMES devices to the following address, in case you want
them to be disposed:
PRIMES GmbH
Max-Planck-Str. 2
D-64319 Pfungstadt
Germany

PRIMES
BeamMonitor BM+ with LDS 2.98
73
Revision 01/2018 EN
19 Declaration of conformity

PRIMES
BeamMonitor BM+ with LDS 2.98
74
Revision 01/2018 EN
20 Technical Data
Supply data
Supply voltage, DC V 24 ± 10 %
Maximum current consumption A 1.8
Max. current consumption in standby mode A 0.4
Measurement Parameters
Dynamic A/D Converter bit 16
Power range W 50 – 25000
Max. power density kW/cm
2
10
Wave length µm 10.6 or 1.06
Beam dimensions mm 10 – 70
Max. beam divergence mrad < 100
Accuracy (beam diameter) % ± 5
Reproducibility (beam diameter) % ± 3
Revolution speed rpm 1562
Communication
Interfaces – Ethernet, RS485
Weights and measures
Dimensions L x W x H mm 476 x 292 x 83
Weight, approx. kg 10
Environmental Conditions
Service Temperature Range
Storage Temperature Range
°C
°C
+10 ... +40
-10 ... +50
Reference Temperature °C +22
Max. Admissible Relative Air Humidity (noncondensing) % 0 ... 80

PRIMES
BeamMonitor BM+ with LDS 2.98
75
Revision 01/2018 EN
21 Dimensions
21.1 BeamMonitor BM+ 60
Ø 60
Laser beam
93
106
7660
83
100 56
212
133133
43
(60)
100
316
4x M6
4x M6
All dimensions in mm (general tolerance ISO 2768-v)

PRIMES
BeamMonitor BM+ with LDS 2.98
76
Revision 01/2018 EN
21.2 BeamMonitor BM+ 100
Beam
63
Ø 100
146
71150
292
83
138 150
436
Laser beam
4x M6
436
All dimensions in mm (general tolerance ISO 2768-v)

PRIMES
BeamMonitor BM+ with LDS 2.98
77
Revision 01/2018 EN
22 Appendix
22.1 System control (option)
An optional connection to the system control is available. Please contact your PRIMES sales partner with
any questions.
22.2 Description of the MDF file format
The MDF file format is a simple ASCII-format which includes the main data of a beam measurement – the
spatial power density distribution. MDF stands for “Measurement Data Format”.
By means of this standardized format conversion problems between different evaluation programs are supposed to be reduced and a safe data transmission, e.g. per e-mail, is supposed to be ensured.
An important factor contributing to the success of MDF is its ability to store measurement data very efficiently, i.e., memory space-saving and fast storage. Moreover, the read access to data in the file can also
be optimized. To do so, the file must, if necessary, be “sorted” once (for example, when opening it for the
first time). This enables indexed and thus faster access to the data.
MDF contains both the raw measurement data acquired during a measurement and metadata necessary
for interpreting the raw data. This includes, for example, information for converting the raw data into physical
values, or the ASAM-compliant signal name.
The files are arranged as follows:
Line Contents
1 MDF100 (file identifier)
2
Number of image points: in x-direction in y-direction
3
Size of the measurement range: length in x (mm) length in y (mm)
4
Position along the beam axis: z-position (mm)
5
Transversal position of the center of the measurement range: x-pos y-pos (mm)
6
Amplification of the measuring signal: enhancement (dB)
7
Number of averages: number
8
Offset value displayed by the measuring device: offset-value
9
Wavelength-value
10
Power value
11
Focal length value
12
Date, time value
x
I
n the following lines the data can be found. There is a maximum of 80 characters per line.
x
x
Comments are inserted as additional lines, into the lines after the file identifier.
The comment lines each start with a semi-colon.

PRIMES
BeamMonitor BM+ with LDS 2.98
78
Revision 01/2018 EN
Example:
MDF100
;This is an example.
;These lines are a comment.
64 64
2 2
11
...
...
1
10
10 10 10 10 10 10 10 10 10 10
11 12 13 14 15 16 17 18 19 20
20 20 20 20 20 18 16 14 12 10
....
....

PRIMES
BeamMonitor BM+ with LDS 2.98
79
Revision 01/2018 EN
23 Basis of beam diagnosis
23.1 Laser beam parameter
Raw beam diameter
Divergence angle
Focus diameter
Focal length f
z-axis
z-axis
Fig. 23.1: Sketch for the definition of beam parameters
23.1.1 Rotationally symmetric beams
According to ISO 11145 as well as ISO 11146 three beam parameters are necessary for the characterization
of a rotationally symmetric beam:
• the z-position of the beam waist (focus) z
0
• the diameter of the beam waist d
σ
F
• the far field divergence angle Θ
By means of these three values it is possible to determine the beam diameter at every spot along the propagation direction. The following restriction is applicable: The divergence angle has to be smaller than 0.8 rad
and the focus diameter and the divergence angle were determined with the 2nd moment method.
Equation 1:
Furthermore, the beam propagation is described by means of the so called beam propagation ratio K.
Equation 2:
with:
K: = beam propagation ratio
M2: = beam propagation factor
λ: = wave length in a medium with the refractive index n
Θσ: = divergence angle
d
σ
0
: = beam waist diameter

PRIMES
BeamMonitor BM+ with LDS 2.98
80
Revision 01/2018 EN
The derived beam parameter product, is a constant size as long as image defect free and aperture free
components are used.
Equation 3:
BPP
An important beam parameter is the Rayleigh length:
The Rayleigh length is the distance towards the propagation in which the laser beam has increased by
. It can be calculated by means of the following formula:
Equation 4:
23.1.2 Non rotationally symmetric beams:
In order to describe non rotationally symmetric beams, the following parameters are required:
• the z-position of the beam waist (focus) z
x
and z
y
• the diameter of the beam waist d
σ0x
and d
σ0y
• the far field divergence angle Θσx and Θ
σy
• the angle ϕ between the x´-axis of the measuring system and the x-axis of the beam (the x-axis of the
beam is the one closest to the x-axis of the measuring system.)
Coordinate system of the beam (x, y)
Coordinate system of the device (x, y)
x-axis
y-axis
x-axis
y-axis
Fig. 23.2: Beam parameter of the not rotationally symmetric beam
All beams which can be characterized by two axes which are perpendicular to each other can be described
by means of the above mentioned parameters.
Further beam parameter such as the K-figure or the beam propagation factor are calculated directionally by
means of as the same equations as the rotationally symmetric beams. This always results in two parameters
such as Kx and Ky.

PRIMES
BeamMonitor BM+ with LDS 2.98
81
Revision 01/2018 EN
23.2 Calculation of beam data
For the calculation of the beam data not only the algorithms for the 2nd moment method are implemented as
demanded by the ISO standard 11145 but also the 86 % method which is widely-spread within the industry.
For the Gaussian TEM00-mode both methods offer similar results whereas in case of the majority of other
laser beams the 2nd moment method calculates bigger beam diameters than the 86 % method.
Laser radiation often is a mixture of different modes with different frequencies and coherent characteristics.
All known measuring procedures only provide little information on the beam. Therefore the calculated beam
parameters are always dependent on the measuring procedure. For the interpretation of the measuring
results it is important to be aware of this fact.
The calculation of the beam radius requires the following to preparatory steps:
1. Measurement of the power density distribution
2. Determination of the zero level
3. Determination of the beam position
23.2.1 Determination of the zero level
The zero level can – for instance – be determined by means of a histogram by applying the frequency of the
measured power density values (please see Fig. 23.3).
• Zero level of the signal
Frequency (au)
Fig. 23.3: Schematic histogram of the scanned measuring points
The histogram shows how frequently a certain power density was measured. The maximum of this curve
indicates the power density of the zero level. The power density is deducted from all measured values of
the power density distribution.
It is important to measure the zero level accurately because even the slightest error would lead to a drastic
change as far as the volume is concerned. This in turn has a great impact on the measured beam radius.

PRIMES
BeamMonitor BM+ with LDS 2.98
82
Revision 01/2018 EN
23.2.2 Determination of the beam position
The beam position is determined by means of the 1
st
moment method. This means the moment of inertia of
the power density distribution (E(x, y, z) is determined.
Equation 5:
As mentioned at the beginning of the chapter, there are two possibilities how to determine the beam radius
after the determination of the beam position.
23.2.3 Radius determination with the 2nd moment method of the power density distribution
The calculation of the beam radius according to the 2nd moment method of the power density distribution
is effected as shown in equation 6.
Equation 6:
Based on equation 6 the beam diameter is determined as follows:
Equation 7:
This algorithm contains the product derived from the power density and the squared distance to the moment
of inertia. It is only reliable when the zero level is determined correctly. The fill factor, the ratio of the beam
diameter divided by the integration range/measuring window size is a further important quantity. It should
always have a value between 0.3 and 0.6.

PRIMES
BeamMonitor BM+ with LDS 2.98
83
Revision 01/2018 EN
23.2.4 Radius determination with the method of the 86 % power inclusion
The first step is the determination of the volume of the power density distribution. It is proportional to the
total power. The addition of all power density values and their multiplication with the pixel dimensions result
in the volume and therefore the total power. A reliable zero level subtraction is the fundamental basis.
Based on this total power, the focus lies on the range which includes the 86 % of the total beam power. This
beam power must lie within the beam radius.
The integration typically starts with the values of the maximum power density. Then the integration range is
enlarged until 86 % of the total power lie within the radius. As far as the integration is concerned, the number
of pixels is counted. By means of this the 86 % range which means the beam diameter can be determined.
For circular beams similar to the fundamental mode beams the procedure works well.
Fig. 23.4: Graphical presentation of the calculation of the 86% radius
a) shows the power density distribution
b) shows the pixels which include 86 % of the power together. As a clarification the pixels with a low power
are set to zero.
c) shows a section at the “86 % power density inclusion”. The level lies at 14 % of the maximum power
d) shows the section through the distribution at 86 %.

PRIMES
BeamMonitor BM+ with LDS 2.98
84
Revision 01/2018 EN
23.2.5 Further radius definitions (option)
Not all measuring devices for the laser beam diagnosis come to the same measuring result when carrying out
similar measurements with the same laser beam. Apart from a different validation of the measuring devices
the measuring procedures and the used evaluation algorithms have an influence on the determined beam
dimension. Not all the processes used comply with the valid standards. However, they are the preferred
choice for instance in the scientific area. For practical reasons, for instance for the design of the orifices or
for the correlation with processing results, it can also be helpful to use alternative beam radius definitions.
As an option, we offer an extension to the following alternative radius definitions:
1. Knife edge method according to ISO 11146-3
2. Slit method according to ISO 11146-3
3. Gaussfit method
4. 1/e² power density loss method
5. Power inclusion method with a freely definable 1
st
power value
6. Power inclusion method with a freely definable 2nd power value
2nd Moment Power inclusion Knife edge method
Slit method Gaussfit method 1/e
2
-power density
Fig. 23.5: Schematic illustration of the beam radius definitions that are offered optionally for the PRIMES
LaserDiagnosticsSoftware
 Loading...