

Page 1
Stimulator 2.0 April 2011
Plexon Inc
6500 Greenville Ave. Suite 700
Dallas Texas 75206
United States of America
www.plexon.com
Stimulator 2.0 April 2011
STIMULATOR 2.0
Page 2
Neurotechnology Research Systems
Stimulator 2.0
User’s Guide April 2011
CAUTION: THIS STIMULATOR IS NOT FOR USE IN HUMANS
CAUTION: READ THE ENTIRE MANUAL BEFORE ATTEMPTING TO OPERATE THIS EQUIPMENT
IMPORTANT: OBSERVE THE FOLLOWING SEQUENCE DURING ALL EXPERIMENTS:
1. TURN THE STIMULATOR POWER ON
2. LAUNCH THE USER INTERFACE PROGRAM
3. CONNECT THE STIMULATOR TO THE ELECTRODES
4. CONDUCT THE EXPERIMENT
5. CLOSE THE USER INTERFACE PROGRAM
6. DISCONNECT THE STIMULATOR FROM THE ELECTRODES
7. TURN THE STIMULATOR POWER OFF
Plexon Inc Proprietary
The information contained herein is the property of Plexon Inc. and it is proprietary and restricted
solely to assist Plexon Inc. customers.
Neither this document nor the contents may be disclosed, copied, revealed or used in whole or in
part for any other purpose without the prior written permission of Plexon Inc. This document must
be returned upon request of Plexon Inc.
The information contained in this document is subject to change without notice. Plexon Inc.
reserves the right to make changes in equipment design or components as progress in engineering
or manufacturing may warrant.
This user’s guide is PN 14-20-A-13
This user’s guide refers to:
Hardware PN 14-20-A-10-A
Firmware PN 14-20-A-07
Software PN 14-20-A-08
Copyright © 1983-2011 Plexon Inc, All Rights Reserved
® Plexon is a registered trademark of Plexon Inc.
Printed in the United States of America
Stimulator 2.0 - 2 -
Page 3
Neurotechnology Research Systems
Table of Contents
1 Introduction .............................................................................................. 6
2 System Requirements ............................................................................... 6
3 System components .................................................................................. 7
4 Installation ................................................................................................ 8
4.1 Driver Installation ..................................................................................................................................... 8
4.2 Software Installation ................................................................................................................................ 9
4.3 Hardware Installation ............................................................................................................................ 12
4.4 Turning on the power for the first time ......................................................................................... 14
5 Getting Started........................................................................................ 15
5.1 Overview ..................................................................................................................................................... 15
5.2 Operational Flowchart ........................................................................................................................... 16
5.3 Launching the Stimulator 2.0 software .......................................................................................... 17
5.4 Creating a burst of rectangular pulses ............................................................................................ 18
5.5 Verifying the output on an oscilloscope ......................................................................................... 19
5.6 Compliance voltage and stimulation failure ................................................................................. 22
5.7 Automatic electrode discharge .......................................................................................................... 24
5.8 Arbitrary Waveforms & Complex Rectangular Pulses.............................................................. 25
5.9 Impedance measurement ..................................................................................................................... 27
5.10 Working with real electrodes ............................................................................................................. 30
5.11 Starting stimulation from a digital input ....................................................................................... 32
5.12 Stopping stimulation .............................................................................................................................. 34
6 GUI Function Reference .......................................................................... 35
6.1 Parameters Edit/Load ........................................................................................................................... 35
6.1.1 Edit ........................................................................................................................................................... 35
6.1.2 Load ......................................................................................................................................................... 35
6.2 Stimulation Stop/Start ........................................................................................................................... 36
6.2.1 Stop .......................................................................................................................................................... 36
6.2.2 Start ......................................................................................................................................................... 36
6.3 Rectangular Pulse Parameters ........................................................................................................... 37
6.3.1 First Phase Amplitude ..................................................................................................................... 37
6.3.2 First Phase Width .............................................................................................................................. 37
6.3.3 Interphase Delay ............................................................................................................................... 37
© Plexon Inc - 3 -
Page 4
Neurotechnology Research Systems
6.3.4 Second Phase Amplitude ................................................................................................................ 37
6.3.5 Second Phase Width ......................................................................................................................... 37
6.4 Number of Repetitions and Pulse Rate ........................................................................................... 38
6.4.1 No. of Repetitions .............................................................................................................................. 38
6.4.2 Rate .......................................................................................................................................................... 38
6.5 Arbitrary Waveform Patterns ............................................................................................................. 39
6.5.1 Fixed Sampling Rate ........................................................................................................................ 39
6.5.2 Variable Sampling Rate ................................................................................................................. 40
6.6 Vmon scaling and Z conversion ......................................................................................................... 41
6.6.1 Vmon scaling (Stimulation mode) ............................................................................................ 41
6.6.2 Vmon scaling (Z test mode) .......................................................................................................... 41
6.6.3 Z conversion ......................................................................................................................................... 42
6.7 Function Stimulate / Function Z test ............................................................................................... 42
6.7.1 Stimulate Mode .................................................................................................................................. 42
6.7.2 Impedance Test Mode ..................................................................................................................... 42
6.8 Trigger Mode ............................................................................................................................................. 43
6.8.1 Software Trigger Mode .................................................................................................................. 43
6.8.2 Rising Edge Trigger Mode ............................................................................................................. 43
6.8.3 Level Trigger Mode .......................................................................................................................... 44
6.9 Edit/Load All .............................................................................................................................................. 44
6.10 Start Mode ................................................................................................................................................... 45
6.11 Monitor Channel ....................................................................................................................................... 45
6.12 ABORT .......................................................................................................................................................... 46
6.13 File Open / File Save ............................................................................................................................... 47
6.14 Options: Discharge Mode ...................................................................................................................... 48
6.15 Options: Digital Output Mode ............................................................................................................. 48
7 Input and Output Connectors .................................................................. 50
7.1 Power In ....................................................................................................................................................... 50
7.2 Digital In ...................................................................................................................................................... 50
7.3 USB 2.0 ......................................................................................................................................................... 50
7.4 Stim Out ....................................................................................................................................................... 51
7.5 Digital Out ................................................................................................................................................... 51
7.6 Current Monitor ....................................................................................................................................... 52
Stimulator 2.0 - 4 -
Page 5
Neurotechnology Research Systems
7.7 Voltage Monitor ........................................................................................................................................ 53
7.8 Stimulation Cable ..................................................................................................................................... 53
8 Sample Arbitrary Waveform Pattern Files ............................................... 54
9 Stimulator Limitations ............................................................................. 55
9.1 Maximum Compliance Voltage Varies with Stimulation Amplitude................................... 55
9.2 Power on/off Transients ....................................................................................................................... 55
9.3 Current Monitor with an Open Circuit ............................................................................................ 56
9.4 Impedance Test with an Open Circuit ............................................................................................. 57
9.5 Channel fails to start in Impedance Test mode ........................................................................... 57
10 Specifications .......................................................................................... 58
© Plexon Inc - 5 -
Page 6
Neurotechnology Research Systems
1 Introduction
The Plexon® Stimulator 2.0 is a 16-channel constant current stimulator system. It has 16
individually programmable constant current sources that share a common return path. Stimulation
currents may be defined with 16-bit precision up to ±1 mA and delivered with ±10 V compliance.
The graphical user interface makes it easy to define bi-phasic rectangular pulses with micro-Amp
precision and micro-second temporal accuracy. Bursts of pulses repeated at a user defined rate are
also easily configured. In addition, Stimulator 2.0 adds the ability to load arbitrary waveform
patterns from text files.
Playback of pulses and arbitrary stimulation waveforms may be initiated from the GUI or triggered
in response to external digital inputs. Each channel has a dedicated digital input that may be used
in an edge triggered or level triggered (gated) mode to initiate stimulation with microsecond
latency. Each channel also has a dedicated digital output to signal to other devices the precise time
when stimulation is occurring.
The actual current and voltage delivered to any electrode can be conveniently monitored on an
oscilloscope using the standard BNC monitor outputs. A convenient impedance test mode provides
nanoamp resolution and additional filtering and programmable gain for the monitor channel
outputs so that the voltage elicited in response to sub microamp currents may be resolved for
impedance measurement.
Thank you for purchasing this Plexon product. We hope you are pleased with every aspect of it.
Please do not hesitate to contact us if you have any questions.
2 System Requirements
A modern personal computer running Windows 7 or Windows XP with a free USB 2.0 port is
required to operate the system.
An oscilloscope is highly recommended for monitoring the actual current and voltage waveforms
during stimulation.
Stimulator 2.0 - 6 -
Page 7
Neurotechnology Research Systems
1
2
3
4
5
6 7 8
3 System components
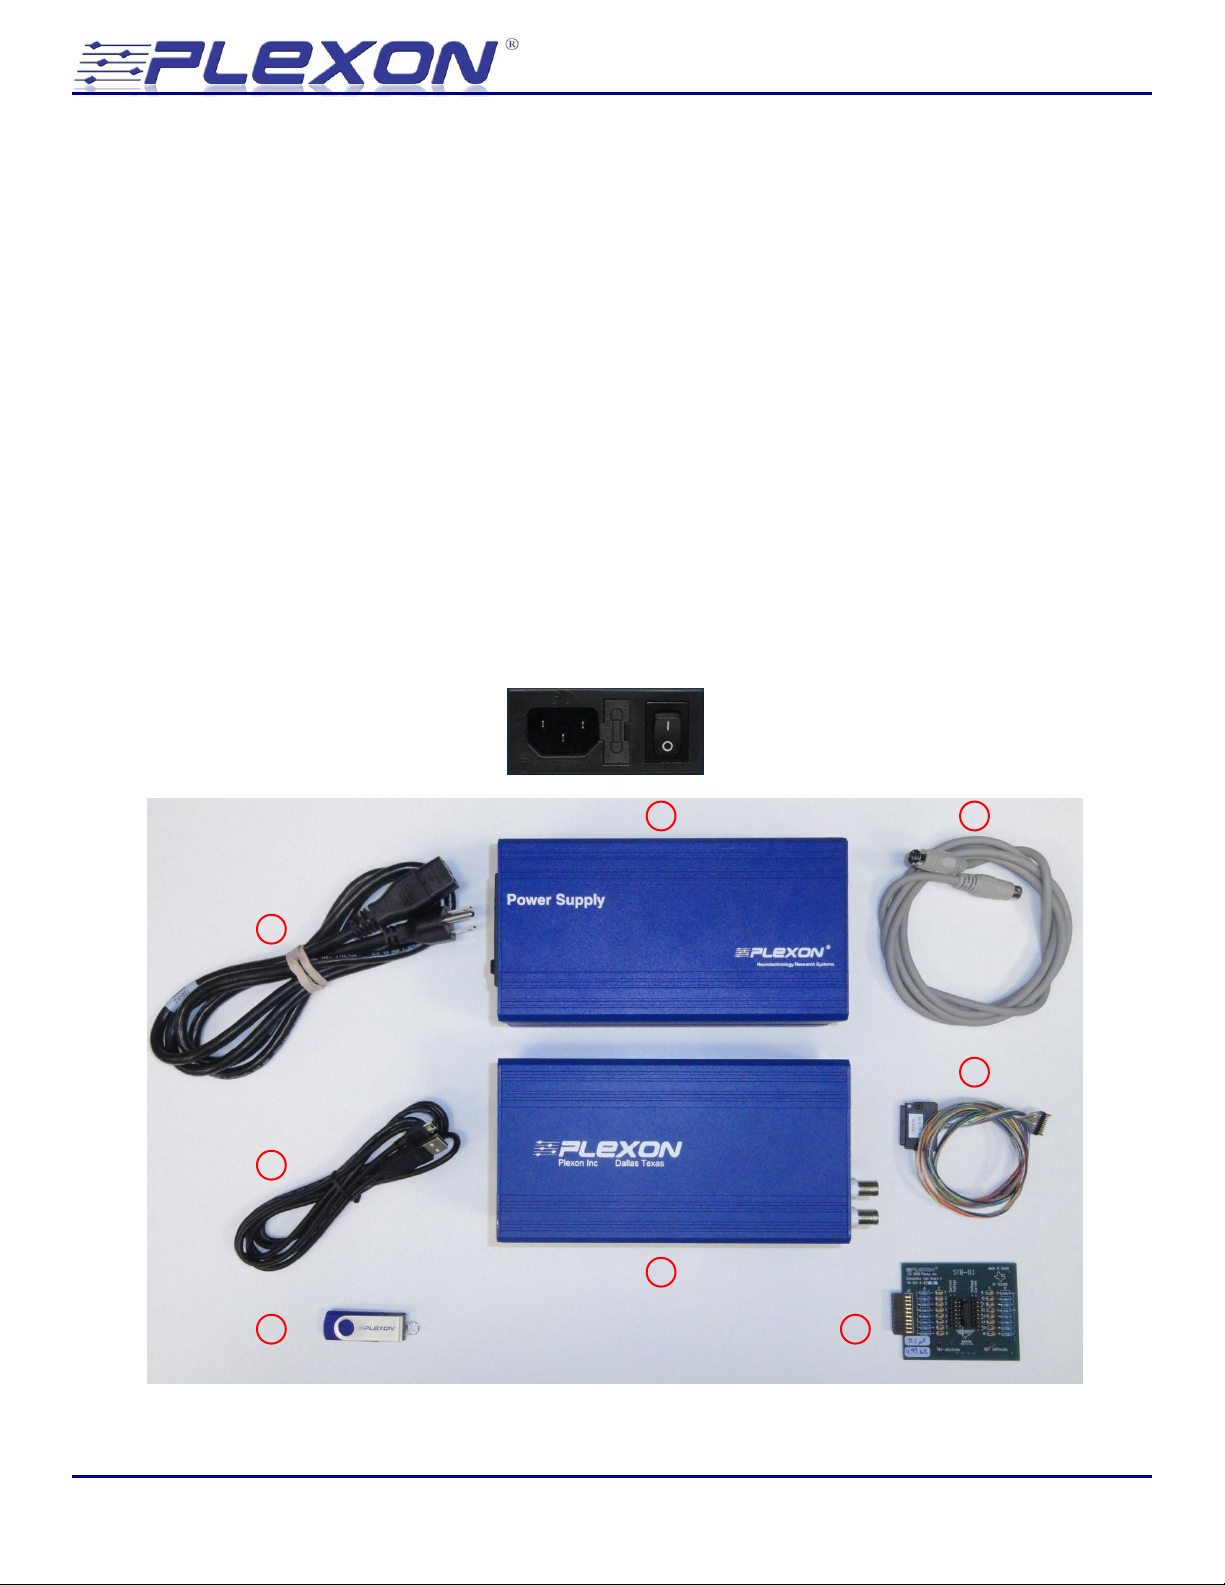
When you receive your Plexon stimulator, confirm that you have the following pieces:
1. USB memory with software & drivers Plexon 14-20-A-14
2. AC power cord (7.5 ft)* Volex 17250 10 B1
3. Power Supply Plexon 09-06-A-14-P1
4. DC power cable (6 ft) StockCable R58190A-06
5. USB Cable (2m) Molex 88732-8902
6. Stimulator Plexon 14-20-A-10-A
7. Stimulation Cable Plexon 14-03-A-03
8. Test Board (model electrodes) Plexon 14-04-A-03-A
* International customers: The stimulator power supply has an International Electrotechnical
Commission (IEC) 60320 C14 inlet for AC power (shown below). The AC power cord supplied with
the stimulator has an IEC 60320 C13 connector and a NEMA 5-15 plug compatible with the AC wall
outlets in North America. Users in other regions must supply a power cord with an IEC 60320 C13
connector and a plug that is compatible with the AC wall outlets in the region of use.
© Plexon Inc - 7 -
Page 8
Neurotechnology Research Systems
4 Installation
Read the entire installation section before proceeding with the installation. Follow the installation
steps in the order that they are presented. Install the drivers first, followed by the software,
followed by the hardware. Do not connect the stimulator to an electrode implant until you have
read the entire manual.
4.1 Driver Installation
Read the entire Driver Installation section before proceeding with any of the steps.
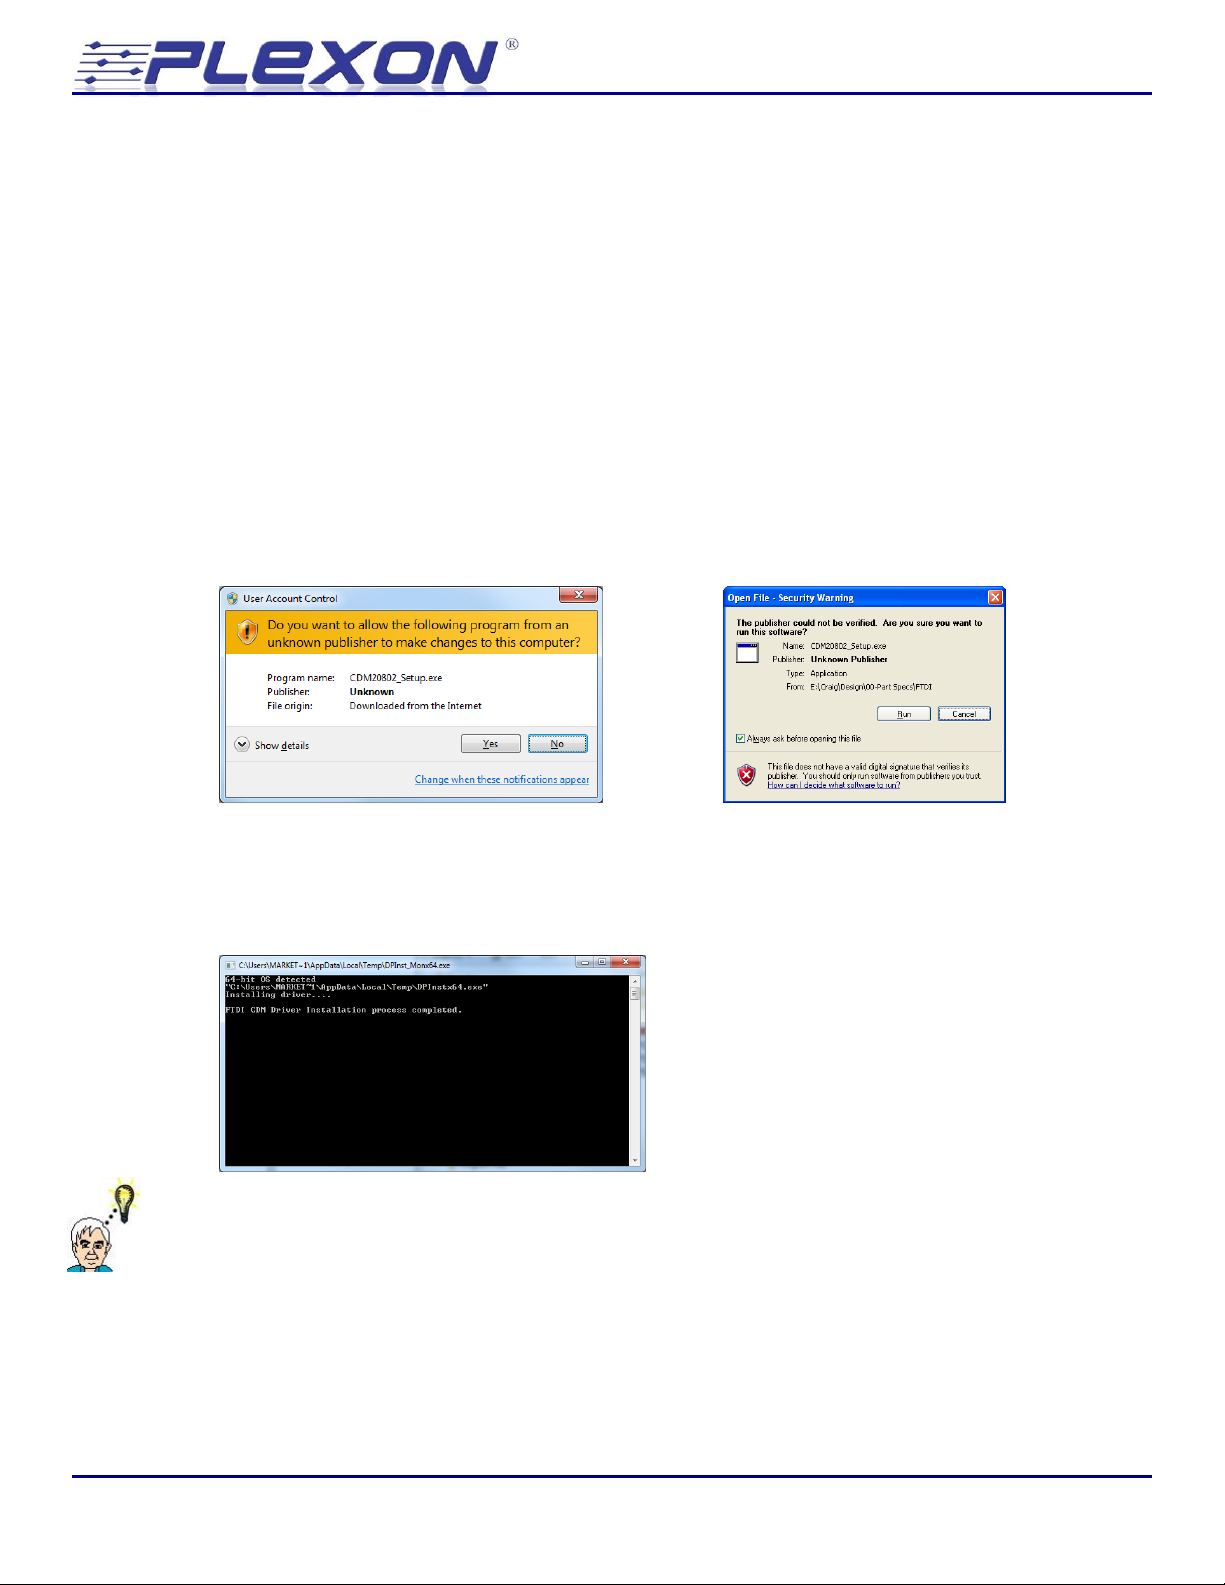
4.1.1 Browse to the folder \Stimulator\Driver on the USB flash drive and run the program
CDM20802_Setup.exe. On some computers, you will get a warning:
Windows 7: Windows XP:
4.1.2 Click Yes or Run to continue:
A command window opens briefly to display the status of the driver installation and then
closes automatically:
Hint: If you do not see the command window at least briefly then it is quite possible that the
driver installation did not complete. In this case, double click on CDM20802_Setup.exe a
second time.
Stimulator 2.0 - 8 -
Page 9
Neurotechnology Research Systems
4.2 Software Installation
Read the entire Software Installation section before proceeding with any of the steps.
Hint: If you are trying to replace an existing version of the software, you should first remove the
existing version before installing the new version.
4.2.1 Browse to the \Stimulator\Software folder on the USB flash drive
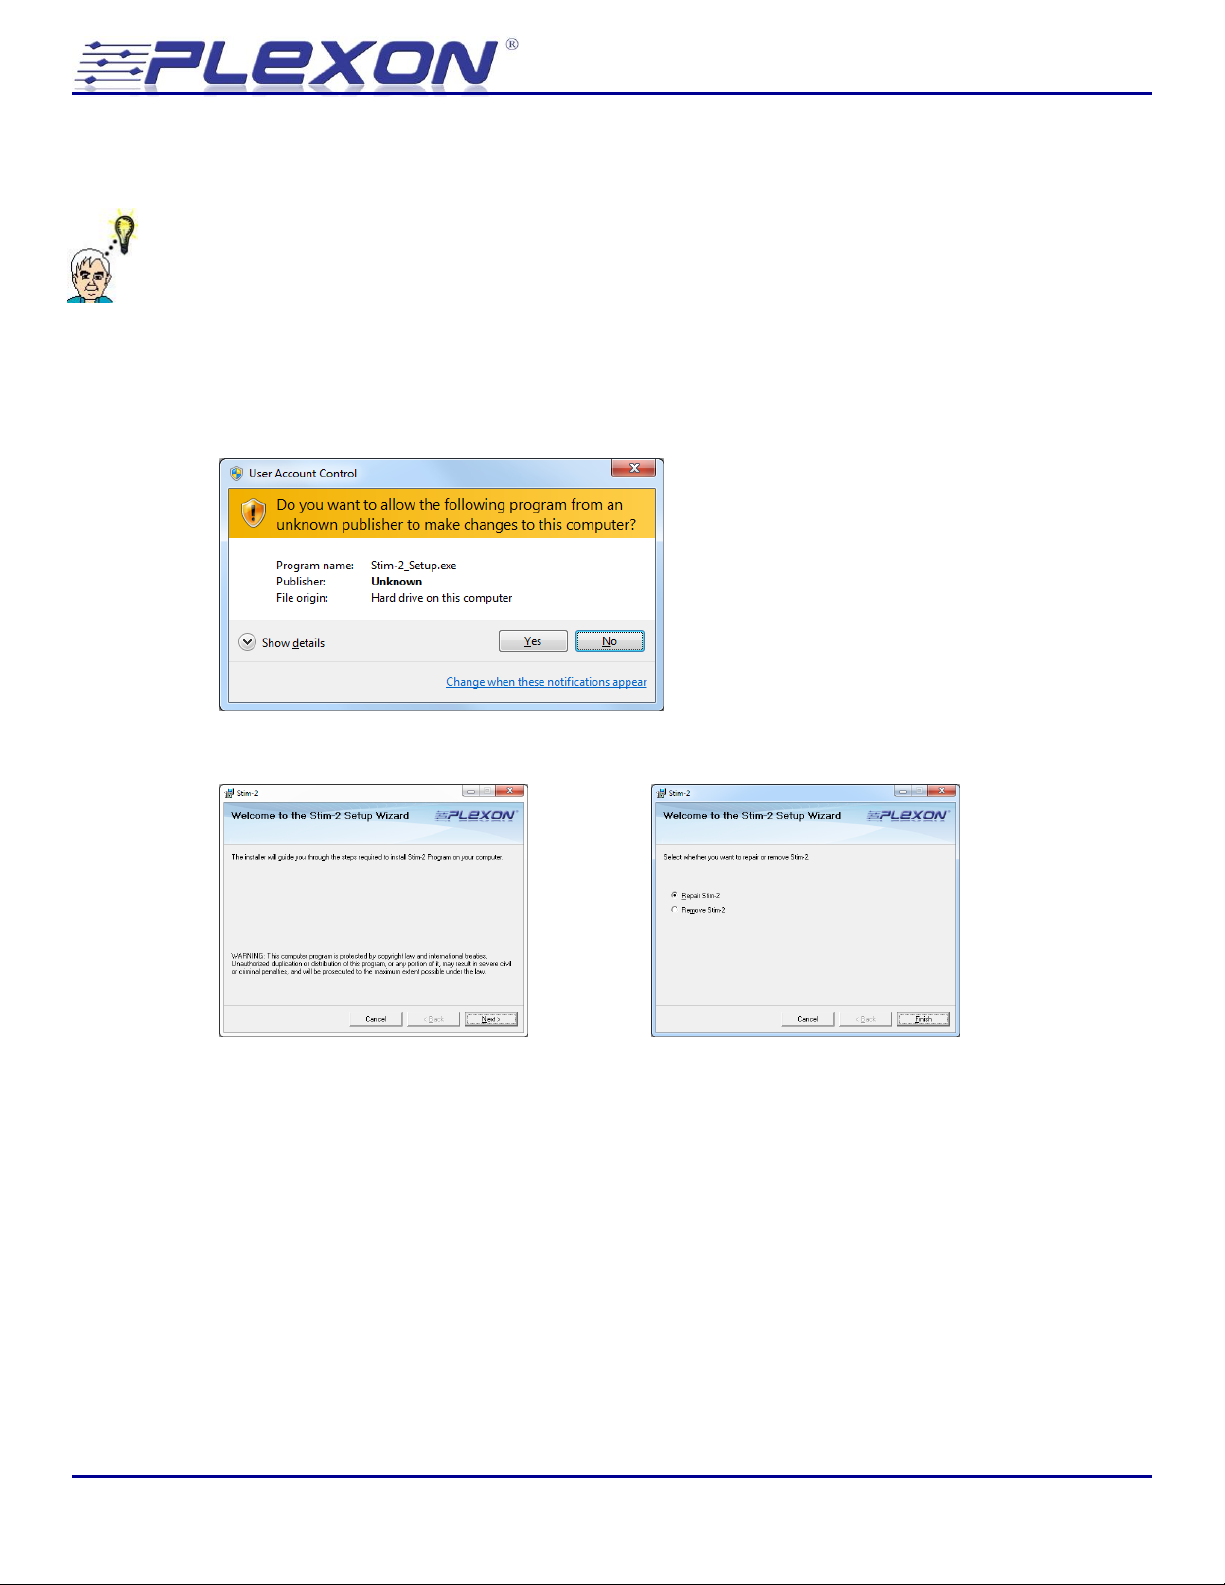
4.2.2 Double-click the file Stim-2_Setup.exe to begin the installation process. On some computers,
you will get a warning:
4.2.3 Click Yes or Run to continue. The welcome screen appears:
If the software is already installed, then the welcome screen gives you the option to repair
(re-install) or remove the software as shown on the right above. If the software is not
already installed, then the welcome screen shown above on the left appears.
Click Next to continue.
© Plexon Inc - 9 -
Page 10
Neurotechnology Research Systems
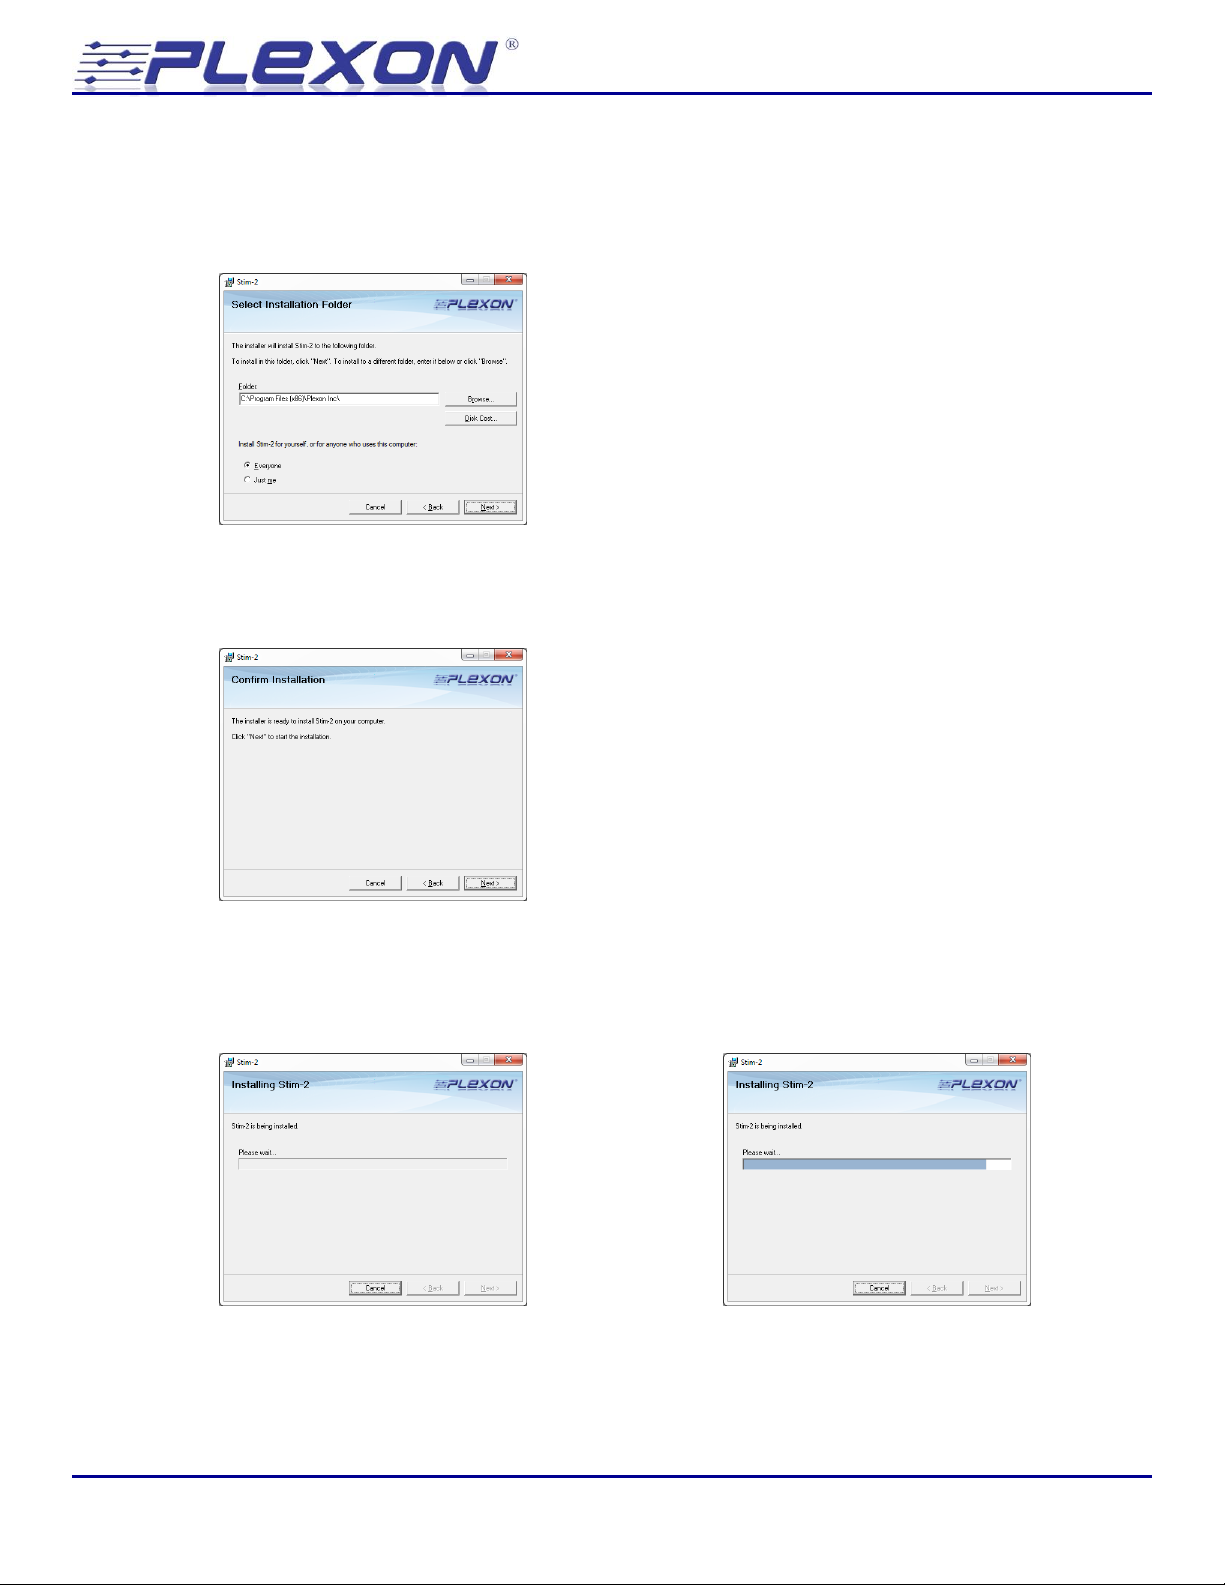
4.2.4 Select the location to install the software:
The default install location for Windows 7 (64 bit) is C:\Program Files (x86)\Plexon Inc\
The default install location for Windows XP is C:\Program Files\Plexon Inc\
Click Next to continue.
4.2.5 You will be asked to confirm that you would like to start the installation:
Click Next to continue.
4.2.6 When the installation begins, it may take a couple of minutes before the progress bar begins
moving across the window. This is especially true in Windows 7:
Stimulator 2.0 - 10 -
Page 11
Neurotechnology Research Systems
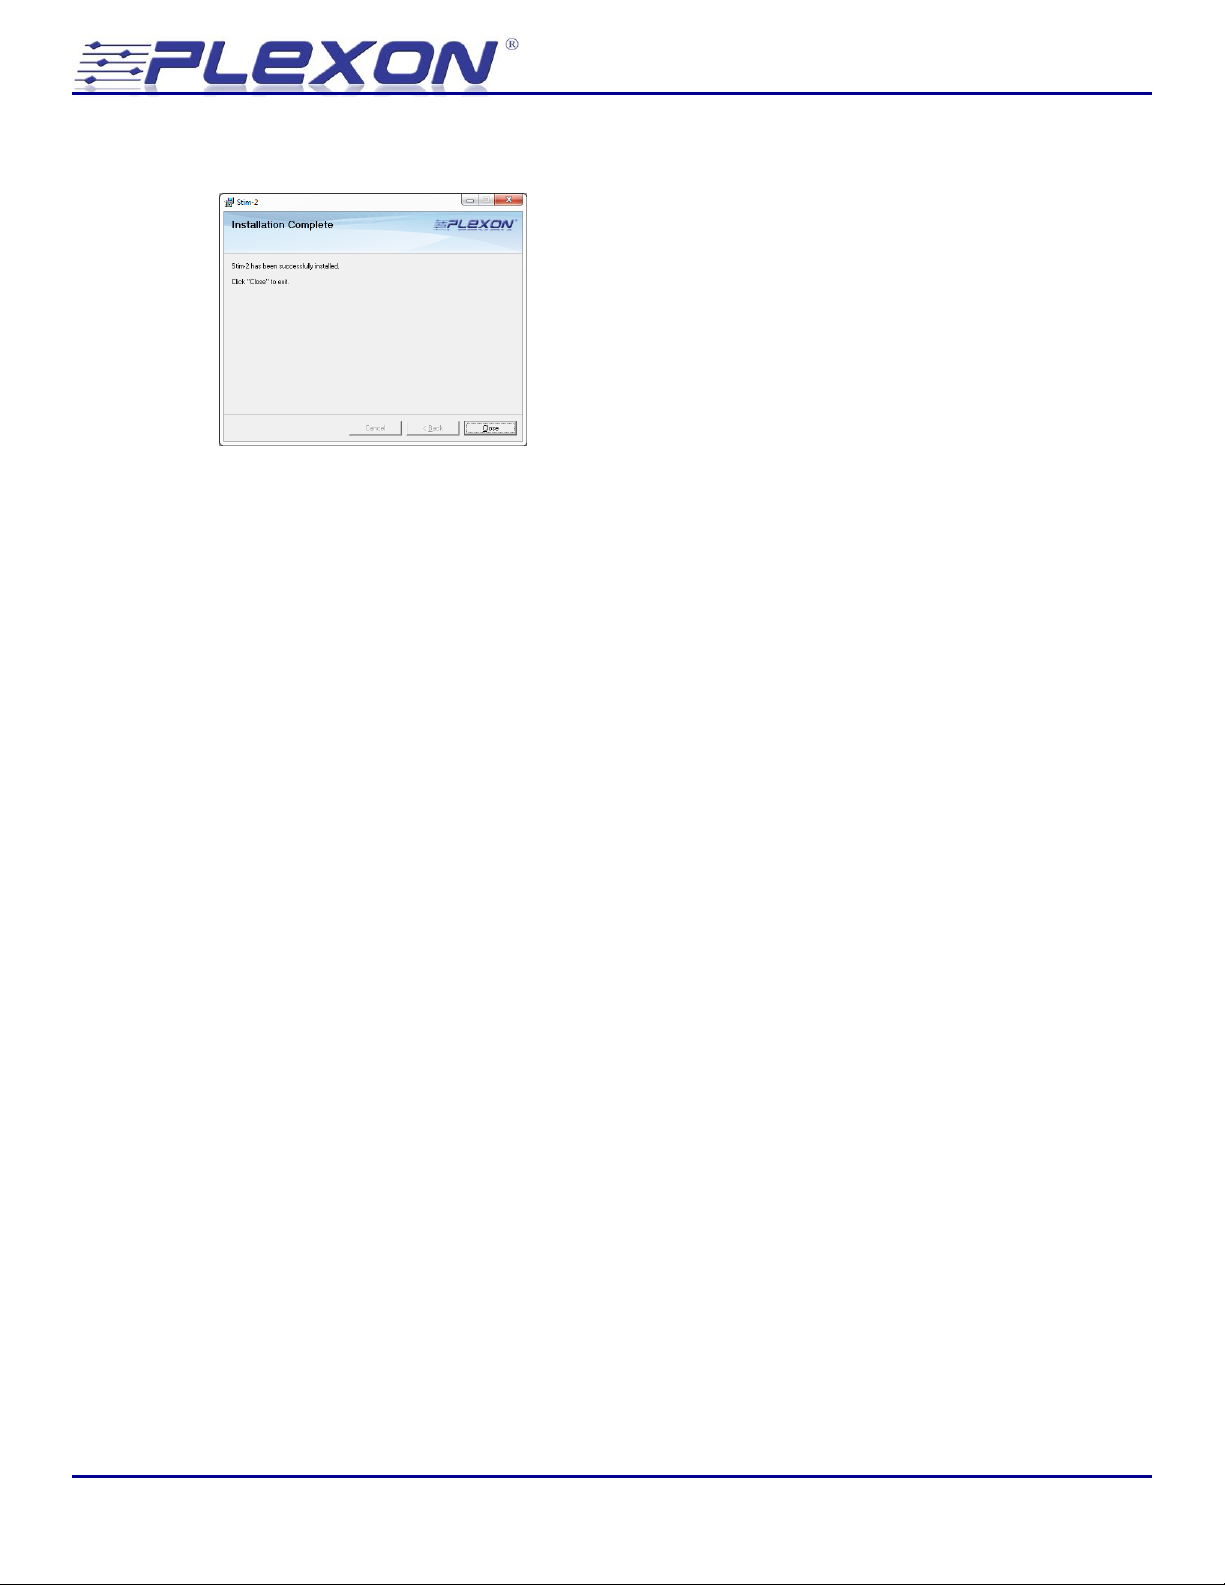
4.2.7 Once the progress bar starts moving, the installation completes quickly.
Click Close to complete the software setup.
© Plexon Inc - 11 -
Page 12
Neurotechnology Research Systems
4.3 Hardware Installation
Read the entire Hardware Installation section before proceeding with any of the steps.
An oscilloscope is highly recommended for viewing the output of the monitor channels.
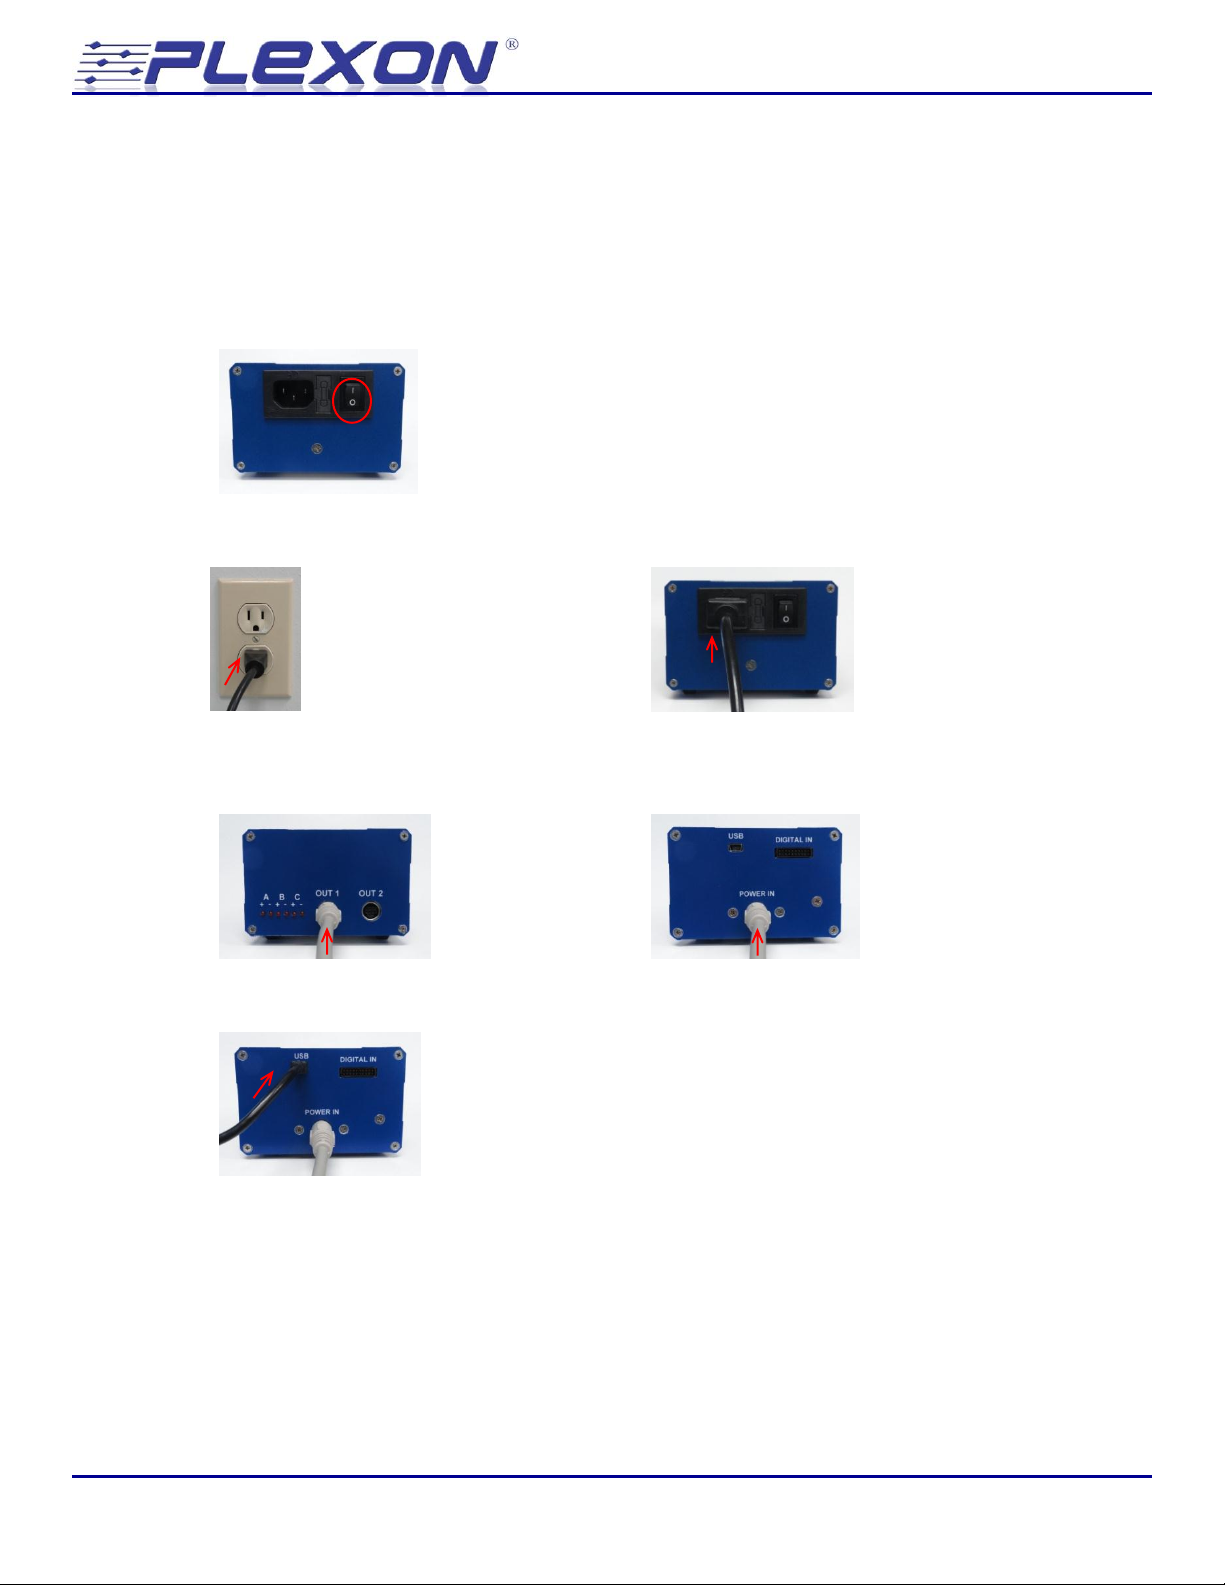
4.3.1 Ensure that the power switch on the power supply is in the off position.
4.3.2 Connect the AC power cord between the AC outlet and the power supply.
4.3.3 Connect the DC power cord between the power supply and the stimulator.
You may connect to either OUT 1 or OUT2 on the power supply.
4.3.4 Connect the USB cable between the stimulator and the computer.
4.3.5 IMPORTANT: Turn on the stimulator power and launch the stimulator GUI before
connecting the stimulator to any electrodes.
Stimulator 2.0 - 12 -
Page 13
Neurotechnology Research Systems
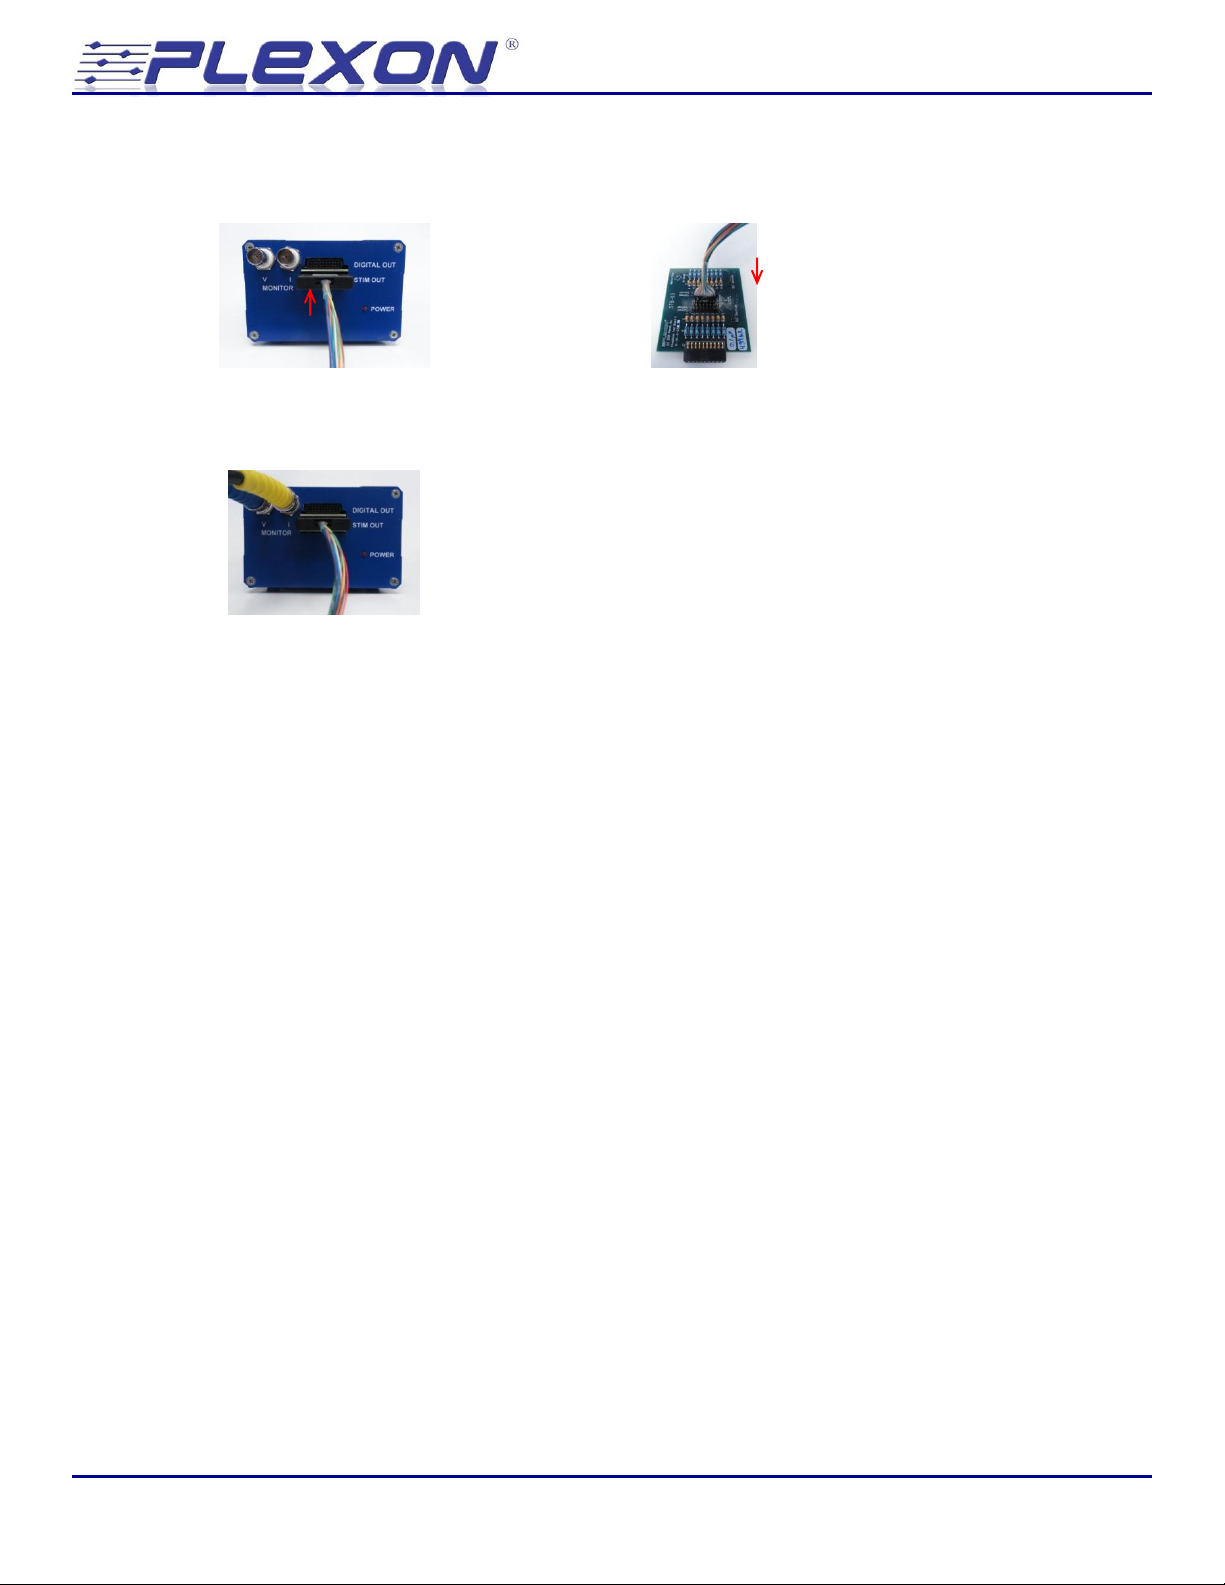
4.3.6 Connect the stimulation cable between the stimulator and the test load board. Be sure to
line up the white orientation dots on both connectors.
4.3.7 Connect BNC cables between the monitor channel outputs and an oscilloscope. Monitoring
the current and voltage delivered to the electrode is an essential part of stimulation.
© Plexon Inc - 13 -
Page 14
Neurotechnology Research Systems
4.4 Turning on the power for the first time
4.4.1 Turn the power supply on. The six LEDs on the front of the power supply and the one LED
on the front of the stimulator should illuminate.
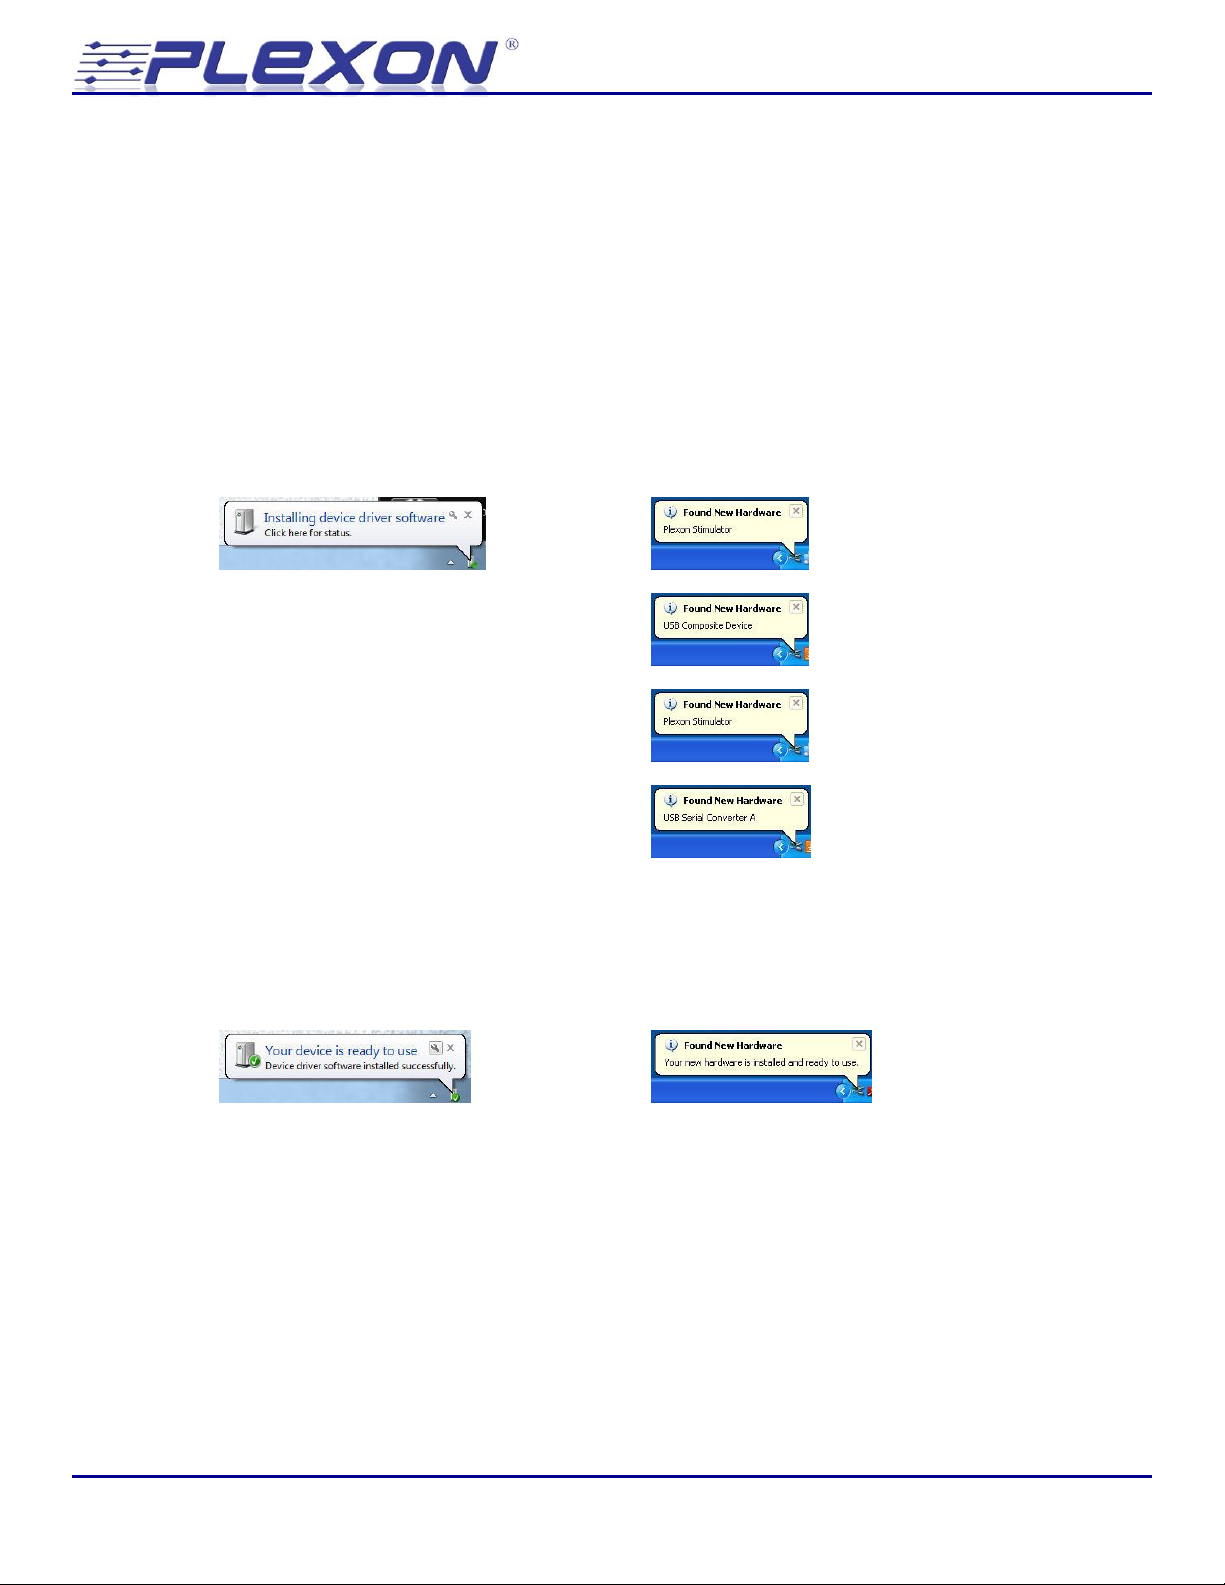
4.4.2 The first time you turn the stimulator on a “Found New Hardware” balloon will appear in
the lower right hand corner of the computer screen. In Windows 7, the balloon changes
from “Installing device driver software” to “Your device is ready to use”. In Windows XP,
the balloon cycles through several different displays including “Plexon Stimulator”, “USB
Composite Device”, and “USB Serial Converter X” where X is successively A, B, C, then D:
Windows 7: Windows XP:
…
(repeats for USB Serial Converter B, C, D)
…
4.4.3 If the “Found New Hardware Wizard” appears, then the drivers for the stimulator are not
properly installed. Refer to section 4.1 for the driver installation procedure.
Stimulator 2.0 - 14 -
Page 15
Neurotechnology Research Systems
5 Getting Started
This section introduces the basic functions of the stimulator guides you through basic stimulator
operation using the model electrodes on the test board. It is highly recommended that you work
through this section before attempting to do any other type of stimulation. Note that you will need
an oscilloscope to see the output of the monitor channels.
IMPORTANT: OBSERVE THE FOLLOWING SEQUENCE DURING ALL EXPERIMENTS:
1. TURN THE STIMULATOR POWER ON
2. LAUNCH THE USER INTERFACE PROGRAM
3. CONNECT THE STIMULATOR TO THE ELECTRODES
4. CONDUCT THE EXPERIMENT
5. CLOSE THE USER INTERFACE PROGRAM
6. DISCONNECT THE STIMULATOR FROM THE ELECTRODES
7. TURN THE STIMULATOR POWER OFF
5.1 Overview
Every stimulation protocol begins with the definition of the stimulation pattern. The stimulator 2.0
graphical user interface (GUI) provides a means for defining bi-phasic rectangular pulses and
bursts of identical pulses that are repeated at a fixed rate. More complicated rectangular
waveforms and non-rectangular arbitrary waveforms may be defined in and loaded from a simple
text file. Once defined, the stimulation pattern is downloaded into the stimulator memory for
playback. Playback can be initiated from the GUI or in response to a digital input to the stimulator
hardware. During playback, the actual current and voltage delivered to the electrode can be
observed on the monitor outputs. Monitoring the electrodes during stimulation is a critical
component of successful stimulation.
In addition to performing stimulation, Stimulator 2.0 also has a special impedance testing mode. In
impedance testing mode, the stimulation pattern is a predefined 1 kHz ±100 nA sine wave that is
automatically loaded into every channel. Playback of the impedance test waveform on particular
channels is initiated from the GUI. The voltage elicited in response to the impedance test current is
then observed on the voltage monitor output to determine the electrode impedance. Variable gain
steps are provided to resolve a wide range of electrode impedances.
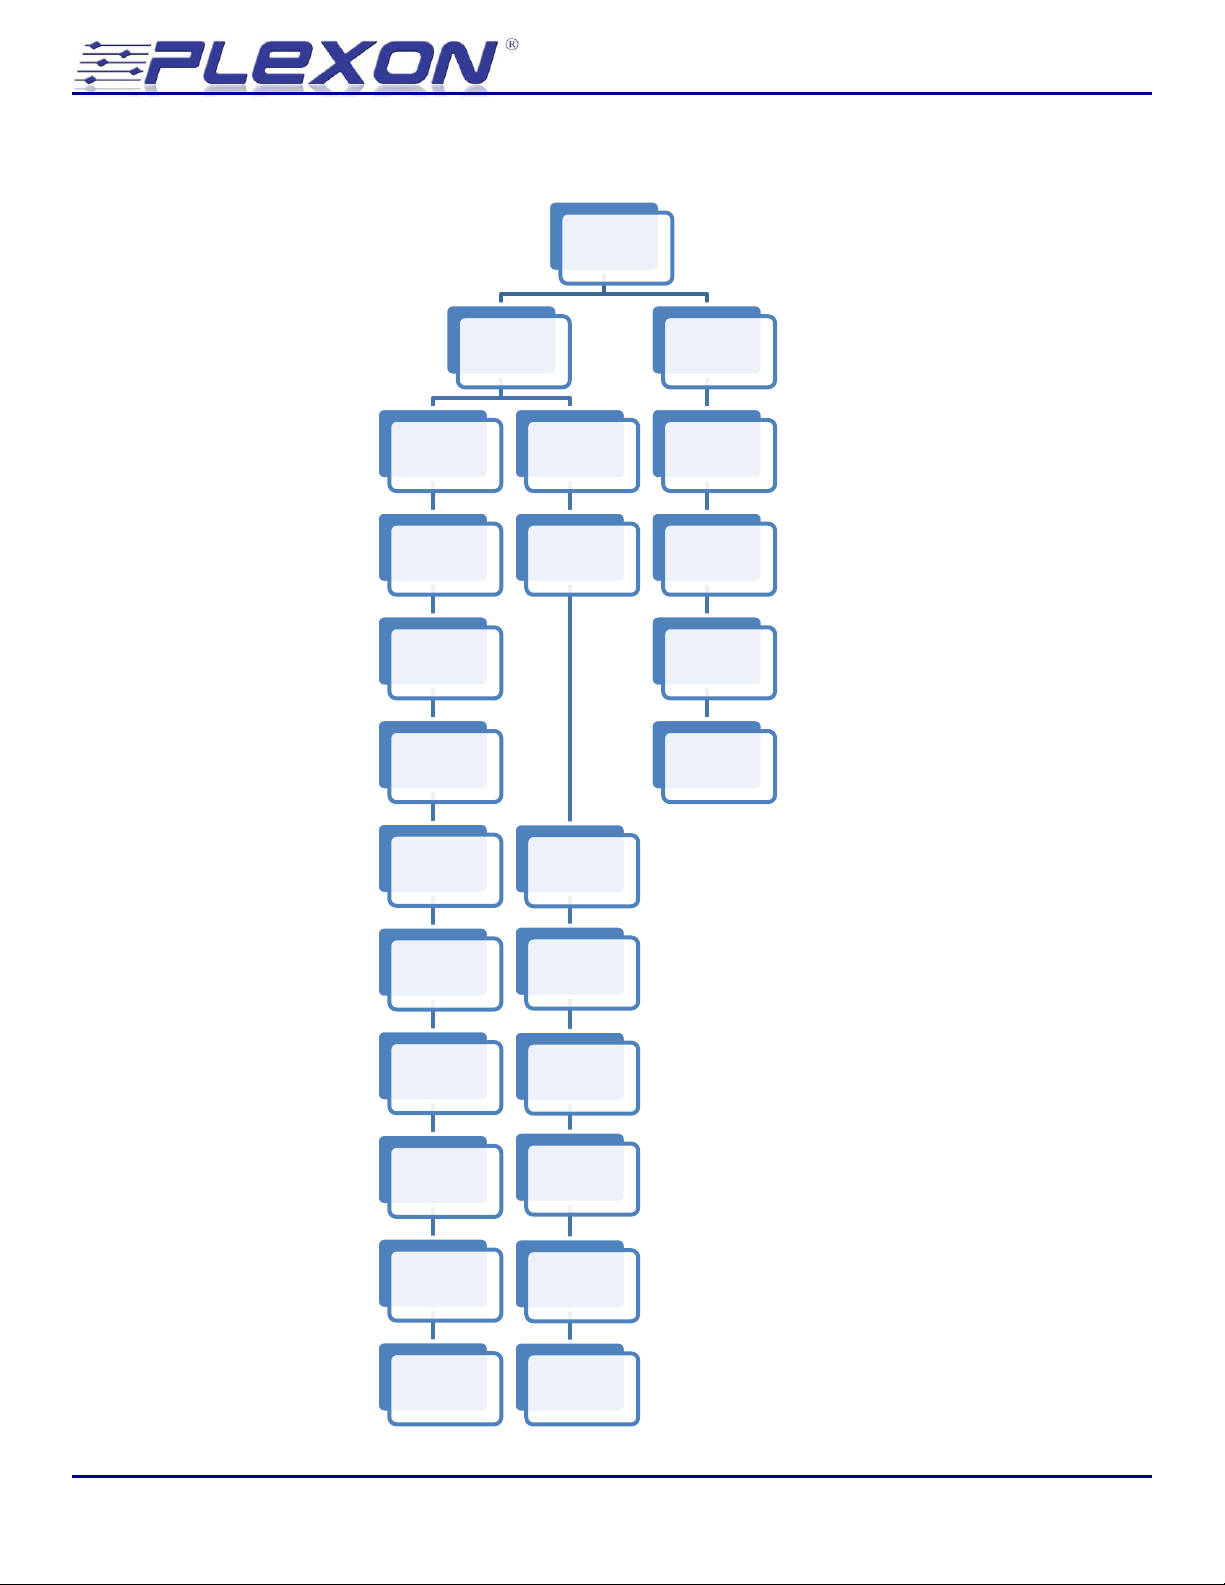
The flowchart in section 5.2 presents the basic operational steps for using Stimulator 2.0.
© Plexon Inc - 15 -
Page 16
Neurotechnology Research Systems
Start Stim 2
Software
Function
Stimulate
Rectangular
Pulses
First phase
amplitude
and width
Interphase
delay
Second phase
amplitude
and width
Number of
pulses
Rate
Trigger Mode
Load
Start
Monitor
Arbitrary
Waveform
Load File
Number of
pulses
Rate
Trigger Mode
Load
Start
Monitor
Function
Z Test
Automatically
loads
waveform
Start
Vmon Scaling
Monitor
5.2 Operational Flowchart
Stimulator 2.0 - 16 -
Page 17
Neurotechnology Research Systems
5.3 Launching the Stimulator 2.0 software
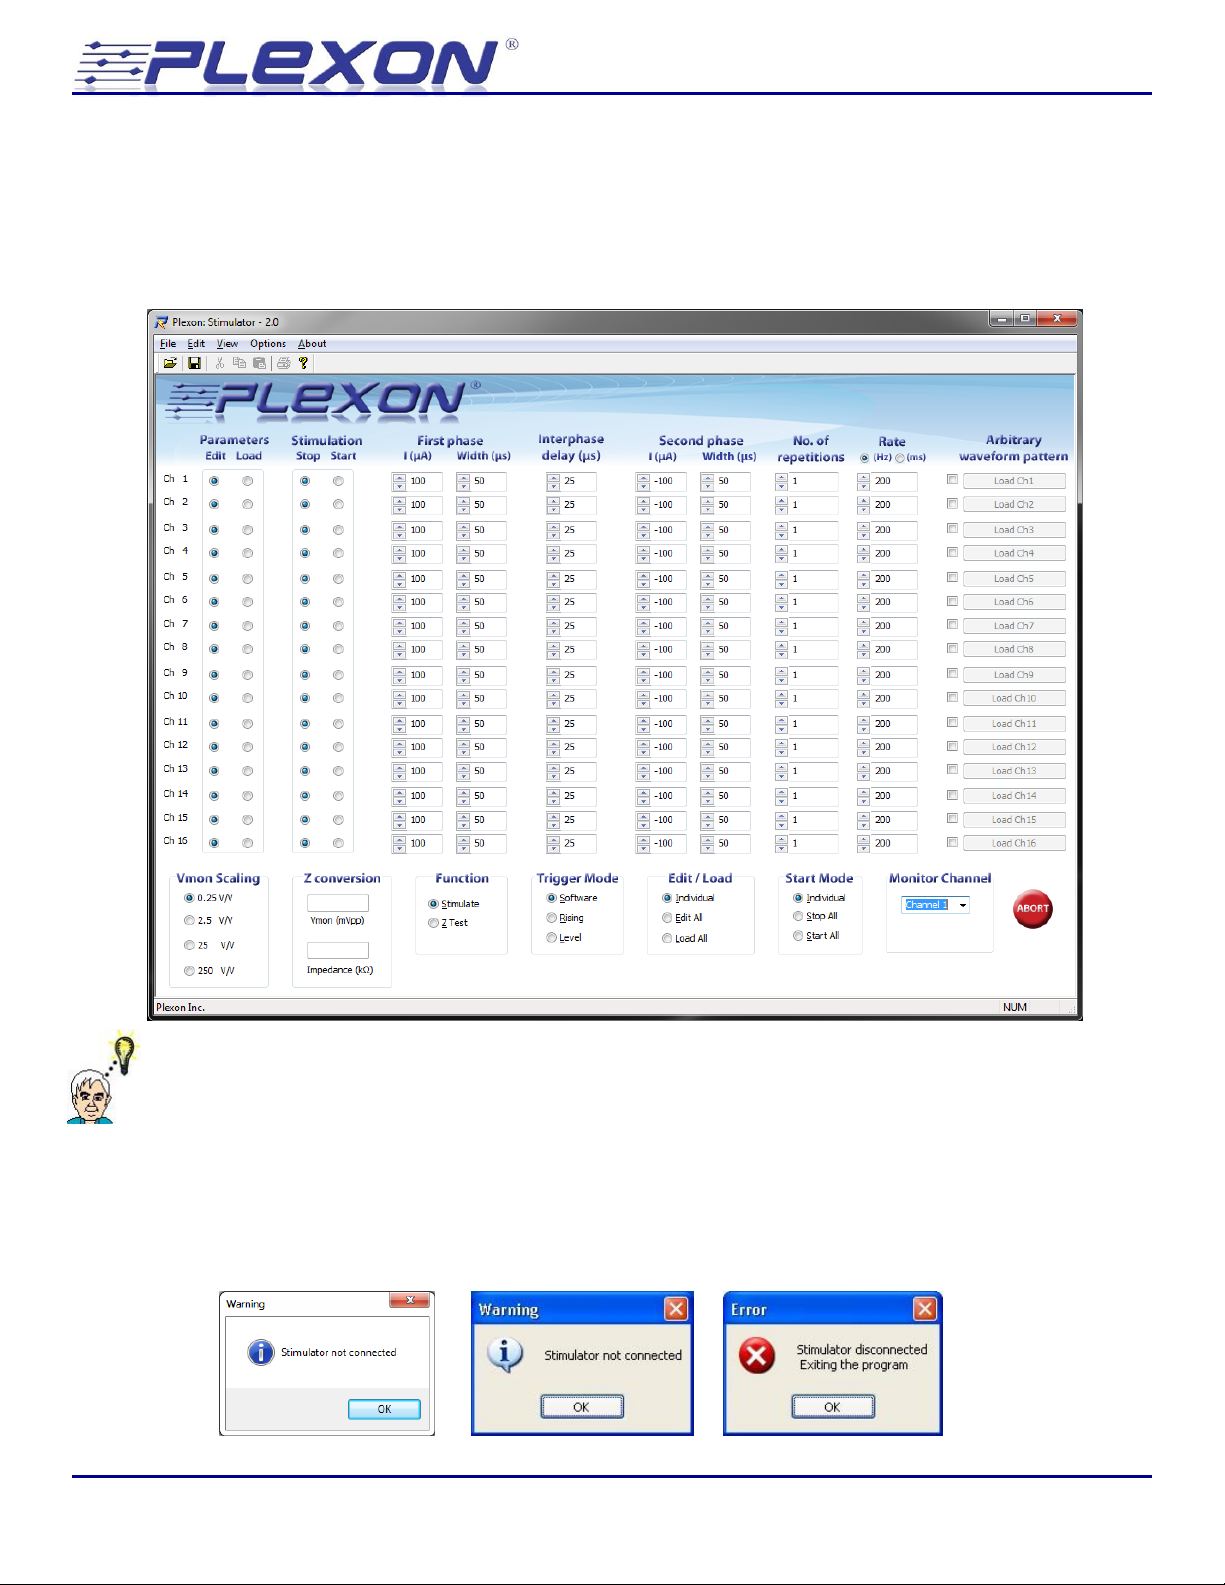
Make sure the stimulator is connected to the computer and turned on. Then launch the Stimulator
2.0 software by double clicking on the desktop icon. You should see the factory default graphical
user interface as shown in the figure below:
Hint: You may load the factory default configuration at any time by selecting Open from the File
menu and then selecting the configuration file “Factory_Default.stm”. By default this file is installed
in the directory C:\PlexonData\Stim-2\Configuration files.
Note that if the USB cable is not connected to the stimulator or if the stimulator power is turned off
when the software is started then and error message will appear. Likewise, if the USB cable is
disconnected or the stimulator power is turned off while the software is running an error message
will appear and the program will close:
© Plexon Inc - 17 -
Page 18
Neurotechnology Research Systems
5.4 Creating a burst of rectangular pulses
For each channel there is a row of channel specific controls and then at the bottom of the interface
there are additional global controls. These controls are described individually in detail in section 6
of the manual. In this section, only the controls required for generating rectangular pulses using
the GUI controls are discussed.
The first step is to configure the stimulation parameters for a single channel. We will start off
configuring channel 1 to generate a bi-phasic rectangular pulse that repeats indefinitely at a rate of
200 Hz.
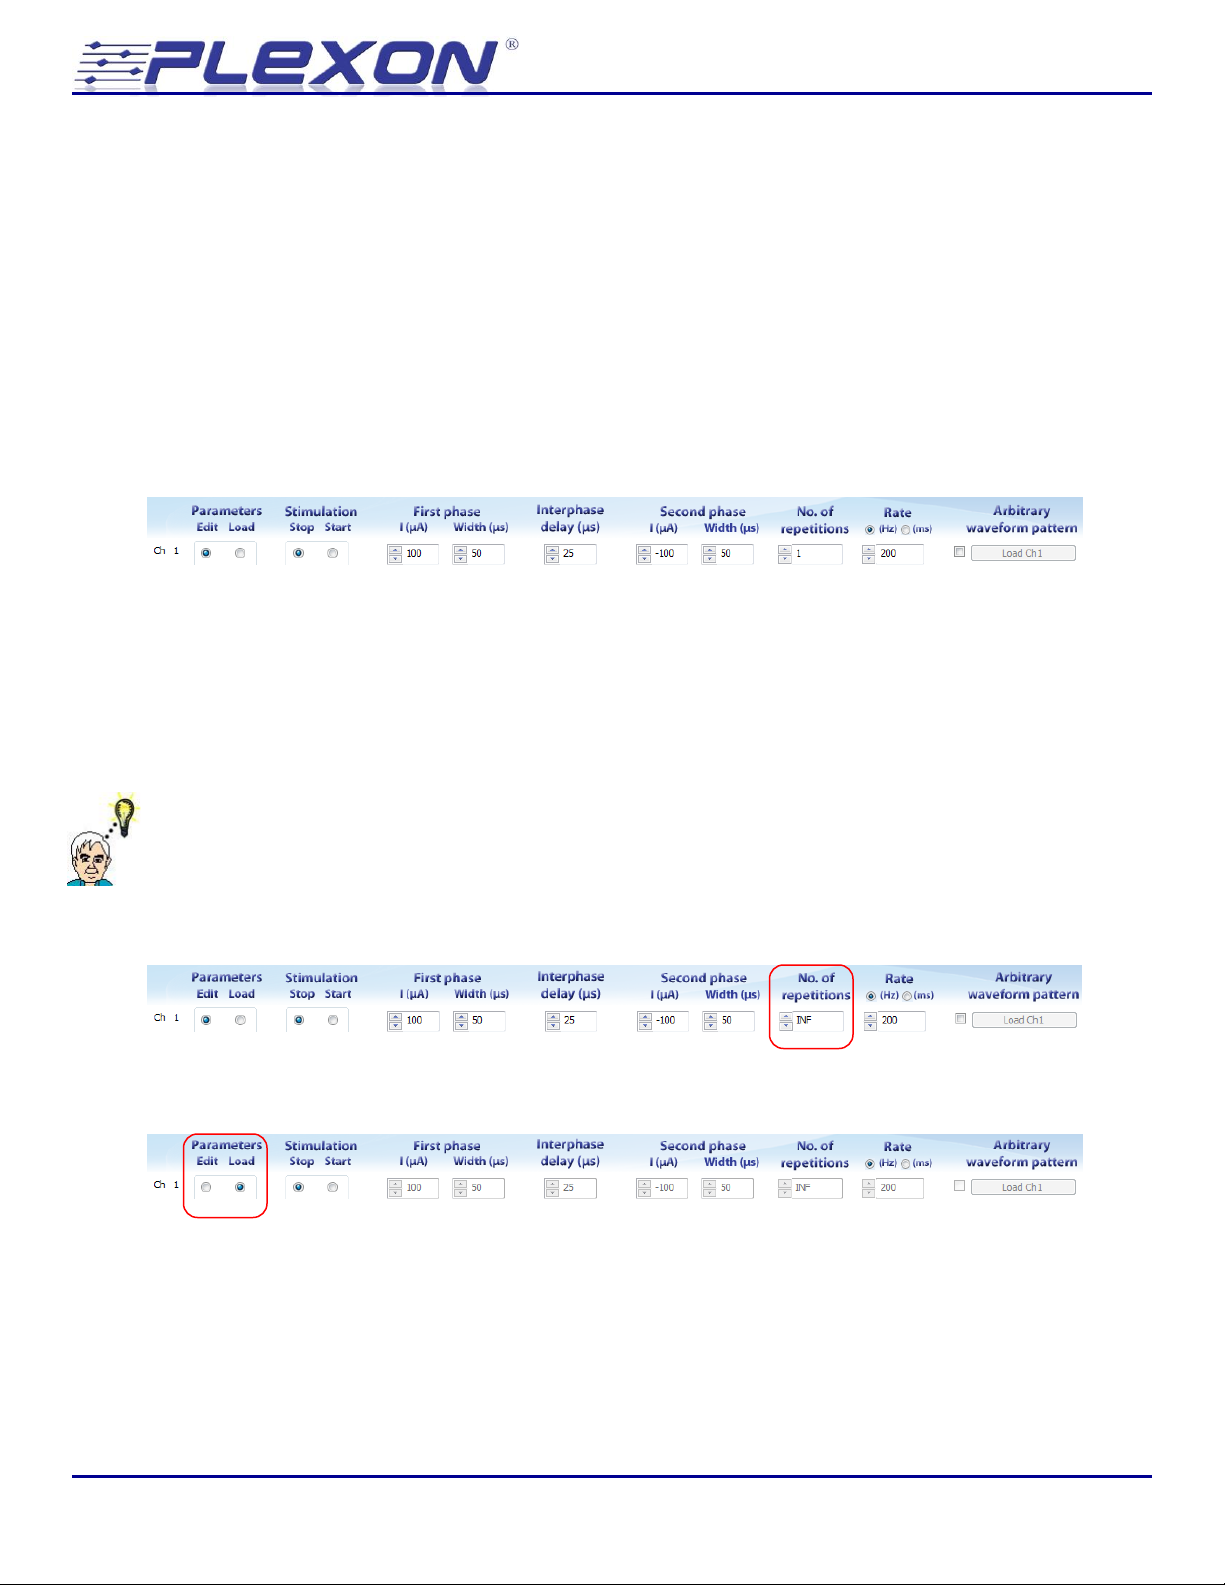
Examine the controls for channel 1:
The default configuration specifies a single biphasic pulse with a short inter-phase delay. The first
phase is +100 µA for 50 µs, the inter-phase is 0 µA for 25 µs, and the second phase is –100 µA for 50
µs.
To make it easier to see on the oscilloscope, we want to generate a continuously repeating pulse
instead of a single pulse. Locate the “No. of repetitions” control at the right hand side of the row of
controls and type “INF” in the control:
Hint: If the No. of repetitions control is set to “1” and you press the down arrow, the control will
change to “INF”. You can also type “0” in the control and when you click on any other control the 0
will change to INF.
The controls for channel 1 should now look like this:
The next step is to download the stimulation parameters into the stimulator hardware. Click on the
“Load” button at the far the left of the row of controls:
Note that the GUI controls for configuring the pulse parameters become grayed out once the
channel has been loaded. To change the parameters you must go back to “edit” mode.
Stimulator 2.0 - 18 -
Page 19
Neurotechnology Research Systems
50 µs
50 µs
25 µs
+250 mV @ I
MON
= +100 µA @ electrode
–250 mV @ I
MON
= –100 µA @ electrode
Once the parameters for a channel have been loaded you may start the stimulation by clicking on
the “start” button:
The stimulation begins, and because the number of repetitions is set to infinite, the pulses will
continue until the “Stop” (or “Edit”) button is pressed.
5.5 Verifying the output on an oscilloscope
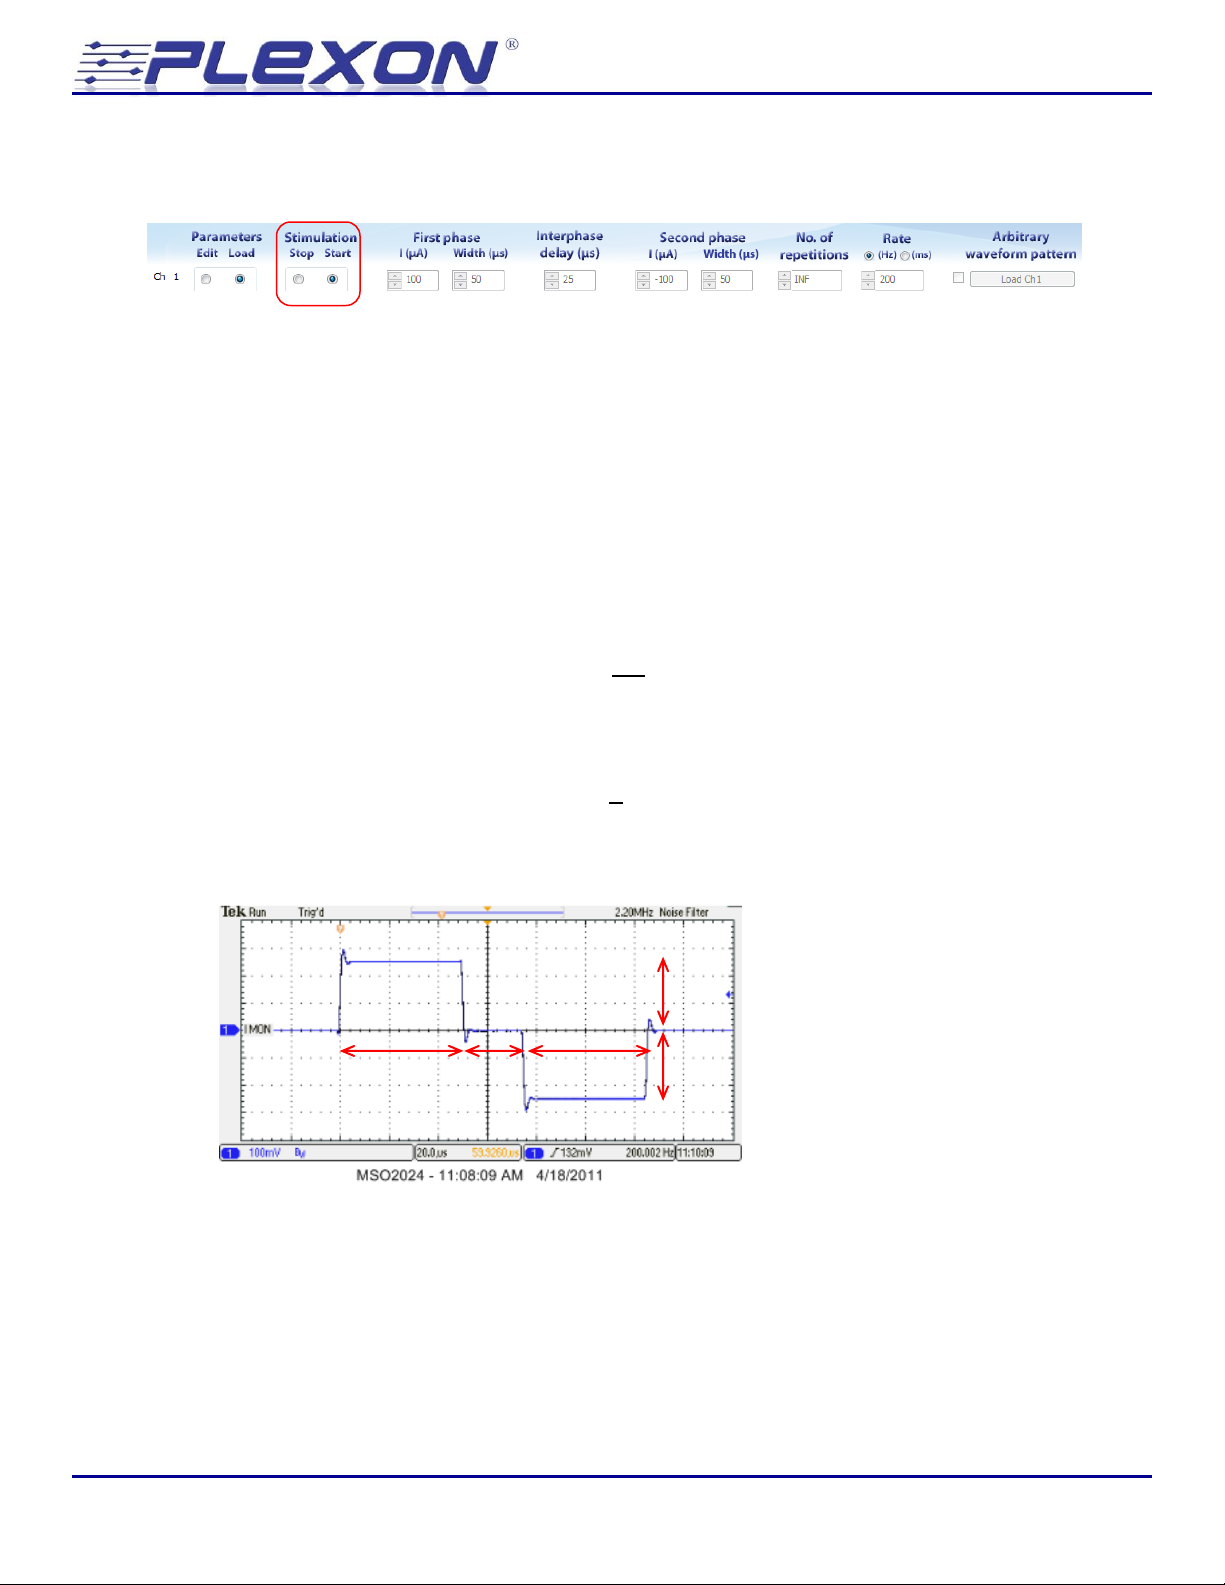
Now examine the current and voltage waveforms on an oscilloscope to see if they make sense. Note
that both the current and voltage monitors output a voltage signal and that there is a scaling factor
that relates what you see on the monitor output to what is happening at the electrode. The scale
factor for the current monitor is 2.5 mV/µA and by default the scale factor for the voltage monitor is
0.25 V/V. That means that if there is a 100 µA current flowing into the electrode from the
stimulator, the current monitor will read:
Likewise, if the stimulator was applying 1V to the electrode, the voltage monitor would read:
The current monitor waveform you see should appear similar to the figure below:
At the beginning of the pulse, the current monitor (I
) jumps from 0 mV to +250 mV and stays at
MON
+250 mV for 50 µs. Then the current monitor drops back to 0 mV for 25 µs and finally drops to
−250 mV for 50 µs. Considering the 2.5 mV / µA scaling factor on the current monitor these 250 mV
steps represent current steps of 100 µA as expected from our channel configuration settings. The
durations also match our settings.
© Plexon Inc - 19 -
Page 20
Neurotechnology Research Systems
V
ACCESS
V
CHARGE
50 µs
50 µs
25 µs
+266 mV @ V
MON
= 1.06 V @ electrode
+125 mV @ V
MON
= 500 mV @ electrode
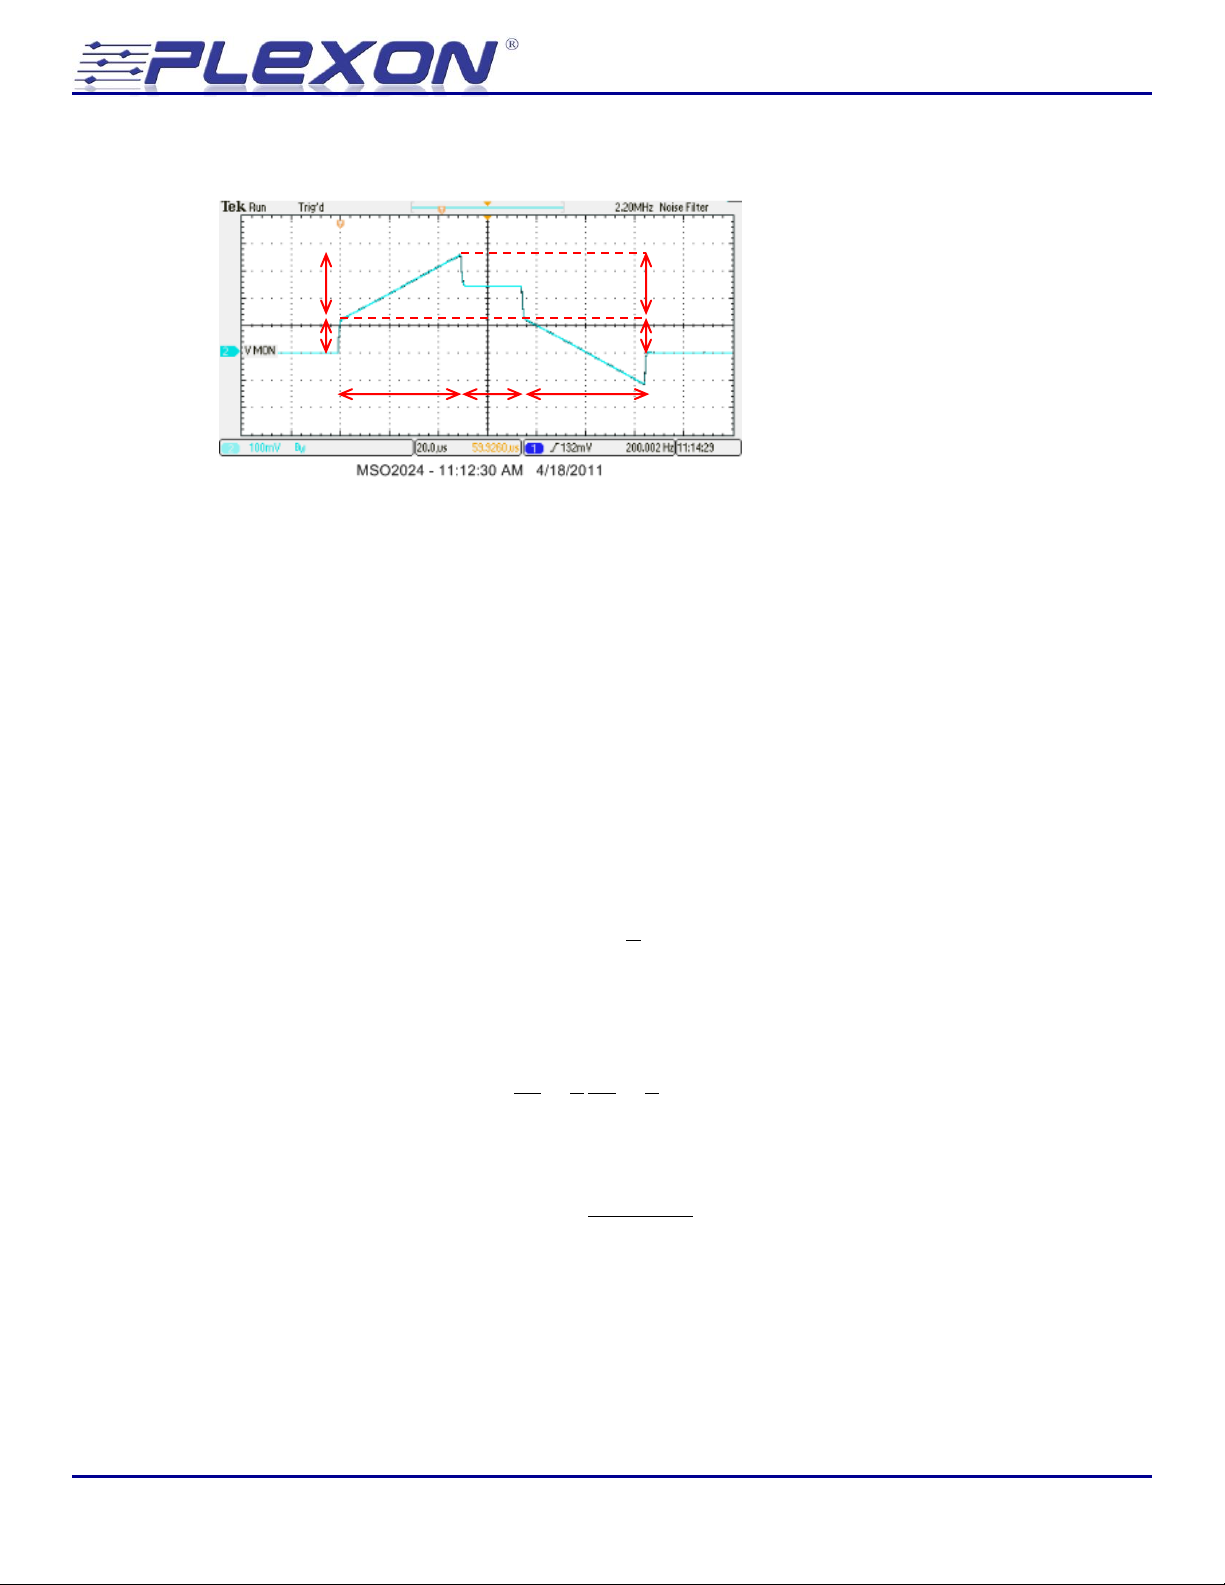
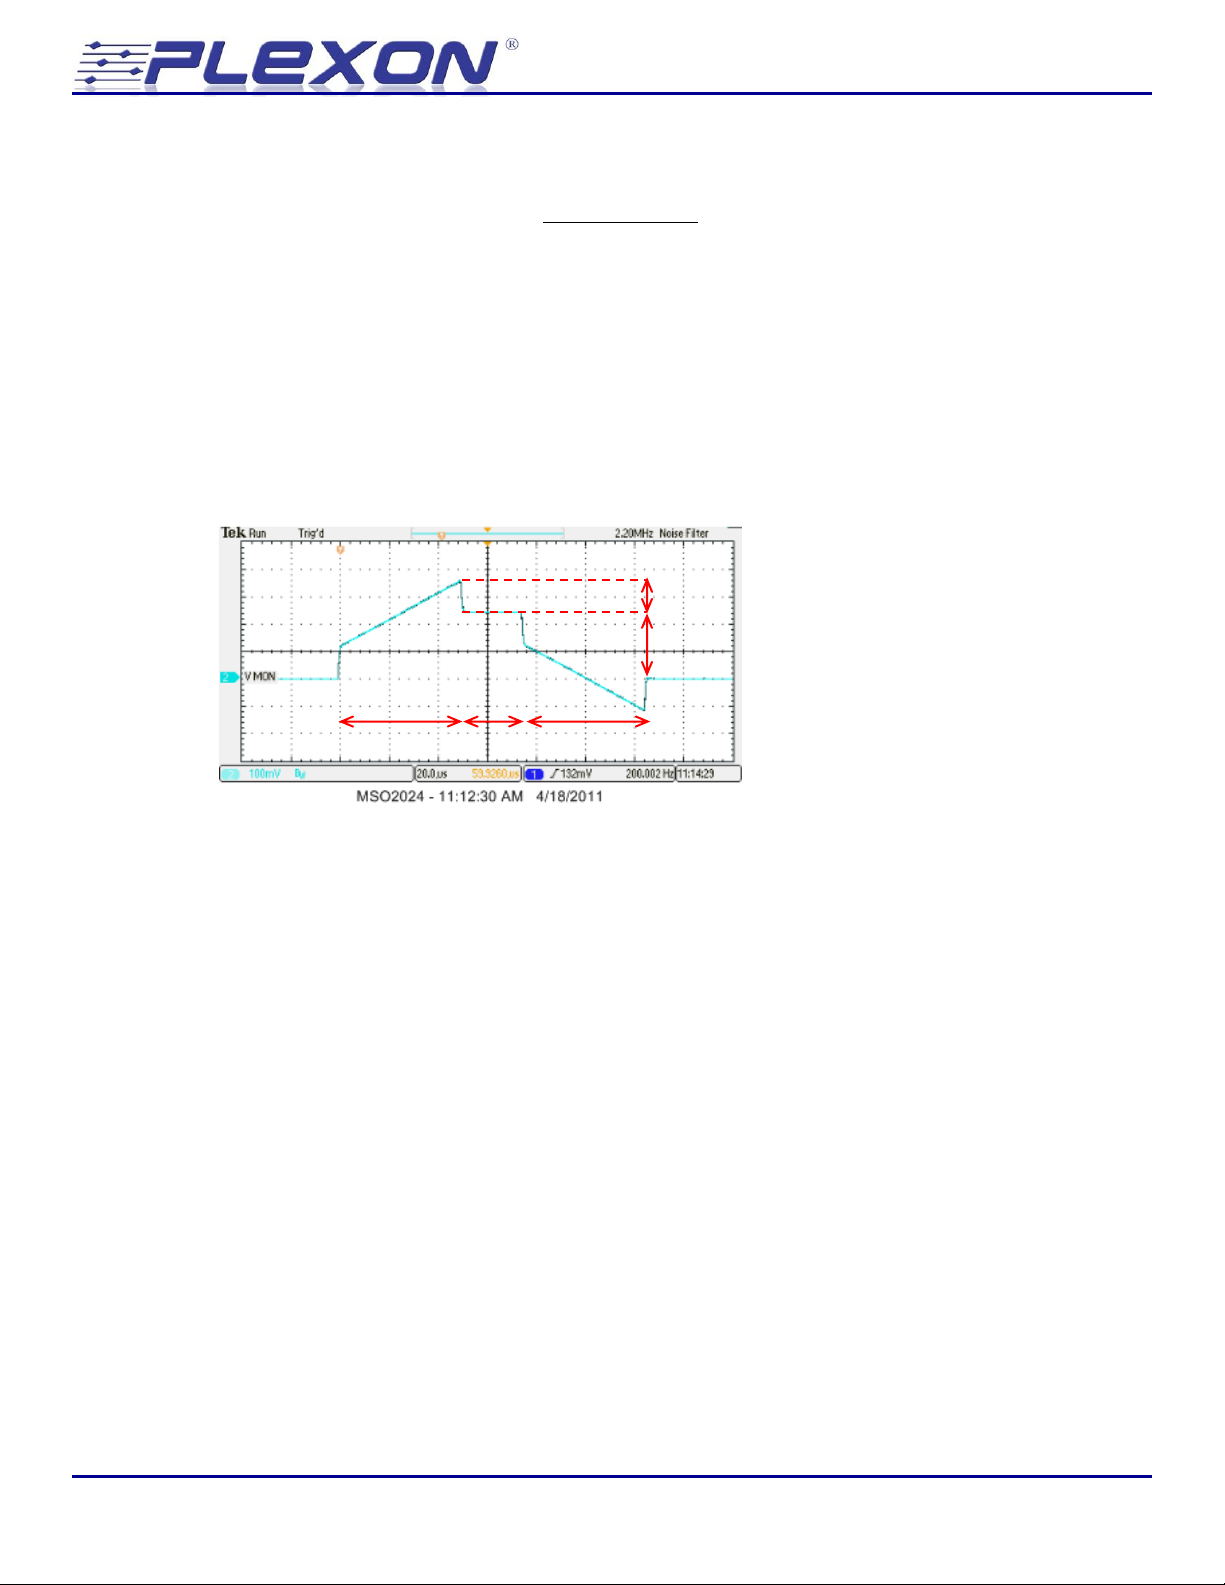
The output of the voltage monitor is a bit more interesting:
At the beginning of the pulse, the voltage monitor (V
) jumps from 0 mV to +125 mV, then
MON
linearly increases another 266 mV over the 50 µs duration of the first phase. Considering the
default scaling of the voltage monitor, the voltage at the electrode initially jumps 500 mV and then
increases another 1.06 V over the course of the 50 µs pulse.
The initial jump in the electrode voltage is due to a property of the electrode called “access
resistance”. In order to drive a current I into the electrode, we must apply a voltage V to the
electrode that satisfies Ohm’s law with respect to the access resistance of the electrode:
The subsequent rise in electrode voltage during the first phase of the pulse is due to charging of the
electrode “capacitance”. By definition, the capacitance of the electrode relates the voltage on the
electrode to the amount of charge deposited on the electrode:
Therefore, the rate at which the electrode voltage changes during the pulse is directly proportional
to the amount of current applied to the electrode and the capacitance of the electrode:
Stimulator 2.0 - 20 -
The change in electrode voltage during the first phase of the pulse is thus given by:
The access resistance and capacitance of the model electrodes on the test board are 4.99 k and
4700 pF respectively. Therefore the expected initial voltage jump for a 100 µA current is:
Page 21
Neurotechnology Research Systems
50 µs
50 µs
25 µs
V
ACCESS
= 500 mV @ electrode
V
CHARGE
= 1.06 V @ electrode
The expected voltage rise over the 50 µs duration 100 µA first phase of the pulse is:
These calculated values are in agreement with the observations from the voltage monitor.
Note also that when the current stops flowing at the end of the first phase the voltage immediately
drops by the same amount that it jumped at the beginning of the pulse (V
). The current during
ACCESS
the interphase period is zero. With no current flowing into the electrode, there is no voltage drop
across the electrode access resistance. Therefore the voltage during the inter-phase period is the
same as V
. Since there is no current during the inter-phase period the voltage also remains
CHARGE
constant during this period.
© Plexon Inc - 21 -
Page 22
Neurotechnology Research Systems
~600
1000 µs
~400
+250 mV @ I
MON
= +100 µA @ electrode
–250 mV @ I
MON
= –100 µA @ electrode
5.6 Compliance voltage and stimulation failure
It is important to monitor the electrode voltage during stimulation to verify that the desired
stimulation pattern was successfully applied to the electrode. There is a maximum voltage that the
stimulator can output called the compliance voltage. Once the voltage on the electrode reaches the
compliance voltage, the stimulator can no longer drive current into the electrode. The successful
delivery of a given stimulation protocol will depend on the amplitude of the current pulse, the
duration of the pulse, the stimulator compliance limit, and the properties of the electrode.
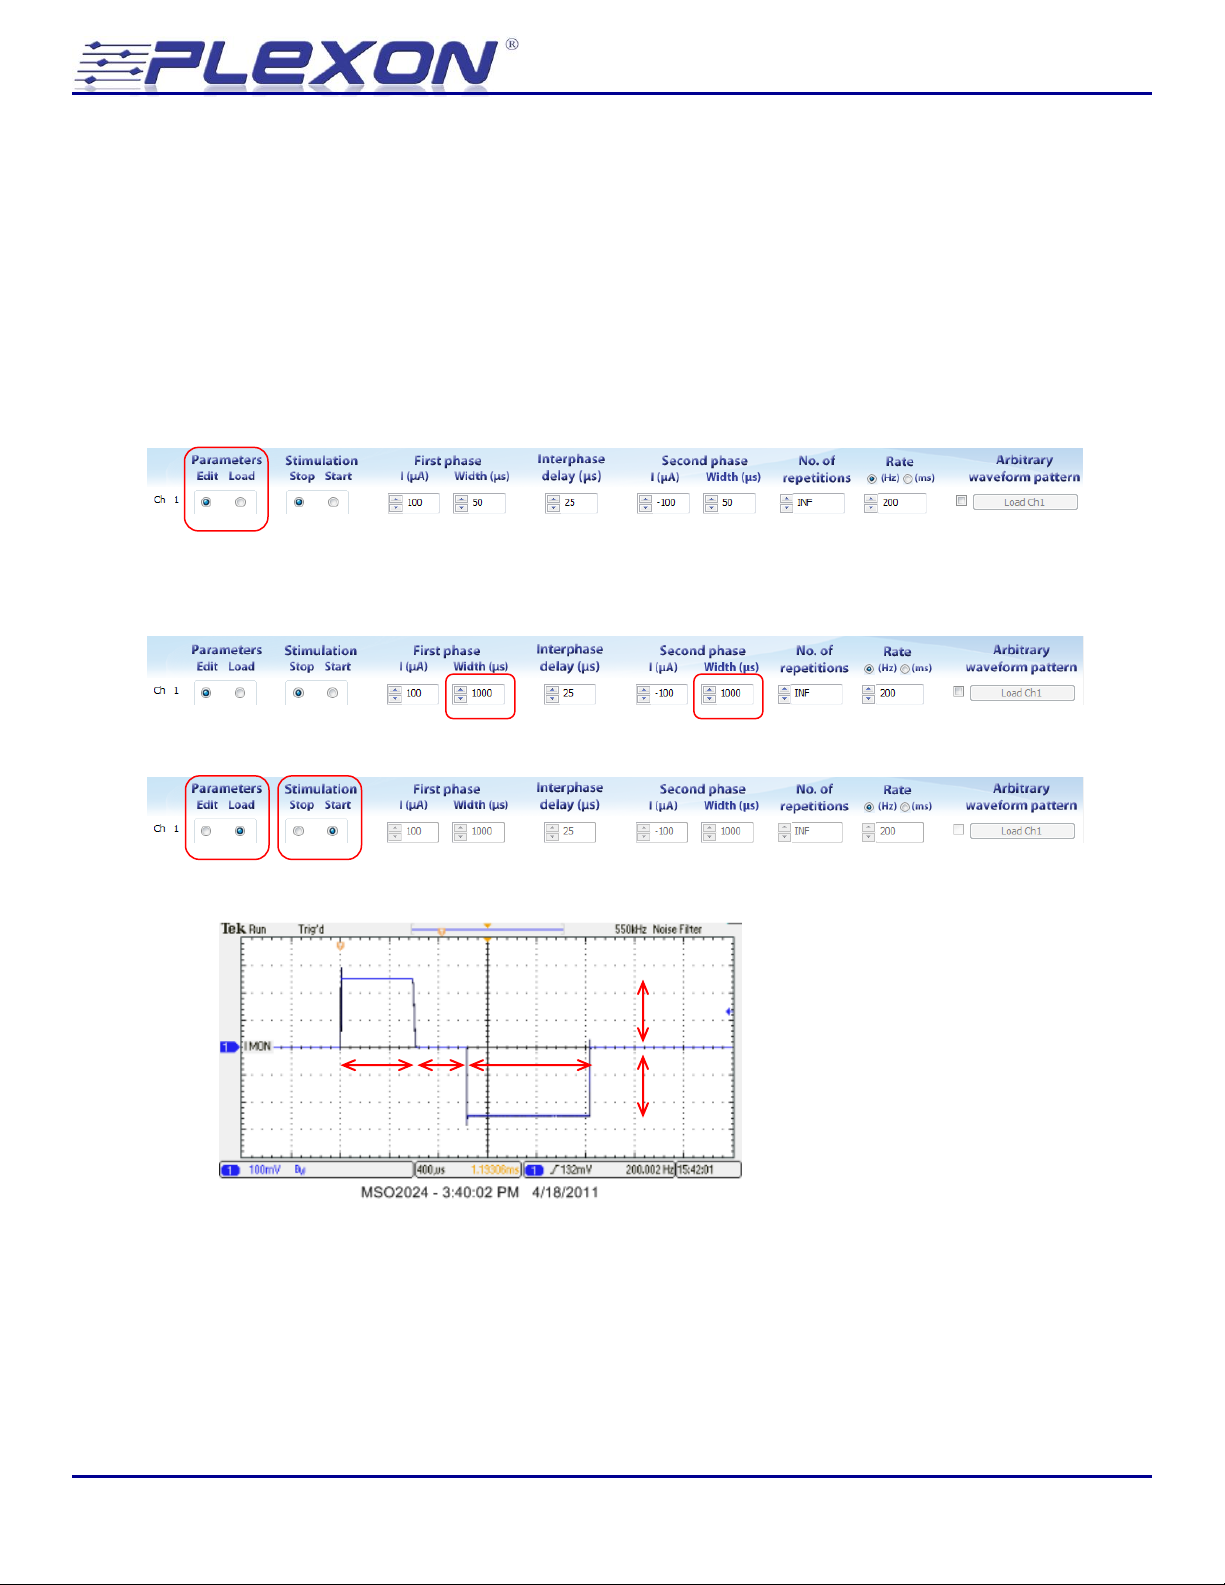
To see this effect, first stop the ongoing stimulation by pressing the “Edit” button for channel 1:
This stops the stimulation and returns the controls for channel to edit mode.
Next, increase the first phase width and second phase width parameters to 1000 µs:
Then “Load” and “Start” channel 1:
Observe the current monitor output on the oscilloscope:
Although the amplitude of the first phase still looks okay the duration appears to be too short and
the duration of the inter-phase period appears to be too long.
Stimulator 2.0 - 22 -
Page 23
Neurotechnology Research Systems
~600
1000 µs
~400
3.25 V @ V
MON
= 13 V @ electrode
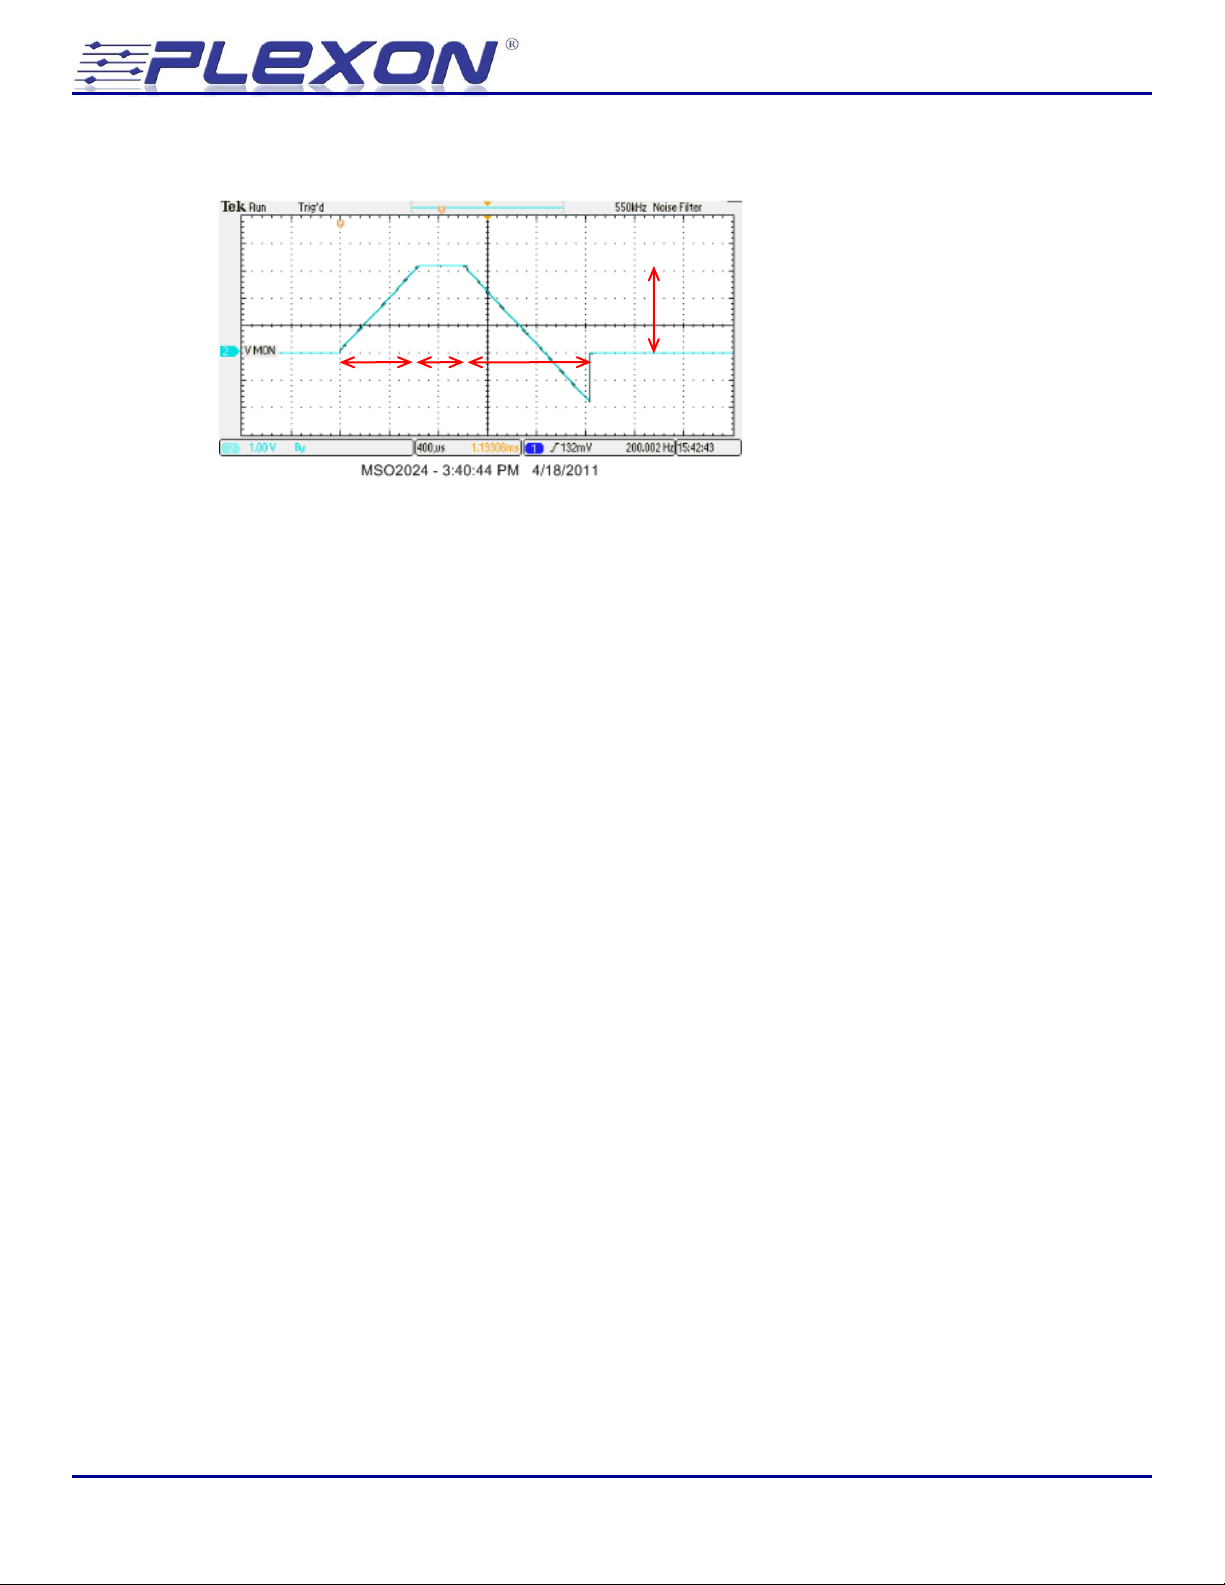
To understand what is happening it is necessary to examine the voltage monitor output:
Notice that for the first ~ 600 µs, the voltage is increasing but that in the next ~ 400 µs the voltage
has reached a plateau of approximately 13V at the electrode (3.25 V at the monitor channel). At
this point, the compliance limit has been reached, and the output current, as seen on the current
monitor, drops to zero. The voltage however stays at its maximum value just to maintain the
electrode in its charged state.
This example clearly illustrates the importance of monitoring the electrode during stimulation.
Monitoring the electrode is necessary to verify that the actual output from the stimulator matches
the programmed response.
© Plexon Inc - 23 -
Page 24
Neurotechnology Research Systems
Discharged
Not discharged
V
5.7 Automatic electrode discharge
Take another look at the current monitor output shown in section 5.6. As we saw there, the first
phase current delivery was cut short because the voltage hit the compliance limit. The amount of
charge deposited on the electrode during this phase was less than requested. Now look at the
amount of charge removed from the electrode during second phase of the pulse. The amount of
charge removed from the electrode during the second phase exceeds the amount of charge
deposited during the first phase. Consequently net charge was removed from the electrode during
the stimulation pulse. Even though the pulse was designed to be charge balanced the actual
delivery of the pulse was not balanced.
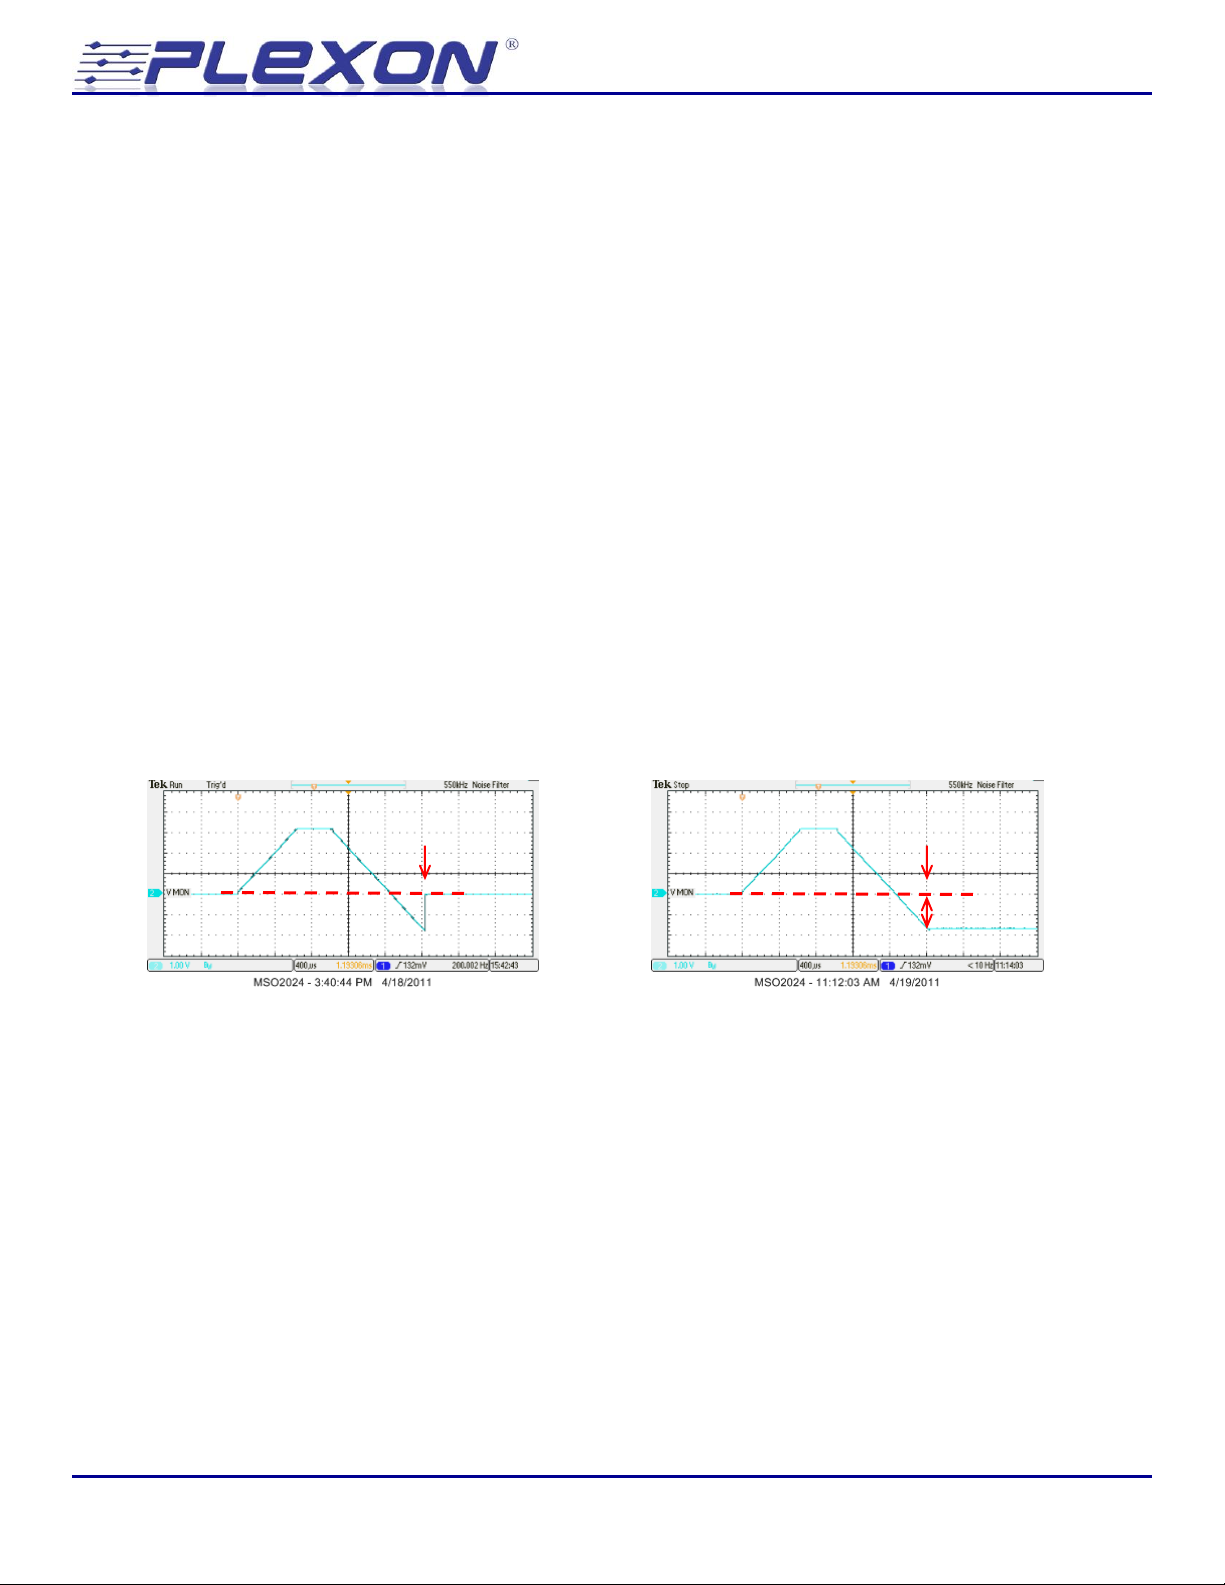
Take another look at the voltage monitor output. Notice that it returns to zero after the end of the
pulse. Ordinarily, if the pulse delivery was not balanced and charge was left on the electrode then
the voltage of the electrode would change after each pulse. The only reason that this does NOT
happen in the figures above is that the stimulator has an automatic electrode discharge feature. By
default the stimulator automatically discharges the electrode during the inter-pulse interval (in
between pulses) and any time the channel is not stimulating (i.e. whenever the channel is in stop or
edit mode). As an option for advanced users, the automatic electrode discharge during the interpulse interval may be disabled. With this feature turned off, the voltage on the electrode does in
fact change after an un-balanced pulse delivery. This is easily seen on the voltage monitor as shown
in the figure on the right below.
Automatic electrode discharge turned on (default) Automatic electrode discharge turned off
Refer to section 6.14, Options: Discharge Mode for additional details.
Stimulator 2.0 - 24 -
Page 25
Neurotechnology Research Systems
5.8 Arbitrary Waveforms & Complex Rectangular Pulses
The graphical user interface provides simple controls for creating bi-phasic rectangular pulses and
bursts of identical pulses. More complicated stimulation patterns can be loaded from user-defined
“arbitrary waveform pattern” text files. The arbitrary waveform pattern can be used to create a
complex stimulation pattern like an action potential and can also be used to create more
complicated patterns of rectangular pulses than can be defined using the front panel GUI controls.
The format of the arbitrary waveform text file is defined in section 6.5.
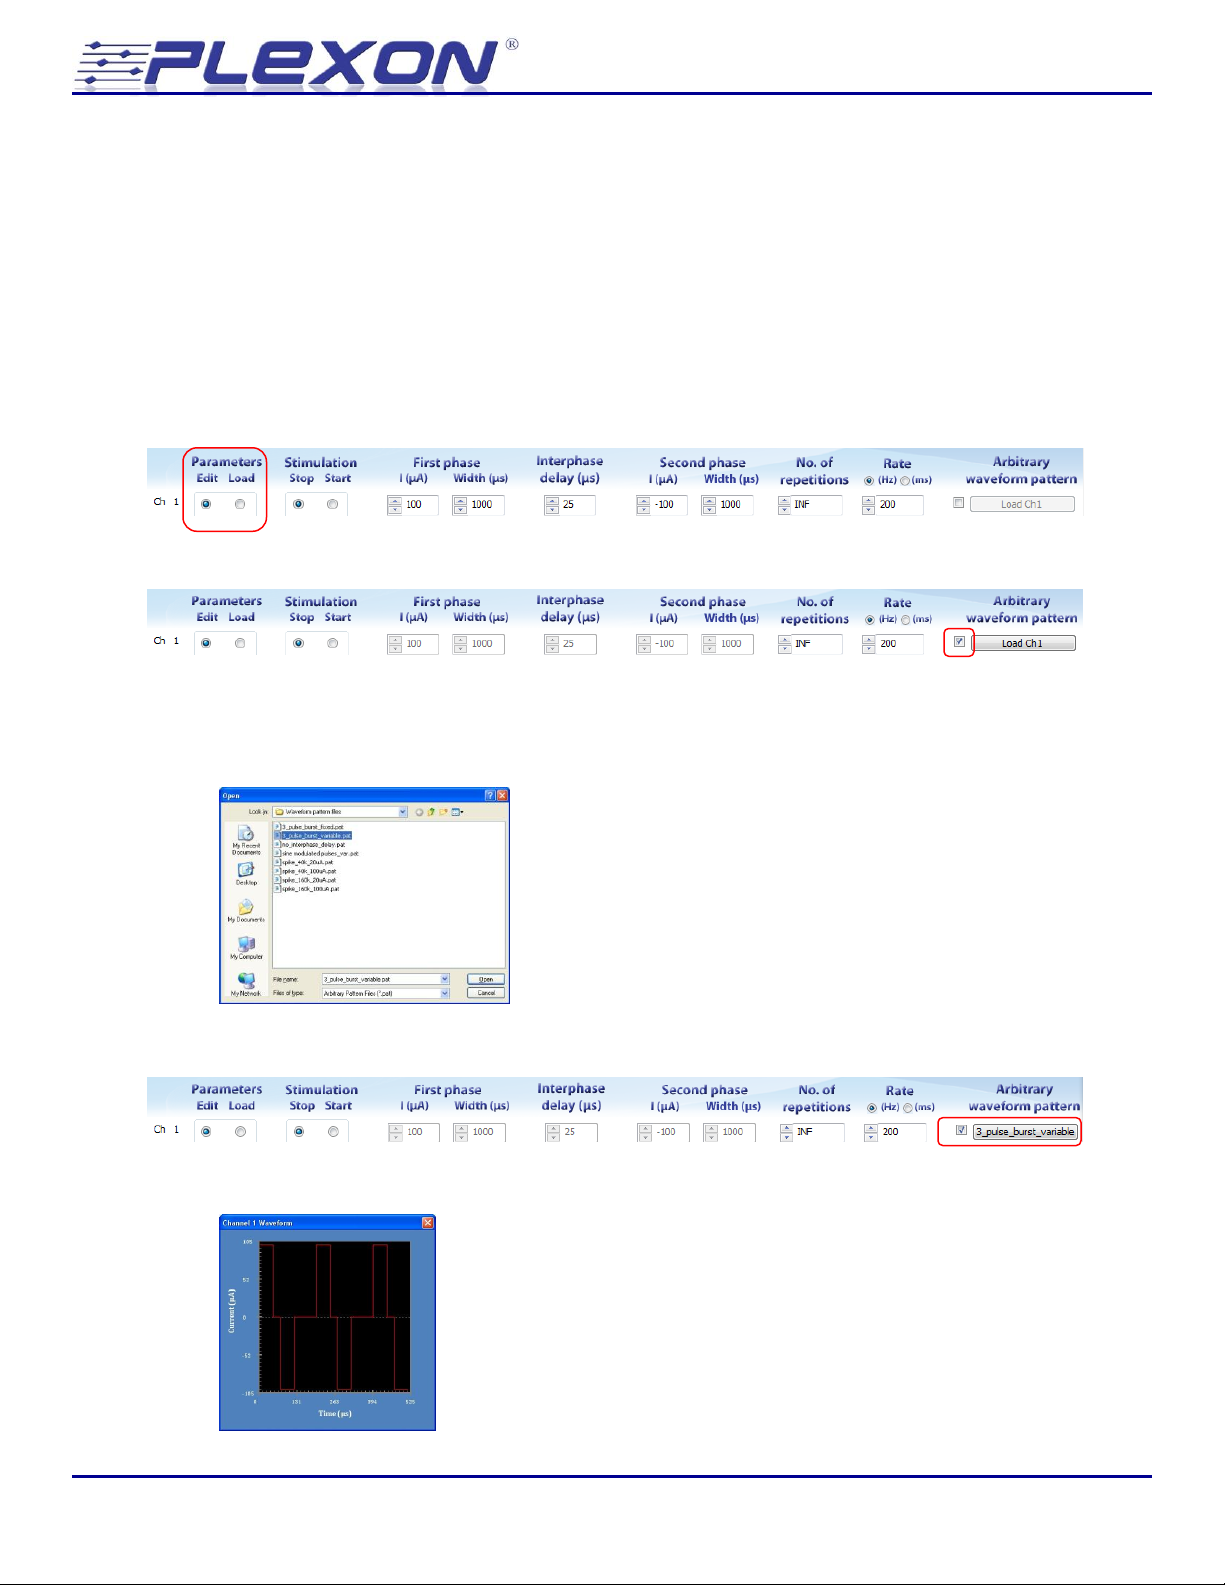
To load an arbitrary waveform for channel 1, make sure the channel is in the “edit” mode:
Then click on the check box on the right next to where it says “Arbitrary waveform pattern”:
The GUI controls for defining a simple rectangular pulse become grayed out and the “Load Ch1”
button becomes active. Click the “Load Ch1” button to open a file selection dialog and then select
the file “3_pulse_burst_variable.pat”:
The text in the button changes from “Load Ch1” to the name of the name of the file selected:
A graphical representation of the waveform is displayed:
© Plexon Inc - 25 -
Page 26
Neurotechnology Research Systems
Rate (1000 Hz = 1 ms)
One waveform
Repeated twice (No. of pulses = 2)
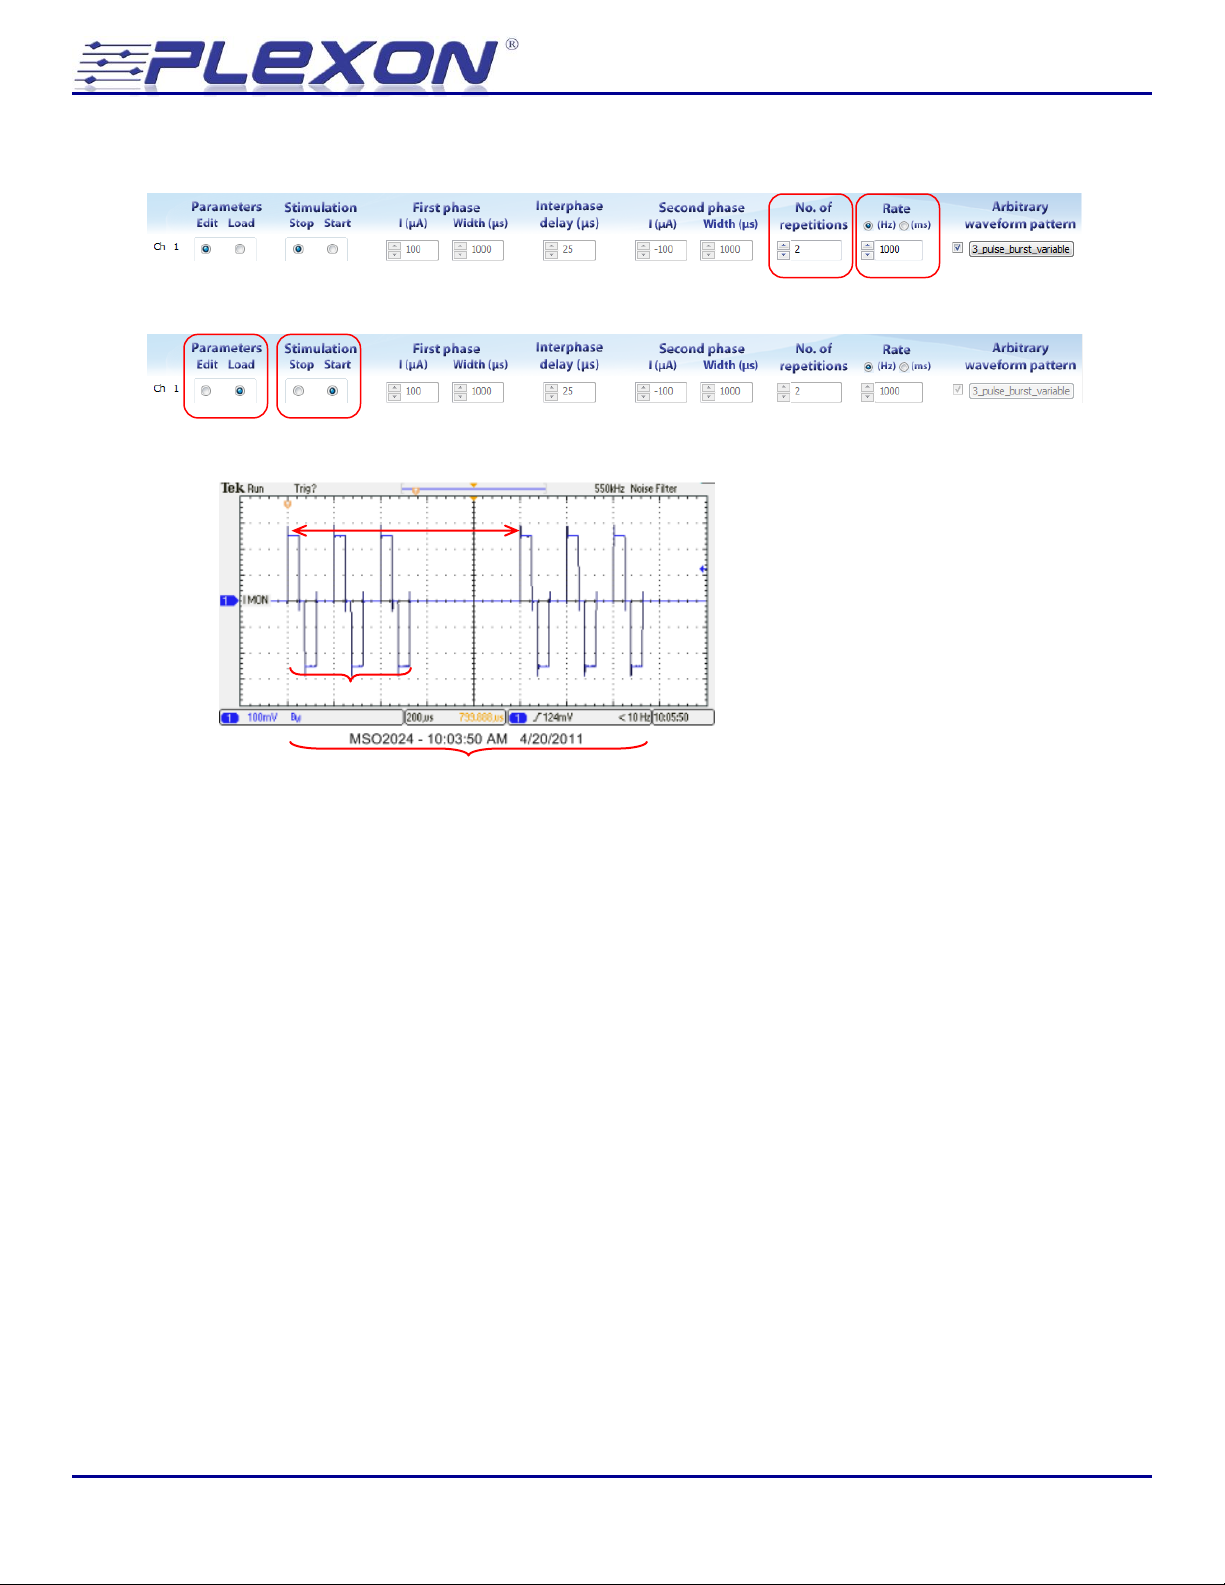
Change the “No. of repetitions” to be 2 and the “Rate” to 1000 Hz:
Then “Load” and “Start” the channel:
The output of the stimulator is:
Stimulator 2.0 - 26 -
Page 27
Neurotechnology Research Systems
5.9 Impedance measurement
Impedance measurement is a typical means of characterizing electrodes. Impedance measurement
is typically accomplished by applying a very low amplitude sinusoidal current to the electrode and
monitoring the resulting voltage developed across the electrode. The stimulator has a special
impedance measurement (Z-test mode) that automatically generates a ±100 nA 1 kHz sinusoid for
impedance testing.
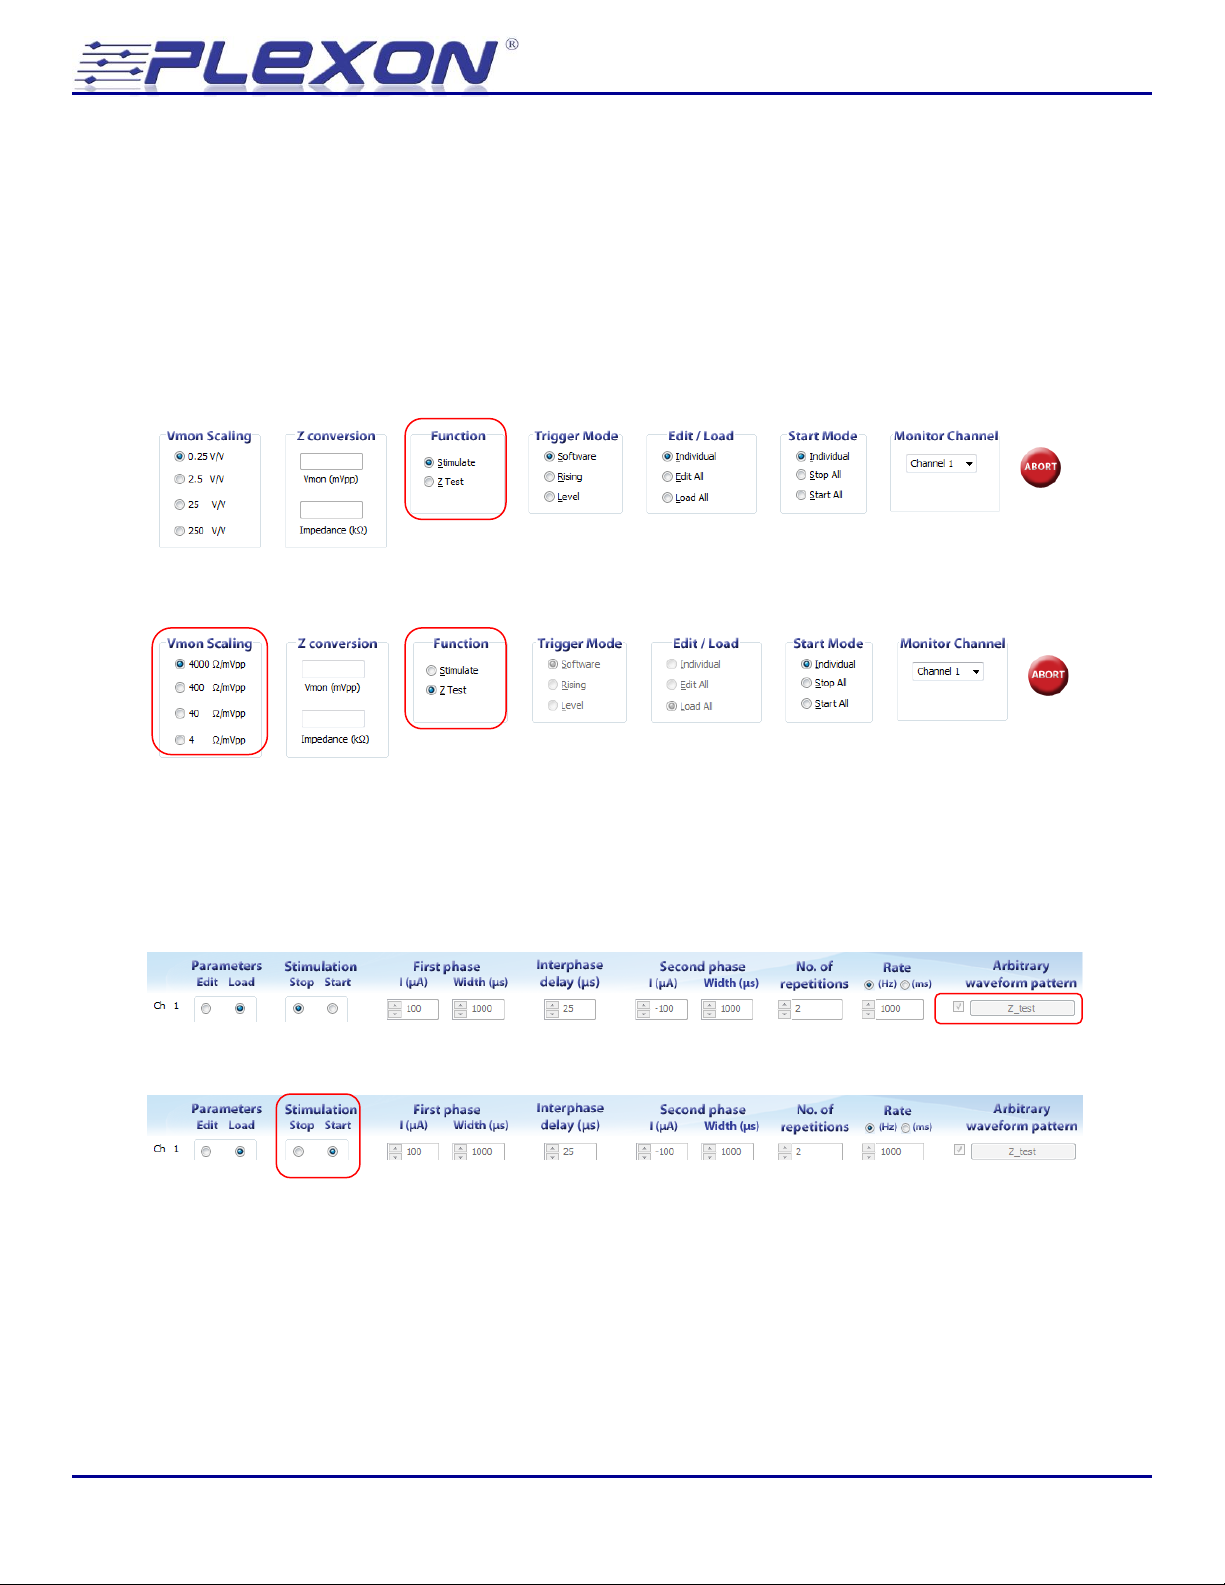
Locate the “Function” control towards the bottom of the GUI:
Press the “Z-test” button to put the stimulator in impedance test mode:
Notice that the Vmon scaling control changes and the default setting is now 4000 /mVpp.
The controls for all channels become grayed out and a pre-defined arbitrary waveform pattern
called “Z-test” that codes for a ±100 nA 1 kHz sinusoidal current is automatically loaded for every
channel:
Click the start button to begin generating the sinusoidal current on channel 1:
© Plexon Inc - 27 -
Page 28
Neurotechnology Research Systems
7.6 mVpp @ V
MON
76.8 mVpp @ V
MON
856 mVpp @ V
MON
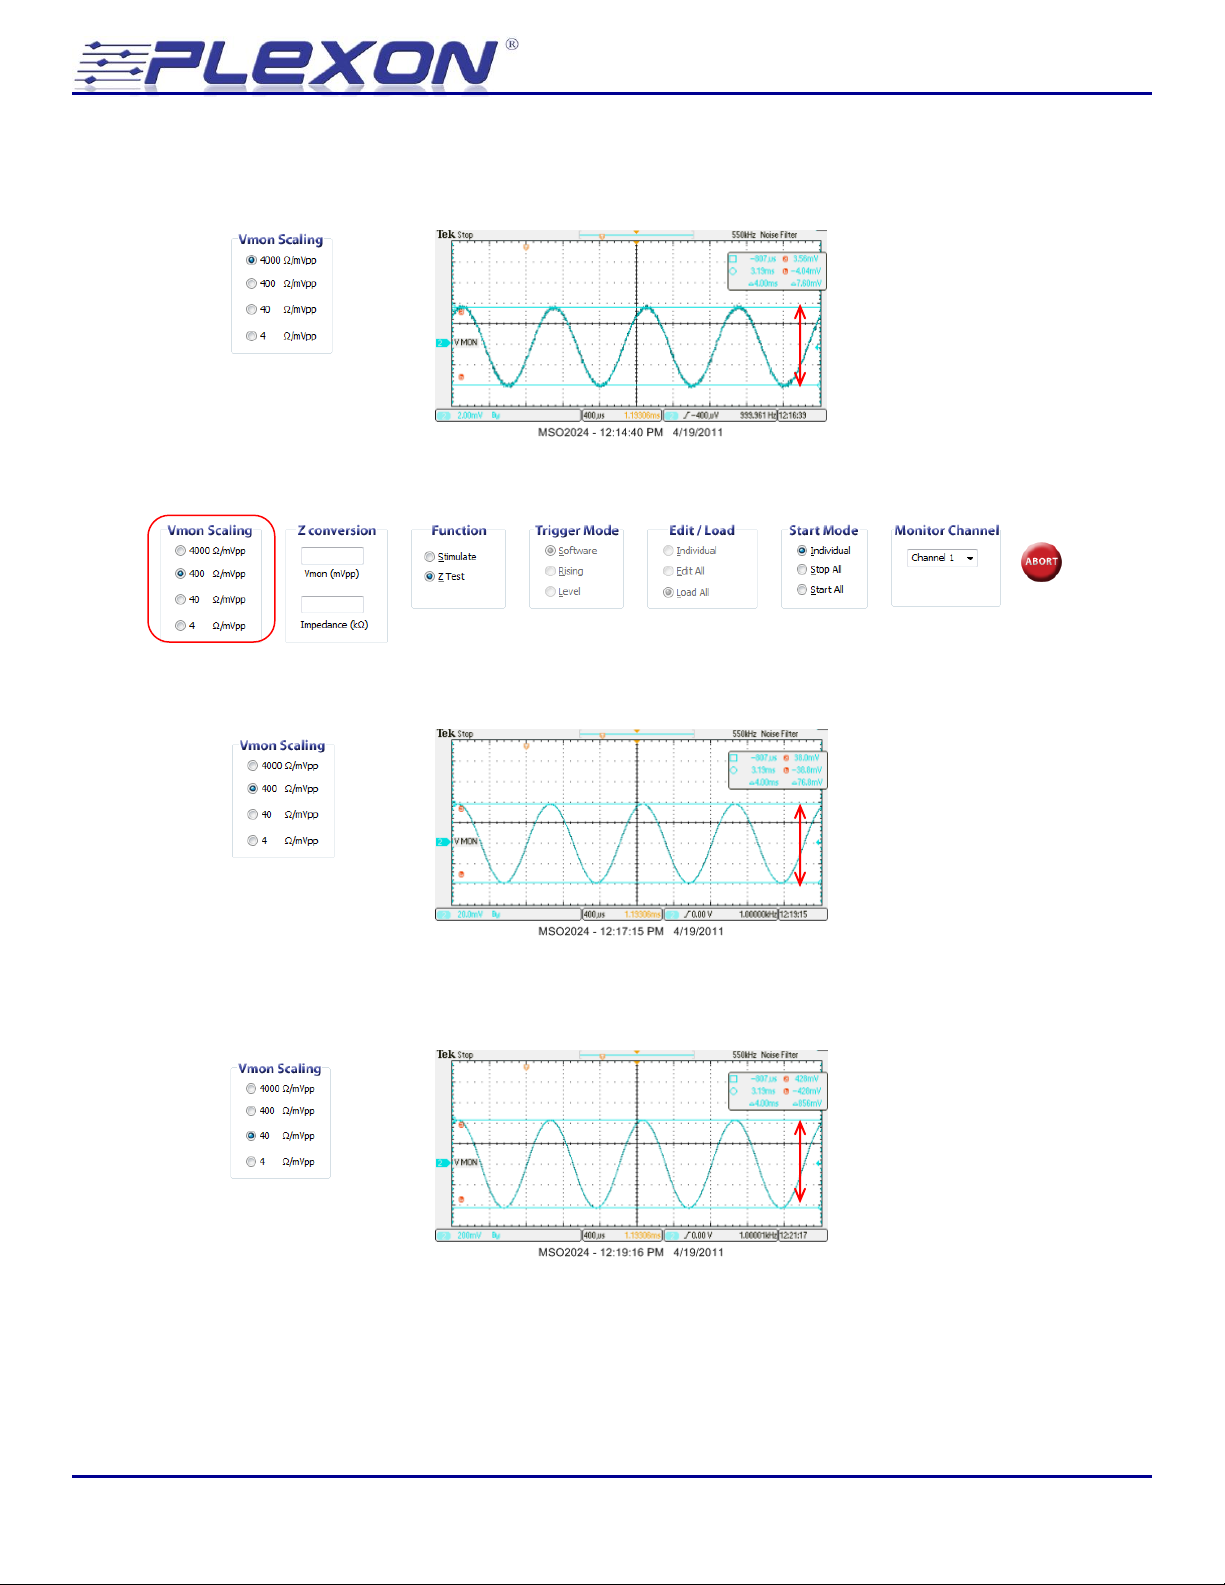
Observe the output of the voltage monitor on an oscilloscope. The voltage across the electrode is a
sinusoid with a peak to peak amplitude of ~ 7.60 mV:
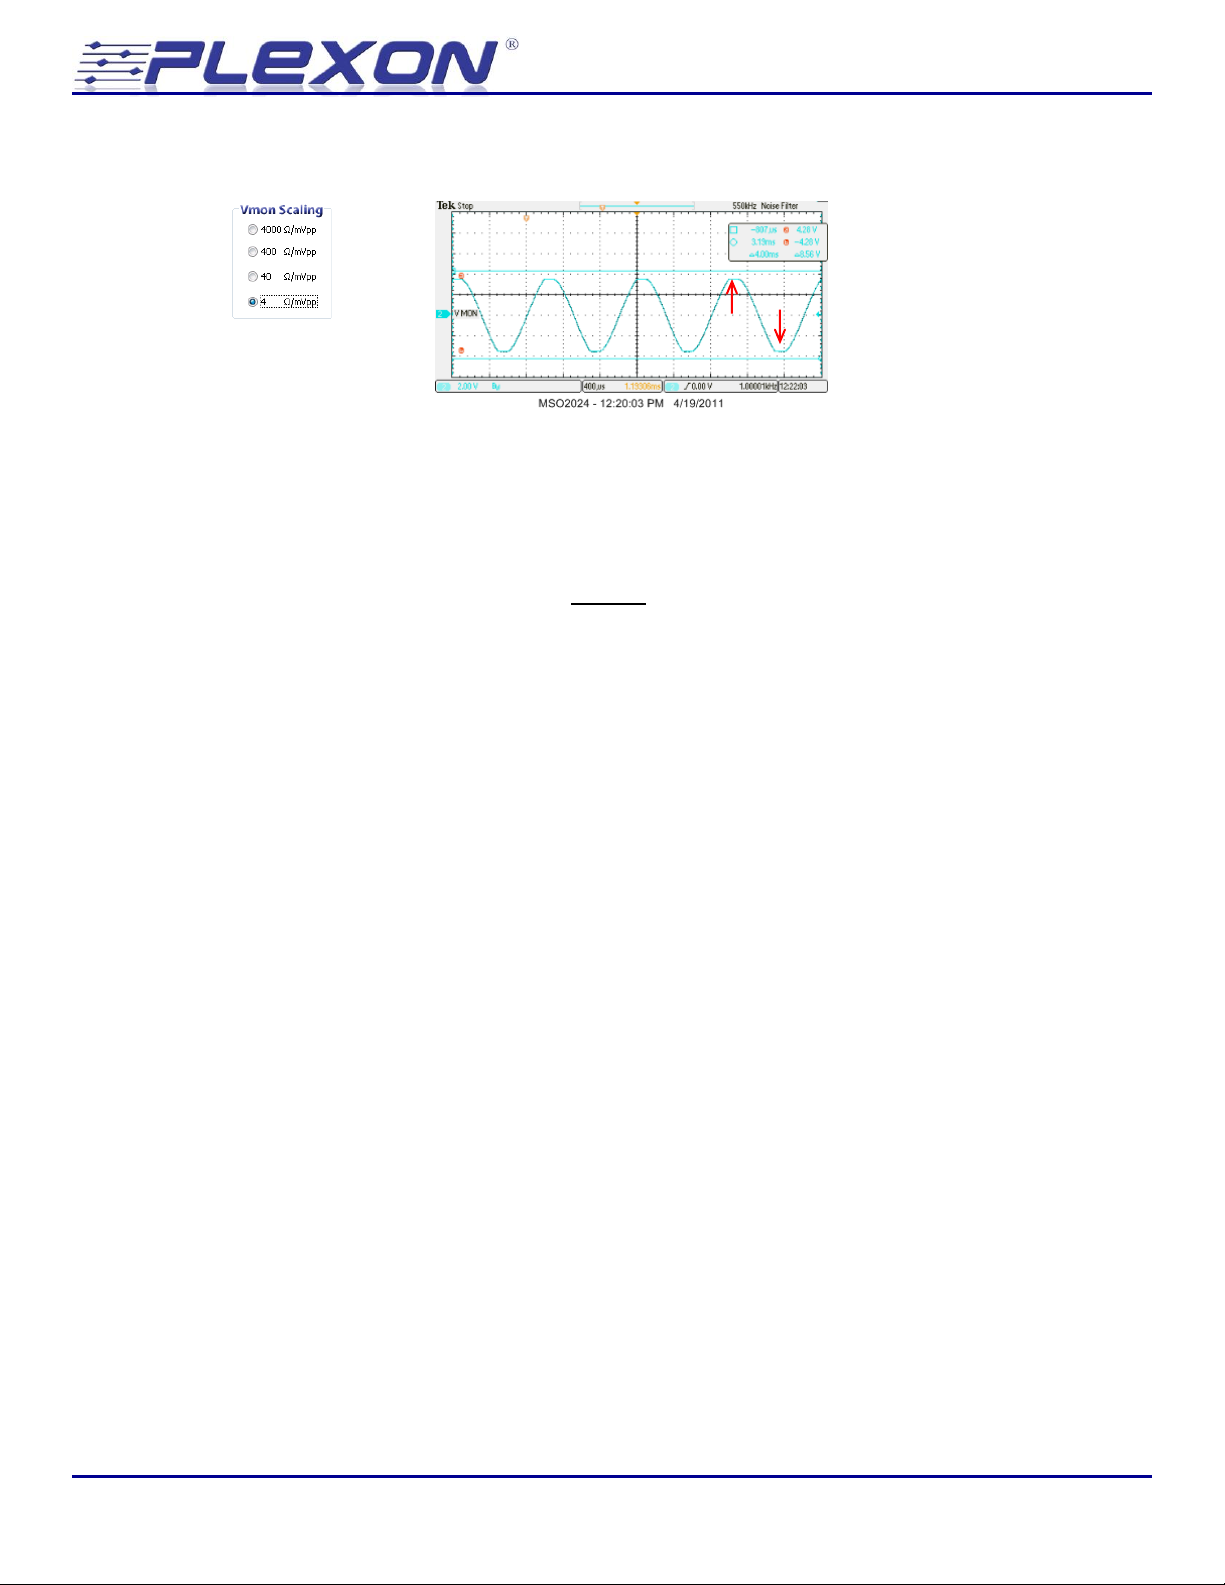
Try changing the Vmon scaling from 4000 /mVpp to 400 /mVpp:
Now the output of the voltage monitor is a sinusoid with a peak to peak amplitude of ~ 76.8 mV:
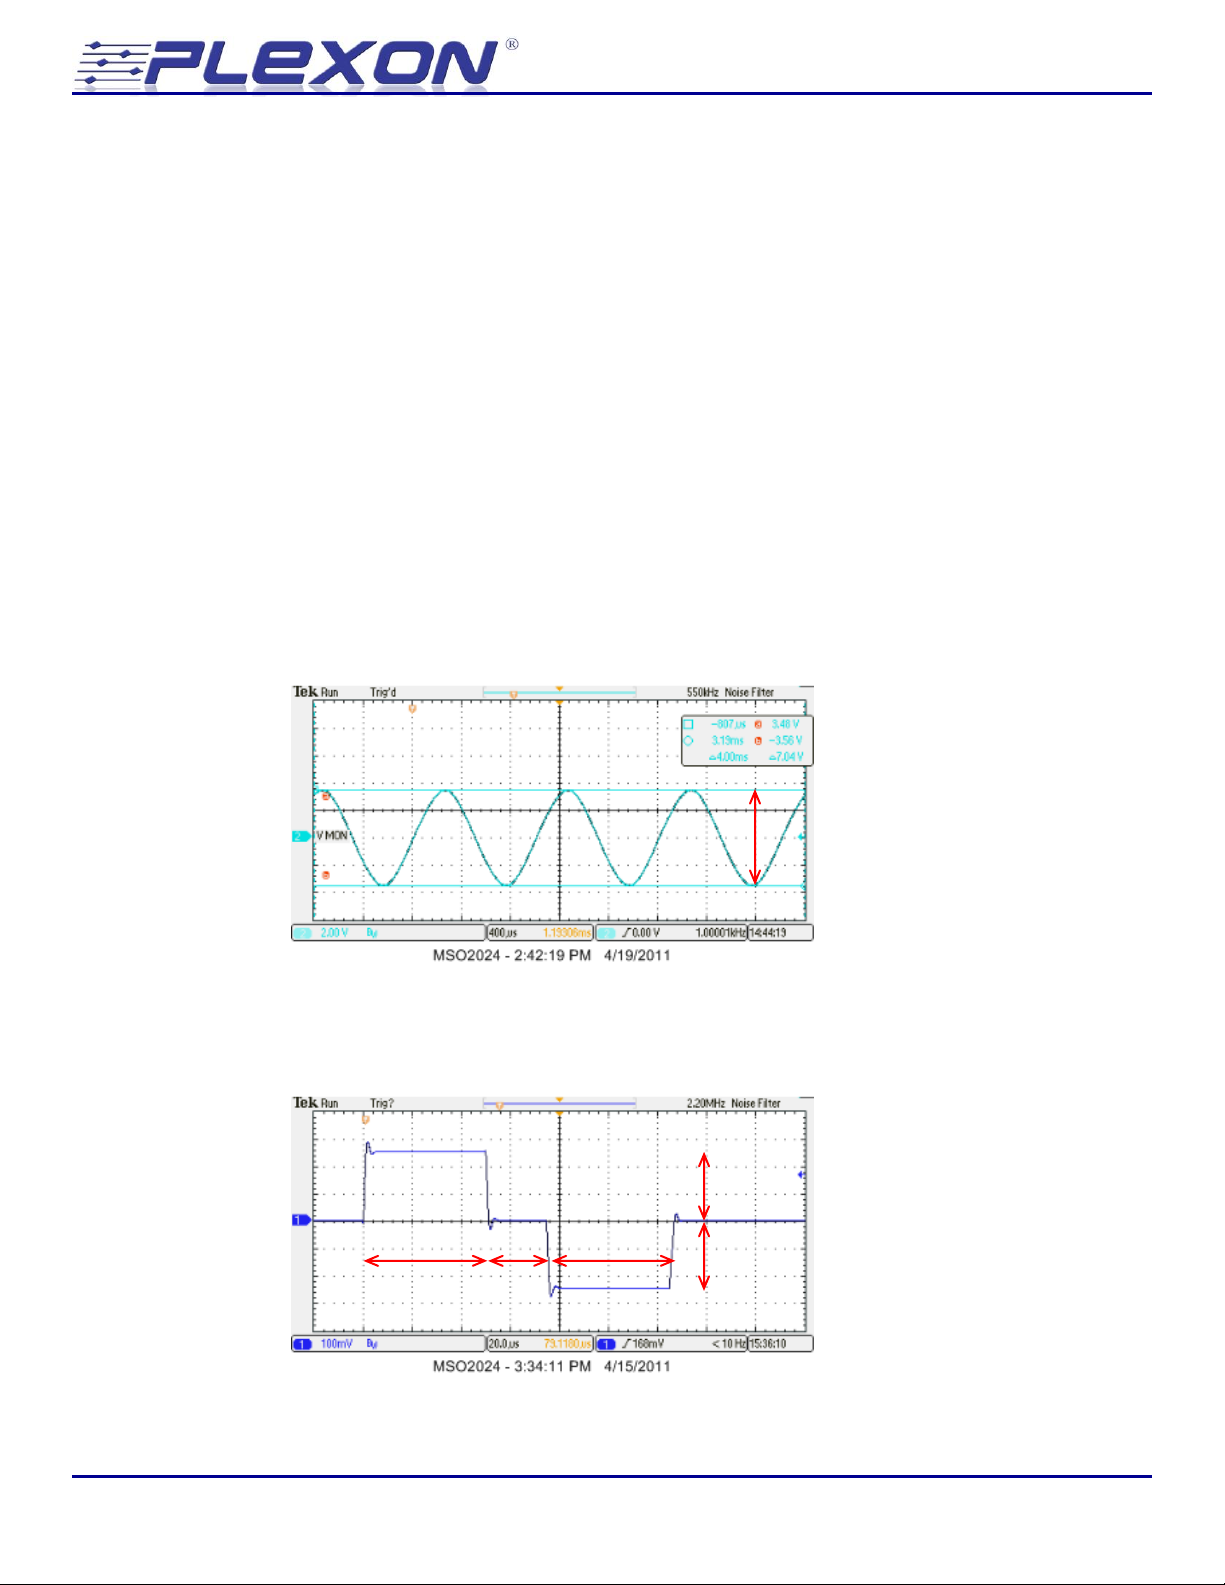
Continue to change the resolution of the monitor channel to obtain the largest amplitude sinusoid
on the monitor channel that is not clipping. Try 40 /mVpp
Stimulator 2.0 - 28 -
Page 29
Neurotechnology Research Systems
Clipping
When the Vmon scaling is changed to 4 /mVpp the output of the monitor channel starts to clip:
To calculate the impedance of the electrode, multiply the peak to peak amplitude observed on the
voltage monitor by the Vmon scaling factor. In this case the peak to peak amplitude signal on the
voltage monitor is 856 mVpp and the Vmon scaling is 40 /mVpp so the impedance of the electrode
is:
To obtain the most accurate impedance reading, you should adjust the scale factor as described
above to obtain the largest possible signal on the voltage monitor that does not clip.
The model electrodes on the test board have a resistance of 4.99 k in series with a 4700 pF
capacitor. The expected impedance for this combination at 1 kHz is 34.2 k in agreement with the
measurement above.
© Plexon Inc - 29 -
Page 30
Neurotechnology Research Systems
50 µs
50 µs
25 µs
7040 mVpp @ V
MON
= 282 k
250 mV @ V
MON
= 100 µA @ electrode
250 mV @ V
MON
= 100 µA @ electrode
5.10 Working with real electrodes
In a typical experimental situation, the properties of the electrode may not be well known and may
vary over time. Characterizing the electrode in saline prior to using it in vivo can provide valuable
information about the condition of the electrode. For example, measuring the impedance of the
electrode before and after implantation can help determine if the electrode was physically damaged
during the implantation process. Likewise estimating the impedance, access resistance, and
capacitance of the electrode periodically can provide clues as to the stability of the electrode tissue
interface over time.
This section shows some measurements obtained from a blunt cut 25 µm diameter platinum
iridium micro-wire electrode in saline. All of the measurements are taken using the same
procedures outlined in the preceding sections that were used with the model electrodes on the test
board. If you have not already done so, practice using the test board before trying to work with
electrodes in saline or trying to work with implanted electrodes.
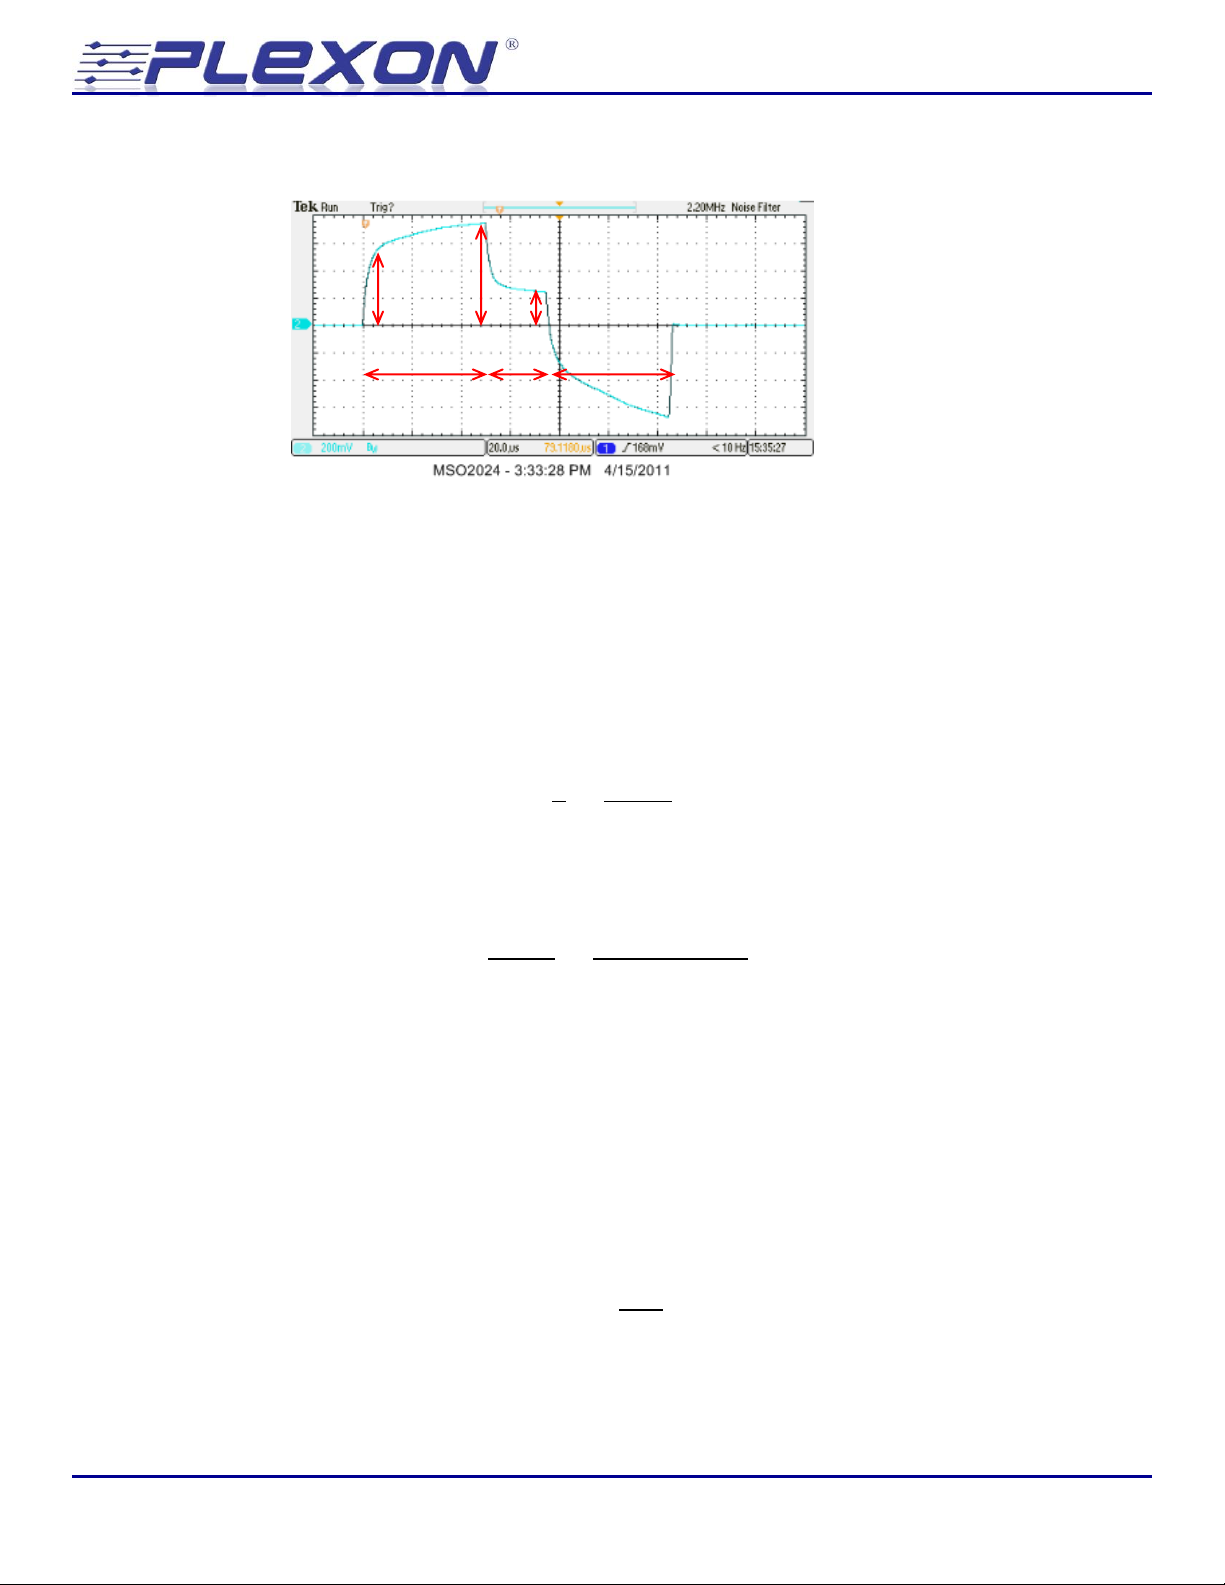
First measure the impedance of the electrode. With the Vmon scaling set to 40 /mVpp, the
resulting voltage monitor output was 7.04 Vpp implying an impedance of 282 k:
Next observe the response of the electrode to the default 100 µA 50 µs stimulation pulse.
Current monitor:
Stimulator 2.0 - 30 -
Page 31
Neurotechnology Research Systems
660 mV @ V
MON
= 2.64 V @ electrode
250 mV @ V
MON
= 1V @ electrode
50 µs
50 µs
25 µs
410 mV @ V
MON
= 1.64 V @ electrode
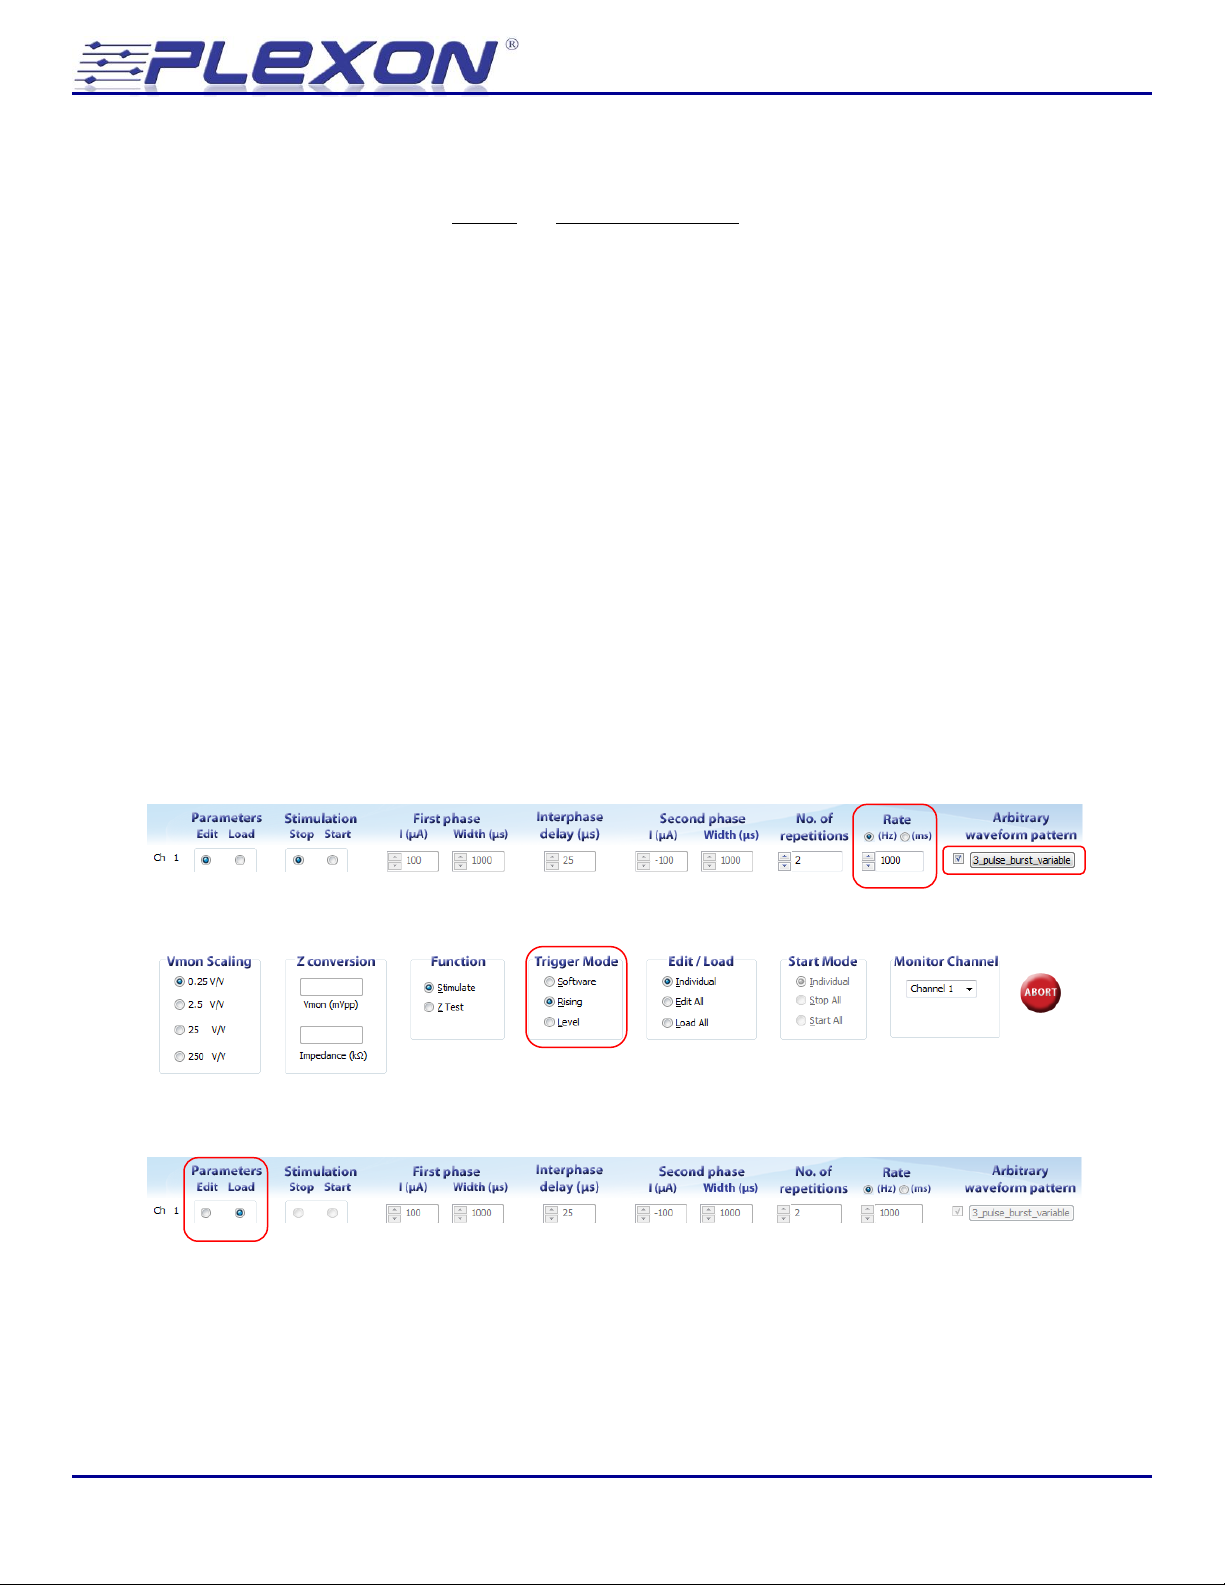
Voltage monitor:
The current monitor output looks normal and the voltage remains well below the compliance limit.
The requested stimulation was successfully delivered.
Similar to the model electrodes on the load board, the voltage of the real electrode shows a quick
jump at the onset of the current followed by a more gradual increase over the duration of the first
phase. Although these are not as distinct as they were with the model electrode, we can still
interpret them in terms of the access resistance and capacitance of the electrode.
An initial jump of 1.64V in response to a current of 100 µA implies an access resistance of:
And the subsequent increase in electrode voltage from 1.64 V to 2.64 V over the course of the 50 µs
pulse implies a capacitance of:
It is tempting to try and relate the impedance of the electrode at 1 kHz to the stimulation properties
of the electrode, but this can be problematic. Electrode impedance is typically measured at 1 kHz
with extremely low currents while stimulation is typically carried out with constant (DC) current of
a much larger amplitude. The properties of an electrode in saline are more correctly the properties
of the electrode electrolyte interface and those properties can vary with frequency, applied voltage,
time, and other factors.
For example, you can estimate the equivalent capacitance of the electrode from the impedance
measurement. The impedance of a capacitor C at a frequency f is given by:
© Plexon Inc - 31 -
Page 32
Neurotechnology Research Systems
So the estimated capacitance of an electrode with impedance of 282 k at 1 KHz is:
Note that the capacitance estimated from the impedance measurement is nearly an order of
magnitude smaller than the capacitance of the electrode estimated from a constant (DC) current
pulse.
5.11 Starting stimulation from a digital input
To start stimulation from a digital input first configure the pulse parameters or load an arbitrary
waveform for the channel or channels you want to stimulate. Next, find the “Trigger Mode” control
at the bottom of the screen. There are two digital input trigger modes, “Rising” and “Level”. In the
rising trigger mode, stimulation begins when the digital input for the channel transitions from low
(~0V) to high (~5V). In the level trigger mode, stimulation also begins when the digital input
transitions from low to high, but in level trigger mode, if the digital input is still high when the
stimulation protocol completes then the stimulation protocol will begin again. Note that once the
stimulation pattern is triggered by the digital input, it will play to completion even if the digital
input goes low. This helps guard against un-balanced charge delivery.
Configure channel 1 using the “3_pulse_burst_variable” arbitrary pattern and set the No. of
repetitions to 2 and the Rate to 1000 Hz:
Now select the “Rising” Trigger Mode:
Download the stimulation parameters to the stimulator by selecting “Load”:
Stimulator 2.0 - 32 -
Page 33
Neurotechnology Research Systems
Waveform #1
Waveform #2
Rate
1st Pattern
2nd Pattern
Digital input still high at end of 1st pattern
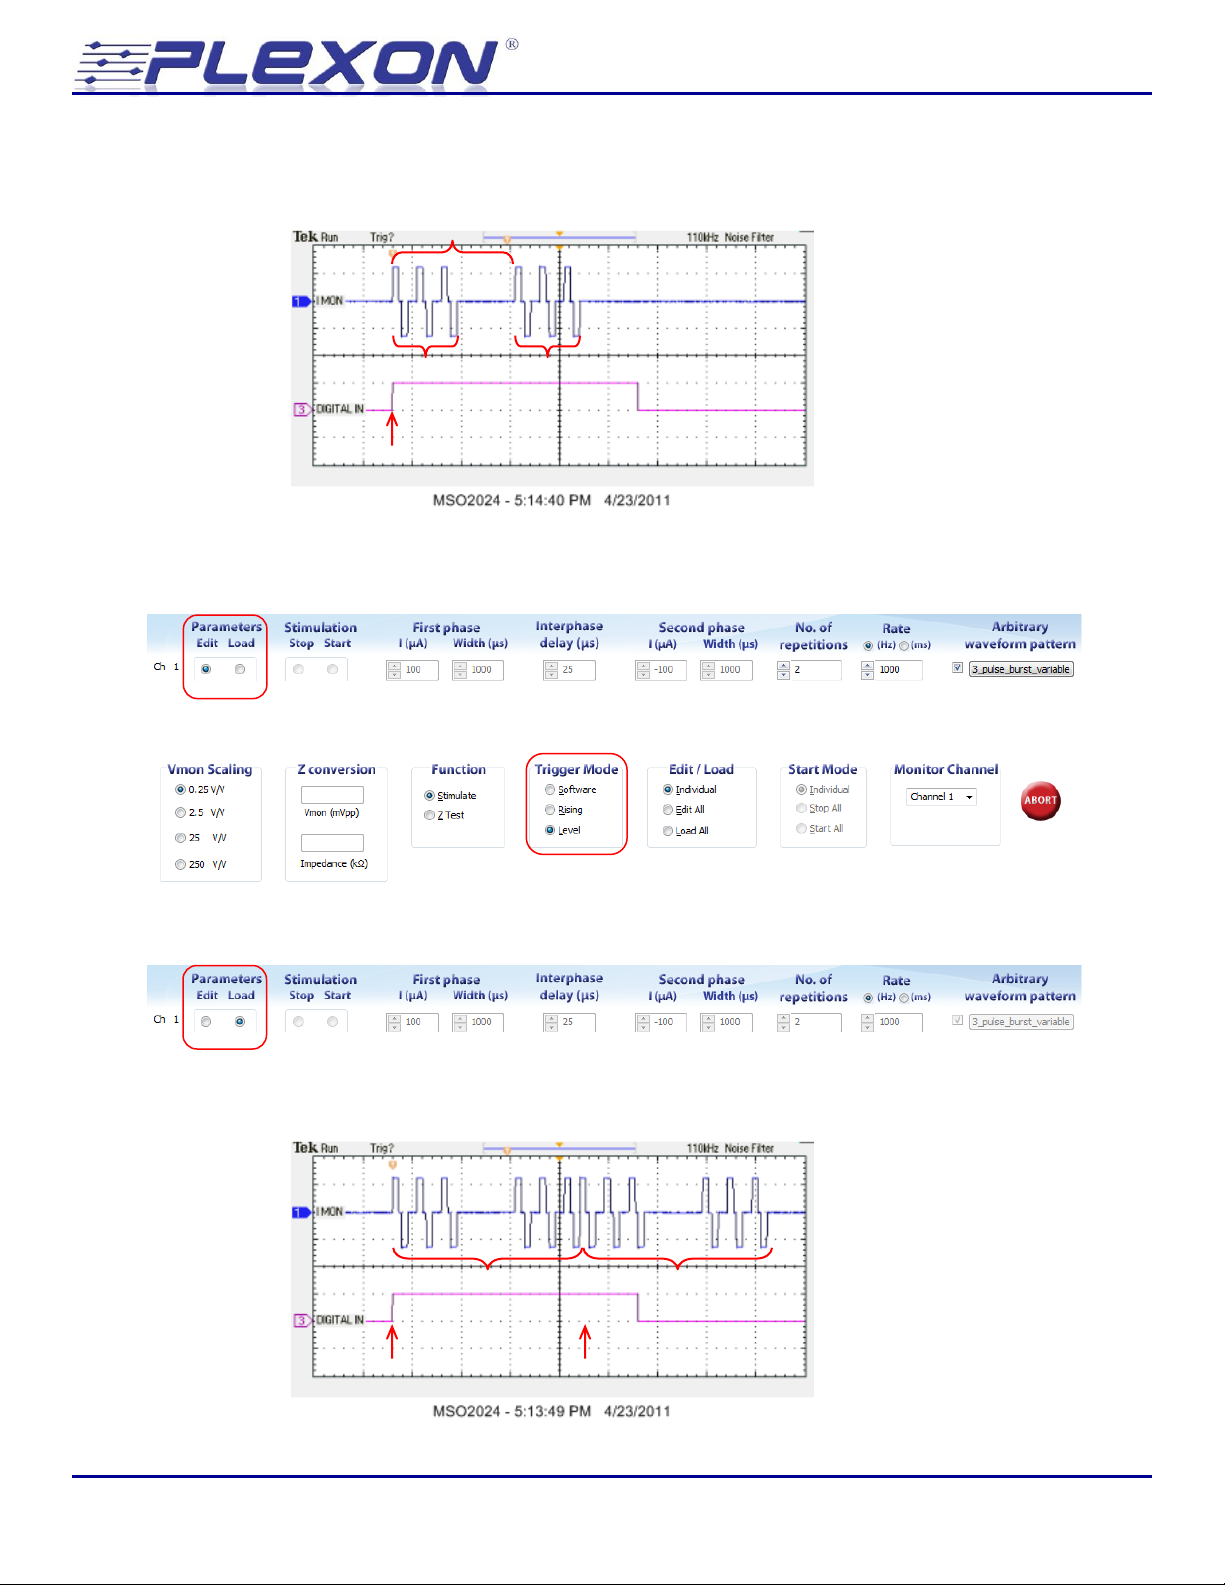
The stimulator is now armed and when the digital input for channel 1 goes high, the stimulation
pattern consisting of two repeats of the “3 pulse burst” waveform starts and plays to completion:
Compare that with the output in “Level” trigger mode. To switch to level trigger mode, you must
first change channel 1 to edit mode:
Then switch to level trigger mode:
Finally load channel 1 again:
The stimulator is now armed and when the digital input for channel 1 goes high, the stimulation
pattern starts and plays to completion:
© Plexon Inc - 33 -
Page 34
Neurotechnology Research Systems
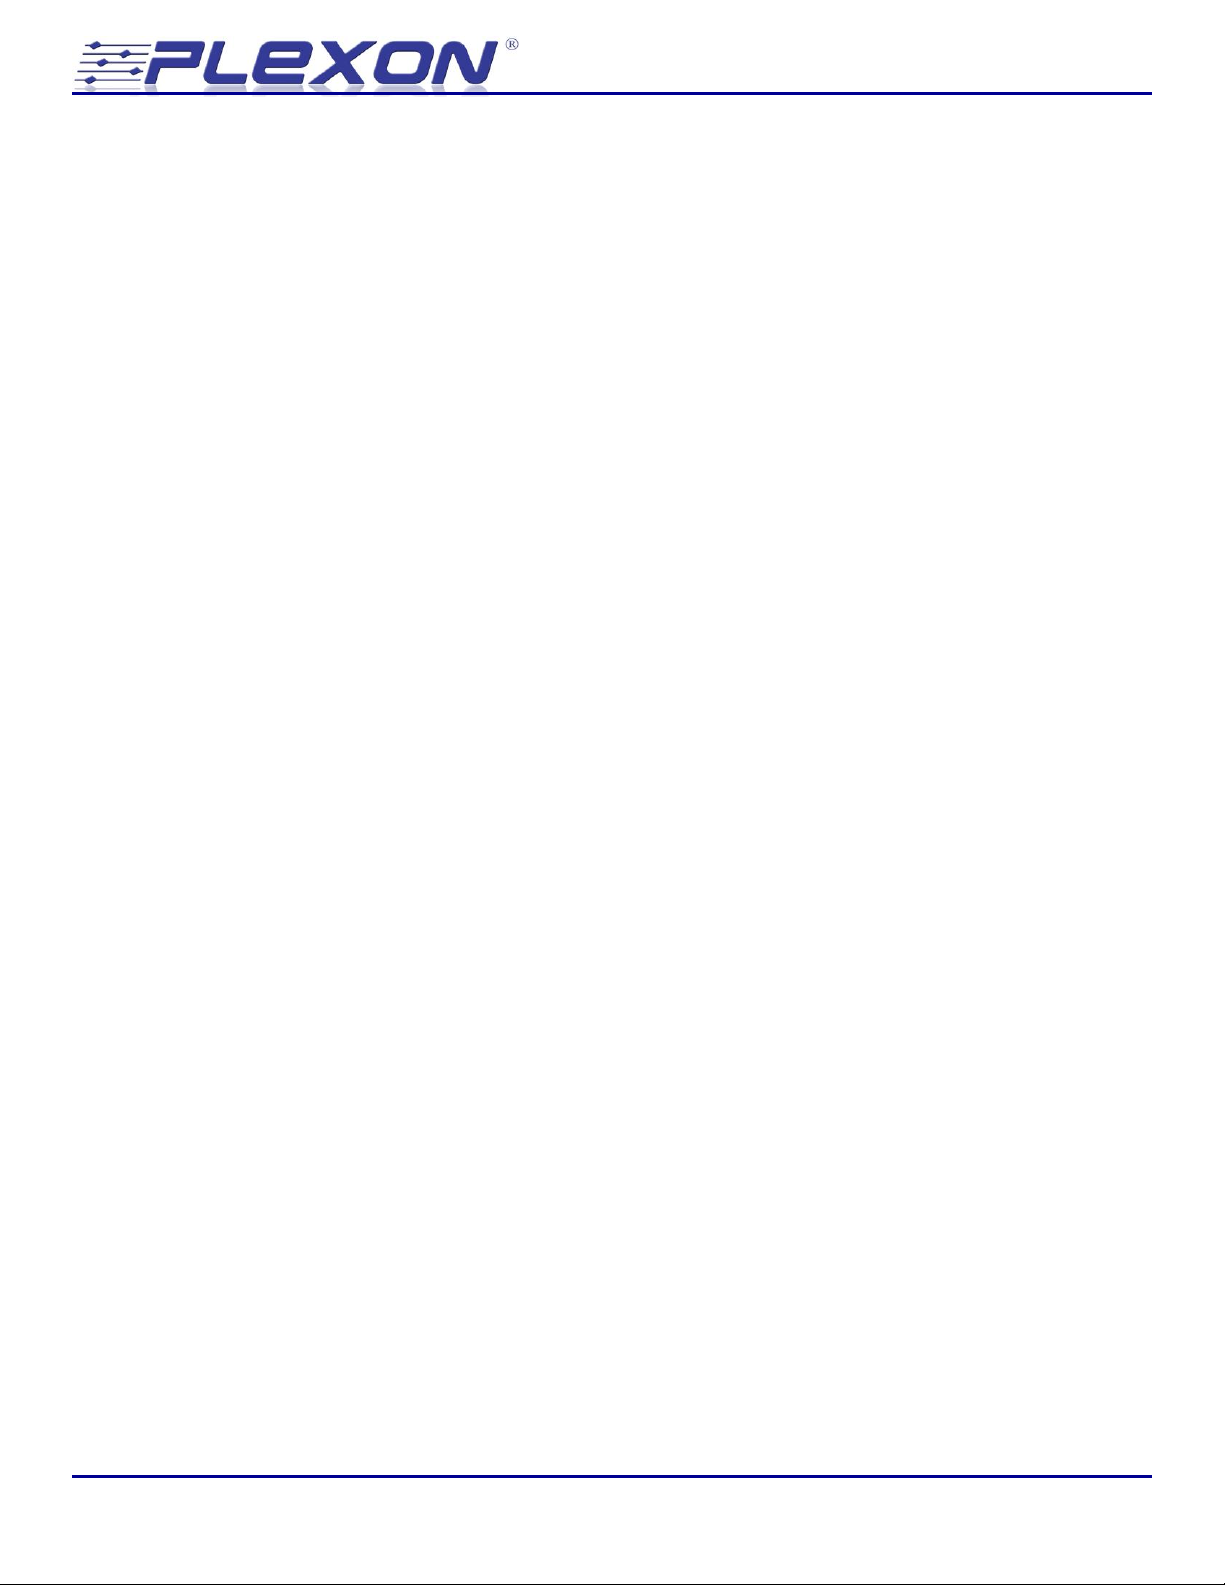
In level trigger mode however, since the digital input is still high at the end of the stimulation
pattern, a second stimulation pattern begins immediately. There is no “Rate” delay between the
two stimulation patterns in level triggered mode. The initiation of each stimulation pattern is
determined solely by the state of the digital input. Note that additional delay can be added to the
end of the arbitrary waveform pattern if it is desired.
5.12 Stopping stimulation
Most stimulation protocols are of finite duration and once they have been started will run to
completion and then stop automatically. Some stimulation protocols however may be defined with
very long intervals or with a very large or even infinite number of repetitions. It may become
desirable to stop these protocols before completion. An ongoing stimulation protocol can be
stopped by pressing the Stop, Edit, Stop All, Edit All, or Abort controls, or by closing the user
interface. Pressing the Stop or Edit control for a particular channel causes the stimulation in
progress on that channel to stop. Pressing the Stop All, Edit All, or Abort controls, or closing the
user interface causes stimulation to stop on all channels.
If there is a pulse or waveform in progress when a Stop, Edit, Stop All, or Edit All command is
issued, the stimulator will allow that pulse or waveform to complete before stopping the
stimulation. Most rectangular pulse and arbitrary waveforms are designed to be charge balanced.
That is they are designed such that the net charge deposited on the electrode over the course of the
pulse or waveform is zero. By allowing the pulse or waveform that is in progress to complete, the
stop mechanism helps to preserve that charge balance.
Pressing the Abort button or closing the user interface causes the stimulation to stop immediately
even if there is a pulse or arbitrary waveform playback in progress. Even though this temporarily
results in an unbalanced stimulation, the automatic electrode discharge feature (see section 5.7)
prevents long term charge accumulation on the electrode.
Refer to section 6.12, ABORT, for some examples.
Stimulator 2.0 - 34 -
Page 35
Neurotechnology Research Systems
6 GUI Function Reference
6.1 Parameters Edit/Load
Note: The Edit/Load controls may be grayed out if the Edit All or Load All control is selected.
6.1.1 Edit
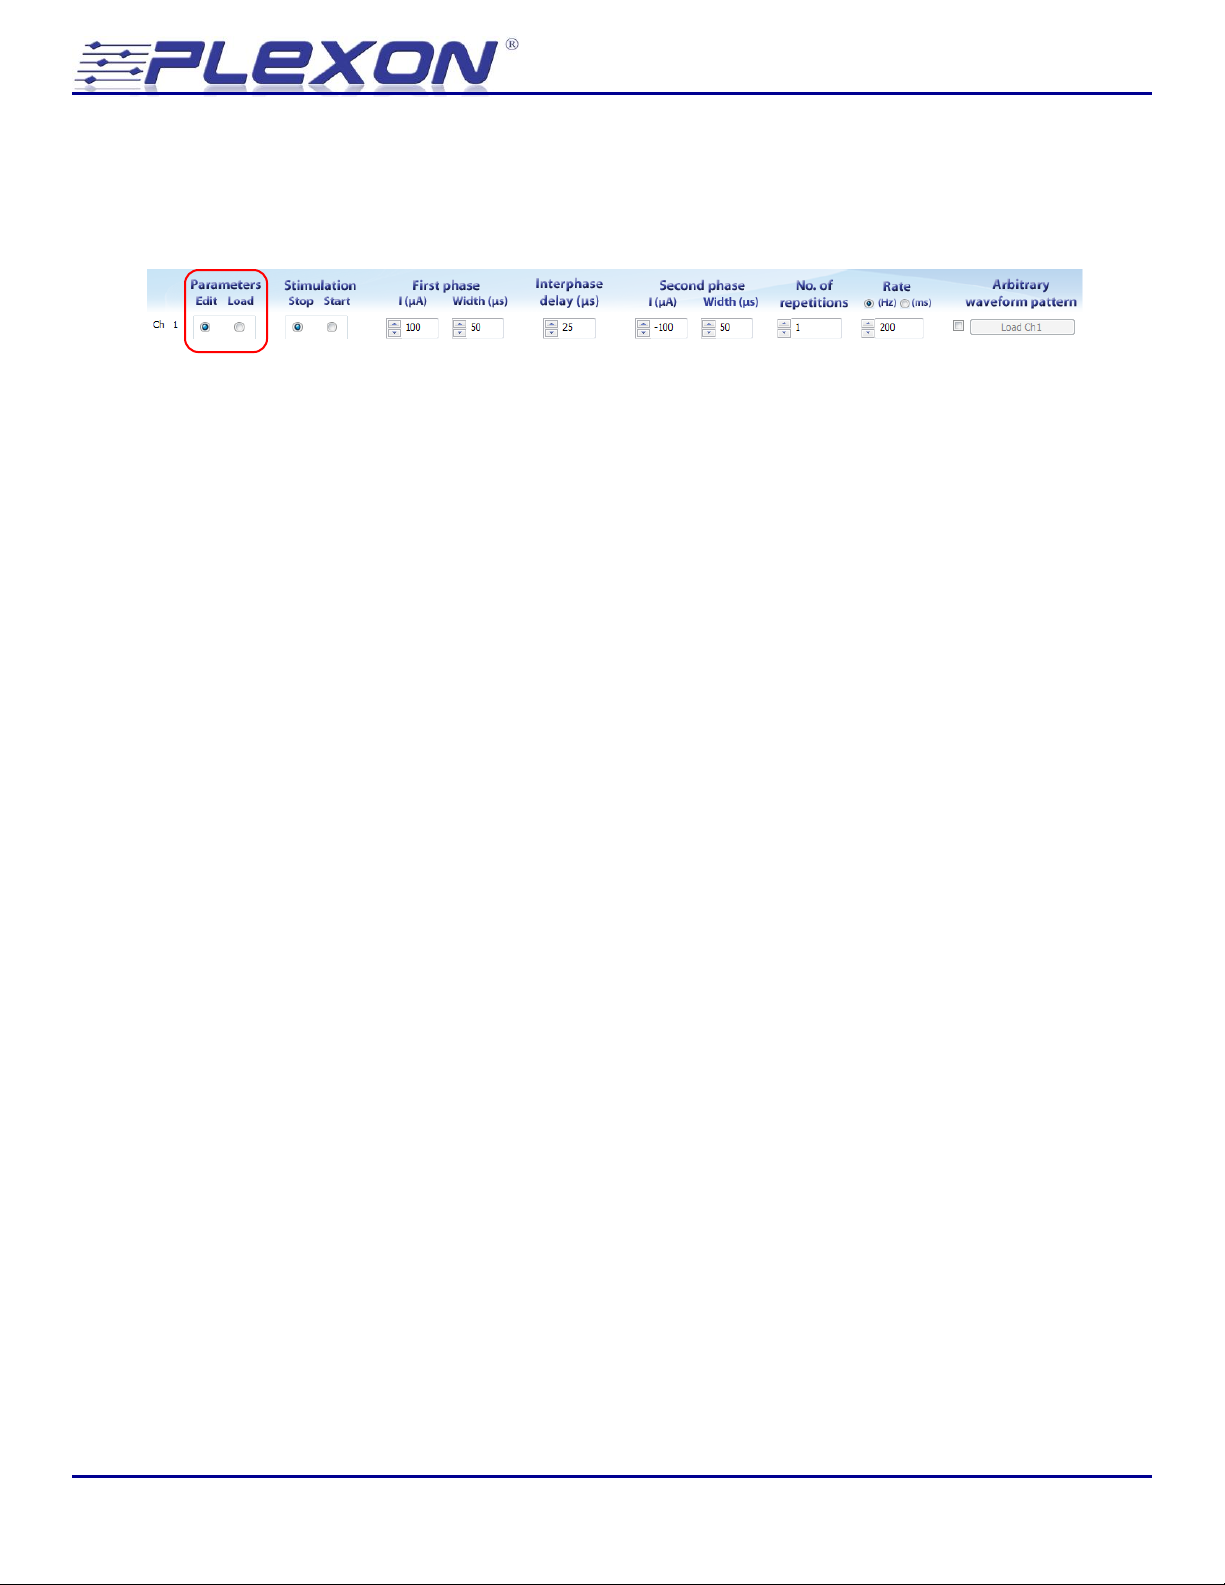
The stimulation parameters for a channel can only be changed when the channel is in edit mode.
Press the Edit button to put the channel in edit mode.
Pressing the edit button will cause any stimulation pattern that is in progress on the channel to
stop.
6.1.2 Load
Once the stimulation parameters for a channel have been configured, press the load button to
download the configuration to the stimulator hardware. Once the stimulation parameters have
been downloaded to the stimulator, the channel configuration controls become grayed out.
© Plexon Inc - 35 -
Page 36
Neurotechnology Research Systems
Stop Command
Remainder of current pulse/waveform completes
Subsequent pulses do not play
6.2 Stimulation Stop/Start
Note: The Start/Stop controls may be grayed out if the Stop All or Start All control is selected.
6.2.1 Stop
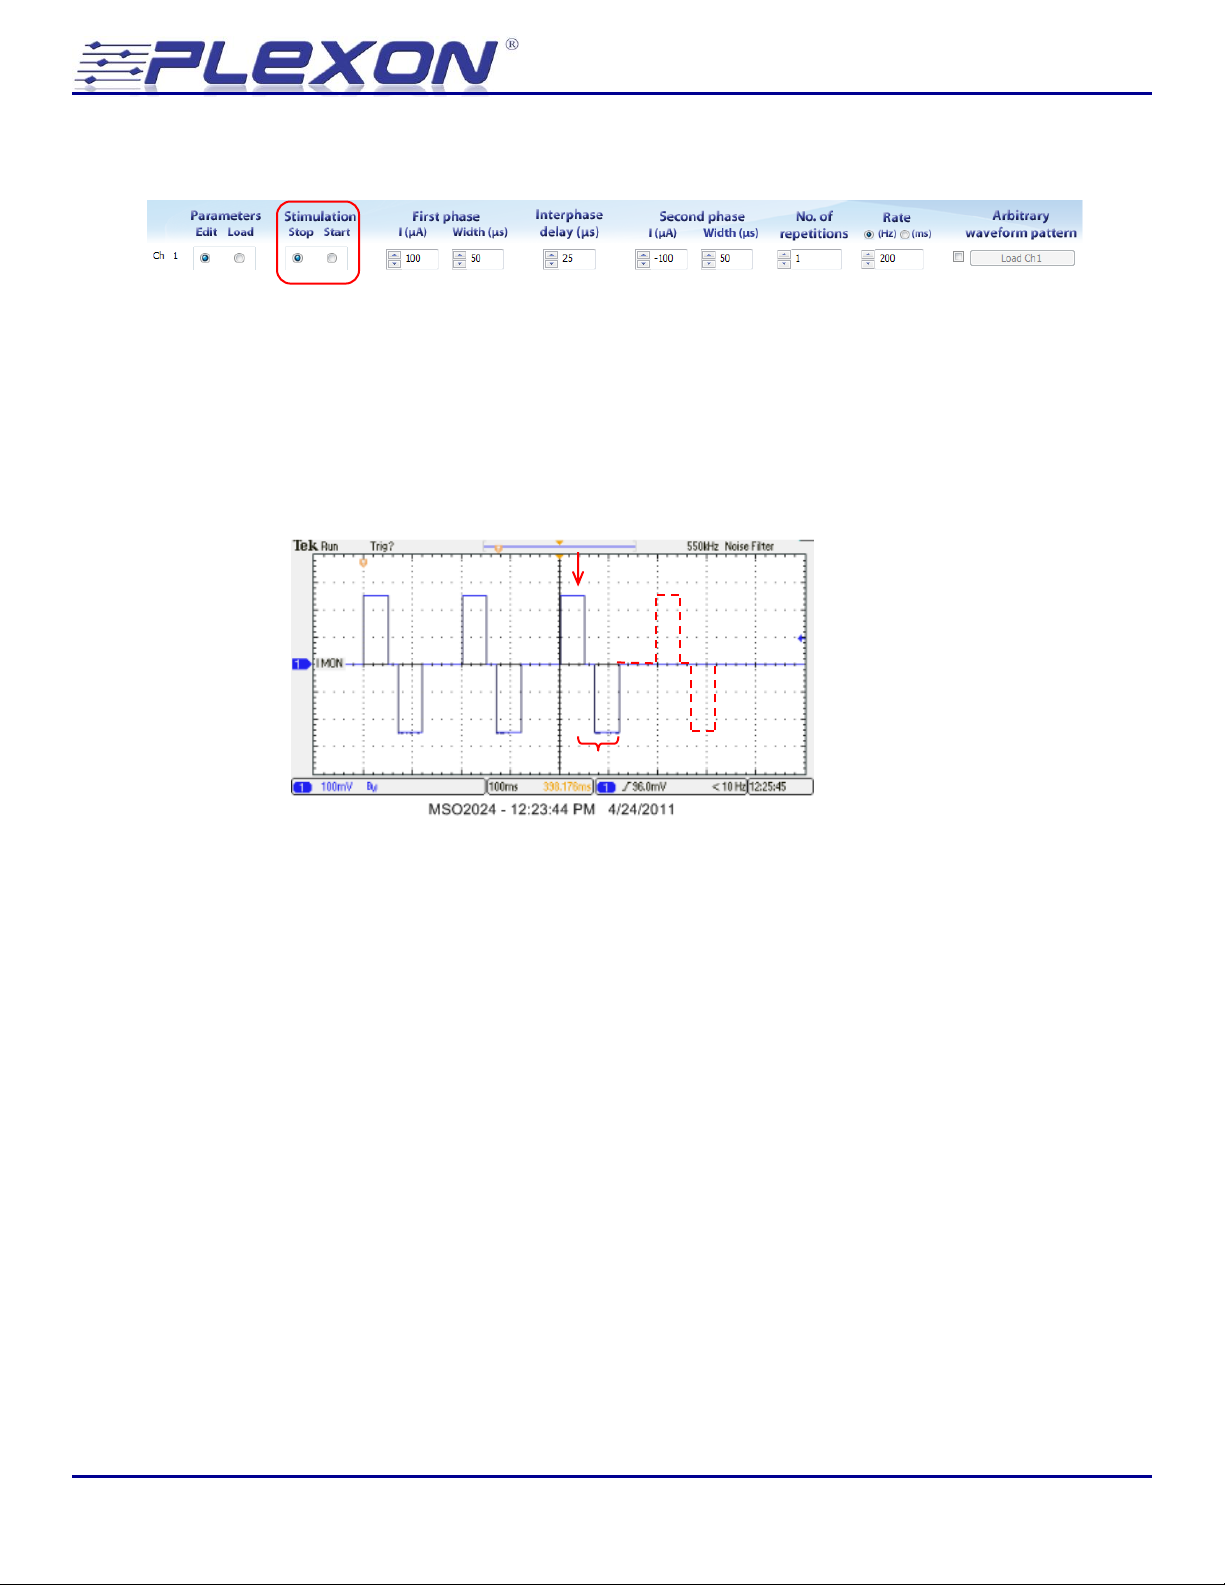
Press the stop button to stop a stimulation pattern that is in progress. When stop is clicked in the
middle of a pulse or arbitrary waveform output, the remainder of that pulse or arbitrary waveform
will play to completion. This helps preserve charge balance in the stimulation output. Any
remaining pulses in the pattern will not be played.
6.2.2 Start
Press the start button to initiate playback of the stimulation pattern for the channel when the
trigger mode is set to software. The stimulation parameters for the channel must be loaded before
the start button can work.
Stimulator 2.0 - 36 -
Page 37
Neurotechnology Research Systems
1st phase amplitude
2nd phase amplitude
1st phase width
2nd phase width
Interphase delay
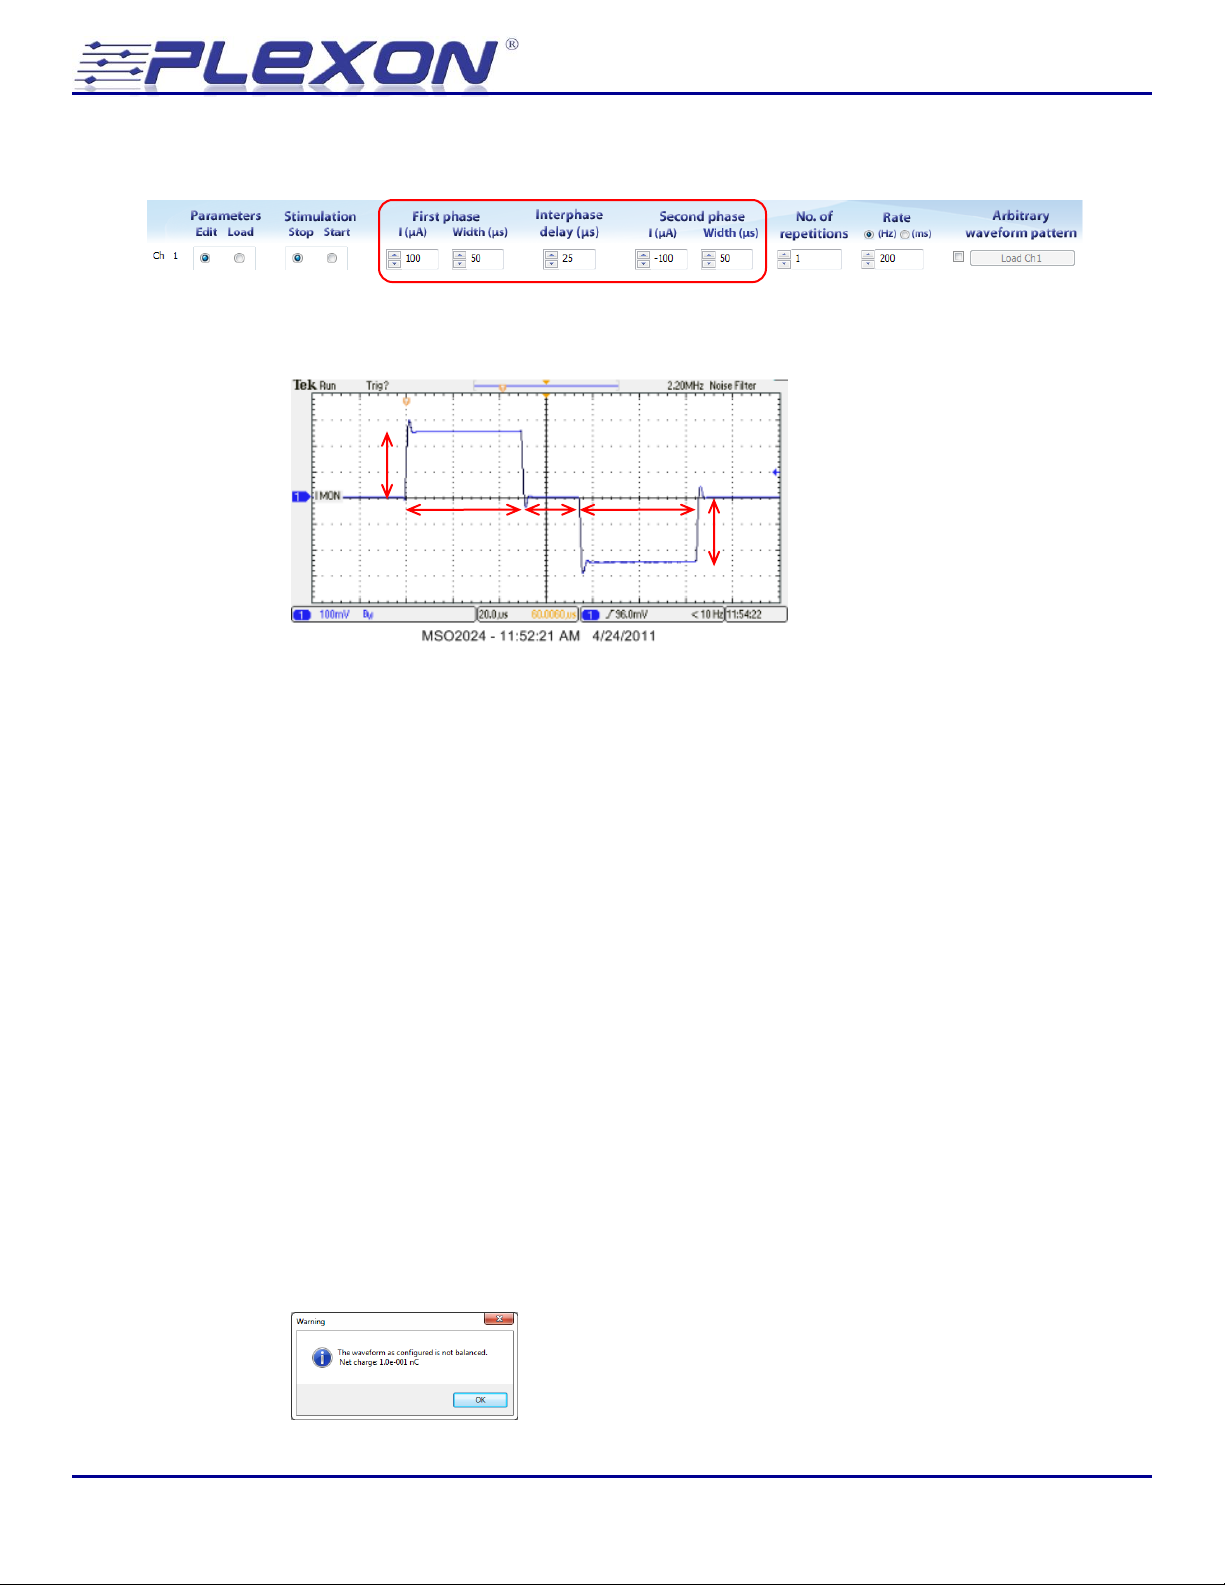
6.3 Rectangular Pulse Parameters
The graphical user interface provides controls for defining the amplitude and duration parameters
of a bi-phasic rectangular pulse:
6.3.1 First Phase Amplitude
The first phase amplitude may range from +1000 µA to -1000 µA in steps of 1 µA.
6.3.2 First Phase Width
The first phase width may range from 5 µs to 65535 µs in steps of 1 µs.
6.3.3 Interphase Delay
The interphase delay is the time between the first and second phases. The interphase delay may
range from 5 µs to 65535µs in steps of 1 µs. The current output is zero during the interphase delay.
6.3.4 Second Phase Amplitude
The second phase amplitude may range from +1000 µA to -1000 µA in steps of 1 µA.
6.3.5 Second Phase Width
The second phase width may range from 5 µs to 65535 µs in steps of 1 µs.
If the charge delivered in the second phase is not equal and opposite to the charge delivered in the
first phase, then a warning will pop up when you attempt to load the stimulation parameters. The
net charge imbalance per pulse is also given in the warning.
© Plexon Inc - 37 -
Page 38
Neurotechnology Research Systems
Rate
Number of repetitions = 3
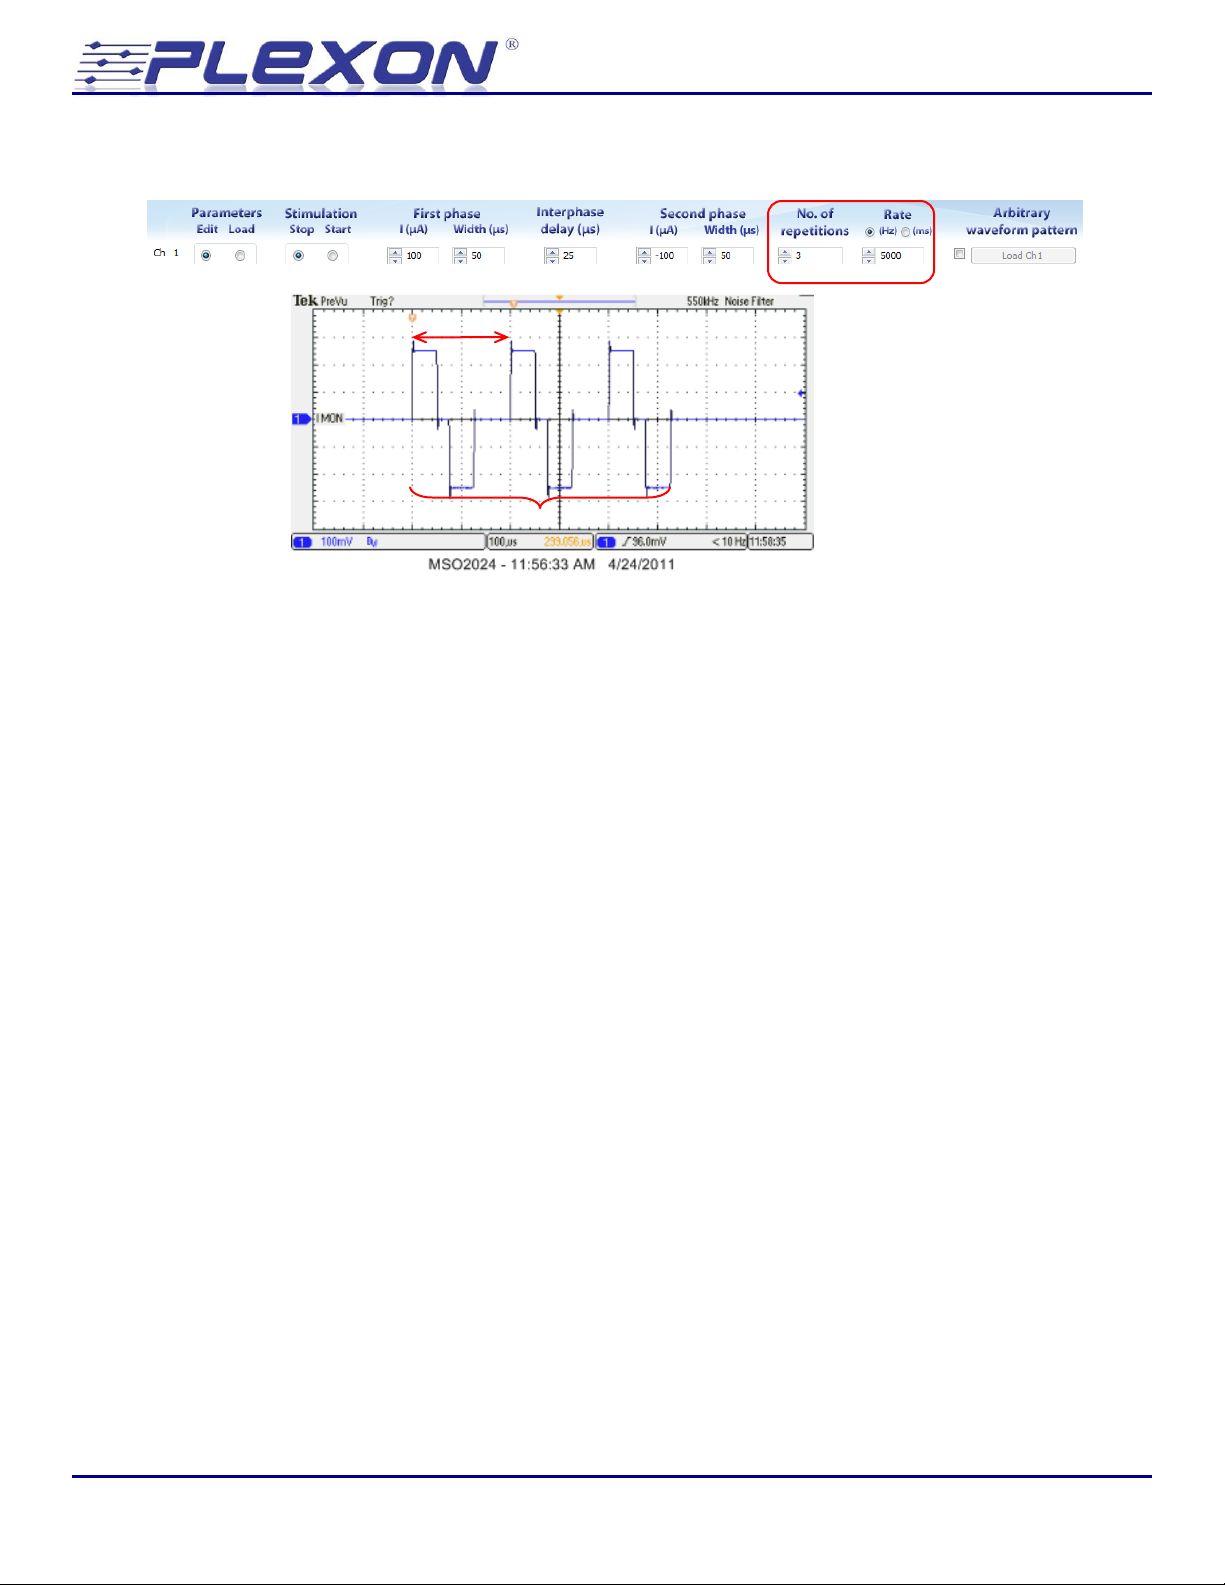
6.4 Number of Repetitions and Pulse Rate
6.4.1 No. of Repetitions
The number of repetitions is simply the number of times that the bi-phasic pulse (defined using the
GUI controls) or the arbitrary waveform (loaded from a text file) is repeated. The number of
repetitions can range from 1 to 32767. An infinite number of repetitions can also be generated by
typing “0” or “INF” in the control. The defined number of pulses or waveforms will be generated
every time the channel is started.
6.4.2 Rate
The rate is the frequency at which the defined pulse or arbitrary waveform is repeated, expressed
in Hertz, or the time between the start of one pulse or arbitrary waveform and the start of the next
pulse or arbitrary waveform, expressed in milliseconds. Use the radio buttons to select whether to
express the rate in Hertz or in milliseconds. The maximum time between pulses is 125000 ms
corresponding to a minimum rate of 0.008 Hz. The minimum time between pulses generally
depends on the length of the pulse or arbitrary waveform that is being repeated. The time between
pulses must include the duration of the pulse and at least 5 µs between pulses. For example a pulse
that lasts for 200 µs must be repeated at a rate less than 4878 Hz since 1/(200 µs + 5 µs) ~ 4878 Hz.
The rate parameter may be entered in steps of 0.001 ms (1 µs).
Stimulator 2.0 - 38 -
Page 39
Neurotechnology Research Systems
6.5 Arbitrary Waveform Patterns
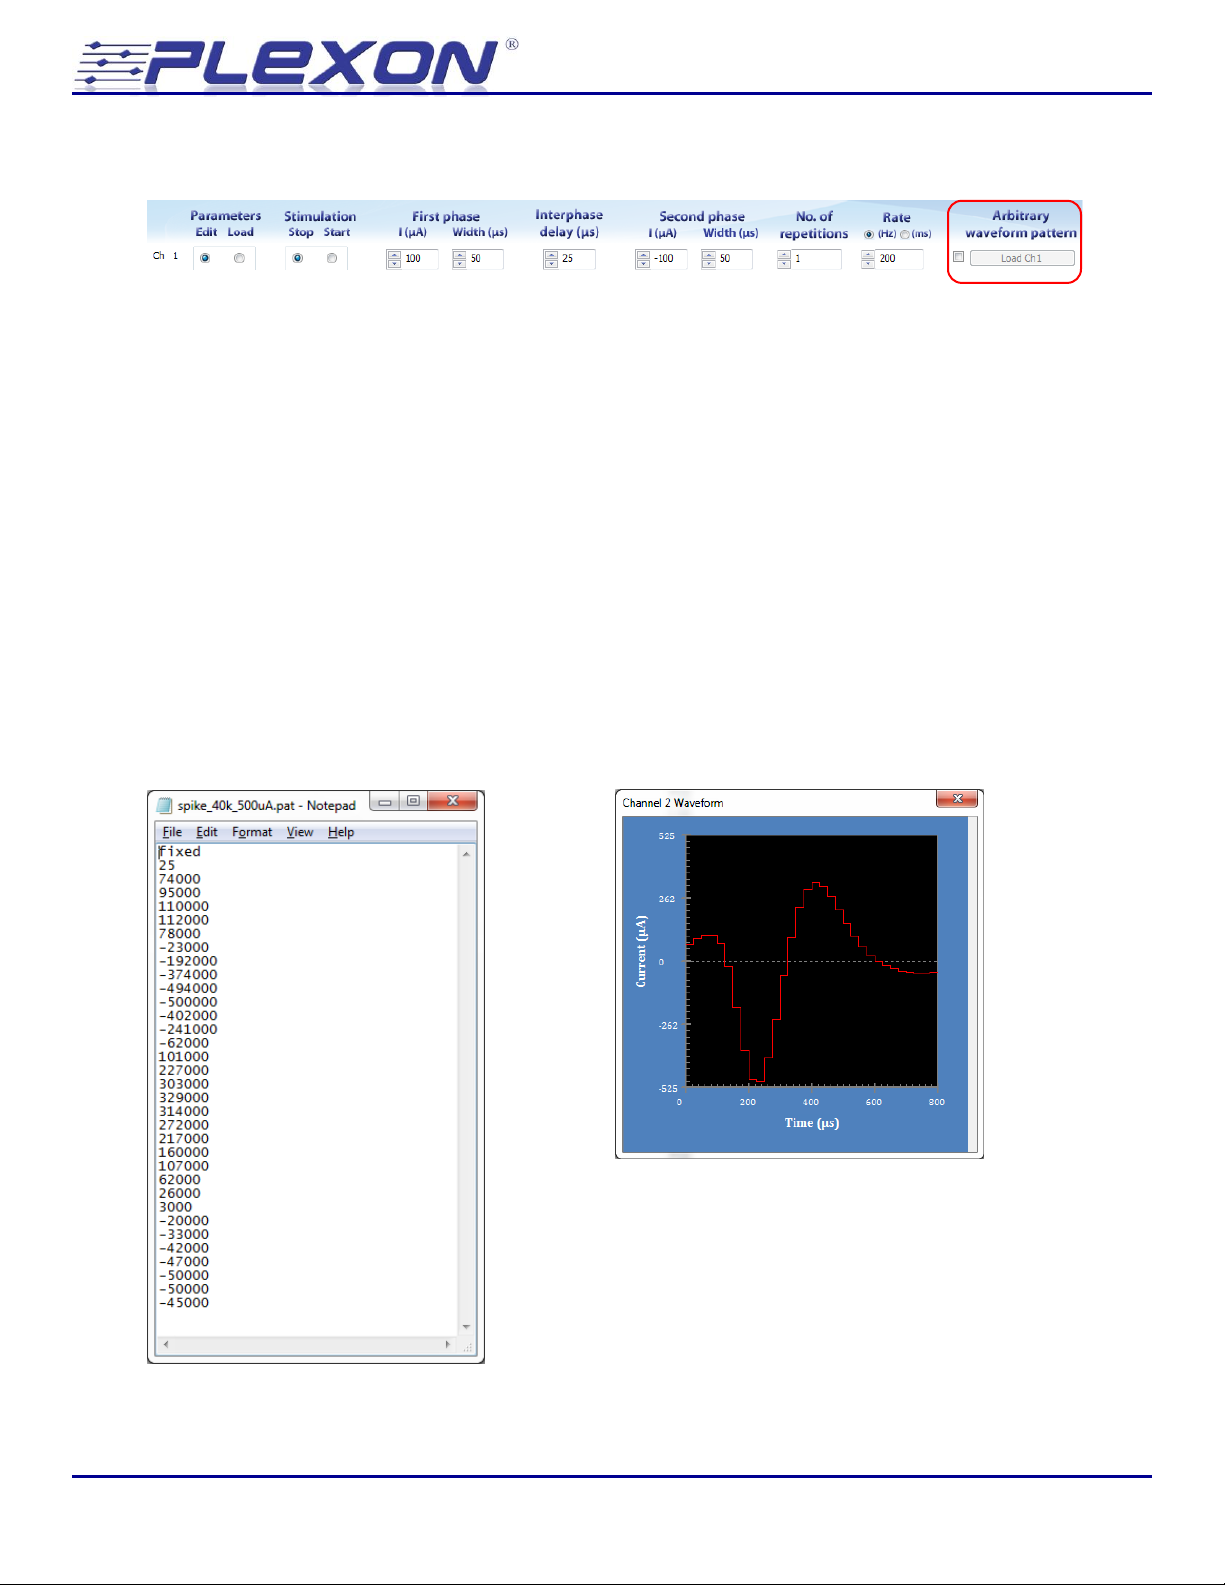
Arbitrary waveform patterns are stimulation patterns that are defined in text files with a .pat
extension. Check the box at the far right of the row of controls next to where it says arbitrary
waveform pattern to disable the rectangular pulse controls and enable the arbitrary waveform
pattern load button. Click on the Load Ch N button to select and open an arbitrary waveform file.
When the file is opened, a graphical representation of the arbitrary waveform is displayed.
Two arbitrary waveform pattern file formats are supported. One file format uses a fixed sampling
rate and the other file format uses a variable sampling rate.
6.5.1 Fixed Sampling Rate
In the fixed sampling rate file format, the first line of the file contains the keyword “fixed”. The
second line of the file codes for a single duration parameter expressed in microseconds. The
subsequent lines of the file contain a series of current amplitude values expressed in nanoamps.
When the stimulation pattern is played back, each current amplitude from the file is played for the
fixed amount of time specified by the duration parameter. The fixed sampling rate format is
especially useful for coding continuously varying shapes such as the action potential waveform.
© Plexon Inc - 39 -
Page 40
Neurotechnology Research Systems
The file can contain up to 1000 amplitude values. The duration parameter can range from 1 µs to
65535 µs. The current amplitudes can range from -1,000,000 nA to +1,000,000 nA in steps of 1 nA.
Note however that the actual resolution of the stimulator output in stimulation mode is ~ 30 nA
and all current amplitudes will be rounded to the nearest possible output value. For example an
amplitude value of 15 nA will be rounded down to 0 nA and an amplitude value of 16 nA will be
rounded up to 30 nA.
6.5.2 Variable Sampling Rate
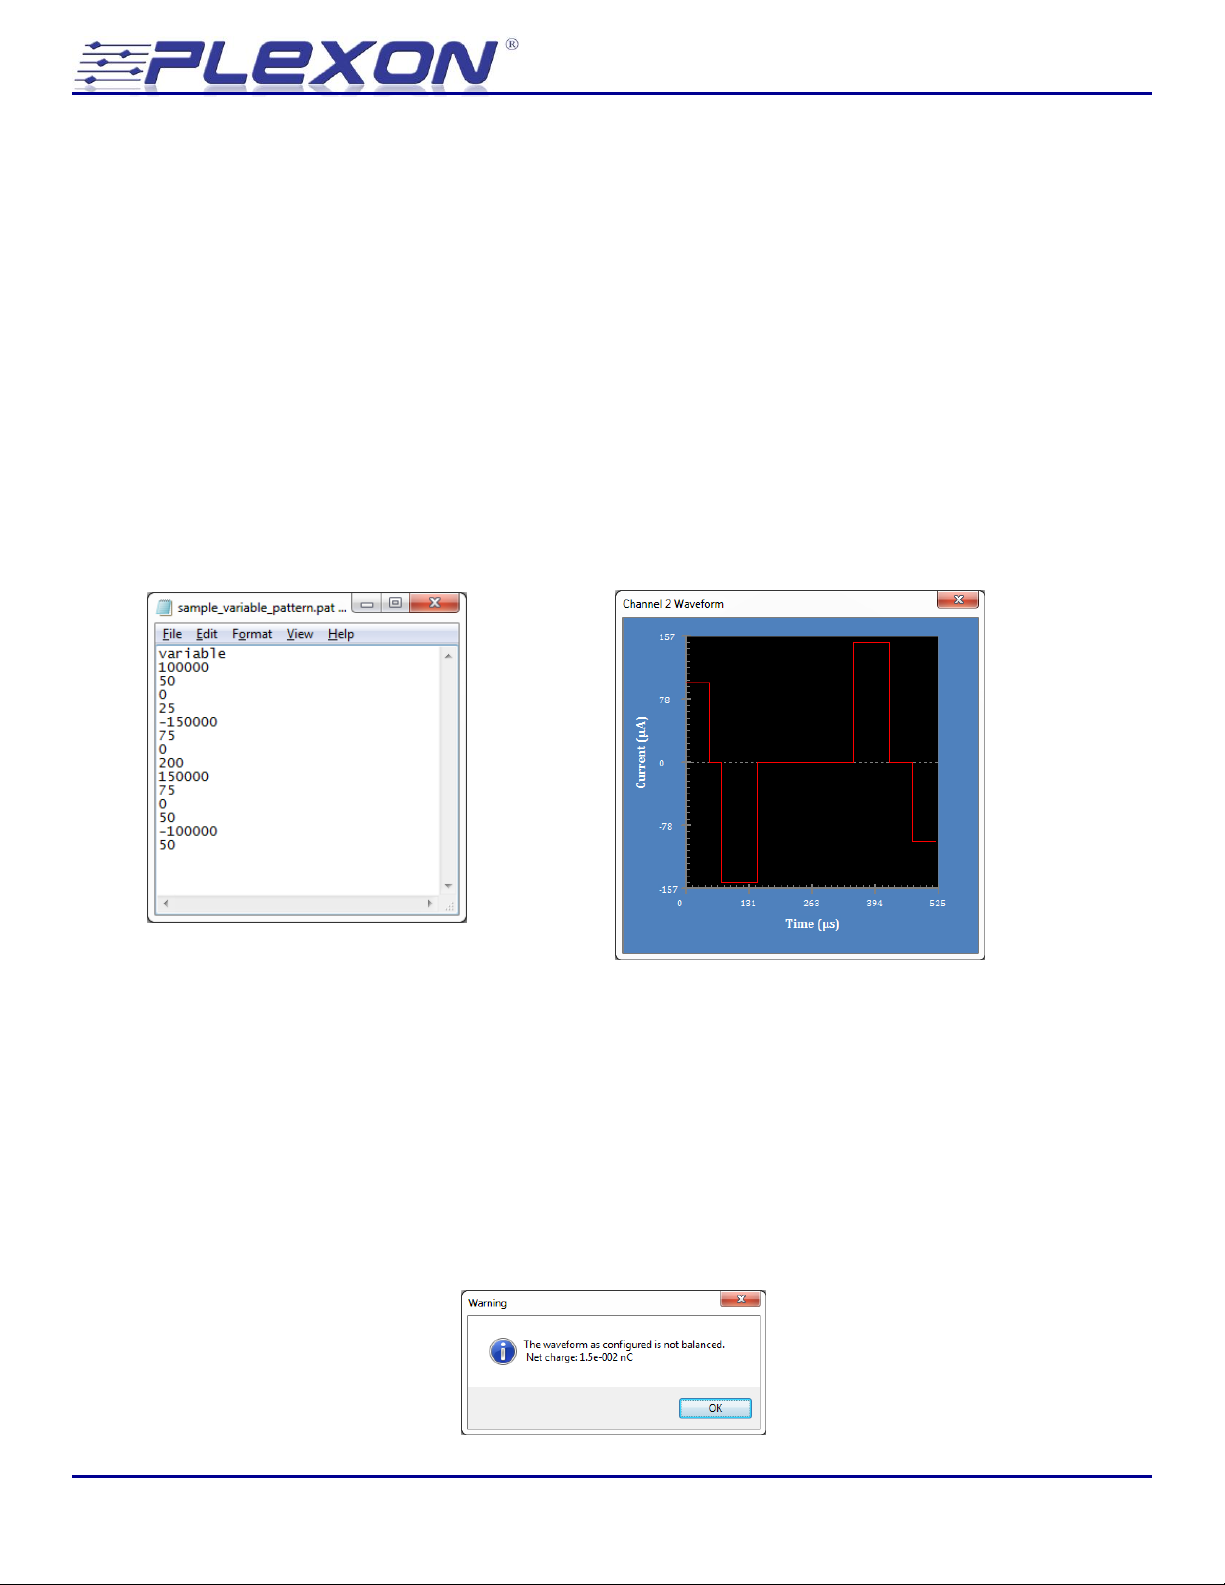
In the variable sampling rate file format, the first line of the file contains the keyword “variable”.
The second line of the file codes for a current amplitude and the third line of the file codes for the
duration that the amplitude on line two should be played Subsequent lines in the file code for
additional amplitude duration pairs. When the stimulation pattern is played back, each current
amplitude is played for the specific duration associated with that amplitude. The variable sampling
rate format is especially useful for coding complex patterns of rectangular pulses.
The file can contain up to 500 amplitude duration pairs. The duration parameter can range from 1
µs to 65535 µs. The current amplitudes can range from -1,000,000 nA to +1,000, 000 nA in steps of
1 nA. Note however that the actual resolution of the stimulator output in stimulation mode is ~ 30
nA and all current amplitudes will be rounded to the nearest possible output value. For example an
amplitude value of 15 nA will be rounded down to 0 nA and an amplitude value of 16 nA will be
rounded up to 30 nA.
As with rectangular pulses, the arbitrary pattern should be charge balanced, meaning that the same
amount of current is deposited and withdrawn from the electrode. The Stim2 software will
automatically analyze the loaded file and give a warning if the net charge is not zero.
Stimulator 2.0 - 40 -
Page 41
Neurotechnology Research Systems
+266 mV @ V
MON
= 1.06V @ electrode
856 mVpp @ V
MON
= 34240 Ohm
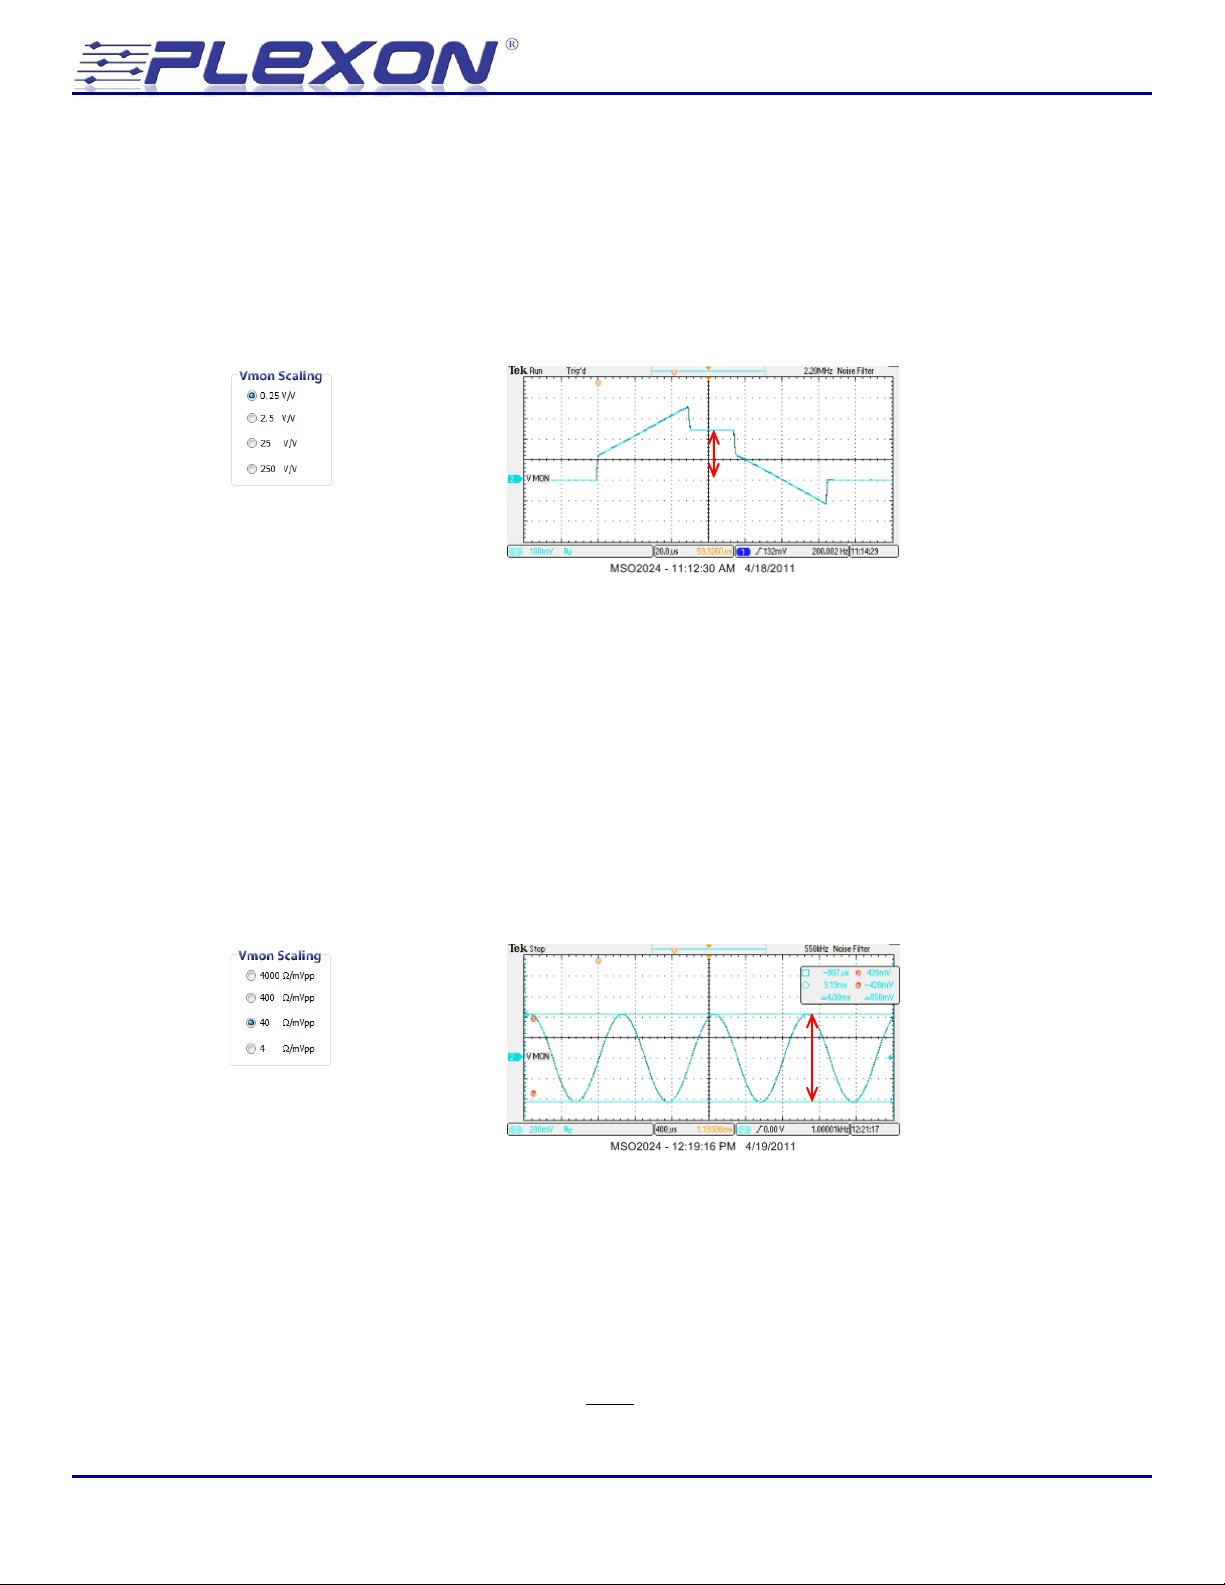
6.6 Vmon scaling and Z conversion
The Voltage monitor scaling control indicates the relationship between the voltage at the monitor
channel and the voltage at the electrode. The behavior of the control depends on whether the
stimulator is in stimulation mode or impedance test mode as described below.
6.6.1 Vmon scaling (Stimulation mode)
When the stimulator function is set to stimulate the voltage monitor scaling is expressed as the
number of volts at the monitor channel output for each volt at the electrode. By default the scaling
is 0.25 V/V meaning that a 1 V signal at the electrode will appear as 0.25 V on the monitor channel.
This setting is appropriate for most electrodes. Adjusting the Vmon scaling might only be necessary
to help resolve small voltages when stimulating with extremely low impedance electrodes. Divide
the voltage observed on the monitor output by the scale factor to determine the voltage at the
electrode. Note that if the Vmon scaling is set higher than 0.25V/V, then the output of the voltage
monitor will saturate before the compliance limit is reached and the may not reflect the actual
voltage at the electrode. See section 7.7, Voltage Monitor, for additional details.
6.6.2 Vmon scaling (Z test mode)
When the stimulator function is set to impedance test (Z test) a 1 kHz ±100 nA sinusoidal current is
applied to the electrode and the resulting peak to peak voltage elicited across the electrode
indicates the impedance of the electrode. Adjust the Vmon scaling control to obtain the largest
peak to peak signal on the monitor channel that is not clipping. Measure the peak to peak
amplitude of the signal on the voltage monitor in millivolts and multiply the reading by the scale
factor to obtain the electrode impedance in Ohms:
© Plexon Inc - 41 -
Page 42
Neurotechnology Research Systems
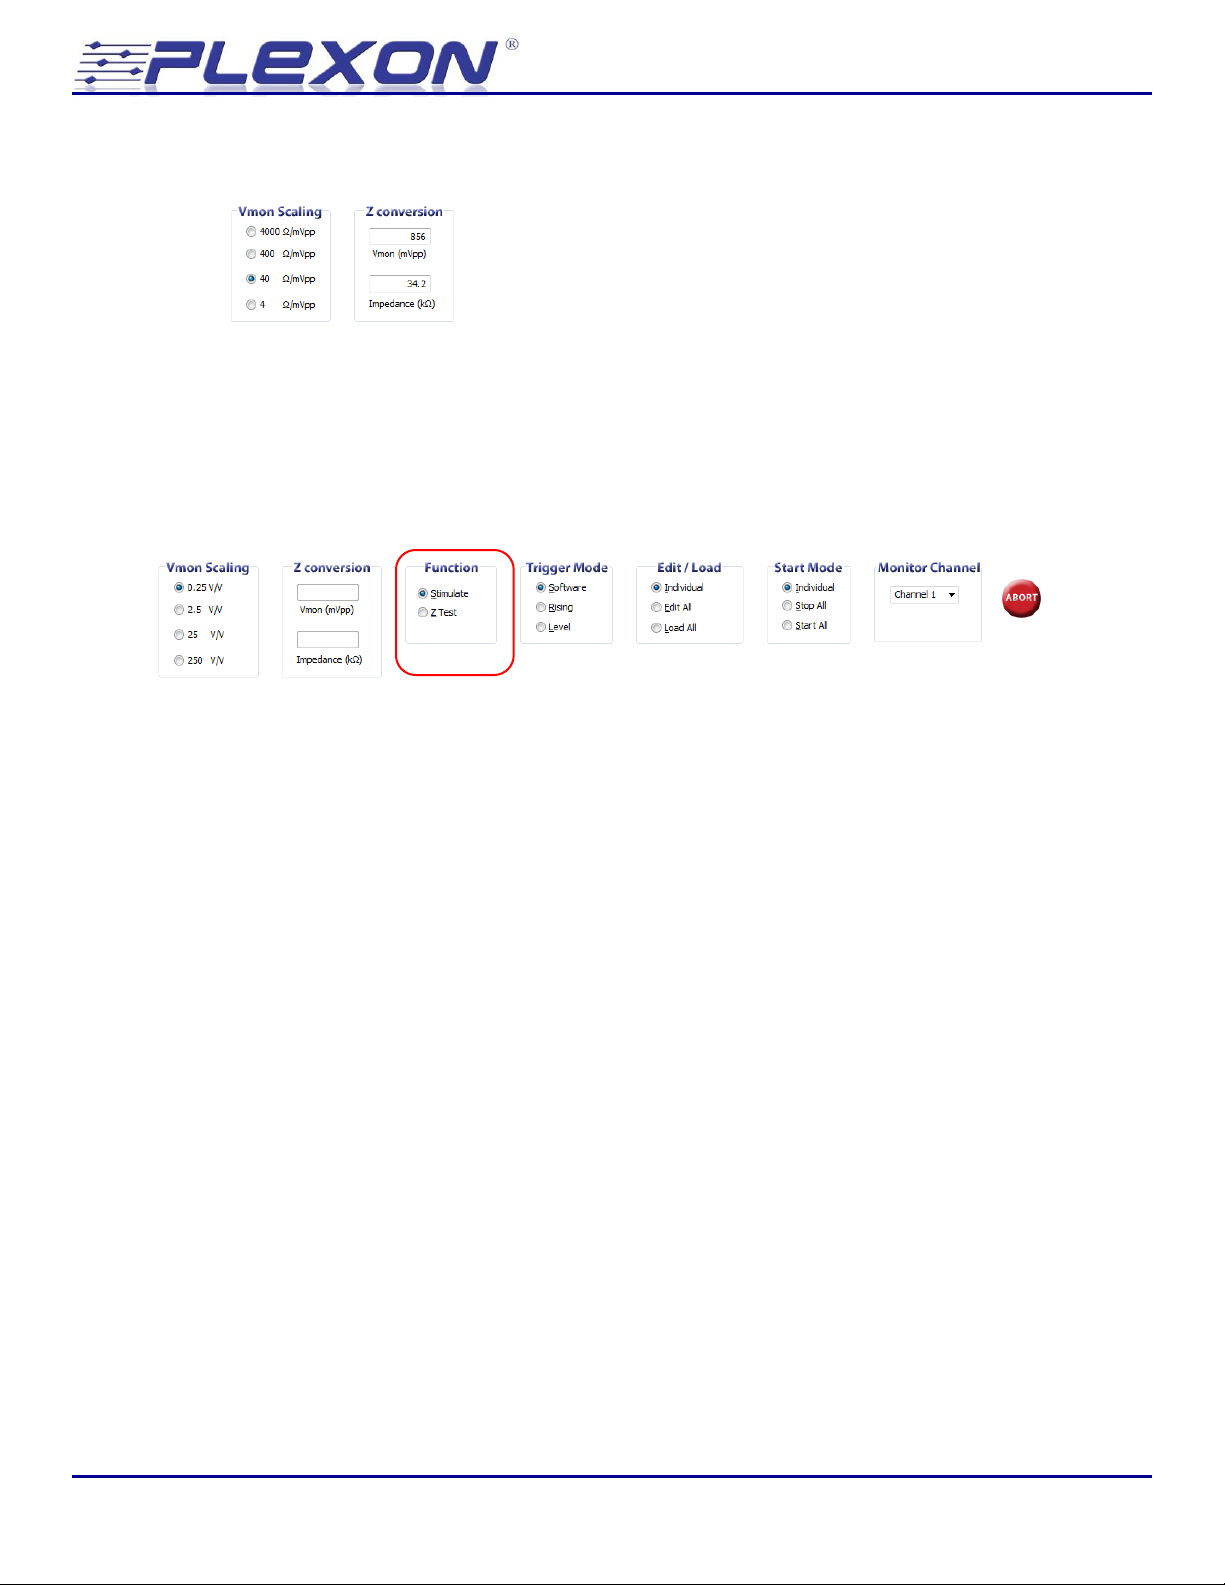
6.6.3 Z conversion
The Z conversion control calculates the electrode impedance from the voltage measurement you
provide. Enter the peak to peak voltage expressed in millivolts that you observed on the voltage
monitor output. The control calculates and displays the corresponding electrode impedance
expressed in k. The voltage monitor scale factor is handled automatically for you.
6.7 Function Stimulate / Function Z test
6.7.1 Stimulate Mode
Select stimulate mode for rectangular pulse or arbitrary waveform stimulation.
6.7.2 Impedance Test Mode
Select impedance test (Z Test) mode to perform impedance testing on electrodes. In impedance
test mode, a 1 kHz ±100 nA sinusoidal stimulation pattern is automatically selected and loaded for
each channel. Start stimulation on a channel and observe the voltage monitor output for that
channel to determine the impedance of the electrode. See section 5.9 for an example.
Stimulator 2.0 - 42 -
Page 43
Neurotechnology Research Systems
Waveform #1
Waveform #2
Complete pattern
Rate 1 2
3
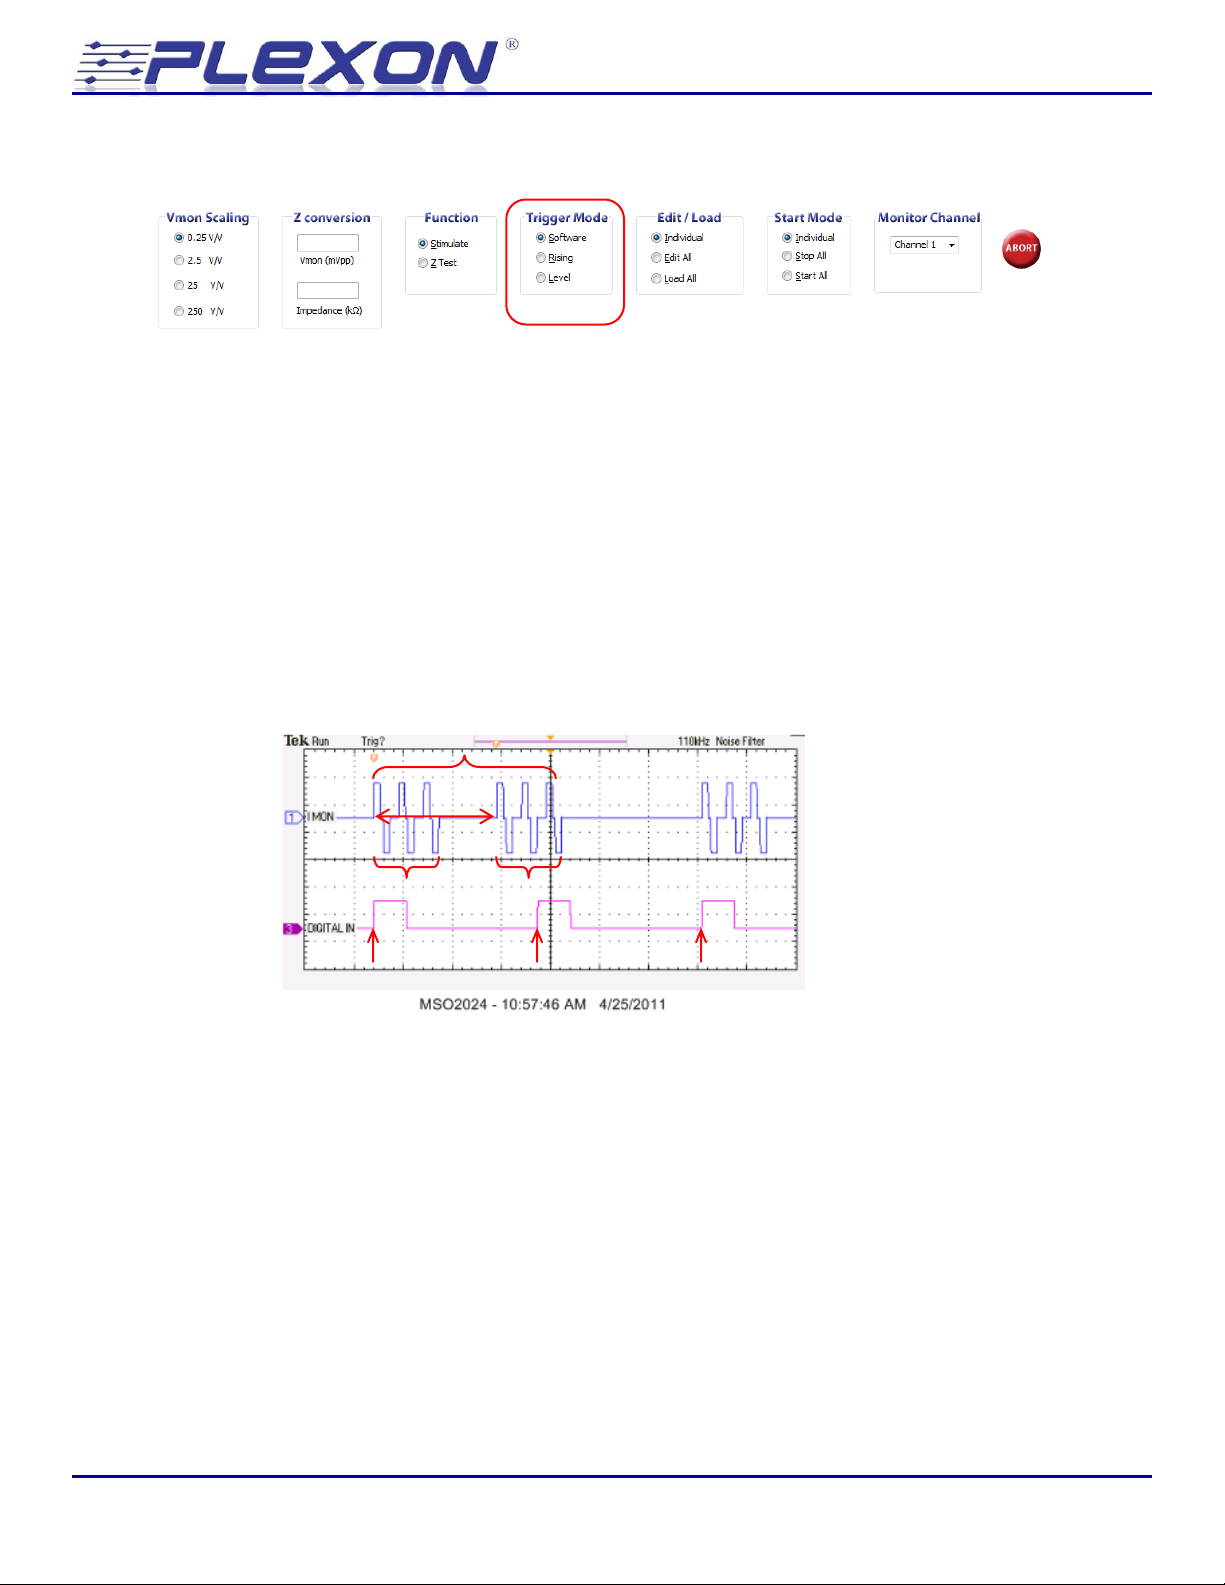
6.8 Trigger Mode
The trigger mode determines how stimulation is initiated. The three trigger modes, Software,
Rising, and Level are described below. In all cases, the stimulation pattern for the channel must be
defined and loaded before it can be triggered.
6.8.1 Software Trigger Mode
In Software mode, stimulation is initiated by clicking on the Start or Start All buttons in the GUI.
Each time Start or Start All is pressed, the stimulation pattern for the channel is initiated.
6.8.2 Rising Edge Trigger Mode
In the Rising trigger mode, stimulation begins when the digital input for the channel transitions
from low (~0V) to high (~5V). The latency from digital input to stimulation onset is less than 1 µs.
In the example above, the stimulation pattern consists of two repetitions of a 3 pulse burst
arbitrary waveform. The stimulation pattern is initiated by the rising edge in the digital input
marked 1. Once the stimulation pattern is triggered it will play to completion even if the digital
input goes low during the stimulation. If another rising edge occurs during the stimulation pattern
it is ignored (e.g. the rising edge marked 2 is ignored).
© Plexon Inc - 43 -
Page 44
Neurotechnology Research Systems
Pattern #1
Pattern #2
1 2 3
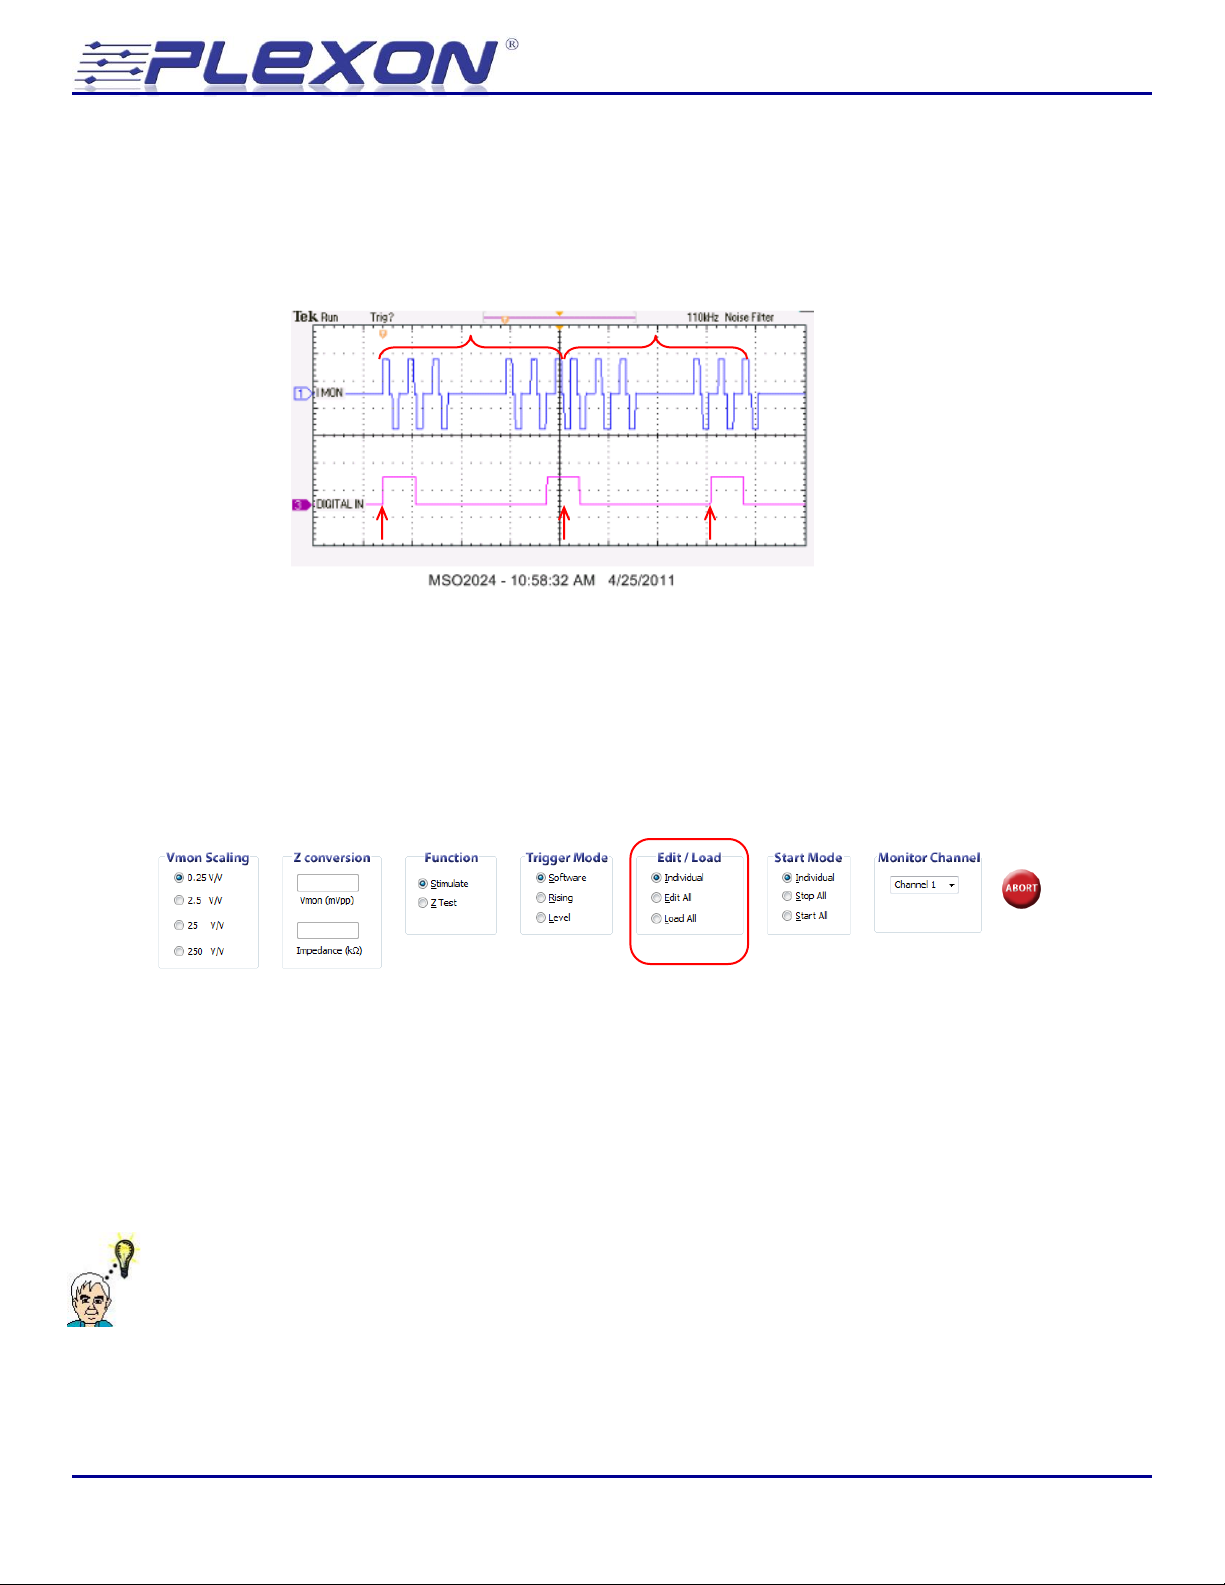
6.8.3 Level Trigger Mode
In the Level trigger mode, stimulation also begins when the digital input for the channel transitions
from low (~0V) to high (~5V), but in level trigger mode, if the digital input is still high when the
stimulation protocol completes then the stimulation protocol will begin again immediately.
In the example above, the stimulation pattern consists of two repetitions of the 3 pulse burst
arbitrary waveform. The stimulation pattern is initiated by the rising edge in the digital input
marked 1. Because the digital input is high at the end of the first stimulation pattern (at the point
marked 2) the stimulation pattern starts playing a second time. Changes to the digital input during
the stimulation pattern are ignored (e.g. the pulse marked 3).
6.9 Edit/Load All
When the Edit/Load control is in Individual mode, the mode of each channel can be configured
using the individual Edit and Load controls in the row of controls dedicated to that channel.
Pressing the Edit All button causes all channels to switch to parameter editing mode. Note that
pressing Edit All will cause any stimulation pattern in progress on any channel to stop. Pressing the
Load All button will cause the stimulation parameters for all channels to be downloaded into the
stimulator.
Pressing Edit All or Load All will also cause individual channel edit and load contols to be grayed
out. Press the Individual button to configure the mode of each channel independently of the others.
Hint: You probably want to return the Edit/Load control to Individual after pressing Edit All or
Load All and there is no reason not to do so.
Stimulator 2.0 - 44 -
Page 45
Neurotechnology Research Systems
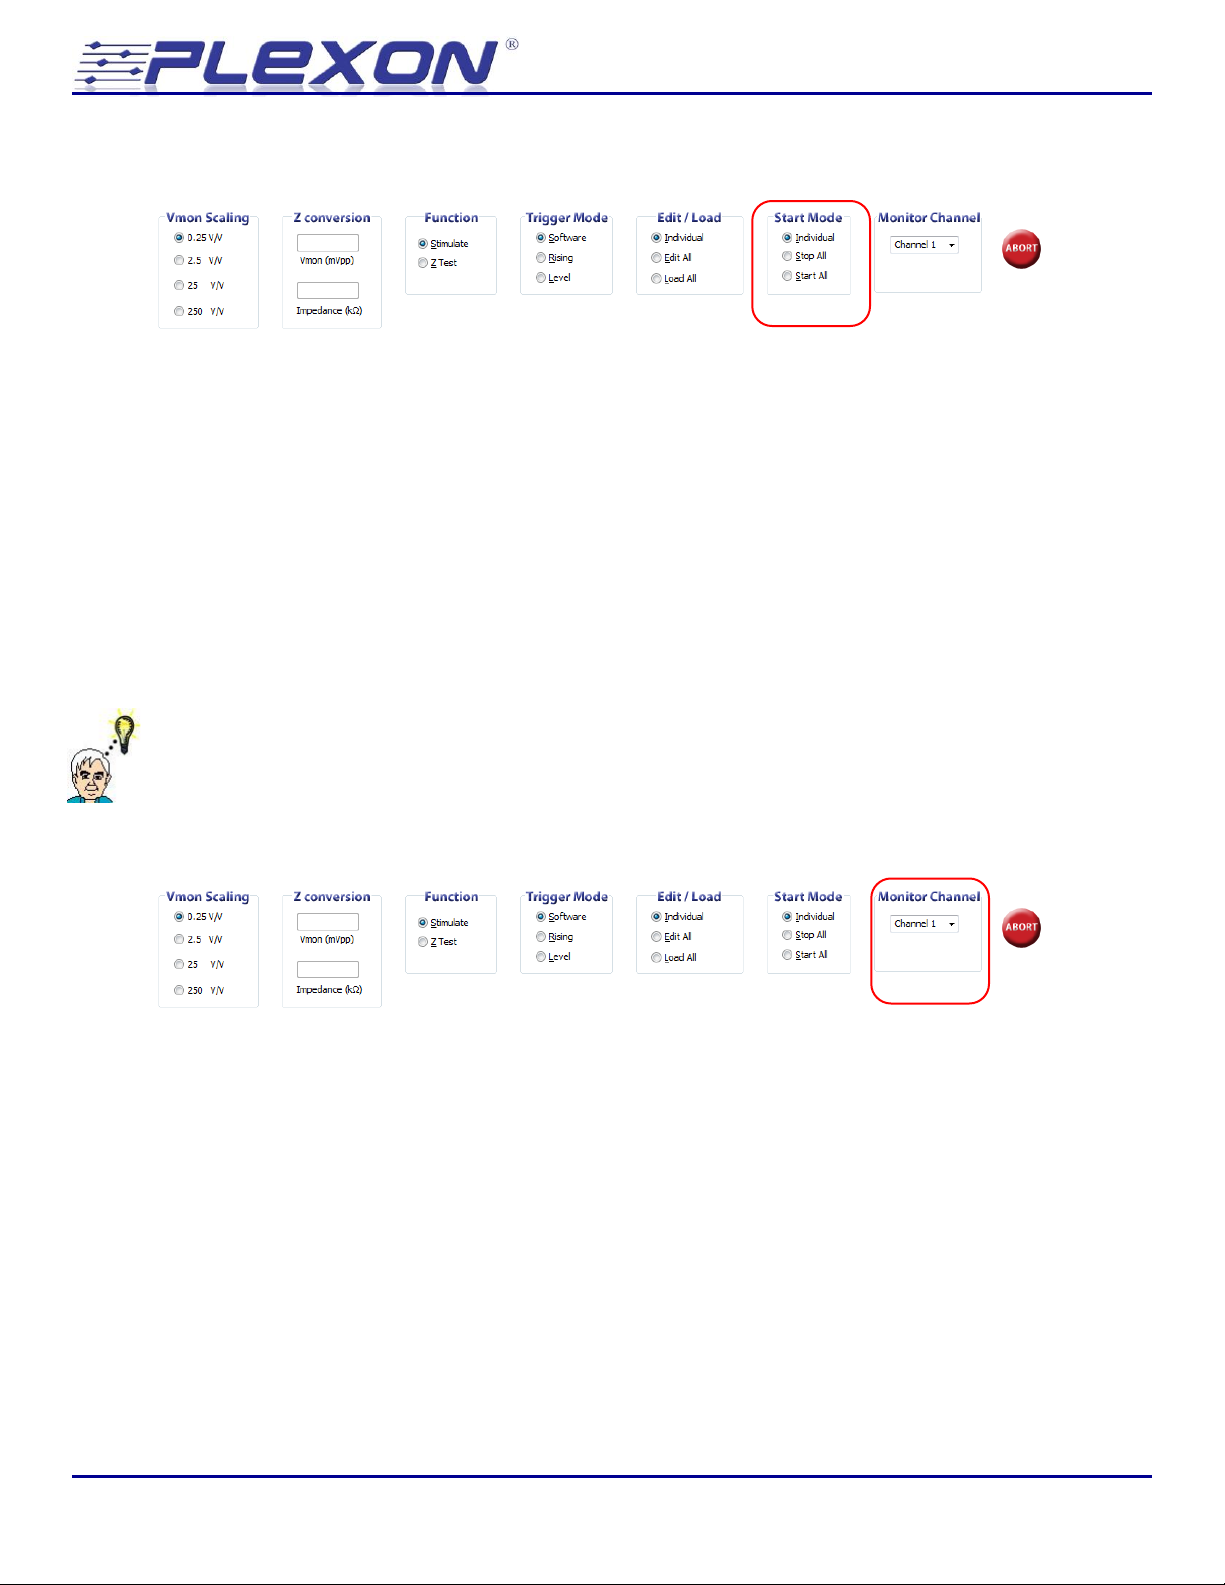
6.10 Start Mode
When the Start Mode control is in Individual mode, each channel and can be started or stopped
using the individual Start and Stop controls in the row of controls dedicated to that channel. Refer
to section 6.2 for a description of Stop and Start.
Pressing Stop All is a convenient way to stop the stimulation in progress on every channel. Pressing
Start All is a convenient way to start the stimulation protocol on every channel. Pressing Start All is
also the only way to start stimulation on multiple channels simultaneously from the GUI. Complex
multichannel stimulation protocols can be initiated using the Start All function. First define and
load the appropriate stimulation pattern for the channels you wish to stimulate and then initiate
the multichannel stimulation pattern by pressing the Start All button.
Note the pressing Stop All or Start All causes the individual channel Stop and Start controls to be
grayed out. Press the Individual button to start or stop channels independently.
Hint: You probably want to return the Start Mode to Individual after pressing Stop All or Start All
and there is no reason not to do so.
6.11 Monitor Channel
Use the dropdown menu to select one channel for display on the voltage and current monitor
outputs. Only one channel may be monitored a time. Connect the current and voltage monitor
outputs to an oscilloscope using standard BNC cables to see the stimulation pattern that is being
applied to the selected electrode.
© Plexon Inc - 45 -
Page 46
Neurotechnology Research Systems
Stop
Abort
Pulse in progress completes
Pulse in progress does NOT complete
6.12 ABORT
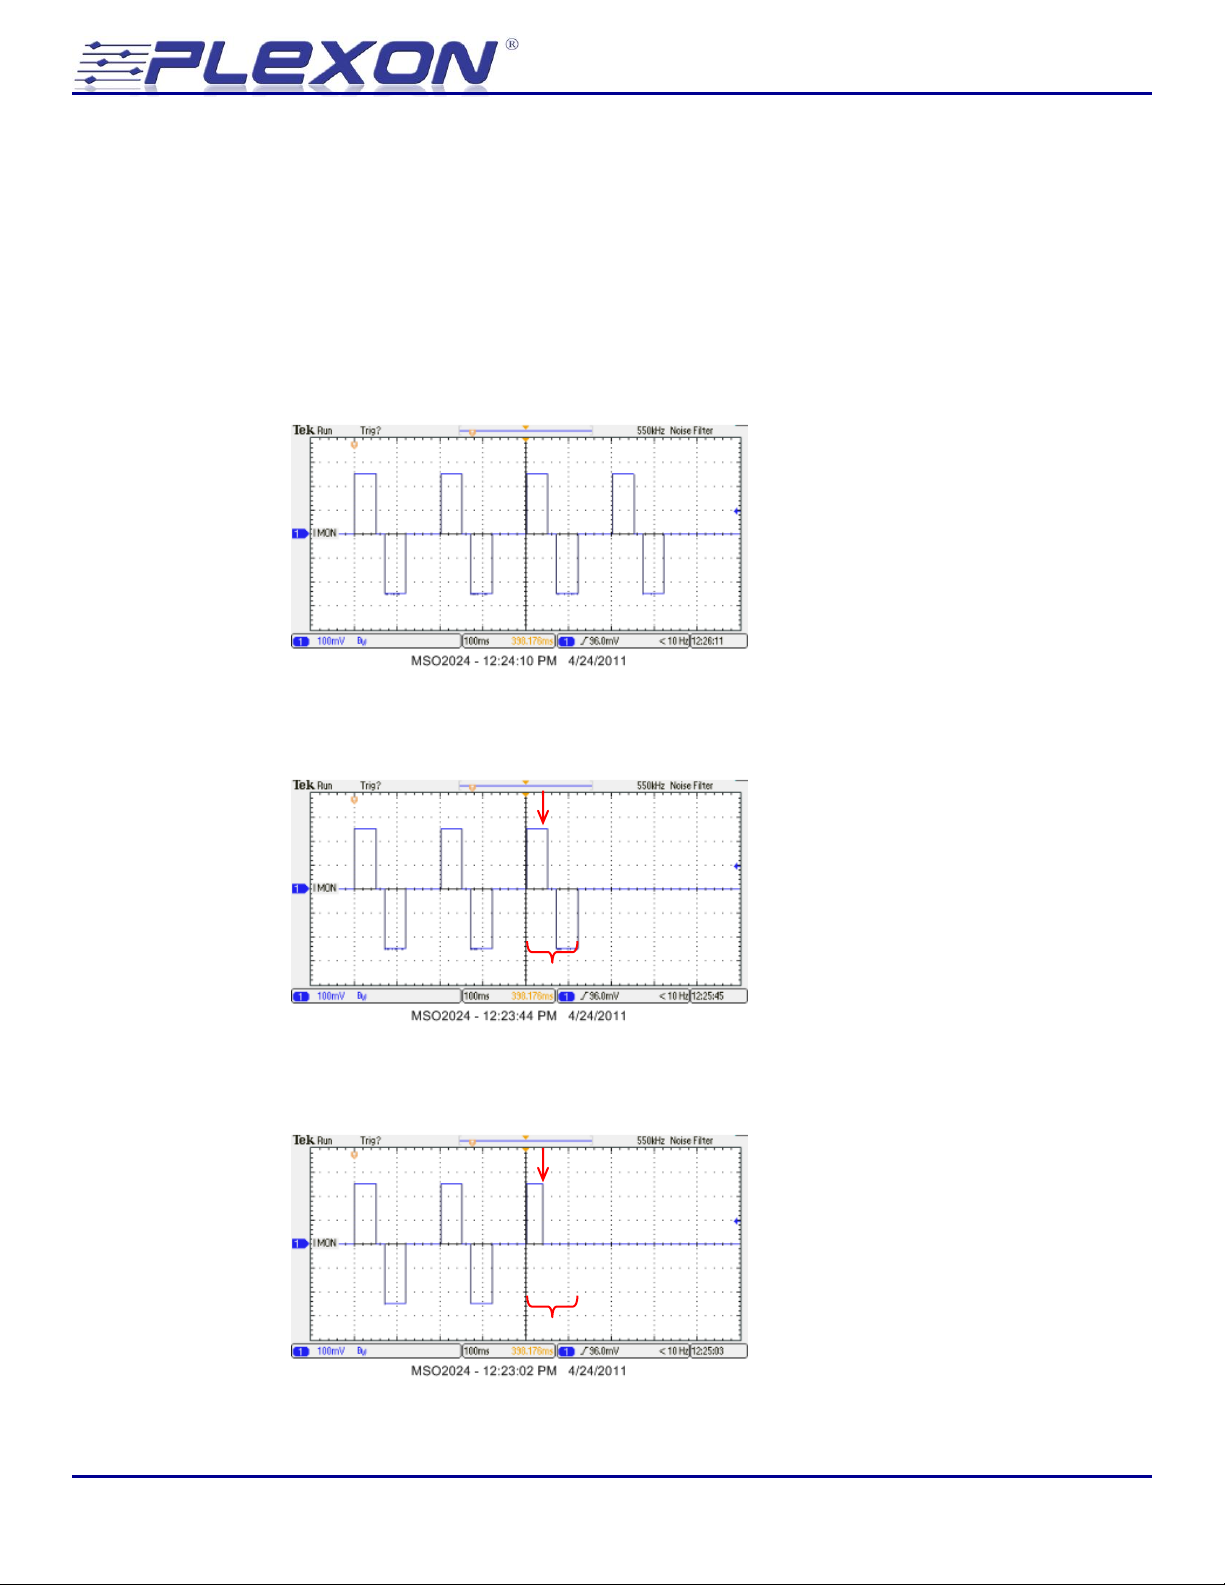
Pressing the red ABORT button will cause all stimulation to stop immediately even if there is a
pulse or arbitrary waveform in progress. This is in contrast to stopping stimulation by pressing
stop, stop all, edit, or edit all where a pulse or arbitrary waveform that is in progress will play to
completion. Pressing ABORT also causes all channels to return to the edit mode. If the stimulator is
in impedance test mode, it will return to stimulate mode.
Consider a complete stimulation pattern that is composed of four pulses:
Pressing stop, stop all, edit, or edit all in the middle of the third pulse causes the stimulation to end
after the third pulse completes. Allowing the pulse to complete helps to preserve charge balance.
Pressing abort in the middle of third pulse results in a truncated third pulse and an unbalanced
stimulation, but is the fastest way to stop an ongoing stimulation.
Stimulator 2.0 - 46 -
Page 47
Neurotechnology Research Systems
6.13 File Open / File Save
The rectangular pulse parameters (phase amplitude, phase width, inter-phase delay, No. of
repetitions, and rate) for all channels can be saved to a user named file for future use by clicking the
Save icon or by selecting Save from the File menu. These configuration files have an extension of
“.stm”.
In addition, whenever you close the stimulator user interface, the current values of the rectangular
pulse parameters are automatically saved to a file called “LastConfig.stm”. These parameters are
then automatically re-loaded the next time you open the user interface.
Note that if any channels have been configured to use an arbitrary waveform pattern, neither the
fact that the channel has been configured to use an arbitrary waveform pattern nor the name of the
arbitrary waveform pattern are saved to the configuration file. You must manually configure
channels to use arbitrary waveform patterns and manually load the arbitrary waveform patterns
for those channels.
The default values of the rectangular pulse parameters are stored in a read only file called
“Factory_Default.stm”. If you open the “Factory_Default.stm” file just after launching the software
you will restore the GUI controls to their factory fresh state.
© Plexon Inc - 47 -
Page 48
Neurotechnology Research Systems
Waveform
Waveform
Interpulse
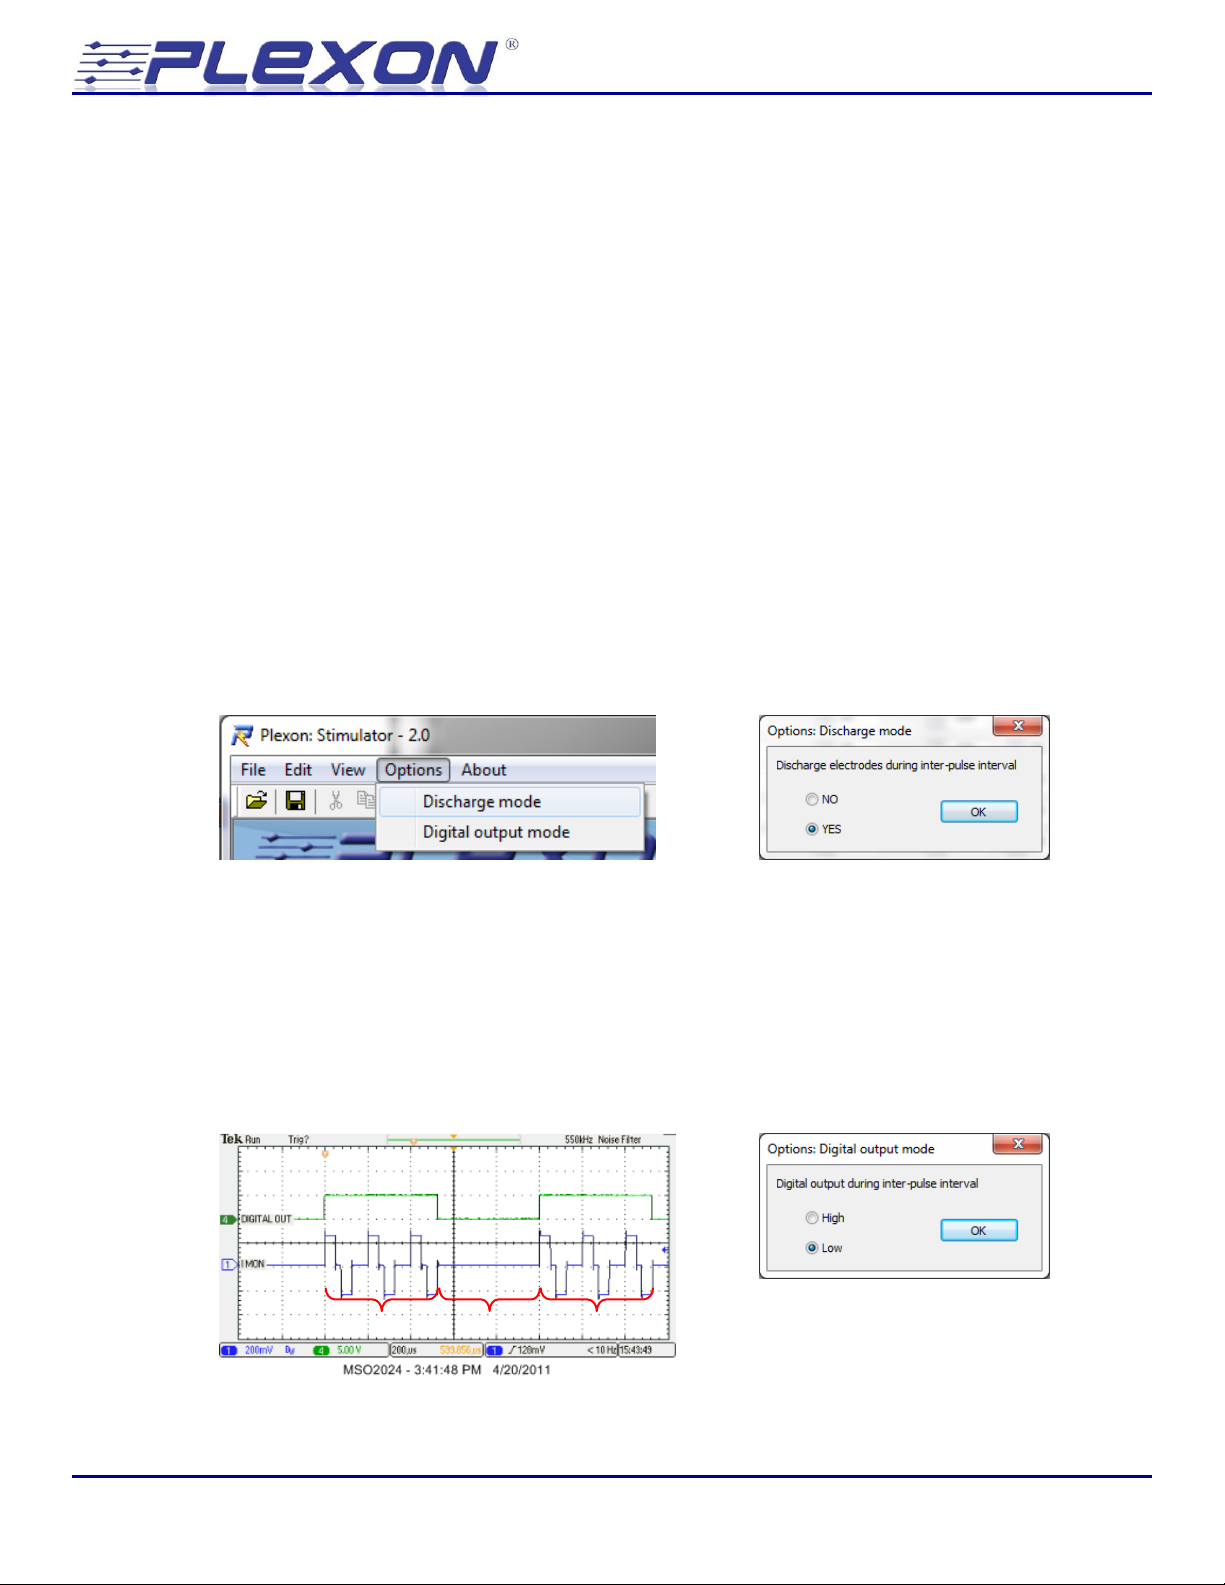
6.14 Options: Discharge Mode
Caution: Only advanced users who fully understand the implications should attempt to change the
discharge mode setting. If you have any questions do NOT change the discharge mode setting.
Even when the stimulator is programmed to deliver a “balanced” stimulation in which equal
amounts of charge are deposited on and removed from the electrode, a net accumulation of charge
on the electrode can occur. This accumulation of charge can occur when the compliance limit is
reached during the stimulation (see section 5.6) or because the electrode response or circuit
response is not perfectly linear. The accumulation of charge will result in a slow drifting of the
electrode baseline voltage over time and can result in the electrode staying at excessive voltages for
prolonged periods of time. In order to guard against un-intentional electrode charging, all
electrodes are automatically discharged in between pulses and any time the channel is not
stimulating. Advanced users ONLY may disable the automatic discharge of the electrodes that
occurs between pulses. Note however, that disabling automatic electrode discharge can lead to
excessive voltages developing on the electrode during extended stimulation patterns. It is essential
to monitor the voltage of the electrodes frequently when the automatic electrode discharge feature
is disabled. To disable this feature, select Discharge mode from the Options menu and then select
NO.
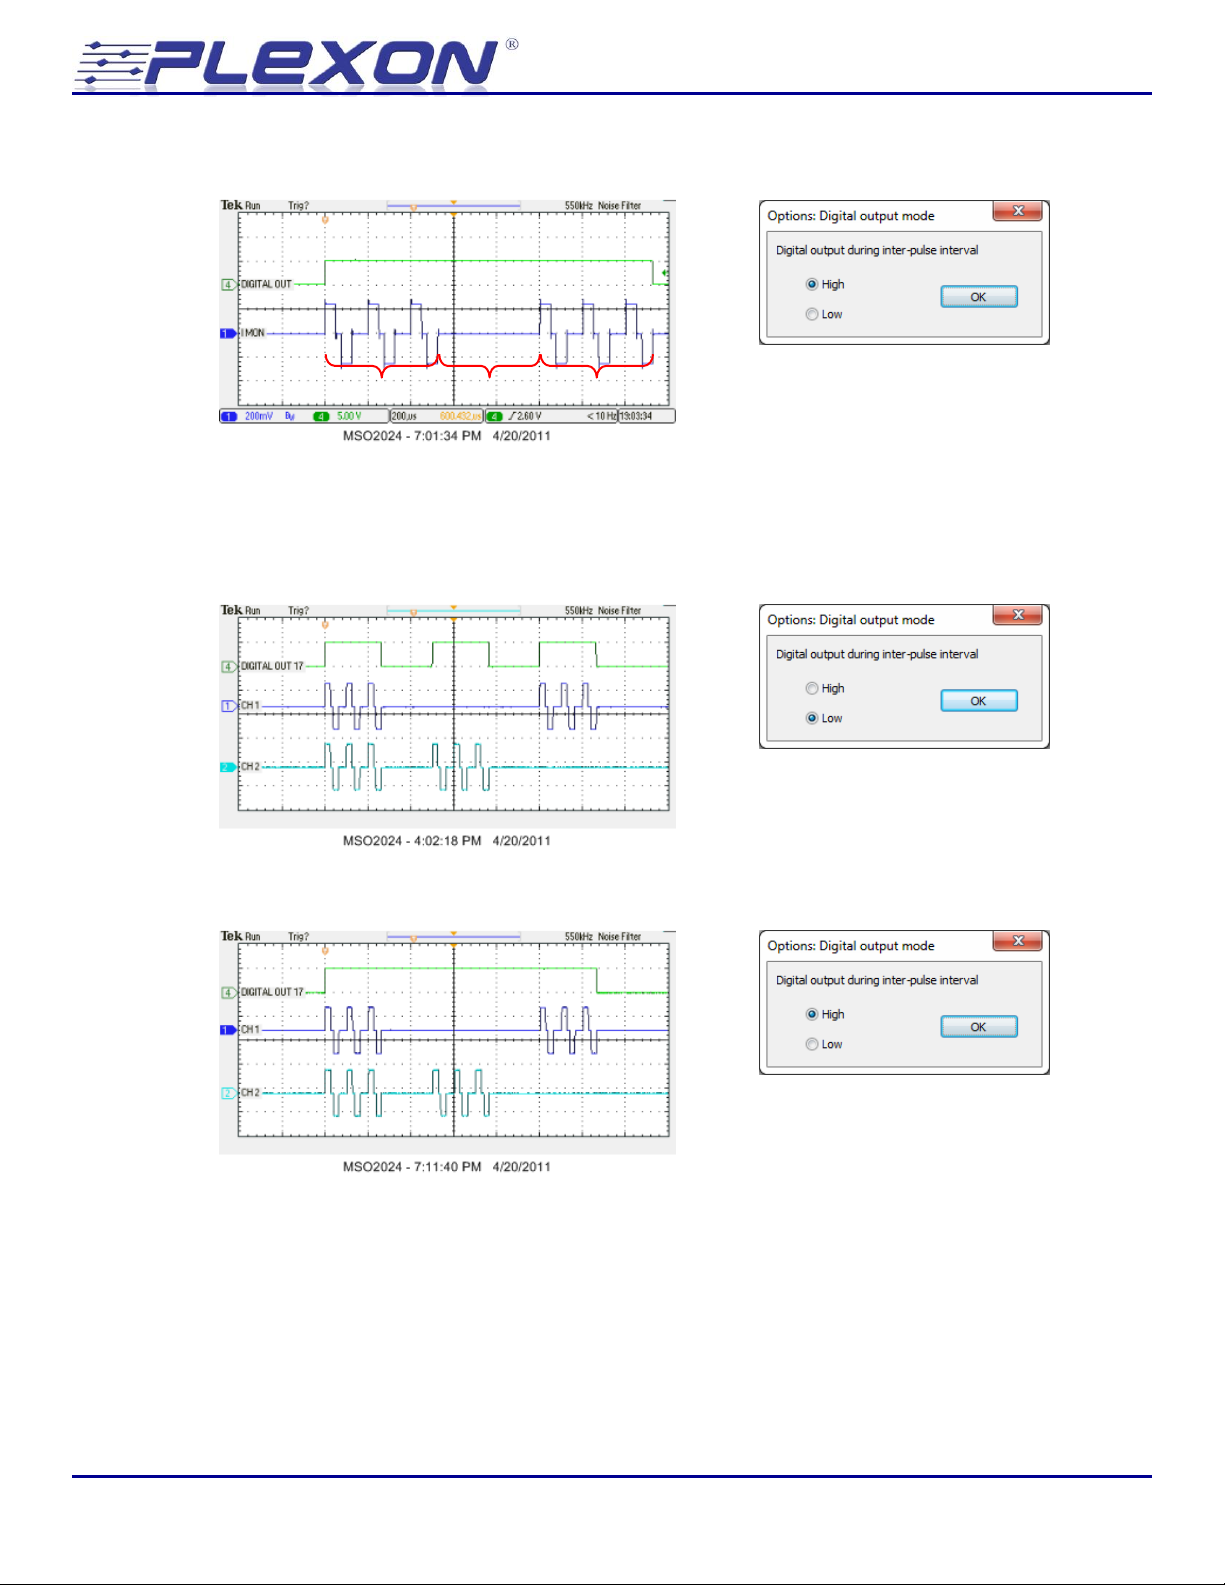
6.15 Options: Digital Output Mode
Each stimulator channel has a dedicated digital output that indicates when stimulation is occurring
on that channel. The digital output is always high during the pulse or arbitrary waveform output,
but the user can control the state of the digital output during the time in between pulses or
arbitrary waveforms by selecting Digital output mode from the options menu.
Digital output mode set to low during inter-pulse interval:
Stimulator 2.0 - 48 -
Page 49
Neurotechnology Research Systems
Waveform
Waveform
Interpulse
Digital output mode set to high during inter-pulse interval:
There is also a 17th digital output that goes high when ANY channel is playing back a stimulation
waveform:
Digital output 17 with digital output mode set to low during inter-pulse interval:
Digital output 17 with digital output mode set to high during inter-pulse interval:
© Plexon Inc - 49 -
Page 50
Neurotechnology Research Systems
Pin
Function
1
-5 V, 1.5A
2
NC 3 NC 4 −15 V, 0.5A
5
Analog IO GND
6
Analog IO GND
7
+5 V, 1.5A
8
+15 V, 0.5 A
9
NC
7 8 9
1
2
4 5 6
3
1 – DI 1 3 – DI 3
5 – DI 5
7 – DI 7
9 – DI 9
11 – DI 11
13 – DI 13
15 – DI 15
17 – Reserved
19 – Dig. IO GND
2 – DI 2
4 – DI 4
6 – DI 6
8 – DI 8
10 – DI 10
12 – DI 12
14 – DI 14
16 – DI 16
18 – Dig. IO GND
20 – Dig. IO GND
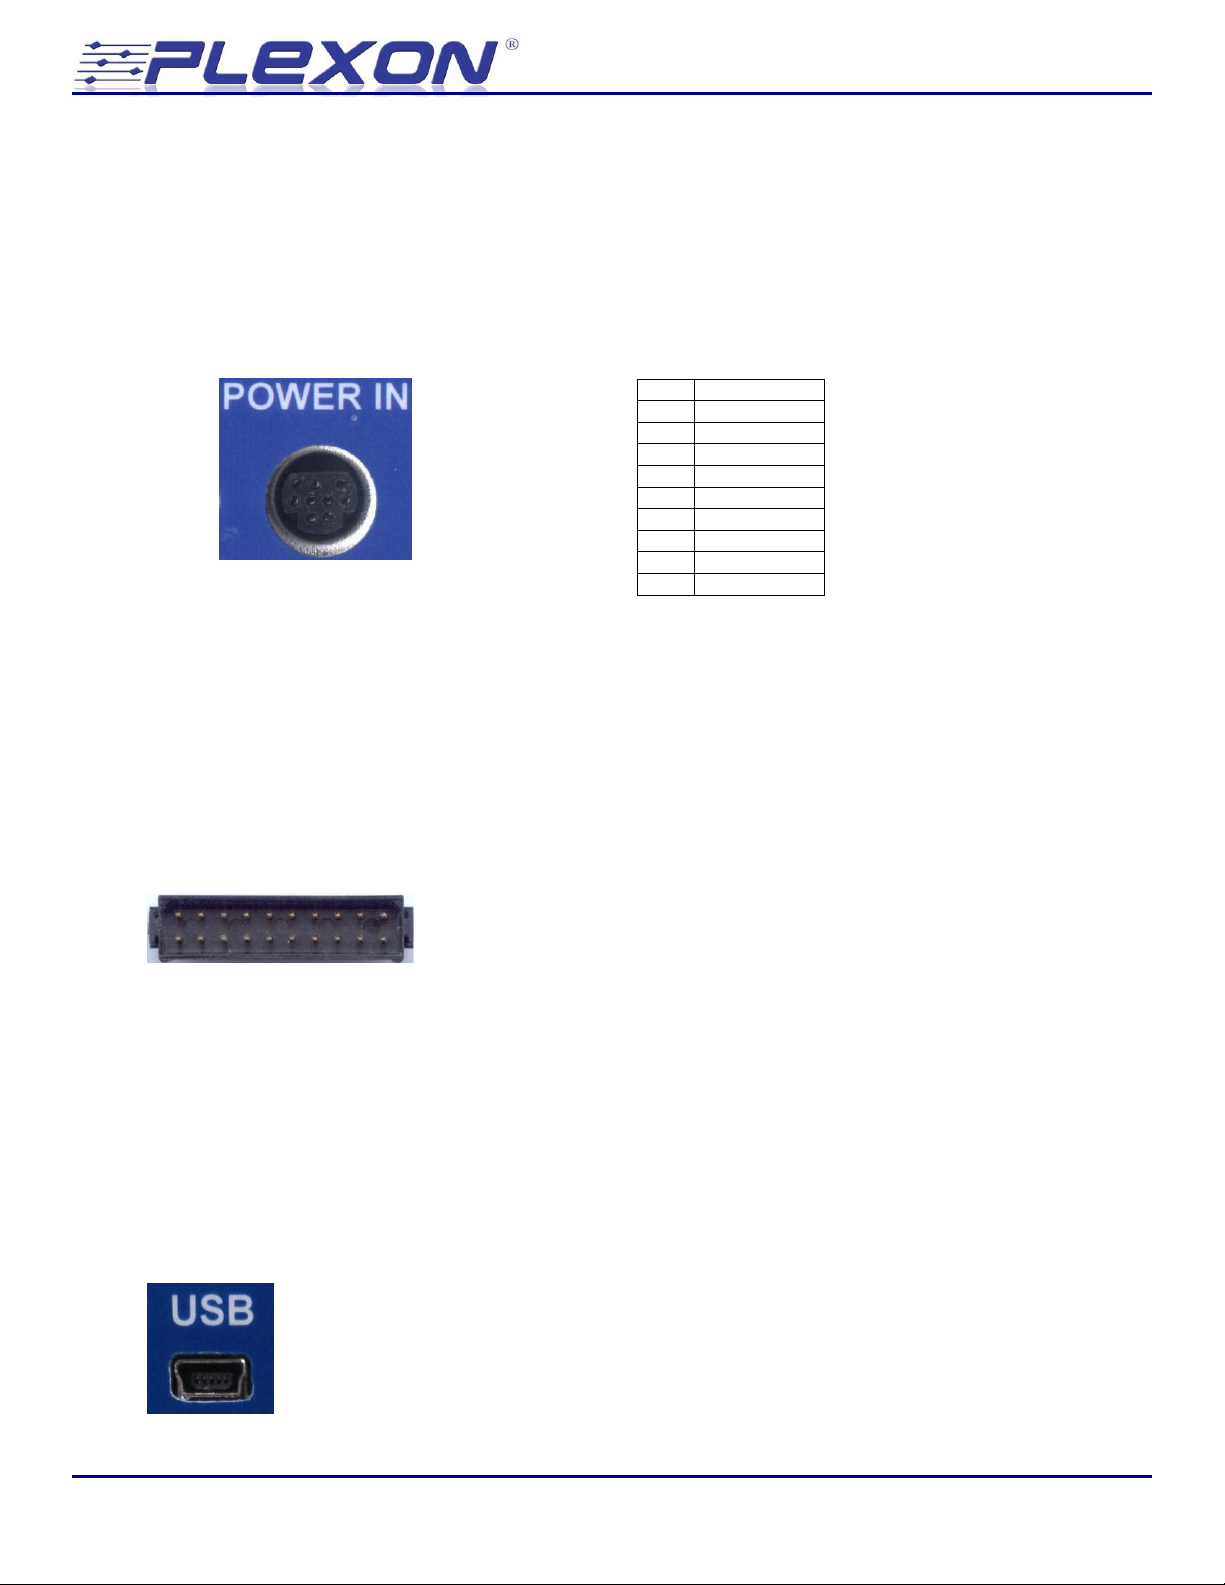
7 Input and Output Connectors
7.1 Power In
This information is provided for reference only. Use the recommended Plexon power supply and
cable to power the stimulator. The power input connector is a standard 9-pin circular mini DIN
connector. The stimulator operates from ±5V and ±15V power supplies.
7.2 Digital In
Each channel in the stimulator has a dedicated digital input (DI) that can initiate stimulation on that
channel. See sections 5.11 and 6.8. The inputs are TTL compatible.
7.3 USB 2.0
The stimulator has a mini type B USB 2.0 receptacle for communications with the host computer.
The USB receptacle on the stimulator is connected to digital IO ground. The USB connector on the
host computer is typically connected to the AC wall outlet ground. Therefore, the USB cable
typically connects the digital IO ground on the stimulator to the AC wall outlet ground.
Stimulator 2.0 - 50 -
Page 51
Neurotechnology Research Systems
1 – DO 1 3 – DO 3
5 – DO 5
7 – DO 7
9 – DO 9
11 – DO 11
13 – DO 13
15 – DO 15
17 – DO 17 19 – Dig. IO GND
2 – DO 2
4 – DO 4
6 – DO 6
8 – DO 8
10 – DO 10
12 – DO 12
14 – DO 14
16 – DO 16
18 – Reserved
20 – Dig. IO GND
1 – Ch 1 Out
3 – Ch 3 Out
5 – Ch 5 Out
7 – Ch 7 Out 9 – NC
11 – Analog IO GND
13 – NC
15 – Ch 9 Out
17 – Ch 11 Out
19 – Ch 13 Out
21 – Ch 15 Out
23 – NC
25 – Analog IO GND
2 – Ch 2 Out
4 – Ch 4 Out
6 – Ch 6 Out
8 – Ch 8 Out
10 – NC
12 – NC
14 – NC
16 – Ch 10 Out
18 – Ch 12 Out
20 – Ch 14 Out
22 – Ch 16 Out
24 – NC
26 – NC
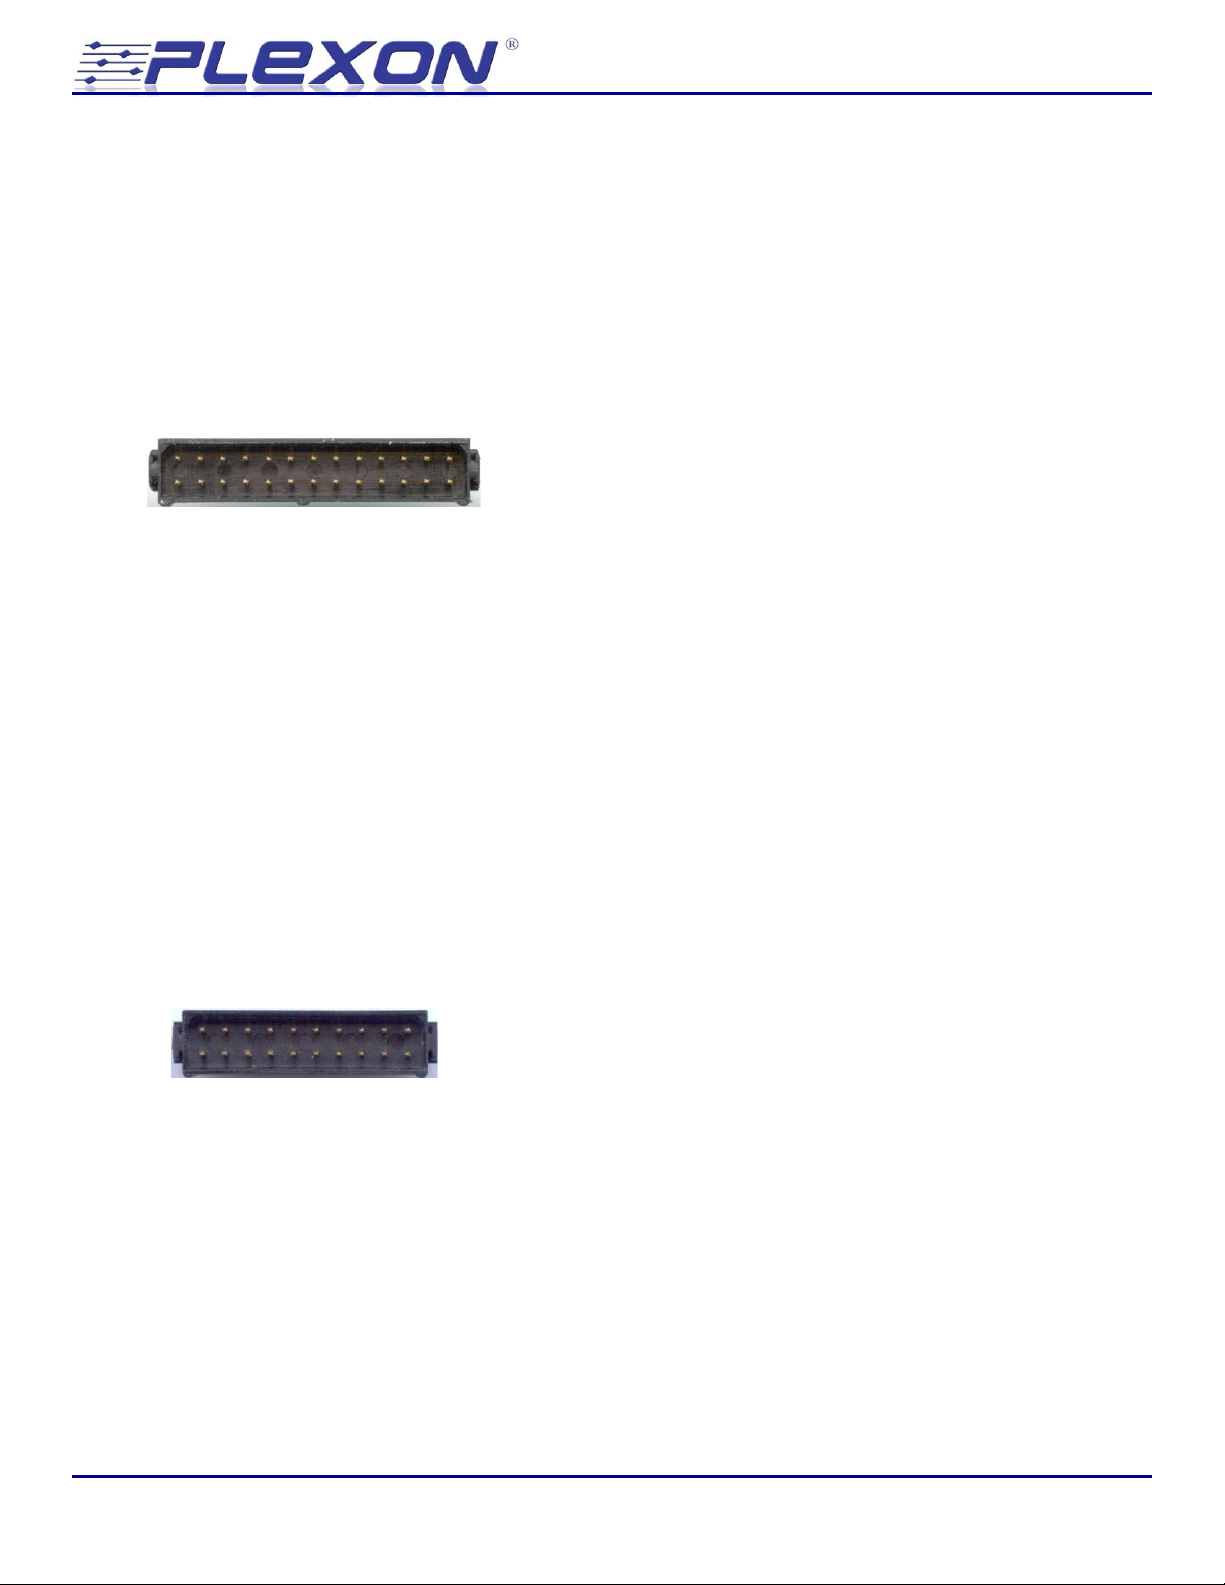
7.4 Stim Out
The stimulation output connector is where the stimulation currents exit the box. Note that the
Analog IO ground is isolated from the Digital IO ground and from the AC wall outlet ground.
7.5 Digital Out
Digital outputs 1 – 16 indicate when the corresponding channels are stimulating. Digital output 17
goes high when any channel is stimulating. See section 6.15, Options: Digital Output Mode for
additional details.
© Plexon Inc - 51 -
Page 52
Neurotechnology Research Systems
250 mV @ I
MON
= 100 µA @ electrode
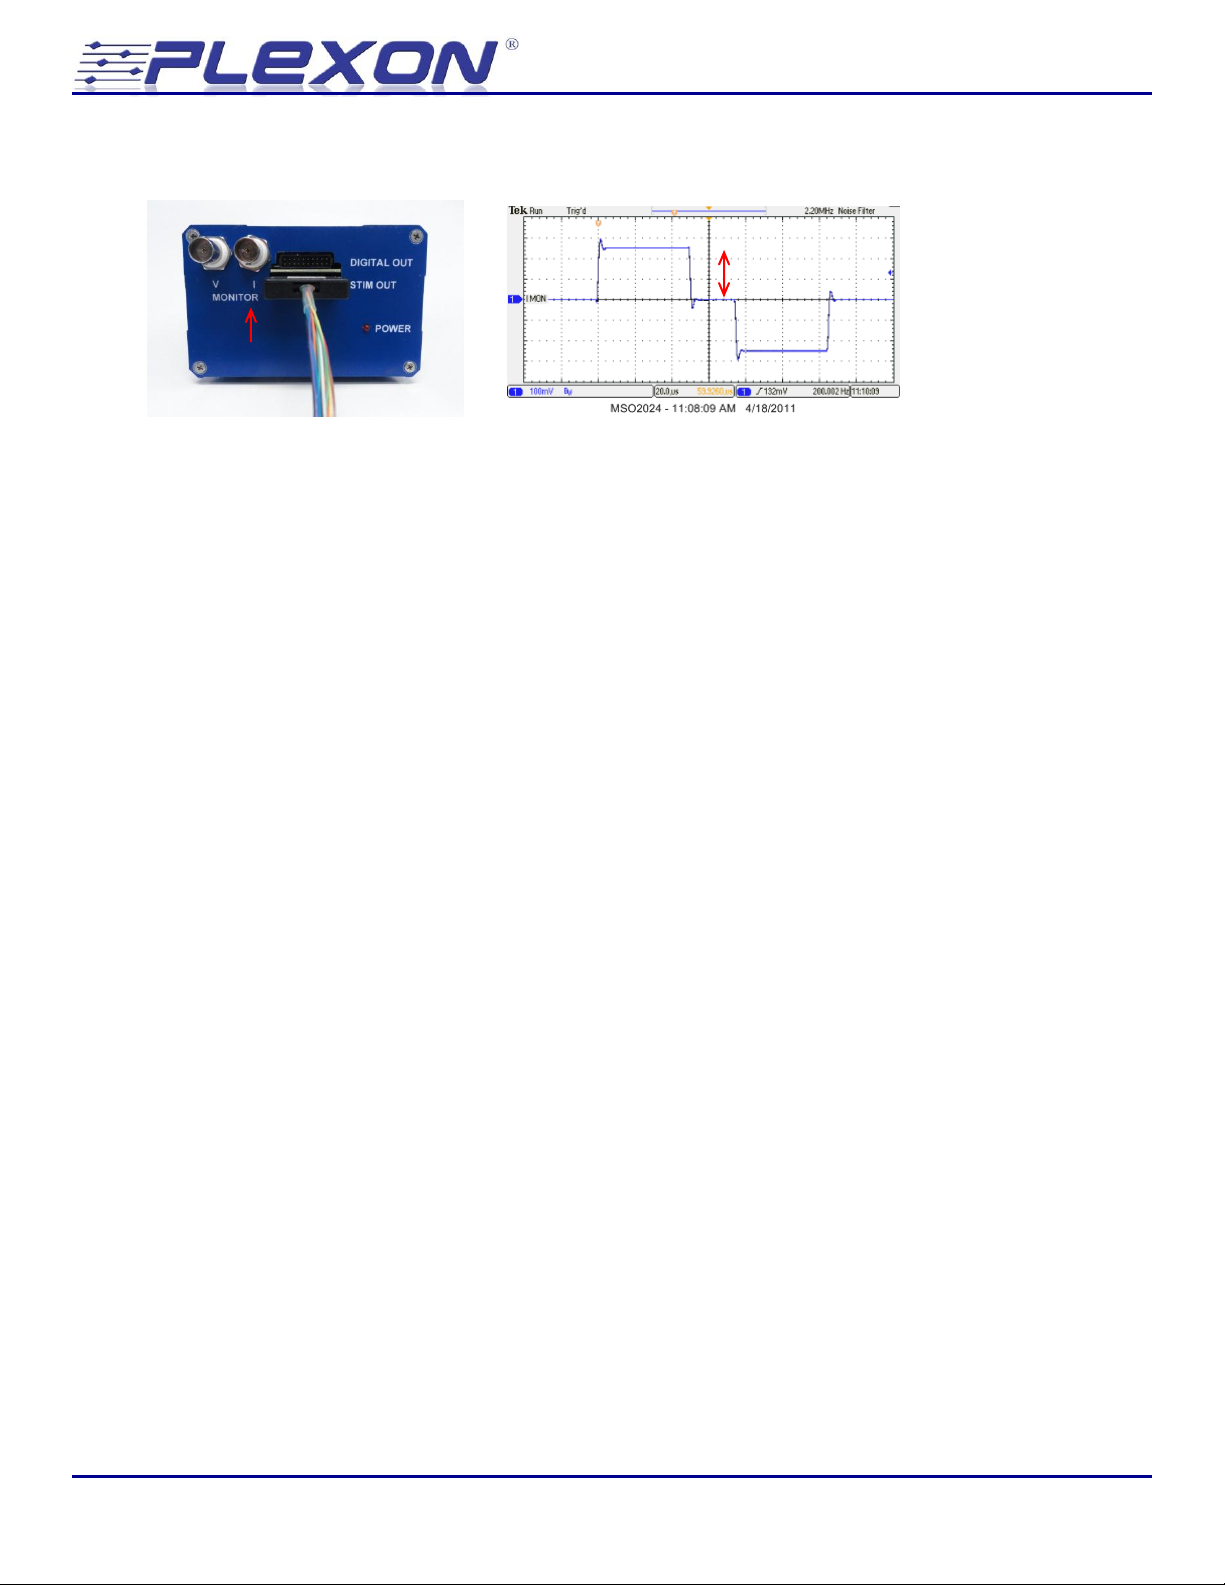
7.6 Current Monitor
The current monitor displays a scaled representation of the actual current flowing into the selected
electrode at any given time. The scaling factor for the current monitor output is 2.5 mV/µA. A
100 µA signal at the electrode will appear as a 250 mV signal on the oscilloscope. Use an
oscilloscope to observe the current monitor output.
Note that the outer contact of the current monitor BNC connector is connected to analog IO ground.
The outer contact of the BNC connectors on many oscilloscopes is connected to the AC wall outlet
ground. Therefore connecting a BNC cable between the current monitor output and an oscilloscope
will typically connect the stimulator analog IO ground to the AC wall outlet ground.
If the output of the current monitor does not appear to match the stimulation pattern you
requested, refer to section 5.5, Verifying the output on an oscilloscope and section 5.6, Compliance
voltage and stimulation failure.
Stimulator 2.0 - 52 -
Page 53
Neurotechnology Research Systems
2 – Channel 2
4 – Channel 4
6 – Channel 6
8 – Channel 8
10 – NC
12 – NC
14 – NC
16 – Channel 10
18 – Channel 12
20 – Channel 14
22 – Channel 16
24 – NC
26 – NC
B1 – Channel 9
B2 – Channel 10
B3 – Channel 11
B4 – Channel 12
B5 – Channel 13
B6 – Channel 14
B7 – Channel 15
B8 – Channel 16
B9 – NC
B10 – Return 2
391 mV @ V
MON
= 1.56 V @ electrode
7.7 Voltage Monitor
In stimulation mode, the voltage monitor outputs a voltage that is proportional to the voltage being
applied to the selected electrode. Refer to section 5.5, Verifying the output on an oscilloscope for
some examples. By default the Vmon scaling (see section 6.6.1) is set to 0.25 V/V and the voltage
monitor output is one fourth the actual voltage at the electrode. This setting is appropriate for
almost all electrodes. Note that the output range of the voltage monitor is ±3.25 V. If the Vmon
scaling is set higher than 0.25V/V, then the output of the voltage monitor will saturate before the
compliance limit is reached and the may not reflect the actual voltage at the electrode. For example,
with the Vmon scaling set to 2.5 V/V, the voltage monitor will saturate when the electrode voltage
is only ±1.3V, which is well below the maximum stimulator output voltage.
In Z test mode, the voltage monitor outputs a voltage that is proportional to the impedance of the
electrode. See sections 5.9, Impedance measurement, and 6.6, Vmon scaling and Z conversion, for
additional details.
Note that the outer contact of the voltage monitor BNC connector is connected to analog IO ground.
The outer contact of the BNC connectors on many oscilloscopes is connected to the AC wall outlet
ground. Therefore connecting a BNC cable between the voltage monitor output and an oscilloscope
will typically connect the stimulator analog IO ground to the AC wall outlet ground.
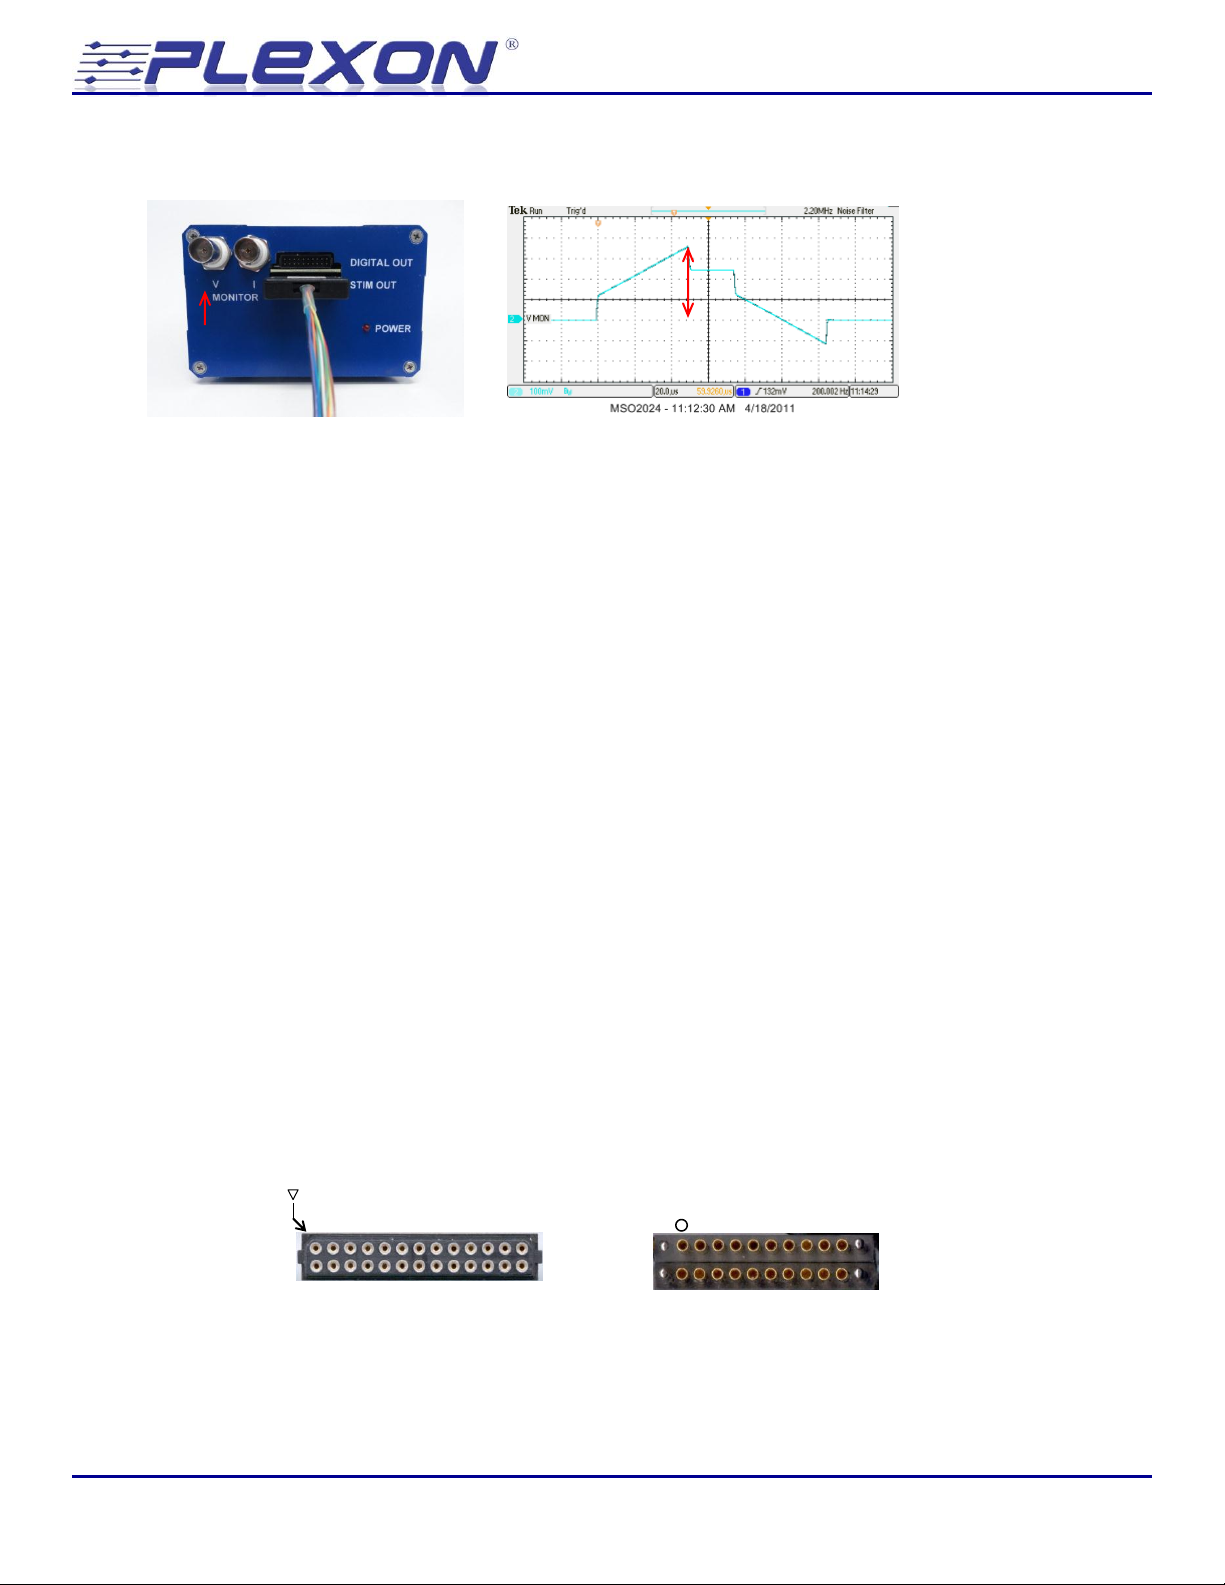
7.8 Stimulation Cable
The pinout for the stimulation cable with Plexon PN 14-03-A-03 is provided below for your
convenience.
© Plexon Inc - 53 -
Page 54
Neurotechnology Research Systems
8 Sample Arbitrary Waveform Pattern Files
Several example arbitrary waveform files are installed with the Stimulator software. These files
were designed to illustrate how to use arbitrary waveform files and some of the things you can
accomplish using arbitrary waveform files. Each file is described briefly below. By default these files
are installed in the directory “C:\PlexonData\Stim-2\Waveform pattern files”. The files can be
opened with any text editor (e.g. Notepad).
“3_pulse_burst_fixed.pat” and “3_pulse_burst_variable.pat” both code for an identical sequence of
three pulses. These files illustrate the two different arbitrary waveform file formats. One file is
coded using the fixed sampling rate format described in section 6.5.1 and the other is coded using
the variable sampling rate format described in section 6.5.2. Creating an arbitrary waveform file
containing multiple rectangular pulses is useful for creating complex temporal patterns of
rectangular pulses that cannot be created using the GUI controls alone. For instance, a sequence
consisting of bursts separated by idle periods can be created by defining the burst in an arbitrary
waveform pattern file and then using the GUI controls to repeat the burst with the desired amount
of time in between bursts. See section 5.8 for an example of such a waveform created using the
“3_pulse_burst_variable.pat” arbitrary waveform pattern file.
When using the GUI controls to define rectangular pulses, the minimum interphase delay (the time
between the two pulse phases) that can be entered is 5 µs. You can however define a pulse with
zero interphase delay by using an arbitrary waveform file. This is illustrated in the file
“no_interphase_delay.pat”.
The file “sine modulated pulses_var.pat” contains a sequence of pulses delivered at 150 Hz whose
amplitudes are modulated by a 5 Hz sinusoidal envelope. Such amplitude modulated stimulation
patterns can be used to mimic theta rhythm and other oscillatory brain patterns.
The files “spike_40k_20uA.pat” and “spike_40k_100uA.pat” are actual extracellular spike waveforms
recorded with an acquisition system that was sampling at 40 kHz. These files illustrate the extreme
flexibility of arbitrary waveform patterns. The two files represent two different scaling of the
original extracellular voltage recording into current. In one the minimum voltage of the action
potential was scaled to 20 µA and in the other it was scaled to 100 µA.
The files “spike_160k_20uA.pat” and “spike_160k_100uA.pat” illustrate the ability of the stimulator
to play back waveforms at very high sampling rates. These files are based on the same data as their
“40k” counterparts described above, but the original 40 kHz spike waveform has been interpolated
and up-sampled to 167 kHz. This results in a noticeably smoother waveform on playback.
Stimulator 2.0 - 54 -
Page 55
Neurotechnology Research Systems
0 100 200 300 400 500 600 700 800 900 1000
0
2
4
6
8
10
12
14
Stimulator Current Output (µA)
Maximum Voltage Output (V)
Simulator Compliance Voltage
9 Stimulator Limitations
9.1 Maximum Compliance Voltage Varies with Stimulation Amplitude
The “compliance voltage” or maximum voltage that the stimulator will deliver to an electrode varies
with the stimulation current as shown in the graph below. For very low stimulation currents the
maximum voltage the stimulator will deliver is ±13.5 V. The compliance voltage decreases linearly
with increasing stimulation current. At the maximum output current of ±1 mA, the compliance
voltage is reduced to ±8.5 V.
There is a 5 k resistor in series with the current output. As with any resistor, there is a voltage
drop across the resistor that is proportional to the current going through the resistor (V = I*R). The
voltage drop across this resistor is used to measure the actual output current, but reduces the
voltage available to deliver to the electrode.
9.2 Power on/off Transients
To avoid transients at the stimulator outputs caused by turning the power on and off, the following
sequence is recommended for conducting a stimulation experiment: Turn the stimulator power on,
launch the user interface program, connect the stimulator to the electrodes, conduct the
experiment, close the user interface program, disconnect the stimulator from the electrodes, and
turn the stimulator power off.
Do not turn the power supply to the stimulator on and off rapidly. If the power supply to the
stimulator is turned on and off rapidly, it is possible that -15V may be applied to all electrodes for
~2 seconds. Allow at least 1 minute between turning the power switch on and off.
© Plexon Inc - 55 -
Page 56
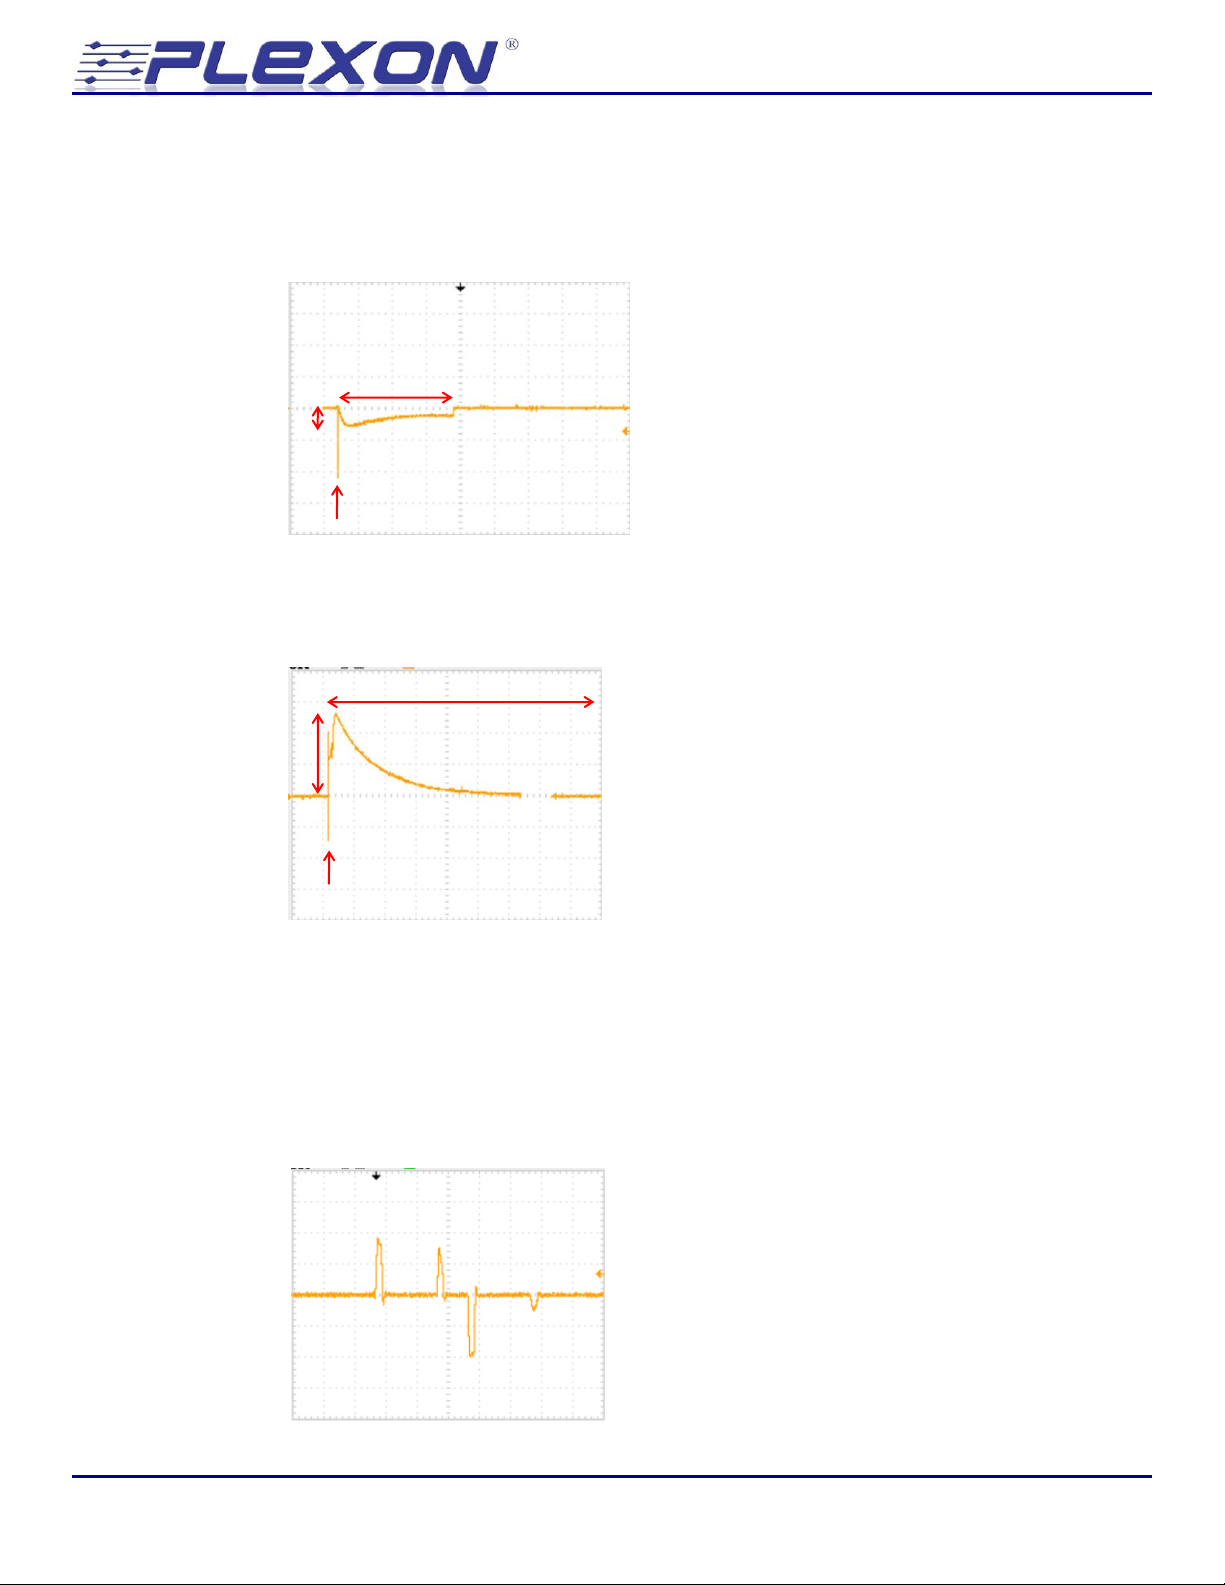
Neurotechnology Research Systems
Power off
Power On
1.7 sec
100 mV
5.5 sec
500 mV
A small transient may appear at the stimulator outputs when the power is turned on. A typical
power on transient voltage measured at the electrode is shown below. For this reason, do not
connect the stimulator outputs to the electrode implant until after the stimulator power has been
turned on.
A larger transient can occur at the stimulator outputs when the power is turned off. A typical
power off transient measured at the stimulator output is shown below. For this reason, disconnect
the stimulator from the electrodes before turning the power off.
9.3 Current Monitor with an Open Circuit
Ideally, when no electrode is connected to the stimulator output, the current monitor should always
read 0V. However, some artifacts may appear on the current monitor when the programmed
current output changes rapidly. For example, stimulating with a rectangular pulse pattern when no
electrode is connected will result in transients on the current monitor at the beginning and end of
each phase of the pulse as shown below.
Stimulator 2.0 - 56 -
Page 57
Neurotechnology Research Systems
Whenever the current monitor does not appear to match the requested stimulation pattern, the
voltage monitor should be examined. Refer to section 5.5, Verifying the output on an oscilloscope
and section 5.6, Compliance voltage and stimulation failure.
9.4 Impedance Test with an Open Circuit
Ideally, if no electrode is connected to the stimulator (or the connection to the electrode is broken)
then the impedance test procedure would indicate infinite impedance. However, due to stray
capacitance in the output of the stimulator and in the cabling to the electrode, the impedance test
procedure will yield a finite but large impedance result. With no cable connected to the stimulator,
this open circuit impedance will vary from channel to channel and will typically range from 5.5 M
to 11.5 MWith the 14-03-A-03 stimulation cable connected to the stimulator, but no electrodes
connected to the cable, the open circuit impedance will typically range from 1.5 M to 5.75 M
9.5 Channel fails to start in Impedance Test mode
If you use the Start All command in Z test mode, occasionally one of the channels will fail to start. If
you observe that the voltage monitor output is a flat line at zero during impedance testing, then you
should change the channel to back to edit mode and then load and re-start the channel.
© Plexon Inc - 57 -
Page 58
Neurotechnology Research Systems
General
Dimensions power supply
stimulator
8.2 in x 2.8 in x 4.1 in
8.2 in x 2.8 in x 4.1 in
Weight power supply
stimulator
2.5 lbs
2.0 lbs
Power requirements
100 – 240 VAC, 47 – 63 Hz, 0.96 – 0.51 A
Operating Systems
Windows XP, Windows 7
Interface
USB 2.0
Analog outputs
Stimulation mode
Constant Current
Number of analog output channels
16 outputs, 1 return
Maximum Current
±1 mA (Stimulation mode)
Resolution
16 bits
Output current resolution
30 nA (Stimulation mode)
Compliance voltage
10 V @ 700 µA (see section 9.1)
Temporal resolution
1 µs
Output rise time
1.25 µs 100 µA, 10 k load
Minimum pulse width
5 µs
Minimum pulse rate
0.008 Hz (125 s)
Maximum pulse rate
100 kHz
Digital inputs/outputs
Number of digital inputs
16
Number of digital outputs
17
Digital input levels
TTL, Low < 0.8V, High > 2.0V
Digital output levels
HCT, Low < 0.33V, High > 3.84V
Digital input/output latency
< 1 µs
Maximum trigger rate
100 kHz
Minimum trigger pulse width
1 µs
Arbitrary waveforms
Maximum sample points
1000
Maximum update rate
1 MHz (1 µs)
10 Specifications
Stimulator 2.0 - 58 -
Page 59
Neurotechnology Research Systems
© Plexon Inc - 59 -
Page 60

Plexon Inc
6500 Greenville Ave. Suite 700
Dallas Texas 75206
United States of America
Tel: 214-369-4957
Fax: 214-369-1775
E-mail: [email protected]
www.plexon.com
Stimulator 2.0 April 2011
 Loading...