

Page 1

IT-19C
QAM SIGNAL ANALYZER
OPERATING MANUAL
Revision 1.0 of 06.2019
Page 2

2
Page 3

Table of contents
1 Introduction ................................................................................................................. 4
2 General Description and Principle of Operation ............................................................ 6
2.1 Function .......................................................................................................................... 6
2.2 Environmental Conditions .............................................................................................. 6
2.3 Package Contents ........................................................................................................... 6
2.4 Specifications .................................................................................................................. 7
2.5 Application Area ............................................................................................................. 8
3 Preparation for Operation ............................................................................................ 8
4 Operation Procedure .................................................................................................... 9
4.1 Controls and Indicators .................................................................................................. 9
4.2 Preparations for Measurement...................................................................................... 9
4.3 Measurement Procedure ............................................................................................. 10
4.3.1 General Information .............................................................................................. 10
4.3.2 Channel Measurement Mode ............................................................................... 11
4.3.3 Scan Measurement Mode ..................................................................................... 12
4.3.4 Spectrum Measurement Mode ............................................................................. 14
4.4 Data Logger Function ................................................................................................... 15
4.4.1 General Information .............................................................................................. 15
4.4.2 Channel Plan List ................................................................................................... 15
4.4.3 List of Limit Plans ................................................................................................... 18
4.4.4 Channel Data Logger ............................................................................................. 20
4.5 General Settings ........................................................................................................... 24
4.6 Analyzer Self-Test ......................................................................................................... 25
4.7 Identification Data Readout ......................................................................................... 26
4.8 Operation Controlled by PC ......................................................................................... 26
4.8.1 General Information .............................................................................................. 26
4.8.2 ViewIt19C Software ............................................................................................... 26
4.8.3 SoftManager PC Software ..................................................................................... 27
4.8.4 Connection to a PC ................................................................................................ 28
4.9 Updating Firmware....................................................................................................... 28
4.9.1 General Information .............................................................................................. 28
4.9.2 Updating Firmware Via Internet ............................................................................ 29
4.9.3 Manual Firmware Updating .................................................................................. 29
4.9.4 Emergency Firmware Update ................................................................................ 29
4.10 Battery Operation ...................................................................................................... 30
5 Maintenance .............................................................................................................. 31
6 Troubleshooting ......................................................................................................... 31
7 Storage....................................................................................................................... 32
8 Transportation ........................................................................................................... 32
9 Labeling...................................................................................................................... 32
10 Warranty Information .............................................................................................. 32
3
Page 4

1 Introduction
This Operating Manual is intended for introducing the design, functions, and basic instructions
related to operation and servicing of the IT-19C QAM Signal Analyzer (Analyzer).
Reliability of IT-19C is ensured by fulfilment of regular maintenance procedures. These procedures
and their intervals are described in Section 5.
Repair of the Analyzer should be performed at the factory of origin or in places with special
equipment by people with special training who are familiar with the device and its principle of
operation. During the start-up process the special equipment is used, therefore the adjustment of
the Analyzer or replacing elements that affect the measurement accuracy is prohibited.
Follow the rules of storage and transportation in sections 7 and 8 in order to avoid any mechanical
damage of the Analyzer.
In this manual the following abbreviations are used:
• AC – alternating current;
• BER - Bit Error Ratio;
• DC – direct current;
• MPEG - Motion Pictures Expert Group (the name of the video and audio compression
standard);
• PC - Personal Computer;
• PER – Packet Error Ratio;
• RF - radio frequency;
• TV – television;
• USB – Universal Serial Bus.
The appearance of the Analyzer and its components are displayed in Figure 1.1 and Figure 1.2.
The Analyzer has a plastic impact-resistant collapsible housing. IT-19C Analyzer’s overall
dimensions are 193x94x53 mm.
There is a keypad and a graphic display on the top panel of the base module (Figure 1.1). On the
front panel, there is a connector for connecting the device to a computer and a connector for
connecting an external power source (Figure 1.2). There is a 75 input “F-male” connector on the
back panel .
4
Page 5
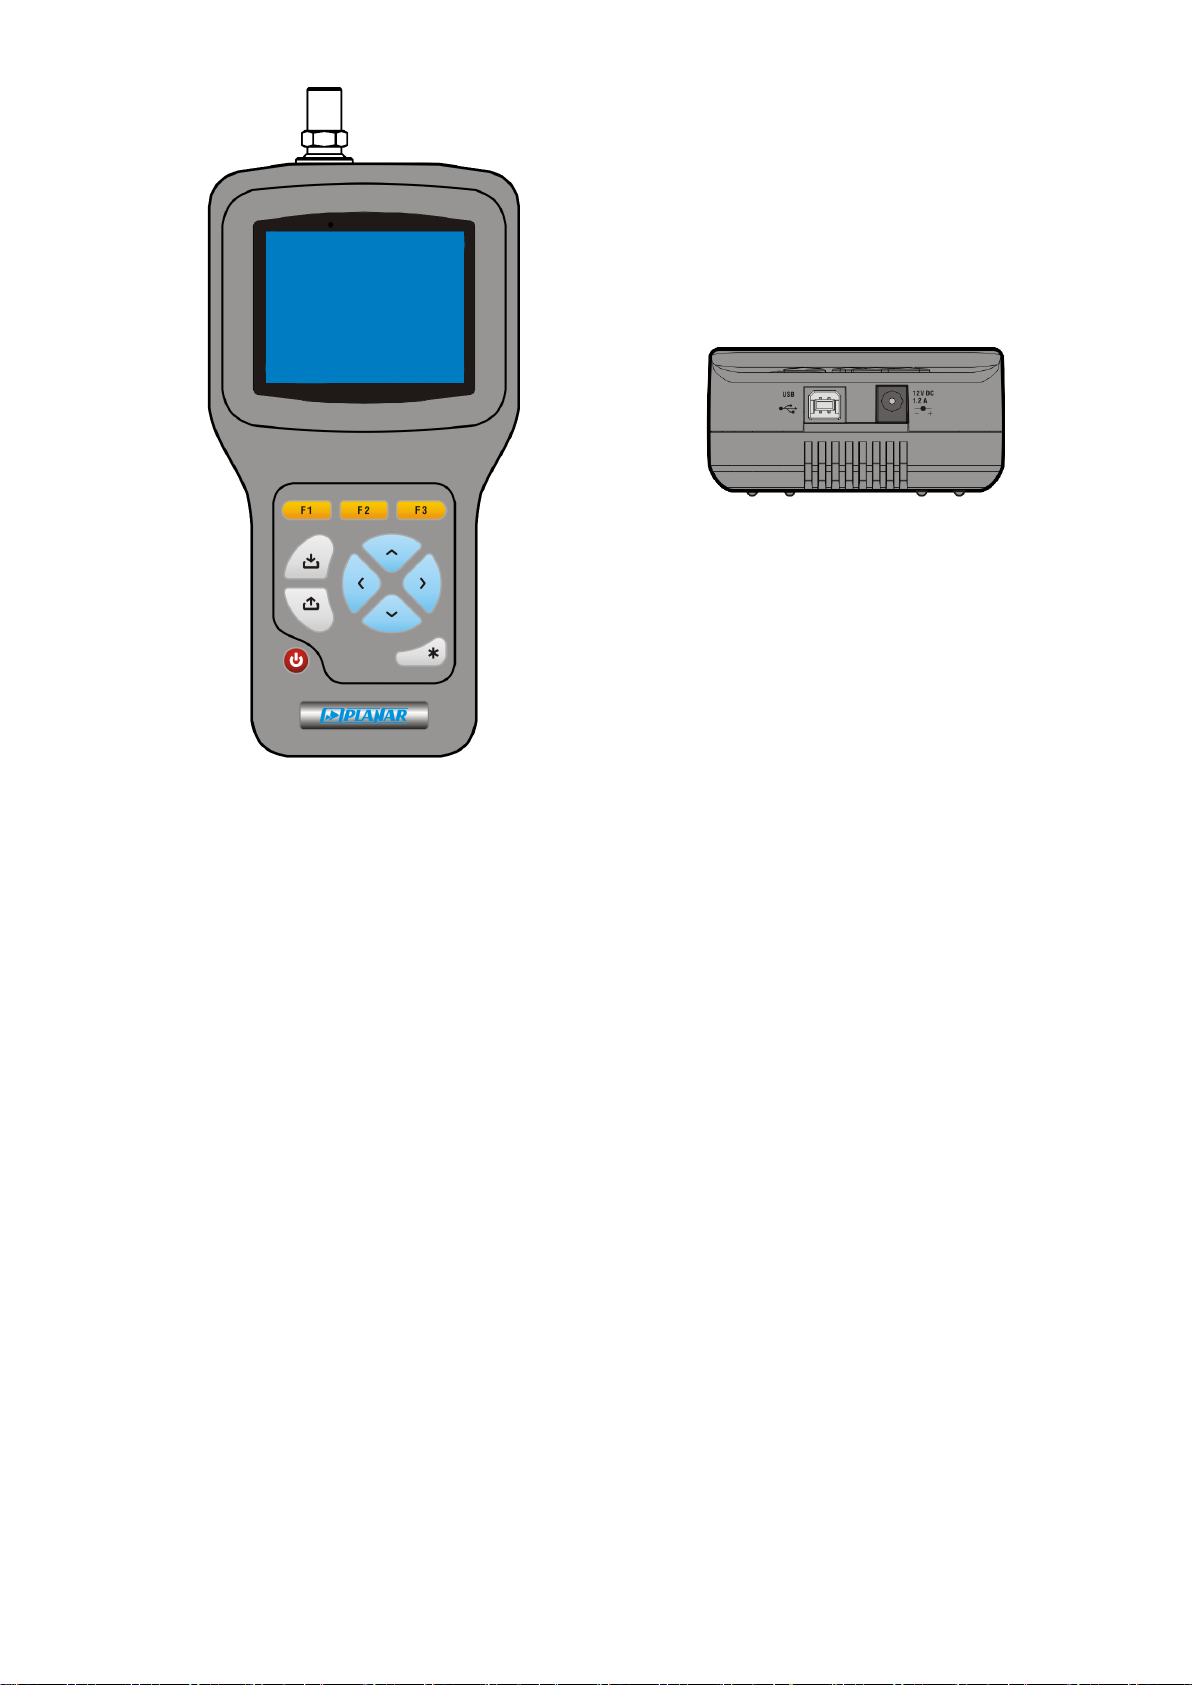
Figure 1.1
Figure 1.2
This Operating Manual is made for the 02.019.02 hardware version of IT-19C Base Unit, software
version 01.01.XX.XX of IT-19C and ViewIt19С software version for PC.
5
Page 6

2 General Description and Principle of Operation
2.1 Function
TheDVB-C IT-19C signal Analyzer is designed formeasuringparameters of TV channels with
analog modulation: video level, video level to sound level ratio, video level to noise level ratio. You
can also measure power of TV channel with digital modulation.
For signals of DVB-C and J.83 Annex B digital cable television standards, the Analyzer allows to
measure parameters of reception quality — Modulation Error Ratio (MER), Bit Error Ratio (BER),
the number of wrong MPEG stream packets, the noise immunity margin (MARGIN), and the
constellation diagram (on PC screen).
IT-19C provides with the automatic settings detection mode (channel frequency, symbol rate,
modulation type). There is a spectrum analysis mode aimed at searching for any unwanted signal.
The Analyzer can be connected to a PC for additional service modes. The Analyzer allows you to
measure the direct and alternating voltage of remote distribution receiving systems of TV and
radio broadcasting network power supply.
2.2 Environmental Conditions
Normal operation conditions:
1) ambient temperature (23±5) ºС;
2) relative air humidity(55±25)%;
3) atmospheric pressure 84-106 kPa (630-795 mm Hg);
4) voltage transmitters correspond to CAT. II installation category.
Rated operation conditions:
1) ambient temperature -10 to 5°С;
2) relative air humidity 90% to 25 ºС temperature;
3) atmospheric pressure 84-106 kPa630-795 mm Hg).
2.3 Package Contents
The Analyzer package includes:
1) The IT-19C Analyzer ............................................................... 1 pc.;
2) Rubber boot ........................................................................... 1 pc.;
3) Li-Po battery .......................................................................... 1 pc.;
4) F-F RF adapter ........................................................................ 1 pc.;
5) 12V/1.2A charger ................................................................... 1 pc.;
6
Page 7

6) Reference card ....................................................................... 1 pc.;
Input parameters:
- input impedance within operating frequency range:……………………. 75 Ohm;
- input impedance for frequencies up to 50 Hz:……………… at least 200 kOhm.
Allowed resulting value of AC input voltage for frequencies over 5 MHz:...3 V.
Allowed resulting value of AC and DC input voltage for frequencies
under 100 Hz: …………………………………………………………………………………….. 150 V.
7) Quick start guide .................................................................... 1 pc.;
8) Operating manual is available for download from http://www.planarchel.ru.
2.4 Specifications
Operating frequency range .......................................................................................... 5 to 1006 MHz
Frequency resolution ............................................................................................................... 125 kHz
Measurement level range ............................................................................................ 30 to 120 dBμV
Measurement level resolution .................................................................................................... 0.1 dB
Level measurement accuracy at 23 0C operation temperature ................................................ ±1.5 dB
Level measurement accuracy at rated operating temperature ................................................ ±2.0 dB
Level measurement channel passband ............................................................................. 230 ± 60 kHz
Frequency indication .......................................................................................................... 6 characters
Channel number indication ................................................................................................ 3 characters
Signal level indication......................................................................................................... 4 characters
Digital TV standards ........................................................................................ ITU-T J.83 ANNEX A/B/C
Modulation types ...................................................................................................... QAM 64, 128, 256
Symbol rate ................................................................................................................... 5.0 to 7.2 MSps
MER measurement range ................................................................................................... 28 to 40 dB
MER measurement resolution ..................................................................................................... 0.1 dB
MER measurement accuracy at the digital channel power value not less than 60 dBμV ......... ±2.0 dB
BER measurement range ....................................................................................... 4.0x10⁻³ to 1.0x10
Digital channel power limit, which provides quasi error-free decoding ................................ 45 dBμV
Automatic frequency adjustment in the digital channel parameters changing mode......... ±0.25 MHz
Warm-up time ....................................................................................................................... 2 minutes
7
-9
Page 8

IT-19C can be powered by:
• AC circuit with 220 ± 22 V voltage, 50 ± 0.5 Hz frequency with no more than 5% harmonic
content, via 12V/1.2A Charger;
• external DC source with 11 to 13 V voltage, and no more than 0.25 V ripple;
• built-in battery.
Current consumed from external power source or battery, not more than ................................. 1.2A
Continuous stable operation under normal conditions
(when powered by external source), not less than ................................................................ 24 hours
Battery life, not less than .......................................................................................................... 5 hours
Dimensions:
- analyzer ............................................................................................................. 193x94x53 mm
- package ........................................................................................................... 255х180х70 mm
Weight:
- analyzer ............................................................................................................................ 0.5 kg
- analyzer in a package ...................................................................................................... 1.0 kg.
2.5 Application Area
IT-19C analyzer can be used when checking and setting the networks of distribution and receiving
the TV and radio broadcasting, individual network elements and other electronic devices. The
Analyzer allows you to measure the voltage level of a radio-frequency signal, parameters of a TV
radio-frequency signal with analog and digital modulation of the DVB-C and J.83 Annex B
standards. The Spectrum measurement mode makes it possible to search for any unwanted signal.
The Analyzer can be used both in laboratory conditions with power supply from an external power
source, and in outdoors being powered by the in-built battery or from the vehicle electrical
system.
3 Preparation for Operation
Perform external examination to make sure your IT-19C has no visible mechanical damage.
Upon the arrival of the package, check the availability of all the items contained in it against the
list provided (Section 2.3).
If the IT-19C has been kept in the environment other than the rated operating conditions, leave
your Analyzer in the environment with normal operating conditions for at least 2 hours before
operation.
8
Page 9

4 Operation Procedure
4.1 Controls and Indicators
The location of controls, indicators and connectors is shown in Figure 1.1.
Functions of the elements are the following:
1) «F1», «F2», «F3» functional keys are designed for enabling the commands
corresponding to the icons displayed on the screen of the Analyzer;
2) The « » key allows you to go to the previous level of the menu;
3) The « » key is used to confirm the command;
4) « », « », «◄» and «►» arrows allow editing in the current operation mode;
5) The « » key provides additional features;
6) The « » key turns the Analyzer on and off;
7) The « 12V DC 1.2A» connector provides connection to an external power source;
8) The «USB » connector provides connection to the PC;
9) The «INPUT» connector is designed for the signal input, “F-male”-type connector.
4.2 Preparations for Measurement
Before you operate your IT-19C, make sure to read this Operating Manual carefully, as well as to
inspect the location of the controls and indicators of the Analyzer (Section 4.1).
To prepare your Analyzer for operation with the external power source, do the following:
1) connect the power source to the connector located on the side panel of IT-19C;
2) turn on the power source.
To prepare your IT-19C for operation in stand-alone mode, powered by the battery, press and hold
down « » until the display lights up.
The name and type of the Analyzer will be shown on the screen. After 1 second, either the main
mode-selection menu (main menu) will appear (Figure 4.1), or the last measurement mode used
before turning the power supply off (Section 4.5).
When you first turn on the analyzer, you need to configure the basic operation parameters. To
perform the setting, select the settings tab in the main menu mode using «◄» и «►» and
set the icon in the bottom line of the screen using « » и « ». Press «F1». In the parameter
table that appears, select the required ones in turn and set the parameter values using the «◄»
9
Page 10
and «►». For the proper functioning of the analyzer, the following parameters must be
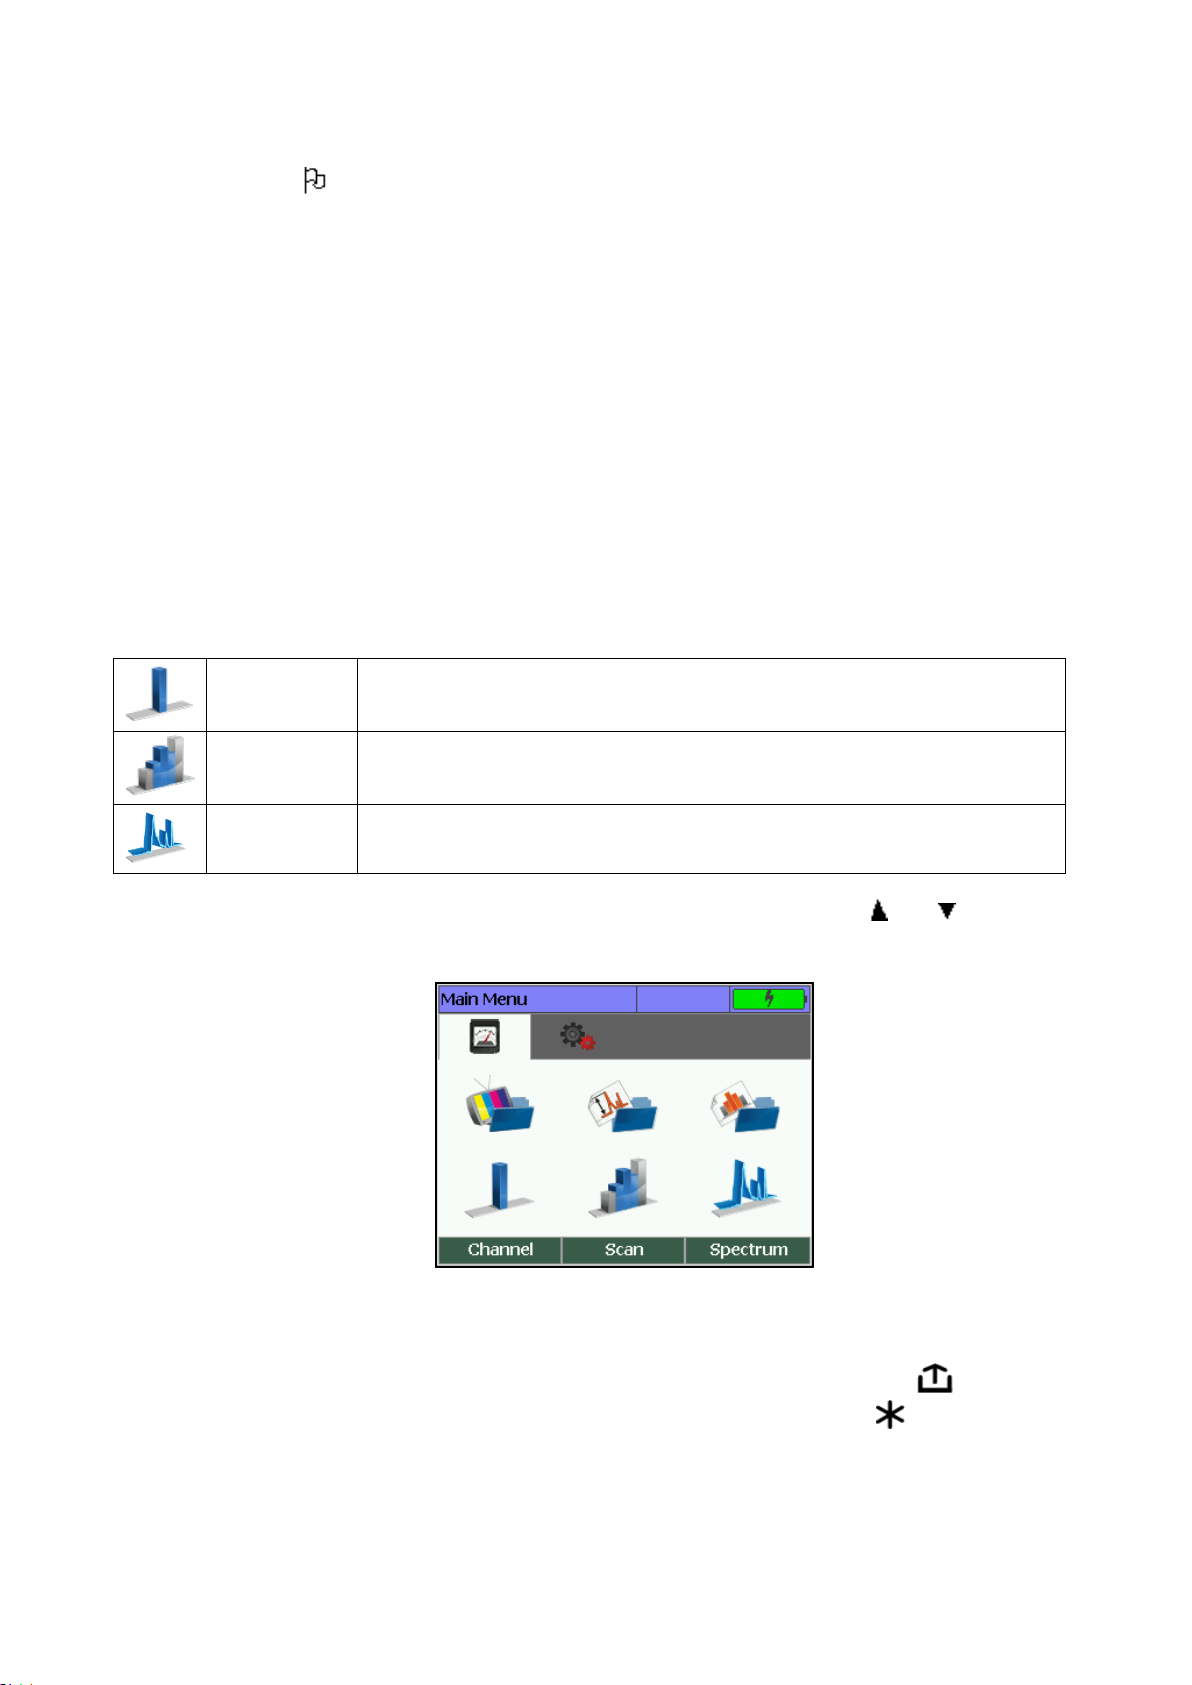
Channel
TV channel parameter measurement
Scan
Channel level, ripple and tilt measurement
Spectrum
Radio-frequency signal spectrum measurement
configured:
• Language . Used language for user interface. Possible values are: English(USA),
Русский.
• Level units. Level units of measure. Possible values are dBuV, dBmV, dBm.
• Channel template. Channel allocation standard. Possible values are OIRT, CCIR,
Australian, Australian SBAND.
The purpose of the remaining parameters is described in section 4.5. After setting the parameters,
press the «F1/Save» to save the settings or «F3/Cancel» to restore the old values.
4.3 Measurement Procedure
4.3.1 General Information
IT-19C analyzer offers three measurement modes:
Set the icon of the required mode at the bottom of the screen by pressing and in the main
menu (Figure 4.1).
Figure 4.1
Press one of the buttons of the functional group (F1, F2, F3), above which there is the desired icon
for selecting the measurement mode. Return to the selection menu by pressing . For a quick
switch between measurement modes (without entering the menu) press . The line of the
function buttons (F1, F2, F3) will display names of measurement modes on a yellow background.
Click the desired button.
When selecting the measurement mode, the name of the selected channel plan (Section 4.4.2) is
displayed in the status bar for a few seconds.
10
Page 11

Figure 4.2
In measurement modes, the measured constant voltage (VDC) value or the alternating voltage
(VAC) value of the cable network is displayed at the top of the screen.
4.3.2 Channel Measurement Mode
In this mode, the measurement of TV channel parameters and the voltage level applied to the
input of the device is performed. The view of the screen for a channel with analog modulation is
shown in Figure 4.2.
The following information is shown on the screen:
• express-test result: PASS/FAIL if a quick scan is on (Section 4.4.3);
• Name and number of the channel;
• CR: video level frequency and offset;
• VID: video level;
• CN: signal/noise value;
• V/A: video level to sound level ratio;
• MARGIN: signal/noise value margin;
• UPTIME: measuring time.
If a quick check of parameters is enabled (Section 4.4.3), the parameter with failed value is
highlighted in red.
To measure the signal-to-noise ratio, the Analyzer carries out measurements at the point with the
lowest level of useful components of the radio-frequency signal in the channel band. The
frequency of noise measurement is determined automatically by searching for the best possible
point in the frequency range with the video level offset from - 1.5 to 6.0 MHz.
The screen view for a channel with digital modulation is shown in Figure 4.3.
11
Page 12

Figure 4.3
The following information is presented on the screen:
• express-test result: PASS/FAIL if a quick scan is on (Section 4.4.3);
• channel synchronization icon;
• name and number of the channel;
• CR: channel frequency and offset;
• P: channel power;
• MER value;
• MARGIN: MER margin;
• ERROR: the number of unrepaired packets of the MPEG stream;
• UPTIME: parameter measurement time;
• CBER: BER channel value (preBER);
• PER: MPEG stream Packet Error Ratio.
Input voltage level measurement is carried out in the range from 10 to 100 V. The typical value of
absolute measurement accuracy shall not exceed ± 1.5 V. The value of voltage level measured at
the input connector of the device is displayed at the top line of the screen. If the voltage is
constant, the value is displayed as 50VDC. If the voltage is altering, the value is displayed as
50VAC.
Tune to the desired channel using «◄» and «►» to measure channel parameters. In case of
working without a channel plan, you can tune to any channel according to the selected Channel
template (Section 4.5) using «◄» and «►». If there is a TV signal, the Analyzer automatically
determines the channel type. When working with the selected channel plan (Section 4.4.2), retuning is carried out through channels from this plan.
4.3.3 Scan Measurement Mode
In this mode the screen displays signal levels as a bar-graph. It is presented in Figure 4.4:
12
Page 13

Figure 4.4
The screen shows:
• express-test result: PASS/FAIL if a quick scan is on (Section 4.4.3);
• channel type;
• the name and the number of the channel;
• TV channel frequency;
• V: TV channel level or P: digital TV channel power;
• deviation of the value level from the nominal value.
The level, frequency, and level deviation values correspond to the channel at the marker position.
The marker’s position can be changed by pressing «◄» and «►». The analog channel bar is
yellow, the digital channel bar is blue.
The Scan measurement mode has two display options: ripple measurement (Limit option) (Figure
4.4) and tilt measurement (Figure 4.5). To select an option for the display, press «F2».
To adjust the mode parameters, press «F1/Settings». Two parameters will appear in the dropdown menu:
• Level scale. Possible values are 2, 5, 10 dB per division;
• Averaging. Possible values are Off, Low, Medium, High.
The level scale can be adjusted with « » and « », going to the setup menu is not needed.
In the ripple measurement mode, the display shows boundaries of required channel levels. To
adjust the boundaries, press «F3/Limit» and adjust the base level value and the ripple value in the
drop-down menu.
While working without a channel plan, when entering the mode, the channel types are detected
automatically. Channel type automatic detection is also performed after the signal appears at the
input of the device (if there was no signal before). Work is conducted on all channels of the TV
system. When working with one of the channel plans, scanning is performed only on the selected
channels. Tuning the marker is made through the channels of the channel plan.
13
Page 14

In the tilt measurement mode (Figure 4.5), the display shows levels of TV channels and the slope
Figure 4.5
line between the peaks of the two selected channels. To select channels, press «F3/Marker» and
adjust the position of the first and the last channels in the drop-down menu.
4.3.4 Spectrum Measurement Mode
This mode displays the signal spectrum. The screen view is presented in the Figure 4.6:
Figure 4.6
The screen shows:
• span window;
• the name and the number of the channel;
• marker position frequency;
• the signal level at the point where the marker is located;
• max or min signal level at the point where the marker is located.
The current spectrum trace is yellow. The additional trace line of the max or min values is blue. To
reset the line, press «F3/Reset».
Marker’s location can be changed by pressing «◄» and «►» with the indication of «F2/Marker».
If the button has the value of «F2/Channel», the position of the scan window changes.
14
Page 15

To adjust the mode parameters, press «F1/Settings». Four parameters will appear in the drop-
Figure 4.7
down menu to select:
• Level scale. Possible values are 5, 10 dB;
• Span. Span range. Possible values are 18, 36, 72 MHz;
• Averaging. Possible values are Off, Low, Medium, High;
• Hold. Additional trace display. Possible values are Off, MIN, MAX.
The level scale can be adjusted with « » and « », going to the setup menu is not needed. To
move a marker or scan window quickly, press « » and one of the arrows «◄» or «►»
simultaneously.
4.4 Data Logger Function
4.4.1 General Information
Data Logger is intended for automation of the procedure of recording the measurement results.
The memory capacity allows to save up to 64 channel plans, up to 16 limit plans, up to 250 channel
data logger pages with maximum number of channels. The Analyzer allows viewing the saved data
off-line or by means of a computer (Section 4.8.2).
4.4.2 Channel Plan List
In the main selection menu, the icon corresponds to the mode. This mode allows
performing all the operations with channel plans: viewing, editing, deleting, and creation of new
pages. See the view of the screen in Figure 4.7. The table contains 2 columns. The first column is a
channel plan name. The second column shows the status of the channel plan. To select a channel
plan, use the « » and « » buttons. Select the required channel plan and press the "F3/Select"
button.
4.4.2.1 Editing Channel Plan
To view and edit the channel plan, select the required one and press “F1/Plan”. In the pop-up
menu, select Edit. The screen view of the channel plan table is shown in the Figure 4.8:
15
Page 16

Figure 4.8
Figure 4.9
The table contains the channel number, channel name, channel frequency and type (analog or
digital). For general information about the channel plan, press «F2/Info».
To edit the channel, press «F1/Channel». The pop-up menu shows the possible commands with
the channel:
1) New. Adding a channel;
2) Edit. Editing channel parameters;
3) Delete. Deleting a channel.
In channel editing mode, a table with parameters will appear on the screen. The screen view is
shown in the Figure 4.9:
The editing table contains 7 parameters for an analog channel:
1) Type. Channel type: analog.
2) Number. Channel number.
3) Frequency. Video carrier frequency.
4) Name. Channel name. It can be edited in ViewIt19C.
5) Standard. The parameter determines the channel bandwidth.
6) System. It determines the channel color system.
16
Page 17

7) SNR method. Measurement mode of the Signal/Noise parameter. Possible values: On
and Off.
6 parameters are provided for digital channels with unsupported digital modulation:
1) Type. Channel type: digital.
2) Number. Channel number.
3) Frequency. The center frequency of the channel.
4) Name. Channel name. It can be edited in ViewIt19C.
5) Bandwidth. The parameter determines the channel bandwidth.
6) SNR method. Measurement mode of the Signal/Noise parameter. Possible values: On
and Off.
6 parameters are provided for digital channels with Annex B or DVB-C modulation:
1) Type. Channel type: DVB-C или J.83-B.
2) Number. Channel number.
3) Frequency. The center frequency of the channel.
4) Name. Channel name. It can be edited in ViewIt19C.
5) Modulation. The parameter determines a type of modulation.
6) Symbol rate. The parameter determines the value of the symbol rate.
To save the channel parameters, press «F2/Save» button. To exit the function without saving,
press « ».
4.4.2.2 Deleting a Channel Plan
To delete a channel plan, select the required one and press «F1/Plan/Delete» then press « ». A
confirmation dialog will appear.
4.4.2.3 Creating New Channel Plan
To create a new channel plan in auto mode, press «F2/New/Scan». After scanning all the TV
channels, the analyzer switches to the channel plan editing mode (Section 4.4.2.1). Edit the
channel plan parameters if necessary and save them into memory.
To create a new channel plan without scanning, press «F2/New/Empty». The device will enter the
channel plan editing mode, where you can manually create a new channel plan.
17
Page 18

4.4.3 List of Limit Plans
Limit plans are designed to perform checks of the measured channel parameters while scanning
the channel data logger, as well as during a quick check in the Channel and Scan measurement
modes. In the main selection menu, the icon corresponds to the mode.
This mode allows performing all operations with limit plans: viewing, editing, deleting, creating a
new one. The screen view is shown in Figure 4.10. The table contains the names of the limit plans
and their status. To select the desired plan limit and enable quick check of parameters, press
«F3/Select».
Figure 4.10
To work without checking, select «Switched off».
To edit the selected limit plan or delete it, press «F1/Plan». In the pop-up menu, select the
appropriate command. To create a new limit plan, press «F2/New».
In the editing mode, there are four tables with limit plan parameters, which can be selected in the
pop-up menu by pressing «F1/Type» (Figure 4.11).
Figure 4.11
18
Page 19

1) General parameters:
-Δ Level, dB
Maximum value of channel levels ripple;
- Δ Analog/Digital, dB
The minimum and maximum difference between levels of
analog and digital channels;
- Δ Adj. Ch., dB
The maximum difference between adjacent channel levels.
- Video level, dBuV
Minimum and maximum value of channel levels;
- Video/Audio, dB
The minimum and maximum value of V/A ratio;
- C/N, dB
Minimum value of C/N ratio.
- Power, dBuV
Minimum and maximum channel power values;
- MER/QAM64, dB
Minimum MER value for QAM64 modulation;
- MER/QAM128, dB
Minimum MER value for QAM128 modulation;
- MER/QAM256, dB
Minimum MER value for QAM256 modulation;
- preBER
The maximum value of the preBER parameter.
- Power, dBuV
Minimum and maximum channel power values;
- C/N, dB
Minimum value of C/N ratio.
2) Parameters for analog channels:
3) Parameters for DVB-C/J.83 channels:
4) Parameters for digital channels (with unsupported modulation):
To enable or disable checking one of the parameters, press «F2/Enable/Disable». The parameter
will display the corresponding status. To look through the parameters, use the « » and « »
buttons. To change the parameters, use the «◄» and «►» buttons.
19
Page 20

4.4.4 Channel Data Logger
Figure 4.12
Figure 4.13
Indicator
Page status of the Channel Data Logger
Page is created, but not scanned.
Page is scanned, no errors are found.
Page is scanned, errors are found.
4.4.4.1 General Information
The Channel Data Logger is intended for measuring TV channel parameters on one of the channel
plans, checking cable network parameters for compliance with the selected limit plan and
documenting the check results in the analyzer’s memory. The Channel Data Logger allows viewing
the measurement results and errors in different parameters and uploading the data into your PC
for further processing and report preparation.
4.4.4.2 List of Channel Data Logger Pages
In the main selection menu, the icon corresponds to the Channel Test mode. This mode
allows performing all possible operations with the Channel Data Logger: viewing, deleting and
creating a new page. The screen views are shown in figures 4.12 and 4.13.
The screen displays a list of channel data logger pages with pages names, and also the channel and
limit plans related to the name. For each page in the first position of the row there is a status
indicator.
The bottom row contains a list of commands that are selected using the function buttons. The
buttons «◄» and «►» switch the screen view. Use the « » and « » buttons to select the
Channel Data Logger page.
20
Page 21

List of possible commands:
1) F1/Page Operations with the selected Channel Data Logger page.
• New Creating a new page;
• Delete Deleting a page;
• Info Viewing current page information;
• Open Viewing page content;
2) F2/Start Start scanning the selected channel Data Logger.
3) F3/Sort Sorting the table by Status, Name of the Channel Data Logger, Channel Plan
or Limit Plan.
4.4.4.3 Creating New Channel Data Logger Page
To create a new page, press «F1/Page» and select New. A table for preparing a new page will
appear on the screen (Figure 4.14).
Figure 4.14
The name of the page is assigned automatically. In the table it is necessary to select a channel plan
and a limit plan from those prepared in advance. The page will be associated with the selected
plans. When deleting or editing these plans, the Channel Data Logger page will be deleted from
memory.
Next, you need to select the parameter measurement mode. You can set the following
measurement parameters:
• All parameters Measurement of all parameters;
• Level only Measurement of channel levels only;
• Level+CN/MER. Measurement of channel levels and C/N ratio for analog
channels and MER for digital.
21
Page 22

To set the page scan time, set the Precision/Speed profile:
Profile
Parameter averaging
BER measurement limit
Fast
by 1 value
1E-6
Normal
by 2 values
1E-7
Precise
by 4 values
1E-8
• Page name
Name of the Channel Data Logger page;
• Measured
Number of channels. Measured /Total;
• State
Test result;
• Defective an. ch.
Number of analog channels, with errors/total number;
• Defective dig. ch.
Number of digital channels, with errors/total number;
• Δ analog,dB
Ripple value for analog channels and permissible limit;
• Δ digital,dB
Ripple value for digital channels and permissible limit;
• Δ analog/digital,dB
Maximum level difference between analog and digital channels and
permissible limit.
4.4.4.4 Viewing the Measured Data of the Channel Data Logger
To view the Channel Data Logger page, press «F1/Page» and select Open. A table of general data
of the Channel Data Logger page will appear on the screen (Figure 4.15).
The table contains:
Figure 4.15
If the parameter analysis is disabled in the limit plan, then in the table its status is marked as Off.
22
Page 23

To view the general results of the Data Logger measured data, press «F2 /Map». The screen will
Indicator
Status
Channel parameters are not measured yet
No channel errors are detected
There are errors in the channel parameters
The cursor is located on the channel.
display the list of channels in a graphical format (Figure 4.16).
Figure 4.16
Each rectangle corresponds to a definite channel from the channel plan, which color determines
its status.
Using the navigation buttons you can select the channel, which number and name are displayed at
the top, and also the measured parameters in the bottom row. For more information, press
«F2/Details» to enter the detailed information mode. In this mode, the measured data with
permissible limits are displayed in a table (Figure 4.17).
Figure 4.17
To go through the channels, use the navigation buttons «◄», «►» or «F1», «F3». To go through
only channels with errors, press «F2/Error».
23
Page 24

4.4.4.5 Scanning Channel Data Logger Page
Language
Selecting a Graphical user interface language.
Color theme
Selecting a color set of the graphical interface.
Key sound
Key sound indication control.
Auto Power Off
Setting Analyzer automatic switch-off. Power off after the last button
press.
Auto light off
Setting automatic backlight switch-off mode.
To start scanning the selected Channel Data Logger page (Section Ошибка! Источник ссылки не
найден.), press the «F2/Start». A table for preparing scan data (Figure 4.12) will appear on the
screen where you can tune the measurement parameters and scan speed. Press «F1/Ok» to
confirm the start. The scan progress table will appear on the screen. After the scan is complete,
you can save the results and go to the data view mode.
4.4.4.6 Deleting Channel Data Logger Page
To delete the selected Channel Data Logger page, press «F1/Page» and select Delete. A
confirmation dialog will appear on the screen. You can cancel or confirm page deletion.
4.5 General Settings
The General Settings mode is designed to set the modes of the analyzer's overall operation. To
start the mode in the main selection menu, select the icon set and using « » and « » set
the icon in the bottom row of the screen. Use «F1/Config» to start the mode (Figure 4.18).
Figure 4.18
The table contains 7 parameters for selecting the operating mode:
24
Page 25

Quick start
Setting Analyzer switch-on behavior. The analyzer starts with the
selection menu, or with the mode at the last power off.
Level units
Possible values: dBuV, dBmV, dBm.
Channel Template
Selecting channel allocation standard.
4.6 Analyzer Self-Test
Figure 4.19
Internal drive
Remaining capacity of the Data Logger memory.
Temperature
Temperature inside the analyzer.
Calibration
State of calibration coefficients tables (faultless or failed).
Devices
Faultless operation of analyzer internal parts.
To check the correct functioning of the analyzer individual components and the operating
conditions, the device self-test mode is intended. The icon in the main selection menu
corresponds to the mode. The self-test screen view is shown in Figure 4.19:
The table contains the following verifiable parameters:
Each parameter is followed by a status at the end of the row. If the icon color is green, then the
parameter is normal. If red, it means a problem is detected.
If there is not enough free memory, which is indicated by the error indicator, then unnecessary
files should be deleted from the memory of the Data Logger. If the error does not disappear, then
contact the service center.
25
Page 26

If the temperature inside the analyzer is out of tolerance, then this may lead to additional
Figure 4.20
measurement errors or failure of the device.
In case of an error indication of the Calibration tables or internal Devices, it is necessary to contact
the service center.
4.7 Identification Data Readout
The identification data readout program is intended for determining the serial number of the
Analyzer, their modifications and software versions. The icon in the main menu
corresponds to this mode. The screen view is shown in the Figure 4.20:
4.8 Operation Controlled by PC
4.8.1 General Information
You can control your IT-19C QAM Signal Analyzer via PC that connects via USB. ViewIt19C and
SoftManager software can be downloaded from http://www.planarchel.ru.
4.8.2 ViewIt19C Software
ViewIt19C makes it possible to:
1) measure the following (for channels with analog modulation):
• video carrier level;
• video to audio carriers ratio;
• video carrier to noise ratio.
2) measure the following (for channels with digital modulation):
• channel power;
• channel power to noise ratio;
• MER, CBER, PER for J.83 Annex A/B/C modulated channel;
26
Page 27

• constellation diagram.
3) carry out the spectrum measurement within the full frequency band;
4) measure the channel level in accordance with the channel plan;
5) view and save all measured data;
6) view and save data logger pages;
7) view, edit and save Channel plans;
8) update the firmware.
The screen view of ViewIT19C is shown in Figure 4.21.
Figure 4.21
4.8.3 SoftManager PC Software
SoftManager is intended for updating the device firmware (Section 4.9). The software can be
installed separately, it can also be installed as a part of the ViewIt19C software and be called from
it. The appearance of the program is shown in Figure 4.22.
27
Page 28

Figure 4.22
4.8.4 Connection to a PC
To connect the Analyzer to a PC, perform the following:
1) Turn on the Analyzer and connect it to the PC via USB interface.
2) In the analyzer, enter to computer mode (the mode corresponds to the icon in the
main menu).
3) Install the software for PC (ViewIt19C or SoftManager) and a USB driver. USB drivers
and software installation instructions are provided in the readme_rus.txt file that is
distributed with the programs.
4) Run the PC program and find the IT19C in the device list by serial number.
4.9 Updating Firmware
4.9.1 General Information
The device offers the capability to update its firmware. We go on with development of the devices
and keep on working out new firmware versions that provide new features. Each firmware version
has its unique number, e.g. 01.00.01.03. The firmware version is displayed in the identification
data reading mode (Section 4.7).
Firmware update can be carried out in two ways:
1) Via Internet, with automatic availability verification of a new firmware version (Section
4.9.2).
28
Page 29

2) Manually, selecting the file with the new firmware version (Section 4.9.3). New versions
come available for free download from our website http://www.planarchel.ru/ in the
section that describes IT-19C analyzer.
4.9.2 Updating Firmware Via Internet
To use this function, the device firmware update check must be enabled in the ViewIt19C settings.
To update the firmware via Internet:
1) Connect the device to the ViewIt19C program (Sections 4.8.2, 4.8.4).
2) After connecting the Analyzer, the program will automatically check for updates. If a
new firmware version is detected, it will offer to update. To perform the update, follow
the wizard.
If the process was interrupted while loading the program to the Analyzer, you should repeat the
program update process.
After the update is completed, there will be a message on the computer screen claiming the
update completion success. The Analyzer will reboot and start working as if it has just been turned
on.
4.9.3 Manual Firmware Updating
To update the Analyzer firmware manually, follow the steps below:
1) connect the device to the SoftManager program (Sections 4.8.3, 4.8.4). To start
SoftManager from ViewIt19C, switch to firmware update mode in PC software.
2) Select the file with the device firmware (* .bsk2): click (Figure 4.22) and select the
file in a standard Windows file selection window.
3) Click «Update» button and wait for the update to complete.
If the process was interrupted while loading the firmware to the Analyzer, you must repeat the
firmware update process.
The update process completion is the same as during the updating via Internet.
4.9.4 Emergency Firmware Update
An emergency software update procedure is provided if the main device program is damaged and
does not allow the user to enable the PC mode . To call out the update procedure, make sure
that the device is switched off, press and hold « », turn on the power by pressing « » or by
applying external power. The program status bar update mode will appear on the display:
IT-19C Bootloader v1.1.
To update the device firmware, perform actions described in section 4.9.3.
29
Page 30

4.10 Battery Operation
Icon
Status
External power supply. The battery is charged.
The battery is charging. Approximately 75% charged.
Battery power supply. 100% charged.
Battery power supply. 50% charged.
Battery power supply. 25% charged.
Battery power supply. Less than 10% remaining.
IT-19C is powered by in-built LiPo batteries of 43x56x14mm dimensions and 1450 mAh capacity.
To determine the residual capacity of the battery, look at the top right corner of the screen.
If the capacity indicator is red, critical charge balance is indicated. In this case, you should charge
the battery.
To charge the battery, connect an external power source of 12 V or connect IT-19C to the vehicle
power supply of 12 V. The Analyzer will turn on in operating mode. Fast battery charge will occur
in the main menu mode. When you turn on any measurement mode, the device switches to the
slow battery charging mode.
Charge the battery when the ambient temperature is from 0 to + 45 ° С. A full charge in fast
charging mode takes about 2 hours. The battery charges up to 50% in 30 minutes and up to 90% in
1 hour. In the slow charging mode (when the one of measurement mode is on), the charging
process takes approximately twice as long.
You should charge battery using the external power source once every 3 months in order to
equalize the charge of battery and thus increase their life time.
30
Page 31

5 Maintenance
Required maintenance is limited to observation of rules related to proper operation, storage, and
transportation set forth in this Manual and also minor fault elimination.
Perform preventive inspections including check of controls, assembly reliability, and keypad
condition after the warranty period has expired and annually since then.
6 Troubleshooting
Fault occurrence: The analyzer doesn’t turn on in battery operation.
Possible reason: Extremely low charge or malfunction of the battery.
Methods of correction: To check, you need to connect an external power supply. If the
device turns on, charge the battery. If, after charging, the analyzer still doesn’t turn on in
battery operation, contact the technical support service center to replace the defective
battery or repair.
Possible reason: Firmware failure.
Methods of correction: Update the firmware from an external computer (Section 4.9).
Fault occurrence: The analyzer does not turn off in battery operation (display backlight is on).
Possible reason: Program is “is hanging up”.
Methods of correction: Press and hold « » approximately for 5 second until the display
switches off. After releasing the key, turn on the analyzer.
Fault occurrence: High error in measuring the level of all channels or in a separate frequency
range.
Possible reason: Increased wear of the RF input adapter.
Method of correction: Replace the input adapter by the proper one.
Possible reason: Incorrect setting the channel plan, as a result, when measuring, the analyzer
is tuned with frequency offset.
Method of correction: Set up the channel plan (Section 4.4.2.1).
Possible reason: Incorrect channel allocation standard (channel template).
Method of correction: Check the value of the Channel template parameter in the general
settings mode (Section 4.5).
31
Page 32

7 Storage
Store your analyzer under the following conditions: environment temperature from -20 to +40 0С,
relative humidity up to 90 % (at 30 0С).
8 Transportation
The analyzers must be shipped in any closed vehicles at temperature from -20 to +40° C, relative
humidity of 90% (at 30° C) and atmospheric pressure of 84 to 106.7 kPa (630 to 800 mm Hg).
Cargo holds, railway cars, containers, and truck beds, used for transportation should be free from
any traces of cement, coal, chemicals, etc. When shipped by air, the analyzers should be kept in
aircraft sealed compartments.
9 Labeling
The labeling of the analyzer is made in accordance with the standards. The serial number, which
contains the sequential number and the date-of-manufacture code, is stamped on the back panel
of the analyzer and can be viewed on the display in the identification data readout program
(Section 4.7).
10 Warranty Information
The manufacturer warrants that the IT-19C QAM Signal Analyzer conforms to the specifications of
this Manual when used in accordance with the operating regulations detailed in this Manual. The
manufacturer or regional representative shall, at his discretion, repair or replace, for free, any
Meter, recognized as faulty within the warranty period, which is twenty-four (24) months from the
date of purchase. Should the user fail to submit a document confirming the date of purchase, the
warranty period will be determined by the date of manufacture.
The warranty is invalid if:
a) a defect or damage is caused by improper storage, misuse, careless handling, improper
maintenance or accident;
b) the product was modified or repaired by an unauthorized person;
c) the product seals are tampered;
d) the product has mechanical damage.
The warranty does not cover built-in batteries.
Transport risks and costs associated with delivery from the manufacturer or authorized service
centers are borne by the buyer.
The manufacturer is not responsible for direct or indirect damage of any kind to people or goods
caused by the use of the product and/or suspension of use as a result of possible repair.
When returning a defective product, please provide exact details of this product and a clear
description of the failure. The manufacturer (regional representative) reserves the right to check
the product in their laboratories to verify the validity of the claim.
32
 Loading...