

Page 1
IT-14
DVB-T SIGNAL ANALYZER
OPERATING MANUAL
Page 2

2
22.04.2011
Page 3

3
TABLE OF CONTENTS
1 GENERAL INFORMATION....................................................................................................................... 4
1.1 INTRODUCTION.........................................................................................................................................4
1.2 SAFETY PRECAUTION................................................................................................................................4
2 GENERAL PRESCRIPTION AND PRINCIPLE OF OPERATION............................................................ 4
2.1 FUNCTION................................................................................................................................................4
2.2 ENVIRONMENTAL CONDITIONS...................................................................................................................5
2.3 PACKAGE CONTENT..................................................................................................................................5
2.4 SPECIFICATION ........................................................................................................................................6
2.5 DESIGN AND OPERATION OVERVIEW ..........................................................................................................7
2.5.1 Principle of operation ..................................................................................................................... 7
2.5.2 Block diagram ................................................................................................................................7
2.5.3 Component arrangement ............................................................................................................... 8
3 PREPARATION FOR OPERATION ......................................................................................................... 8
4 OPERATION PROCEDURE..................................................................................................................... 8
4.1 CONTROLS AND INDICATORS .....................................................................................................................8
4.2 PREPARATION FOR MEASUREMENT............................................................................................................8
4.3 MEASUREMENT PROCEDURE.....................................................................................................................9
4.3.1 General information........................................................................................................................ 9
4.3.2 LEVEL measurement mode......................................................................................................... 10
4.3.3 SCAN measurement mode .......................................................................................................... 12
4.3.4 RIPPLE measurement mode ....................................................................................................... 13
4.3.5 SPECTRUM measurement mode................................................................................................ 14
4.3.6 MER/BER measurement mode.................................................................................................... 14
4.3.7 CONSTELLATION measurement mode...................................................................................... 16
4.4 DATA MANAGER .....................................................................................................................................16
4.4.1 General information...................................................................................................................... 16
4.4.2 Channel plan manager................................................................................................................. 16
4.4.3 Data log manager......................................................................................................................... 18
4.5 SETUP ...................................................................................................................................................21
4.6 SELF-TEST.............................................................................................................................................21
4.7 IDENTIFICATION ......................................................................................................................................22
4.8 BATTERY OPERATION .............................................................................................................................23
4.9 PC COMMUNICATION ..............................................................................................................................23
4.9.1 General information...................................................................................................................... 23
4.9.2 Software installation..................................................................................................................... 23
4.9.3 USB driver installation.................................................................................................................. 23
4.9.4 PC communication launch ........................................................................................................... 23
4.9.5 Firmware updating ....................................................................................................................... 24
4.9.6 Channel template editing ............................................................................................................. 25
5 MAINTENANCE...................................................................................................................................... 26
6 TROUBLESHOOTING............................................................................................................................ 26
7 STORAGE............................................................................................................................................... 27
8 TRANSPORTATION............................................................................................................................... 27
Page 4

4
1 GENERAL INFORMATION
1.1 Introduction
This operating manual is intended for introducing the design, functions, and basic instructions related to
operation and servicing of IT-14 (Analyzer).
IT-14 is designed for testing and adjustment of television and broadcasting distribution networks as well
as of separate components of such networks, or other electronic devices. The Analyzer allows measurement
of channel level, parameters of TV signal with analog and digital modulation of DVB-T standart.
The Analyzer can be used both in laboratory, powered by an external power source, and in field,
powered by batteries or car cigarette lighter.
The reliability of the IT-14 is ensured by fulfillment of regular maintenance procedures. These
procedures and their intervals are described in Section 5.
In this manual the following abbreviations are used:
ADC - Analog-to-Digital Converter
BER - Bit Error Ratio
CD - compact disk
COFDM - Coded Orthogonal Frequency Division Multiplexing
DVB-T - Digital Video Broadcasting - Terestrial
IF - Intermediate Frequency
LCD - Liquid Crystal Display
MER - Modulation Error Ratio
MPEG2 - Motion Pictures Expert Group
PC - Personal Computer
preBER - BER before Viterbi decoder
postBER - BER after Viterbi decoder
QAM - Quadrature Amplitude Modulation
QPSK - Quadrature Phase Shift Keying
1.2 Safety precaution
Thoroughly inspect the product and carefully read the related documentation to get acquainted with all
the safety markings and instructions before you start to operate the Analyzer.
WARNING Only trained service personnel aware of the hazards involved should perform repair on the
Analyzer.
CAUTION Tuning the Analyzer and replacement of the components that influence the accuracy of
measurements without service personnel is strictly prohibited, since the components used in the Analyzer
are purpose-made and their replacement will result in inaccurate operation of the Analyzer. To exclude the
possibility of mechanical damage to the IT-14, the instructions regarding the storage and transportation
(Sections 7 and 8) of the Analyzer must be observed.
2 GENERAL PRESCRIPTION AND PRINCIPLE OF OPERATION
2.1 Function
The IT-14 offers measurement of the following parameters of analog channels: video carrier level, V/A
ratio, and C/N ratio. For digital channels channel power can be measured. For DVB-T signals IT-14 offers
measurement of reception quality parameters: modulation error ratio MER, bit error ratio BER before and
after Viterbi decoder, erroneous packets after Reed-Solomon decoder counter and constellation diagram. IT14 features automatic defining of the settings (channel frequency, subcarriers number, subcarriers
modulation type, guard interval, code rate, spectrum inversion). The IT-14 can be connected to a personal
computer to access additional modes. The Analyzer allows to measure direct and alternating voltage of the
remote power supply of the TV and broadcasting distribution networks.
Page 5

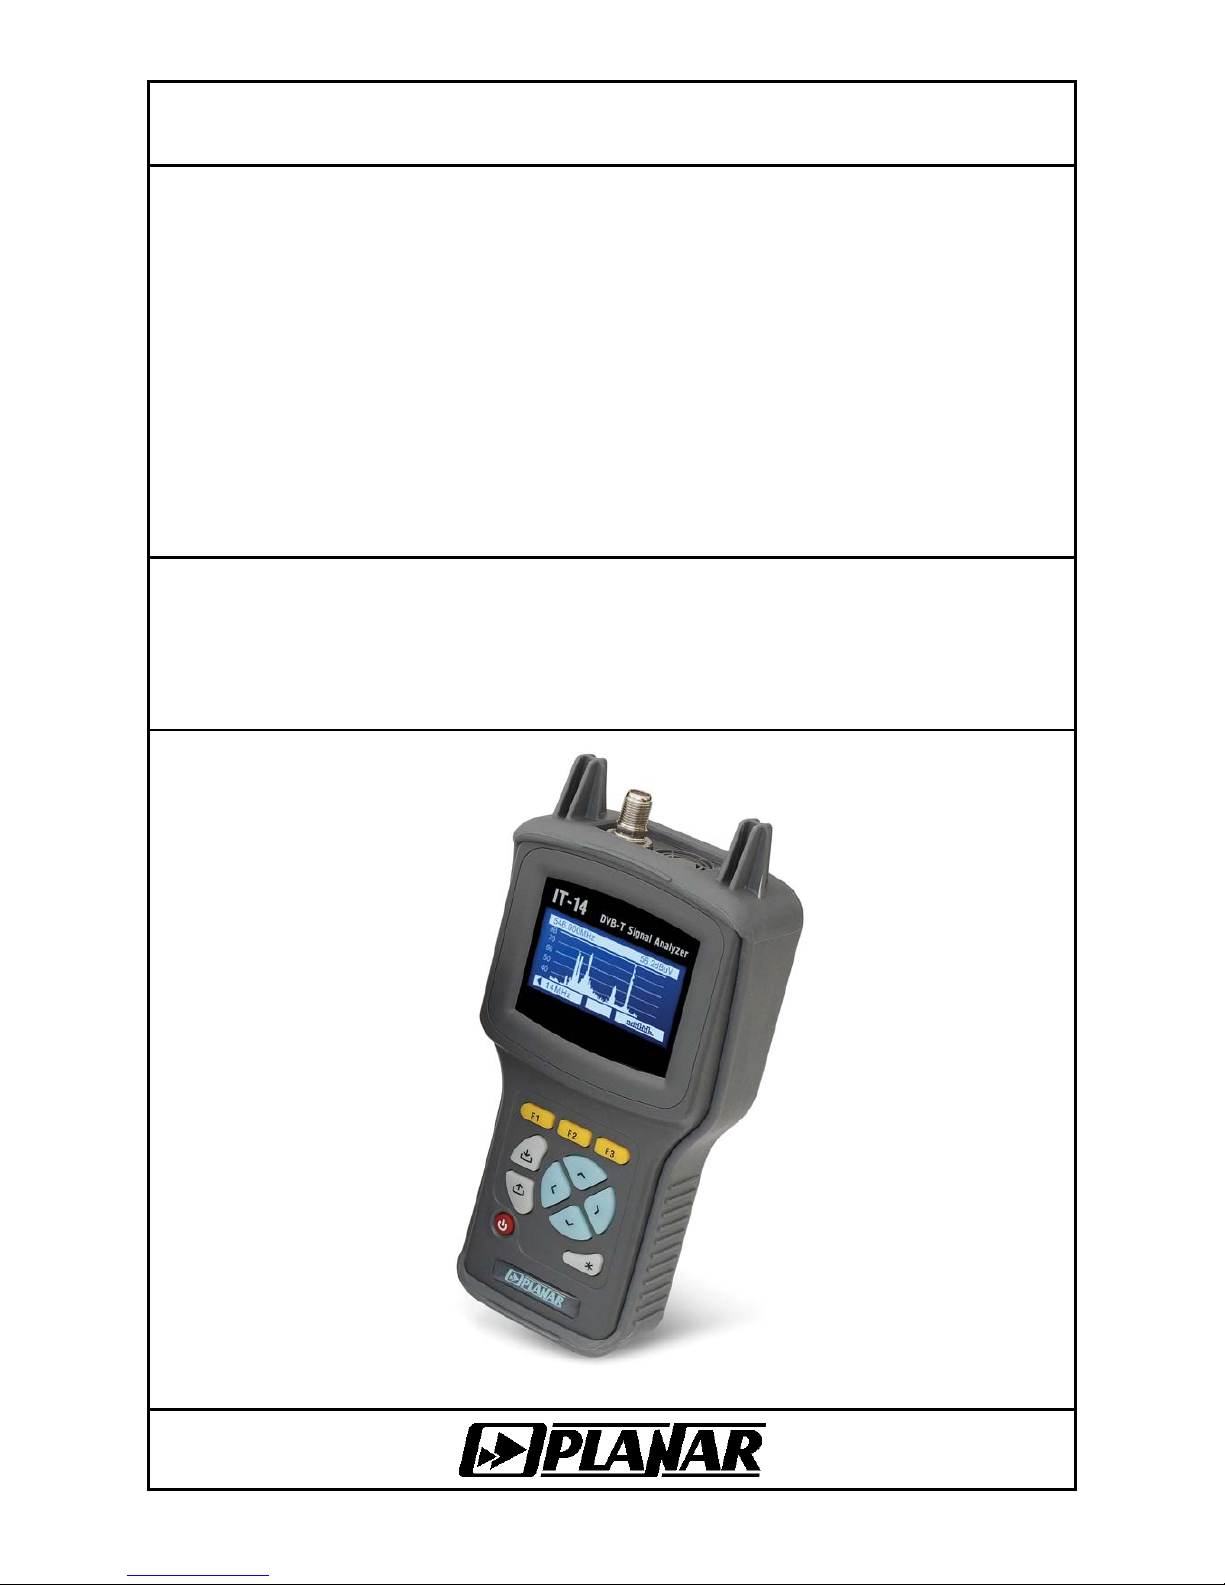
The appearance of the Analyzer is shown in Figure 1.1. and Figure 1.2.
Figure 1.1 Figure 1.2
This Operating Manual is made in accordance with the firmware version 13.0.0.4 for IT-14.
2.2 Environmental conditions
Normal operating conditions:
a) ambient temperature (23±5) °С;
b) relative air humidity (55±25)%;
c) atmospheric pressure 84-106 kPa (630-795 mm Hg);
d) voltage transients correspond to installation category CAT. II.
Rated operating conditions:
a) ambient temperature from -10 to 50 °С;
b) relative air humidity not greater than 90% at 25 ºС temperature;
c) atmospheric pressure 84-106 kPa (630-795 mm Hg).
2.3 Package content
The Analyzer package includes:
a) IT-14 .................................................................................................... 1 pc;
5
Page 6

b) Rubber boot ......................................................................................... 1 pc;
c) Li-Ion battery........................................................................................ 1 pc;
d) “F”-”F” adapter ..................................................................................... 1 pc;
e) 12V/1.2A charger................................................................................. 1 pc;
f) Reference card .................................................................................... 1 pc;
g) Opearting manual ................................................................................ 1 pc.
2.4 Specification
Operating frequency range................................................................................ 45 to 900 MHz
Resolution.......................................................................................................... 125 kHz
Channel template............................................................................................... set with PC (section 4.9.6)
Input parameters:
input impedance within operating frequency range:..........................................75 Ohm
input impedance for frequencies up to 50 Hz:...................................at least 200 kOhm
Allowed resulting value of AC input voltage for frequencies over 5 MHz:………......3 V
A
llowed resulting of AC and DC input voltage for frequencies under 100 Hz:.......150V
Level measurement range................................................................................. 30 to 120 dBµV
Measurement level resolution............................................................................ 0.1 dB
Accuracy within 30 – 120 dBµV level range ...................................................... ±1.5 dB
Accuracy at operating temperature ...................................................................±2.2 dB
Measurement channel passband for -3 dB level ...............................................230 ± 60 kHz
Frequency indication.......................................................................................... 6 characters on LCD
Channel number indication................................................................................ 3 characters on LCD
Signal level indication ........................................................................................4 characters on LCD
Input signal modulation
Channel bandwidth .....................................................................................8 MHz
Channel modulation type ............................................................................COFDM
Subcarriers modulation type .......................................................................QPSK, QAM16, QAM64
Subcarriers number..................................................................................... 2k, 4k, 8k
Guard interval.............................................................................................. 1/32, 1/16, 1/8, 1/4
Hierarchical modulation type....................................................................... α=1, α=2, α=4
Code rate..................................................................................................... 1/2, 2/3, 3/4, 5/6, 7/8
Operating channel power range ........................................................................ 60 to 110 dBµV
MER measurement range (for QAM64, code rate 3/4) .....................................18 to 35 dB
MER measurement resolution ...........................................................................0.1 dB
MER measurement accuracy at operating channel power................................ ±2.0 dB
BER measurement range
preBER........................................................................................................ 1.0x10
-2
to 1.0x10
-8
postBER ......................................................................................................1.0x10-3 to 1.0x10
-8
Channel power treshold (postBER less than 2x10⁻⁴)
For QAM64, code rate 3/4, SNR=46 dB .....................................................40 dBµV
Frequency auto tuning range............................................................................. ±0.500 MHz
Warm-up time, less than.................................................................................... 5 min
IT-14 powering:
from AC circuit with 100/220V voltage and 50/60 Hz via 12V/1.2A charger;
from external DC source with 10 to 14 V voltage and ripple level no greater than 0.5 V;
from Li-ion battery with 1500 mAh capacity.
Current consumed from external power
source or batteries, not greater than .................................................................0.6 A
Continuous stable operation under normal conditions (when powered by external source)
no less than ..................................................................................................24 hrs
Battery life under normal conditions (1500 mAh battery capacity), no less than 3 hrs
Mean time between failures, no less than .........................................................10000 hrs
Average lifetime, no less than ...........................................................................5 years
Dimensions ........................................................................................................ 193x94x53 mm
Package dimensions.......................................................................................... 255х180х70 mm
Weight................................................................................................................ 0.46 kg
6
Page 7
Weight in package .............................................................................................0.5 kg
2.5 Design and operation overview
2.5.1 Principle of operation
The IT-14 Analyzer is a receiver of DVB-T signals with demodulation of the traffic stream to MPEG-2.
The input tuner is a super heterodyne receiver with triple frequency conversion (auto or manual frequency
tuning). Modulation error ratio MER and constellation diagram are measured in the process of DVB-T signal
demodulation based on vector analysis. Bit error ratio BER in digital stream is determined by means of
analysis of Viterbi and Reed-Solomon decoders operation. Channel power is measured by means of analogto-digital converter after signal detection at output of logarithmic detector of the amplifier of the third IF. Level
of analog channels is detected with peak detector. Power of digital channels and noise level are detected
with average detector. The principle of spectrum analyzer is based on sequential analysis method with
spectrum indication on the LCD display.
The view displayed on the screen in the MER/BER mode DVB-T signals reception quality parameters
measurement is the numeric values of the measured digital parameters (MER, bit error ratio BER before and
after Viterbi decoder and erroneous packets counter after Reed-Solomon decoder). The constellation
diagram mode shows the vector structure of the quadrature components of the demodulated digital signal on
the phase plane. The signal level measurement mode in a frequency point displays for the analog signals:
the numeric value of the signal level, V/A and C/N ratios, for digital signals: the value of the actual channel
power.
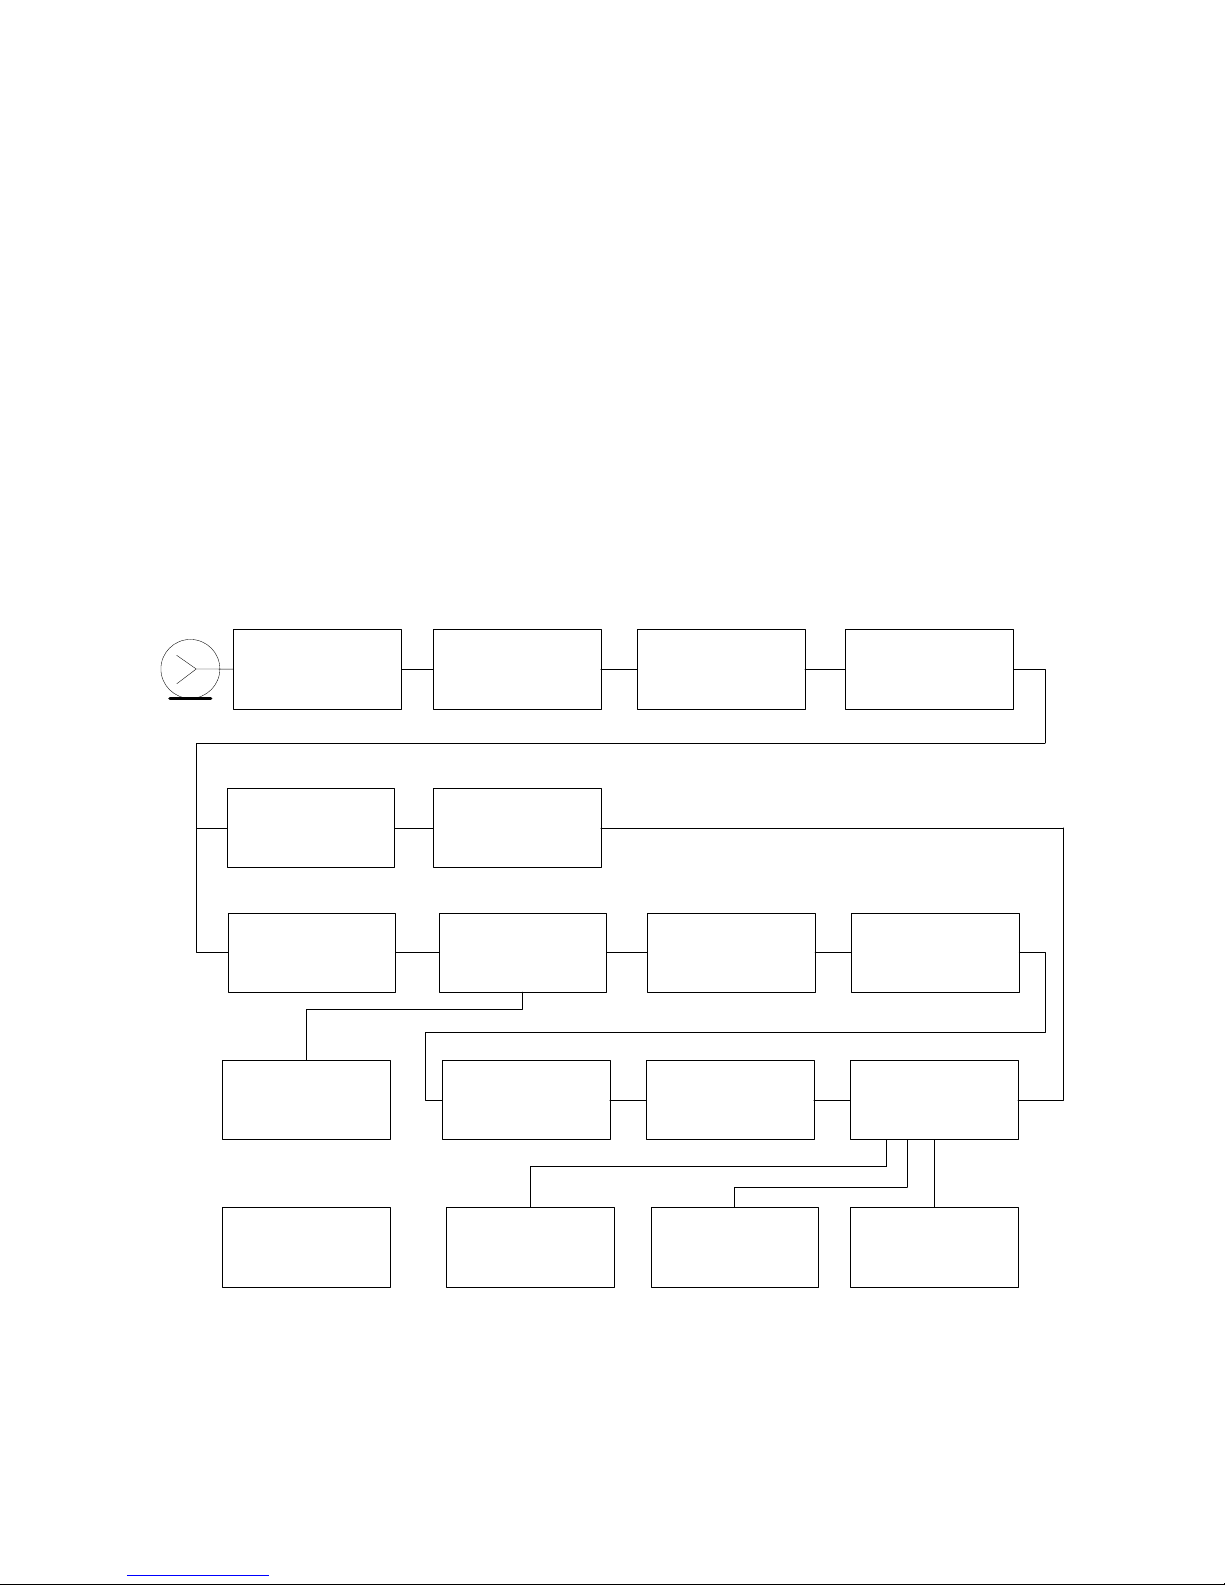
2.5.2 Block diagram
The block diagram of IT-14 is shown in Figure 2.5.1.
Low-pass filter
(LPF)
Attenuator
0/20/40dB (A)
Tuner
45-900 MHz
(T)
Band-pass filter
IF2 39 MHz
(BPF2)
Mixer
(M)
Band-pass filter
IF3 10,7 MHz
(BPF3)
Logarithmic gain
amplifier limiter
(LGAL)
Local oscillator
28,3 MHz
(LO)
Band-pass filter
IF2 36,125 MHz
(BPF1)
DVB-T
demodulator
(Dm)
Keyboard
(K)
Nonvolatile
memory
(NVRAM)
Liquid-crystal
display
(LCD)
Power unit
(PU)
Control unit
(CU)
Analog-to-digital
converter (ADC)
Signal detector
(SD)
Amplifier
0/11dB (Amp)
Figure 2.5.1
After the low-pass filter (LPF), the input signal if necessary is strengthened by the wide-band amplifier
(Amp) or reduced by the attenuator (A). Then the signal is converted into the second IF 39 MHz in level
7
Page 8

measurement mode or 36.125 MHz in DVB-T signal demodulation mode by the tuner (T) with frequency
double conversion.
The signal of the second IF by means of mixer (M) controlled by the local oscillator (LO) is converted into
the third IF, and further is filtered at 10.7 MHz frequency by the bandpass filter (BPF3), which defines the
receiver measurement filter bandwidth.
Logarithmic gain amplifier limiter (LGAL) performs logarithmation and signal detection.
Signal detector (SD) allows measuring of signal level by means of analog-to-digital converter (ADC). SD
uses peak detection for measuring analog channel level and average detection for measuring noise level
and digital channel power. The digital code of the input signal level logarithm is defined as real value and is
corrected in accordance with the calibration matrix of the control unit (CU) microcontroller.
In DVB-T signal demodulation mode the signal with the second IF, after bandpass filter (BPF1) filtering
comes to DVB-T demodulator (Dm), which performs demodulation and signal parameters measurement. The
control unit processes the measured results.
The control unit receives the commands from the user entered via keypad (K), processes the data,
displays them on the LCD, and also controls the operation with external PC.
The nonvolatile memory (NVRAM) stores the calibration coefficients set by the manufacturer, data log
pages, channel template, channel plans and service information.
The Power Unit (PU) generates the required voltages either from battery or from an external power
source.
2.5.3 Component arrangement
The IT-14 is implemented in plastic shockproof sectional housing that includes printed and threedimensional wiring. IT-14 dimensions are 193x94x53 mm.
The front panel of the Analyzer represents the tactile silicon keypad and a graphical display (Figure 1.1).
The front panel has a connector for PC connection and external power source connector (Figure 1.2). The
input 75-Ohm input “F”-male connector is located on the rear panel.
3 PREPARATION FOR OPERATION
Perform external examination to make sure your IT-14 is free from any visible mechanical damage.
Upon receipt of the package, check the availability of the items contained in it against the list provided
(Section 2.3).
If the IT-14 has been kept in the environment other than the rated operating conditions, leave your
Analyzer in facilities with normal operating conditions at least for 2 hours prior to operation.
4 OPERATION PROCEDURE
4.1 Controls and indicators
The location of controls, indicators and connectors is shown in Figure 1.1. These elements have the
following functions:
a) F1, F2, F3 functional keys enable the commands corresponding to icons shown on the screen of IT-
14;
b)
key allows you to return to the previous menu level;
c)
key enables auxiliary functions;
d)
, , ◄ , and ► arrows allow you to edit the current operation mode;
e)
key allows you to choose an element from the list;
f)
key switches the power of IT-14 on/off;
g)
12V DC 1.2A connector is for connection to an external power source;
h) USB
connector is for connection to a computer;
i) «INPUT» connector is for signal input, “F”-male connector.
4.2 Preparation for measurement
8
Page 9
Before you start operating your IT-14 make sure to carefully read this Operating Manual as well as to
inspect the location of the controls and indicators of the Analyzer (Section 4.1).
To prepare your Analyzer for operation with the external power source, connect the Charger to the
connector located on the front panel of the IT-14 and then to the power source.
To prepare your IT-14 for operation in stand-alone mode, powered by the battery, push and hold the
key until the LCD backlight turns on.
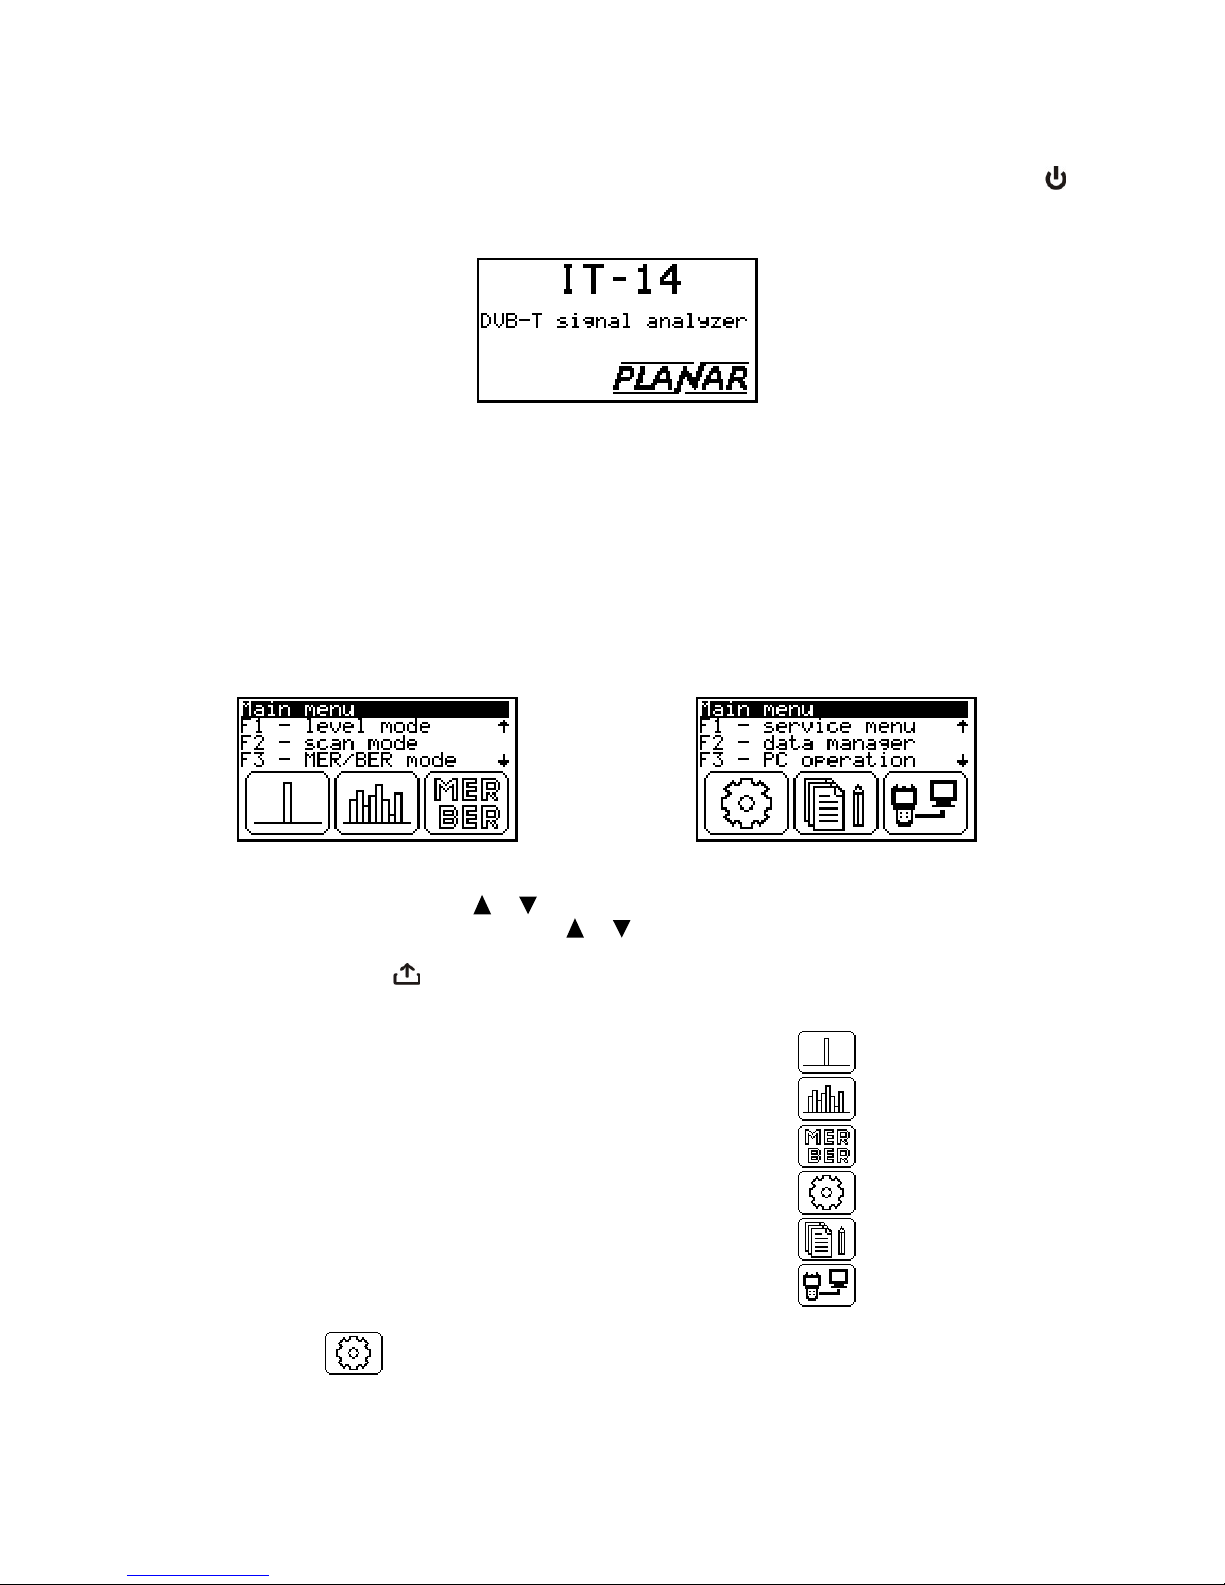
The following message (see Figure 4.2.1) will appear on the screen:
Figure 4.2.1
The screen displays the name and model of the Analyzer. After approximately 1 second, the Analyzer
will open the main mode-selection menu (Figure 4.3.1), further referred to as “Main menu”.
4.3 Measurement procedure
4.3.1 General information
The Analyzer features on-screen menu for selection of modes of operation. The icons of the menu
correspond to various functions. The Main menu (see Figure 4.3.1) will appear on the screen after the
Analyzer is powered up.
Figure 4.3.1 Figure 4.3.2
To change Main menu line press
or arrow. You will see the following line of the Main menu (Figure
4.3.2). To return back to the previous line press
or arrow once again. Function of menu are selectable
with the functional keys F1, F2 and F3, which are under the required icons. To return to the Main menu from
the selected function, press
key.
The Main menu contains 6 icons corresponding to the following functions:
a) LEVEL measurement ..........................................................................
;
b) SCAN measurement............................................................................
;
c) MER/BER measurement .....................................................................
;
d) Service menu.......................................................................................
;
e) Data manager menu............................................................................
;
f) PC connection .....................................................................................
.
When choosen
from theMain menu, Service menu will appear on the screen (Figure 4.3.3), and
9
Page 10

when choosen - Data manager menu (Figure 4.3.4).
Figure 4.3.3 Figure 4.3.4
Function of service menu and data manager menu are selectable with the functional keys F1, F2 and
F3, which is under the required icon. To return to corresponding menu from the selected function, press
key. To return to the Main menu press
once again.
Service menu and data manager menu contains 5 icons corresponding to the following functions:
a) Setup ................................................................................................... ;
b) Self-test................................................................................................
;
c) Identification.........................................................................................
;
d) Channel plans manager.......................................................................
;
e) Data log manager ................................................................................
;
The Analyzer offers six modes to measure TV signal parameters:
a) TV channel level and signal power in frequency point, V/A and C/N ratios, as well as alternating and
direct voltage at the input of the Analyzer in LEVEL mode;
b) TV channels level in SCAN mode;
c) TV channels level ripple in RIPPLE mode;
d) Signal spectrum in SPECTRUM mode;
e) DVB-T signal reception quality parameters in MER/BER mode;
f) DVB-T signal constellation diagram in CONSTELLATION mode.
LEVEL, SCAN and MER/BER modes are selectable from the Main menu. SPECTRUM and RIPPLE
mode are selectable from SCAN mode by pressing function keys F2 and F3, correspondingly.
CONSTELLATION mode is selected from MER/BER mode by pressing F2 functional key.
4.3.2 LEVEL measurement mode
The
icon in the Main menu refers to this mode. In this mode you can measure TV channel
parameters and signal level in a frequency point.
The screen view in channel parameter measurement mode is represented in Figure 4.3.5 (for analog
channel) and in Figure 4.3.6 (for digital channel).
Figure 4.3.5 Figure 4.3.6
On the screen you will see the following data:
10
Page 11

1 – channel number
2 – channel level measured in dBmV, dBuV or dBm
3 – selected frequency in MHz
4 – V/A ratio in dB
5 – command line with commands activated by F1, F2 or F3 keys
6 – channel name (when working with selected channel plan)
7 – direct voltage or effective alternating voltage at the input of the Analyzer, at 50/60 Hz frequency, in V
8 – C/N ratio in dB.
When digital channel level is measured you will see D message instead of V/A or C/N on the screen.
When you open LEVEL mode, you can see channel plan name indicated by «Plan:», if one has been
selected.
When the LEVEL function is activated, the IT-14 measures the parameters of the TV channel which was
last selected in one of the measurement modes. This mode will be indicated by Ch shortcut in command line.
The channel modulation type (digital or analog) corresponds to the selected channel plan. If the channel plan
has not been selected, the modulation type is determined automatically.
Three parameters are measured for analog channels. Video carrier level is measured in the frequency
point defined in accordance with the channel template for operation without channel plan. If channel plan has
been selected, the frequency point will be taken from this channel plan. To determine V/A ratio, the Analyzer
additionally measures the audio carrier, which is defined in accordance with the channel template. The V/A
value will be displayed on the screen in position 4 (Figure 4.3.5).
To measure C/N ratio the Analyzer performs measurement in the frequency point with the lowest content
of the useful components of RF signal within the channel bandwidth. If a channel plan has been selected the
measurement frequency will be defined by the channel plan, if not, it will be defined automatically by means
of searching the optimal frequency within frequency offset range of minus 1.500 to minus 1.000 MHz
relatively to video carrier frequency. C/N ratio will appear in position 8 (Figure 4.3.5). The C/N ratio will be
calculated by the following formula:
C/N = Uch – Unoise – 10Lg(Bch/Bm) – K, where
C/N – carrier to noise ratio value;
Uch – channel level;
Unoise – noise level;
Bch – video channel bandwidth;
Bm – measurement channel passband;
K – correction factor.
When working with selected channel plan C/N ratio measurement can be switched on/off separately for
each channel (Section 4.4.2). When working without channel plan C/N ratio measurement can be swithced
off for all channels by means of channel template (Section 4.9.6).
For digital channels the Analyzer measures signal power within the channel bandwidth.
To perform this measurement, the Analyzer applies the integration method. The IT-14 calculates the total
signal power value by measuring the power within all of the channel bandwidths in 125 kHz increments. It
then recalculates the total value into actual power value using the following formulas:
Usum =
[]
∑
=
125.0
0
20/
10
Bch
i
Ui
Uch =
()
KUsum
+
⋅ log20 , where
Ui – signal power value in i-point of the channel;
Вch - digital channel bandwidth in MHz;
Usum – total signal power value in the channel bandwidth, uV;
Uch - actual channel power in dBuV;
К - correction coefficient.
The value of the Bch bandwidth is determined by the channel plan (Section 4.4.2) or channel template if
no channel plan has been selected (Section 4.9.6). The K constant are determined empirically.
To increase the accuracy of the measurement operating with a channel plan, set the digital channel
parameters (Section 4.4.2) to their optimal values.
11
Page 12

The range of voltage measurement at the Analyzer input is from 10 to 100 V. The absolute error of the
measurement is lower than ±1.5 V. The measured value of the voltage is indicated in position 7 (Figure
4.3.5). If the voltage is direct you will see V= on the screen, if it is alternating V~ will appear.
To measure channel parameters, select the required channel by ◄ and ► arrows.
If no channel plan is selected, using ◄ and ► arrows you can switch to any channel in accordance with
the channel template (Section 4.7). Once a signal is detected, the Analyzer will automatically determine the
channel type. The measurements will be performed in accordance with these parameters.
If one of the channel plans has been selected (Section 4.5), the selection will be performed between the
channels of the plan.
You can access other measurement modes using functional keys. F1 key will open SCAN mode (Section
4.3.3). F2 key will activate the mode of signal level measurement in a frequency point. F3 key will open
MER/BER measurement mode (Section 4.3.6), if the selected channel is digital.
The view of the screen in the mode of signal level measurement in a frequency point is shown in Figure
4.3.7.
Figure 4.3.7
In this mode V/A ratio and C/N ratio are not displayed, as well as D message.
In the mode of signal level measurement in a frequency point the level is measured at the selected
frequency. This mode is indicated by Hz message in the command line. The tuning to the frequency is
performed with 125 kHz step by ◄ and ► arrows.
Pressing F2 key you can return to channel parameters measurement mode.
4.3.3 SCAN measurement mode
The
icon in the Main menu refers to this mode. This mode displays the signal levels as a bar-
graph. See Figure 4.3.8:
Figure 4.3.8
On the screen you will see the following data:
1 – number of channel indicated by marker
2 – command line with commands activated by F1, F2 and F3 keys
3 – channel name (when working with selected channel plan)
4 – measured level of channel indicated by marker, in dBmV, dBuV or dBm
5 – marker
6 – channel status: A – analog, D - digital.
You can navigate the marker by means of ◄ and ► keys.
If no channel plan has been selected, all the channels of the channel allocation standard will be
displayed on the screen. Channel modulation type is determined automatically when you enter the mode and
12
Page 13

each time, signal is appeared on the input. It is shown by the progress indicator «channels scanning». The
modulation type of the channel indicated by the marker will be shown in position 6 while the measurement is
being performed.
If one of the channel plans has been selected, the scanning will be performed only over the selected
plan channels. In this case, after entering SCAN mode you will see selected channel plan name indicated by
«Plan:» for a few seconds. The navigation by ◄ and ► keys will be fulfilled only within the selected channel
plan. The channel name will be displayed in position 3, modulation type will be displayed in position 6.
In SCAN mode the Analyzer applies estimating method for determining the digital channel level. This
method involves measurement of the signal level in the central point of the channel, which is further
recalculated into channel level value using the following formula:
Uch = Um +10Lg (Вch/Вm) + К, where
Uch - channel level;
Um – channel level in the central point;
Вch - digital channel bandwidth;
Вm – measurement channel passband;
К - correction coefficient.
The value of the Bch bandwidth is determined by the channel plan (Section 4.4.2) or by channel
template (Section 4.9.6 ), if no channel plan has been selected. The K constant are determined empirically.
This method helps to accelerate the measurement process but gives additional error when digital
channel has high ripple.
The graph reference level shown in Figure 4.3.8 is automatically set to the channel with the maximum
level.
You can access other measurement modes using functional keys. F1 key will open LEVEL measurement
mode (Section 4.3.2). F2 key will open RIPPLE measurement mode (Section 4.3.4). F3 key will open
SPECTRUM measurement mode (Section 4.3.5).
4.3.4 RIPPLE measurement mode
This measurement mode is selected from SCAN mode by pressing F2 key. This mode displays signal
levels as vertical bars and the horisontal level lines between the peaks of the two selected channels. The
screen view is represented in the Figure 4.3.9:
Figure 4.3.9
On the screen you will see the following data:
1 – channels ripple value between A and B markers
2 – A marker
3 – command line with commands activated by F1, F2 and F3 keys
4 – B marker
Adjust the marker position by ◄ and ► arrows. Selection of the marker is performed by F1 and F3 keys
and indicated by the asterisk in the command line.
If no channel plan is selected, all the channels of the channel template will be displayed on the screen.
Channel modulation type is determined automatically each time, signal is appeared on the input and what is
shown by the progress indicator (channels scanning).
If one of the channel plans has been selected, the scanning will be performed only over the selected
plan channels. The navigation by ◄ and ► keys will be fulfilled only within the selected channel plan.
The graph reference level shown in Figure 4.3.9 is automatically set to the channel with the maximum
level. The marker positions are saved into the memory and restore once you enter RIPPLE measurement
mode again.
Channels measurement nad representation on the graph according to the same principle as in SCAN
measurement mode (Section 4.3.3).
13
Page 14

You can return to SCAN measurement mode by pressing F2 key.
4.3.5 SPECTRUM measurement mode
This measurement mode is selected from SCAN mode by pressing F3 key. This mode displays spectrum
of the input signal in scaleable frequency range. See Figure 4.3.10:
Figure 4.3.10
On the screen you will see the following data:
1 – frequency of the frequency point indicated by marker
2 – command line with commands activated by F1, F2 and F3 keys
3 – measured level of the frequency point indicated by marker, in dBmV, dBuV or dBm
4 – marker
Adjust the marker position by ◄ and ► arrows. Select frequency range scale with F1 key from the
fullowing list:
a)
. Spectrum diagram is in 13.750 MHz frequency range. LCD pixel corresponds to 0.125
MHz frequency range;
b) . Spectrum diagram is in 27.500 MHz frequency range. LCD pixel corresponds to 0.250
MHz frequency range;
c)
. Spectrum diagram is in 55.000 MHz frequency range. LCD pixel corresponds to 0.500
MHz frequency range;
d)
. Spectrum diagram is in 110.000 MHz frequency range. LCD pixel corresponds to 1.000
MHz frequency range;
Measuring of spectrum is pefrormed in 0.125 MHz step. When you choose 28MHz, 55MHz or 110MHz
frequency range several frequency points corresponds to one LCD pixel. In this case the frequency point
with the highest level will be dispayed.
Progress of spectrum measurement is indicated with white point run at the bottom of the spectrum
diagram.
You can return to SCAN measurement mode by pressing F3 key.
4.3.6 MER/BER measurement mode
The
icon in the Main menu refers to this mode. This mode displays the table of the parameters
featuring the input DVB-T signal quality. The screen view is represented in the Figure 4.3.11:
Figure 4.3.11
On the screen you will see the following data:
1 – channel number
2 – selected frequency and frequency shift in MHz
3 – signal modulation parameters (subcarrier modulation type and subcarriers number)
4 – MER value in dB
14
Page 15

5 – perBER value
6 – postBER value
7 – erroneous packets after Reed-Solomon decoder counter
8 – command line with commands activated by F1, F2 and F3 keys
9 – channel name (when working with selected channel plan)
10 – demodulator status.
When this mode is activated or tuning to a channel is performed, the Analyzer will start input signal
synchronization process, which will be indicated by a progress bar in position 10. The lock icon
will appear in position 10 once synchronization is achieved. Subcarrier modulation type and subcarriers
number will be presented in position 3. Some time later MER, preBER, postBER and erroneous packets
number measured values will appear in positions 4, 5, 6 and 7. If postBER value is lower than 2.0E-04, then
postBER marked with «pass» message, otherwise with «fail» message.
If signal level value of the selected channel is insufficient, low level icon
will be blinking in
position 10. Channel synchronization in this case is impossible. If signal level is high enough, but
sinchronization hasn’t been achieved in 30 secinds, then channel has too high noise level, or channel has
modulation other than DVB-T.
To measure channel parameters, select the required channel by ◄ and ► arrows.
If no channel plan is selected, using ◄ and ► arrows you can switch to any channel in accordance with
the selected channel template (Section 4.6). Once a signal is detected, the Analyzer will automatically
determine the channel parameters: frequency offset, spectrum inversion, subcarriers number, subcarriers
modulation type, guard interval and code rate.
If one of the channel plans has been selected, the tuning will be performed between the digital channels
of the channel plan. In this case, after entering MER/BER mode you will see selected channel plan name
indicated by «Plan:» for a few seconds. The channel parameters will be taken from the channel plan. If the
selected channel plan does not include any digital channels, tuning to channels will not be performed.
NOTE! When working with hierarchical modulated channel, postBER is measured for low priority stream.
When you press
, current measurement is interrupted and demodulator starts channel sinchronization
once again.
You can access other measurement modes using functional keys. F2 key will activate CONSTELLATION
measurement mode (Section 4.3.3). F3 key will open LEVEL measurement mode (Section 4.3.2).
Press F1 key, if you want to get detailed information of channel parameters. Channel parameters table is
represented in the Figure 4.3.12.
Figure 4.3.12
On the scrren you will see the following parameters:
a) DVB bandwidth – channel bandwidth;
b) Spectrum – spectrum type: inverted or normal;
c) Guard interval – guard interval relative duration;
d) Hierarch mode – hierarchical modulation mode;
e) Code rate (HP) – high priority stream relative code rate;
f) Code rate (LP) – low priority stream relative code rate (for hierarchical modulation only);
g) TPS cell ID – transmitter ID in hexadecimal format.
Press
key to return to MER/BER measurement mode.
15
Page 16

4.3.7 CONSTELLATION measurement mode
This measurement mode is selected from MER/BER mode by pressing F2 key. This mode displays DVBT channel constellation diagram. See Figure 4.3.13:
Figure 4.3.13
On the screen you will see the following data:
1 – channel number
2 – quadrant marker
3 – channel name (when working with selected channel plan)
4 – demodulator status
5 – MER value in dB
6 – preBER value
7 – postBER value
8 – diagram zoom scale choosing key
When there is not sinchonization with the channel, constellation diagram is empty. After sinchronization
is being achieved quadrature modulation points is displayed on the diagram. For example, for QAM64
subcarrier modulation 64 points of data subcarriers and 4 points of pilot subcarriers will be displayed. View of
constellation diagram allows to determine distortion behavior in the channel.
MER, preBER and postBER measurement values are displayed in positions 5, 6 and 7.
With
, , ◄ , and ► keys you can choose diagram quadrant for being zoomed. Choosed quadrant is
marked with the arrow (position 2). For activating zoomed view mode press F3 button. Press F3 button once
again to return to native view mode.
Press
key to return to MER/BER measurement mode (Section 4.3.6).
4.4 Data manager
4.4.1 General information
Data manager provides automation of measurement and result recording procedures. The Analyzer
offers two tools: Channel plan manager and Data log manager. The memory capacity allows you to save up
to 16 channel plans (up to 112 channels per plan), and up to 130 data log pages (with maximum number of
channels). The IT-14 allows you to view the saved data in stand-alone mode or by means of a computer.
4.4.2 Channel plan manager
The
icon in the data manager menu refers to this mode. The mode allows you to perform all the
operations with channel plans (viewing, editing, deleting, and creating channel plans). The screen view is
represented in the Figure 4.4.1.
Figure 4.4.1
On the screen you will see the following data:
16
Page 17

1 – table header line
2 – channel plan selected for the measurement
3 – command line with commands activated by F1, F2 and F3 functional keys
4 – scroll bar
The first column is contains a plan index number. The second column is a plan name of up to 15
characters in length. This name is assigned by the user during creating and later can be edited by
ItToolsTerrestrial PC software. If the channel plan is not available, it will be indicated by *********** message.
If a channel plan has been selected in Setup (Section 4.5), its name will be highlighted in inverse color
(position 2).
Using
, arrows you can select a channel plan from 1 to 16 index number. The selected channel plan
will be framed.
The list of available commands:
a) F1 key to view and edit the selected channel plan;
b) F2 key to delete the selected channel plan;
c) F3 key to create a new channel plan in automatic mode.
4.4.2.1 Channel plan editing
To view and edit a channel plan, select the required one and press F1. You will see the channel plan
table. The screen view is represented in the Figure 4.4.2.
Figure 4.4.2
On the screen you will see the following data:
1 – table header line
2 – selected line
3 – command line with commands activated by F1, F2 and F3 functional keys
4 – scroll bar
The table represents a list of channels comprising the channel plan. The top line divides the table into
columns. The first column is the index of channel (from 1 to 112). The second column is a channel number
covering the channel plan’s point. The third column is the channel modulation type: A or D (analog or digital).
The fourth column is the channel name of up to 6 characters. The bottom line shows the commands that can
be activated by the functional keys. These commands are as follows:
a) F1 key to view and edit the selected frequency point;
b) F3 key to delete the selected frequency point.
To edit a channel, select the required one by
and keys (the selected line will be framed, position 2).
Then press F1 key. The table of channel parameters will appear. The screen view is represented in the
Figure 4.4.3 (for analog channel) and in the Figure 4.4.4 (for digital channel).
Figure 4.4.3 Figure 4.4.4
There are two groups of parameters:
General parameters:
17
Page 18

a) Channel – channel number;
b) Type – channel type: analog or digital;
c) Frequency – frequency of the video carrier for analog channel or central frequency for digital channel;
d) Fnoise – frequency shift for C/N ratio measurement for analog channels. Can be adjusted from -8000
to +8000 kHz with 125 kHz step. You can turn off the C/N measurement for a channel by setting
frequency shift value as 0. In this case «------» value will be presented in the table;
Digital channel parameters:
a) Band width – channel bandwidth. Can be adjusted from 1000 to 8000 kHz with 125 kHz step;
b) COFDM – subcarriers modulation type. Available values: ------, QPSK, QAM16, QAM64. The «------»
symbol means modulation type diffrerent from DVB-T.
c) Spectrum – spectrum type: normal or inverted. Available values: norm, inv;
d) DVB bandwidth – DVB-T channel bandwidth. Available values: 6MHz, 7MHz, 8MHz;
e) Carriers – subcarriers number. Available values: 2k, 4k, 8k;
f) Guard interval – guard interval relative duration. Available values: 1/32, 1/16, 1/8, 1/4;
g) Hierarch mode – hierarchical modulation type (for QAM16 and QAM64 subcarriers modulation only).
Available values: ---, α=1, α=2, α=4;
h) Code rate (HP) – high priority stream relative code rate. Available values: 1/2, 2/3, 3/4, 5/6, 7/8;
i) Code rate (LP) – high priority stream relative code rate (for hierarchion modulation enabled only).
Available values: 1/2, 2/3, 3/4, 5/6, 7/8;
The initial values of the parameters are set during automatic detection of a channel plan and can be
manually edited by means of channel editing function.
When you create a new channel plan (Section 4.4.2.3) channel parameters are set according the
following rules:
a) For analog channels frequency is set to video carrier frequency of the channel. The noise frequency
offset is defined automatically by means of searching the optimal frequency within frequency offset
range of minus 1.500 to minus 1.000 MHz relatively to video carrier frequency;
b) For digital channels frequency is set to central frequency of the channel. Channel bandwidth is set
according to channel template (Section 4.7). DVB-T channel parameters are detected automatically.
To fine tune a parameter, select it by
, keys, and then scroll to the required values by ◄, ► keys.
To save the channel, press F2. To abort the function without saving changes, press F1 key. Always
check all the parameters after the channel plan has been automatically set. It is more convenient to
determine the parameters in the spectrum measurement mode using PC. In case of incorrect (or nonoptimal) settings, fine tune the parameter manually. Otherwise, it can lead to errors in channel parameters
measurement.
Pressing
key will confirm saving changes if any and exit the mode. You should consider that when
you save changes to or delete a channel plan, the data log pages which are related to the plan becomes
deleted.
To delete the selected channel, press F3 key.
4.4.2.2 Channel plan erasing
To erase a channel plan, select the required one and press F2. The confirmation request dialog will
appear. To abort erasing, press F3. To confirm erasing of the plan, press F1.
4.4.2.3 Channel plan creating
To create a new channel plan in auto mode, supply the signal to the RF input of the Analyzer, select
position of the plan in the table and press F3. After the Analyzer has completed scanning all the channels of
the channel template, it will switch to channel plan editting mode (Section 4.4.2.1). Edit the channel plan
parameters if needed, and save the plan into the memory.
4.4.3 Data log manager
4.4.3.1 General information
The Data log manager enables you to measure parameters of the TV channels within a channel plan, to
check the network parameters against the limit plan, and save the check results into memory. This function
allows you to view the measurement results and the errors in different parameters, download the data onto
your PC for further processing and report preparation.
18
Page 19
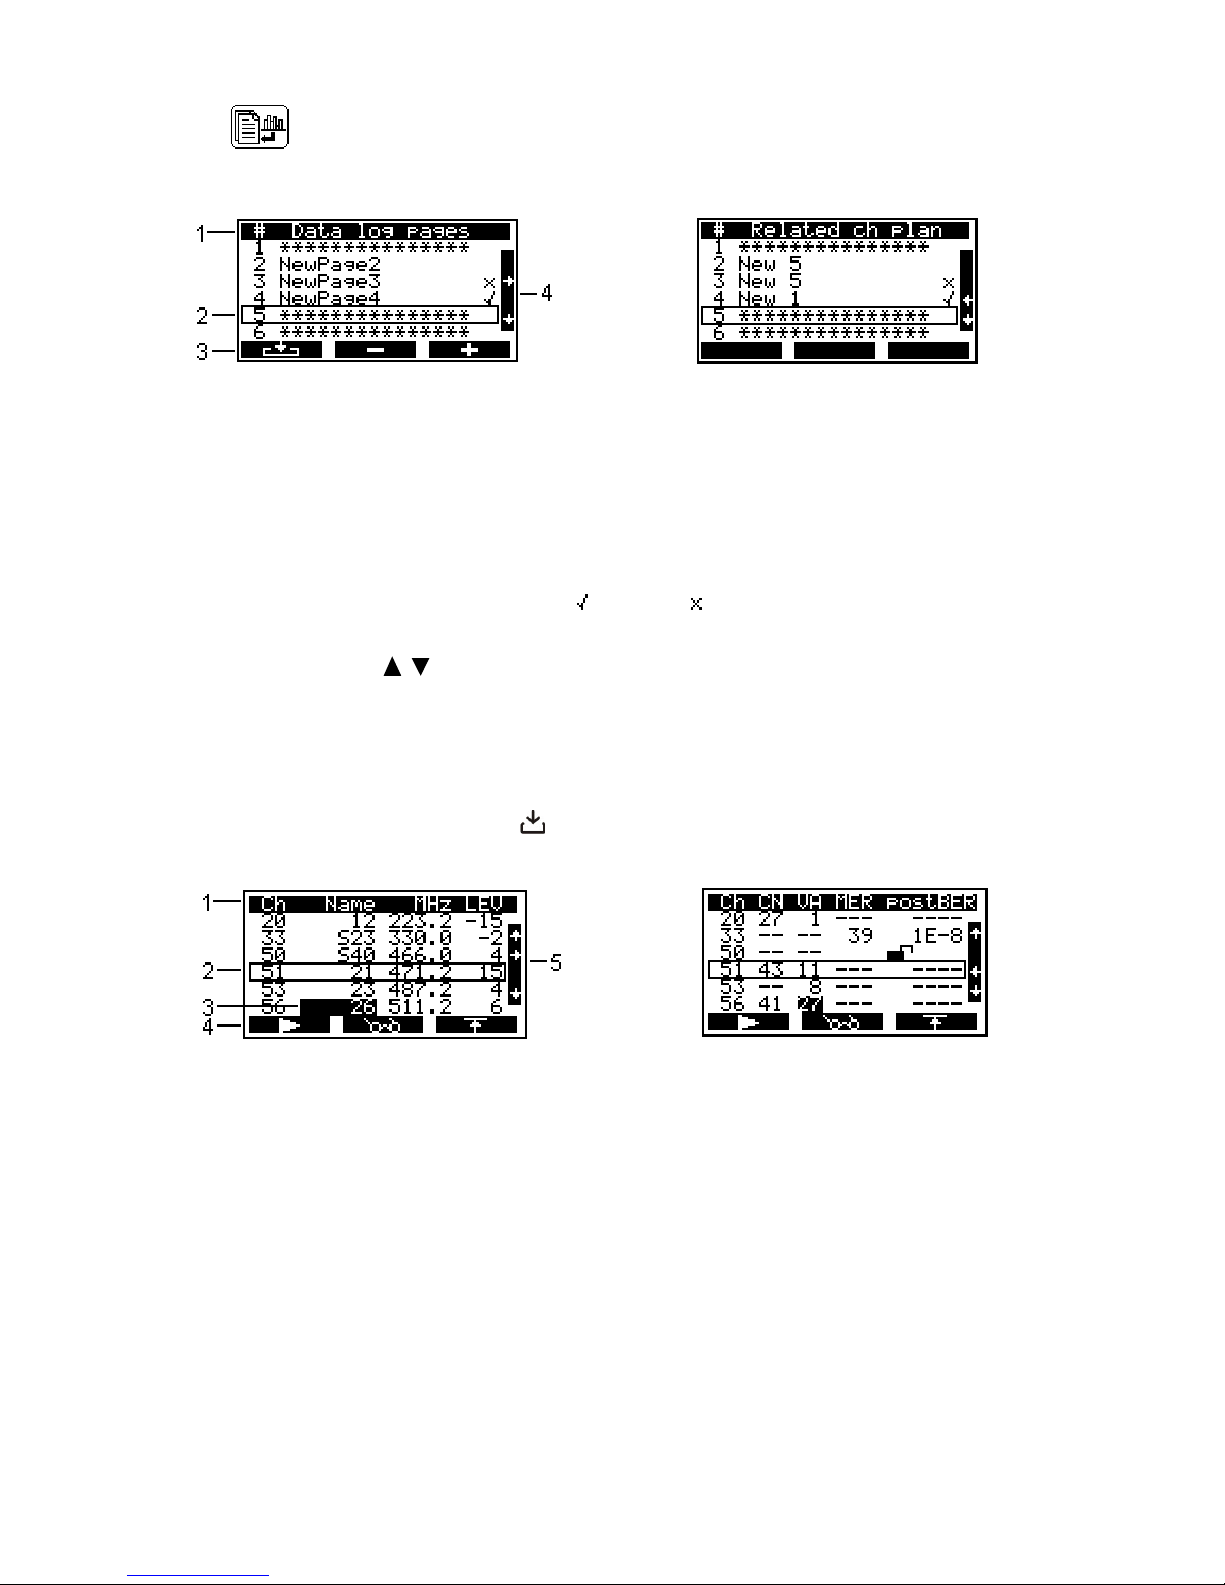
4.4.3.2 Data log pages
The icon in the Data manager menu refers to this mode. This mode allows you to perform with
data log pages such operations as viewing, deleting and creating of a new page. The screen view is
represented in the Figure 4.4.5 and Figure 4.4.6.
Figure 4.4.5 Figure 4.4.6
On the screen you will see the following data:
1 – table header line
2 – selected line
3 – command line with commands activated by F1, F2 and F3 functional keys
4 – scroll bar
The top row of the table (position 1) divides the table into columns. The first column represents the page
numbers form 1 to 130. The second column is the page name. The third column is the result of check against
the limit plan ( no icon – page not measured yet,
- no errors, - some errors). Figure 4.4.6 represents the
list of the channel plan names which are related to data log pages. The bottom line (position 3) contains the
list of commands that can be activated by the functional keys. Press ◄ and ► arrows to switch between the
views of the screen. Press
, keys to select the required page. The selection will be framed (position 2).
The list of available commands:
a) F1 key to view, update and check against the limit plans the selected page;
b) F2 key to delete the selected page or clear all the page;
c) F3 key to create a new data log page.
4.4.3.3 Data log pages operation
To view a data log page, press F1 or . Page data table will appear on the screen (Figures 4.4.7 or
4.4.8).
Figure 4.4.7 Figure 4.4.8
On the screen you will see the following data:
1 – table header line
2 – selected line
3 – channel with some errors
4 – command line with commands activated by F1, F2 and F3 functional keys
5 – scroll bar
Two views of the table are available, for basic and additional parameters. You can switch between these
views by ◄ and ► arrows. The top line of the table (position 1) divides the table into columns. In basic
parameters screen (Figure 4.4.7) the first column is the channel number. The second column is the channel
name. The third column is the video carrier frequency for analog channels or central frequency for digital
channels (with rounding up to 0.1 MHz). The fourth column is video carrier level or digital channel level in
dBuV, dBmV or dBm depending on the preset units. In the additional parameters screen (Figure 4.4.8) the
first column is the channel number, the second column represents C/N ratio (in dB). The third column is V/A
19
Page 20
ratio (in dB). The fourth column displays MER (in dB) and the fifth column will display postBER values. For
digital channels you will see «--» message in the second and third columns, and for analog channels «--»
message in the fourth and fifth columns. If the noise measurement has been disabled for one of the analog
channels, «--» message will be displayed in the second column for this channel. If DVB-T demodulator
synchronization with digital channel has not been achieved during its measurement, no lock icon
will
appear in the fourth and fifth columns.
The bottom line (position 4) contains the commands that you can activate by the functional keys.
Press
or keys to select the required channel. The selection will be framed (position 2).
The list of available commands:
a) F1 key to measure the page;
b) F2 key to view the measurement results in SCAN measurement mode (Section 4.3.3);
c) F3 key to view and edit the limit plan parameters.
To start page measuring, press F1 key. Measuring process will be indicated by a progress bar. After the
measuring is completed, the new values will appear in the measurement result field of the screen. If the
channel name is highlighted in inverse color (position 3), this indicates that the errors have been detected in
this channel during the check against the limit plan. Incorrect parameters are also highlighted in inverse
color.
To identify the errors, activate the limit plan manager (F3 key). The table of limit plan parameters will
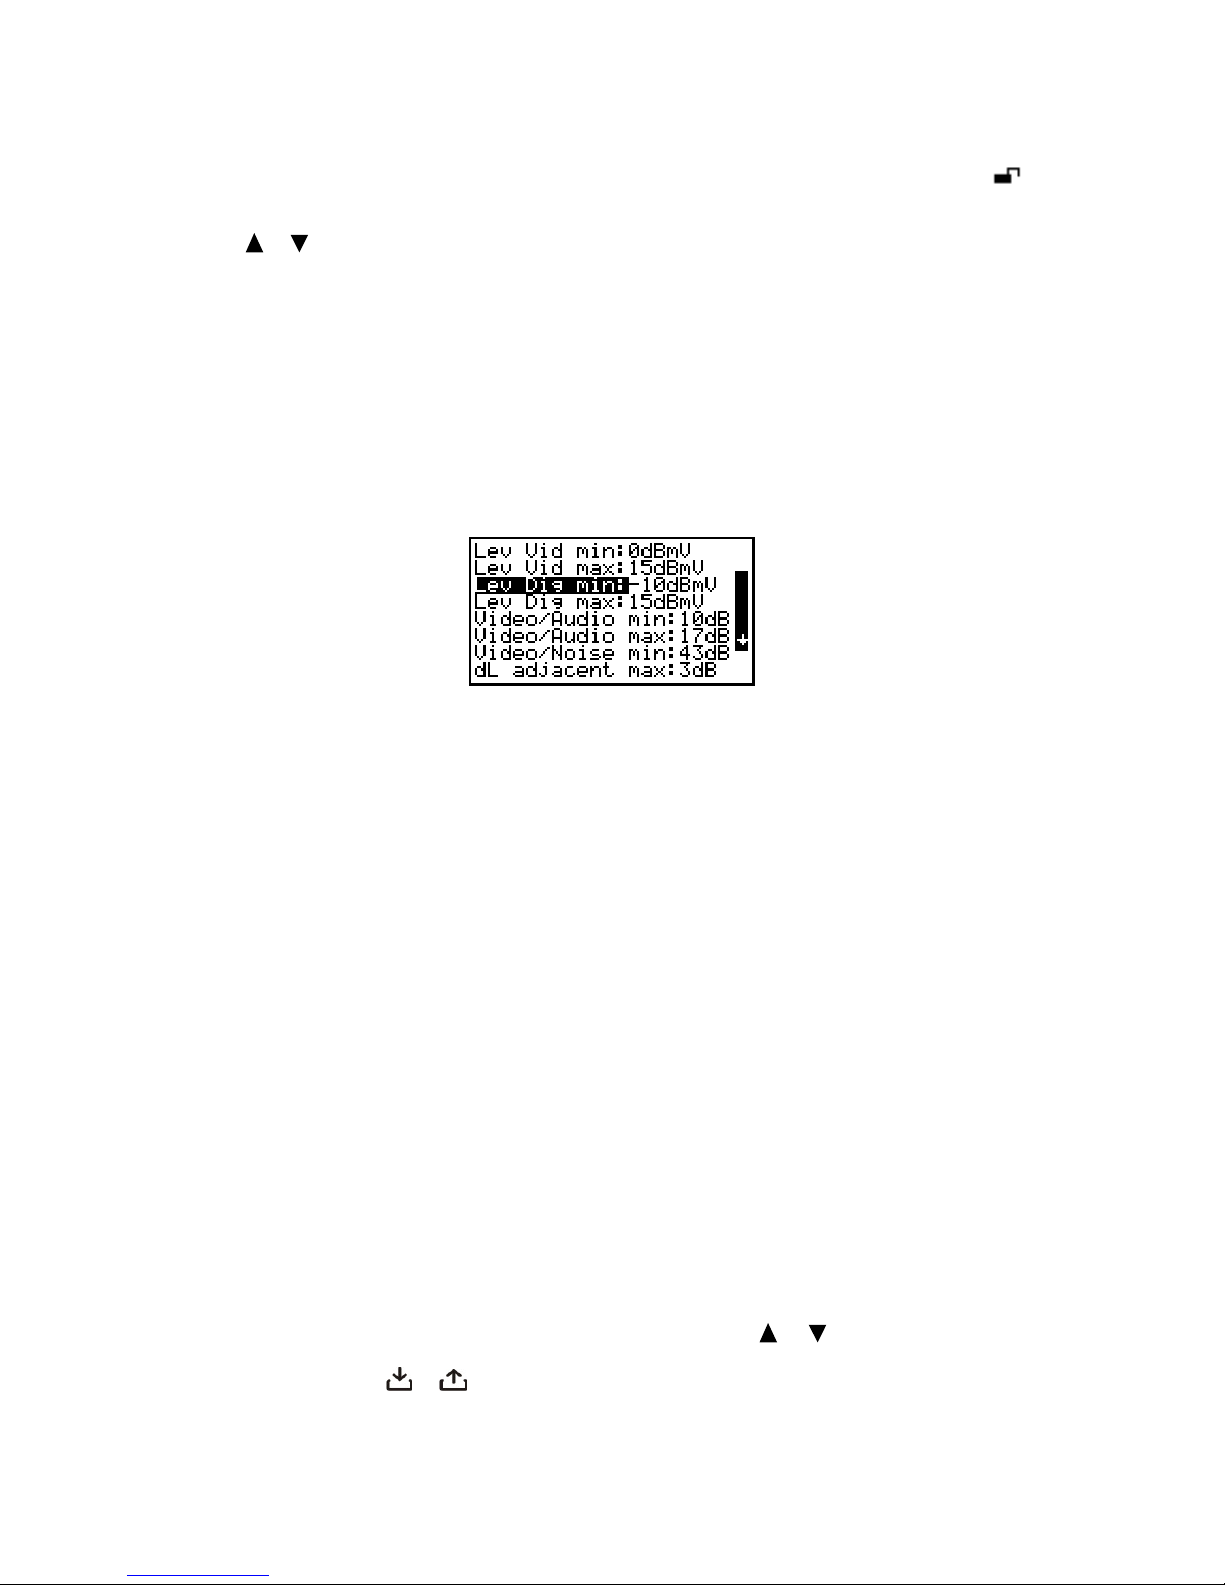
appear on the screen (Figure 4.4.9).
Figure 4.4.9
This table represents the parameters for the measurement results to be verified with. The parameters
are editable only using a PC. The table contains 13 parameters:
a) Lev Vid Min. The minimum value of video carrier level for analog channel. Default value: 48 dBuV.
Available values: 45 to 95 dBuV;
b) Lev Vid Max. The maximum value of video carrier level for analog channel. Default value: 85 dBuV.
Available values: 45 to 95 dBuV;
c) Lev Dig Min. The minimum value of digital channel level. Default value: 48 dBuV. Available values: 45
to 95 dBuV;
d) Lev Dig Max. The maximum value of digital channel level. Default value: 85 dBuV. Available values:
45 to 95 dBuV;
e) Video/Audio min. The minimum value of V/A ratio. Default value: off. Available values: 5 to 20 dB;
f) Video/Audio max. The maximum value of V/A ratio. Default value: off. Available values: 5 to 20 dB;
g) Video/Noise min. The minimum value of C/N ratio. Default value: off. Available values: 15 to 55 dB;
h) dL adjacent max. The maximum value of ratio between the adjacent channel levels. Default value: 10
dB. Available values: 2 to 10 dB;
i) Video/Dig max. The maximum value of ratio between analog and digital channel levels. Default value:
25 dB. Available values: 5 to 30 dB;
j) MER(QPSK) min. The minimum value of MER for DVB-T channels with QPSK subcarriers
modulation. Default value: 12 dB. Available values: 2 to 35 dB;
k) MER(QAM16) min. The minimum value of MER for DVB-T channels with QAM16 subcarriers
modulation. Default value: 27 dB. Available values: 6 to 35 dB;
l) MER(QAM64) min. The minimum value of MER for DVB-T channels with QAM64 subcarriers
modulation. Default value: 30 dB. Available values: 10 to 35 dB;
m) postBER max. The maximum value of postBER. Default value: off. Values available: 1E-4, 1E-5,
1E-6, 1E-7, 1E-8, off. If you make off setting, postBER parameter will not be measured when the
data log page is measured.
For editing limit plan, choose parameter you want to change with
or keys. Then tune parameter
value with ◄ and ► keys. For swithing off parameter set the minimal parameter’s value with ◄ key. You will
see «off» message. Press
or key to return to the data log page table. The channels, which failed the
20
Page 21
check against the selected parameter of limit plan, will be highlighted with the channel names in inverse
color. To check the page against some other parameter, you will need to open the limit plan manager again
and make a new selection.
4.4.3.4 Data log page erasing
To erase a data log page, select the required page and press F2. The confirmation request dialog will
appear. To cancel erasing, press F2. To confirm erasing of the selected page, press F1. To confirm erasing
of all the pages, press F3.
4.4.3.5 Data log page creating
To create a new data log page, select the required fpage and press F3. Channel plan selection screen
will open. Press
and keys to select the channel plan to be measured. Press . The screen will display
the data log page table with initial values (Figure 4.4.7). Then you can perform all the operations described in
Section 4.4.3.3: measuring, checking against a limit plan and saving the page into memory.
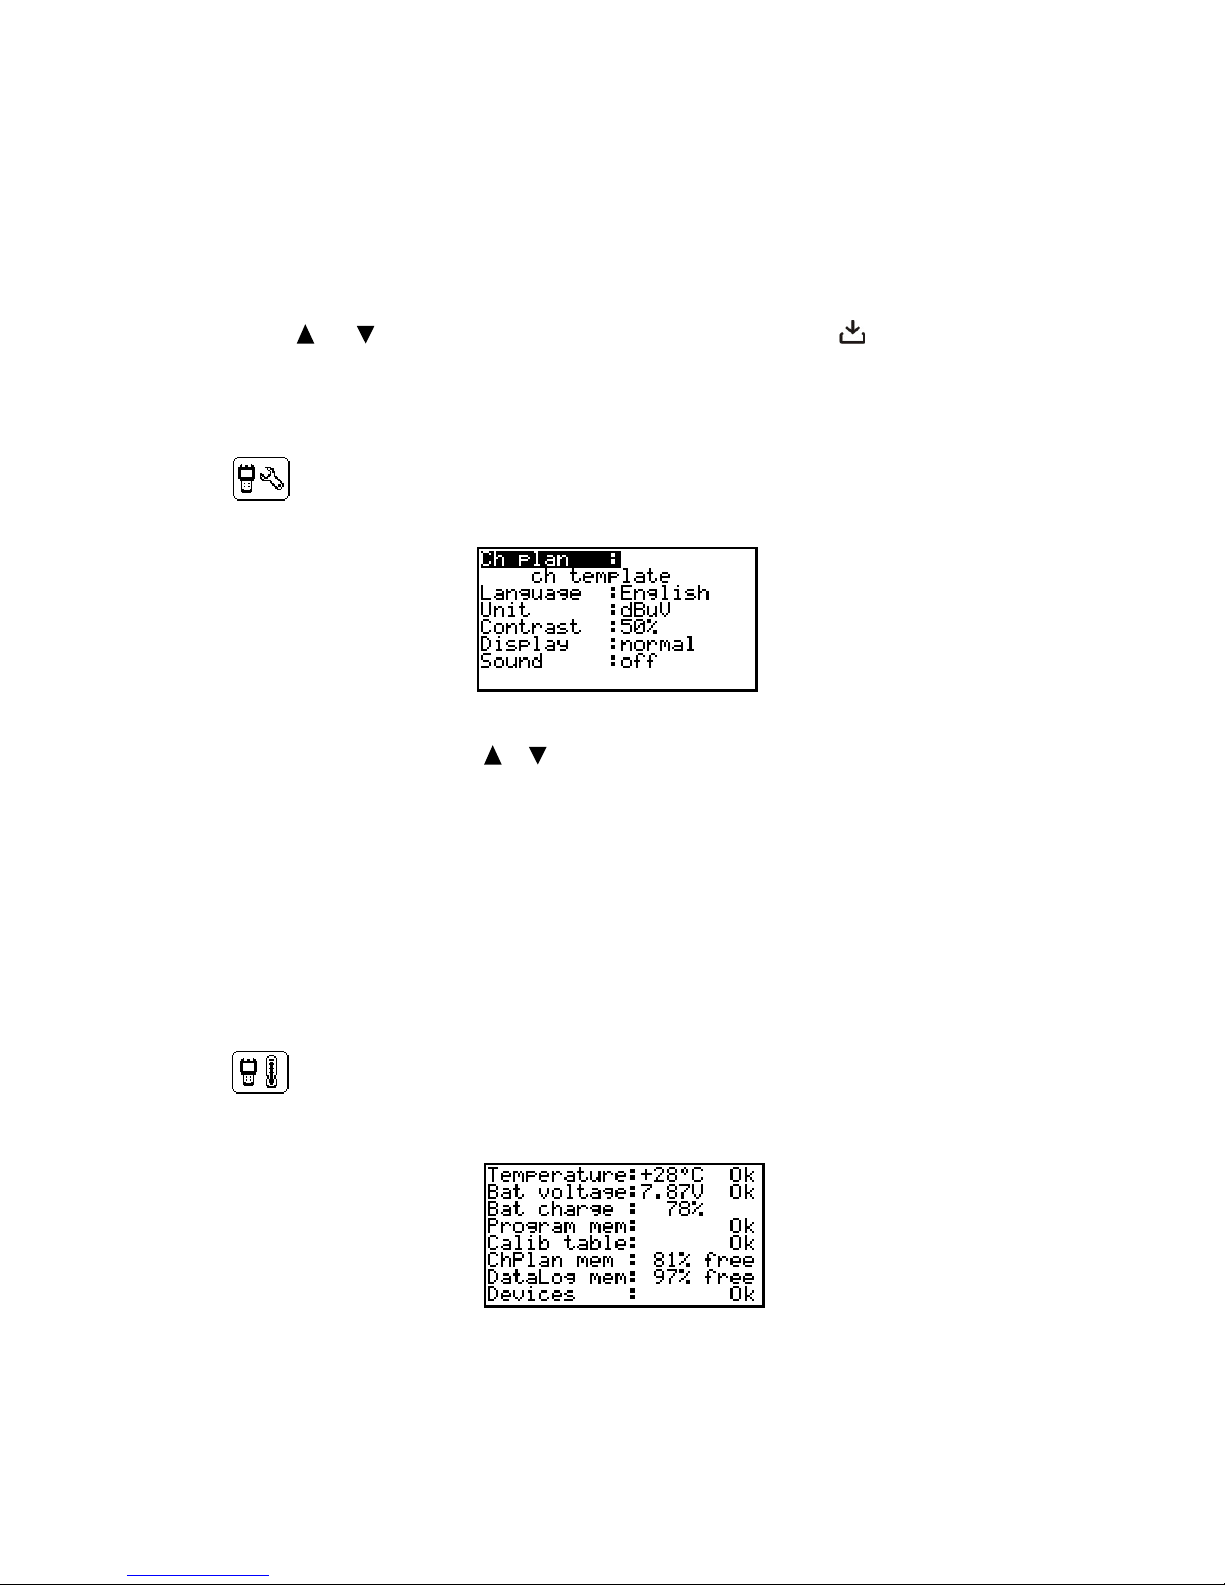
4.5 Setup
The
icon in the Service menu refers to this mode. The setup mode allows you to modify the
general parameters of the Analyzer. The screen view is represented in the Figure 4.5.1.
Figure 4.5.1
Choose parameter for editinig with
or keys. Then scroll parameter with ◄ and ► keys.
The table represents the following settings:
a) Ch plan. Select channel plan from the available (Section 4.4.2). If a channel plan is not selected, ch
template will be displayed;
b) Language. Select language. Available settings: English;
c) Unit. Select measurement units for the signal level. Available settings: dBuV, dBmV, dBm;
d) Contrast. Set LCD contrast from 0 to 100%;
e) Display. Select display mode. Available settings: normal – white characters in the blue background;
revers – blue characters in white background;
f) Sound. Select key pressing sound. Available settings: off – silent; type1, type2, type3 – three types
of sound.
4.6 Self-test
The
icon in the Service menu refers to this mode. The self-test mode allows you to check the
performance of the components of IT-14 and its functional condition. The screen view is represented in the
Figure 4.6.1.
Figure 4.6.1
The table represents the following parameters to be checked:
21
Page 22
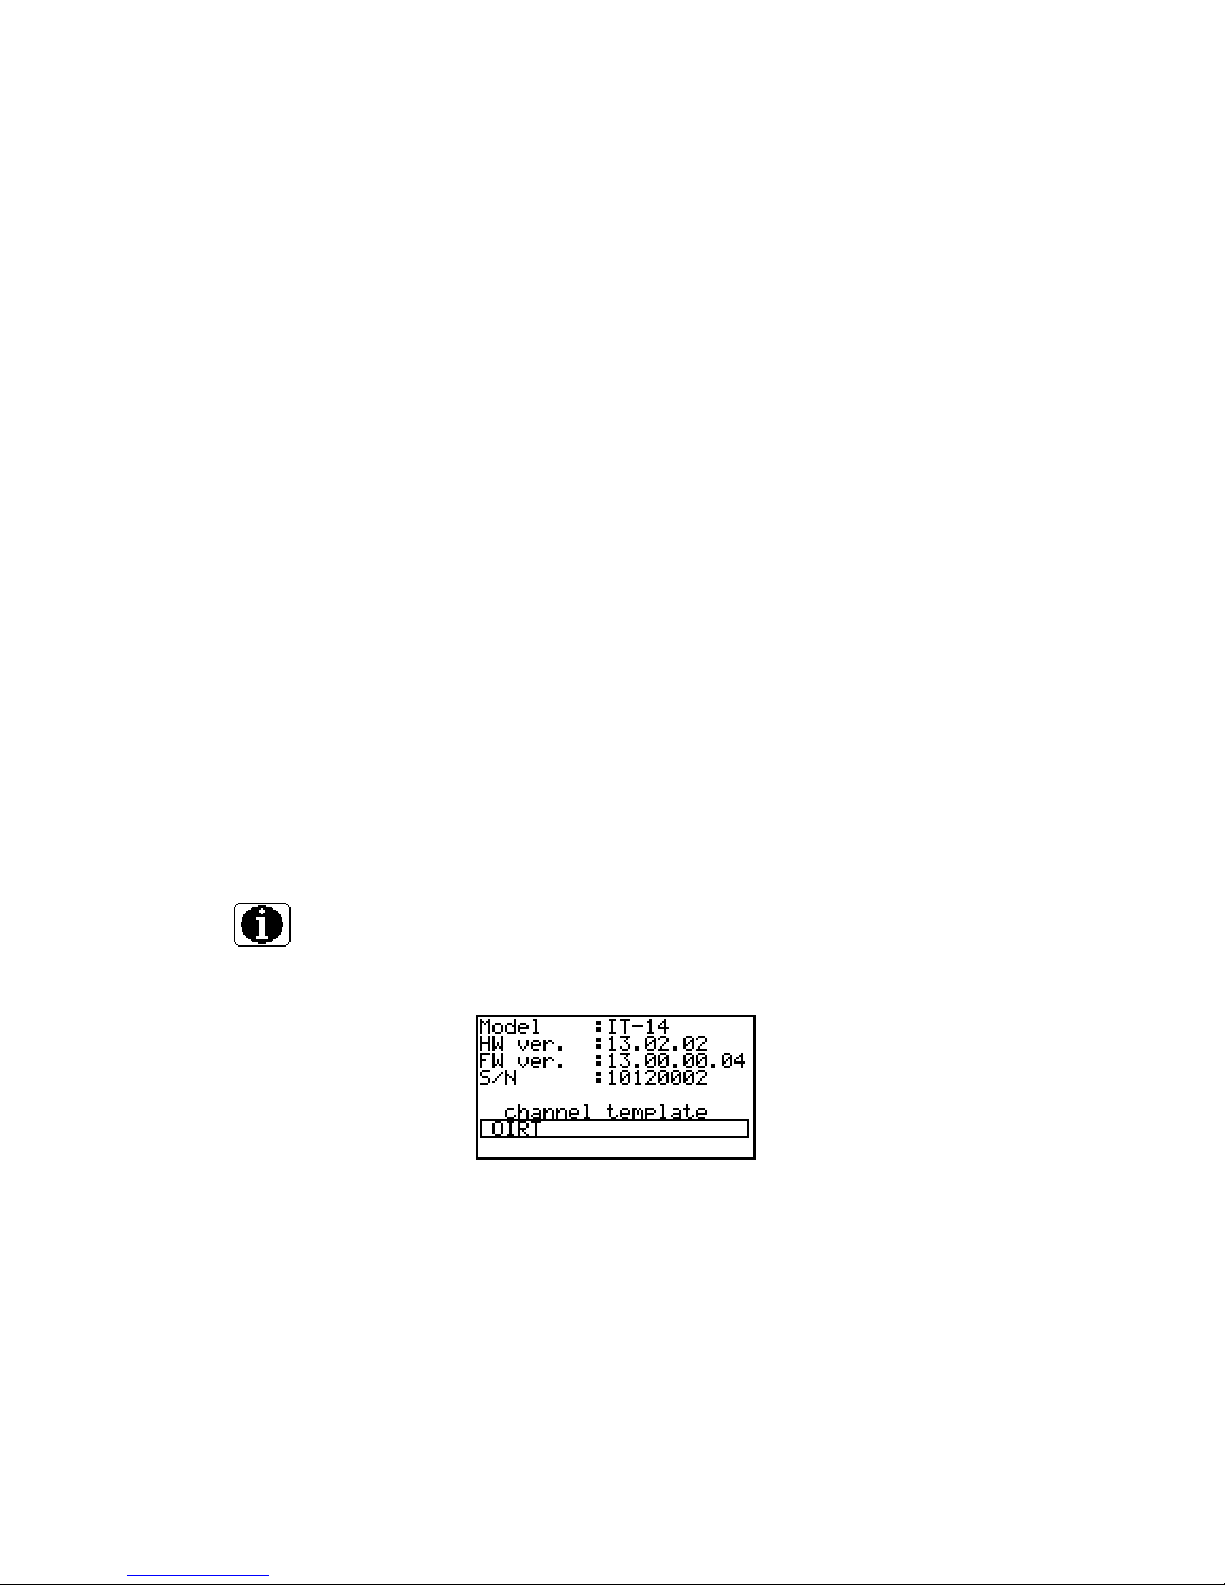
Temperature. Temperature inside the Analyzer.
The function checks the temperature inside the Analyzer. Temperature is the main environmental factor,
which influences the accuracy of measurements. To check the accuracy of measurements of the signal level,
use the temperature parameter. If the temperature value is within the allowed range of – 10 to 50 ºС, then
Ok status will be displayed at the end of the parameter line. If the temperature is not within this allowed
range, then status will not be displayed. If instead of temperature «---» value is displayed, this indicates that
temperature measuring device is faulty. In this case, please contact the service center.
Bat voltage. Voltage of the battery.
Bat charge. Battery level status.
The battery voltage and battery level status parameters allow you to check the battery condition. Perform
this check when operating in stand-alone mode (power supply switched off). If the measured battery voltage
is higher than 6.8 V, then Ok status is indicated, if the voltage is lower than 6.8 V, then Low status is
indicated. The voltage will then be recalculated into the battery level status value in percent, which will help
you to estimate the time remaining for the Analyzer to operate. Please note that with decrease of ambient
temperature the battery capacity also decreases. This should be taken into account when estimating the
operating time of the Analyzer.
Program mem. Firmware status.
This function checks the firmware status of your IT-14. If no errors detected, the Ok status is displayed. If
an error has been detected, the Error status is displayed. In this case, the firmware must be reinstalled
(Section 4.9.5).
Calib table. Calibration table status.
This function checks calibration table. If no errors detected, the Ok status is displayed. If an error has
been detected, the Error status is displayed. In this case, please contact the service center.
ChPlan mem. Channel plan memory status.
DataLog mem. Data log memory status.
This function shows the free memory in percent for each memory type.
Devices. Internal devices status.
This program checks the condition of the Analyzer components. If no errors detected, the Ok status is
displayed. If an error has been detected, the Error status is displayed. In this case, please contact the
service center.
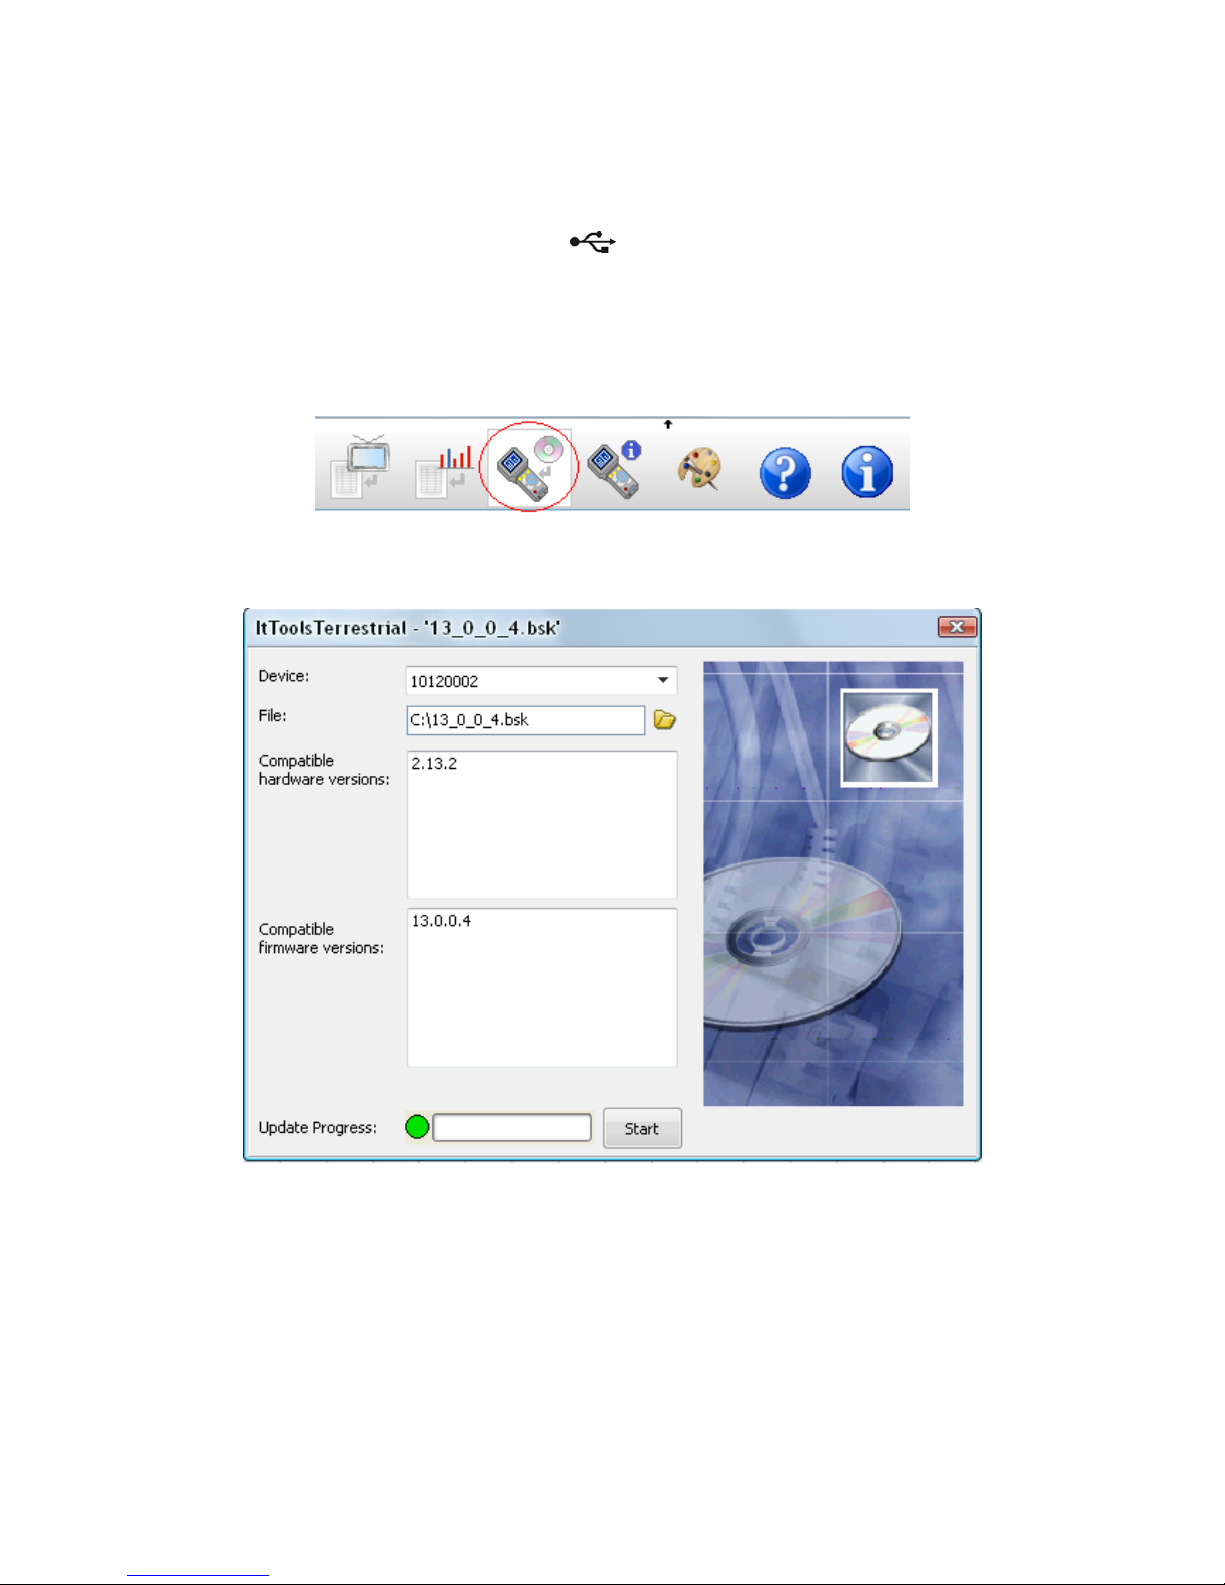
4.7 Identification
The
icon in the Service menu refers to this mode. The Identification function allows you to
determine the Analyzer model, its serial number, modification and firmware version, channel template name.
The screen view is represented in the Figure 4.7.1.
Figure 4.7.1
Your IT-14 data are displayed in the upper part of the screen:
a) Model – Analyzer model;
b) HW ver. – Analyzer hardware version;
c) SW ver. – Analyzer firmware version;
d) S/N – Analyzer serial number.
In the lower part of the screen, you will find name of the channel template, which can be edited with
external PC (Section 4.9.6).
22
Page 23

4.8 Battery operation
The IT-14 is powered by Li-ion battery of no less than 1500 mAh capacity.
To determine the battery level status, use the self-test function of the Analyzer (Section 4.6.3). When the
effective charge level of the battery drops to the critical point you will hear a warning beep. This signifies that
the time of operation until total battery discharge is a few minutes.
When you connect an external 12 V DC power source or the car cigarette lighter socket of 12 V to the
Analyzer, battery charging automatically switches on. The protection circuit will cut off the charging process
when the temperature in the battery compartment is higher than 60
0
C. That is why make sure to charge the
battery in the ambient temperature not higher than 35 – 40
0
C. We do not recommend you to charge
batteries under high temperature, because they will not be able to gain full charge. Also, we do not
recommend deep discharging of battery, because it leads to battery life time decreasing. You can control
charging process from Self-test menu (Section 4.6). If battery level is reached 100%, it means that charging
is finished and battery is ready for using.
CAUTION! IT-14 is shipped with nonstandard Li-ion battery. In the case of its malfunctioning or
expiration of its life time, it can be repaced with a new one only in the service center. Do not try to do it
yourself.
4.9 PC communication
4.9.1 General information
You can operate with your IT-14 via PC. For connection to PC use USB
on the front panel of your
Analyzer. The ItToolsTerrestrial software allows the following:
a) measurement of video carrier level, C/N ratio and V/A ratio for analog channels and channel power for
digital channels;
b) measurement of spectrum within scaleable frequency band (from 45 to 900 MHz);
c) measurement of DVB-T signal reception quality;
d) viewing and creating data log pages;
e) editing of channel plans;
f) editing of channel template;
g) saving and documenting of measurement results.
4.9.2 Software installation
You can find all the necessary information about software installation from the «readmy.txt» document,
which is distributed with the ItToolsTerrestrial installation file.
4.9.3 USB driver installation
Please, install ItToolsTerrestrial software (Section 4.9.2) before the USB driver installation.
Follow the steps:
a) Plug the USB cable into the Analyzer USB
port on the front panel;
b) Switch on the Analyzer;
c) Wait for USB driver installation master being appeared;
d) Choose manual USB driver installation and set folder “Drivers” as a path to the driver. It is in the place
you installed ItToolsTerrestrial software to;
e) Wait for driver being installed;
When the driver is successfully installed you can communicate your IT-14 with ItToolsTerrestrial
software.
4.9.4 PC communication launch
To launch communication of your IT-14 with PC refer to the following steps:
a) Switch on the Analyzer;
b) Plug the USB cable into the Analyzer USB
port on the front panel;
c) Choose
icon from the Main menu.
After that you can see the screen with the blinking «Waiting for command» message. The analyzer is
ready for communication with ItToolsTerrestrial software.
23
Page 24
4.9.5 Firmware updating
The IT-14 offers the capability to update its firmware without use of any additional equipment. We go on
with improving IT-14 firmware. Each version of the firmware has its unique identification number, e.g.
13.0.0.3. The Analyzer firmware version is displayed in the Identification mode (section 4.7).
Before firmware updating make sure ItToolsTerrestrial software and IT-14 USB driver have been
installed.
To update the Analyzer’s firmware proceed as follows:
a) Plug the USB cable into the Analyzer USB
port on the front panel;
b) Switch on the Analyzer;
c) If you see «Bootloader» message on the screen, that means the firmware is damaged and you
should skip step (d);
d) Launch PC communication (Section 4.9.4);
e) Launch ItToolsTerrestrial software and choose Firmware updating manager icon on the navigation
bar at the top of the window (Figure 4.9.1);
Figure 4.9.1
f) You will see the Firmware updating manager (Figure 4.9.2);
Figure 4.9.2
g) Choose device for firmware updating in the «Devices:» list;
h) Specify the path to the firmware updating *.bsk file;
i) Press «Start» button;
If your Analyzer functions properly, USB port cable connected correctly and the firmware updating file is
compatible with the IT-14, the process of program updating onto your Analyzer will automatically start. The
Analyzer must be powered from an external power source. After the download is over the pop-up
24
Page 25
window will announce that the operation has been successfully completed. The IT-14 will reboot and start
operating similar to when it has been powered up.
CAUTION Do not interrupt the firmware updating process. This can lead to malfunction of the Analyzer.
But, if this does occur, repeat the firmware updating once again.
4.9.6 Channel template editing
ItToolsTerrestrial software allow editing of the Analyzer’s channel template. To access channel
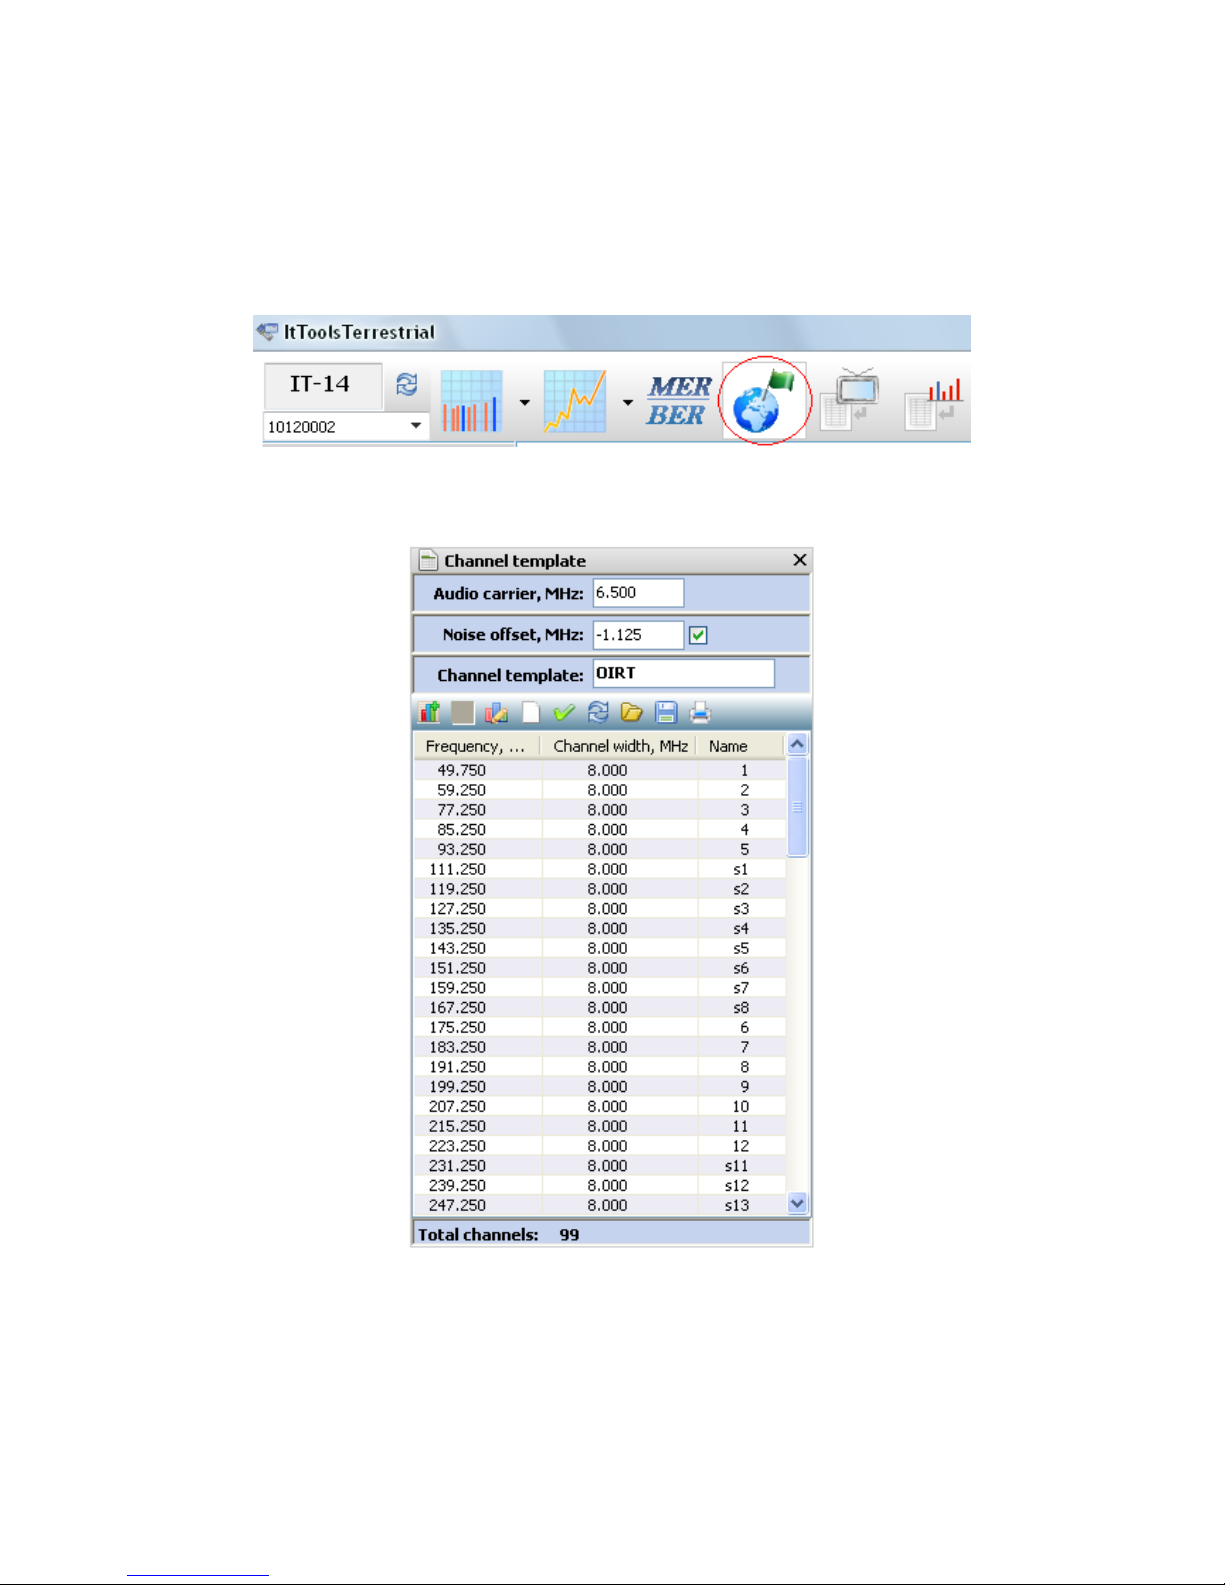
template manager press the icon with the Globe on the navigation bar (Figure 4.9.3).
Figure 4.9.3
Channel template manager window will appear on the screen. See figure 4.9.4.
Figure 4.9.4
Channel template manager allow to:
a) Channel template creating;
b) Channel template editing;
25
Page 26

c) Channel template saving to or loading from the file. Standart channel templates: OIRT and CCIR are
distributed with the ItToolsTerrestrial software. You can find them in the folder “TvSystems” in the
place all user data are stored;
d) Channel template saving to or loading from the IT-14.
Channel template consists of the following parameters:
a) Audio carrier. Audio carrier frequency shift from the channel video carrier. Uses for V/A ratio
measurement.
b) Noise offset. Frequency point for noise measurement shift from the channel video carrier. This value
uses as an default noise frequency offset value when creating or editing channel plan with
ItToolsTerrestrial software. If noise offset is disabled, then C/N ratio measurement is switched off.
c) Channel template. The name of the channel template. You can see it in the Information mode
(section 4.7).
d) Frequency. Video carrier frequency. Set for every channel.
e) Width. Channel band width. Uses for digital channels power measuring and determining its central
frequency. Set for every channel.
f) Name. Identity number of the channel which you can see in measurement modes. Set for every
channel.
5 MAINTENANCE
Required maintenance is limited to observation of instructions related to proper operation, storage, and
shipment, which are supplied in this Manual and also minor defects correction.
Perform preventive inspections covering check of controls, reliability of assembly, and the keypad
condition after the warranty period has expired and annually since then.
6 TROUBLESHOOTING
Defect detection: The IT-14 fails to switch on in stand-alone mode.
Possible reason: Extremely low charge or malfunction the battery.
Methods of correction: To check the IT-14 condition, connect the external power adapter. If the Analyzer
switches on, check the battery voltage in self-test mode (Section 4.6.3). Low voltage (under 6.8 V) is an
evidence that the battery is discharged or malfunctioning. Voltage that is higher than normal (over 8.5 V)
indicates that the battery is malfunctioning. The battery should be charged in case it is low (Section 4.8) or
replaced in the service center if it is malfunctioning.
Defect detection: The IT-14 is switched on in stand-alone mode but instead of displaying the Main
menu it displays message «Bootloader».
Possible reason: The Analyzer’s firmware is damaged.
Methods of correction: Reinstall analyzer’s firmware (Section 4.9.5).
Defect detection: The IT-14 does not react on pressing any of keys.
Possible reason: The Analyzer’s firmware may be frozen.
Methods of correction: Press and hold
key for 5 seconds. Then switch on The Analyzer.
Defect detection: High error at level measurements in some or all of the channels.
Possible reason: Increased wear of the RF input adapter.
Method of correction: Replace the RF input adapter by a good one.
Possible reason: Incorrect channel plan setting, which makes the IT-14 to tune to an offset video carrier
point.
26
Page 27

27
Method of correction: Adjust the channel plan (Section 4.4.2.1).
Possible reason: Incorrect selection of the channel template.
Method of correction: Check the parameters of the channel template (Section 4.9.6).
Defect detection: When measuring DVB-T channel parameters «Demodulator error» message
appears on the screen.
Possible reason: Demodulator malfunction.
Method of correction: Please contact the service center.
7 STORAGE
Store your IT-14 under the following conditions: environment temperature from -20 to +40 °С, relative
humidity up to 90 % (at 30 °С).
8 TRANSPORTATION
The IT-14 must be shipped in any closed vehicle at temperature from -20 to +40 °С, relative humidity
90% (at 30 °С) and atmospheric pressure of 84 to 106.7 kPa (630 to 800 mm Hg).
Cargo holds, railway cars, containers, and truck beds, utilized for shipment of the IT-14 should be free
from any traces of cement, coal, chemicals, etc. When shipped by air the products should be kept in aircraft
sealed compartments.
 Loading...