

Page 1

IT-100
MULTISYSTEM TV ANALYZER
OPERATING MANUAL
Page 2

Revision 1.5 of 24.08.2018
2
Page 3

CONTENS
1. GENERAL INFORMATION................................................................................................5
1.1. Introduction ................................................................................................................5
1.2. Safety Precautions..................................................................................................... 6
2. GENERAL DESCRIPTION AND PRINCIPLE OF OPERATION........................................6
2.1. Function .....................................................................................................................6
2.2. Environment Conditionals ..........................................................................................7
2.3. Package Contents .....................................................................................................7
2.4. Specifications.............................................................................................................8
2.4.1. Spectrum Analyzer..........................................................................................8
2.4.2. Analog TV signal parameters measurement ...................................................8
2.4.3. Digital CATV signal parameters measurement ...............................................8
2.4.4. DVB-T signal parameters measurement .........................................................9
2.4.5. DVB-T2 signal parameters measurement .......................................................9
2.4.6. DVB-S/S2 signal parameters measurement....................................................9
2.4.7. IPTV signal parameters measurement............................................................9
2.4.8. Optical input parameters .................................................................................9
2.4.9. TV video and sound analysis parameters .......................................................9
2.4.10. Transport stream analysis parameters..........................................................10
2.4.11. Transport stream recording parameters........................................................10
2.4.12. Inputs and interfaces.....................................................................................10
2.4.13. General specifications ...................................................................................10
2.5. IT-100 Range of Application ......................................................................................10
2.6. Design and Operation Overview ................................................................................ 11
2.6.1. Principle of Operation...................................................................................... 11
2.6.2. Component Arrangement ................................................................................11
3. PREPARATION FOR OPERATION...................................................................................14
4. OPERATION PROCEDURE..............................................................................................14
4.1. Operation starting ......................................................................................................14
4.2. Controls and Indicators..............................................................................................15
4.3. Terrestrial TV Channels Measurement Procedure..................................................... 16
4.3.1. General Data...................................................................................................16
4.3.2. Operating Modes Settings...............................................................................19
4.3.3. TV Channel Parameters Measurement in Channel Mode...............................19
4.3.4. Signal Spectrum Measurement in Spectrum Mode ......................................... 22
4.3.5. TV Channel Parameters Measurement in Full Scan Mode ............................. 23
4.3.6. TV channels parameters measurement in Echo Diagram mode .....................26
4.3.7. Equalizer parameters measurement of DVB-C and J.38-B/C channels ..........27
4.3.8. Measurement of analog channel undesirable modulation (HUM)....................28
4.3.9. Measurement of Second-order and Triple-beat intermodulation (CSO/CTB) ..29
4.3.10. Channel reception quality monitoring ............................................................29
4.3.11. Data Logger Function....................................................................................32
4.3.12. Channel Plans...............................................................................................32
4.3.13. Limit plans ..................................................................................................... 35
4.3.14. Channel Data Logger ....................................................................................37
4.4. Satellite TV Channels Measurement Procedure ........................................................ 42
4.4.1. General Information ........................................................................................42
4.4.2. Operating Modes Setting.................................................................................43
4.4.3. Satellite Transponder Parameters Measurement in the Channel Mode..........44
4.4.4. Satellite Transponder Parameters Measurement in the MER/BER Mode .......46
4.4.5. Signal Spectrum Measurement in the Spectrum Mode ...................................47
4.4.6. DiSEqC control mode......................................................................................49
4.4.7. DiSEqC positioner operating ...........................................................................50
3
Page 4

4.4.8. Transponder reception quality monitoring .......................................................50
4.4.9. Data Logger Handling ..................................................................................... 51
4.4.10. LNB Configuration Setting Mode...................................................................51
4.4.11. Satellite Parameter Tables Handling.............................................................54
4.5. IPTV Measurements Procedure.................................................................................58
4.5.1. General Information ........................................................................................58
4.5.2. IPTV Stream Reception Quality Parameters Measurement ............................59
4.5.3. IPTV stream reception quality monitoring........................................................60
4.5.4. TCP/IP network connection quality testing (TCP/IP ping) ............................... 62
4.6. Transport Stream Analysis Procedure .......................................................................63
4.6.1. General information......................................................................................... 63
4.6.2. Transport stream general information window ................................................64
4.6.3. Transport stream analysis profile settings .......................................................65
4.6.4. Transport stream analysis recommendations..................................................70
4.6.5. Transport stream analysis events logger.........................................................71
4.6.6. ETSI TR 101 290 errors information window...................................................73
4.6.7. Transport stream programs list .......................................................................74
4.6.8. PCR time domain monitoring ..........................................................................77
4.6.9. Transport stream PIDs list...............................................................................78
4.6.10. Transport stream service information tables tree ..........................................80
4.7. TV Video and Sound Analysis Procedure ..................................................................81
4.7.1. General Information ........................................................................................81
4.7.2. TV Picture and Sound Analysis for Digital Channels....................................... 82
4.7.3. TV Video and Sound Analysis for Analog Channels .......................................82
4.8. MPEG Transport Stream Recording Procedure........................................................83
4.9. File Manager..............................................................................................................84
4.9.1. General information......................................................................................... 84
4.9.2. Operating File Manager...................................................................................84
4.10. Setup and Test Modes.............................................................................................86
4.10.1. Self-Test Mode..............................................................................................86
4.10.2. Regional Parameters Setting ........................................................................87
4.10.3. Analyzer Operation Parameters Setting........................................................87
4.10.4. Identification Data Readout ...........................................................................88
4.10.5. Network Parameters Setting .........................................................................89
4.11. Taking screenshot ...................................................................................................90
4.12. Analyzer Firmware Updating....................................................................................90
4.12.1. Regular Firmware Updating Procedure........................................................90
4.12.2. Emergency Firmware Updating Procedure ...................................................91
4.13. Analyzer Remote Control.........................................................................................92
4.13.1. Remote Desktop ...........................................................................................92
4.13.2. Operating Internal Drive ................................................................................93
4.14. Measurement results output via USB interface........................................................94
4.14.1. General information....................................................................................... 94
4.14.2. Message format ............................................................................................94
4.14.3. Messages of channel measurement results ..................................................94
4.15. Battery Operation..................................................................................................... 96
5. MAINTENANCE................................................................................................................. 97
6. TROUBLESHOOTING.......................................................................................................97
7. STORAGE .........................................................................................................................98
8. TRANSPORTATION..........................................................................................................98
9. LABELING .........................................................................................................................98
10. WARRANTY INFORMATION ..........................................................................................98
4
Page 5

1. GENERAL INFORMATION
1.1. Introduction
This Operating Manual is intended for introducing the design, functions, and basic
instructions related to operation, servicing and transportation of the IT-100 Multisystem TV
Analyzer (Analyzer).
The IT-100 Multisystem TV Analyzer is designed for measuring parameters of digital
and analog TV signals and for controlling TV picture and audio channel.
The Analyzer can be used both in laboratory, powered by an external power source,
and in field, powered by batteries.
The reliability of the IT-100 is ensured by fulfillment of regular maintenance
procedures. These procedures and their intervals are described in section
5.
In this manual the following abbreviations are used:
− 8PSK – 8-ary Phase Shift Keying;
− 16APSK – 16-ary Amplitude and Phase Shift Keying;
− 32APSK – 32-ary Amplitude and Phase Shift Keying;
− ADC – Analog To Digital Converter;
− BER – Bit Error Ratio;
− CATV – Cable Television;
− CDL – Channel Data Logger;
− C/N – Carrier-to-noise ratio;
− CP – Channel Plan;
− CSO/CTB – Composite Second Order and Composite Triple Beat;
− DF – Delay Factor;
− DiSEqC – Digital Satellite Equipment Control;
− DL – Data Logger;
− DNS – Domain Name System;
− DVB-C – Digital Video Broadcasting – Cable;
− DVB-S/S2 – Digital Video Broadcasting – Satellite;
− DVB-T/T2 – Digital Video Broadcasting – Terrestrial;
− ES – Erroneous Second;
− IAT – Inter-Arrival Time;
− ICMP – Internet Control Message Protocol;
− IF – Intermediate Frequency;
− IP – Internet Protocol;
− IPTV – Internet Protocol Television;
− ISI – Input Stream Identifier;
− LCD – Liquid Crystal Display;
− LNB – Low Noise Block;
− LP – Limit Plan;
− MER - Modulation Error Ratio;
− MLT – Media Loss Total;
− MPEG – Moving Picture Expert Group;
− NTSC –
National Television System Committee (Color TV broadcasting standard);
− PAL – Phase Alternating Line (Color TV broadcasting standard);
− PC – Personal Computer;
− PCR – Program Clock Reference;
− PER – Packet Error Ratio;
− PLS – Physical Layer Scrambling;
− QAM – Quadrature Amplitude Modulation;
5
Page 6

− QPSK – Quadrature Phase Shift Keying;
− RF – Radio Frequency;
− RMS – Root Mean Square;
− RTP – Real-Time Transport Protocol;
− SECAM – Séquentiel couleur à mémoire (Color TV broadcasting standard);
− SES – Severely Errored Second;
− TF – Transponder frequency;
− TS – Transport stream;
− TV – Television;
− UDP – User Datagram Protocol;
− V/A – Video to Audio carriers ratio;
1.2. Safety Precautions
Thoroughly inspect the product and carefully read the related documentation to get
acquainted with all the safety markings and instructions before you start to operate the
Analyzer.
WARNING Only trained service personnel aware of the hazards involved should
perform repair on the Analyzer.
CAUTION Tuning the Analyzer and replacement of the components that influence
the accuracy of measurements without service personnel is strictly prohibited, since the
components used in the Analyzer are purpose-made and their replacement will result in
inaccurate operation of the Analyzer. To exclude the possibility of mechanical damage to
IT-100, the instructions regarding the storage and transportation (see sections 7 and 8) of
the Analyzer must be observed.
2. GENERAL DESCRIPTION AND PRINCIPLE OF OPERATION
2.1. Function
The IT-100 Multisystem TV Analyzer is designed for measuring parameters of digital
and analog TV signals and for controlling TV video and audio. The Analyzer enables
measurement of the following parameters for analog TV channels: channel level, Video to
Audio (V/A) ratio, Carrier to Noise (C/N) ratio. It allows measuring the following parameters
for digital TV channels: channel power and Carrier to Noise (C/N) ratio. For J.83 Annex
A/B/C (cable television), DVB-T/T2 signals (terrestrial television) and DVB-S/S2 signals
(satellite television), IT-100 offers measurement of reception quality parameters:
modulation error ratio MER, bit error ratio BER, constellation diagram, echo diagram and
impulse response. The Analyzer allows for ETSI TR 101290 real time analysis of transport
stream.
The Analyzer features operation in CATV networks distributing through coaxial or
fiber-optic cables, as well as in IPTV channels.
IT-100 offers automatic defining of the channel settings (channel frequency, TV
system, symbol rate, modulation, etc.).
The Analyzer can be connected to a personal computer to enable remote access to
its functions and updating its firmware. External memory devices can be connected to the
Analyzer via USB interface to enable data storage. IT-100 also features spectrum
measurement mode. It allows measuring direct and alternating current voltage of remote
networks powering and television and broadcasting reception distribution systems, as well
as supplying power to antenna amplifiers or LNBs. The Analyzer supports DiSEqC and
«Single Cable Routing» command system.
The appearance of the Analyzer is shown in figure 2.1.
6
Page 7

Figure 2.1
This Operating Manual is made in accordance with the IT-100 hardware version
02.100.1 and the 2.10.X.X/1.0.X.X firmware version.
2.2. Environment Conditionals
Normal operating conditions:
1) ambient temperature (23±5) ºС;
2) relative air humidity (55±25) %;
3) atmospheric pressure 84-106 kPa (630-795 mm Hg);
4) voltage transients correspond to CAT II measurement category.
Rated operating conditions:
1) ambient temperature from -10 to 50 ºС;
2) relative air humidity not greater than 90% at temperature 25 ºС;
3) atmospheric pressure 84-106 kPa (630-795 mm Hg).
2.3. Package Contents
The Analyzer package includes:
1) IT-100 Multisystem TV Analyzer ................................................1 pc;
2) Carrying Case ............................................................................1 pc;
3) Carrying Sling ............................................................................1 pc;
4) Crosshead Screwdriver..............................................................1 pc;
5) Li-Ion 7.4V 4000mAh Battery .....................................................1 pc;
6) Mains Charger ...........................................................................1 pc;
7) Mains Charger Cable .................................................................1 pc;
8) Car Lighter Adapter....................................................................1 pc;
9) “F”-”F” Adapter ...........................................................................1 pc;
10) “F”-”IEC” Adapter ......................................................................1 pc;
7
Page 8

11) FC optical adapter with a dust cap............................................1 pc;
12) SC optical adapter with a dust cap............................................1 pc;
13) USB port cable..........................................................................1 pc;
14) Calibration certificate.................................................................1 pc;
15) Quick start guide .......................................................................1 pc.
2.4. Specifications
2.4.1. Spectrum Analyzer
Operating frequency range:
- terrestrial broadcasting mode: ....................................................................5 to 1200 MHz;
- satellite broadcasting mode: ...................................................................950 to 2150 MHz;
Frequency resolution: ................................................................................................25 kHz;
Level measurement range:.......................................................................... 20 to 120 dBμV;
Level measurement accuracy: ..................................................................................±1.2 dB;
Level measurement accuracy at operating temperature:..........................................±1.5 dB;
Level measurement resolution:.................................................................................. 0.1 dB;
Frequency
indication: ........................................................................................ 7 characters;
Channel number indication: .............................................................................. 3 characters;
Signal level indication: ...................................................................................... 4 characters;
Frequency sweep range: .......................................... 10,20,50,100,200,400,800,1200 MHz;
Measurement detector:.......................................................Quasi-peak, Root-mean-square;
Reference level:....................................................................... 50 to 120 dBμV, 10 dB step;
Resolution bandwidths:.................................................................... 50, 120, 250, 1000 kHz;
Number of markers: ............................................................................................................ 2;
“Quick” frequency sweep time in frequency ranges, less than:
- 1200 MHz: .............................................................................................................. 250 ms;
- 800 MHz: ................................................................................................................ 170 ms;
- 10,20,50,100,200 MHz: ........................................................................................... 70 ms.
2.4.2. Analog TV signal parameters measurement
Operating frequency range: .........................................................................42 to 1002 MHz;
TV broadcasting standards: ........................................................................ B/G, I, D/K, M/N;
Color TV broadcasting standards: .......................................................PAL, SECAM, NTSC;
measurement range:........................................................................... 30 to 120 dBμV;
Level
Level measurement accuracy (C/N>20 dB): .............................................................±1.2 dB;
Level measurement resolution:.................................................................................. 0.1 dB;
Upper C/N measurement range value (channel level > 65 dBμV): ............................. 50 dB;
HUM measurement range:.................................................................................. 0.6 to 20%;
Lower CSO/CTB measurement range value (channel level > 65 dBμV): ................ -62 dBc;
2.4.3. Digital CATV signal parameters measurement
Operating frequency range: .........................................................................42 to 1002 MHz;
Power
measurement range: ........................................................................ 35 to 115 dBμV;
Power measurement accuracy (C/N>20 dB): ...........................................................±1.2 dB;
Digital CATV standards:............................................................... ITU-T J.83 ANNEX A/B/C;
Modulation type: .......................................................................QAM64, QAM128, QAM256;
Symbol rate:.................................................................................................5.0 to 7.2 MSps;
MER measurement range:................................................................................. 29 to 42 dB;
MER measurement accuracy:...................................................................................±2.0 dB;
MER measurement resolution: .................................................................................. 0.1 dB;
BER measurement resolution: ............................................................. 1.0x10⁻³ to 1.0x10
-12
;
8
Page 9

Minimal channel power for quasi-error-free decoding:............................................ 50 dBμV.
2.4.4. DVB-T signal parameters measurement
Operating frequency range: .........................................................................42 to 1002 MHz;
Power
measurement range: ......................................................................... 35 to 115 dBμV;
Power measurement accuracy (C/N>20 dB): ...........................................................±1.2 dB;
Modulation type: .............................................................................QPSK, QAM16, QAM64;
MER measurement range:................................................................................. 14 to 35 dB;
MER measurement accuracy:...................................................................................±2.0 dB;
MER measurement resolution: .................................................................................. 0.1 dB;
BER measurement resolution: .............................................................. 1.0x10⁻² to 1.0x10
-10
Minimal channel power for quasi-error-free decoding:............................................ 45 dBμV.
2.4.5. DVB-T2 signal parameters measurement
Operating frequency range: .........................................................................42 to 1002 MHz;
Power measurement range: ......................................................................... 35 to 115 dBμV;
Power measurement accuracy (C/N>20 dB): ...........................................................±1.2 dB;
DVB-T2 standard: ......................................................................................................... 1.3.1;
Modulation type: .............................................................QPSK, QAM16, QAM64, QAM256;
MER measurement range:..................................................................................22 to 35 dB;
MER measurement accuracy:...................................................................................±2.0 dB;
MER measurement resolution: .................................................................................. 0.1 dB;
BER measurement resolution: .............................................................. 1.0x10⁻² to 1.0x10
-10
Minimal channel power for quasi-error-free decoding:............................................ 45 dBμV.
;
;
2.4.6. DVB-S/S2 signal parameters measurement
Operating frequency range: .......................................................................950 to 2150 MHz;
Power measurement range: ......................................................................... 45 to 115 dBμV;
Power measurement accuracy (C/N>20 dB): ...........................................................±1.2 dB;
Modulation type: ...............................................................QPSK, 8PSK, 16APSK, 32APSK;
Symbol rate:..................................................................................................... 1 to 45 Msps;
DiSEqC standards: ....................................................................... 1.0, 1.1, 1.2, 2.0, 2.1, 2.2;
«Single Cable Routing» standard: ........................................................................ EN 50494;
MER measurement range:..................................................................................14 to 25 dB;
MER measurement accuracy:...................................................................................±2.0 dB;
MER measurement resolution: .................................................................................. 0.1 dB;
BER measurement resolution: ............................................................... 1.0x10⁻² to 1.0x10⁻⁹;
Minimal channel power for quasi-error-free decoding:............................................ 45 dBμV.
2.4.7. IPTV signal parameters measurement
Transport protocol:............................................................................................... UDP, RTP;
IP routing type:......................................................................... unicast, multicast (IGMP v2);
TS bitrate: ............................................................................................................... 70 Mbps.
2.4.8. Optical input parameters
Operating wavelength range:.....................................................................1100 to 1650 nm;
Power measurement range: ........................................................................... -20 to +8 dBm;
Operating power level range of optical receiver:.............................................. -9 to +2 dBm;
0 dBm optical power measurement accuracy: ......................................................... ±0.5 dB;
Optical power measurement resolution:.................................................................... 0.1 dB;
Calibration wavelengths of power meter:...................................................... 1310, 1550 nm.
2.4.9. TV video and sound analysis parameters
Video codecs: ................H.264/AVC L4.1 HP, MPEG-2 MP@HL, VC-1 AP L3, AVS PL 6.0;
9
Page 10

Video resolution: .............................................................. 1080i60, 1080p30, 720p60, 576p;
Video aspects ratio: ................................................................................................ 16:9, 4:3;
Audio codecs: ................................................................................... MPEG1 L1/2, HE-AAC.
2.4.10. Transport stream analysis parameters
TS analysis: ........................in accordance with TR101290 standard (except 3.3, 3.9, 3.10);
TS bitrate: ............................................................................................................... 80 Mbps.
2.4.11. Transport stream recording parameters
File format:....................................................................................................................... TS;
Target drive:..............................................................................................internal drive only;
TS bitrate: ............................................................................................................... 60 Mbps;
Recording time:.......................................................................................................... 10 min;
2.4.12. Inputs and interfaces
RF Input connector: ........................................................................................... 75Ω F-male;
Maximum RF signal power: ................................................................................... +20 dBm;
Maximum input voltage (DC to 100Hz): ................................................................90 V peak;
RF input return loss, not less than: ............................................................................. 14 dB;
Optical connector type: ...................................... replaceable, FC or SC, single mode 9/125;
Maximum input power:........................................................................................... +10 dBm;
USB interface:................................................................... USB2.0 host and USB2.0 device;
LAN interface: ................................................................................. Ethernet RJ45 10/100M;
CAM module connector: .........................................................................................PCMCIA;
Powering connector: ............................................................................... DJK-02B (5.5x2.5).
2.4.13. General specifications
Display: ..............................................................................................4.3” TFT, 480x272 pix;
Remote powering supply voltage:................................................................5,12,13,18,24 V;
Output remote powering: .............................................................................................. 5 W;
Analyzer can be powered by:
- AC circuit with 100 to 242 V via 12V/3.3A charger;
- external 12±0.6 V DC source;
- internal Li-Ion 7.4V 4000mAh battery.
Battery life time: .............................................................................................................. 4 h;
Warm-up time: ............................................................................................................. 2 min;
Dimensions:
- analyzer: .................................................................................................. 245x150x65 mm;
- package: ................................................................................................ 425х325х135 mm;
Weight:
- analyzer: ................................................................................................................... 1.5 kg;
- in package: ............................................................................................................... 3.4 kg.
2.5. IT-100 Range of Application
The IT-100 Analyzer is designed to ensure high-performance control and adjustment
of television and broadcasting distribution networks, as well as of separate components of
such networks, or other electronic devices. The Analyzer allows for measurement of TV
10
Page 11

signal level, DVB-C/T/T2/S/S2 and ITU-T J.83 annex A,B,C digital and analog signal
parameters. It also enables measurements of optical signal power and fiber-optic cable
network parameters.
The Analyzer can be used both in laboratory, powered by an external power source,
and in field, powered by batteries.
2.6. Design and Operation Overview
2.6.1. Principle of Operation
The IT-100 Multisystem TV Analyzer is basically a TV signal receiver demodulating
signal to MPEG transport stream. If the transport stream is encrypted, it is restored by a
CAM-module and decoded into TV picture and sound. The input tuner is a doubleconversion superheterodyne receiver with manual and automatic frequency adjustment.
Modulation error ratio MER and constellation diagram are measured during demodulation
of quadrature signal based on vector analysis. Bit error ratio BER in digital transport
stream is measured by means of analysis of operation of noise immune convolutional
codecs. Radio signal measurement is performed by means of conversion of analog RF
signal into digital sequence using ADC and its further processing using signal processor
based on discrete Fourier transformation. The principle of operation of spectrum analyzer
is based on serial or parallel method of analysis with spectrum indication on display.
The resulting image is displayed on LCD in the measurement mode of digital and
analog TV signals reception quality parameters and is basically numerical values and
graphical representation of measured digital parameters (modulation error ratio and bit
error ratio). The constellation diagram mode features vector structure of quadrature
components of demodulated signal with digital modulation in the phase plane. The
spectrum analyzer mode displays the tested signal amplitude to frequency dependence
chart. The TV channel radio signal level measurement mode displays numeric value of
signal level, video carrier to audio carrier level ratio and carrier to noise ratio in the
distribution channel for analog channels or signal power in the channel band for digital
modulation signals.
2.6.2. Component Arrangement
The IT-100 Analyzer is implemented in plastic shockproof sectional housing with
rubber-coated protective elements and includes printed and three-dimensional wiring.
The front panel of the Analyzer consists of a keypad, a graphical display and battery
charge and external power source status indicators (figure
2.2). A loudspeaker (1) and a
fold-out support (2) are located on the rear panel (figure 2.3) of the Analyzer.
11
Page 12

Figure 2.2 Figure 2.3
1) functional keys enable the commands shown on the screen of the Analyzer.
2) alphanumeric keys.
3) the Shift key enables selection of an alternative set of functional keys and
additional functions of alphanumeric keys indicated by yellow icons.
4) remote feeding power source status indicator.
Indicator External power source status
(No light)
(Green light)
Power source is off.
Power source is on. The input connector voltage is normal.
Power source failure. The input connector voltage is outside
(Red light)
the predefined limits.
5) battery charge indicator.
Indicator Battery charge status
(No light)
(Yellow light)
(Green light)
(Red light)
No power from the charger.
The battery is charging.
The battery is charged.
Battery failure.
6) navigation keys.
− « », « », «◄» and «►» keys are used to move the cursor on the LCD
screen;
− «ENTER» is used to confirm the current command entry;
− «EXIT» is used to cancel the current command or return to a previous menu
level.
7) the « » key switches the Analyzer on/off.
12
Page 13

The lower panel (figure 2.4) has a cover under which the communication ports for
connecting the Analyzer with the external devices and the external power source
connector are located. Below are air gates.
Do not close the air gates during the Analyzer operation. This may cause the
Analyzer overheating!
The upper panel (figure
2.5) includes the input RF connector and optical connector.
Figure 2.4
Figure 2.5
The right panel (figure 2.6) has the CAM module compartment cover fixed by two
captive screws.
Figure 2.6
The CAM module port and eject button are inside the compartment (figure
2.7). In
order to install or remove the CAM module, unscrew the captive screws using the
screwdriver included in the package. The right screw should be unscrewed completely to
allow the compartment cover rotate freely on the left screw, which should be unscrewed by
half the first. The CAM module should be installed face (surface A) down to the
bottom of the Analyzer.
To remove the module, press the eject button.
13
Page 14

Figure 2.7
3. PREPARATION FOR OPERATION
Perform external examination to make sure your IT-100 is free from any visible
mechanical damage.
Upon receipt of the package, check the availability of the items contained in it against
the list provided (see section 2.3).
If your IT-100 has been kept in the environment other than the rated operating
conditions, leave the Analyzer in facilities with normal operating conditions at least for 2
hours prior to operation.
4. OPERATION PROCEDURE
4.1. Operation starting
Before you start to operate your IT-100 make sure to carefully read this Operating
Manual as well as to inspect the location of the controls and indicators of the Analyzer
(section 2.6.2).
To prepare your Analyzer for operation from an external power source, connect the
Charger to the connector located on the bottom of the Analyzer and then to the power
source. Push and hold the «
» key until the LCD backlight turns on.
To prepare your IT-100 for operation in stand-alone mode, powered by batteries,
push and hold the «
» key until the LCD backlight turns on.
The following message (figure 4.1) will appear on the screen, when firmware is
started up.
14
Page 15

Figure 4.1
The screen displays name and type of the Analyzer. In approximately one second,
the Analyzer will open the main mode selection menu – Main Menu (figure 4.2) or the last
previously operated mode before the power was switched off (section 4.10.3).
4.2. Controls and Indicators
The location of controls, indicators and connectors is described in section 2.6.2.
To select an alternative function of a key, press the «Shift» key once. An alternative
function for switching between the measurements modes will appear in the field of
functional keys. The Analyzer will return to the basic functional keys layout after you press
any key.
To select a “hot key”, press the «Shift» key and one of the alphanumeric keys with
additional functions simultaneously:
Key Icon Function
7
8
.space
0
Battery service mode (section 4.13)
Screenshot saving to file (section
4.11)
Remote feeding power supply control (section 4.3.1.5)
Volume adjustment (sections 4.7.2, 4.7.3)
The Analyzer features interactive operating mode selection menu, which is basically
a set of graphical pictures (icons) on the LCD screen, each of which corresponds to a
certain mode. The selection menu is shown in figure
4.2.
15
Page 16

Figure 4.2
The menu introduces four tabs (pages) of icons: the page of terrestrial TV
measurement icons , the page of satellite TV measurement icons , the page of
IPTV measurement icons and the page of setting icons which are switched
using the «◄» and «►» keys. To select a mode, set its icon in the bottom screen line. The
mode names will appear on functional keys. Use the corresponding functional key to select
the mode. Press «EXIT» to go back to the selection menu.
4.3. Terrestrial TV Channels Measurement Procedure
4.3.1. General Data
4.3.1.1. Measurement modes and switches among them
The Analyzer features three basic and several additional measurement modes:
1) Channel parameters measurement in the Channel mode.
Additional modes for analog channels:
− video and sound control (Video);
− second-order and third-order distortion measurement in the cable network
(CSO/CTB);
− measurement of unwanted modulation (HUM);
− reception quality parameters monitoring (Statistics).
Additional modes for digital channels:
− video and sound control (Video);
− transport stream analysis (MPEG Analyzer);
− transport stream recording (MPEG Recorder);
− reception quality parameters monitoring (Statistics);
− DVB-T/T2 echo diagram (Echo Diagram);
− DVB-C and J.83-B/C demodulator equalizer parameters measuring
(Equalizer).
2) All channels level measurement in the Full Scan mode.
Additional modes:
− channel flatness measurement in absolute and relative terms;
− channel tilt measurement in absolute and relative terms.
3) Signal spectrum measurement in the Spectrum mode.
In the Main Menu (figure 4.2), use the « » and « » buttons to set the desired
measurement mode icon in the bottom line of the screen. The following icons correspond
to measurement modes:
16
Page 17

Channel Scan Spectrum
Click on one of the functional keys with the desired icon to select the measurement
mode. Press «EXIT» to return to the selection menu.
On the functional keys panel, «F1» is used to open the setting menu, and «F2» to
«F6» are used to set up the current mode. Press the «Shift» key to display the functional
keys which enable quick switching between measurement modes.
4.3.1.2. Screen view in measurement modes
The screen view in all measurement modes has common elements and settings, as
shown in figure 4.3.
Figure 4.3
The spaces are aimed to display the following information:
1) Current mode name;
2) Modes and settings icons;
3) RF input or output voltage value;
4) Optical power value in case optical input is selected;
5) Battery charge status and remaining time;
6) Current mode parameters and measuring channel parameters;
7) Automatic limit plan test results;
8) Selected channel name;
9) Selected channel number.
Modes and settings icons are the following:
LNB power 22 kHz modulation mode
Conditional access module (CAM) found
Device connected to PC via USB port
Selected channel synchronization indicator
Selected input indicator: RF (radio frequency) or OP (optical).
4.3.1.3. Navigation
Channel or frequency navigation (depending on the Setting parameter value and the
selected mode) is carried out by the «◄» and «►» keys or alphanumeric keys. To select a
special channel, start its entry with the «.space» key. Press «ENTER» after you complete
17
Page 18

the number entry. If the channel number entered is incorrect, the previous channel number
will be displayed.
If you use the «◄» and «►» keys in the selected channel plan operating mode
(section
4.3.12.1), tuning will be performed by channels from the plan. Direct entry of the
channel number allows tuning to any channel. If such channel is not listed in the channel
plan, only its number will be displayed on the screen. Channel tuning and numbering is
carried out in accordance with the selected channel allocation standard (channel template)
(section 4.10.2).
4.3.1.4. Checking According to Limit Plan
In the Channel measurement mode the measured parameters are checked for
compliance with the selected limit plan. The green indicator is displayed on the
screen if the parameter values are within the set limits. Otherwise the red indicator is
displayed. Values of measured parameters which are outside the set limits are highlighted
in red. The measured channels outside the channel plan are not checked.
Note. The «Default» limit plan is used by default.
4.3.1.5. Remote feeding power supply
To power external devices, such as, for example, antenna amplifiers, the IT-100
analyzer is equipped with a controlled remote power source. Power from the source feeds
the RF input connector. To set the voltage value, as well as to turn the source on or off, it
is necessary to call the source control mode. To call the mode, press the «Shift» button
and then, without releasing it, press the « / .space» button. The control mode window
will appear on the screen as shown in figure 4.4:
Figure 4.4
The source control mode is only called from one of the measurement modes. To set
the voltage value from the 5V, 12V or 24V series, use the «◄» , «►» or «F3 / ◄» , «F4 /
►» buttons. Voltage change is only possible when the source is turned off. To turn the
source on/off, press the «F1 / Enable/Disable» button. If the source is switched on, the
current power and current values are displayed in the mode window. If the values are
within acceptable limits, then the background color is green. The green color of the LED on
the front panel of the analyzer duplicates the indication of the power supply to the input
connector. In case of a source failure error detection (there is power on the input of the
analyzer, the power is out of tolerance or the current exceeds the allowable value), the
panel color of the power or current value becomes red, which is also duplicated by the red
light of the LED.
18
Page 19

If the source is switched off, the value of the voltage that is fed to the input of the
device is displayed in the window. The nature of the voltage is also displayed. The direct
voltage is accompanied by the abbreviation VDC, alternating voltage by the abbreviation
VAC.
To exit the mode, press the «F6 / Close» or «EXIT» button.
4.3.2. Operating Modes Settings
Parameters setting program is intended for setting the device operation parameters
in the terrestrial TV broadcasting mode. The
icon in the terrestrial TV folder
corresponds to this mode. The parameters setting screen view is shown in figure 4.5:
Figure 4.5
The table includes the following editable parameters:
1) Input signal source. Selection of radio frequency (RF) or optical
input (OP).
2) Test point compensation. Enabling signal level correction during
measurement at test point.
3) Test point attenuation. Test point signal attenuation value.
4) Optical signal wavelength. Selection of optical signal wavelength.
5) Channel template. Selection of TV system.
6) Level units. Selection of signal level measurement units.
7) HUM power grid. Setting the power grid frequency value for HUM
modulation measurement.
8) Output measurement results via USB. Enabling measurement results output
via USB interface (section 4.14).
4.3.3. TV Channel Parameters Measurement in Channel Mode
The Channel mode allows displaying level and other reception quality parameters of
TV channel. View of the mode and functionality set depends on the measured channel
type (analog or digital).
4.3.3.1. Analog channel measurement
The screen view and information displayed for analog channel parameters
measurement option are shown in figure 4.6.
19
Page 20

Figure 4.6
The following parameters are displayed on the screen: video carrier frequency and
frequency offset (CR), measured level (VID), as well as reception quality parameters, such
as video to audio ratio (V/A1, V/A2), audio carrier frequency offset, carrier to noise ratio
(C/N) and carrier to noise margin (MARGIN). UPTIME parameter shows elapsed time
since TV channel was locked. In case a parameter value is outside the limits of selected
limit plan (section 4.3.13), it is indicated with red background.
Level and carrier to noise ratio values are indicated in graphical form in left part of the
screen. The bar height indicate current parameter value, and markers indicate minimal and
maximal parameter value achieved.
Channel selecting is performed with the «◄» and «►» key pressing. When pressed
with «Shift» holding, channel is changed with bigger step. Channel can also be selected
by typing its number with alphanumeric keyboard.
When a channel is selected, the Meter will automatically detect the standard and
modulation parameters. It is recommended to use channel plan (section 4.3.12) in order to
make synchronization faster.
To set up the mode, press «F1 / Settings». The following parameters are available
for editing in the dropdown menu:
1) Ref. level. Selection of reference level value. Possible values are 50 to 120 dBuV
and Auto. The setting resolution is 10 dB. The parameter sets up the maximum
possible measured signal level;
2) Level scale. Setting level histogram division value: 2, 5, 10 or 20 dB;
3) Averaging. Selection of measured parameters averaging factor: Off, Low,
Medium, High;
4) Sound indication. Selecting the parameter value sound indication type: off –
switched off, Tone – sound frequency is proportional to parameter value, Pulse –
pulse repetition rate is proportional to parameter value;
5) Indicate parameter. Selecting the parameter to indicate its value with sound:
level – channel power, MER or C/N – MER or C/N value.
Press «F3 / Mode» to get access to additional measurement modes. The following
modes are available in the dropdown menu:
1) HUM. Undesirable modulation measurement mode (section 4.3.8);
2) CSO&CTB. Composite Second Order and Composite Triple Beat measurement in
cable network (section 4.3.9);
3) Statistics. Channel reception quality monitoring (section 4.3.10).
Press F4 / Video to enter TV Video and Sound analysis operating mode. Press F5 /
Info to see channel modulation parameters. Press F6 / Reset to clear all the measurement
results and restart measuring.
20
Page 21

4.3.3.2. Digital channel measurement
Digital modulation channels feature measurements of actual channel power level in
the channel allocation bandwidth and TV channel reception quality parameters in numeric
form and in the form of vertical bars (figure 4.7).
Figure 4.7
The following data is displayed on the screen: tuning frequency and frequency offset
(CR), actual channel power level in the channel allocation bandwidth (P) and measured
reception quality parameters, such as modulation error ratio (MER), MER margin to quasi
error-free reception threshold (MARGIN), uncorrected MPEG packets rate and quantity on
demodulator output (PER/CNT). The following parameters of decoders are measured for
different standards:
1) DVB-C and J.83-B/C. Bit error rate before Reed Solomon decoder (CBER);
2) DVB-T. Bit error rate before Viterbi decoder (CBER) and after Viterbi decoder
(VBER);
3) DVB-T2. Bit error rate before LDPC decoder (CBER) and after LDPC decoder
(LBER).
UPTIME parameter shows elapsed time since TV channel was locked. In case a
parameter value is outside the limits of selected limit plan (section 4.3.13), it is indicated
with red background.
Level value and MER values are indicated in graphical form in left part of the screen.
The bar height indicate current parameter value, and markers indicate minimal and
maximal parameter value achieved.
Channel selecting is performed with the «◄» and «►» key pressing. When pressed
with «Shift» holding, channel is changed with bigger step. Channel can also be selected
by typing its number with alphanumeric keyboard.
When a channel is selected, the Meter will automatically detect the standard and
modulation parameters. It is recommended to use channel plan (section
4.3.12) in order to
make synchronization faster.
To set up the mode, press «F1 / Settings». The following parameters are available
for editing in the dropdown menu:
1) Ref. level. Selection of reference level value. Possible values are 50 to 120 dBuV
and Auto. The setting resolution is 10 dB. The parameter sets up the maximum
possible measured signal level;
2) Level scale. Setting level histogram division value: 2, 5, 10 or 20 dB;
3) Averaging. Selection of measured parameters averaging factor: Off, Low,
Medium, High;
4) Sound indication. Selecting the parameter value sound indication type: off –
switched off, Tone – sound frequency is proportional to parameter value, Pulse –
pulse repetition rate is proportional to parameter value;
21
Page 22

5) Indicate parameter. Selecting the parameter to indicate its value with sound:
level – channel power, MER or C/N – MER or C/N value;
6) View. Graphical data representation type: Histogram – Level and MER values in
form of a graph, Constellation – constellation diagram;
7) Zoom. Constellation diagram zoom mode: x1 or x4;
8) PLP. Selecting PLP stream for DVB-T2 channel;
9) Profile. Selecting stream for DVB-T channel: HP – high priority stream, LP – low
priority stream.
To get access to additional measurement modes, press the «F3 / Mode» key. The
following functions are available in the dropdown menu:
1) MPEG Analyzer. MPEG transport stream analyzing (section
4.6);
2) MPEG Recorder. MPEG transport stream recording to file (section 4.8);
3) Statistics. Channel reception quality monitoring (section 4.3.10);
4) Echo Diagram. DVB-T/T2 channels echo diagram measurement (section
4.3.6);
5) Equalizer. Equalizer parameters measuring for DVB-C and J.83-B/C channel
(section
4.3.7).
Press F4 / Video to enter TV Video and Sound analysis operating mode. Press F5 /
Info to see channel modulation parameters. Press F6 / Reset to clear all the measurement
results and restart measuring.
4.3.4. Signal Spectrum Measurement in Spectrum Mode
The radio signal spectrum is displayed on the screen in this mode. The screen view
and the information displayed are shown in figure 4.8:
Figure 4.8
The following is displayed on the screen: two markers, frequency shift between
markers dF and difference in measured levels dL. The markers position on the screen is
set up by the «◄» and «►» keys if the «F3» key represents the Marker. The marker color
available for position setting is shown on the «F2» key, by pressing which a different
marker can be chosen. If the «F3» key represents Center, then the screen view can be
moved by the «◄» and «►» keys to the respective side.
To set up the spectrum analyzer modes, press «F1 / Settings». The following
parameters are available for editing in the dropdown menu.
1) Ref.level. Selection of reference level value. Possible values are 50
to 120dBuV and Auto. The setting resolution is 10 dB.
The parameter sets up the maximum possible measured
signal level.
22
Page 23

2) Level offset. Possible values are Manual and Auto. In the Auto mode
the amplitude scale position is set automatically. In
Manual mode the scale position can be set manually by
pressing the «
» and « » keys.
3) Scale. Setting amplitude scale range values: 5dB or 10dB.
4) Averaging. Selecting averaging degree for measured values. Possible
values: Off, Low, Medium, High.
5) Detector. Selecting measuring detector type: Peak or RMS. Peak
(Peak) detector is used to measure level of TV signals
with analog modulation. Root-mean-square (RMS)
detector is used to measure broadband signals or to
search noise.
6) Hold. Enabling additional signal level trace. Possible values: Off,
Min, Max. When the additional trace is enabled, the
Analyzer screen displays the second signal line showing
minimum and maximum values obtained during scanning.
To reset the trace, press the «F6 / Reset» key.
7) Scan mode. Scanning mode. Possible values: Single, Quick, Precise.
In the Single sweep mode a single scanning is carried out
by pressing the «ENTER» key. The Quick continuous
scanning mode enables the quickest scanning by
decreasing the level measurement accuracy. The Precise
scanning mode allows for maximum accuracy of signal
level measurements.
8) Span. Frequency scanning span. Possible span values and
corresponding measuring filter bandwidth values are given
in the table below.
Span, MHz 10 20 50 100 200 400 800
Full,
1200
Filter bandwidth, kHz 50 250 250 1000 1000 1000 1000 1000
9) Tuning. Central frequency position setup mode. The Freq.
value selects the central frequency position tuning by
frequency. Position tuning by frequency is carried out by
entering the numeric value from the keypad. The Chann.
value selects the position tuning by channel number.
Alphanumeric keys are used enter channel number or frequency directly. Enter the
frequency value in MHz or the channel number and press «ENTER». After you press
«ENTER» the selected channel or frequency value are set in the center of the screen.
The set mode parameters are indicated on the upper panel of the display screen.
4.3.5. TV Channel Parameters Measurement in Full Scan Mode
The Full Scan mode is used for measurements of channel levels in full frequency
span. There are five screen views in this mode:
1) Full Scan. Full Scan Channel level measurement.
2) Limit. Measurement of channel level flatness.
3) Limit rel. Measurement of channel flatness in relative terms.
4) Tilt. Tilt measurement at channel level tuning.
5) Tilt rel. Tilt measurement at channel level tuning in relative terms.
23
Page 24

The screen view can be selected by pressing «F2 / View».
In the Full Scan mode TV radio signal levels are displayed in the form of vertical
bars. The screen view is shown in figure
4.9:
Figure 4.9
Analog channels are indicated by the yellow color, and digital – by blue. The tuning
frequency and channel level values, which are marked by the marker, are displayed under
the channel level chart. The marker position can be changed by the «◄» and «►» keys.
To designate the marker position directly type in the channel number using the
alphanumeric keys and press «ENTER».
To set up the spectrum analyzer mode, press the «F1 / Settings» key. The following
parameters will be available for editing in the dropdown menu.
1) Ref.level. Selection of reference level value. Possible values are 50
to 120dBuV and Auto. The setting resolution is 10 dB.
The parameter sets up the maximum possible measured
signal level.
2) Level offset. Possible values: Possible values are Manual and Auto. In
the Auto mode the amplitude scale position is set
automatically. In Manual mode the scale position can be
set manually by pressing the «
» and « » keys.
3) Scale. Setting amplitude scale range values: 2dB, 5dB or 10dB.
4) Averaging. Selecting averaging degree for measured values. Possible
values: Off, Medium, High.
The screen view in the Limit mode is shown in figure 4.10.
Figure 4.10
24
Page 25

In the Limit mode the scope of permissible values of channel level is displayed
additionally. The reference level and flatness are set up in the dropdown menu which is
activated by the «F3 / Limits» key. The deviation from the reference level is indicated on
the screen along with the channel level at which the marker is set up. The difference
between analog and digital channels indicated in the corresponding limit plan is displayed
as A-D.
The screen view in the Limit rel. mode is shown in figure
4.11.
Figure 4.11
The level difference between measured and reference level is indicated on the
screen. The digital channel levels are additionally compensated using the A-D value.
The screen view in the Tilt mode is shown in figure 4.12.
Figure 4.12
In the Tilt mode the tilt line between two selected reference channels is indicated on
the screen. The reference channels location is set up in the dropdown menu, which is
activated by pressing the «F3 / Marker» key. If a channel marked by the cursor is located
between the markers, then the difference between the marked channel level and the tilt
line will be indicated. The positive value means that the channel level is higher than the tilt
line, and the negative value means that the channel level is lower than the tilt line. General
tilt value between reference channels is indicated as TILT.
The screen view in the Tilt rel. mode is shown in figure 4.13.
25
Page 26

Figure 4.13
The difference levels between the measured values and the tilt line are displayed on
the screen. The digital channel levels are additionally compensated using the A-D value.
4.3.6. TV channels parameters measurement in Echo Diagram mode
The echo diagram deal with displaying DVB-T or DVB-T2 channel impulse response
diagram, as well as basic reception quality parameters. The screen view and the data
displayed are presented in Fig. 4.14:
Figure 4.14
Echo diagram features the bar graph of signal amplitudes which arrive with delay
after the main signal (of peak amplitude). Signal amplitude is measured in reference to the
main signal amplitude in dB, while the main signal amplitude is assumed to be equal to 0
dB. The delay value can then be negative, i.e. the echo signal arrives to the signal
reception point before the main signal. This is true if there reflected signal amplitude is
higher than that of the main signal (for example, when the signal arrives from the
transmission antenna and retransmitter).
The echo diagram is intended for high precision positioning of the reception antenna.
The main quality criteria for the selection of signal arrival direction is minimum echo signal
level, especially outside the guard interval limits. The positioning procedure requires
controlling basic reception quality parameters, such as level, MER and BER.
To change the cursor position, use the ◄ and ► keys. Press one of these keys along
with the Shift key to move the cursor by several positions. By pressing the F3 / ◄Max and
F4 / Max► key, the cursor will shift through echo signals with maximum amplitude values.
The echo signal delay and amplitude in the marker position are indicated under the
diagram.
The echo diagram updating is indicated by the • marker in the upper right corner of
the diagram. To make the echo signal analysis easier, the table of maximum amplitude
26
Page 27

signals (up to 8 signals) is shown on the screen. The echo signals are arranged in the
descending order of amplitude.
To change the measurement parameters, press the F1 / Settings key. The following
settings will be listed in the dropdown menu:
1) Zone. Selecting the echo signal delay range indicated on the diagram: Full-echo
– the full delay range supported by the Analyzer, Pre-echo – the negative delay
range, Post-echo – the positive delay range, Near-echo – the range close to the
main signal;
2) Resolution. The delay resolution of echo diagram measurement: Normal – fast
echo diagram measurement with rough delay estimation, High – slow echo
diagram measurement with precise delay estimation;
3) Units. The delay measurement unit: Distance – additional distance traveled by
echo signal in reference to main signal in km or miles (depending on regional
settings), Delay – echo signal arrival time in reference to main signal.
4.3.7. Equalizer parameters measurement of DVB-C and J.38-B/C channels
This mode allows displaying the parameters of signal demodulator equalizer, as well
as the common quality parameters of DVB-C and J.83-B/C channels reception. The
screen view and the data displayed are presented in Fig.
4.15:
Figure 4.15
The equalizer is intended for correcting the amplitude and phase response of the
received signal, thus enabling higher quality of reception in presence of distortion. That is
why the equalizer parameters analysis allows estimating the signal correction level in
terms of quality and quantity, and thus determining its distortion.
The equalizer parameters are presented graphically. The following display modes are
available for selection from the drop down menu by pressing the F2 / View key:
1) Equalizer taps. This mode allows viewing the gain values diagram for each of the
equalizer taps. The values are shown in dB in reference to the central tap having
the gain value of 0 dB. Each equalizer tap enables the signal delay equal to time,
which is a multiple of symbol duration. When receiving the ideal signal, all of the
equalizer taps energy is concentrated in three to five taps to the left and to the
right of the central tap. In case of distortion, the energy is distributed to the larger
number of taps. A peak value at one or several taps is the evidence of the
reflected signal arrival. Gain value and tap signal delay in the cursor position are
indicated in the bottom part of the screen. If you select the Distance
measurement unit from the F1 / Settings dropdown menu, the screen view will
display the distance
1
from the signal source to obstacle at the boundary of which
the signal was reflected instead of delay. Each of the tap bars has a marker of
1
For distance calculation, relative signal propagation rate in cable is assumed to be equal to 0.87
27
Page 28

maximum permissible tap gain value according to ETSI TR 101290. The ECHO
MARGIN column displays the worst-case difference between the permissible
value and the value measured at all taps, i.e. this value indicates the noise margin
of reflected signals level;
2) Freq. Response. This mode displays the amplitude to frequency response of the
channel calculated from the equalizer impulse response characteristic. Frequency
offset in reference to the channel center and the response level in dB in the cursor
position are indicated in the bottom of the screen. Response flatness in dB is
indicated in the FLATNESS column;
3) Group delay. This mode allows viewing channel group delay, calculated from the
equalizer impulse response. Frequency offset in reference to the channel center
and delay value in ns in the cursor position are indicated in the bottom of the
screen. Response flatness in ns is indicated in the FLATNESS column.
4.3.8. Measurement of analog channel undesirable modulation (HUM)
This mode allows viewing relative level bar graph of harmonic component of analog
channels undesirable modulation, as well as total relative level of undesirable modulation
in the channel frequency band. The screen view and the data displayed are presented in
Fig.
4.16.
Figure 4.16
The relative level value of undesirable modulation is measured using the following
formula:
HUM[%] = ( Lmax – Lmin ) * 100 / Lch, where
Lmax – maximum level of parasitic component in the measurement interval,
Lmin – minimum level of parasitic component in the measurement interval,
Lch – average carrier level value in the measurement interval.
Measurement results analysis of undesirable modulation level of separate harmonic
component enables qualitative evaluation of the nature of distribution network problem.
High value of fundamental harmonic (50 or 60 Hz) usually indicates the problem with
power sources of signal generation and distribution equipment. High value of second
harmonic (100 or 120 Hz) indicates the problem with the equipment grounding circuit,
which is the reason of parasitic signal rectification.
Total relative level of undesirable modulation in the channel frequency band enables
numerical determination of the video and sound quality. It is indicated in the HUM
parameter line to the right from the bar graph.
The power grid frequency is selected in the terrestrial TV channels setting mode
(section
4.3.2).
28
Page 29

4.3.9. Measurement of Second-order and Triple-beat intermodulation (CSO/CTB)
This mode enables graphical and textual presentation of measurement results of
second and third order distortion for analog TV channel. The screen view and the data
displayed are presented in fig. 4.17.
Figure 4.17
Relative levels of second-order distortion (CSO) and third-order distortion (CTB) are
indicated on the left-side bar graph. The measurement is carried out in reference to the
channel carrier level. The table to the right from the bar graph indicates the following data:
1) VID. Level and frequency of channel carrier;
2) CSO. Relative level of second-order distortion and the frequency at which
distortion was measured. The Analyzer automatically calculates frequencies of
second-order harmonic components occupying the channel and indicates the
measurement results for the highest level harmonic component. Frequency of
harmonic components occupying the channel is calculated using the cross
products of channel frequencies from channel plan or TV system, if channel plan
is not used;
3) CTB. Relative level of third-order distortion and frequency at which distortion was
measured. The measurement is carried out at the channel carrier frequency.
The dropdown menu of the F1 / Settings key enables selection of the following
measurement modes:
1) In-Service. The measurement is carried out during channel broadcasting. In this
mode the Analyzer synchronizes with the analog channel and measures CSO
harmonic components in the course of “black” lines, i.e. the measurement can be
carried out only in case of synchronization with the channel. CTB cannot be
measured in this mode, because this measurement is carried out at the channel
carrier frequency;
2) Out-Service. The measurement is carried out when the channel is switched off
(carrier must not be available). This mode enables CSO and CTB measurement in
the disabled channel frequency band. As the channel is not available, the
measurement in carried out in reference to the nearest analog channel. If the
channel plan is not used, the Analyzer determines channel type according to the
selected TV system.
4.3.10. Channel reception quality monitoring
This mode allows displaying timing diagram of analog or digital channel reception
quality parameters in the given time interval. The screen view and the data displayed are
presented in fig. 4.18.
29
Page 30

Figure 4.18
Depending on the type of the measured channel, the Analyzer enables monitoring of
the following quality parameters:
Channel type
Level C/N MER BER
Measured parameter
Analog + +
Digital (DVB or J.83-B/C) + + +
Digital (unknown modulation) + +
FM-radio +
Pilot signal + +
Each parameter diagram includes 300 time intervals. Depending on the user-defined
measurement duration, each time interval equals to:
Measurement
duration
Time interval,
sec
5 min 10 min 30 min 1 h 2 h 6 h 12 h 24 h 48 h 72 h
1 2 6 12 24 72 144 288 576 864
Each time interval accumulates minimum and maximum values of quality parameter,
as well as errored seconds count:
1) ES. Indicates the number of seconds during which errors were detected:
− DVB or J.83-B/C Channel. At least one errored MPEG packet or
synchronization loss is detected during the second;
− Analog Channel. Minimum signal-to-noise ratio below 43 dB or
synchronization loss is detected during the second;
2) SES. Indicates the number of seconds during which severe errors were detected:
− DVB or J.83-B/C Channel. Over 5% of errored MPEG packets or
synchronization loss is detected during the second;
− Analog Channel. Synchronization loss is detected during the second;
3) UAT. Indicates the number of seconds during which channel synchronization was
lost.
The measurement mode can be set up in the dropdown menu accessed by pressing
the F1 / Settings key:
1) Duration. Signal measurement duration: 5 min, 10 min, 30 min, 1 h, 2 h, 6 h, 12
h, 24 h, 48 h, 72 h;
2) Beeping on SES. Switching sound indication of severe error (SES) detection: Off,
On;
3) Autosave. Switching automatic measurement results saving to a file upon
measurement completion: Off, On.
30
Page 31

Measurement can be started by pressing the F6 / Start key. In case the Autosave
function is on, it is necessary to specify the page name for further automatic saving to a
file.
In order to stop the measurement, press the F6 / Stop key during measurement. A
beep will sound when the measurement is stopped.
The following data is indicated on the screen during measurement (section
4.47):
1) Instantaneous measurement results of level, MER or C/N and BER measured
within seconds;
2) Total measurement results. Include all time intervals passed from the beginning of
measurement, minimum and maximum parameter values for the whole
measurement time, total ES and SES number during the whole measurement
time;
3) Timing diagram of the selected parameter. For level, C/N and MER parameters,
the diagram consists of vertical lines, the lowest point of which corresponds to
minimum parameter value in the time interval, and the upper point – to maximum.
For BER the diagram consists of bars, the height of which corresponds to the
number of corrected (green) and uncorrected (red) bits in the respective time
interval;
4) Measurement results at the marker position. Include absolute time of time interval
beginning at the market position, parameter values and the number of ES, SES
and UAT errored seconds in the time interval at the marker position;
5) ES/SES grid. Features the grid with vertical marks matched with the time diagram.
In case at least one severe error (SES) is detected in the time interval, a red mark
is indicated, and if an ES error is detected, a green mark is indicated. This grid
allows determining whether errors were detected during measurement, and how
they are grouped in time. The indicator of the time passed is shown under the grid
in the form of a line.
The parameter to be viewed on the diagram can be selected using the dropdown
menu of F2 / View. To move the cursor, use the ◄ and ► keys. By pressing these keys
along with the Shift key, the cursor can be moved with a larger pitch.
To view the detailed measurement results obtained during all measurement time,
press the F4 / Total key. The table includes the following information:
1) Bits total. Total number of bits received before the first decoder;
2) Bits corrected. Total number of bits corrected by decoders;
3) Bits uncorrected. Total number of uncorrected bits at the output of the last
decoder;
4) ES total. Total number of errored seconds;
5) SES/UAT total. Total number of severely errored seconds, as well as the number
of seconds during which synchronization loss was detected;
6) MER min/max. Minimum and maximum MER values obtained during all
measurement time;
7) MER avr. Average MER value obtained during all measurement time;
8) SNR min/max. Minimum and maximum C/N value obtained during all
measurement time;
9) SNR avr. Average C/N value obtained during all measurement time;
10) LEV/POW min/max. Minimum and maximum channel level value obtained during
all measurement time;
11) LEV/POW avr. Average channel level value obtained during all measurement
time.
Measurement results can be saved to a file upon completion or forced stop of
measurement using the F5 / Save key. You need to specify the page name in the popup
field and press ENTER. In case a USB flash drive is connected to the Analyzer, the page
will be saved to it, otherwise the page will be saved to the internal drive. You can view the
31
Page 32

measurement results saved to a file in the file manager (section 4.9), by selecting the RF
Statistics file type.
4.3.11. Data Logger Function
Data Logger (DL) is intended for automation of the procedure of recording the
measurement results. There are three data logger directories: Channel Plan List, Limit
Plan List, Channel Data Logger. The DL memory is common for all directories and is
allocated dynamically. The memory capacity allows saving up to 99 channel plans, 99 limit
plans, 999 channel data logger pages each containing maximum channel quantity. The DL
memory can be controlled in the Memory Manager (section
4.9), which allows operating
with files in internal memory or external USB flash drive.
The data logger directories can be scrolled through by arrows and functional keys. In
the main selection mode select the desired page of icons using the «◄» and «►» keys,
set the desired mode icon in the bottom screen line using the « » and « » keys and then
select the desired mode using functional keys. The following icons correspond to the Data
Logger directories:
Channel Plans Limit Plans Channel DL
4.3.12. Channel Plans
4.3.12.1. Channel Plans List
This mode allows performing all the operations with channel plans: viewing, editing,
deleting, and creation of new plans. The screen view of the mode is shown in figure 4.19.
The table on the screen displays the channel plan name and the date of creating or
editing. The channel plan set up in the Analyzer is marked in the table by the
symbol.
Channel plans in the table are arranged by names. The channel plan «All channels» is
always located in the upper line of the table and corresponds to channel template. If this
plan is selected, the Analyzer operates without a channel plan.
Figure 4.19
Use the functional keys to perform the following operations with channel plans:
− «F1 / Edit». Reading and editing the channel plan in cursor position.
32
Page 33

− «F2 / New». Creating a new channel plan: empty or automatically
detecting.
− «F3 / Delete». Deleting the channel plan in cursor position.
− «F4 / Rename». Renaming the channel plan in cursor position.
− «F5 / Drive». Channel plans source drive selecting: internal drive or
USB flash drive.
− «F6 / Select». Selecting the channel plan in cursor position.
4.3.12.2. Channel Plan Editing
The screen view of the channel plan table is shown in figure 4.20:
Figure 4.20
The table indicates channel number, channel name, its frequency and signal type.
Functional keys enable the following operations:
− «F1 / Edit». Editing the channel in cursor position.
− «F2 / New». Adding a new channel.
− «F3 / Delete». Deleting the channel in cursor position.
− «F4 / Info». Viewing information about channel plan name and
channels quantity.
− «F6 / Save». Save changes and quit.
Channel selecting is performed with «
» and « » keys or entering channel number
with alphanumeric keyboard. To edit selected channel press «F1 / Edit» or «ENTER» key.
The screen view in the channel parameters editing mode is shown in figure 4.21.
Figure 4.21
Possible signal types and their parameters are as follows:
1) Common parameters:
33
Page 34

− Number. Channel number in accordance with selected TV
system
− Frequency. Channel frequency.
− Name. Channel name.
2) Analog. TV signal with analog modulation.
− Standard. Broadcast television standard: B, G, H, D, K, I, M, N.
− System. Color television standard: Auto, PAL, SECAM,
NTSC. When Auto selected, the Analyzer detects
color standard automatically. However it can be detected wrong in case of
receiving signal with particular impairments.
− Audio. Audio standard: Mono, NICAM, Dual. Dual is
correspond to stereo broadcasting standards similar to A2.
− Audio-2 frequency offset. Audio second subcarrier frequency offset
relative to channel frequency.
− SNR method. C/N measurement method: off, inband, outband.
When inband selected, noise level is measured inside the channel
bandwidth during black lines transmitting. When outband selected, noise
level is measured outside the channel bandwidth at the frequency with
minimal signal level.
3) Pilot signal. Unmodulated carrier.
− SNR method. C/N measurement method: off, outband. When
outband selected, noise level is measured at frequency specified with
«Noise frequency offset» parameter.
− Noise bandwidth. Signal bandwidth for which noise level is calculating.
− Noise frequency offset. Frequency offset relative to channel frequency
at which noise level is measured.
4) FM. FM radio.
5) Digital. Channel with digital modulation which is not supported by the
Analyzer.
− Bandwidth. Channel bandwidth.
− SNR method. C/N ratio measurement method: off, outband.
When outband is selected, noise level measurement is performed outside
the channel bandwidth at frequency with minimal signal level.
6) DVB-C. J.83 Annex A (DVB-C) cable TV channel.
7) J.83-B. J.83 Annex B cable TV channel.
8) J.83-C. J.83 Annex C cable TV channel.
− Modulation. Modulation type: QAM64, QAM128, QAM256.
− Symbol rate. Symbol rate.
9) DVB-T. DVB-T channel.
10) DVB-T2. DVB-T2 channel.
− Bandwidth. Channel bandwidth: 6, 7, 8 MHz.
The initial parameter values are set during automatic channel plan definition and can
be corrected. To adjust the parameter value, select the desired parameter using the « »
and « » keys. The parameter is adjusted using the «◄», «►» keys or typed in directly
using the alphanumeric keys. You can scroll through the channels using the «F3» and
«F4» keys without returning back to the channel plan table.
4.3.12.3. New Channel Plan Creation
To create a new channel plan in the automatic mode, send a signal to the Analyzer
input press the «F3 / New» key and select «Scan» option. Enter the channel name in the
popup window and press «ENTER». After that the Analyzer will scan all TV channels and
enter the channel plan editing mode. Adjust the channel parameters and open the channel
34
Page 35

plans table saving the new channel plan in the DL memory. You can change the channel
plan name if necessary.
4.3.13. Limit plans
4.3.13.1. Limit Plans List
Limit plans contain channel parameters check criteria and are used for
measurements in the channel data logger mode.
This mode allows performing all operations with the limit plan (LP): reading, editing,
deleting, creating a new LP, selecting an LP for checking in the measurement modes. The
screen view of the limit plan list is shown in figure
4.22.
The table indicates the limit plan name, the current limit plan, date of creating or
editing. Limit plans in the table are arranged by their names. The «Switched off» limit plan
is always located in the upper line of the table and cannot be edited.
The functional keys enable the following operations with limit plans:
− «F1 / Edit». Reading and editing the limit plan in cursor position.
− «F2 / New». Creating a new limit plan.
− «F3 / Delete». Deleting the limit plan in cursor position.
− «F4 / Rename». Renaming the limit plan in cursor position.
− «F5 / Drive». Limit plans source drive selecting: internal drive or USB
flash drive.
− «F6 / Select». Selecting the limit plan in cursor position.
4.3.13.2. Limit Plan Editing
The screen view is shown in figure 4.23:
Figure 4.22
35
Page 36

Figure 4.23
The table indicates the TV channel parameter names and their minimum and
maximum limit values against which the measured parameters are checked in the
terrestrial TV channels measurement modes. A separate parameters setting page is
provided for each channel type, which can be opened by pressing the «F1 / Type» key. To
save the changes press "F6 / Save".
The following channel types and their parameter sets are available.
1) General. General limit plan settings2.
− Level delta: Maximal available channels level difference. Performed
separately for analog channels and digital channels.
− Analog/Digital Delta: Minimal and maximal available level difference
between analog and digital channels.
− Adj. Channels Delta: maximal available level difference between adjacent
channels. Analog and digital channels are never supposed to be adjacent.
2) Analog channels. Channel with analog modulation.
− Video Level: Minimal and maximal available channel level.
− Video/Audio-1: Minimal and maximal available values of video-to-
audio ratio for first audio subcarrier.
− Video/Audio-2 (Dual): Minimal and maximal available values of video-
to-audio ratio for second audio subcarrier (for channels with A2 stereo
broadcasting).
− Video/Audio-2 (NICAM): Minimal and maximal available values of video-
to-audio ratio for second audio subcarrier (for channels with NICAM stereo
broadcasting).
− C/N: Minimal available C/N ratio value.
3) Pilot signal. Unmodulated carrier.
− Level: Minimal and maximal available level.
− C/N: Minimal available C/N ratio value.
4) FM radio. FM radio.
− Level: Minimal and maximal available channel level.
5) Digital channels. Channel with digital modulation of unknown type.
− Power: Minimal and maximal available channel power.
− C/N: Minimal available C/N ratio value.
6) DVB-C/J.83 channels. Digital cable TV channels.
− Power: Minimal and maximal available channel power.
− MER/QAM64: Minimal available MER value for channels with
QAM64 modulation.
− MER/QAM128: Minimal available MER value for channels with
QAM128 modulation.
2
Pilot signals and FM radio are not checked against general parameters
36
Page 37

− MER/QAM256: Minimal available MER value for channels with
QAM256 modulation.
− preBER: Maximal available value of BER before Reed-
Solomon decoder.
7) DVB-T channels. DVB-T digital on-air broadcasting standard channels.
− Power: Minimal and maximal available channel power.
− MER/QPSK: Minimal available MER value for channels with
QPSK modulation.
− MER/QAM16: Minimal available MER value for channels with
QAM16 modulation.
− MER/QAM64: Minimal available MER value for channels with
QAM64 modulation.
− CBER: Maximal available value of BER before Viterbi
decoder.
− VBER: Maximal available value of BER after Viterbi decoder.
8) DVB-T2 channels. DVB-T2 digital on-air broadcasting standard channels.
− Power: Minimal and maximal available channel power.
− MER/QPSK: Minimal available MER value for channels with
QPSK modulation.
− MER/QAM16: Minimal available MER value for channels with
QAM16 modulation.
− MER/QAM64: Minimal available MER value for channels with
QAM64 modulation.
− MER/QAM256: Minimal available MER value for channels with
QAM256 modulation.
− CBER: Maximal available value of BER before LDPC
decoder.
− LBER: Maximal available value of BER after LDPC decoder.
To adjust the parameter value, select the desired parameter using the « » and « »
keys. The parameter is adjusted using the «◄» and «►» keys. Any limit plan parameter
can be disabled for checking in the channel data logger with pressing «F2/ Disable» key.
Press «F2 / Enable» again to enable checking.
4.3.14. Channel Data Logger
4.3.14.1. General Information
The Channel Data Logger (CDL) is used for measurement of TV channel and other
signal parameters using one of the channel plans and their checking against the selected
limit plan. The Analyzer allows saving the measurement and check results in the data
logger memory as well as measurement timestamp. The CDL allows viewing
measurement results, viewing different parameter errors, saving to CSV file for further
processing and presentation of test results.
4.3.14.2. List of Channel Data Logger Pages
This mode allows performing all possible operations with the CDL pages: reading,
deleting, creating a new page and measuring page. The screen view of this mode is
shown in figure 4.24:
37
Page 38

Figure 4.24
The screen shows the list of channel data logger pages. Each CDL page contains the
following data: status, page name, date and time of last measurement, name of related
channel plan and name of related limit plan.
Press the «►» key to view the related channel plan. Press «►» key again to view
related limit plan on the screen. Press «◄» key twice to return to view of last
measurement time and date.
To select one of the CDL pages viewing mode, open the popup menu by pressing
the «F1 / Page» key:
1) Open. Opening the selected CDL page.
2) Info. Viewing page parameters.
3) Graph. Viewing the selected CDL page in the Scan mode (in
development).
4) Delta. Reading the selected CDL page in the Scan mode, and
indicating the difference between the CDL page channel levels
and current channel levels (in development).
You can delete the unnecessary CDL page by pressing the «F3 / Delete» key. A new
CDL page can be created using the «F2 / New» key. The «F6 / Sort» key allows selecting
the method of pages sorting in the table (by the last measurement time and date, status,
page name, channel plan or limit plan name). To select the CDL files source drive, press
the «F5 / Drive» key. Page can be measured with pressing «F4 / Start» key.
The status indicator specifies the CDL page state:
Grey indicator Page created but not measured
Red indicator Page measured, errors found
Green indicator Page measured, errors not found
When you create a channel data logger page (by pressing the «F2 / New» key), page
setup window will be displayed on the screen as shown in figure
4.25.
38
Page 39

Figure 4.25
To set up the page, specify the following parameters:
1) Page name. Can be edited with pressing «F2 / Rename» key;
2) Channel plan. Channel plan with channels set for measurement. Can be selected
one of the channel plans of internal disk or external USB flash drive. Selected
channel plan data is copied to CDL page, so, editing or deleting selected channel
plan will not affect the page;
3) Limit plan. Limit plan with measurement results checking limits defined. Can be
selected one of the limit plans of internal disk or external USB flash drive.
Selected limit plan data is copied to CDL page, so, editing or deleting selected
limit plan will not affect the page;
4) AMP powering. Switching off/on supplying external devices via RF input (for
example antenna amplifier);
5) AMP voltage. External devices supplying voltage: 5, 12, 24 V;
6) Test point compensation. Turning off/on compensation of signal attenuation at
test point;
7) Test point attenuation. Test point attenuation value in dB: 0...40 dB;
8) Measure. Selecting parameters for measuring (affects measurement duration):
All parameters – measure all the parameters, Level only – measure only
channels level, Level + CN/MER – measure Level and channel C/N or MER;
9) Precision/Speed. Select the balance between measurement results precision
and measurement duration: Fast – fast measurement without averaging
– acceptable measurement duration with some averaging, Precise – high
measurement duration with strong averaging.
All the parameters except for Channel plan and Limit plan can be modified before
measurement.
3
, Normal
4.3.14.3. Channel Data Logger Reading and Measurement
When enters data logger page common page information view appears on the
screen (figure
4.26).
3
Analog channels C/N is always measured with outband method regardless of the channel plan configuration
39
Page 40

Figure 4.26
The following information on page measurement results is indicated on the screen:
1) Page name. Data logger page name;
2) Measured. Time and date of page measuring. In case the page is not measured,
this field is not shown;
3) State. The page state: Errors found – the page is measured, but the results do
not conform to the limit plan check criteria, No errors – the page is measured,
and the results conform to the limit plan check criteria, Not measured – the page
is not measured;
4) Analog channels with fault. The number of analog channels, measurement
results of which do not conform to the limit plan check criteria. Total number of
analog channels is also indicated;
5) Digital channels with fault. The number of digital channels, measurement
results of which do not conform to the limit plan check criteria. Total number of
digital channels is also indicated;
6) Other channels with fault. The number of other channels (pilot signals, FM
radio), measurement results of which do not conform to the limit plan check
criteria. Total number of channels of such type is also indicated;
7) Analog channel level delta, dB. The maximum level flatness value for analog
channels. In case this value exceeds the permissible value, it is highlighted in red;
8) Digital channel level delta, dB. The maximum level flatness value for digital
channels. In case this value exceeds the permissible value, it is highlighted in red;
9) Analog/Digital delta, dB. The value of maximum level difference between analog
and digital channels. In case this value is beyond the permissible limits, it is
highlighted in red.
To view the information on page settings, press the F2 / Info key. The page
parameters table will then appear on the screen (figure 4.25). To start the measurement,
press the F1 / Start key. To cancel the measurement, press the F1 / Cancel key. To save
the measurement results, use the F6 / Save key.
To view the channel measurement results in a form of a map, press the F3 / Map
key. In this mode the channel map is indicated on the screen (figure 4.27). Each cell of the
map corresponds to a channel of the page. The cell color indicates the channel status:
1) Green – the channel is measured, the measurement results conform to the limit
plan check criteria;
2) Red – the channel is measured, the measurement results do not conform to the
limit plan check criteria;
3) Grey – the channel is not measured.
40
Page 41
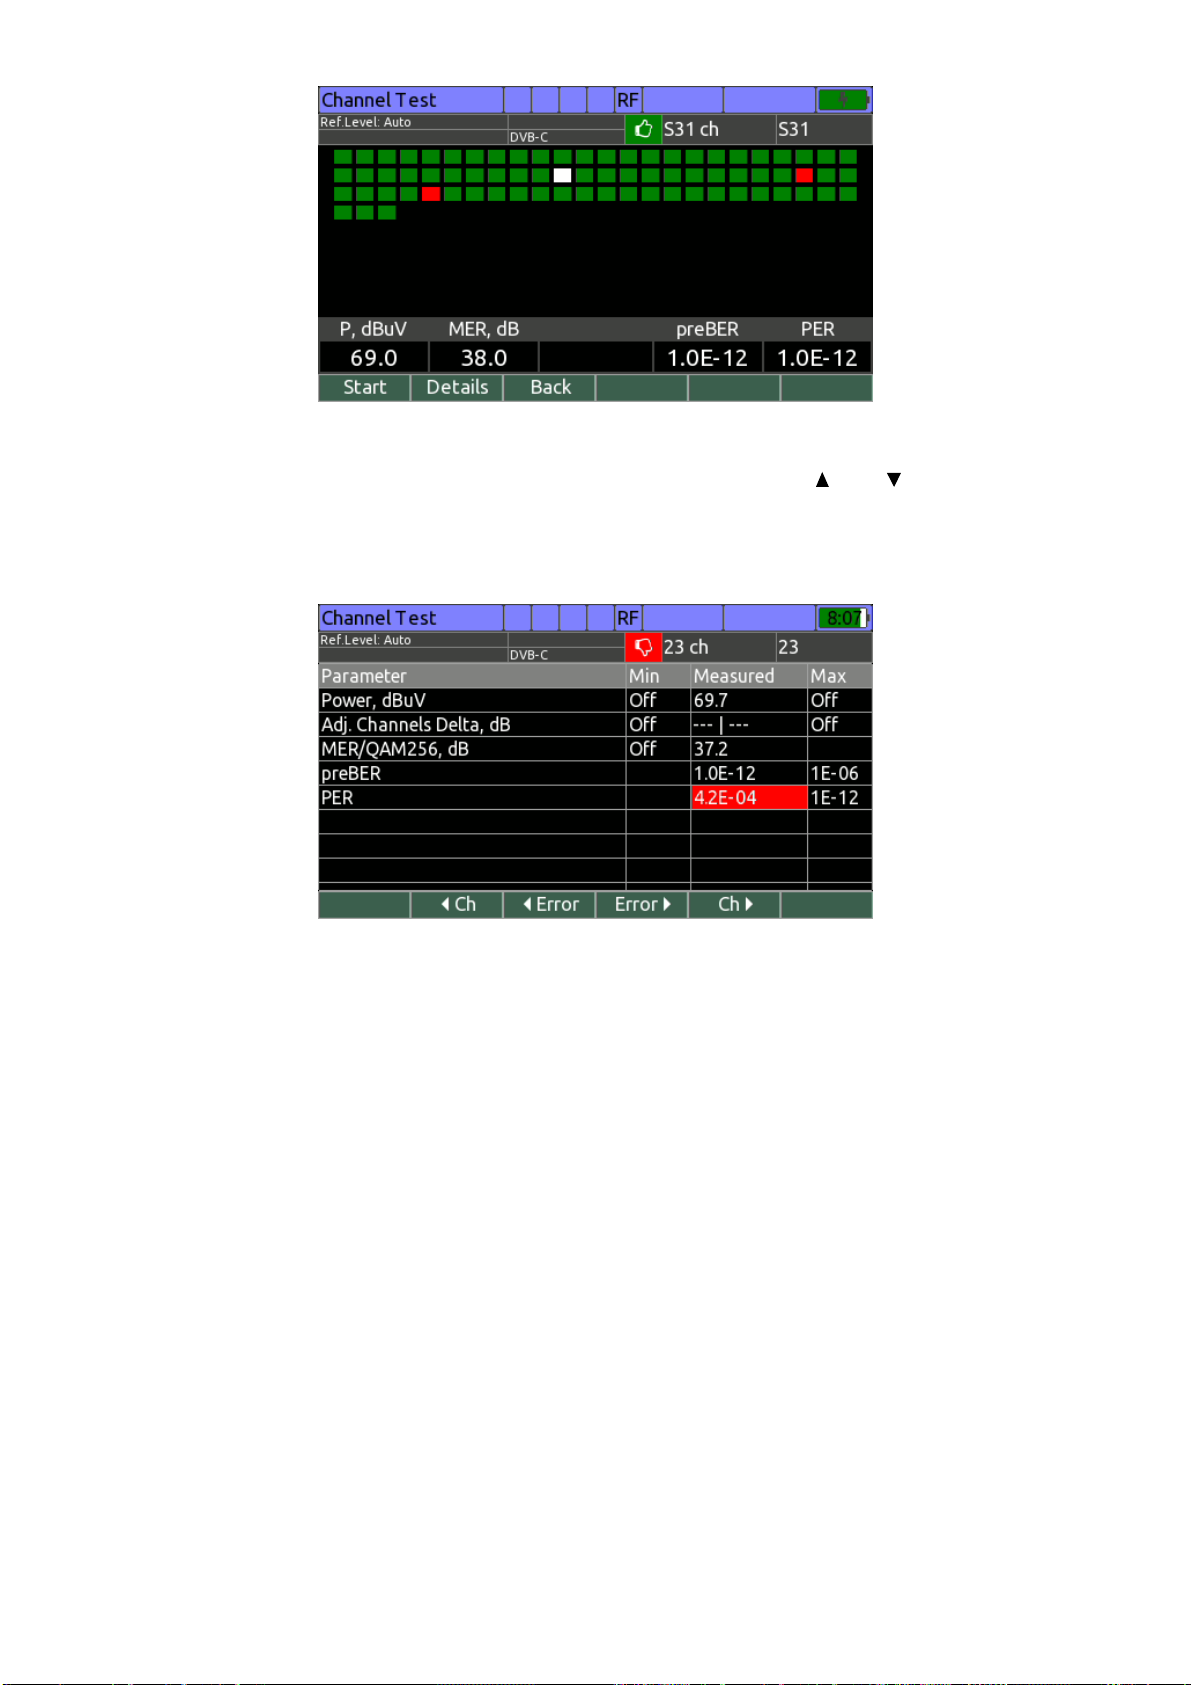
Figure 4.27
The channel can be selected on the map using the ►, ◄, and keys. The table
under the map indicates the channel measurement results in the cursor position. Press the
F2 / Details or ENTER key to view the detailed measurement results for the selected
channel as shown in fig.
4.28.
Figure 4.28
The table indicates the parameters of measurement results checking against the limit
plan, as well as measured parameters for current channel. The parameter value is
highlighted in red if it does not satisfy the test criterion. The parameter value is not
indicated if this parameter measurement is disabled in the channel plan or CDL page
parameters.
Use the «F2 / ◄Ch » and «F5 / Ch► » keys to scroll through the channels without
leaving to the common table. To scroll through the channels with errors use the «F3 /
◄Error » and «F4 / Error► » keys.
To return to the common page parameters view press «F3 / Back» or «EXIT» key.
4.3.14.4. Delta Mode
This mode presents data in the form of a bar graph as in the Graph mode, but the
length of a bar indicates the difference between the level value in CDL and currently
measured channel level value. The positive value indicates that the CDL level value is
higher than the measured level value, and vice versa. The measured level values are at
the same time checked against the limit plan. The channel plan and the limit plan are
obtained from the CDL. The sample view of the Delta mode is shown in figure
4.29.
41
Page 42

Figure 4.29
4.4. Satellite TV Channels Measurement Procedure
4.4.1. General Information
You need to specify the LNB configuration settings manually before you start
operating your Analyzer and in process of measurements. The LNB configuration setting
mode is used for this purpose (section 4.4.10). The icon in the main menu
corresponds to this mode. This mode enables the LNB configuration setting.
The Analyzer features three measurement modes:
1) Measurement of DVB-S/S2 signal parameters in the Channel mode (single
LNB dish alignment mode).
Additional measurement modes:
− video and sound control (Video);
− MPEG transport stream analysis (MPEG Analyzer);
− MPEG transport stream recording (MPEG Recording);
− Transponder reception quality monitoring (Statistic).
2) Measurement of reception quality parameters of DVB-S/S2 signal in the
MER/BER mode.
Additional measurement modes:
− video and sound control (Video);
− MPEG transport stream analysis (MPEG Analyzer);
− MPEG transport stream recording (MPEG Recording);
− Transponder reception quality monitoring (Statistic).
3) Signal spectrum measurement in the Spectrum mode.
Use the «
» and « » keys in the main menu (figure 4.2) to set the desired operating
mode icon in the bottom screen line. The following icons correspond to the measurement
modes:
Channel MER/BER Spectrum
To select the measurement mode press the corresponding key from the set of
functional keys with the respective icon. To return to the main menu, press the «EXIT»
key.
42
Page 43

The screen view includes common elements and settings in all measurement modes
as shown in figure
4.30.
Figure 4.30
The fields on the screen indicate the following information:
1) Current measurement mode name
2) Modes and settings icons (section 4.3.1.1)
3) Voltage value at the RF input (section 4.3.1.5)
4) Optical power value, in case optical input is selected
5) Battery charge status and remaining time
6) Current measurement mode parameters and channel parameters
7) Transponder parameters: frequency, polarization and symbol rate.
The «F1» key on the functional keys panel is used to open the settings menu. The
«F3» to «F6» keys enable the current mode setting. Press the «Shift» key to display the
functional keys for quick switching between the measurement modes.
The LNB settings menu («F2» key) contains a list of parameters which can be
selected using the « » and « » keys, and set up using the «◄» and «►» keys.
In case measuring is performed with LNB profile selected, the following list of LNB
parameters is available:
1) Satellite. The selected LNB satellite name. The information parameter cannot
be edited.
2) LNB. Selection of LNB: LNB1 to LNB4 . 2…4 converters (available if LNB
profile contains more than one converter). For the SCR converter the
parameter enables the slot selection.
3) LO. Selection of converter heterodyne: Low, High.
4) Polarization. Selection of LNB polarization: V – vertical, H – horizontal, L –
left-handed circular, R – right-handed circular.
In case operating is performed without LNB profile the following list of LNB
parameters is available:
1) Tone 22 kHz. Switching on/off 22 kHz tone;
2) Voltage. Target LNB voltage: 13, 18 V.
4.4.2. Operating Modes Setting
The parameters setting program is used for setting the device operation parameters
in the satellite TV broadcasting mode. The icon in the satellite TV folder corresponds
to this mode. The parameters setting screen view is shown in figure
4.31:
43
Page 44

Figure 4.31
The table contains the following editable parameters:
1) Input signal source. Selection of radio frequency or optical input.
2) Optical signal wavelength. Selection of optical signal wavelength.
3) Levels units. Selection of signal level measurement units.
Possible variants: dBuV, dBmV or dBm.
4) Output measurement results via USB. Enabling measurement results output
via USB interface (section 4.14).
4.4.3. Satellite Transponder Parameters Measurement in the Channel Mode
The screen view of the Channel mode and the information displayed are shown in
figure 4.32.
Figure 4.32
The following is displayed on the left of the screen:
1) P. Transponder power;
2) MAX. Maximal transponder power detected during all the measurement time;
3) LNB current. LNB supply current in mA;
The following is displayed on the right of the screen:
1) MER. MER value;
2) MAX. Maximal MER value detected during all the measurement time;
4) MARGIN. MER margin to quasi error-free reception threshold;
5) UPTIME. Transponder measurement duration;
6) CBER. BER before Viterbi decoder (for DVB-S), or before LDPC decoder (for
DVB-S2);
44
Page 45

In the central part of the screen you can see power and MER values in a form of a
histogram with markers of minimal and maximal values detected during all the
measurement time.
At the top you can see informational panel (figure
4.30) operating mode settings and
locked transponder parameters.
To set up transponders, use the ◄ and ► keys. When holding pressed Shift key
transponders will be scrolling with a higher pitch value. To enter transponder frequency or
symbol rate, use the alphanumeric keys. Confirm entering with one of the following keys:
1) F1 / IF. Intermediate frequency is specified. Current polarization will not changed;
2) F2 / TF, H/L. Satellite band frequency is specified and horizontal/left-handed
circular polarization selected;
3) F3 / TF, V/R. Satellite band frequency is specified and vertical/right-handed
circular polarization selected;
4) F4 / SR. Transponder symbol rate is specified;
5) ENTER. Satellite band or intermediate frequency is specified (detected
automatically). Current polarization will not changed.
To access the mode settings, press the F1 / Settings key. The following settings are
available:
1) Ref. level. Selecting reference level value. Available values 50 to 120
dBuV and Auto. The setting resolution 10 dB. The
parameter sets up the maximum possible measured signal
level.
2) Level scale. Histogram level scale value: 2, 5, 10 dB
3) Averaging. Selection of measured level averaging degree. Available
values: off, Low, Medium, High. When satellite dish
positioning is performed it is recommended to specify off value.
4) Sound indication. Selecting the parameter value sound indication type: off –
switched off, Tone – sound frequency is proportional to parameter value,
Pulse – pulse repetition rate is proportional to parameter value;
5) Indicate parameter. Selecting the parameter to indicate its value
with sound: level – transponder power, MER – MER value.
6) Motor control. Enabling or disabling DiSEqC positioner operating mode
(section
4.4.7);
7) ISI. Selecting DVB-S2 transponder logical stream;
8) PLS. Specifying DVB-S2 transponder descrambling key.
To enter additional transponder measurement modes, press the F3 / Mode key. The
following modes are available:
1) MPEG Analyzer: MPEG transport stream analysis (section 4.6).
2) MPEG Recorder: MPEG transport stream recording (section
4.8).
3) Statistics: Transponder reception quality monitoring (section
4.4.8).
To enter the TV video viewing mode, press the F4 / Video key. Press F5 / Info key to
see transponder modulation parameters.
To restart transponder measurement press the F6 / Reset key.
To switch the LNB power supply on and off, use the source control mode. To call the
mode, press the «Shift» key and then, without releasing it, press / .space key
(section 4.3.1.5).
LNB converter configuring is performed in the F2 / LNB popup menu (section
4.4.14.4.2).
To open the MER/BER, Spectrum or DiSEqC measurement modes, use the F3, F4
and F5 keys in the additional set of functions which is started by the Shift key.
45
Page 46

4.4.4. Satellite Transponder Parameters Measurement in the MER/BER Mode
In this mode the measured DVB-S/S2 signal quality parameters are displayed on the
screen in figure form and in the form of vertical bars. It also features a constellation
diagram measurement mode. The screen view of this mode is shown in figure 4.33
Figure 4.33
The following is displayed on the screen:
7) IF. Transponder tuning frequency (IF) and locked transponder frequency offset
relative to tuning frequency;
8) P. Transponder power;
9) MER. MER value;
10) MARGIN. MER margin to quasi error-free reception threshold;
11) UPTIME. Transponder measurement duration;
12) CBER. BER before Viterbi decoder (for DVB-S), or before LDPC decoder (for
DVB-S2);
13) VBER/LBER. BER after Viterbi decoder (for DVB-S), or after LDPC decoder (for
DVB-S2);
14) PER/CNT. Erroneous packets error rate and total erroneous packets number.
On the left of the screen MER and BER values are displayed in a form of a histogram
with markers of minimal and maximal values detected during all the measurement time.
At the top you can see informational panel (figure 4.30) operating mode settings and
locked transponder parameters.
To set up transponders, use the ◄ and ► keys. When holding pressed Shift key
transponders will be scrolling with a higher pitch value. To enter transponder frequency or
symbol rate, use the alphanumeric keys. Confirm entering with one of the following keys:
6) F1 / IF. Intermediate frequency is specified. Current polarization will not changed;
7) F2 / TF, H/L. Satellite band frequency is specified and horizontal/left-handed
circular polarization selected;
8) F3 / TF, V/R. Satellite band frequency is specified and vertical/right-handed
circular polarization selected;
9) F4 / SR. Transponder symbol rate is specified;
10) ENTER. Satellite band or intermediate frequency is specified (detected
automatically). Current polarization will not changed.
To access the mode settings, press the F1 / Settings key. The following settings are
available:
9) Ref. level. Selecting reference level value. Available values 50 to 120
dBuV and Auto. The setting resolution 10 dB. The
parameter sets up the maximum possible measured signal level.
46
Page 47

10) Averaging. Selection of measured level averaging degree. Available
values: off, Low, Medium, High. When satellite dish positioning is
performed it is recommended to specify off value.
11) View. Graphical representation type: Histogram – MER and BER values in
a form of a graph, Constellation – constellation diagram measuring.
12) Zoom: Constellation diagram zoom: x1 or x4;
13) Motor control. Enabling or disabling DiSEqC positioner operating mode (section
4.4.7);
14) ISI. Selecting DVB-S2 transponder logical stream;
15) PLS. Specifying DVB-S2 transponder descrambling key.
To enter additional transponder measurement modes, press the F3 / Mode key. The
following modes are available:
4) MPEG Analyzer: MPEG transport stream analysis (section 4.6).
5) MPEG Recorder: MPEG transport stream recording (section 4.8).
6) Statistics: Transponder reception quality monitoring (section
4.4.8).
To enter the TV video viewing mode, press the F4 / Video key. Press F5 / Info key to
see transponder modulation parameters.
To restart transponder measurement press the F6 / Reset key.
To switch the LNB power supply on and off, use the source control mode. To call the
mode, press the «Shift» key and then, without releasing it, press / .space key
(section 4.3.1.5).
LNB converter configuring is performed in the F2 / LNB popup menu (section
4.4.14.4.2).
To open the Channel, Spectrum or DiSEqC measurement modes, use the F3, F4
and F5 keys in the additional set of functions which is started by the Shift key.
4.4.5. Signal Spectrum Measurement in the Spectrum Mode
The signal spectrum is displayed on the screen in this mode. The screen view and
the information displayed are shown in figure
4.34:
Figure 4.34
Frequency navigation is performed as follows:
1) Navigation of transponders (F4 key is indicated as TP•). The transponder
selection is set up using the ◄ and ► keys for current polarization. To enter
the frequency value directly, use the alphanumeric keys. To confirm the
frequency value entry, press the «ENTER» key. The Analyzer automatically
detect which kind of frequency is entered – intermediate frequency or
satellite band frequency and set specified frequency in the center of the
47
Page 48

screen. If confirmation is performed with F1 / IF key, it is assumed
intermediate frequency is entered. If confirmation is performed with F2 / TF,
H/L or F3 / TF, V/R key, it is assumed satellite band frequency is entered
and horizontal/left-handed circular polarization or vertical/right-handed
circular polarization is selected;
2) Navigation of markers (F4 key is indicated as Marker•). The marker position
moving within the spectrum window is performed using the ◄ and ► keys.
To enter the frequency value directly, use the alphanumeric keys. To confirm
the frequency value entry, press the «ENTER» key. The Analyzer
automatically detect which kind of frequency is entered – intermediate
frequency or satellite band frequency and move selected marker to the
specified frequency. If confirmation is performed with F1 / IF key, it is
assumed intermediate frequency is entered. If confirmation is performed with
F2 / TF key, it is assumed satellite band frequency is entered. Marker
selecting is performed with F3 key. Selected marker color is indicated in the
F3 key position.
To access the mode settings, press the F1 / Settings key. The following settings are
available:
1) Ref. level. Selecting reference level value. Available values 50 to 120
dBuV and Auto. The setting resolution is 10 dBuV. The
parameter sets up the maximum possible measured signal
level.
2) Level offset. Possible values: Manual and Auto. In the Auto mode, the
amplitude scale position is set automatically, in
accordance with the maximal measured level value. In the
Manual mode, the scale position can be set manually
using the
and keys.
3) Averaging. Selecting measured level averaging degree. Available
values: off, Low, Medium, High.
4) Hold level. Enabling an additional signal level trace. Possible values:
off, MIN, MAX. If an additional trace is enabled, the
second signal line is displayed on the screen showing
minimum and maximum values obtained during
measuring. To reset the trace, press the «F5 / Reset» key.
5) Measure. Measuring mode. Possible values: Single, Quick,
Precise. In the single sweep mode a single scanning is
carried out by pressing the ENTER or F6 / Start key. The
Quick continuous scanning mode enables the quickest
scanning by decreasing the level measurement
accuracy. The Precise scanning mode allows for maximum
accuracy of signal level measurements.
6) Span. Frequency scanning span. Possible span values and
corresponding measuring filter passband values are given
in the table below.
Scanning range, MHz 10 20 50 100 200 400 800 1200
Filter passband, kHz 50 250 250 1000 1000 1000 1000 1000
7) Frequency ruler. Selecting the horizontal scale presentation variant:
− IF: IF frequencies displayed on the horizontal scale.
− TF: Satellite frequencies displayed on the horizontal scale. The
setting is available only if the converter profile is selected.
48
Page 49

− TP: Transponders bandwidth displayed on the horizontal scale. The
setting is available only if the converter profile is selected.
− LNB band: LO operating ranges displayed on the horizontal scale.
8) Level scale. Setting the amplitude scale value: 5, 10 dB.
9) Motor control. Enabling or disabling DiSEqC positioner operating mode
(section 4.4.7).
To switch the LNB power supply on and off, use the source control mode. To call the
mode, press the «Shift» key and then, without releasing it, press / .space key
(section 4.3.1.5).
LNB converter configuring is performed in the F2 / LNB popup menu (section
4.4.14.4.2).
To open the Channel, MER/BER or DiSEqC measurement modes, use the F3, F4
and F5 keys in the additional set of functions which is started by the Shift key.
4.4.6. DiSEqC control mode
The icon in the main selection menu corresponds to this mode. The mode is
intended for sending arbitrary DiSEqC commands. The Analyzer serves as a master
DiSEqC device in this mode. The mode screen view is presented in fig. 4.35.
Figure 4.35
The mode features a table of sent commands and responses to them as a sequence
of bite in hexadecimal format. The last sent commands are indicated in the beginning of
the list.
To send a typical command, press the F1 / List key and select one of the commands
from the dropdown menu:
1) 1.0 Switch. DiSEqC 1.0 switch control command. You need to specify the input
number (1…4);
2) 1.1 Switch. DiSEqC 1.1 switch control command. You need to specify the input
number (1…16);
3) SCR LNB UB signal on. The command switches the tone on in all SCR LNB
slots;
4) SCR LNB UB power off. The command switches the tone off in the given SCR
LNB slot. You need to specify the slot number;
5) Stop. The command enables positioner movement stopping;
6) Go home. The command enables positioner moving to the starting position;
7) Go to position. The command enables positioner moving to the given position.
You need to specify the position number (1…99);
8) Save position. The command enables position saving under the given number.
You need to specify the position number (1…99).
49
Page 50

To enter an arbitrary command, press the F3 / New key. You have to enter three to
six bites in hexadecimal format (0 to 9 digits, A to F letters) in the popup field.
To repeat a recently sent command, select the needed command by the
and
keys and press F2 / Repeat.
In case the command sent implies a response, the Received column will indicate a
bite set received from a slave device and the command progress status:
1) Ок. The command is received;
2) not supported. The command is not supported by the device;
3) not recognized. The command is received with an error;
4) parity error. The command is received with an error.
To clear the command history, use the F4 / Clear key.
To enable or disable the LNB power supply source, use the power source control
mode. To select the mode, press Shift and .space / simultaneously (section 4.3.1.5).
To go to Channel, MER/BER and Spectrum measurement modes, use the F2, F3
and F4 keys in the additional panel of functional keys accessed by the Shift key.
4.4.7. DiSEqC positioner operating
To operate the DiSEqC positioner in the Channel, MER/BER and Spectrum
measurement modes, the control mode of basic DiSEqC positioner functions is available.
The mode can be enabled in the dropdown menu of F1 / Settings using the Motor
Control option:
1) Off. The control is disabled;
2) Stepwise. The control is enabled, movement is incremental;
3) Continuously. The control is enabled, movement is continuous.
Enabling the DiSEqC control mode results in F3 to F6 functional keys reassignment:
1) F3 / ◄ W – westward movement;
2) F4 / E ► – eastward movement;
3) F5 / Stop – positioner stop;
4) F6 / Motor – positioner commands menu:
− Go home. The command enables positioner moving to the starting position;
− Goto position. The command enables positioner moving to the earlier saved
position. You need to specify the position number (1…99);
− Save position. The command enables the current position saving under the
given number. You need to specify the position number (1…99);
− Set East limit. The command enables setting the current position as
maximum when moving to the east;
− Set West limit. The command enables setting the current position as
maximum when moving to the west;
− Delete limits. The command enables deleting the earlier defined east and
west limits.
4.4.8. Transponder reception quality monitoring
This mode displays timing diagrams of transponder reception quality parameters in
the given time interval.
The mode operation principle is similar to the quality parameters monitoring mode for
terrestrial TV channel reception (section 4.3.10).
50
Page 51

4.4.9. Data Logger Handling
The Data logger (DL) is used to save the setting profiles. The Analyzer features two
types of structures referring to DL: LNB configurations table and satellite parameters table.
The data logger memory is common for all types of structures and is allocated
dynamically. The memory capacity allows storing up to 99 LNB profiles (section 4.4.10.2),
and up to 999 satellite parameters pages each of which may contain up to 300
transponders (section 4.4.11). The Analyzer allows viewing, creating and editing the saved
data off-line. The following icons correspond to the DL modes:
LNB Configurations
Table
Satellite Parameters
Table
4.4.10. LNB Configuration Setting Mode
The LNB configuration tables are available for making the Analyzer application
convenient in a specific system containing a reception satellite antenna, one or several
LNB converters and signal routing network with DiSEqC switches. The table sets up the
converter parameters, polarization control and LO selection methods, converter access
method, and satellite parameters.
LNB configuration consists of the following parameters:
1) Configuration name;
2) LNB converters number;
3) Parameters of each of LNB converters;
4) Satellite, attached to each of LNB converters;
There is a non-editable LNB configuration «Without converter». When selected, it
gives possibility to manually control LNB voltage and 22 kHz tone, as well as to send
DiSEqC commands.
4.4.10.1. LNB configuration list
This mode allows creating, deleting, editing and selecting LNB configuration, as well
as setting up the parameters of converters and attached satellites. The screen view of this
mode is shown in figure 4.36.
Figure 4.36
Use the functional keys to perform the following operations with satellites:
− «F1 / Edit». Reading and editing the configuration in cursor position
(section 4.4.10.2).
51
Page 52

− «F2 / New». Creating a new configuration.
− «F3 / Delete». Deleting the configuration in cursor position.
− «F4 / Rename». Renaming the configuration in cursor position.
− «F5 / Drive». Configurations source drive selecting: internal drive or
USB flash drive.
− «F6 / Select». Selecting the configuration for operating in measurement
modes.
4.4.10.2. LNB Configuration common parameters handling
The LNB configuration common parameters screen view is shown in figure 4.37.
Figure 4.37
The following parameters are available for configuring:
1) Name. LNB configuration name;
2) LNB type. LNB converter type. Use the «◄» and «►» keys to select one of the
typical converter types. Press «ENTER» or «F1 / Edit» key to edit selected
converter parameters (section 4.4.10.3). icon indicates converter that is stored
in the LNB configuration;
3) LNB satellite. Satellite, which signal is received by the converter. Use the «◄»
and «►» keys to select one of the satellites of the Analyzer (section
4.4.11). Use
alphanumeric keyboard to find a satellite with its orbital position. Press «ENTER»
or «F1 / Edit» key to edit selected satellite parameters (section
4.4.11.2). icon
indicates satellite that is stored in the LNB configuration;
Press «F3 / LNB+» or «F4 / LNB-» to specify converters number. To exit the mode
and save the changes, use the «F6 / Save» key. To exit the mode and discard changes,
use the «EXIT» key.
4.4.10.3. LNB Configuration converter parameters handling
The common converter parameters table view is shown in figure 4.38.
52
Page 53

Figure 4.38
The following parameters are available for configuring:
1) Name. Converter name. This name is indicated in the «LNB» context menu of the
measurement modes, when selecting converter to operate with;
2) Type. Converter type: «LNB with 1/2/3/4 LOs» - usual converter with 1…4 LOs,
«SCR LNB» - Single Cable Routing converter, «DLNB» - converter which moving
each receiving transponder on a fixed intermediate frequency (specifying in the
satellite transponder parameters);
3) Heterodyne selecting. LO selecting algorithm for «LNB with 2 LOs» converter:
«Manual» - LO is selected according to «LO selecting» LO parameter, «0/22
kHz» - low LO is selecting when 22 kHz tone is disabled, and high – when 22 kHz
tone is enabled, «DiSEqC» - LO is selecting with standard DiSEqC command
sequence;
4) Polarization selecting. Signal polarization selecting algorithm for «LNB with 1/2
LOs» converter: «Without control» - each band operates with signal of fixed
polarization (see «Polarization» parameter in LO settings), «13/18 V» - for each
band polarization is selectable with LNB voltage (13 V – vertical or right-handed
circular polarization, 18 V - horizontal or left-handed circular polarization),
«DiSEqC» - polarization selecting is performed with standard DiSEqC command
sequence;
5) Switch order. Signal routing network configuration: «Not used» - receiver is
connected directly to converter, «LNB -> TB -> 1.1 -> 1.0» - converter is
connected to receiver via Tone Burst switch, DiSEqC 1.1 switch and DiSEqC 1.0
switch in order, «LNB -> TB -> 1.0 -> 1.1» - converter is connected to receiver via
Tone Burst switch, DiSEqC 1.0 switch and DiSEqC 1.1 switch in order;
6) DiSEqC 1.0 switch input. DiSEqC 1.0 switch input, converter connected to: «Not
used» - switch is not used, «LNB 1…4» – 1, 2, 3 or 4 input;
7) DiSEqC 1.1 switch input. DiSEqC 1.1 switch input, converter connected to: «Not
used» - switch is not used, «LNB 1…16» – 1…16 input;
8) Tone burst switch input. Tone Burst switch input, converter connected to: «Not
used» - switch is not used, «LNB A» - input A, «LNB B» - input B;
9) Slots number. «SCR LNB» converter slots number: 4 or 8;
10) Slot 1…8. «SCR LNB» converter slot 1…8 intermediate frequency.
Use «F1/ View» context menu to switch between common converter parameters and
LO parameters. When LO parameters configuring is selected, the following table will
appear on the screen (figure
4.39).
53
Page 54

Figure 4.39
The following parameters are available for configuring:
1) LO frequency. LO frequency which is used to move satellite band to receiver’s
intermediate frequency;
2) Band minimal frequency. Satellite band minimal frequency value;
3) Band maximal frequency. Satellite band maximal frequency value;
4) Polarization. Selecting signal polarization, which is available for the satellite
band: «V/H или R/L» - any polarization can be selected, according to
«Polarization selecting» converter parameter, «V» - vertical polarization is only
available for satellite band, «H» - horizontal polarization is only available for
satellite band, «L» - left-handed circular polarization is only available for satellite
band, «R» - right-handed circular polarization is only available for satellite band;
5) LO selecting. LO selecting scheme: «Low (0 kHz)» - LO is selected when 22
kHz tone is disabled, «High (22 kHz)» - LO is selected when 22 kHz tone is
enabled, «Low/High (DiSEqC)» - LO is selecting with standard DiSEqC
command sequence.
Converter performs moving signal of satellite frequency to the receiver intermediate
frequency according to the following formulas:
IFTP = | FTP – FLO | (1)
= | FLO – FTP | (2), where
IF
TP
F
– transponder frequency,
TP
FLO – LO frequency,
– transponder intermediate frequency.
IF
TP
The formula (1) or (2) which is used for moving transponder frequency is selecting
according to converter internal structure.
To exit to the LNB configuration common parameters setting mode and save the
changes, use the «F6 / Save» key. To exit the mode and discard changes, use the «EXIT»
key.
4.4.11. Satellite Parameter Tables Handling
4.4.11.1. General Information
Satellite parameter tables are used for quick Analyzer setting to transponder
frequency. The table allows saving parameters of the satellite (name, orbital position), as
well as parameters of transponders (frequency, polarization, symbol rate, relative coding
rate). Parameters tables are used as templates for satellite assignment in the converter
configuration profile (i.e. copied in the configuration profile).
54
Page 55

The icon in the main menu corresponds to this mode. This mode allows
performing all operations with the satellite parameters. The screen view is shown in
figure 4.40.
Figure 4.40
The table indicates satellite name and its orbital position. Use the functional keys to
perform the following operations with satellites:
− «F1 / Edit». Reading and editing the satellite in cursor position.
− «F2 / New». Creating a new satellite.
− «F3 / Delete». Deleting the satellite in cursor position.
− «F4 / Rename». Renaming the satellite in cursor position.
− «F5 / Drive». Satellites source drive selecting: internal drive or USB
flash drive.
− «F6 / Sort». Selecting the satellites sorting order: by name or by orbital
position.
Enter orbital position with alphanumeric keyboard to find a corresponding satellite in
the list.
4.4.11.2. Satellite Entry Creating and Editing
The screen view of this mode is shown in figure 4.41.
Figure 4.41
The satellite entry includes five parameters:
1) Name. Satellite name.
2) Orbital position. Satellite orbital position, in degrees from 0 to 180 of
eastern (E) or western (W) longitude.
55
Page 56

3) Band. Satellite transponders broadcast band: Ku – Ku band, Ka – Ka
band, C – С band. The parameter cannon be edited, it is defined automatically
using the list of transponders.
4) Transponders number. Number of transponders in satellite entry (cannot be
edited).
5) Modified. Date of creating/updating satellite entry (cannot be edited,
set up automatically).
Press «F2 / Scan» key to enter transponders searching mode (section
4.4.11.4).
To exit the mode and save the changes, use the «F6 / Save» key. To exit the mode
and discard changes, use the «EXIT» key.
To edit the transponder entries, press the «F1 / TP » key (figure 4.42).
Figure 4.42
The table indicates the transponder number in the list, frequency, polarization,
symbol rate, relative code rate, modulation type and broadcast standard.
Use the functional keys to perform the following operations with transponders:
− «F1 / Edit». Reading and editing the transponder in cursor position.
− «F2 / New». Creating a new transponder.
− «F3 / Delete». Deleting the transponder in cursor position.
− «F4 / Info». Show satellite name and number of transponders.
− «F6 / Save». Save changes and exit.
Enter frequency with alphanumeric keyboard to find corresponding transponder in the
list. To exit the mode and discard changes, use the «EXIT» key.
4.4.11.3. Transponder Entry Creating and Editing
The screen view of the transponder editing mode is shown in figure 4.43.
56
Page 57

Figure 4.43
The following transponder parameters are available for configuring:
1) Frequency. Transponder central frequency in MHz.
2) Polarization. Transponder signal polarization: V – vertical, H –
horizontal, L – left-handed circular, R – right-handed circular.
3) Symbol rate. Transponder symbol rate in kSps.
4) Standard. Transponder broadcast standard: DVB-S or DVB-S2.
5) Constellation. Transponder modulation type: QPSK, 8PSK, 16APSK,
32APSK. The parameter is available for DVB-S2 standard only.
6) FEC. Transponder relative code rate. If «Auto» specified,
relative code rate will be defined by the Analyzer automatically.
7) PLS. Scrambling key for decoding DVB-S2 data stream.
4.4.11.4. Searching for transponders
Transponders searching mode allows to perform input signal scanning in order to get
the transponders list. The view of the mode is represented on the figure 4.44.
Figure 4.44
The following parameters setting up should be performed in the settings table:
1) LNB configuration. Selecting one of the LNB configurations to perform scanning
with (section 4.4.10.1). Transponders searching is available only for LNB
configurations with converters other than SCR or DLNB;
2) LNB. Selecting one of the converters of the selected LNB configuration;
3) Ref. level. Selecting reference level value. Available values 50 to 120 dBuV and
Auto. The setting resolution is 10 dBuV. The parameter sets up the maximum
possible input signal level;
4) LNB power. LNB converter powering control: on, off;
57
Page 58

5) Polarization. Selecting converter polarization(s) to scan: L – left-handed circular,
R – right-handed circular, V – vertical, H – horizontal;
6) LO. Selecting converter LO(s) to scan.
Press «F1 / Ok» key to start transponders searching. The progress and found
transponders number is indicated during the searching.
Press «F6 / Cancel» or «EXIT» to discard changes and leave the mode.
4.5. IPTV Measurements Procedure
4.5.1. General Information
Before you start operating your Analyzer, you need to set up the network interface
parameters (section 4.10.5).
The Analyzer features the following operating modes:
1) IPTV stream reception quality parameters measurement. It enables the access to
the following additional modes:
− TV video and sound analysis (section 4.7);
− MPEG transport stream analysis (section 4.6);
− MPEG transport stream recording (section 4.8);
− IPTV stream reception quality monitoring (section 4.5.3);
2) TCP/IP connection testing in Ping mode.
To enable the required operating mode in the main menu (figure 4.2), use the and
keys to set the required icon in the bottom line of the screen and press the
corresponding functional key. Operating modes and their icons are matched as follow:
IPTV Ping
To return to the main menu, press the EXIT key.
The screen view of the measurement modes features common elements and settings
as shown in figure 4.45.
Figure 4.45
The following data is displayed on the screen:
1) Current mode name;
2) Modes and settings icons (section 4.2);
3) Battery charge status;
4) IPTV stream parameters: IP address, type of protocol and port;
5) IPTV stream name (equivalent to IP address).
58
Page 59

The panel of functional keys includes the following keys: F1 is used to open the
settings menu, F2 through F6 are used to set up the current mode. Press the Shift key to
display the functional keys for quick switching between modes.
4.5.2. IPTV Stream Reception Quality Parameters Measurement
In this mode the IPTV stream reception quality parameters are displayed according to
RFC 4445. The screen view and displayed information are shown in figure
4.46.
Figure 4.46
The following parameters are displayed on the screen:
1) IAT (MIN/AVR/MAX). Minimum/average/maximum value of variability of the arrival
interval of adjacent IP packets throughout the stream measurement. IAT is
measured in ms and can be used to evaluate the stream flatness (jitter);
2) DF (MIN/AVR/MAX). Minimum/average/maximum value of data delay factor
throughout the stream measurement. DF is measured within the second interval
and displayed in ms. In fact, DF indicates the amount of time of data delay in the
receive buffer or the amount of time required to drain the buffer. So, DF indicates
minimal necessary depth of stream reception buffer enabling constant stream rate
at the buffer output and eliminating the data loss. The buffer volume can be
estimated as follows:
V = DF * BR * 1000, where
V is buffer depth in bytes,
DF is data delay factor in ms,
BR is MPEG stream rate in Mbit/s.
3) IP PACKETS. Total number of received IP packets throughout the measurement;
4) MLT. Number of lost MPEG packets throughout the measurement. This
measurement is performed only for RTP protocol, and is based on the analysis of
RTP packets sequence number. The RTP packet is considered to be lost if it is
missing in the buffer for RTP packet sequencing. The buffer allows for up to 10
packets sequencing;
5) IP BITRATE. The rate of IPTV ETHERNET frames in Mbit/s;
6) UPTIME. The IPTV stream measurement time after synchronization. The
synchronization progress bar is indicated until the synchronization is achieved.
The bar graph shown on the screen indicates the distribution of received IP packets
in IAT intervals. Each bar corresponds to a certain IAT interval of 0.4 ms. The bar height
indicates the number of packets corresponding to this IAT interval expressed as percent of
the total number of received packets. The maximum value bar is highlighted and its
interval limit values are indicated at the X axis. The bar graph view allows to analyze the
near-field stream distortion. The near-field stream distortion may be due to high degree of
59
Page 60

network or its separate nodes usage, low signal-to-noise ratio of the distribution network,
etc.
To set up the IPTV stream source, press the F1 / Settings key. The following
parameters are available for editing from the dropdown menu:
1) IP Address. The IP address of the IPTV stream source. The Analyzer will
automatically determine the routing type (unicast/multicast) using the IP address.
2) Port. The IPTV stream source port.
To confirm the changes, press the F1 / Settings or EXIT key.
Additional functions will become available after synchronization. The F3 / Mode key
opens the dropdown menu, enabling the following additional operation modes:
1) Statistics. Monitoring of IPTV stream reception quality (section
4.5.3);
2) MPEG Analyzer. The MPEG transport stream analysis (section 4.6);
3) MPEG Recorder. The MPEG transport stream recording (section 4.8);
Press the F4 / Video key to go to the TV video and sound analysis mode (section
4.7).
Press the F5 / Info key to display the table of additional information on IPTV stream:
1) Protocol. The IPTV stream protocol: UDP or RTP;
2) Routing. The IPTV stream routing type: unicast or multicast;
3) Packets/frame. The number of MPEG packets in the IP packet;
4) MPEG bitrate. The MPEG transport stream rate in Mbit/s;
5) Order errors. Number of the RTP packets sequence errors.
Press the F6 / Reset key to reset the IPTV stream measurement results. The
measurement is restarted.
Press the Shift key to enable additional functions on the functional panel: use the F1
/ Network key to go to the Analyzer network settings mode (section 4.10.5), F3 / Ping to
go to the TCP/IP connection testing mode (section 4.5.4).
4.5.3. IPTV stream reception quality monitoring
This mode displays timing diagrams of IPTV stream reception quality parameters
according to RFC 4445 in the given time interval. The screen view and the data displayed
are presented in fig. 4.47.
Figure 4.47
60
Page 61

The Analyzer allows monitoring the DF, MLR4 and IAT (section 4.5.2). Each
parameter diagram includes 300 time intervals. Depending on the user-defined
measurement duration, each time interval equals to:
Measurement
duration
Time interval,
sec
5 min 10 min 30 min 1 h 2 h 6 h 12 h 24 h 48 h 72 h
1 2 6 12 24 72 144 288 576 864
Each time interval accumulates minimum and maximum values of quality parameter,
as well as errored second counts:
1) ES. Indicates the number of seconds during which errors were detected;
2) SES. Indicates the number of seconds during which severe errors were detected
(including stream synchronization loss).
The second is errored if the measured parameter (DF or MLR) value has exceeded
the respective user-defined limit value during a second.
The measurement mode setting is carried out in the dropdown menu by pressing the
F1 / Settings key:
1) Duration. IPTV stream measurement duration: 5 min, 10 min, 30 min, 1 h, 2 h, 6
h, 12 h, 24 h, 48 h, 72;
2) DF limit (ES). DF limit value, by exceeding of which the second is considered to
be errored: 5...500 ms;
3) DF limit (SES). DF limit value, by exceeding of which the second is considered to
be severely errored: 5...500 ms;
4) MLR limit (ES). MLR limit value, by exceeding of which the second is considered
to contain errors: 1...50;
5) MLR limit (SES). MLR limit value, by exceeding of which the second is
considered to contain severe errors: 1...50;
6) Beeping on SES. Switching sound indication of severe error (SES) detection: Off,
On;
7) Autosave. Switching automatic measurement results saving to a file upon
measurement completion: Off, On.
Measurement can be started by pressing the F6 / Start key. In case the Autosave
function is switched on, it is necessary to specify the page name for further automatic
saving to a file.
In order to stop the measurement, press the F6 / Stop key during measurement. A
beep will sound after the measurement is stopped.
The following data is indicated on the screen during measurement (figure 4.47):
1) Instantaneous measurement results of DF, MLR, and IAT measured in a second
interval;
2) Total measurement results. Include all time intervals passed from the beginning of
measurement, minimum and maximum parameter values for the whole
measurement time, total ES and SES number during all measurement time;
3) Timing diagram of the parameter to be displayed. For the DF and IAT parameters,
the diagram includes vertical lines, the lower point of which corresponds to the
minimum parameter value in the time interval, and the upper point – to the
maximum value. For the MLR parameter, the diagram includes bars, the height of
which corresponds to the number of lost MPEG packets in the respective time
interval;
4) Measurement results at the marker position. Include absolute time value of time
interval beginning at the market position, minimum and maximum parameter
4
Measured for RTP protocol only
61
Page 62

values, and the number of ES and SES errored seconds in the time interval at the
marker position;
5) ES/SES grid. Features the grid with vertical marks matched with the timing
diagram. In case at least one severe error (SES) is detected in the time interval, a
red mark is indicated, and if an ES error is detected, a green mark is indicated.
This grid allows determining whether errors were detected during measurement,
and how they are grouped in time. The indicator of the time passed is shown
under the grid in the form of a line.
The parameter to be viewed on the diagram can be selected using the dropdown
menu of F2 / View. To move the cursor, use the ◄ and ► keys. By pressing these keys
along with the Shift key, the cursor can be moved with a larger pitch.
To view the detailed measurement results obtained during all measurement time,
press the F4 / Total key. The table includes the following information:
1) ES total. Total number of errored seconds during all measurement time;
2) SES total. Total number of severely errored seconds during all measurement
time;
3) DF min/max. Minimum and maximum DF values during all measurement time;
4) DF avr. Average DF value during all measurement time;
5) MLT. The number of lost MPEG packets during all measurement time;
6) IAT min/max. Minimum and maximum IAT values during all measurement time;
7) IAT avr. Average IAT value during all measurement time;
8) IP bitrate. Average IP stream bitrate during all measurement time;
9) MPEG bitrate. Average MPEG stream bitrate during all measurement time.
Measurement results can be saved to a file upon completion or forced stop of
measurement by pressing the F5 / Save key. Specify the page name in the popup field
and press ENTER. In case a USB flash drive is connected to the Analyzer, the page will
be saved to it, otherwise the page will be saved to the internal drive. You can view the
measurement results saved to a file in the file manager (section
4.9), by selecting the IPTV
Statistics file type.
4.5.4. TCP/IP network connection quality testing (TCP/IP ping)
This mode displays the results of connection quality testing in TCP/IP networks. The
screen view and the data displayed are presented in fig.
4.48.
Figure 4.48
Connection quality testing in TCP/IP networks is carried out by sending an ICMP
echo request and receiving an echo response from the remote network node. Quality
evaluation is performed using the data on echo response packet integrity, as well as the
time between sending the request and receiving the response.
62
Page 63

To set up the mode, press the F1 / Settings key. The following parameters from the
dropdown menu are available for editing:
1) IP address. IP address of the network node, at which ICMP echo requests are to
be sent;
2) Continuously. Enabling/disabling of the continuous request sending mode until
manual stop: On, Off;
3) Packets quantity. Number of echo requests to be sent: 1...10000. The parameter
is available for editing if the continuous request sending mode is disabled;
4) Packet length. Data field size of ICMP echo request in bytes: 0...65500;
5) Interval. Request sending interval in seconds: 1...60 sec.
In case the IP address of the remote node is not known, it can be determined using
the domain node name by pressing the F2 / Find IP key. Specify the full domain node
name in the popup field. If the IP address is detected, it will be indicated on the screen, as
well as set in the mode settings. To find the IP address, the Analyzer needs access to the
DNS network server (section
4.10.5).
The testing is started by pressing the F6 / Start key. The testing is stopped
automatically after sending of the number of requests specified in the settings, or manually
by pressing the F6 / Stop key.
The testing results are indicated in the table, in which the following data is shown for
each echo response:
1) #. Request number;
2) IP address. The node IP address, at which echo requests are sent;
3) Status. Echo request sending results: Ok – proper echo response received within
the specified time, Response timeout – the response is not received within the
specified time (5 sec), No connection – the Analyzer is not connected to the
TCP/IP network;
4) Bytes. The number of data field bytes of the received ICMP echo response;
5) TTL. IP header TTL field value of echo response;
6) Time. The time between echo request sending and echo response receiving in
ms.
Total testing session statistics containing the following data is indicated in the lower
part of the screen:
1) Sent. The number of echo requests sent;
2) Lost. The number of missing responses to echo requests;
3) Time min. Minimum time of response to echo request during all testing time;
4) Time max. Maximum time of response to echo request during all testing time;
5) Time avg. Average time of response to echo request during all testing time;
Press the Shift key, and additional functions will become available for the functional
panel keys: F1 / Network – switching to the Analyzer network settings mode (section
4.10.5), F2 / IPTV – switching to the quality parameters measurement mode for the IPTV
stream reception (section
4.5.2).
4.6. Transport Stream Analysis Procedure
4.6.1. General information
Transport steam analyzer is designed to learn the structure of MPEG transport steam
(TS), and to check TS compliance to the requirements of ETSI TR 101 290 in the real
time. In addition, this mode allows you to measure a number of indicators of TS and its
components: the TS bitrate, the bitrate of elementary streams, the repetition rate of PSI/SI
tables, the repetition rate of PTS timestamps, PCR accuracy (jitter of the PCR timestamps
source), the PCR timestamps frequency offset, the frequency drift rate of PCR
timestamps, etc.
63
Page 64

Access to the mode is performed by pressing the «F3 / Mode» button and selecting
«MPEG Analyzer» in the drop-down menu from the following modes:
1) Channel mode, for the terrestrial and cable TV channels (section
4.3.3);
2) Channel mode, for the satellite TV transponders (section 4.4.3);
3) MER/BER mode, for the satellite TV transponders (section 4.4.4);
4) IPTV mode, for the IPTV stream (section 4.5.2);
5) File Manager for the TS files (section 4.9).
Before performing TS analysis it is necessary to learn the general features, and also
the recommendations on the analysis procedure (section 4.6.4).
4.6.2. Transport stream general information window
The TS general information window allows you to get a general idea about the
structure of the stream, found errors, and to manage the analysis process (figure 4.49).
Figure 4.49
The window contains the following information:
1) Analysis time. The duration of the TS analysis;
2) Network name. The name of the broadcast network that is transmitted in the NIT
table;
3) Bitrate. Average TS bitrate in Mbit/s;
4) ES. Summary bitrate of elementary streams (video, audio and data) as a
percentage of the TS bitrate;
5) PSI/SI. Summary bitrate of service information tables (PAT, PMT, NIT, etc.) as a
percentage of the TS bitrate;
6) Null. Staffing bitrate (PID=0x1FFF) as a percentage of the TS bitrate;
7) Packets count. The number of TS packets received during the analysis;
8) PIDs count. The PIDs number in the TS;
9) Services count. The number of programs in the TS;
10) TR 101 290 errors count. The number of analysis errors of ETSI TR 101 290
priority 1, 2 and 3 that were found during the analysis;
11) Last event. Information about the latest event in the events logger (section 4.6.5)
and the total number of events in the events logger.
The analysis is set up by using the "F1 / Settings" button context menu. There are
the following settings:
1) Duration. The necessary analysis duration: 5 min, 10 min, 30 min, 1 h, 2 h, 6 h,
12 h, 24 h, 48 h, 72 h;
2) Profile. Select profile analysis settings: Cable, Terrestrial, Satellite, IPTV
(SPTS), Custom. The analysis settings profile is a set of settings (the ETSI TR
101 290 parameters checklist, PSI/SI tables and elementary streams intervals
limits, etc.) which are used for TS analysis. The profile is selected automatically
by the Analyzer in accordance with the TS source;
64
Page 65

3) Beep on event. Switching on/off sound signal playing in case an event occurs
during the TS analysis;
4) Autosave. Switching automatic analysis results saving to a file upon analysis
completion: Off, On.
Configuring of the analysis profile settings is performed in the "F2 / Profile" button
context menu. The menu contains the following options (section
4.6.3):
1) TR101290. Selecting ETSI TR 101290 parameters to be checked during the
analysis;
2) Limits. Setting the limit values for the TS parameters (repetition rate of PSI/SI
tables, PTS timestamps, PCR timestamps, etc.);
3) Exceptions. Excepting some TS objects from the analysis. This can be useful
when the analyzed TS has a complex structure, in case the Analyzer doesn’t have
enough resources to handle such TS.
The analysis is started by pressing the «F5 / Start» button. In case the Autosave
function is switched on, it is necessary to specify the page name for further automatic
saving to a file. Pressing the «F6 / Stop» button again leads to the analysis stopping.
Access to the analysis measurement results is available from the «F3 / Results»
button context menu. One of the following items can be selected:
1) Events. Enter to the analysis events logger (section
4.6.5);
2) Errors. Enter to the analysis errors detailed information window for each of the
ETSI TR 101 290 priorities (section
4.6.6).
Press «F4 / Stream» button to learn the TS structure. Select one of the following
items in the appeared context menu:
1) Services. Enter to the TS programs list (section 4.6.7);
2) PIDs. Enter to the TS PIDs list (section 4.6.9);
3) PSI/SI. Enter to the TS service information tables tree view (section 4.6.10).
Analysis results can be saved to a file upon completion or forced stop of
measurement by pressing the «F6 / Save» key. Specify the page name in the popup field
and press «ENTER». In case a USB flash drive is connected to the Analyzer, the page will
be saved to it, otherwise the page will be saved to the internal drive. You can view the
analysis results saved to a file in the file manager (section 4.9), by selecting the «MPEG
analysis results» file type.
Press the «EXIT» button to leave the TS analysis mode. In order to prevent
accidental data loss, the Analyzer cannot be switched off during the analysis.
4.6.3. Transport stream analysis profile settings
Access to the TS analysis profile settings is performed from the TS general
information window (section 4.6.2) from «F2 / Profile» button context menu. The active
profile can be selected in the TS analysis settings context menu.
4.6.3.1. ETSI TR 101 290 parameters checking list
Selecting ETSI TR 101 290 parameters to be checked during the analysis is
performed from the list, as shown in the figure 4.50.
65
Page 66

Figure 4.50
The list of available parameters is presented in a form of a table divided into 3
columns. Each column corresponds to its priority (1st, 2nd or 3rd), according to ETSI TR
101 290. If the parameter is selected to be checked during the analysis it is marked with a
icon.
The following parameters of the first priority are available:
1) 1.1 TS sync loss. Loss of synchronization with the transport stream: two or more
packets in a row have the synchronization byte value different from 0x47. Restore
of synchronization registers when 5 MPEG packets in a row have a proper
synchronization byte;
2) 1.2 sync byte error. MPEG packet synchronization byte value is different from
0x47;
3) 1.3a PAT error 2. The repetition period of all sections with table_id=0x00 (PAT) in
PID=0x0000 exceeds the defined value (500 ms by default). Sections with
table_id different from 0x00 found in PID=0x0000. Scrambling_control_field is
different from 0x0 for PID=0x0000;
4) 1.4 Continuity count. Incorrect packets sequence order: the continuity_count
field value of two consecutive packets with the same PID differs by more than 1; a
packet with the same continuity_count field value for the PID appears more than
twice in a row5;
5) 1.5a PMT error 2. The repetition period of all sections with table_id=0x02 (PMT)
in PID specified in the program_map_pid of the PAT table exceeds the defined
value (500 ms by default). Scrambling_control_field is different from 0x0 for PID
specified in the program_map_PID of the PAT table;
6) 1.6 PID error. The repetition period of the MPEG packets of elementary streams
(video, audio, data) exceeds the defined limit (5 sec by default). Elementary
streams of audio and data with a language descriptor of ISO 639 type, that is
different from 0, are excluded from checking.
The following parameters of the second priority are available:
1) 2.1 Transport error. Transport_error_indicator field of the MPEG packet equal to
1. This indicates that the packet is damaged and cannot be further analyzed;
2) 2.2 CRC error. The CRC error was detected in the CAT, PAT, PMT, NIT, EIT,
BAT, SDT or TOT table sections. This indicates that the table section is damaged
and should not be used by the receiver;
3) 2.3a PCR repetition. The repetition period of the PCR timestamps exceeds the
defined limit (40 ms by default);
4) 2.3b PCR discontinuity. The difference between the two consecutive PCR
timestamps counter values (PCRi – PCR
) is less than 0 or exceeds the defined
i-1
5
According to ISO/IEC 13818-1, the appearance of a MPEG packet duplicate is not an error
66
Page 67

limit (100 ms by default), and, meanwhile, the discontinuity_indicator flag is not
set;
5) 2.4 PCR accuracy. The value of the PCR accuracy metric (the jitter of the PCR
timestamps source) is outside of the defined range (-500...+500 ns by default).
The measurement is made in accordance with the profile MGF2 (100 mHz),
according to ETSI TR 101 290;
6) PCR FO/DR. The frequency offset of PCR timestamps is outside of the defined
range (-810...+810 Hz, by default). The frequency drift rate of PCR timestamps is
outside of the defined range (-27...+ 27 mHz/s by default). The measurement is
made in accordance with the MGF2 (100 mHz) profile, according to ETSI TR 101
290;
7) 2.5 PTS error. The repetition period of PTS timestamps exceeds the defined limit
(700 ms by default);
8) 2.6 CAT error. The MPEG packets with the scrambling_control_field different
from 0, were detected in the transport stream, and table with table_id=0x01 (CAT)
were not detected; table sections with table_id, that are different from 0x01, were
detected in PID=0x0001.
The following parameters of the third priority are available:
1) 3.1a NIT actual error. The sections with table_id other than 0x40 (NIT of the
current broadcast network), 0x41 (NIT of the broadcast networks different from
the current one), or 0x72 (ST) are detected in PID=0x0010. The repetition period
of all sections with table_id=0x40 (NIT of the current broadcast network) in
PID=0x0010 exceeds the defined value (10 sec by default). The interval between
the arrival time of any two sections with table_id=0x40 (NIT of the current
broadcast network) in PID=0x0010 is less than the defined value (25 ms by
default);
2) 3.1b NIT other error. The repetition period of all sections with table_id=0x41 (NIT
of the broadcast networks different from the current one) of each table in
PID=0x0010 exceeds the defined value (10 sec by default);
3) 3.2 SI repetition error. The repetition period of all sections in the PAT, CAT,
PMT, NIT, SDT, BAT, EIT, TDT, and TOT tables separately exceeds the defined
value. The interval between the arrival time of any two PAT, PMT, NIT, SDT, BAT,
EIT, RST, TDT, and TOT sections for each table separately less than the defined
value (25 ms by default). The parameter is a duplicate for most types of tables,
and in case an error is detected, 3.2 indicator will be set in addition to indicator
specific for the checking table;
4) 3.4a Unreferenced PID. The packets with a PID that is not referenced by any
service information table (PSI/SI) within the defined time interval (500 ms by
default) is detected in the transport stream;
5) 3.5a SDT actual error. The repetition period of all sections with table_id=0x42
(SDT of the current transport stream) in PID=0x0011 exceeds the defined value
(2 sec by default). The sections with table_id different from 0x42 (NIT of the
current broadcast network), 0x46 (SDT of the transport streams that are different
from the current one), 0x4A (BAT), or 0x72 (ST) are detected in PID=0x0011. The
interval between the arrival time of any two sections with table_id=0x42 (SDT of
the current transport stream) in PID=0x0011 is less than the defined value (25 ms
by default);
6) 3.5b SDT other error. The repetition period of all sections with table_id=0x46
(SDT of the transport streams different from the current one) of each table in
PID=0x0011 exceeds the defined value (10 sec by default);
7) 3.6a EIT actual error. The repetition period of all sections with table_id=0x4E
(EIT of the current/following program event of the current transport stream) of
each of the tables in PID=0x0012 exceeds the defined value (2 sec by default).
67
Page 68

The sections with table_id different from 0x4E...0x6F (EIT) or 0x72 (ST) are
detected in PID=0x0012. The interval between the arrival time of any two sections
with table_id=0x4E (EIT of the current/following event of the current transport
stream) of each of the tables in PID=0x0012 is less than the defined value (25 ms
by default);
8) 3.6b EIT other error. The repetition period of all sections with table_id=0x4F (EIT
of the current/following event of transport streams different from the current) of
each of the tables in PID=0x0012 exceeds the defined value (10 sec by default for
cable and satellite TV and 20 sec for terrestrial TV);
9) 3.6c EIT P/F error. If one of the sections (0 or 1) of the EIT table (current/
following event) for the program of any of the transport stream presents, the other
must present too. In case the transport stream doesn’t match the condition, an
error is registered;
10) 3.7 RST error. The sections with table_id different from 0x71 (RST) or 0x72 (ST)
are detected in PID=0x0013. The interval between the arrival time of any two
sections with table_id=0x71 (RST) in PID=0x0013 is less than the defined value
(25 ms by default);
11) 3.8 TDT error. The repetition period of all sections with table_id=0x70 (TDT) in
PID=0x0014 exceeds the defined value (30 sec by default). The sections with
table_id different from 0x70 (TDT), 0x72 (ST), or 0x73 (TOT) are detected in
PID=0x0014. The interval between the arrival time of any two sections with
table_id=0x70 (TDT) in PID=0x0014 is less than the defined value (25 ms by
default).
The cursor is moved by using the «◄», «►», «
» and « » buttons. To select and
deselect the parameter for checking, press «ENTER» or «F6» button. To select or
deselect all the parameters of a priority at the cursor position, press the «F5 / All» button.
To set the default parameters selection for the current profile, press the «F2 / Default»
button.
To exit from the mode with saving of changes it is necessary to press the «F1 /
Save» button. To exit and discard changes, press the «EXIT» button.
4.6.3.2. Transport stream parameters limit values setting
Setting the limit values of the transport stream parameters is performed in the table
shown in the figure 4.51.
Figure 4.51
The following transport stream parameters and their limit values are shown in the
table:
1) Max PAT interval, ms. The maximum repetition period of all sections of the PAT
table: 1…60000 ms;
68
Page 69

2) Max PMT interval, ms. The maximum repetition period of all sections of the PMT
table: 1…60000 ms;
3) Max Video/Audio interval, ms. The maximum repetition period of video and
audio elementary streams packets: 1…60000 ms;
4) Max user PID interval, ms. The maximum repetition period of the data
elementary streams: 1…60000 ms;
5) Max PCR interval, ms. The maximum repetition period of PCR timestamps for
each of the program: 1…60000 ms;
6) Max PCR delta value, ms. The maximum difference between the two
consecutive PCR timestamps counter values (PCR
– PCR
i
) for each of the
i-1
program: 1…60000 ms;
7) Max PCR accuracy error, ns. The maximum allowed value of the PCR accuracy
metric (absolute value) for each of the program: 1…60000 ns;
8) Max PCR frequency offset, Hz. The maximum allowed value of the PCR
timestamps frequency offset (absolute value) for each of the program: 1…60000
Hz;
9) Max PCR drift rate, mHz/s. Maximum allowed value of the of PCR timestamps
frequency drift rate (absolute value) for each of the program: 1…60000 mHz/s;
10) Max PTS interval, ms. The maximum allowed repetition period of the PTS
timestamps for each of the elementary stream: 1…4000 ms;
11) Max NIT act./oth. interval, ms. The maximum repetition period of all sections of
the NIT table for each broadcast networks: 1…60000 ms;
12) Max CAT interval, ms. The maximum repetition period of all sections of the CAT
table: 1…60000 ms;
13) Max BAT interval, ms. The maximum repetition period of all sections of the BAT
table for each of the bouquet: 1…60000 ms;
14) Min section interval, ms. The minimum allowed time between arrival of any two
sections of the same table: 1…16000 ms;
15) Unreferenced PID duration, ms. Maximum allowed time during which a PID
doesn’t referenced by PSI/SI tables: 1…60000 ms;
16) Max SDT actual interval, ms. The maximum repetition period of all sections of
the SDT table of the current transport stream: 1…60000 ms;
17) Max SDT other interval, ms. The maximum repetition period of all sections of the
SDT table for each of the transport streams different from the current one:
1…60000 ms;
18) Max EIT P/F actual interval, ms. The maximum repetition period of all sections
of the EIT table (current/following event) for each program of the current transport
stream: 1…3000 ms;
19) Max EIT P/F other interval, ms. The maximum repetition period of all sections of
the EIT table (current/following event) for each program of transport streams
different from the current one: 1…60000 ms;
20) Max TDT/TOT interval, ms. The maximum repetition period of all sections of the
TOT and TDT tables: 1…32500 ms;
The cursor is moved by using the «◄», «►», « » and « » buttons. The value for
the parameter at the cursor position can be edited by using the alpha-numeric keyboard.
To set the default limit values for the current profile, press the «F2 / Default» button.
To exit from the mode with saving of changes it is necessary to press the «F1 /
Save» button. To exit and discard changes, press the «EXIT» button.
4.6.3.3. Transport stream objects exception from analysis setting
Setting the exception of the transport stream objects from the analysis is performed
by using the table, as shown in the figure 4.52.
69
Page 70

Figure 4.52
The table contains the following items for their exception from the analysis:
1) EIT excepted from analysis. Exception the EIT tables (current/following event)
of the current transport stream programs;
2) EIT-schedule excepted from analysis. Exception the EIT tables (several days
schedule) of the current transport stream programs;
3) EIT-other excepted from analysis. Exception the EIT tables (current/following
event) of the programs of the transport streams different from the current one;
4) EIT-other-schedule excepted from analysis. Exception the EIT tables (several
days schedule) of the current transport stream programs different from current
one;
5) SDT-other excepted from analysis. Exception the SDT tables of the transport
streams different from the current one;
6) ECM excepted from analysis. Exception the ECM elementary streams;
7) PCR of radio programs excepted from analysis. Exception the PCR
timestamps of all radio programs;
8) PCR of TV programs excepted from analysis. Exception the PCR timestamps
of all TV programs;
The selected exceptions are marked the
configuring are given in the section
4.6.4.
icon. Recommendations on exceptions
The cursor moves by using the « » and « » buttons. For selecting or deselecting
exception press «ENTER» or «F6» button. For selecting or deselecting of all the
exceptions press «F5 / All» button. To set the default exceptions selecting for the current
profile, press the «F2 / Default» button.
To exit from the mode with saving of changes it is necessary to press the «F1 /
Save» button. To exit and discard changes, press the «EXIT» button.
4.6.4. Transport stream analysis recommendations
Before starting to perform the transport stream analysis (especially long-term), it is
necessary to prepare the Analyzer as follows:
1) Set the required duration of the analysis in the settings (section 4.6.2);
2) Make sure the Meter is connected to the external power source when you are
planning a long-term analysis;
3) Make sure the required analysis profile is selected in the settings (section
4) Make sure that the analysis settings correspond to the task (section
4.6.3);
5) Start the analysis of transport stream (section 4.6.2);
70
4.6.2);
Page 71

6) When you plan a long-term analysis, observe the analysis progress for the first 23 minutes, and make sure that the analysis does not stop and there is no a large
number of events in the events logger (section
4.6.5);
7) Leave the Meter until the end of the analysis.
It is not recommended that a large number of similar events are registered in the
logger during the analysis. As a result, the Analyzer’s efficiency reduces, and also it
becomes difficult to find a particular event in the logger among a batch of similar events. It
is important to remember that no more than 10,000 events can be registered in the log.
Usually, a large number of similar events indicate that the limit values of transport steam
parameters are set incorrectly (section
4.6.3.2).
Another problem is the fact that the analysis might be emergency stopped because of
the lack of the Analyzer’s resources due to the complex structure of the transport stream.
Normally this problem appears in the first 2-3 minutes. The critical features of the transport
stream complexity are in following:
1) A large number of programs (several dozens). Usually transport streams with
plenty of the radio programs are the risk factor;
2) Broadcasting TV programs schedule (EIT) in the transport stream with a total
duration of more than 1 week. The risk factor in this case is the transport streams
broadcasting schedule for all the programs in the network, not only for the
programs of the current transport stream;
3) Presence of a large number of ECM elementary streams in the transport stream.
The risk factor is transport streams with a large number of programs and groups
of programs and several encryption systems.
To analyze such transport streams, you should exclude some types of the objects
from the analysis (section
4.6.3.3).
It is also necessary to remember about some features of the Meter concerning the
analysis of the structure of the service information tables of the transport stream (section
4.6.10). Because the Meter has a limited performance, the accumulation of the sections of
the tables is performed when such the opportunity is appeared. Considering that the total
amount of information of the average transport stream carried in the tables of service
information is more than 1 MB, so the accumulation of all sections can take 5...10 min.
Hence, the period of time from the beginning of the analysis to the appearance of the table
in the service information tables tree should not be associated with the frequency of
occurrence of this table in the transport stream. You should remember this when analyzing
the transport stream from the short-duration file: after the analysis is completed, sections
of some tables could absent in transport streams service information tables tree, although
they are actually present in the stream.
4.6.5. Transport stream analysis events logger
The events logger is a table of event with a timestamp and description that occurred
during the TS analysis (figure 4.53).
71
Page 72

Figure 4.53
Each event consists of two lines and contains the following information:
1) The occurred events time and date;
2) The PID identifier, which the event is associated with. Available for the most of
events;
3) The program identifier (SID) which the event is associated with;
4) The originating broadcast network identifier (ONID), which the event is associated
with;
5) The transport streams identifier (TS), which the event is associated with;
6) The programs bouquet identifier (bouquet), which the event is associated with;
7) Event indicator identifier according to ETSI TR 101 290. Available for the most of
events;
8) Textual description of the event.
The logger can contain the following events:
1) The event of registration an error according to ETSI TR 101 290 indicators. The
description of the event consists of indicator identifier and a detailed description of
the event (for example «3.1a: NIT repetition period >500 ms»);
2) PCR drift rate >X mHz/s or frequency offset >Y Hz, where X and Y – the limit
values of parameters. The event occurs when the frequency offset and(or) the
drift rate of PCR timestamps goes outside the defined range;
3) PCR drift rate and frequency offset of program in bounds. The event occurs
when the frequency offset and the drift rate of PCR timestamps return to the
defined range;
4) Analysis started. Analysis of the transport stream is started;
5) Analysis stopped. The transport streams analysis is completed thanks to the
user's initiative, due to the completion of the defined analysis duration, or due to a
critical fault;
6) Synchronization with signal source lost. Lost of synchronization with the signal
source by which the transport stream is transmitting: DVB channel demodulator
(no synchronization), IPTV network interface (no IP packets for 1 sec) or file
system (end of file);
7) Synchronization with signal source established. Synchronization with the
transport stream source is established: DVB channel demodulator
(synchronization appeared), IPTV network interface (IP packets appeared) or file
system (start playing of the file);
8) MPEG packet size other than 188 bytes. The MPEG packet with size other than
188 bytes is detected;
9) MPEG stream bitrate is too high. The transport streams bitrate is higher than
the processing rate of the Analyzer. The analysis cannot be continued;
72
Page 73

10) Not enough memory to continue analysis. There is not enough RAM for the
transport streams analysis. Analysis cannot be continued. It is necessary to
exclude some objects of the transport stream from the analysis (section
4.6.3.3);
11) Events register too often. The Meter does not have enough time to register
events in the logger, because they arrive too quickly. Analysis cannot be
continued. It is necessary to change the parameters of analysis settings profile
(section 4.6.3);
12) MPEG stream structure has changed. The transport stream structure has
changed (the number of programs, the program elementary stream set, etc.).
Analysis cannot be continued. To continue the analysis it is necessary to run it
again;
13) Too much events registered. The maximum number of logger events is
reached. The transport streams analysis continues, but events do not register
anymore. To avoid registration a large number of similar events, it is necessary to
set up the analysis settings profile parameters (section 4.6.3);
14) Unknown fault happened. An unknown error occurred during the analysis.
Analysis cannot be continued. It is necessary to contact the manufacturer to fix a
fault;
15) The events about excluding the transport streams objects from the analysis.
Events appear when the analysis is started if an or several exceptions are
selected (section
4.6.3.3).
The cursor is moved by using the «
» and « » buttons. If pressed together with the
«Shift» button, the cursor is moved on the several events. To move to the beginning of the
logger, press the «F5 / Start» button, and to move to the end – «F6 / End».
For the event at the cursor position, it is possible to move to the other modes to view
the measurement results associated with that event:
1) «F2 / PID». Go to PIDs list view with setting the cursor to the PID associated with
the event;
2) «F3 / PSI/SI». Go to the transport stream service tables structure tree with setting
the cursor to the table associated with the event;
3) «F4 / Service». Go to the program list view with setting the cursor to the program
associated with the event.
4.6.6. ETSI TR 101 290 errors information window
The errors information window consists of ETSI TR 101 290 parameters list with
information about the status of each parameter, as shown on the figure 4.54.
Figure 4.54
The list contains parameters similar to those presented in the ETSI TR 101 290
parameters checking list (section
4.6.3.1). There is a registered errors counter on the right
73
Page 74

of the checking parameter. In case at least one error is registered, the counter is displayed
with the red background. If checking of the parameter is switched off, the «---» is indicated
instead of errors counter.
The cursor is moved by using the «◄», «►», «
» and « » buttons. Press the
«ENTER» or «F1 / Details» button to see detailed information about the parameter in the
cursor position. The detailed information of registered errors will appear on the screen in a
form of a tree (figure 4.55).
Figure 4.55
The tree consists of errors counters for all the checking parameters grouped
according to their priorities. Some checking parameters (for example «1.3a PAT error 2»)
are divided into sub-parameters according to TR 101 290. Errors are counted for each
transport stream object (PID, PSI/SI table) separately, and indicated on the screen with the
object identification information (PID, SID, service name).
Root nodes that contain a structured set of data are indicated with the « » (node
expanded) or «►» icon (node collapsed). If checking parameter or group of parameters
contains one or more errors, the corresponding node is indicated with the icon, and the
node name is displayed in red color.
The cursor moves by using the « » and « » buttons. When pressed together with
the «Shift» button, the cursor moves on several nodes. When pressing the «►» button on
the root node, it expands. When pressing it again, the cursor moves to the first child node
of the root node. Press the «◄» button to move the cursor to the nearest root node. When
pressing the «◄» button again the selected root node is collapsed. When pressing the
«◄» button together with the «Shift» button, all root nodes of the branch in the cursor
position are collapsed, up to the main root node. Press the «F5 / Fold all» button to
collapse all the tree nodes. Press the «F1 / ◄Error» or «F6 / Error►» button to navigate
cursor among the nodes, which contain errors.
There is a tree route map at the top of the window, which shows the names of the
nodes, separated by the «/» symbol. These nodes are the successive root nodes for the
node in the cursor position.
When setting the cursor on one of objects containing errors, the following actions are
available:
1) Pressing «F2 / Service» button to switch to the programs list with cursor on the
corresponding service (section 4.6.7);
2) Pressing «F3 / PID» button to switch to the PIDs list with cursor on the
corresponding PID (section 4.6.9).
4.6.7. Transport stream programs list
The transport stream programs list is represented as a table with the information
about the programs, as shown in the figure 4.56.
74
Page 75

Figure 4.56
The table columns contain the following information about the programs of the
transport stream:
1) Service. The name of the program according to the SDT table. If one or more
elementary streams of the program contain errors, the name of the program is
displayed on the red background;
2) SID. The programs identifier according to PMT and SDT tables;
3) CA. The indicator of encrypted program;
4) Type. Program type: TV – TV program, Radio – radio program, Data – another
types of program;
5) ES. Number of elementary streams (video, audio and data) of the program;
6) %. The summary bitrate of all elementary streams of the program as a percentage
of the transport stream bitrate;
7) PCR PID. The PID identifier in which the program PCR timestamps are
transmitted and PCR monitoring status icon (section 4.6.8): - monitoring is in
progress, - monitoring is finished, measurement results are available. If the
program does not have PCR timestamps, the value is specified as «---».
The cursor is moved by using the « » and « » buttons.
For viewing the structure of the PMT table (section
4.6.10) press «F2 / PMT» button,
SDT table - «F3 / SDT», EIT (current/following event) table - «F4 / EIT».
For switching to the PCR time domain monitoring mode, press the «F5 / Jitter»
button (section 4.6.8).
Press the «ENTER» or «F1 / Details» button to view the detailed information about
the components of the program in the cursor position. The table with information about the
program structure appears on the screen, as shown on the figure
4.57.
Figure 4.57
75
Page 76

There is the table with the list of elementary streams of the program on the left side of
the screen. The table consists of columns with the following information:
1) Status of elementary stream:
a.
(green). The elementary stream is free of errors;
b. (red). The elementary stream contains errors;
c. (grey). The elementary stream does not contain data for checking (applies to
ECM);
2) Type. Elementary stream type: VID -video, AUD – audio, PCR – PCR
timestamps, ECM;
3) PID. PID identifier of the elementary stream. It is displayed on the red background
if PID contain errors (section 4.6.9);
4) Bitrate, MBit/s. Absolute and relative bitrate of the elementary stream as a
percentage of the transport stream bitrate.
Technically, ECM is not a part of the program, but the program refer to ECM, so it is
displayed in the table. The several programs can refer to the same ECM.
The cursor is moved by using the « » and « » buttons. Additional information about
the elementary stream in the cursor position is displayed on the right side of the screen:
1) PID interval error, count. The number of times elementary stream packets
repetition period exceeds the defined limit during the analysis;
2) PTS interval error, count. The number of times PTS timestamps repetition
period exceeds the defined limit during the analysis. If the elementary stream
doesn’t have PTS timestamps or the elementary stream is encrypted, the «---»
value is displayed;
3) PTS repetition period, ms. The average repetition period of PTS timestamps in
ms. If the elementary stream doesn’t have PTS timestamps or the elementary
stream is encrypted, the «---» value is displayed;
4) PCR repetition error, count. The number of times PCR timestamps repetition
period exceeds the defined limit during the analysis;
5) PCR discontin. error, count. The number of times the difference of the
consecutive PCR timestamps counter values (PCRi – PCR
) is outside the
i-1
defined range during the analysis;
6) PCR repetition period, ms. The average PCR repetition period in ms;
7) PCR ассuracy error, count. The number of times PCR accuracy metric (jitter of
PCR timestamps source) is outside of the defined range during the analysis;
8) PCR FO/DR error, count. The number of times PCR timestamps frequency offset
or drift rate is outside the defined range during the analysis;
9) PCR accuracy, ns. The current RMS value of the PCR accuracy metric (jitter of
PCR timestamps source) in ns;
10) PCR freq. offset (FO), Hz. The current average PCR timestamps frequency
offset value in Hz. The value is displayed in gray color until the measurement
accuracy will achieve the optimal value (about 1 min since the beginning of the
analysis);
11) PCR drift rate (DR), mHz/s. The current RMS value of the PCR timestamps drift
rate mHz/s. The value is displayed in gray color until the measurement accuracy
will achieve the optimal value (about 1 min since the beginning of the analysis).
If the parameter value exceeds the defined range, it is displayed on the red
background.
Press «ENTER» or «F2 / PID» to switch to the PIDs list view with the cursor on the
PID of the selected elementary stream.
76
Page 77

4.6.8. PCR time domain monitoring
Time domain monitoring of program PCR timestamps allows to measure PCR
repetition period, PCR frequency offset etc., in real time with representing measuring
results in a form of a graph (figure 4.58).
Picture 4.58
Each of the graphs consists of three traces. Depending on the measured parameter,
the traces have the following meaning:
trace value parameter
trace 1 trace 2 trace 3
PCR accuracy (PCR source jitter) maximum RMS minimum
PCR repetition period maximum average minimum
PCR drift rate maximum RMS minimum
PCR frequency offset maximum average minimum
Each trace includes 300 time intervals. Depending on the user-defined measurement
duration, each time interval equals to:
Measurement
duration
Time interval,
sec
5 min 10 min 30 min 1 h 2 h 6 h 12 h 24 h 48 h 72 h
1 2 6 12 24 72 144 288 576 864
Each time interval accumulates parameter value according to trace type.
There is program name, its identifier (SID) and PCR PID identifier (PID) at the top of
the screen. The following information is indicated on the right of the screen: measured
parameter name, starting time and date of the interval and the measurement results in the
cursor position. Measurement results value color corresponds to the trace color. In case of
transport stream synchronization loss, corresponding time intervals is not shown on the
trace.
Monitoring setting up is performed in the «F1 / Settings» context menu:
1) Duration. Monitoring duration: 5 min, 10 min, 30 min, 1 h, 2 h, 6 h, 12 h, 24 h,
48 h, 72 h.
Selecting of the parameter to show on the graph is performed in «F2 / View» context
menu:
1) PCR accuracy. PCR timestamps source jitter;
2) PCR interval. PCR repetition period;
3) PCR drift rate;
4) PCR freq. offset. PCR frequency offset.
77
Page 78

Press «F3 / Start» to launch monitoring. Monitoring can be started only in case
transport stream analysis is in progress (section
4.6.2). The monitoring is continued when
leaving the mode. PCR monitoring only for one of the programs can be performed at a
time.
Press «F3 / Stop» to stop monitoring. Monitoring is automatically stopped in case the
set up time is over or transport stream analysis has finished (section 4.6.2). The
measurement results are saved for each program separately when leaving the mode, and
available on the screen on the following enter the mode.
To move the cursor, use the ◄ and ► keys. By pressing these keys along with the
Shift key, the cursor can be moved with a larger pitch.
4.6.9. Transport stream PIDs list
The transport stream PIDs list is a table of the PID identifiers which the transport
stream consists of, and their additional information (figure 4.59).
Figure 4.59
There is a PIDs list on the left side of the screen with the following information:
1) PID. The PID identifier value. If the PID contains errors, the identifier is displayed
on a red background;
2) CA. The indicator of the encrypted information transferred in this PID;
3) Content. The list of objects transferred in the PID (see below).
The cursor moves by using the « » and « » buttons. When pressed together with
the «Shift» button, the cursor moves on the several PIDs. Additional information is
displayed for the PID in the cursor position on the right side of the screen:
1) Bitrate, Mbit/s. The absolute and relative PID bitrate as a percentage of the
transport stream bitrate;
2) Packets count. The total number of the MPEG packets of the PID received
during the analysis. In case no packets received for PID, which is referenced by
the transport stream service information, the value is displayed on the red
background;
3) Scrambling. PID data encrypting status: – PID is transmitted without
encryption, (no background) - PID data is encrypted, (red background) – PID
data is encrypted, but according to the standard should not be (all PSI/SI tables
except EIT), CAT is not detected – PID data is encrypted, but CAT table is not
found in the transport stream;
4) Continuity error count. Number of continuity_count errors detected during the
analysis. If the value is more than 0, it is displayed on a red background;
78
Page 79

5) Unexpected PSI/SI count. The number of detected service information tables
(PSI/SI) that should not appear in this PID. If the value is more than 0, it is
displayed on a red background;
6) PID interval. The indicator of elementary stream repetition period exceeding the
defined limit: OK – no errors detected, ERROR – one or more errors are detected
(displayed on the red background);
7) Reference to PID. The indicator of the lack of reference to PID in the service
information tables (PSI/SI) of the transport stream. The parameter is displayed
only for PID without the reference and «not found» value is displayed on the red
background.
A list of the objects transmitted in the selected PID is displayed at the bottom of the
table («Contents» group):
1) the service information table (PSI/SI), as part of: PAT, CAT, PMT, NIT (the NIT
for the current network broadcast), NIT-oth (NIT for the broadcast networks
different from the current one), SDT (SDT for the current transport stream) SDT-
oth (SDT for transport streams different from the current one), EIT
(current/following event for the programs of the current transport stream) EIT-oth
(present/following event for the programs of the transport streams different from
the current one), EIT-sch (schedule for a few days for the programs of the current
transport streams), EIT-oth-sch (schedule for a few days for programs transport
streams different from the current one), BAT, TOT, TDT, ST, RST, TSDT;
2) VID. Video elementary stream;
3) AUD. Audio elementary stream;
4) DAT. Data elementary stream;
5) ECM. The messages stream of access control: information about the rules of
access to the channels and bouquets of the channels;
6) EMM. The messages stream of access management: information about the
authorization of subscribers and groups of subscribers, the cryptographic keys;
7) NULL. Staffing, transmitted in PID=0x1FFF.
Below the content description group, there is a field with the name of the program
that contains the selected PID, or the name of the program that references to the selected
PID. In case the several programs reference to the selected PID, the number of programs
is displayed instead of the program name.
If the object transmitting in the PID contains errors, its name is displayed on a red
background.
The cursor move through the PIDs which contain errors is performed by pressing the
«F1 / ◄Error» and «F6 / Error►» button. For the convenience of data analysis, it is
possible to display a PIDs list that is matched to the filter specified by the «F2 / Filter»
button context menu:
1) All. Display all the PIDs;
2) Erroneous. Display only the PIDs that contains the errors;
3) EMM/ECM. Display only EMM and ECM PIDs;
4) ES. Display only the elementary stream PIDs;
5) PSI/SI. Display only PIDs with the service information tables.
For elementary stream PIDs pressing the «F3 / Service» button leads to switching to
the programs list view with setting the cursor on the program the selected PID refer to.
By pressing the «F4 / Content» button, the context menu will appear that allows to
switch to one of the following modes:
1) For elementary streams (VID, AUD, DAT). Go to the program detailed information
view (section
4.6.7) with setting the cursor on the selected elementary stream;
79
Page 80

2) For service information tables (PSI/SI). Go to the service information tables tree
view (section
4.6.10) with setting the cursor on the selected table.
4.6.10. Transport stream service information tables tree
The Transport stream service information tables (PSI/SI) structure is represented as
a tree of nodes in the «key: value» format with the table data (figure 4.60).
Figure 4.60
The tree displays information about the service tables which are described in the
ISO/IEC 13818-1 and ETSI EN 300 468 standards.
Root nodes that contain a structured set of data are indicated with the « » (node
expanded) or «►» icon (node collapsed). If service information table or group of tables
contains one or more errors, the corresponding node is indicated with the icon, and the
node name is displayed in red color.
The cursor moves by using the « » and « » buttons. When pressed together with
the «Shift» button, the cursor moves on several nodes. When pressing the «►» button on
the root node, it expands. When pressing it again, the cursor moves to the first child node
of the root node. Press the «◄» button to move the cursor to the nearest root node. When
pressing the «◄» button again the selected root node is collapsed. When pressing the
«◄» button together with the «Shift» button, all root nodes of the branch in the cursor
position are collapsed, up to the main root node. Press the «F5 / Fold all» button to
collapse all the tree nodes. Press the «F1 / ◄Error» or «F6 / Error►» button to navigate
cursor among the nodes which contain errors.
There is a tree route map at the top of the window, which shows the names of the
nodes, separated by the «/» symbol. These nodes are the successive root nodes for the
node in the cursor position.
Press the «F3 / PID» button to switch to the PIDs list view (section 4.6.9) with setting
the cursor on the PID, which the selected table is transferred in.
Press the «ENTER» or «F2 / Info» button to view the detailed information about the
table in the cursor position. The table with additional information of the table appears on
the screen, as shown on the figure 4.57.
80
Page 81

Figure 4.61
There is the name and identification information of the selected table at the top of the
window. The table of detailed information contains the following parameters:
1) Table repetition period, ms. The average repetition period of all sections of the
table in ms. If the repetition period exceeds the defined limit, the value is
displayed on the red background;
2) Table repetition period above maximal limit, counter. The number of times
repetition period of all sections of the table exceeds defined limit during the
analysis. If the value is more than 0, it is displayed on the red background;
3) Section repetition period below minimal limit, counter. The number of times
any two sections of the table arrival interval is less than the defined limit during
the analysis. If the value is more than 0, it is displayed on the red background;
4) Table version changed, counter. The number of times the table version is
changed during the analysis;
5) CRC error, counter. The number of times CRC error in the table sections occurs
during the analysis. If the value is more than 0, it is displayed on the red
background;
6) Section 0 repetition period above maximal limit, counter. The number of
times the repetition period of section 0 of the EIT table (current/following event)
exceeds defined limit during the analysis. If the value is more than 0, it is
displayed on the red background;
7) Section 1 repetition period above maximal limit, counter. The number of
times the repetition period of section 1 of the EIT table (current/following event)
exceeds defined limit during the analysis. If the value is more than 0, it is
displayed on the red background;
8) Section 0 or 1 is not present, counter. The number of times the section 0 or 1
of the EIT table (current/ following event) is missing. If the value is more than 0, it
is displayed on the red background;
9) Time left since last table arrival, min. Time in minutes passed from the last time
the RST table appeared in the transport stream.
4.7. TV Video and Sound Analysis Procedure
4.7.1. General Information
The TV video and sound analyzer is used for real-time control of TV decoded signal.
The mode allows decoding signal, displaying video at the built-in display and controlling
audio at the built-in loudspeaker.
81
Page 82

4.7.2. TV Picture and Sound Analysis for Digital Channels
To start the TV picture and sound analysis mode for digital TV channels, set up the
frequency to the required TV channel in the Channel measurement mode (section 4.3.3).
After channel synchronization press the «F5 / Video» key. The table will appear on the
screen as shown in figure 4.62.
Figure 4.62
The table includes the list of all programs and their parameters in the current
transport stream: program name, its type, video codec, number of sound tracks and
encrypted program icon. Use « » and « » keys to select program. Press the keys
together with «Shift» to navigate through programs with bigger step.
To view the selected program, press the «F1 / Play» key. A video from the selected
service will appear on the screen (figure 4.63). Video and audio stream parameters are
indicated in the right part of the table. If 2 or more audio tracks available, select the
needed track using the «F3 / ◄Audio» and «F4 / Audio►» keys or «◄» or «►» keys
together with «Shift». To view the video in the full screen mode, press the «F1 / Zoom»
key. To go back to the current mode, press «EXIT» key.
Figure 4.63
To adjust the volume of the sound, press the «◄» or «►» key.
4.7.3. TV Video and Sound Analysis for Analog Channels
To start the TV video and sound analysis mode for analog TV channels, set up the
frequency to the required TV channel in the Channel measurement mode (section 4.3.3).
After channel synchronization press the «F4 / Video» key. A video will appear on the
screen (figure 4.64).
82
Page 83

Video and audio parameters are indicated in the right part of the table. To view the
picture in full screen mode, press the «F1 / Zoom» key. To go back to the current mode,
press «EXIT» key.
Figure 4.64
To adjust the volume of the sound, press the «◄» or «►» key.
4.8. MPEG Transport Stream Recording Procedure
This mode enables the real-time MPEG transport stream data recording in the
Analyzer internal memory. The mode becomes available upon pressing the F3 / Mode key
and selecting MPEG Recorder in the dropdown menu from the following modes:
1) Channel mode, for terrestrial TV channels (section 4.3.3);
2) Channel mode, for satellite TV channels (section 4.4.3);
3) MER/BER mode, for satellite TV channels (section 4.4.4);
4) IPTV mode, for the IPTV stream (section 4.5.2).
The mode is available only in case the synchronization with the MPEG transport
stream source is achieved.
The mode screen view is shown in figure 4.65.
Figure 4.65
The table includes the following information:
1) File. The name of file for stream recording.
2) Status. The current mode status: recording – the recording is in progress,
stopped – the recording is stopped.
3) Duration. The time of recording.
4) File Size. The current size of the recorded file.
83
Page 84

5) Drive. The drive for stream recording. The transport stream can be recorded only
to the Analyzer internal memory.
6) Free Space. Free space on the drive for recording. In case the drive is not
available
6
, Not available is displayed.
To set up the recording time, press the F1 / Settings key and select one of the
Duration values in the dropdown menu: 15 sec, 30 sec, 45 sec, 45 sec, 1 min, 3 min, 5
min. To be able to control the recording time manually, select the indef value.
To start the recording, press the F6 / Start key. The information on the transport
stream being recorded is updated in the real-time mode during recording.
To stop the recording, press the F6 / Stop key. The recoding can also be
automatically stopped by the Analyzer in the following cases:
1) The time of recording has achieved the preset duration;
2) The synchronization with the MPEG transport stream is lost;
3) No enough of free drive space;
4) The transport stream rate exceeds the file recording speed.
In case the recording is automatically stopped by the Analyzer, you will hear the beep
sound and see the message stating the reason of recording stop on the screen.
By pressing the F5 / i key the message will be displayed stating that the transport
stream can only be recorded in the Analyzer internal memory.
You can play or perform MPEG analysis of recorded transport stream files with File
Manager (section 4.9).
4.9. File Manager
4.9.1. General information
File manager is intended for controlling files on the Analyzer internal drive, as well as
on the USB flash drive, connected to the Analyzer. The file manager allows viewing,
deleting, copying and moving files, and well as drive formatting.
The file manager is accessed from any selected tab in the main selection menu. Use
the
and keys to set the icon in the bottom line of screen and select the
corresponding functional key. To return to the selection menu, use the EXIT key.
4.9.2. Operating File Manager
The file manager screen view is presented in fig.
4.66.
6
The internal drive is not available if the Analyzer is connected to the PC via USB.
84
Page 85

Figure 4.66
The name of the selected file type is indicated in the upper line of the screen. The
next line indicates the selected drive and free memory capacity. In case the drive is not
available or not formatted7, then the respective message is displayed.
The table of files includes the following information:
1) File selection identifier for operating a group of files;
2) . The identifier of file delete protection during file moving. Available only for
files containing measurement results;
3) Description. File description (channel data logger page name, LNB profile, etc.).
Can be unavailable for certain file types;
4) File name. File name in the file system;
5) Modified. Date and time of file editing;
6) Size. File size.
Only certain number of the table columns is indicated on the screen. To switch
between the visible table columns use the ◄ and ► keys.
To move the cursor through the file list, use the and keys. Press one of these
keys along with the Shift key to move the cursor by several positions.
The file table indicates the list of files for the selected file type and drive. The drive is
selected in the dropdown menu by pressing the F6 / Drive key, and the file type is
selected from the dropdown menu by pressing the F5 / Type key.
To arrange the files in the list using one of the parameters, press the F6 / Sort key on
the additional panel of functional keys (accessed by pressing the Shift key). Select the
parameter of sorting in the dropdown menu. Sorting is carried out in the reverse order by
the repeated selection of the parameter.
The file operation in the cursor position is selected from the dropdown menu
accessed by pressing the F1 / File key:
1) Open. Open a file. There are several opening options depending on the file type;
2) Move. Move a file from the current drive to another drive. If the file protection
identifier is set, the file cannot be deleted, but can only be copied from the current
drive to another drive;
3) Copy. Copy a file from the current disk to another disk;
4) Delete. Delete a file.
To select a group of files, set the cursor to the needed files successively and then
press the F2 / Select key or Shift + ENTER. The selection is cancelled by a repeated
action on the selected file. To select all files from the list, press the F3 / All key. All files
selection will be cancelled by the repeated pressing of this key.
The file group operation is selected from the dropdown menu accessed by the F1 /
Group key:
1) Move. Move a file group from the current drive to another drive. Files with the set
protection identifier can be copied but not deleted;
7
The Analyzer can operate only the FAT32 file system drives
85
Page 86

2) Copy. Copy a file group from the current drive to another drive;
3) Delete. Delete a file group;
4) Deselect. Cancel a file group selection.
Press the F4 / Special key to access the dropdown menu of special functions
selection:
1) Move data. Move all files of measurement results from the internal drive to the
connected USB flash drive. Files with the set protection identifier cannot be
copied or deleted. This function can be used in field in case there is not enough
free memory space on the internal drive to save new measurement results, and a
high-capacity external USB flash drive available;
2) Format drive. Format the selected drive. All files will be deleted after the drive is
formatted!
The following rules are used for copying and moving files:
1) If a file type has a Description identifier, then in case the description of the file
being copied or moved matches the description of one of the files on the target
drive, one of the following actions will be offered: copy/move file with replacement,
save both files, cancel file copying/moving;
2) The file name is generated by the Analyzer automatically. Thus if the
copied/moved file name is the same as the name of one of the files on the target
drive, this is not treated as a conflict. In this case, the file being copied or moved
will be assigned with a unique name.
4.10. Setup and Test Modes
4.10.1. Self-Test Mode
The self-test mode is used for checking the performance of the IT-100 components
and their functional condition. The
icon in the main menu corresponds to this mode.
The screen view of this mode is shown in figure 4.67:
Figure 4.67
The table includes the following parameters to be checked:
1) Battery. Battery voltage and charge status.
2) Internal disk. Status and volume of free internal memory of the
Analyzer.
3) External disk. Status and volume of free external memory of the
Analyzer.
4) Temperature. Temperature inside the Analyzer.
5) Calibration. Status of the Analyzer calibration tables.
86
Page 87

6) Devices. Condition of the Analyzer components.
4.10.2. Regional Parameters Setting
Regional parameters setting program is used for the Analyzer adaptation to local
conditions for the ease of use. The
icon in the main mode corresponds to this mode.
The screen view is shown in figure 4.68.
Figure 4.68
The table includes the following parameters to be edited:
1) Language. Selection of graphical interface language.
2) Date format. Selection of date indication format.
3) Time format. Selection of time indication format.
4) Time zone. Selection of time zone.
5) Auto day saving time shift. Selection of auto day saving time shift.
6) Temperature units. Selection of temperature measurement units.
7) Distance units. Selection of distance measurement units.
8) Decimal separator. Selection of decimal separator symbol.
9) CSV files delimiter. Selection of CSV files delimiter.
The parameters are selected using the « » and « » keys and modified using the
«◄» and «►» keys.
4.10.3. Analyzer Operation Parameters Setting
The Analyzer parameters setting program is used for setting general modes of
Analyzer operation. The icon in the main menu corresponds to this mode. The screen
mode is shown in figure
4.69:
87
Page 88

Figure 4.69
The table includes the following parameters to be edited:
1) Color theme. Selection of a color set of graphical interface elements.
2) Key sound. Selection of key pressing sound or disabling key pressing
sound.
3) Volume. Adjustment of audio volume.
4) Date. Setting the date.
5) Time. Setting the time.
6) Auto power off. Setting auto analyzer power off mode.
7) Quick start. Setting the Analyzer starting mode.
To select a parameter, use the « » and « » keys. To modify a parameter, use the
«◄» and «►» keys.
The Auto power off parameter allows to automatically switch the Analyzer off when
no keys are pressed during a selected time interval.
The Quick start parameter allows selecting the Analyzer switching on method. If the
parameter is set to off, the Analyzer switches on in the Main menu mode. If the parameter
is set to on, the last used before switching the Analyzer off measurement mode is opened
after switching the Analyzer on.
4.10.4. Identification Data Readout
The identification data readout program is used for indication of the Analyzer serial
number and modification, firmware version, network addresses and names. It also displays
the checksum of metrologically significant part of the firmware. The mode allows updating
the Analyzer firmware. The icon in the main menu corresponds to this mode. The
screen view is shown in figure 4.70:
Figure 4.70
88
Page 89

4.10.5. Network Parameters Setting
The network parameters setting mode is used to determine and modify the current
network parameters. The mode also allows updating the Analyzer firmware. The icon
in the main menu corresponds to this mode. The screen view is shown in figure 4.71:
Figure 4.71
The network interface of the device is the ETHERNET port. The device is capable of
working with a static IP address, as well as with a dynamic IP address, with a DHCP
protocol assignment. The device can make registration on a remote DNS server, which
address can be specified statically, or dynamically, with the DHCP protocol assignment. In
this case, the device can be accessed from other devices in the network not only by its IP
address, but also by the device name "it100-XXXXXXXXXXXX", where XXXXXXXXXXXX
is the serial number of the device.
In the mode, the following items are provided for setup and viewing:
1) Dynamic IP address (DHCP). Enable / disable the automatic assignment
of the IP address of the device via the DHCP
protocol.
2) IP address. Setting the IP address of the device. The setting is not
available in the automatic IP address assignment mode.
3) Subnet mask. Setting the subnet mask. The setting is not available in the
automatic IP address assignment mode.
4) Default gateway. Setting the IP address of the subnet default gateway. The
setting is not available in the automatic IP address
assignment mode.
5) Obtain DNS server address auto. Enabling / disabling automatic
detecting IP address of DNS server via DHCP protocol.
The setting is present only in the mode of automatic IP
address assignment.
6) DNS server use. Enabling / disabling the use of the DNS server. The setting
is present only in the manual IP address assignment
mode.
7) DNS server address. Setting the IP address of the DNS server. The setting is
available only if the use of the DNS server is turned on
and the automatic detection of the IP address of the DNS
server is turned off.
8) MAC address. Indication of the unique MAC address of the device's
network interface.
9) TCP/IP host name. Indication of the unit's name, using which it is possible to
access the device from the network.
89
Page 90

When operating in the automatic IP address assignment mode, in the items "IP
address", "Subnet mask" and "Default gateway" the values are displayed assigned by
the DHCP server, or one of the following messages:
1) No link detected. The network cable is not connected to the ETHERNET
port of the device;
2) Not assigned yet. The corresponding parameter is not yet defined;
The similar behavior is used for the item "DNS server address".
To apply the settings without exiting the operation mode, press the «F2 / Note»
button. To apply the settings with exit into the main menu, press the «F1 / Save» button.
To exit to the main menu and cancel the changes, press the «F6 / Cancel» button.
4.11. Taking screenshot
To save the current screenshot to file, press the Shift and 8 / keys
simultaneously. A message indicating the file name and the drive to which the file was
saved will be shown on the screen. If an external flash drive is connected to the USB port,
the file will be saved to it. Otherwise, the file will be saved in the internal Analyzer memory.
The screenshot is saved in the PNG format with assignment of an ordinal number in the
file name and located in the IT100MEM\SNAPSHOT section of the drive root directory.
Previously saved screenshot can be viewed it the File Manager (section
4.9) when
«Screen snapshot» file type is selected.
4.12. Analyzer Firmware Updating
The IT-100 Analyzer allows updating its firmware without the use of any additional
equipment. We continue development of the Analyzer and keep on working out new
firmware and software versions that provide new features. These new versions come
available for free download on our website www.planarchel.ru in the section that describes
IT-100.
The firmware version includes updating the central processing unit (CPU) program
and the auxiliary processing unit (APU) program. Each version has its unique identification
number in the X.X.X.X format (for example, 2.0.1.0). File with the firmware build for
downloading has the it100_build_YYYYYY.bs2 format, which includes the device type and
the build identification number (YYYYYY). The CPU and APU versions can be viewed in
the identification data readout mode (section 4.10.4).
4.12.1. Regular Firmware Updating Procedure
To enter the firmware updating mode from the identification data readout mode
(section 4.10.4), press the «F6 / Update» key.
The mode displays the table of firmware files search sources:
1) Manufacturer server. Firmware updating files are searched on the
Analyzer manufacturer’s server, in case the Analyzer
has access to the Internet.
2) USB flash drive. Firmware updating files are searched in the root
partition of the USB flash drive, connected to the
Analyzer.
3) Internal memory. Firmware updating files are searched in the root
partition of the Analyzer internal memory. The
firmware updating files can be copied to the internal
memory when the Analyzer is connected to a PC via
90
Page 91

USB. In this case the operating system recognizes
the device as a removable medium named IT-100.
The firmware updating files search result for different sources is indicated by the
following messages:
1) connecting… the Analyzer is connecting with the remote server;
2) no Internet connection the Analyzer is not connected to any network;
3) failed to connect the Analyzer did not connect with the remote server;
4) not found USB flash drive was not found;
5) not available internal memory is not available because the
Analyzer is connected to a PC via USB;
6) not formatted the USB flash drive or internal memory is not
formatted or format differs from FAT32;
7) fault hardware error during USB flash drive or internal
memory operation;
8) files found firmware updating files found;
9) no files found firmware updating files not found.
To start the firmware updating procedure, proceed as follows:
1) Select the source with the updating firmware found and press the «F6 / Select» or
«ENTER» key;
2) Confirm the selection by pressing the «F6 / Yes» key in the dialog box;
3) If the updating source is the manufacturer’s server or the internal memory, and the
Analyzer is connected to a PC via USB, disconnect the Analyzer from the PC to
start updating;
4) If the updating source is the manufacturer’s server, the firmware updating file will
be uploaded to the Analyzer internal memory. Loading progress is indicated on
the screen;
5) When the file is uploaded, the Analyzer will automatically restart, open the loader
mode and start the firmware updating process;
6) If the firmware updating file has the same version as the Analyzer firmware, then
the loader panel will display the following message “File firmware version is
identical to device firmware version”. Updating can be started by force using
the F1 key;
7) If the firmware updating file version is lower than the Analyzer firmware version,
then the loader panel will display the following message “File is not compatible
with the device firmware version”. Updating can be started by force using the
F1 key.
The firmware updating process is indicated at the progress bar. If the firmware
updating is completed successfully, the Analyzer will start with the new program.
4.12.2. Emergency Firmware Updating Procedure
If the Analyzer firmware updating mode cannot be started as in case of program
hang-up, the firmware can be updated as follows:
1) Power the Analyzer off, press and hold the «clear» key down. Switch the Analyzer
on;
2) When the screen displays information, release the key;
3) Wait until you see the following message in the bottom of the panel “>> Plug
source with a valid file…”.
To update firmware using the file stored in the internal memory of the Analyzer,
proceed as follows:
1) Connect the Analyzer to a PC using a USB cable;
2) Wait until you see the IT-100 removable disk in the operating system ;
91
Page 92

3) Copy the bs2 firmware updating file to the IT-100 disk root partition;
4) Disconnect the Analyzer from the PC;
5) Wait until the firmware updating process is completed.
To update firmware using the file stored at the USB flash drive:
1) Copy the bs2 firmware updating file to the flash drive root partition;
2) Connect the USB flash drive to the Analyzer;
3) Wait until the firmware updating process is completed.
The firmware updating process is indicated at the progress bar. If the firmware
updating is completed successfully, the Analyzer will start with the new program.
4.13. Analyzer Remote Control
Remote control of the device allows to send commands to the Analyzer from the
distant PC, get access to the Analyzer’s desktop, and also work with the files of the
internal drive of the Analyzer.
Remote control is provided through ETHERNET interface. Before starting please
make sure, the Analyzer network interface is set up (section
4.10.5). Antivirus software
and firewall on the distant PC should not block applications for remote control.
4.13.1. Remote Desktop
Access to the Analyzer remote desktop is performed via VNC protocol. To control the
Analyzer on the distant PC, you need to install any of the available VNC clients (for
example, UltraVNC, TightVNC or RealVNC). Testing was executed by using the VNC
client UltraVNC Viewer version 1.2.1.7. The program settings for working with the Analyzer
(picture 4.72) is shown below:
Figure 4.72
To configure you should complete the following actions:
1) In the «VNC Server» window you should select IP address or the Analyzer’s
domain name which the connection is made to;
2) Choose the «MANUAL» option in the «Quick Options» menu;
3) Set the «Save connection settings as default» mark to use the specified
settings as the default settings for subsequent program launches;
4) Press the «Options…» button to activate manual setting;
5) In the appeared window set the «Auto select best settings» mark in the
«Format and Encoding» menu;
6) Set the «Japanese keyboard» mark in «Mouse and keyboard» menu;
7) Press the «OK» button to accept modifications;
92
Page 93

8) Press the «Connect» button in the Main Menu to set the connection with the
Analyzer.
When configuring other VNC clients please note that the Analyzer supports Raw,
ZRLE and Hextile encoding only.
After connection with the Analyzer is established the image of the Analyzer with the
keyboard and the display appears on the PC screen (Figure
4.73).
Figure 4.73
When you remotely operate the Analyzer, you should remember about the following
features:
1) The Analyzer can be operated by pressing the left mouse button above the image
one of the Analyzer’s buttons on the PC screen;
2) The Analyzer can be operated by pressing the following buttons on the PC
keyboard: F1…F6 – the buttons of the functional group, 0…9 – the buttons of the
alphabetic-numeric group, Enter – the «ENTER» button, Esc – the «EXIT»
button, space – the «.space» button, backspace – the «clear» button, Shift –
the «Shift» button, Up/Down/Left/Right – the navigation buttons;
3) The Analyzer restart button is available instead of the power off button;
4) When you press the «Shift» button with the mouse button a red circle marker will
appear on the buttons image. This red circle marker shows the button is pressed.
This operations logic allows you to press the «Shift» button together with the other
keys;
5) When you press Ctrl+Alt+Shift combination on the keyboard of the distant PC the
«Shift» button passes into the pressed state (see chapter 4).
4.13.2. Operating Internal Drive
Access to the internal disk files is performed via the FTP protocol. To operate the
files, you need to install any of the available FTP clients on the distant PC (for example,
FileZilla, FireFTP or SmartFTP).
As a rule most of clients don’t need to set additional setting except specifying the
Analyzer’s IP address or domain name which the connection is made to.
There are 2 drives in the FTP root directory of the Analyzer’s server:
1) /INTERNAL. The internal drive. Unavailable if the Analyzer is connected to the
PC via USB;
2) /USB0. USB - flash disk connected to the Analyzer.
93
Page 94

4.14. Measurement results output via USB interface
4.14.1. General information
The function of measurement results output via the USB interface can be used for
receiving and processing the measurement results in the real time with third party
Software.
For activation the function, it is necessary to perform the following actions:
1) activate the option «output measurement results via USB» in the operatiтп
mode settings of the terrestrial or the satellite TV (section 4.3.2 and 4.4.2);
2) connect the device to the PC with USB cable;
3) set the virtual COM-port driver (available on request).
For transfering the data by the Analyzer, it is necessary to enter to the one of the
measurement modes that support this function (see below) and setup the measurement
parameters (set an averaging factor, select the channel, etc.).
4.14.2. Message format
The messages sent by the device are the set of the ASCII encoded text lines. Each
line begins with the 10-digits timestamp in ms, since the Analyzer is started up. The line is
ended with the sequence of symbols with 0x0D code (carriage return) and 0x0A code (line
feed).
When numerical values are displayed, the separator of the integer and fractional
parts specified in the regional settings of the device is used (section 4.10.2). After the
numerical values, the measurement unit is specified that is separated from the number by
the space symbol.
The appearance of messages not regulated by the Operating Manual is acceptable.
The example of the text messages sequence is shown below:
0006755820 LEVEL = 64.7 dBuV
0006756310 LEVEL = 64.6 dBuV
0006756820 LEVEL = 64.6 dBuV
0006757060 LOCKED (DVB-T2/32k/QAM64/PLP=0)
0006757330 LEVEL = 64.3 dBuV
0006758860 LEVEL = 64.3 dBuV
0006759130 MER = 33.9 dB
0006759240 BER0 < 1.8E-07
0006759390 LEVEL = 64.4 dBuV
0006759910 LEVEL = 64.3 dBuV
4.14.3. Messages of channel measurement results
The messages with channel measurement results are available from the following
operating modes:
1) Terrestrial or Cable TV channel measurement mode (section 4.3.3);
2) Satellite transponder parameters measurement in the Channel mode (section
4.4.3);
3) Satellite transponder parameters measurement in the MER/BER mode (section
4.4.4).
The following message types are available8:
8
Here and elsewhere, the symbol «_» corresponds to the space symbol, and the symbol «|» separates the possible
variants of the substrings.
94
Page 95

1) LEVEL_=_X_dBuV|dBmV|dBm. The current channel or transponder level is the
X (one decimal place);
2) SNR_=_X_dB. The current value of signal-to-noise ratio is the X value (one
decimal place);
3) V/A1_=_X_dB. The current value of level-to-audio ratio (mono audio subcarrier)
of the analog channel is the X (one decimal point);
4) V/A2_=_X_dB. The current value of level-to-audio ratio (additional audio
subcarrier for stereo broadcasting) of the analog channel is the X (one decimal
point);
5) LOCKED_(X). Synchronization with the channel is set, X - channel parameters in
one of the following formats:
a. Analog/X-Y. Analog channel, X - the color system (PAL, SECAM or NTSC),
and Y – the analog broadcasting standard (B, D, G, H, I, K, L, L’, M or N);
b. DVB-C/X/Y. DVB-C channel, X – the constellation type (QAM64, QAM128 or
QAM256), and Y – the symbol rate in MSymb/s (3 decimal places);
c. J.83-B/X/Y. J.83-B channel, X – the constellation type (QAM64 or QAM256),
and Y – the symbol rate in MSymb/s (3 decimal places);
d. J.83-C/X/Y. J.83-C channel, X – the constellation type (QAM64, QAM128 or
QAM256), and Y – the symbol rate in MSymb/s (3 decimal places);
e. DVB-T/X/Y. DVB-T channel, X – FFT type (2k or 8k), and Y – the constellation
type of subcarriers (QPSK, QAM16 or QAM64);
f. DVB-T2/X/Y/PLP=Z. DVB-T2 channel, X – FFT type (1k, 2k, 4k, 8k, 16k or
32k), Y – the constellation type of subcarriers (QPSK, QAM16, QAM64 or
QAM256), and Z – the identifier of the receiving PLP logical steam;
g. DVB-S/X/Y. DVB-S transponder, X – the constellation type (QPSK), and Y –
the symbol rate in kSymb/s;
h. DVB-S2/X/Y/ISI=Z. DVB-S2 transponder, X – the constellation type (QPSK,
8PSK, 16APSK or 32APSK), Y – the symbol rate in kSymb/s, and Z – the
identifier of the receiving ISI logical steam;
i. FM. FM radio;
j. ?. Unknown type channel;
6) UNLOCKED. Synchronization with the channel is lost;
7) MER_=|<|>_X_dB. The current channel MER value is equal/less/more than X
(one decimal point);
8) MARGIN_=|<|>_X_dB. The current value of the noise margin to the quasi-errorfree decoding point is equal/less/more than the X (one decimal point);
9) BER1_=|<|>_X. The current BER value before the decoders is equal/less/more
than X (scientific notation with one decimal point, for example, 1.0E-09). For DVBC and J.83-C – BER before the Reed-Solomon decoder, DVB-T and DVB-S –
BER before the Viterbi decoder, DVB-T2 and DVB-S2 – BER before the LDPC
decoder;
10) BER2_=|<|>_X. The current BER value after the first decoder is equal/less/more
than X (scientific notation with one decimal point, for example, 1.0E-09). For J.83B, DVB-S and DVB-T – BER before the Reed-Solomon decoder, DVB-T2 and
DVB-S2 – BER before the BCH decoder;
11) BER3_=|<|>_X_(Y_bad_packets). The current PER value at the output of the last
decoder is equal/less/more than X (scientific notation with one decimal point, for
example, 1.0 E-09). Y – the number of uncorrected MPEG packets at the output of
the decoder (that is the accumulative counter in case the averaging is switched on
in the measurement mode settings). For DVB-C, J.83-B, J.83-C, DVB-T and
DVB–S – PER after the Reed-Solomon decoder, for DVB-T2 and DVB-S2 – PER
after the BCH decoder;
12) FATAL_ERROR_(X). The fatal error occurred, X - the error description. Please
contact the Analyzer’s manufacturer to fix the error.
95
Page 96
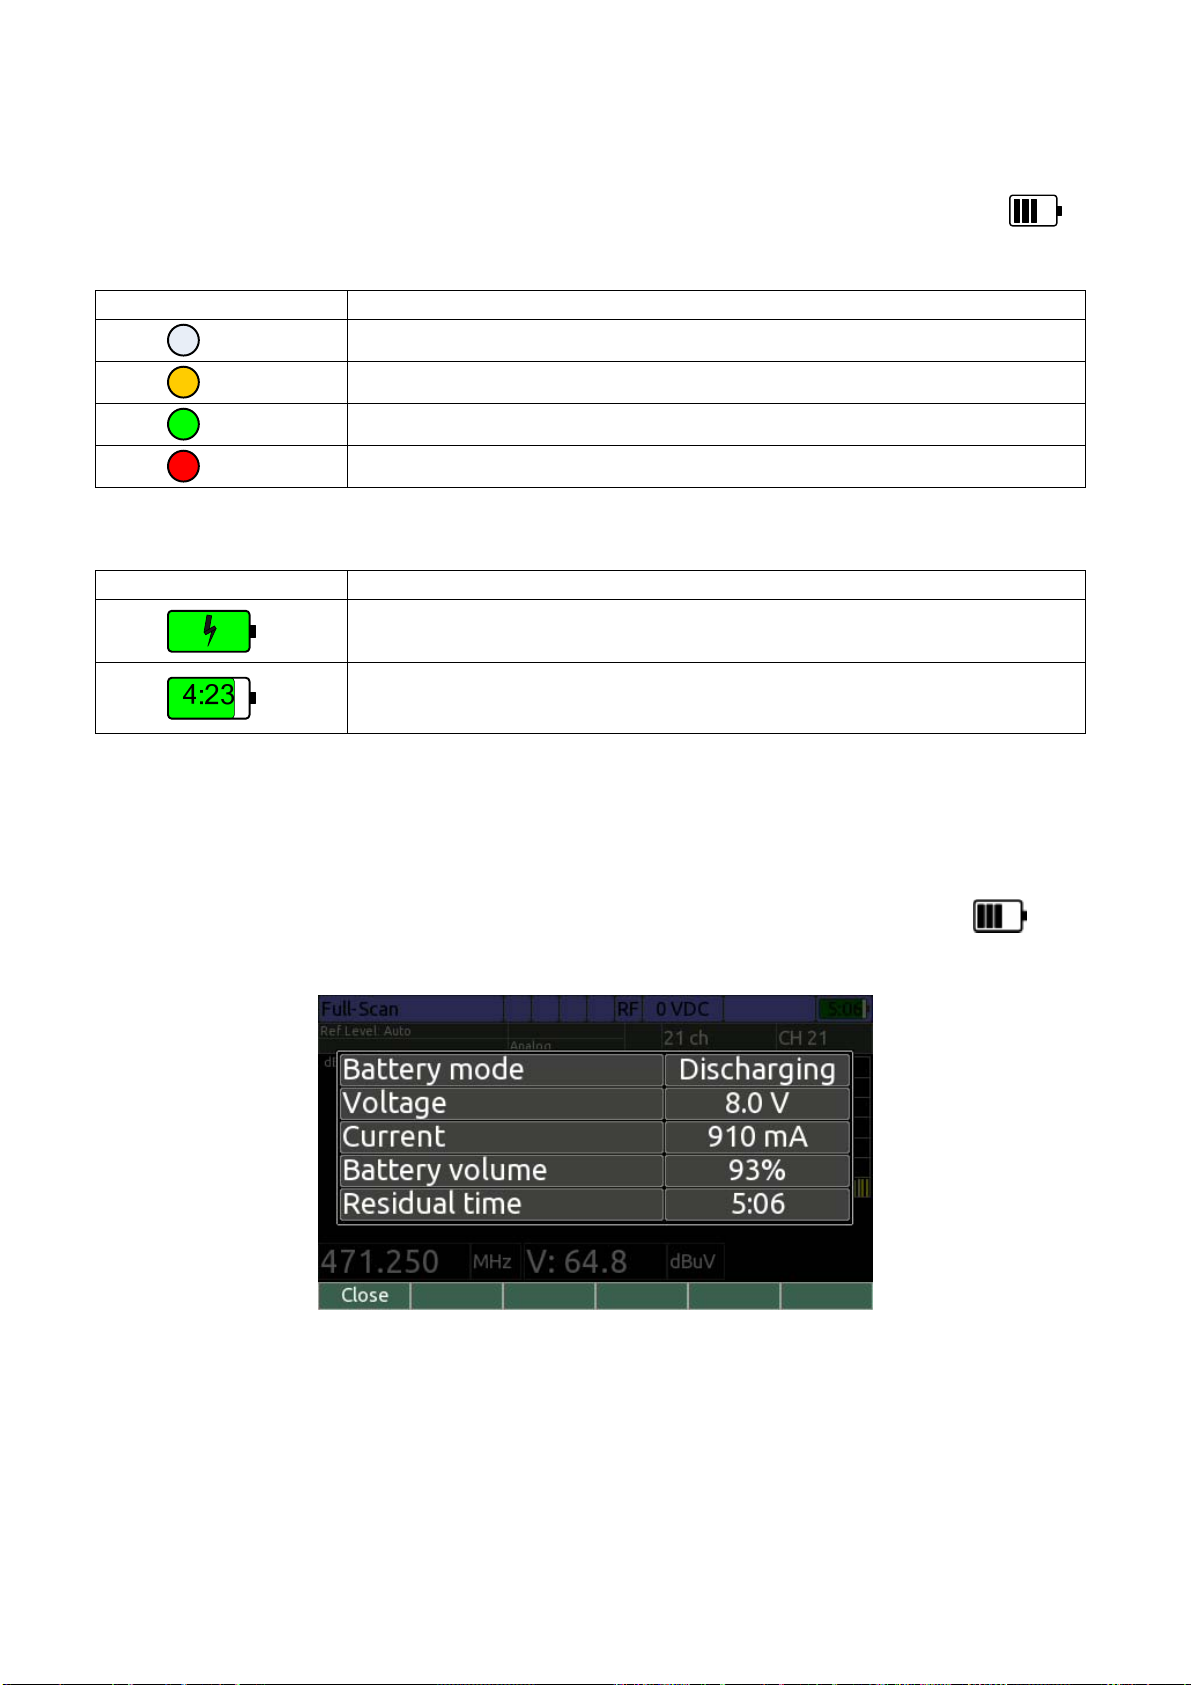
4.15. Battery Operation
As an integrated power source in the analyzer is used a Lithium-ion battery with a
voltage of 7.4V and a capacity of not less than 4000 mAh.
The battery status and operating mode are signaled in several ways. The « »
LED on the front panel of the IT-100 signals the charging mode of the battery:
Indication Battery charge status
No voltage from external charger.
Battery is charging.
Battery is charged.
Battery failure.
The icon in the upper right corner of the display shows the battery charge mode:
Indication Battery operation mode and status
Battery is charging.
Battery is discharging. Remaining capacity and the remaining
operating time.
When detecting a battery failure during charging, the icon's background becomes red.
The length of the color bar displays the value of remaining charge. When the charge is
more than 30%, the color of the bar is green. The color changes to yellow when the
capacity decreases and turns red at less than 15%.
For more information about the operating mode and battery status, run the diagnostic
mode by pressing the «Shift» button and then without releasing it press the « / 7»
button. The battery diagnostic mode will appear on the display as shown in figure 4.74:
Figure 4.74
The current battery mode is displayed in the mode window: Discharging / Charging
/ Charged. There are also displayed the current values of power, current, remaining level
of charge and operating time. To exit the mode, press the «EXIT» key.
When operating from the battery and capacity reducing to a critical level, the analyzer
displays the charge level indicator red. In a while the analyzer will automatically turn off.
To charge the battery, connect the external power source which is included in the
delivery set and provide the power supply. The batteries will charge even if IT-100 power
96
Page 97

is not turned on. The « » indicator signals the power supply from the charger and
indicates the battery charge mode. The yellow color of the indicator means the process of
battery charge. Appearance of a green indicator means that the battery is charged
approximately 80%. To charge the battery fully it is recommended to charge within one
more hour. If the battery is charged during operation of the analyzer, the charge time will
increase. The battery charge should be performed at an ambient temperature from 0 to
+40 0С.
5. MAINTENANCE
Required maintenance is limited to observation of instructions related to proper
operation, storage, and shipment, which are supplied in this Manual and also minor
defects correction.
Perform preventive inspections covering check of controls, reliability of the assembly,
and the keypad condition after the warranty period has expired and annually since then.
6. TROUBLESHOOTING
Defect detection: After the Analyzer is switched on, nothing is displayed on the
screen and there is no backlight.
Possible reason: Extremely low charge, malfunction or one or several batteries
missing.
Methods of correction: To check the Analyzer condition, connect it to the Mains
Charger. If the Analyzer switches on, check the battery
voltage in Self-Test mode (section 4.10.1). Low voltage
(under 7 V) indicates that the battery is discharged or
malfunctioning. Charge the battery in case it is low or
contact the repair service to replace the malfunctioning
battery.
Possible reason: Firmware failure.
Methods of correction: Install the firmware from external PC (section 4.12).
Defect detection: High error at radio signal level measurements.
Possible reason: Incorrect setting of the input attenuation value.
Methods of correction: Check the reference level setting in the measurement
mode («F1 / Settings») (sections
4.4.5). If the reference level selection is complicated, set
4.3.3, 4.3.4, 4.3.5, 4.4.3,
the Auto selection mode.
Possible reason: Damage of the RF input adapter.
Methods of correction: Replace the input adapter.
Possible reason: Incorrect setting of channel plan or channel template as a result
of which the Analyzer tunes to frequency offset channel. This
can be checked in the spectrum analysis mode.
Methods of correction: Adjust the channel plan (section 4.3.12). Check the
selected channel template: Channel template
(section 4.3.2).
Defect detection: the Analyzer fails to switch off by pressing the « » key briefly.
Possible reason: Firmware failure.
Methods of correction: Unplug the Mains Charger power connector. Press and
hold the «
» key until the power switches off.
97
Page 98

Defect detection: the Analyzer drive is not available when connected to PC, or OS
requesting for USB driver.
Possible reason: Measurement results output via USB interface is enabled in
terrestrial or satellite settings menu.
Methods of correction: Disable measurement results output via USB interface
(section
4.3.2, 4.4.2).
7. STORAGE
Store your IT-100 Analyzer under the following conditions: environment temperature
from -20 to +40 С, relative humidity up to 90 % (at 30 С).
0 0
8. TRANSPORTATION
The IT-100 Analyzer must be shipped in any closed vehicle at temperature from -20
to +40 0С, relative humidity 90% (at 30 0С) and atmospheric pressure of 84 to 106.7 kPa
(630 to 800 mm Hg).
Cargo holds, railway cars, containers, and truck beds, utilized for shipment of the
Analyzer should be free from any traces of cement, coal, chemicals, etc. When shipped by
air the products should be kept in aircraft sealed compartments.
9. LABELING
The serial numbers of Analyzer, which contain index number and date-ofmanufacture code, can be found on the bottom panel of the respective item and also can
be viewed on the display in identification data readout program (section 4.10.4).
10. WARRANTY INFORMATION
The manufacturer warrants the IT-100 Multisystem TV Analyzer to conform to the
specifications of this Manual when used in accordance with the regulations detailed in this
Manual.
The manufacturer will repair or replace without charge, at its option, any IT-100
Multisystem TV Analyzer found defective in manufacture within the warranty period, which
is twelve (12) months from the date of purchase. Should the user fail to submit the
warranty card appropriately certified by the seller with its stamp and date of purchase the
warranty period will be determined by the date of manufacture.
The warranty is considered void if:
1) the defect or damage is caused by improper storage, misuse, neglect, inadequate
maintenance, or accident;
2) the product is tampered with, modified or repaired by an unauthorized party;
3) the product's seals are tampered with;
4) the product has mechanical damage.
The battery is not included or covered by this warranty.
Transport risks and costs to and from the manufacturer or the authorized service
centers are sustained by the buyer.
The manufacturer is not liable for direct or indirect damage of any kind to people or
goods caused by the use of the product and/or suspension of use due to eventual repairs.
When returning the faulty product please include the accurate details of this product
and clear description of the fault. The manufacturer reserves the right to check the product
in its laboratories to verify the foundation of the claim.
98
 Loading...