

Page 1
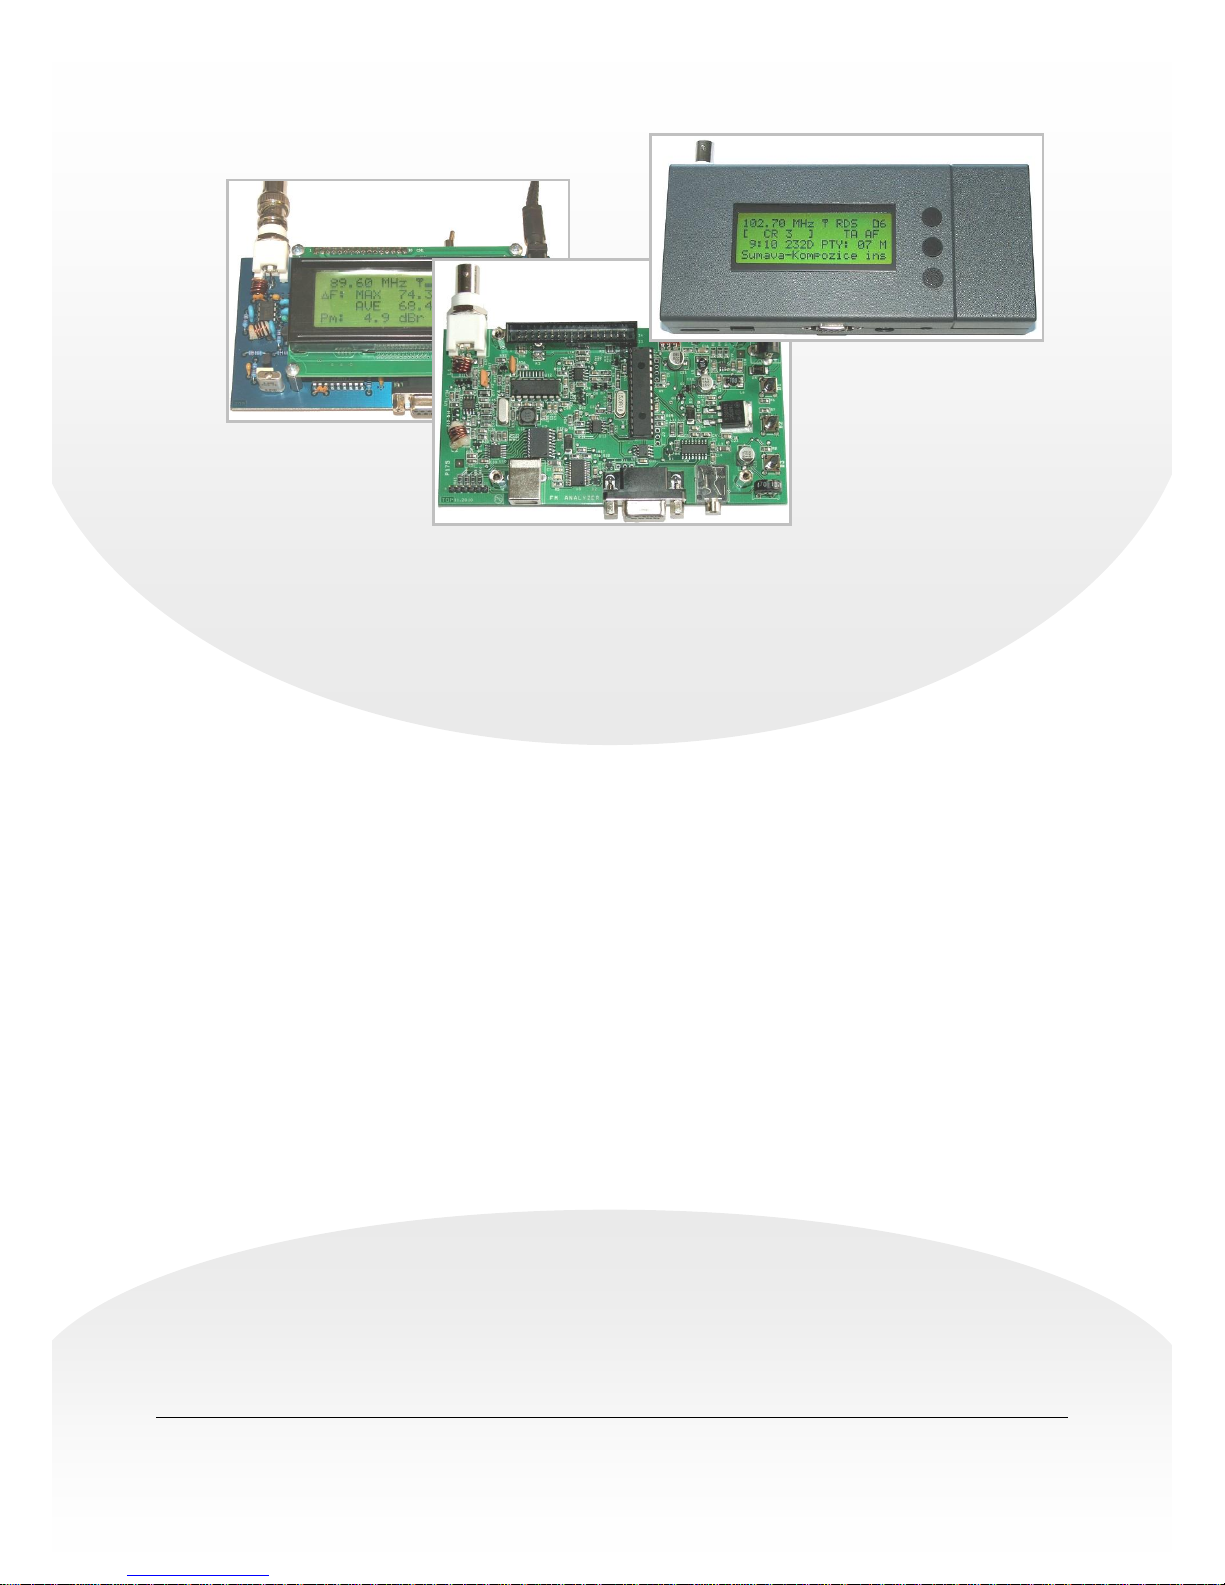
PIRA75 / P175
FM Broadcast Analyzer
User Manual
Firmware version 1.5 rev. 2
Web: http://www.pira.cz E-mail: [email protected]
Page 2

2
Table of Contents
Related Documents ........................................................................................................................................................... 2
Introduction ...................................................................................................................................................................... 3
Main highlights ...................................................................................................................................................................................3
Measurements, indications and outputs ...............................................................................................................................................3
Technical Specifications ................................................................................................................................................... 4
Power supply (P75) .............................................................................................................................................................................6
Power supply (P175) ...........................................................................................................................................................................6
Mainboard composition (P75) .............................................................................................................................................................7
Mainboard composition (P175) ...........................................................................................................................................................8
Alarm outputs (P175) ..........................................................................................................................................................................9
Operating Instructions ................................................................................................................................................... 10
Power-up ........................................................................................................................................................................................... 10
Control buttons .................................................................................................................................................................................. 10
Operating modes ............................................................................................................................................................................... 10
Menu ................................................................................................................................................................................................. 10
Measurements ................................................................................................................................................................. 12
Signal quality .................................................................................................................................................................................... 12
Overall frequency deviation (peak frequency deviation)................................................................................................................... 14
Pilot deviation ................................................................................................................................................................................... 14
RDS deviation ................................................................................................................................................................................... 14
Pilot-to-RDS phase difference........................................................................................................................................................... 15
Modulation power (MPX power, Pm) ................................................................................................................................................ 15
Frequency deviation histogram ......................................................................................................................................................... 16
Service details (P75) ......................................................................................................................................................................... 17
Service details (P175) ....................................................................................................................................................................... 17
Simple stereo balance meter .............................................................................................................................................................. 17
Carrier frequency offset .................................................................................................................................................................... 18
Radio Data System decoding ............................................................................................................................................................ 19
USB and COM Port Communication ........................................................................................................................... 23
Connecting the FM analyzer to a PC ................................................................................................................................................. 23
List of commands and configuration registers................................................................................................................................... 23
Service Part ..................................................................................................................................................................... 28
Firmware update ............................................................................................................................................................................... 28
Superheterodyne receiver ganging .................................................................................................................................................... 28
Annexes ............................................................................................................................................................................ 29
Memory map ..................................................................................................................................................................................... 29
Related Documents
Visit the Website for the latest documentation version and the following additional documentation:
FM Scope - User Guide (http://pira.cz/fm_broadcast_analyzer/fmscope.pdf)
RDS Spy - RDS Decoder for Windows (http://rdsspy.com/download/mainapp/rdsspy.pdf)
Page 3

3
Introduction
The P75 and P175 FM Broadcast Analyzer is a stand-alone low-cost solution for FM broadcast analysis.
It provides complete FM modulation and basic AF spectrum measurements in FM radio band through the
antenna input.
Built-in LCD display and control interface allows to measure and collect data in terrain without need of
any PC computer. Serial interface and the control software provide a possibility of remote control, data
viewing and automated data logging.
This kind of analyzer is essential equipment for all FM radio stations to ensure compliance with basic
technical broadcast standards and to accomplish the highest audio quality possible.
Main highlights
Stand-alone design, completely DSP based from IF to outputs
Compliant with CEPT/ERC REC 54-01 E and ITU-R SM.1268
Dual-conversion receiver
Built-in LCD display and RS-232 interface
Built-in USB interface (P175)
Firmware updates are free
Easy to use
Measurements, indications and outputs
Overall frequency deviation incl. histogram
Modulation power (MPX power)
Baseband spectrum, RF carrier spectrum
Pilot deviation
RDS deviation
Pilot-to-RDS phase difference
FM carrier frequency offset
Reception quality and signal strength
Stereo balance meter
Headphones audio output
Alarm logic or general purpose outputs (P175)
RDS/RBDS decoder
Please read this entire manual and familiarize yourself with the controls before attempting to use this equipment.
The equipment has been thoroughly tested and found to be in proper operating condition when shipped. The
manufacturer is not liable for any damages, including but not limited to, lost profits, lost savings, or other incidental or
consequential damages arising out of the use of this product.
No part of this manual may be reproduced or transmitted in any form or by any means, electronic or mechanical,
including photocopying, recording or information storage and retrieval systems, for any purpose other than the
purchaser's personal use.
It is our intention to provide you with the best documentation possible to ensure successful use of the product. If you
wish to provide your comments on organization, clarity, subject matter and ways in which our documentation can better
serve you, please mail us your comments.
Information in this document is subject to change without notice.
Revision: 2016-10-05
Copyright © 1999-2016 Pira.cz
Page 4
4
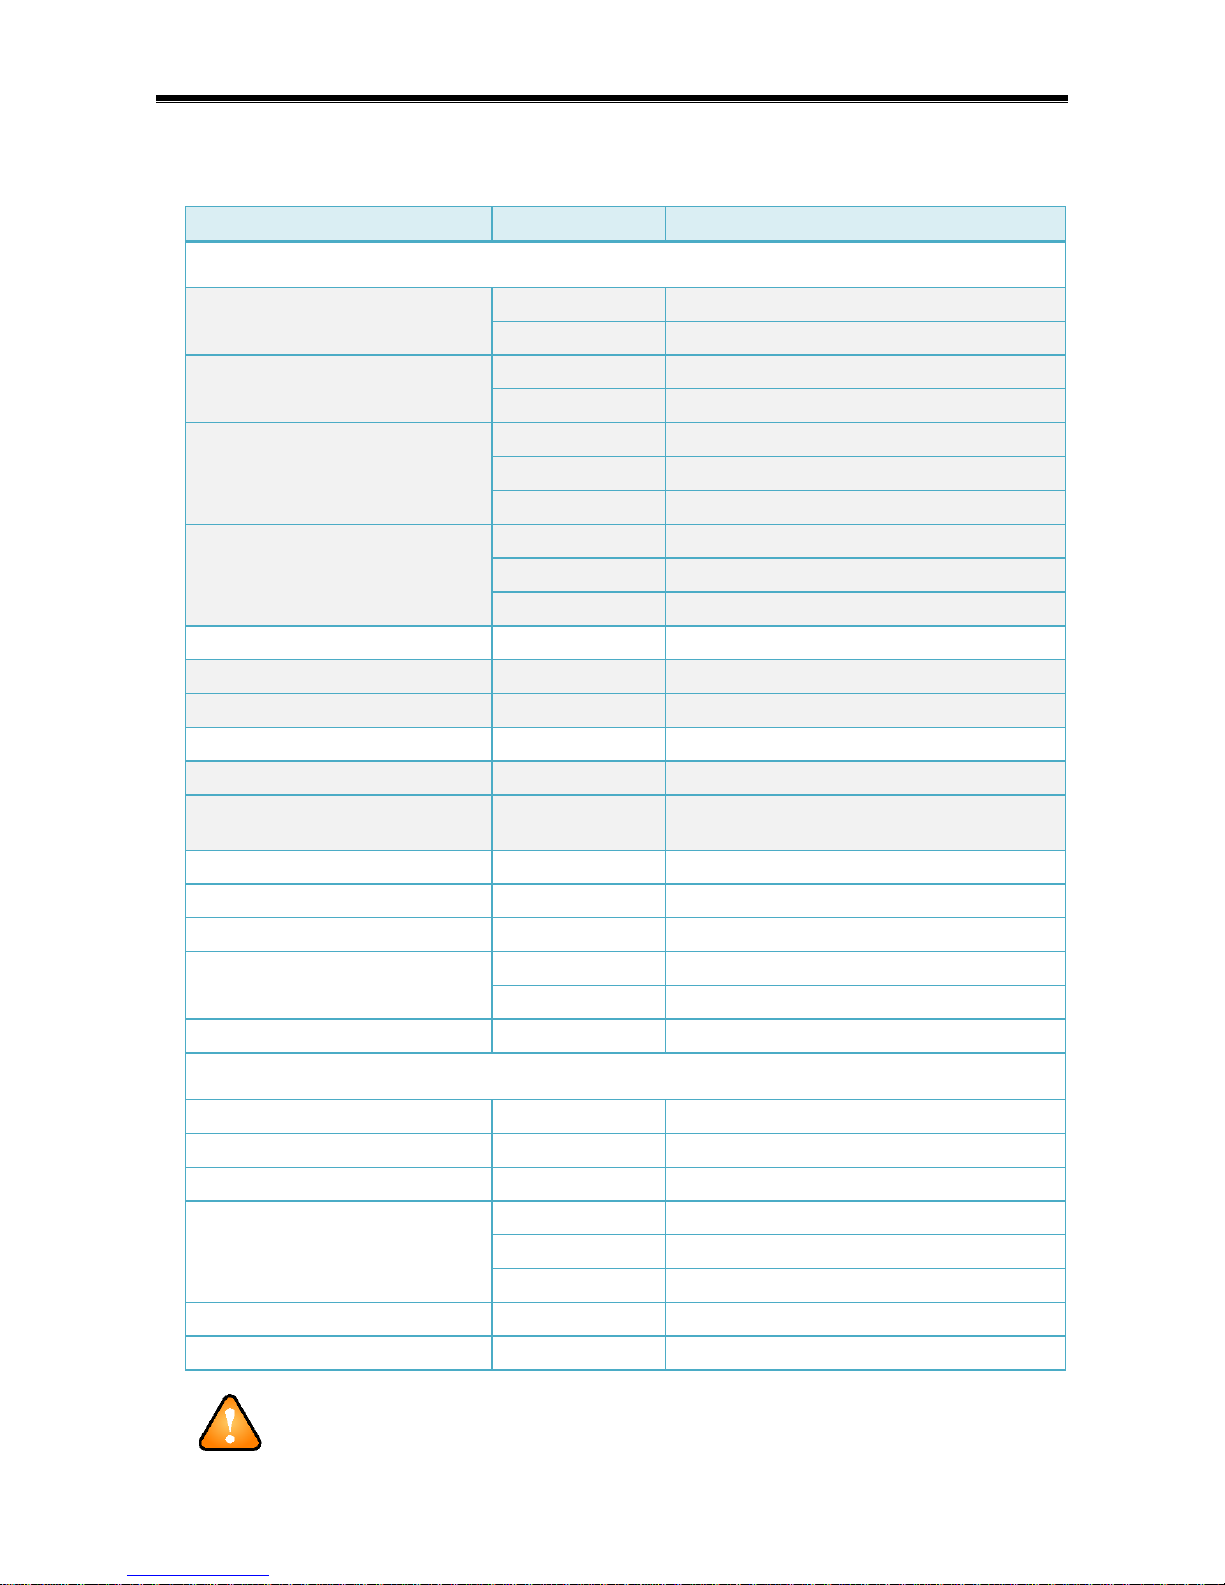
Technical Specifications
Parameter
Condition
Value
General
Supply voltage (P75)
external
8 – 16 V DC
battery
4.8 – 5.8 V DC (4x AA NiMH)
Supply current (P75)
LCD off
170 mA
LCD on
240 mA
Supply voltage (P175)
external
8 – 12 V DC
battery
2.3 – 4.5 V DC (2x or 3x AA NiMH)
USB
5.0 V
Supply current (P175)
LCD off
140 mA
LCD on
210 mA
battery
up to 500 mA
External power supply connector
DC 2.1 mm
Board dimensions (P75)
139 x 72 mm
Board dimensions (P175)
133 x 70 mm
CPU
120 MHz RISC DSP
Data connector (P75)
RS-232 (DCE, 9 pins), bidirectional
Data connector (P175)
RS-232 (DCE, 9 pins), bidirectional,
USB (FTDI based, virtual serial port)
Communication speed
19200 bps
Communication mode
1 stop bit, 8 data bits, no parity, (no flow control)
RX buffer length
40 bytes
Intermediate frequency (IF)
1st IF
10.675 MHz
2nd IF
0.325 MHz ± 0.005 MHz
IF bandwidth
280 kHz
Antenna Input
Antenna connector
BNC, 50 Ohms
Frequency range
87.5 – 108.0 MHz
Tuning step
selectable 50 kHz or 100 kHz
Input sensitivity
S/N 26 dB
4 μV
basic measurements
30 μV
full measurements
70 μV
Maximum input level
0.5 V (5 mW)
Intermodulation immunity
basic (single input LC circuit with coil tap)
Never connect RF power output from the transmitter directly to the device's antenna input!
Page 5
5
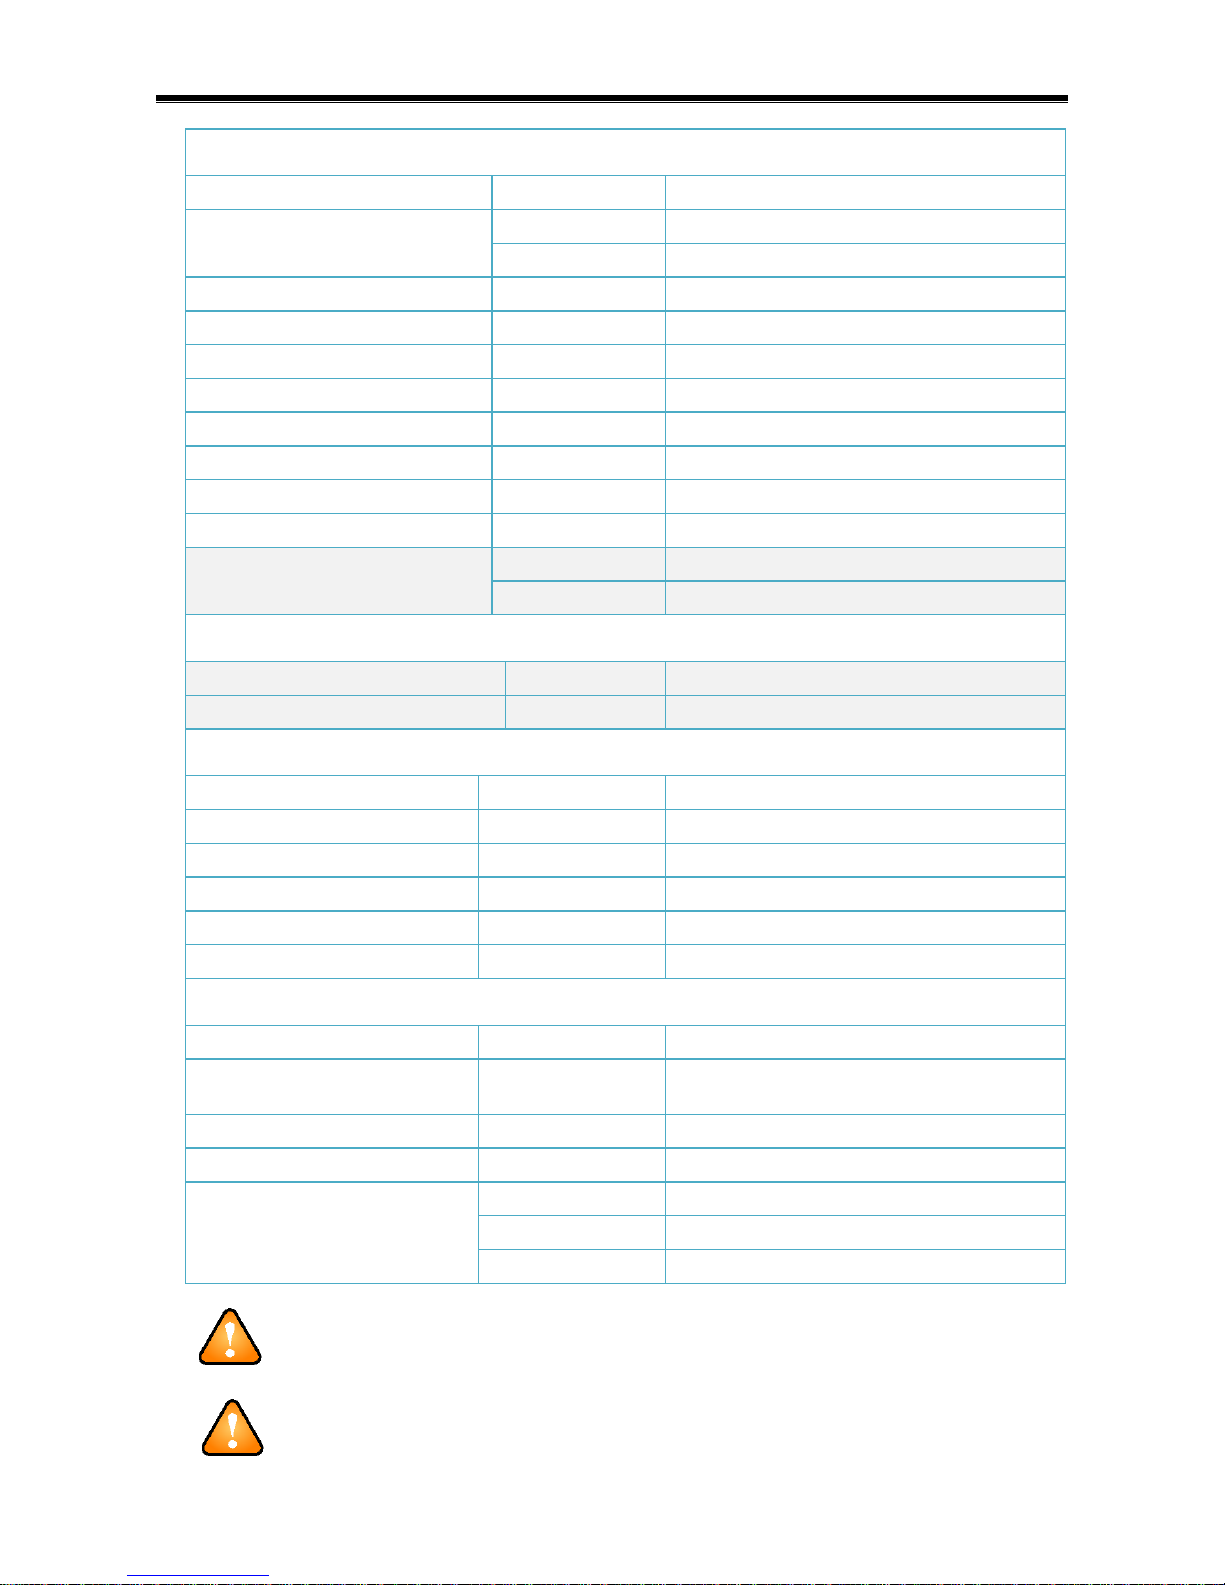
Measurements
Frequency deviation range
min.
0 – 121 kHz
Frequency deviation error
1 kHz sine
< ± 1.5 kHz
typical content
< ± 2 kHz
Modulation power range
min.
-12 – 14 dBr
Modulation power error
-6 – 6 dBr
± 0.2 dBr
Pilot deviation error
6.8 kHz
± 0.2 kHz
RDS deviation range
1.0 – 17.9 kHz, note 5
RDS deviation error
full signal
± 5% ± 0.5 kHz
Pilot-to-RDS phase difference error
± 4 deg.
Baseband frequency response flatness
10 Hz – 60 kHz
± 0.3 dB
Stereo balance error
± 0.5 dB
Signal level error (P175)
35 – 86 dBµV
non-linearity ± 3 dBµV, offset ± 2 dBµV
0 – 35 dBµV
not specified
Alarm Outputs (P175)
Maximum current from pin 1
100 mA
Maximum current from/to pin 2, 3, 4, 5
15 mA (internally limited by 390R serial resistor)
Headphones Audio Output
Audio channels
1 (switchable R+L, L, R, R-L)
Output impedance
typ.
100 Ohms
Output level
no load
adjustable 0 – 2.5 V p-p @ 75 kHz
Signal to noise ratio
75 kHz, volume 0 dB
55 dB
Stereo decoder separation
1 kHz
>23 dB
Distortion
1 kHz
2 %
Internal RDS/RBDS Decoder
RDS groups detected
All RDS groups 0A-15A, 0B-15B
RDS services supported
PS, PI, PTY, PTYN, TP, TA, M/S, DI, AF, EON,
ECC, LIC, PIN, RT, CT, AID, RT+
RDS groups decoded
0A, 0B, 1A, 2A, 2B, 3A, 4A, 10A, 14A
RDS deviation (ΔF
rds
) required
min.
1.0 kHz
Antenna input sensitivity
(average BER = 5 % or less,
single station, no interference)
ΔF
rds
=2.0 kHz
30 μV
ΔF
rds
=3.4 kHz
18 μV
ΔF
rds
=6.8 kHz
9 μV
Never exceed specified voltage value at the battery power supply connector! It may cause
permanent damage to the device! Disconnect or remove accumulators from the unit when it is
not in use!
Don’t open the plastic cover (boxed versions)! No user adjustable parts inside! Risk of damage!
Take care to avoid strong mechanical pressure on the power switch during transport!
Never use the equipment if there's any visible damage on its electrical parts! In that case
disconnect all cables, remove accumulators and contact the vendor or manufacturer.
Page 6

6
Notes (Technical specifications):
1. p-p = peak-to-peak value; BER = Block Error Rate
2. Due to inherent reception the unit may have reduced sensitivity at 90.0 MHz.
3. Very strong el. field intensity (above 130 dBμV/m) may cause additional measuring error or may disallow
the measurement.
4. Shadowed fields are device specific.
5. If pilot and RDS are not synchronized, the range reduces to 1.7 – 17.9 kHz. Spurious RDS detection may
occur on stations without RDS if the station's signal is noisy or specific static sine tones are transmitted.
If ARI system is used simultaneously with RDS on the same transmitter, the RDS deviation value should
not be taken into consideration. Instead of this the Windows application and MPX spectrum graph gives an
image about signal level of each component.
Power supply (P75)
External power supply connector
The FM analyzer can be supplied from any power supply, which delivers a voltage between 8 and 16 V DC and
continuous current of 300 mA to 1 A. The FM analyzer has polarity protection and own voltage stabilizer. The
central conductor of the power supply connector is positive (+).
Battery power supply connector
Use this connector for supplying the FM analyzer from 4x 1.2V NiMH accumulator or stabilized +5V power supply.
This connector is polarity protected.
If both power supply connectors are being used to power the FM analyzer, the external connector has higher
priority.
The unit does not charge the battery.
Power supply (P175)
External power supply connector
The FM analyzer can be supplied from external power supply (typically DC wall adapter), which delivers a voltage
between 8 and 12 V DC and continuous current of 300 to 500 mA. The FM analyzer has polarity protection and own
voltage stabilizer. The central conductor of the power supply connector is positive (+).
Battery power supply connector
Use this connector for supplying the FM analyzer from 2x or 3x 1.2V NiMH accumulator.
Due to safety reasons, the unit does not charge the battery.
USB connector
Use this connector for supplying the FM analyzer from PC computer or stabilized +5V power supply.
This connector is not polarity protected. Connecting an active USB cable the unit is always turned on, i.e. the power
off/on switch has no effect if the unit is powered from USB.
Never exceed specified voltage value at this connector! It may cause permanent damage to the
device!
The USB port must be rated to full 500 mA current! When supplying the unit from USB bus, it is
a better choice to connect the unit to the USB interface on the main board. Supplies for pocket
USB hubs and for some USB interfaces of lap-top and desk top computers are not sufficient and
an external power supply is necessary!
Page 7
7
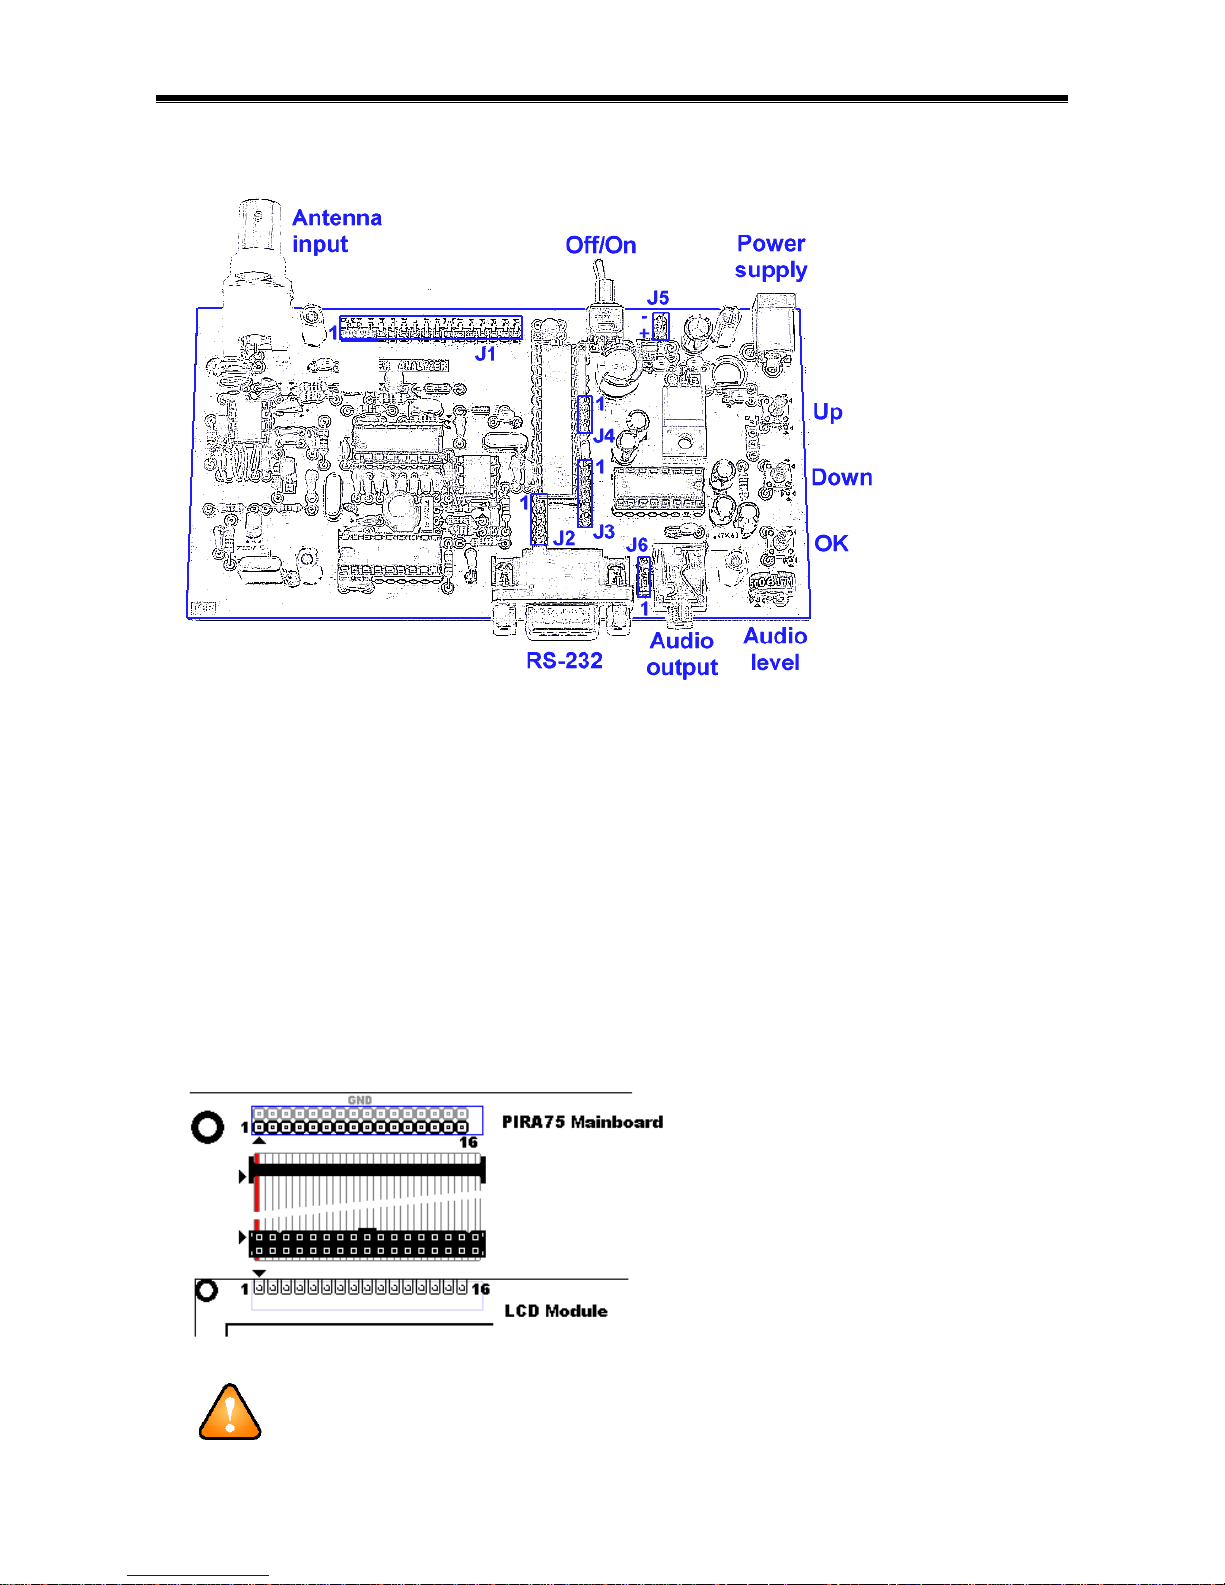
Mainboard composition (P75)
J1 – LCD display connector (HD44780 standard)
J2 – Expansion IIC bus
1: +5 V
2: SDA
3: SCL
4: Ground
J3 – Reserved for user applications
1: Ground
2: DIP5 output (for remote switching)
3: Reserved
4: Ground
5: +5 V
J4 – Reserved
1: MPX/audio PWM output (no LPF)
2: Receive Data (RxD), TTL
3: Transmit Data (TxD), TTL
J5 – Battery power supply connector
J6 – Audio connector mono/stereo switch
1-2: mono jack
2-3: stereo jack (headphones)
Note: the audio output is still one channel.
LCD module connection (if flat cable is used)
Make sure the LCD module is connected right before connecting power supply!
Incorrect connection will cause permanent damage to the LCD module.
Page 8
8
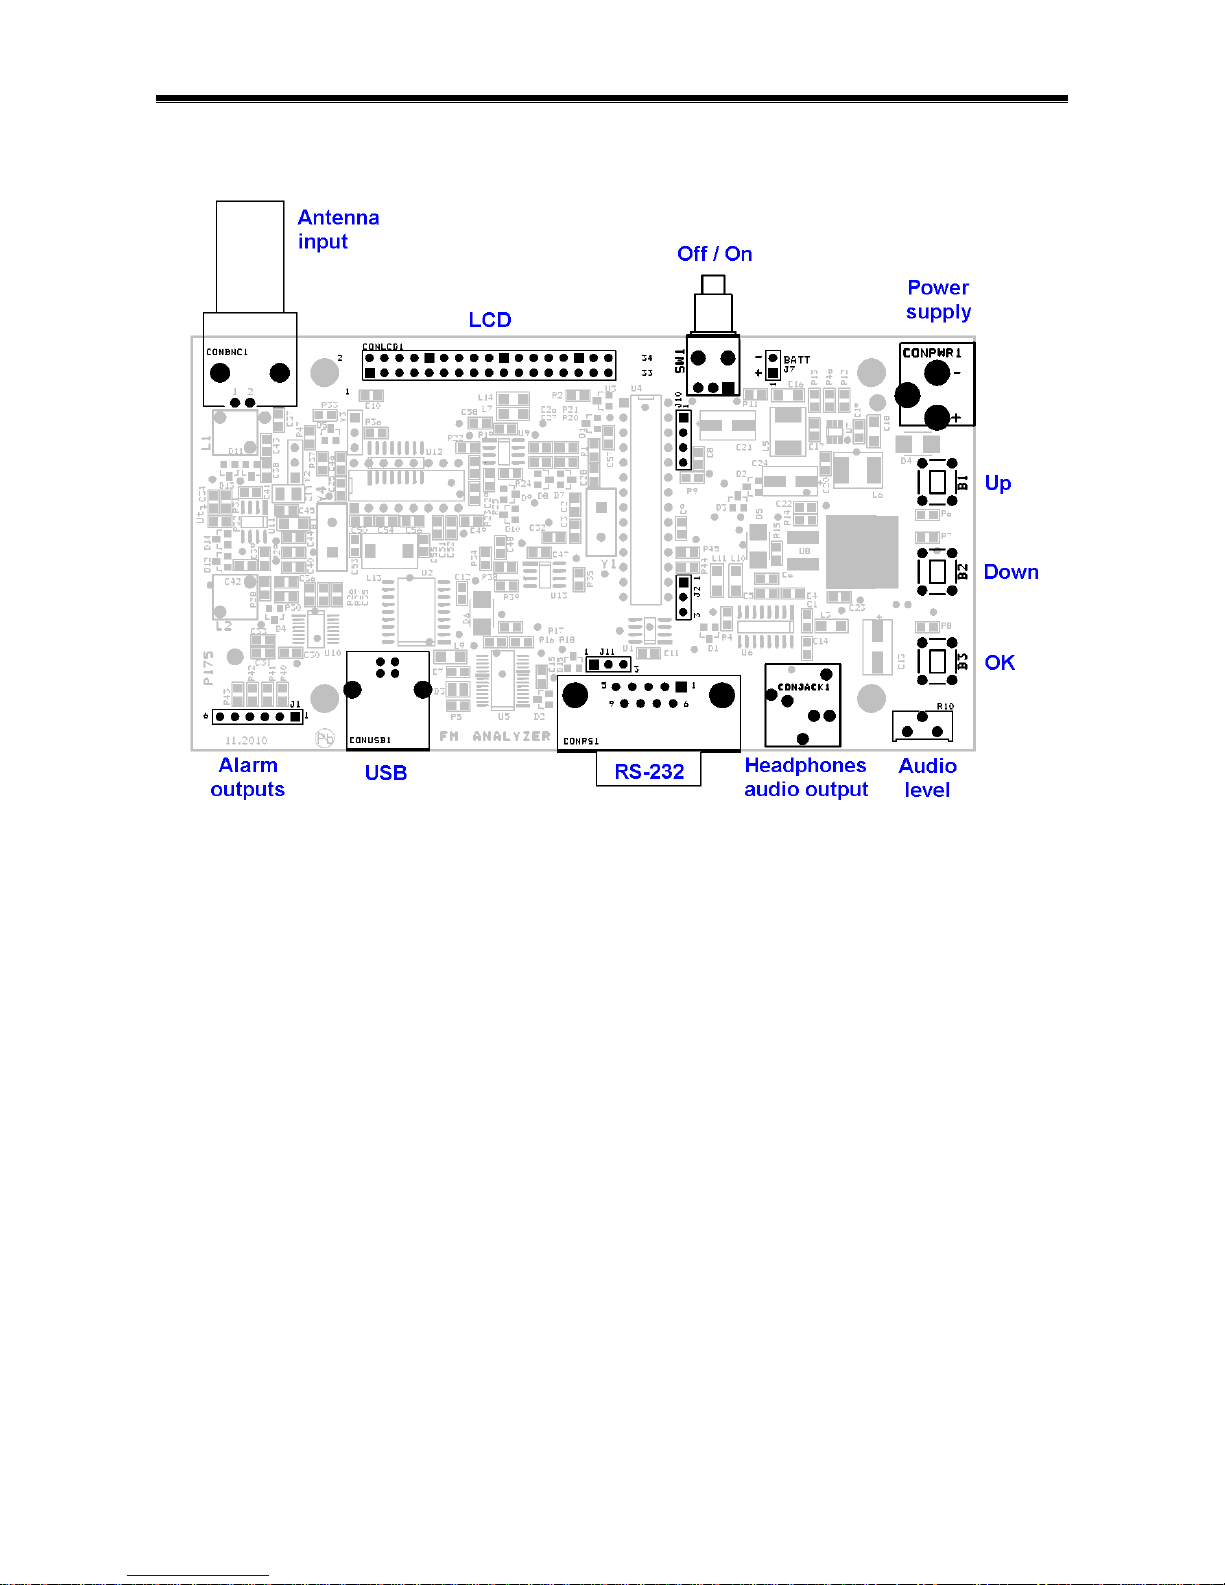
Mainboard composition (P175)
J1 – Alarm outputs / General purpose outputs *
1: +5 V output for powering external device
(max. 100 mA)
2: Alarm 1 (Signal lost)
3: Alarm 2 (Silence)
4: Alarm 3 (Overmodulation)
5: Alarm 4 (Pilot or RDS level error)
6: Ground
J2 – Reserved for special applications
1: DIP5 output (for remote switching)
2: Reserved
3: Ground
J7 – Battery power supply connector
J10 – External buttons (pull-up resistors on board)
1: Ground
2: Up
3: Down
4: OK
J11 – Serial RS-232 port (TTL levels)
1: Receive Data (RxD)
2: Transmit Data (TxD)
3: Ground
* Notes:
The Alarm outputs can be used as independent general purpose logical outputs. See the section "List of commands
and configuration registers" for more details.
Maximum current from/to pins 2-5 is limited by internal 390R serial resistors.
Note: The device provides three serial communication ports (USB, RS-232 and J11). These ports are internally
linked together so the user may select any of these ports that best fits the communication requirements. When
requesting data via any port, all ports will send the reply. The user must ensure that different ports will not receive
requests at the same time.
Note for boxed version: There are no user-adjustable elements inside! Don’t remove the front panel!
Page 9
9
Alarm outputs (P175)
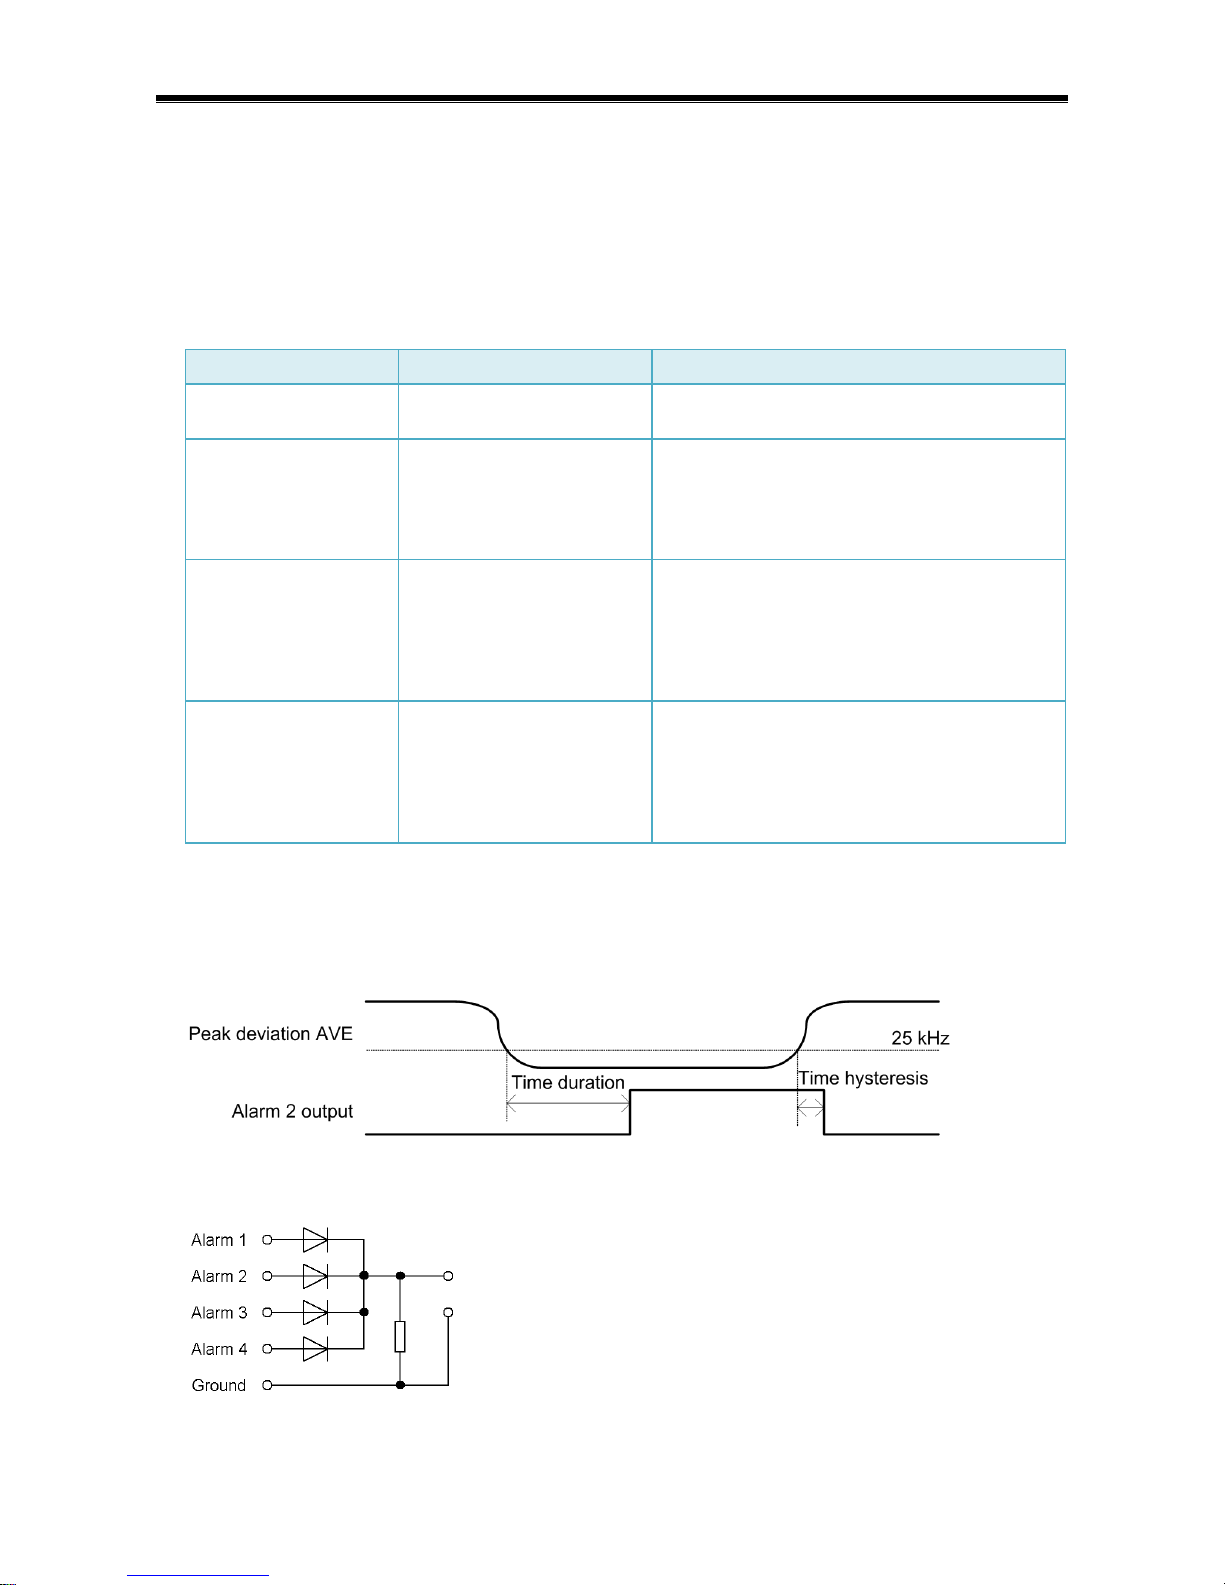
The device provides four independent logic outputs that are set by specific alarm conditions. These outputs can be
used for direct LED driving, switching to backup transmission equipment, signalizing via GSM gateway etc.
The alarm outputs are active high. If the alarm condition is no longer actual, appropriate output is driven low when
the time hysteresis elapses. Almost all parameters are user configurable. With factory default values the alarm
behavior is as showed in this table:
Alarm output
Condition
Interpretation
Alarm 1:
Signal lost
Signal quality < 4
(time duration 30 seconds)
FM transmitter failure or signal for the P175 device
is too weak for permanent monitoring.
Alarm 2:
Silence
ΔF AVE < 25 kHz
(time duration 1 minute)
There's no audio or the audio level is too low.
Broadcast automation system has crashed or
studio's mixing console has been set improperly or
connection between studio and transmitter has been
lost.
Alarm 3:
Overmodulation
ΔF MAX Hold > 88 kHz
and
[Histogram Max At > 78 kHz
or
ΔF AVE > 78 kHz]
(time duration 1 minute)
Transmitter problem or sound processing problem
or unauthorized manipulation with the broadcast
equipment or signal too bad (alarm 1 interpretation
may apply).
Alarm 4:
Pilot or RDS level error
ΔF Pilot < 5.8 kHz
or
ΔF Pilot > 7.7 kHz
or
ΔF RDS > 8.5 kHz
(time duration 1 minute)
Stereo encoder fault or transmitter problem or
unauthorized manipulation with the broadcast
equipment.
The device must operate in Measuring mode otherwise alarms are deactivated and the outputs are driven low. The
user must ensure that the device will receive the station's signal in appropriate quality. To resume the monitoring on
desired frequency automatically after eventual power drop out, save the settings using menu item 4. To configure
the alarms see the section 'USB and COM Port Communication'.
Alarm response example.
Application example – Logical sum (OR function) of alarm outputs.
Page 10
10
Operating Instructions
Power-up
For external power supply, make sure the unit is switched off. Connect the power supply and then switch the unit
on. The device requires no heating time. After a few seconds the unit is ready for operate. The antenna, audio and
data cables can be connected regardless of the operating state.
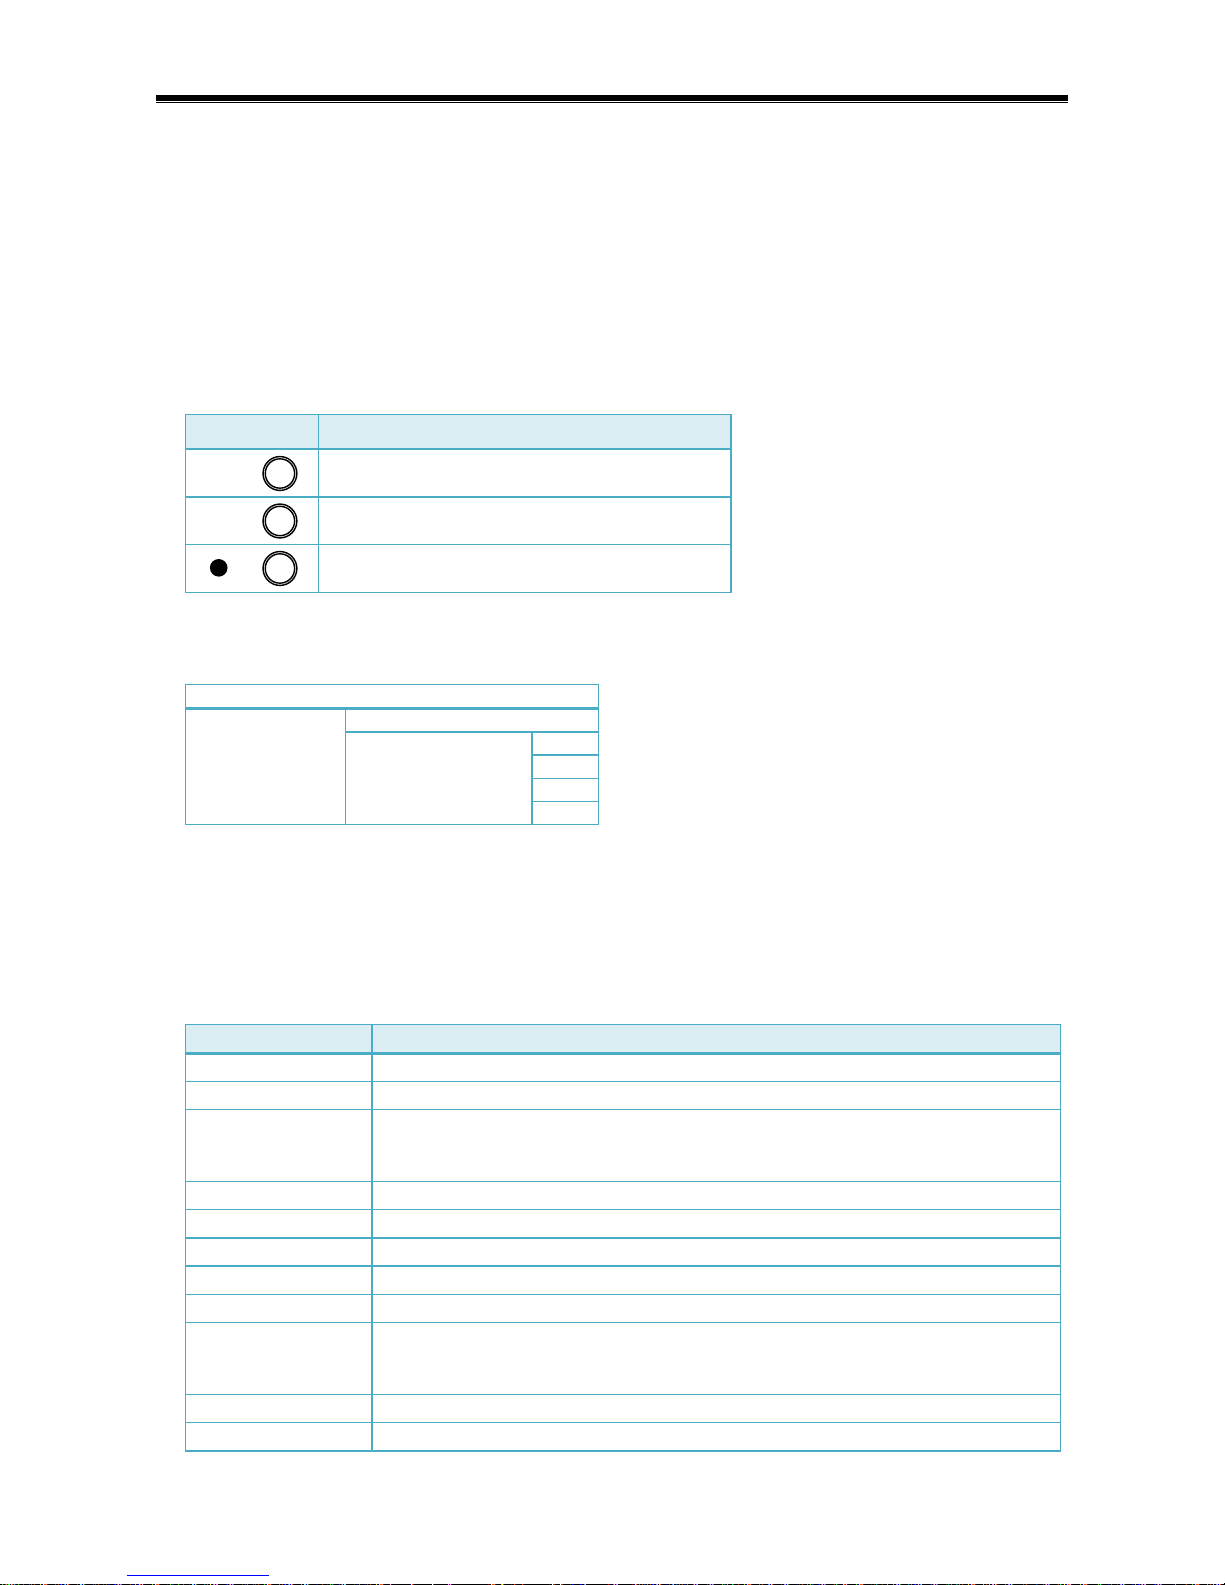
Control buttons
Button
Meaning
Go to next page or menu item, tune up.
Go to previous page or menu item, tune down.
OK, enter the menu, confirm or change the option.
Operating modes
Measuring ON
Measuring OFF
RDS decoder mode
Stereo decoder mode
L
R
L-R
L+R
The mode selected is indicated at the first line of the LCD. When switching between the modes, the values measured
will remain. The stereo decoder modes affect the audio signal in headphones output. This output is one-channel.
Menu
To enter the menu, press the OK button. Some items are showed depending upon context (page or operating mode).
Menu item
Meaning
1 – Tune
Tune to a desired frequency in FM band (manual tuning)
2 – Scan
Tune using a scan mode (automatic tuning, stops on each station).
3 – Histogram Data
3 – Set as Normal
3 – More RDS Data
Show frequency deviation histogram values.
Consider the 2nd IF as a normal (see Carrier frequency offset)
Show more Radio Data System information.
4 – Save Settings
Save settings (incl. actual frequency tuned)
5 – Save Data
Save measured data and RDS data into EEPROM.
6 – Load Data
Load measured data and RDS data from EEPROM.
7 – Clear Data
Clear all measured values in operational memory.
8 – Volume
Adjust audio volume in steps.
9 – Sending Pm
9 – Mode
Enable/Disable sending of modulation power values via serial port if measuring is
enabled.
Set the operating mode if measuring is OFF: RDS, Stereo L, R, L-R, L+R.
10 – Measuring
Enable/Disable the measuring.
11 – Return
Return from the menu.
Page 11

11
Save Data
The FM analyzer can store data from up to 4 (P75) or 30 (P175) measurements into internal EEPROM memory.
This memory does not lose the data after power-off.
Select the Save data menu item and choose unused file position (or rewrite any actual position).
In addition actual frequency and these RDS information are saved: PS, PI, PTY, TP, TA, M/S, RT (P175), EON,
AF, DI, group statistics.
The Save Data feature also supplies a preset memory function for tuning frequencies.
Load Data
Select the Load data menu item and choose the file required. The data are identified by the frequency.
To use the file as a frequency preset:
Make sure the device operates in Measuring or RDS mode
Load the file
To use the file for the purpose of reading all stored data:
Make sure the device is set to Stereo decoding mode
Load the file
You may browse the data, send them via serial port or continue in measurement by enabling the Measuring
option in menu.
Headphones output volume
The menu item 9 allows adjusting of audio volume in steps. Fine adjust or max. level adjust is made using the onboard control.
Note: The headphones output is not suitable for rebroadcast or streaming purposes.
Low battery indication
When the accumulator voltage drops below 4.7 V (P75) or 2.3 V (P175) or when the external power supply voltage
drops below 6.9 V, the “BATT” indicator is showed. The device will not stop the operation by force; it allows the
user to continue in their work. It’s on the user’s responsibility to finish the measurement and switch the unit off as
soon as possible. Disregard for the low battery indicator may result in data loss and accumulator damage!
96.30 MHz §££££¤ ¨5
©menu©©©©©©©©©©©©©©©
9 Volume -6.0 dB
106.10 MHz §££££¤ ¨4
©menu©©©©©©©©©©©©©©©
6 Load Data
File 1 106.10 MHz
106.10 MHz §££££¤ ¨4
©menu©©©©©©©©©©©©©©©
5 Save Data
File 1 No Data
Page 12
12
Measurements
Signal quality
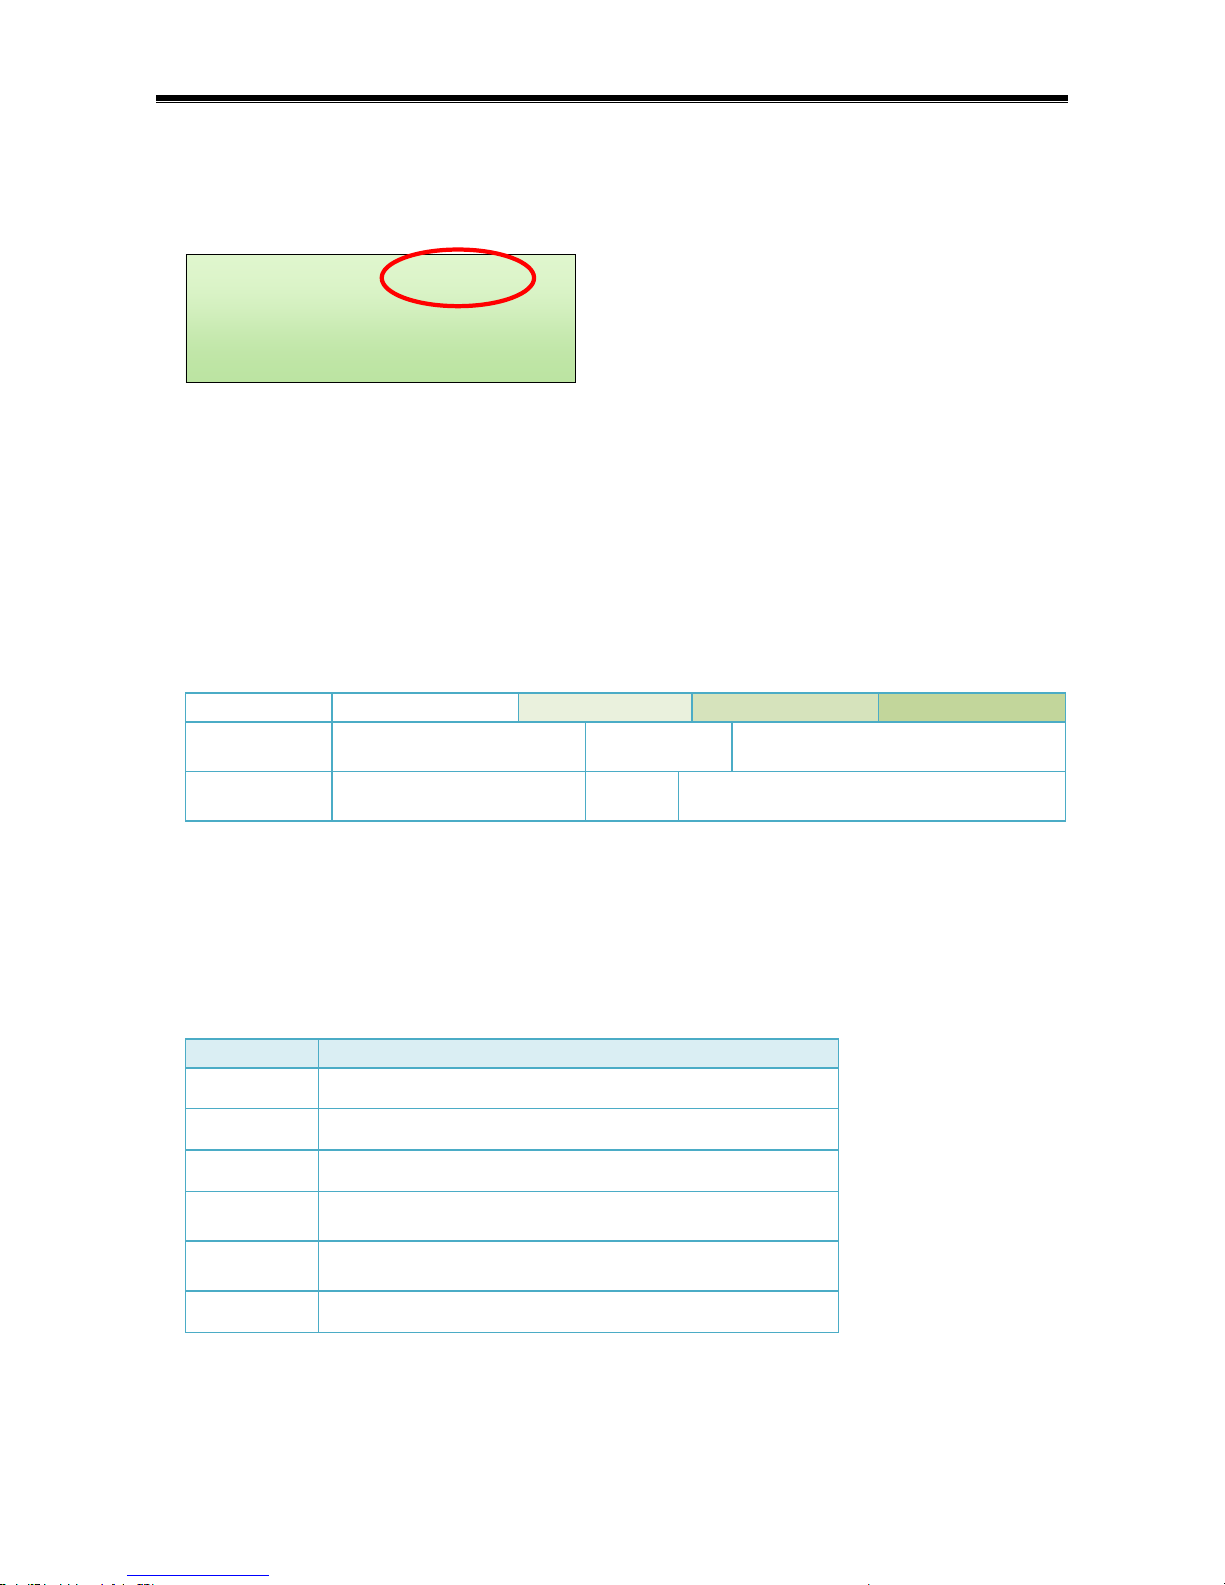
The signal quality indication does not reflect the signal strength directly. It’s a result of the following input
parameters and influences:
Noise level (measured in baseband above 100 kHz)
Multipath propagation
Intermodulation
Amplitude ripple (AM modulation)
2nd IF frequency (frequency offset) – "in-channel" check
The essential condition for the measurement is enough signal level on the antenna input and sufficient frequency
spacing between the stations. Not all signals that you can listen can be also measured. The following scale illustrates
it and it’s valid generally:
Signal level
1 μV
10 μV
100 μV
1000 μV
Reception on
typical receiver
Mono only
Poor quality
stereo
High quality stereo
Measurement
ability
Not possible
Basic
Full
The basic measurement includes modulation power, pilot level and RDS decoding. The full measurement includes
overall frequency deviation and RDS level. In noisy environment or in a location with many strong stations the
minimum signal level may increase.
It’s possible to say that optimal signal strength range and reception conditions for full measurement coincide with
the requirements placed on high quality stereo reception. This rule determines the demands closely.
Signal reception quality table:
Signal
Meaning
§
No signal.
§£
Weak signal detected.
§££
Signal still unusable for measurement.
§£££
Poor signal. Basic measurement is possible with reduced accuracy
for RDS level. Full measurement is not possible.
§££££
Good signal. Full measurement is possible with partially reduced
accuracy.
§££££¤
Excellent signal.
Note: For proper measurement of modulation characteristics, internal bandwidth for RF signal is fixed at 280 kHz.
In locations where stations are present in 200 kHz or even 100 kHz spacing, the device may indicate insufficient
signal quality unless signal of the adjacent stations is rejected enough by positioning of the receiving antenna.
106.10 MHz §££££¤ ¨1
¢F: MAX 74.5 kHz
AVE 69.6 kHz
Pm: 5.4 dBr ( 3.45)
Page 13

13
Following tables illustrate approximate max. measuring distance as a result of transmitter’s ERP power and
measuring conditions:
Estate housing, telescopic antenna:
ERP
Max. distance
1 W
300 m
10 W
800 m
100 W
3 km
1 kW
8 km
10 kW
20 km
100 kW
40 km
Open space, hill, Yagi antenna:
ERP
Max. distance
1 W
800 m
10 W
3 km
100 W
7 km
1 kW
20 km
10 kW
50 km
100 kW
100 km
Baseband noise spectrum from the area around 100 kHz is mirrored to audio spectrum in the audio output. This
results in audible noise expansion and helps to find the best antenna position if the input signal is weak.
Selecting an antenna
There is no generally valid choice for the antenna. The requirements for the antenna differ with local conditions and
kind of use. The essential condition for the measurement is enough signal level of the desired station on the antenna
input. Not all signals that you can listen on any radio receiver can be also measured. It’s possible to say that optimal
signal strength range for full measurement coincides with the range which is required for high quality stereo
reception. From this observation it's clear that simple telescopic or whip antennas are not enough for some
applications. On the other hand special calibrated antennas for EMI and RF field applications have no reason for FM
modulation measurements.
In the transmitter's near field (up to 1 km distance from the transmitter) any piece of wire connected to the antenna
input should be always sufficient. When measuring other than only local stations or where number of stations
reaches a couple of tens, a single dipole or 3-element Yagi antenna will give considerably better results than simple
telescopic or whip antenna. In many cases this kind of antenna must allow positioning in horizontal plane in order to
boost signal of stations of interest and reduce signal of all other stations.
Always make sure there is no pulse interference source near the antenna. These sources especially include
computers, cars, electric motors, PWM regulators, high voltage lines etc. Assure stable antenna position during the
measurement. Especially the frequency deviation should not be measured in motion like in ridden car.
Hint: Keep on mind that with fixed omni-directional antenna, the number of stations with excellent reception (full
measurement ability) usually does not exceed 15, regardless of how many strong stations are on air overall in the
location. This is caused due to multipath propagation of many station signals, as well as by the receiver’s limited
selectivity (restricted by requirement of proper FM deviation measurement) and intermodulation predisposition of
the receiver’s simple front-end. If the station of interest is 30 dB or more below the strongest stations, finding the
best antenna position may be necessary to reduce this ratio and to ensure full measurement ability.
Measurement using the transmitter’s test RF output
Many FM broadcast transmitters are equipped with a test RF output. This output is primarily not intended for
modulation characteristics measurement using an analyzer based on a receiver as the P75/P175 device is. In most
cases it can be used for this purpose but this usually does not bring any advantage. Special care is required before
connecting the analyzer to this output. Make sure the output signal power does not exceed 5 mW (7 dBm). In some
cases the test RF output gives 30 dBm (1 W) or more. This signal must be attenuated to less than 5 mW before
connecting to the analyzer!
Sometimes it is better not to use the test output and get the signal "from air". The modulation characteristics are not
affected in near field. Another recommended way is to connect only the transmitter's and analyzer's ground
(shielding).
On the transmitter sites where many transmitters are operating the user may be forced to find one of the methods
mentioned that gives full quality result. It’s due to intermodulations caused by many strong signals and their
harmonics that are present in this environment.
Page 14
14
Overall frequency deviation (peak frequency deviation)
Frequency deviation (ΔF) is used in FM radio to describe the maximum (peak) instantaneous difference between an
FM modulated carrier frequency, and the nominal carrier frequency.
The overall peak frequency deviation shall not exceed 75 kHz.
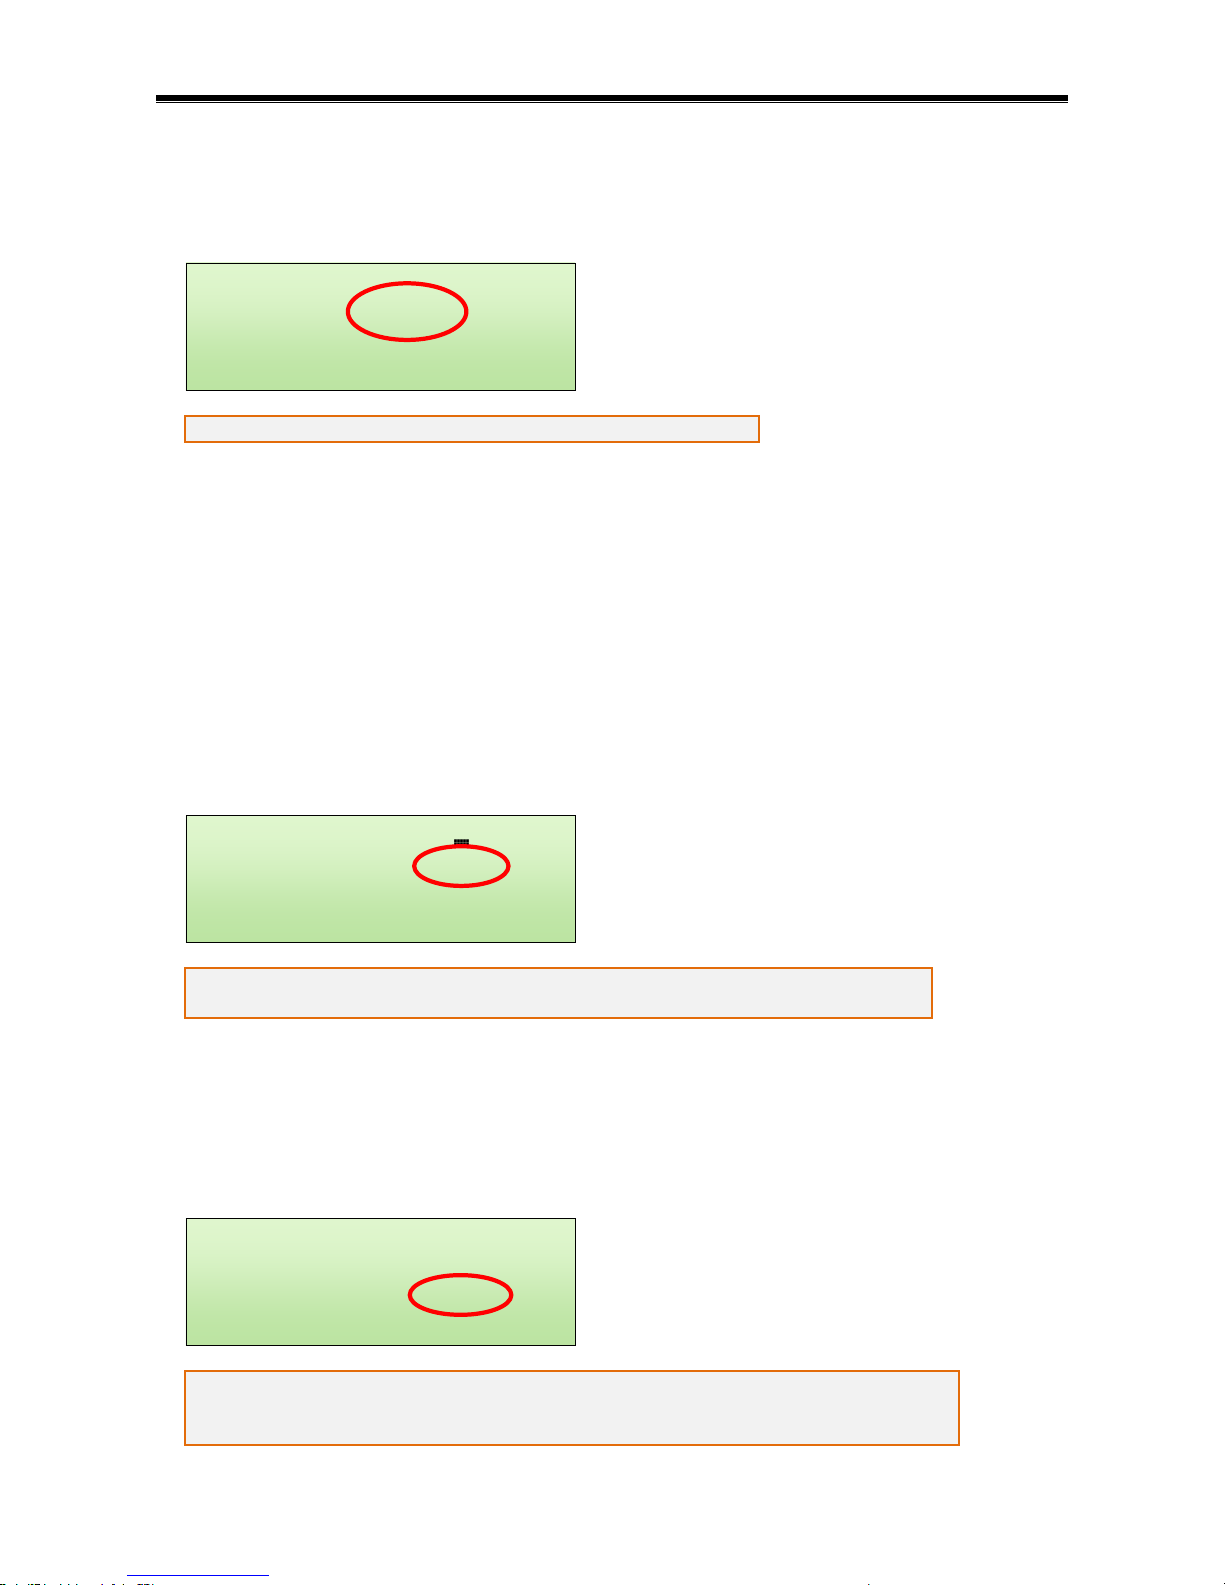
The peak hold values of the deviation are taken during a measuring time of 50 ms, 20 times per one second. From
this array of values the MAX, AVE and MIN values are calculated and showed. These values represent signal
characteristics in last second. The measurement is fully continuous over the signal, without any gaps.
Moreover, MIN Hold and MAX Hold functions are provided. The MAX Hold value represents the maximum
deviation found in last 10 seconds. Since it may be affected by pulse interference, interpret it very carefully.
Remember that any "Hold" or "MAX" function based on a single number cannot fully and adequately
describe the FM modulation characteristics as a histogram function can (described thereinafter).
Pilot deviation
In FM stereo broadcasting, a pilot tone of 19 kHz indicates that there is stereophonic information. The receiver
doubles the frequency of the pilot tone and uses it as a phase reference to demodulate the stereo information. The
(L+R) main channel signal is transmitted as baseband audio in the range of 30 Hz to 15 kHz. The (L-R) subchannel
signal is modulated onto a 38 kHz subcarrier occupying the baseband range of 23 to 53 kHz.
The deviation range of the FM carrier caused by pilot tone is from 6.0 kHz to 7.5 kHz.
The recommended value is 6.8 kHz.
RDS deviation
Radio Data System (RDS), is a standard from the European Broadcasting Union for sending small amounts of
digital information using conventional FM radio broadcasts. Radio Broadcast Data System (RBDS) is the official
name used for the U.S. version of RDS. The two standards are nearly identical, with only slight differences. Both
use a 57 kHz subcarrier to carry data.
The deviation range of the FM carrier caused by RDS/RBDS is from 1.0 kHz to 7.5 kHz.
The most used value is around 3.0 kHz. This value should be considered as a minimum if
dynamic PS or TMC service is being broadcasted.
106.10 MHz §££££¤ ¨3
¢F: Pilot 6.8 kHz
RDS 3.4 kHz
Phase Diff.: 0 deg
106.10 MHz §££££¤ ¨3
¢F: Pilot 6.8 kHz
RDS 3.4 kHz
Phase Diff.: 0 deg
106.10 MHz §££££¤ ¨1
¢F: MAX 74.5 kHz
AVE 69.6 kHz
Pm: 5.4 dBr ( 3.45)
Page 15
15
Pilot-to-RDS phase difference
The 57 kHz for RDS subcarrier was chosen for being the third harmonic of the pilot tone for FM stereo, so it would
not cause interference or intermodulation with it. The amount by which RDS subcarrier and third harmonic of pilot
tone are out of step with each other can be expressed in degrees from 0° to 360°. Since the RDS signal is based on
its carrier phase alternating, the full angle reduces to straight angle and we can equate 90 degrees = -90 degrees.
During stereo broadcasts the RDS subcarrier will be locked either in phase (0 degrees)
or in quadrature (90 or -90 degrees) to the third harmonic of the pilot-tone. The
tolerance on this phase angle is ±10 degrees.
A value out of the specification is however not to be considered as a critical failure, i.e. there's no need to solve that
situation promptly.
If no value is given, the RDS and pilot are not in stable phase relation. In that case check if pilot or MPX signal is
connected to the RDS encoder input and external synchronization is enabled. Follow the instructions supplied with
your transmission equipment.
Set the phase difference when the transmission equipment works under common conditions and after enough time of
warm-up. The phase difference depends a little on the transmission equipment temperature and other physical
quantities.
Modulation power (MPX power, Pm)
The modulation power is a relative power of the MPX signal averaged over 60 seconds according to the formula:
modulation power = 10 log {(2/60 s) (f(t)/19 kHz)2 dt} [dBr]
0 dBr corresponds to an average power of a signal equivalent to the power of a sinusoidal tone which causes a peak
deviation of 19 kHz.
Intensive audio dynamics compression as well as increasing overall peak deviation causes the modulation power to
rise.
The modulation power limit, if defined in your country, is usually 0 dBr or +3 dBr.
Please refer to your local communications authority for more information.
Since the modulation power is averaged over last 60 seconds, first value can appear after one minute from power-up
or tuning to a new frequency. However the analyzer reduces this time using estimation method during first minute
so it shows an estimated value of the modulation power almost immediately, saving considerably the operator's time
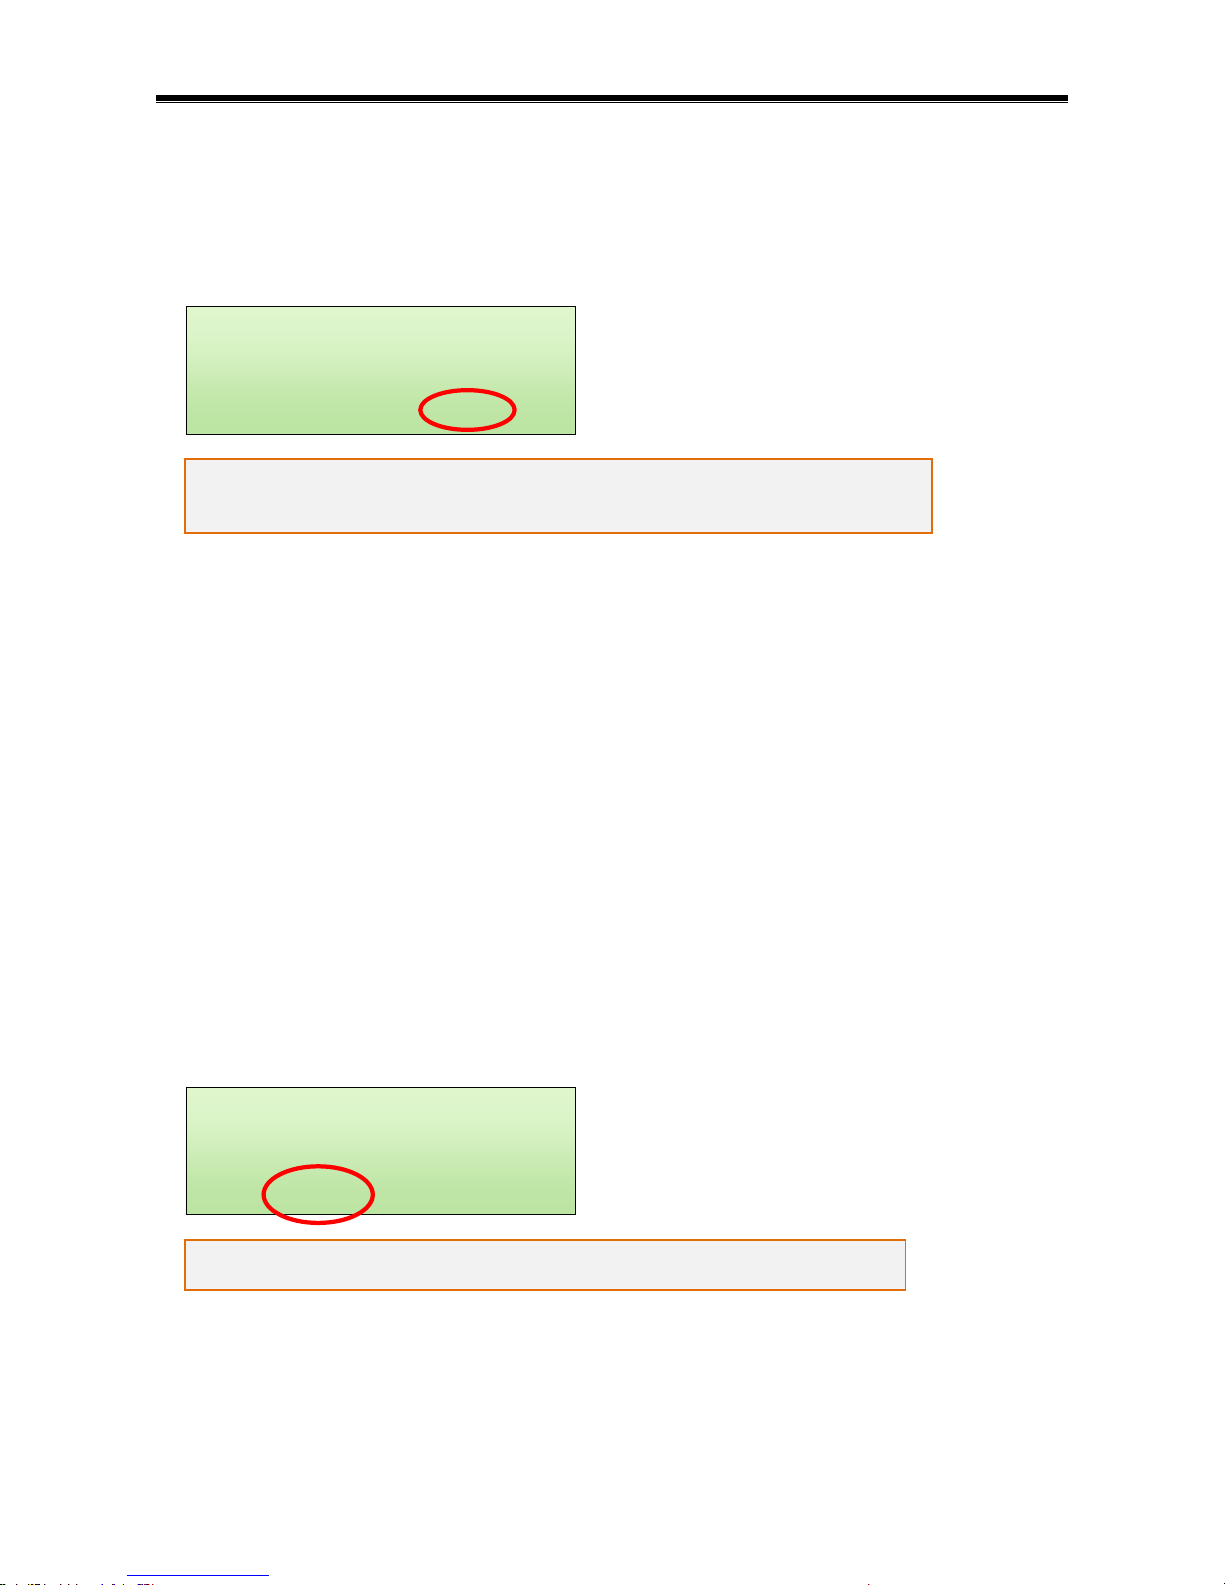
but still keeping compliance with standards. This is indicated by the 'Pm:' symbol blinking. Relevancy and accuracy
of the modulation power value increases with each second. After the first minute elapses, the value is accurate from
this moment and the 'Pm:' symbol stops blinking.
106.10 MHz §££££¤ ¨1
¢F: MAX 74.5 kHz
AVE 69.6 kHz
Pm: 5.4 dBr ( 3.45)
106.10 MHz §££££¤ ¨3
¢F: Pilot 6.8 kHz
RDS 3.4 kHz
Phase Diff.: 0 deg
Page 16
16
The measurement should represent typical modulation of the programme material of the broadcasting station. The
observation time should be at least 15 minutes or in some cases one hour may be required to be sure to measure
representative programme material.
The value in (...) is a linear representation of the modulation power, 0 dBr = 1.00.
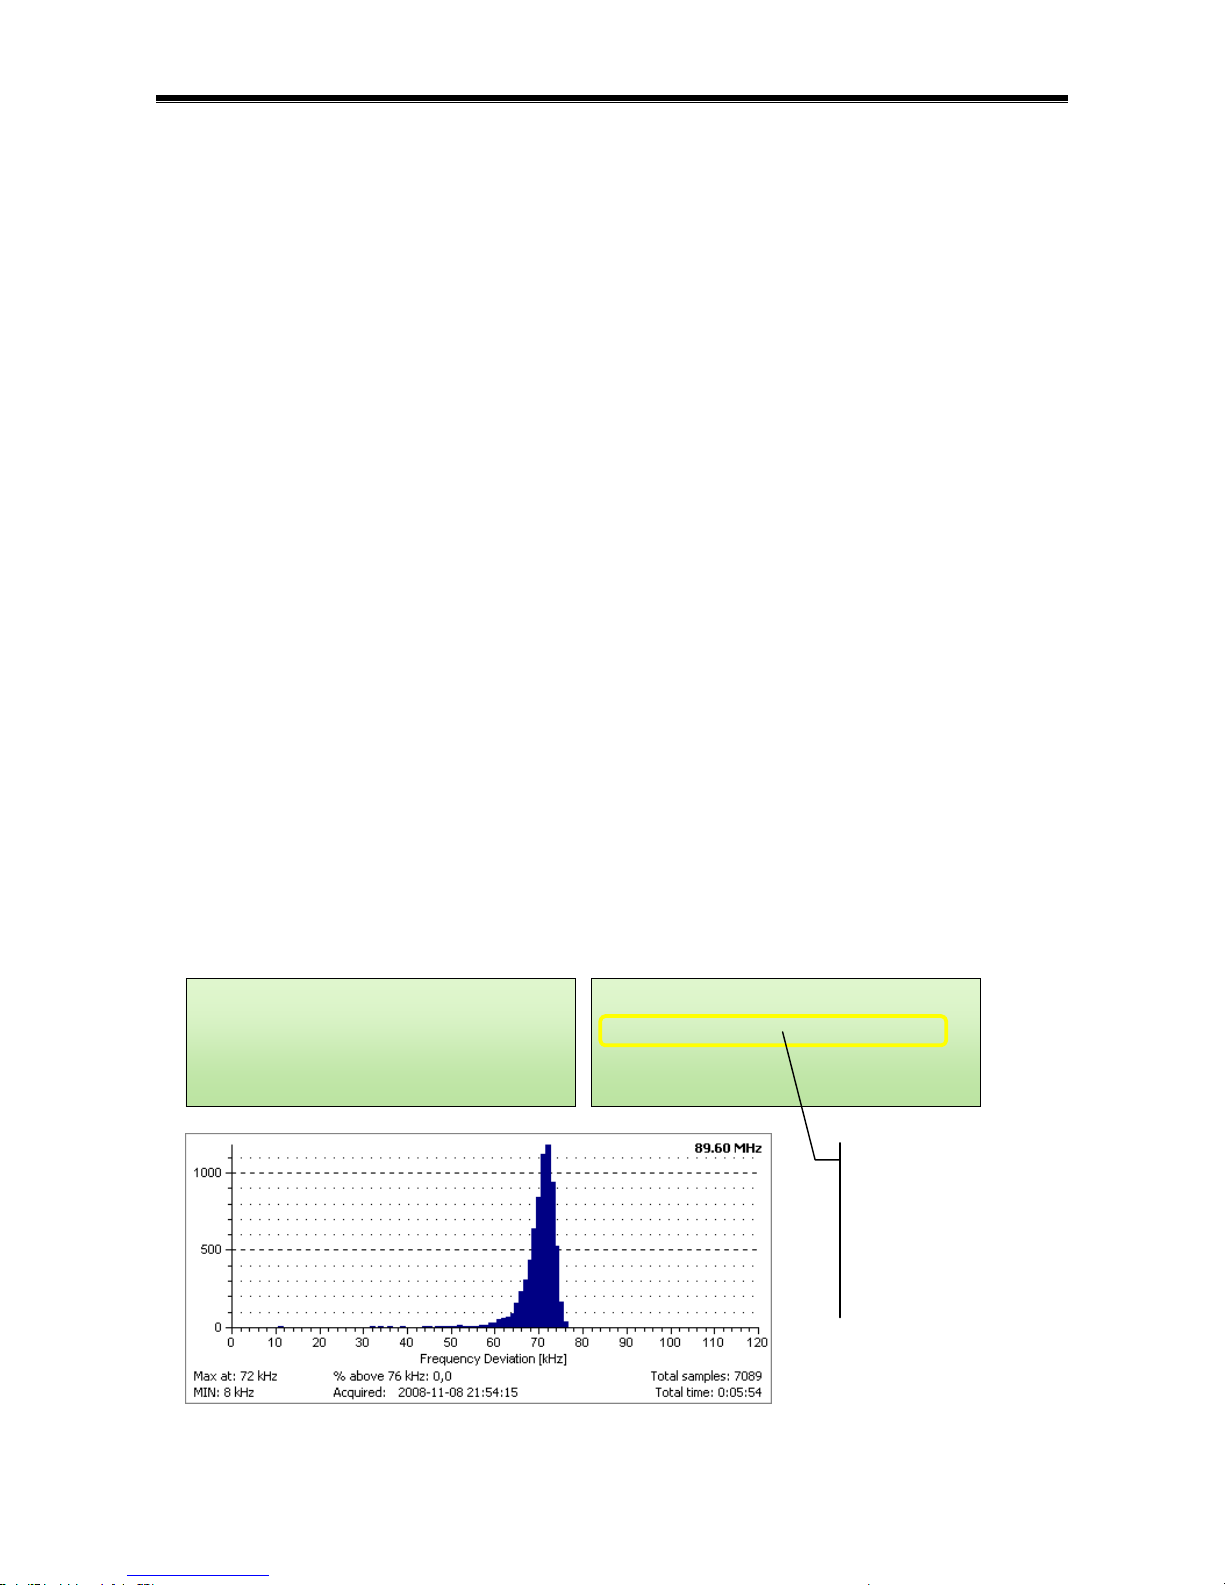
Frequency deviation histogram
To provide more information the deviation is better represented by histogram rather than only displaying the highest
value in over a certain period of time. In this device the histogram of frequency deviation is processed as follows:
a) Obtain N peak hold values (samples) of the deviation, each taken during a measuring time of 50 ms. The
measuring time has influence on the distribution plot and hence must be standardised in order to ensure
repeatability. The 50 ms ensures that the peak values of the deviation are captured even at modulating
frequencies as low as 20 Hz.
b) Discard the samples that have been taken in presence of noise or interference.
c) Divide the range of frequency deviation of interest (0 – 120 kHz) into 1 kHz resolution to give relevant number
of bins.
d) For each bin, count the number of samples which have a value within the bin. The result is a distribution plot
of the deviation – frequency deviation histogram (see the figure below).
e) Add counts in each bin from left to right and normalise by N. The result is a plot of the accumulated
distribution which starts with a probability of 100 % from the lowest deviation and will finish with a
probability of 0 % at the highest deviation.
The measurement should represent typical modulation of the programme material of the broadcasting station. The
observation time should be at least 15 minutes or in some cases one hour may be required to be sure to measure
representative programme material.
Note: Samples associated with the deviation of 121 kHz represent all values above 120 kHz.
Note: Samples are added to the histogram only when the signal quality ensures that the values measured have a
sense. This extends the histogram readability in the cases the reception quality is not good enough.
The histogram example (graphical representation).
103.20 MHz §££££¤ ¨4
45 kHz: 148 20% ¥
46 kHz: 80 17%
47 KHz: 61 15% ®
89.60 MHz §££££¤ ¨4
Histogram of ¢F:
Samples 7 10^3
MAX at 72 kHz
148 samples of the
signal have 45 kHz
peak deviation.
20 % of all samples
have 45 kHz or
more peak
deviation.
Page 17
17
Service details (P75)
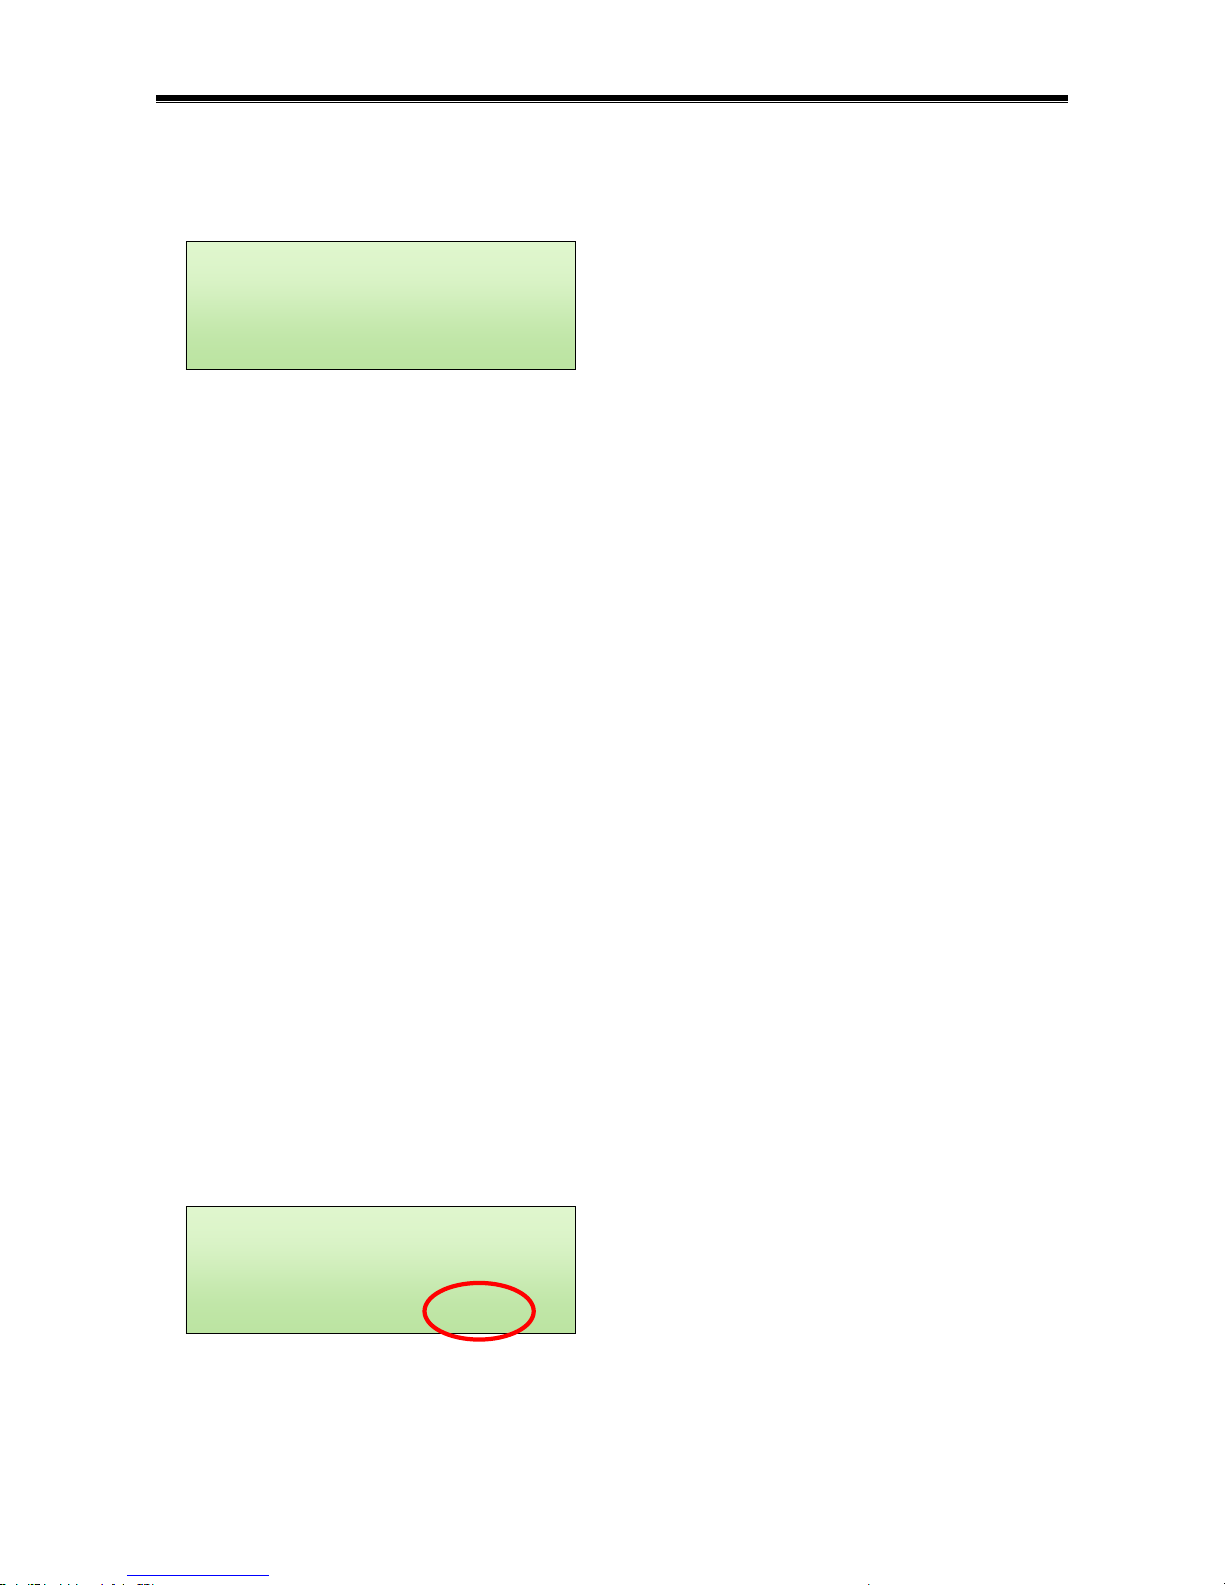
Several service values are provided on the page 5:
The Signal value has two main reasons:
In production / service process: To adjust antenna input circuitry and trace the signal path.
During measurements: To find the best antenna position (strongest signal) resulting in the best suppression of
pulse interference (as recommended for peak deviation measurements).
The Signal value becomes zero when the input level drops below 100 µV, while the maximum Signal value is
reached when input level is about 2 mV.
Use of the 2nd IF parameter is described on following page.
The Noise Level is an output of the internal digital demodulation process telling how much energy is above 100 kHz
in the demodulated signal. It's used as a main indicator of the signal quality.
The user should awake to the fact that the Signal and Noise Level values are dimensionless variables. Comparing
these values makes no sense. They do not evaluate the original signal but the reception quality in the actual place
and using actual antenna and equipment.
Service details (P175)
The same information applies as above except for following:
The Signal represents real signal level on the device input in dBµV unit. Values 0 to 35 dBµV are estimated
from the noise level, thus accuracy is not defined in this range.
There's an additional peak amplitude modulation indicator. The AM on the received signal may occur for
various reasons, including but not limited to transmitter failure, broadcast antenna coupler, motion, interference,
multipath propagation and other characteristics of the environment. In general the AM modulation of the signal
is undesirable. Thus whenever possible the user should choose such antenna placement and direction that
maintains a low or zero AM level. AM below 15 % has usually no effect on the measurement.
Simple stereo balance meter
To activate the stereo decoder, disable Measuring first. Set the Mode to any of the four Stereo options.
The simple stereo balance meter helps to maintain the same peak signal level in both right and left audio channels if
stereo encoder is present in the transmission chain. The best value is around 0 dB (1:1). No special audio signal is
required to be broadcasted but it’s preferable to use a sample with no stereo information.
The menu item 9 determines which audio channel will be present on the audio output. You may choose from L+R,
L, R and L-R. The L-R channel can help to find the best channel balance as well. If monaural audio sample is being
broadcasted, the best balance corresponds with no audio in the L-R channel.
106.10 MHz § L+R ¨5
R:ªªªªªªªªªªª
L:ªªªªªªªªªª
R/L Balance: 0.4 dB
89.60 MHz §££££¤ ¨5
Signal: 66 -
2nd IF: 325.3 kHz
Noise Level: 0 -
Page 18
18
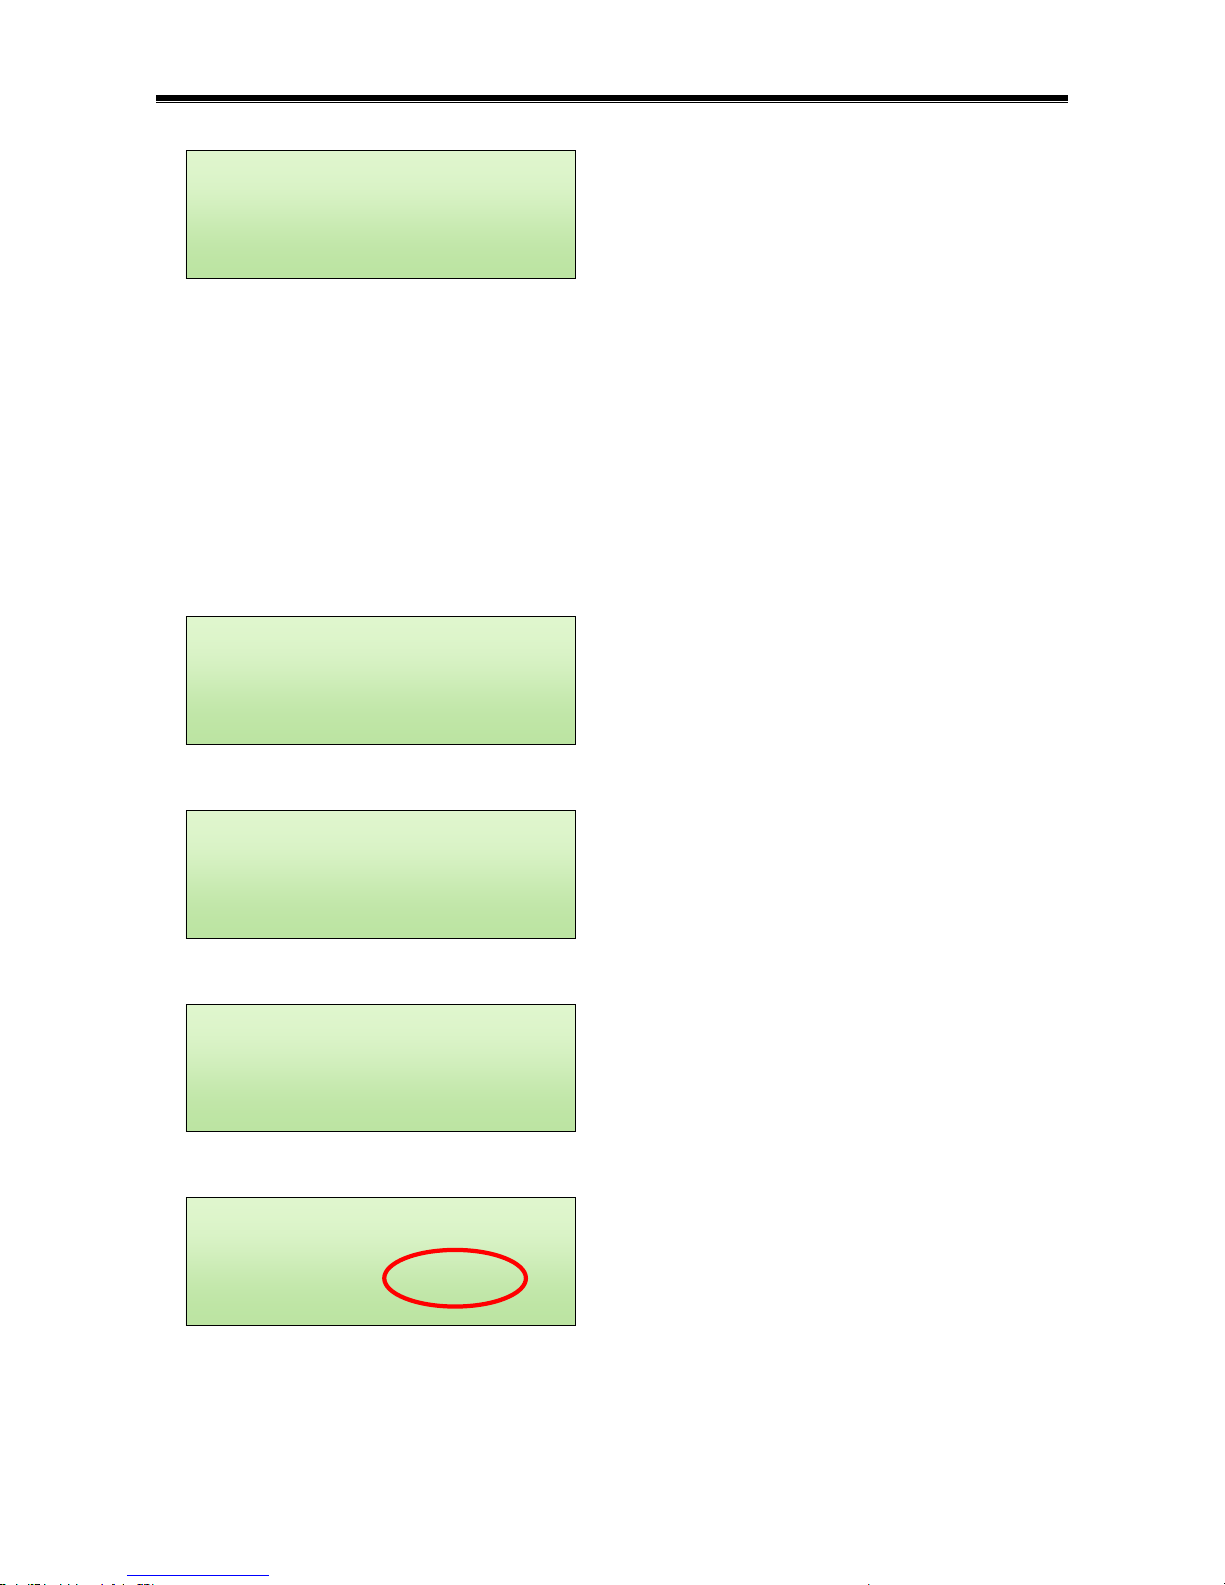
In common operation, the L-R channel may be affected by distortion produced by audio processing. There is also
strong “karaoke” effect present.
Carrier frequency offset
The unit can provide a relative carrier frequency offset from the nominal frequency. Although there is no calibrated
frequency normal included for this purpose, it can be simply found in the band. If any station can be considered as a
frequency etalon, the unit can be used to adjust right carrier frequency on the transmitter with 0.1 kHz precision.
To determine the carrier frequency offset
Under normal conditions the page 5 shows second IF frequency:
Now select menu item 3:
The Offset value appears which is 0.0 on the station selected as Normal:
Now tune to any other station:
Still not sure how to read the result of this example? If real frequency of the station at 89.6 MHz is exact, real
frequency of the station at 92.2 MHz has -0.7 kHz offset so its exact value is 91.1993 MHz
92.20 MHz §££££¤ ¨5
Signal: 57 dBuV
Offset: -0.7 kHz
Noise/AM: 0 / 0%
89.60 MHz §££££¤ ¨5
Signal: 62 dBuV
Offset: 0.0 kHz
Noise/AM: 0 / 0%
89.60 MHz §££££¤ ¨5
©menu©©©©©©©©©©©©©©©
3 Set As Normal
89.60 MHz §££££¤ ¨5
Signal: 62 dBuV
2nd IF: 325.3 kHz
Noise/AM: 0 / 0%
92.20 MHz § L-R ¨5
©menu©©©©©©©©©©©©©©©
9 Channel L-R
Page 19
19
Radio Data System decoding
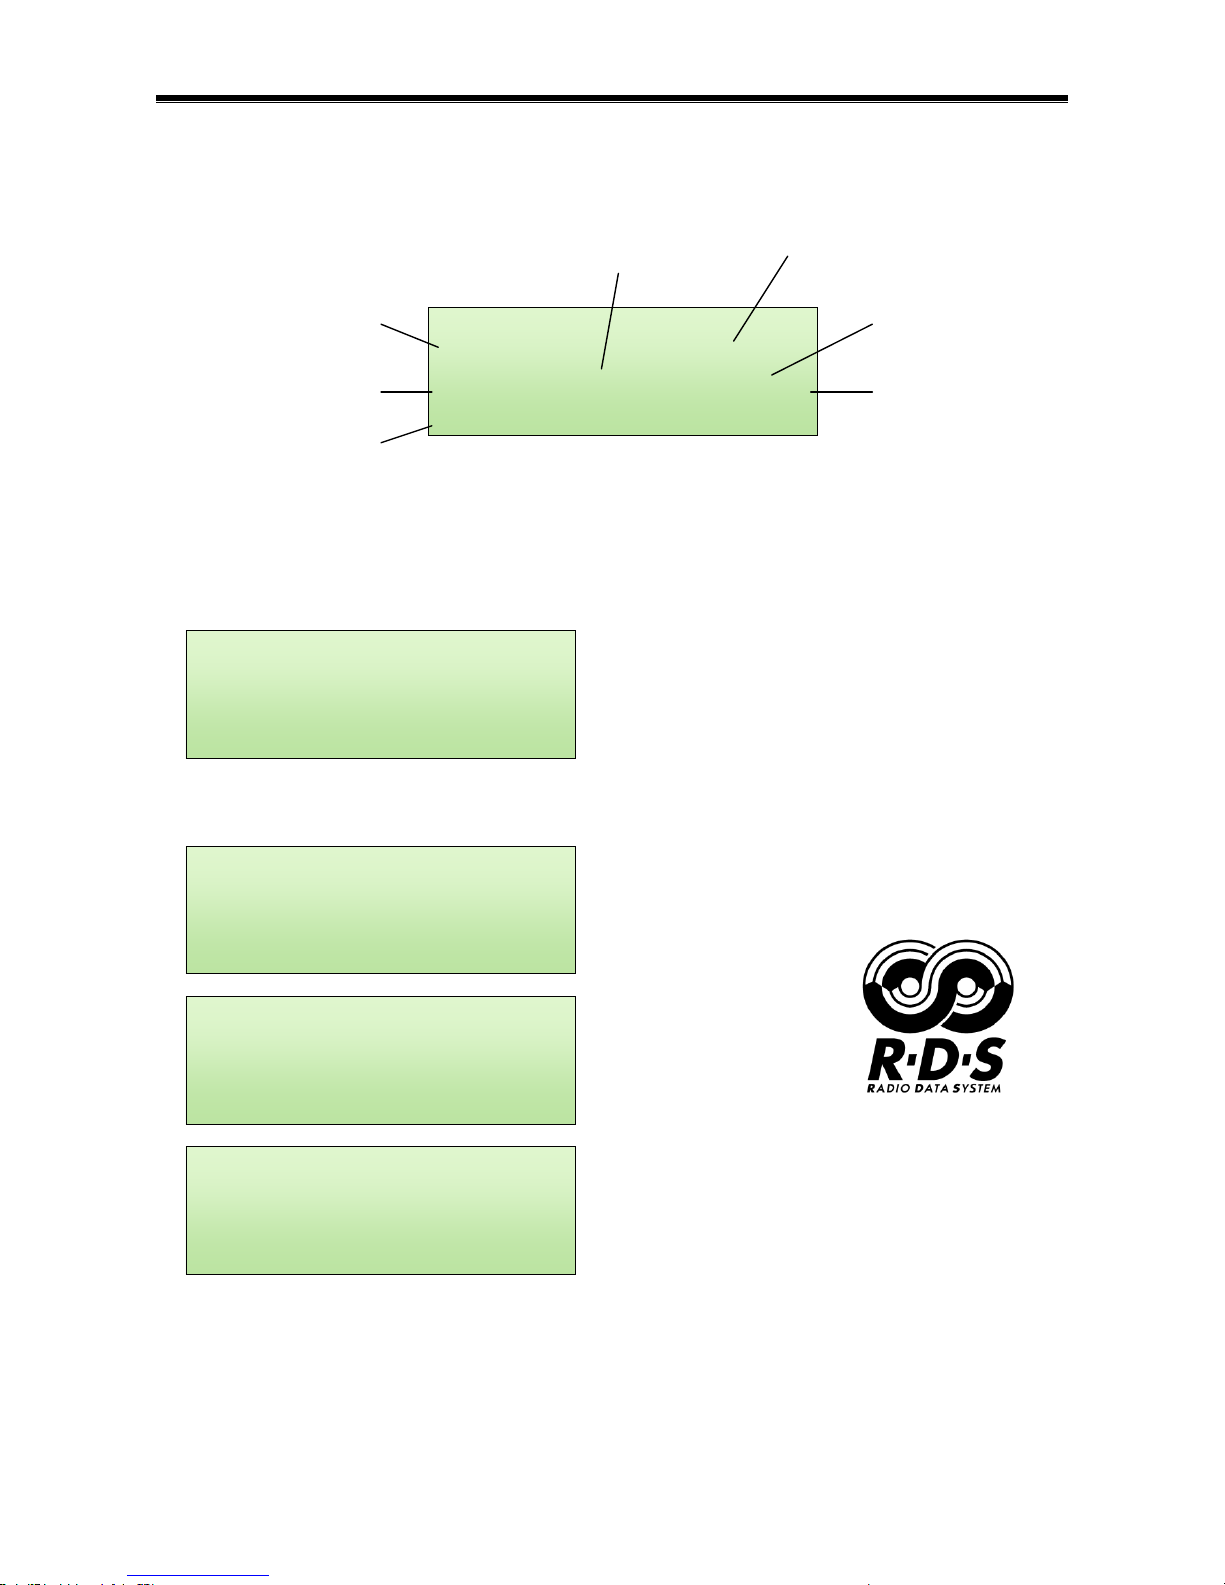
To activate the RDS decoder, disable Measuring first. Set the Mode to RDS. Page 6 shows the basic RDS
information:
If RT+ service is being broadcast, the RT line contains [ ] symbols indicating begin and end of each RT+ tag in the
text. More information is provided on RDS sub-page 15.
When the RDS decoder is active, page 5 shows block error rate (ber) and indicates RDS groups that are being
received. This gives quick survey of the RDS services present in the RDS stream. The group numbers are in
hexadecimal representation:
Detailed RDS information is accessible from page 5 or 6 under the menu item 3 (More RDS Data). Total 48 subpages are provided. Last 32 sub-pages are reserved for group content viewer.
Group order viewer
When you access the Group order sub-page, internal group order buffer starts filling. The group order buffer
capacity is 18 groups. The group order is showed after about 2 seconds and locked for viewing.
99.00 MHz § RDS ¨6
Group Statistics: ¥
0a: 57.0% b: 0.0%
1a: 4.5% b: 0.0%®
99.00 MHz § RDS ¨6
AF: 87.6 98.4 ¥
103.2 104.5
®
99.00 MHz § RDS ¨6
PTY: 15 (EU/US) ¥
Other M /Classicl
PTYN: TRANCE ®
99.00 MHz § RDS ¨5
RDS Groups: ber 0%
a 012.......A...E.
b ................
99.00 MHz § RDS ¨6
[KISS FM ] TP TA AF
13:07 51A4 PTY: 15 M
our phone: 742 256 9
PS
CT
RT
PI
M/S
PTY
TP TA
Page 20
20
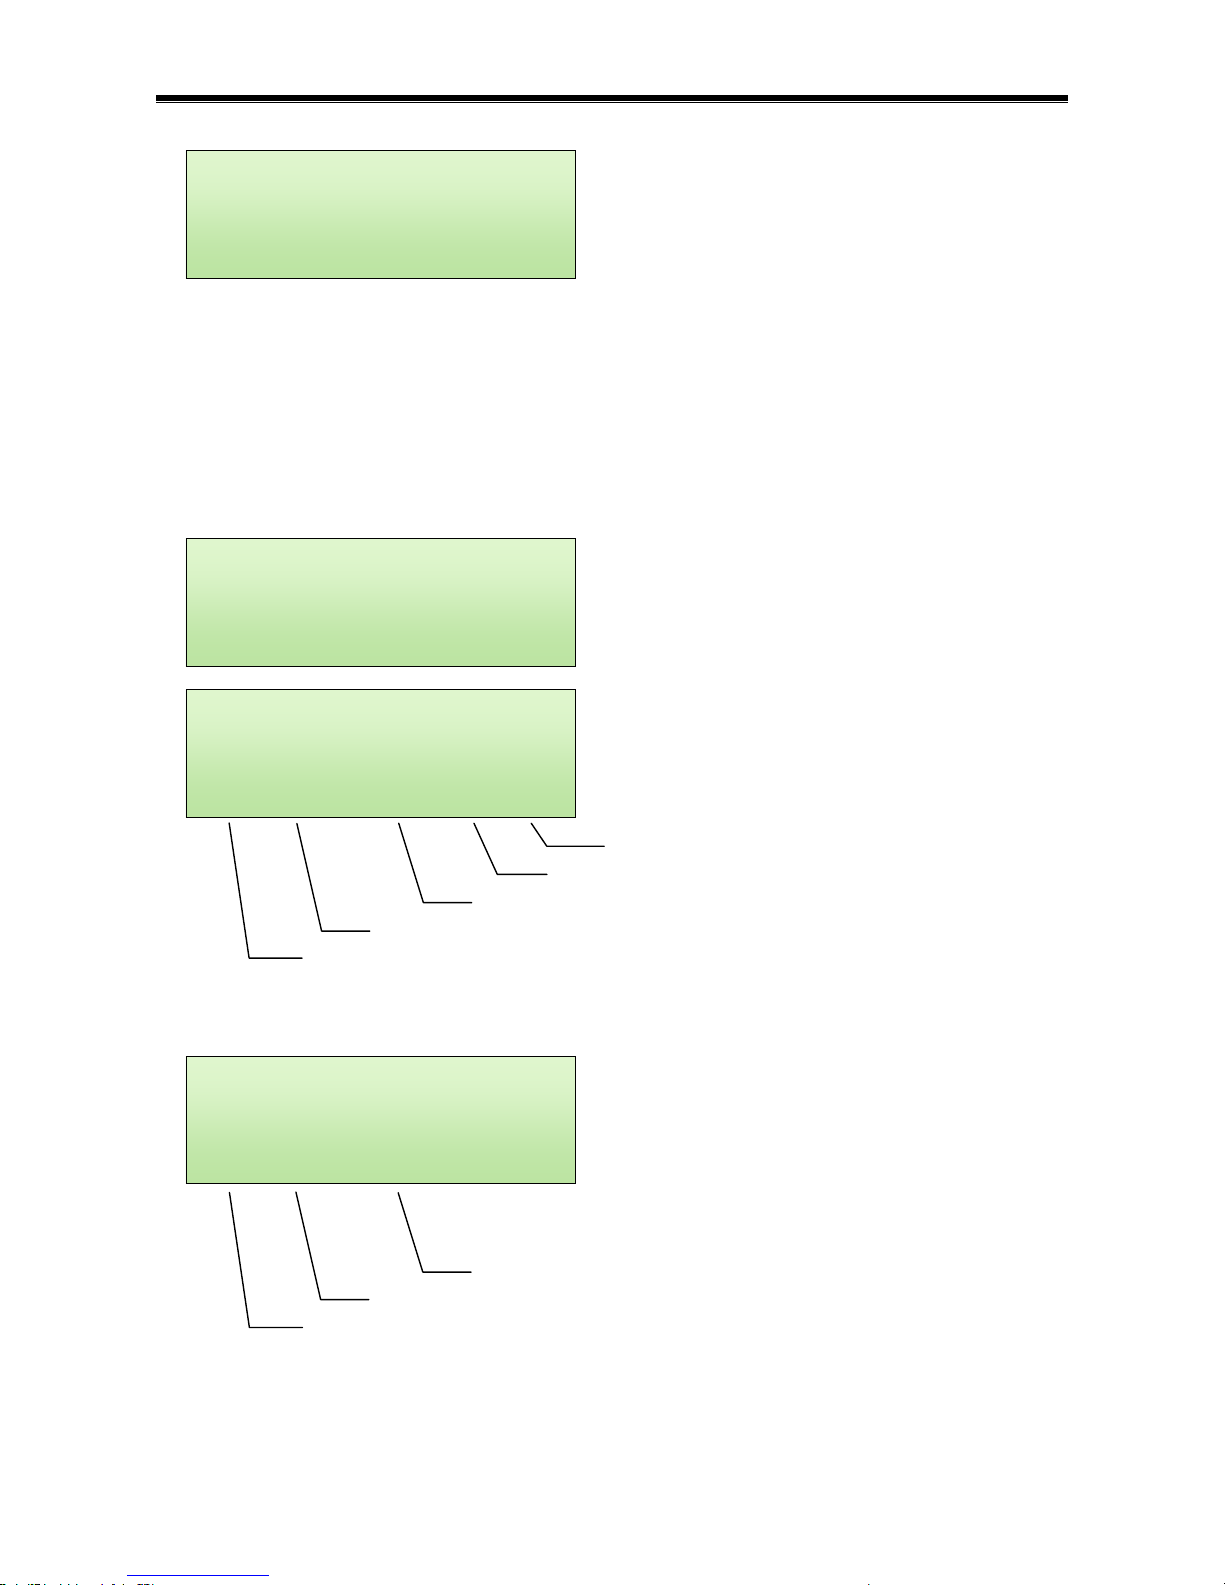
Read the group order line per line from left to right. To view actual group order again, go to previous or next subpage and then back.
Group content viewer
When you access any Group content sub-page, the group content is showed on each error-less reception of the group
type desired. After reception of 3 groups the process is locked for viewing. To view actual group content of the
desired group type again, go to previous or next sub-page and then back. The content does not stay in memory, a
new content is received instead.
Special case is group type 3a (ODA AID) where application group type is directly showed:
89.10 MHz § RDS ¨5
8a 0646 CD46 .F \F ¥
8a 0646 CD46 .F \F
8a 0646 CD46 .F \F ®
89.10 MHz § RDS ¨5
00 EB10 2020 ˇ. ¥
01 7522 4352 u“ CR
02 7B47 2031 {G 1 ®
89.10 MHz § RDS ¨5
... ¥
Group Content 0a ®
89.10 MHz § RDS ¨5
0a 0a 0a 0a 2a 8a ¥
8a 0a 0a 1a 0a 0a
2a 3a 8a 8a 0a 0a ®
Block C (HEX)
Block B (HEX, five LSB’s only)
Block D (HEX)
Block D (ASCII)
Block C (ASCII)
Application group type
Block C (Message)
Block D (Application identification, AID)
Page 21

21
More RDS Data summary
Sub-page
Service / Function
1
Detailed PTY, PTYN
2
EON (PI of other networks), ECC, LIC
3
RT type (A/B), actual RT
4
DI
5-7
AF list
8-13
Group statistics
14
CT, PIN
15
Static PS, actual RT+ markers
(running, toggle, type1, start1, length1, type2, start2, length2)
16
Group order
17
Group content 0a
18
Group content 0b
...
...
23
Group content 3a (ODA AID)
...
...
48
Group content 15b
List of RDS services
RDS Service
Decoded by
the device
RDS Groups
PI (Program Identification)
yes
All
PTY (Program Type)
yes
All
TP (Traffic Program)
yes
All
TA (Traffic Announcement)
yes
0a, 0b, 15b
M/S (Music/Speech)
yes
0a, 0b, 15b
DI (Decoder Identification)
yes
0a, 0b, 15b
PS (Program Service)
yes
0a, 0b
AF (Alternative Frequencies)
yes
0a
ECC (Extended Country Code)
yes
1a
PIN (Program Item Number)
yes
1a
LIC (Language Identification Code)
yes
1a
RT (Radiotext)
yes
2a, 2b
CT (Clock-Time and date)
yes
4a
PTYN (Program Type Name)
yes
10a
EON (Enhanced Other Networks)
yes (PI)
14a, 14b
AID (Application Identification)
yes
3a
RT+ (Radiotext Plus)
yes
3a, 2a, 2b (note 1)
TDC (Transparent Data Channels)
5a, 5b
IH (In-house Applications)
6a, 6b
RP (Radio Paging)
7a, 13a
TMC (Traffic Message Channel)
3a, 8a (note 2)
EWS (Emergency Warning Systems)
9a
Page 22

22
Notes:
1) Does not include the group with tags that is defined in AID group 3a.
2) This is the most frequent group type used for TMC. An indication in the AID group 3a is decisive.
List of ODA applications
AID
Application name
125F
I-FM-RDS for Fixed and Mobile devices
1C68
ITIS In-vehicle database
4BD7
RT Plus
5757
Personal weather station
6552
Enhanced RadioText / eRT
7373
Enhanced early warning system
C350
NRSC Song title and artist
C3B0
iTunes tagging
C3C3
Traffic Plus
C4D4
eEAS
C737
Utility Message Channel
CD46
TMC
E123
APS Gateway
E1C1
Action code
E411
Beacon downlink
Notes:
This is not a complete ODA registration list reference.
Some applications are special purpose only or are used very rarely and may require special receiver.
The most frequent RDS setting errors
Error
Implication
Solution
First PI digit is 0 (zero).
RDS is not working on some
receivers.
First PI digit can’t be 0. It should
be set in accordance with the
country where the station is
located.
Two different stations have the
same last two PI digits, for
example 5AFF and 51FF.
Car radios switch between different
stations oneself.
Stations that carry different
program entire day must be
unambiguously identified by the
last two PI digits.
AF list contains more frequencies
but second PI digit is 0, for
example 603B.
Many receivers ignore the AF list
and listener must tune manually to
the strongest frequency.
The second PI digit can’t be 0 if
the station has more transmitters
listed in AF.
The station uses only one
transmitter but second PI digit is
not 0, for example FFFF.
Car radios search for another
frequency using PI seek, this takes
up to one minute, of course without
any result.
The second PI digit must be 0 if the
station has only one transmitter
(local station).
Page 23
23
USB and COM Port Communication
Connecting the FM analyzer to a PC
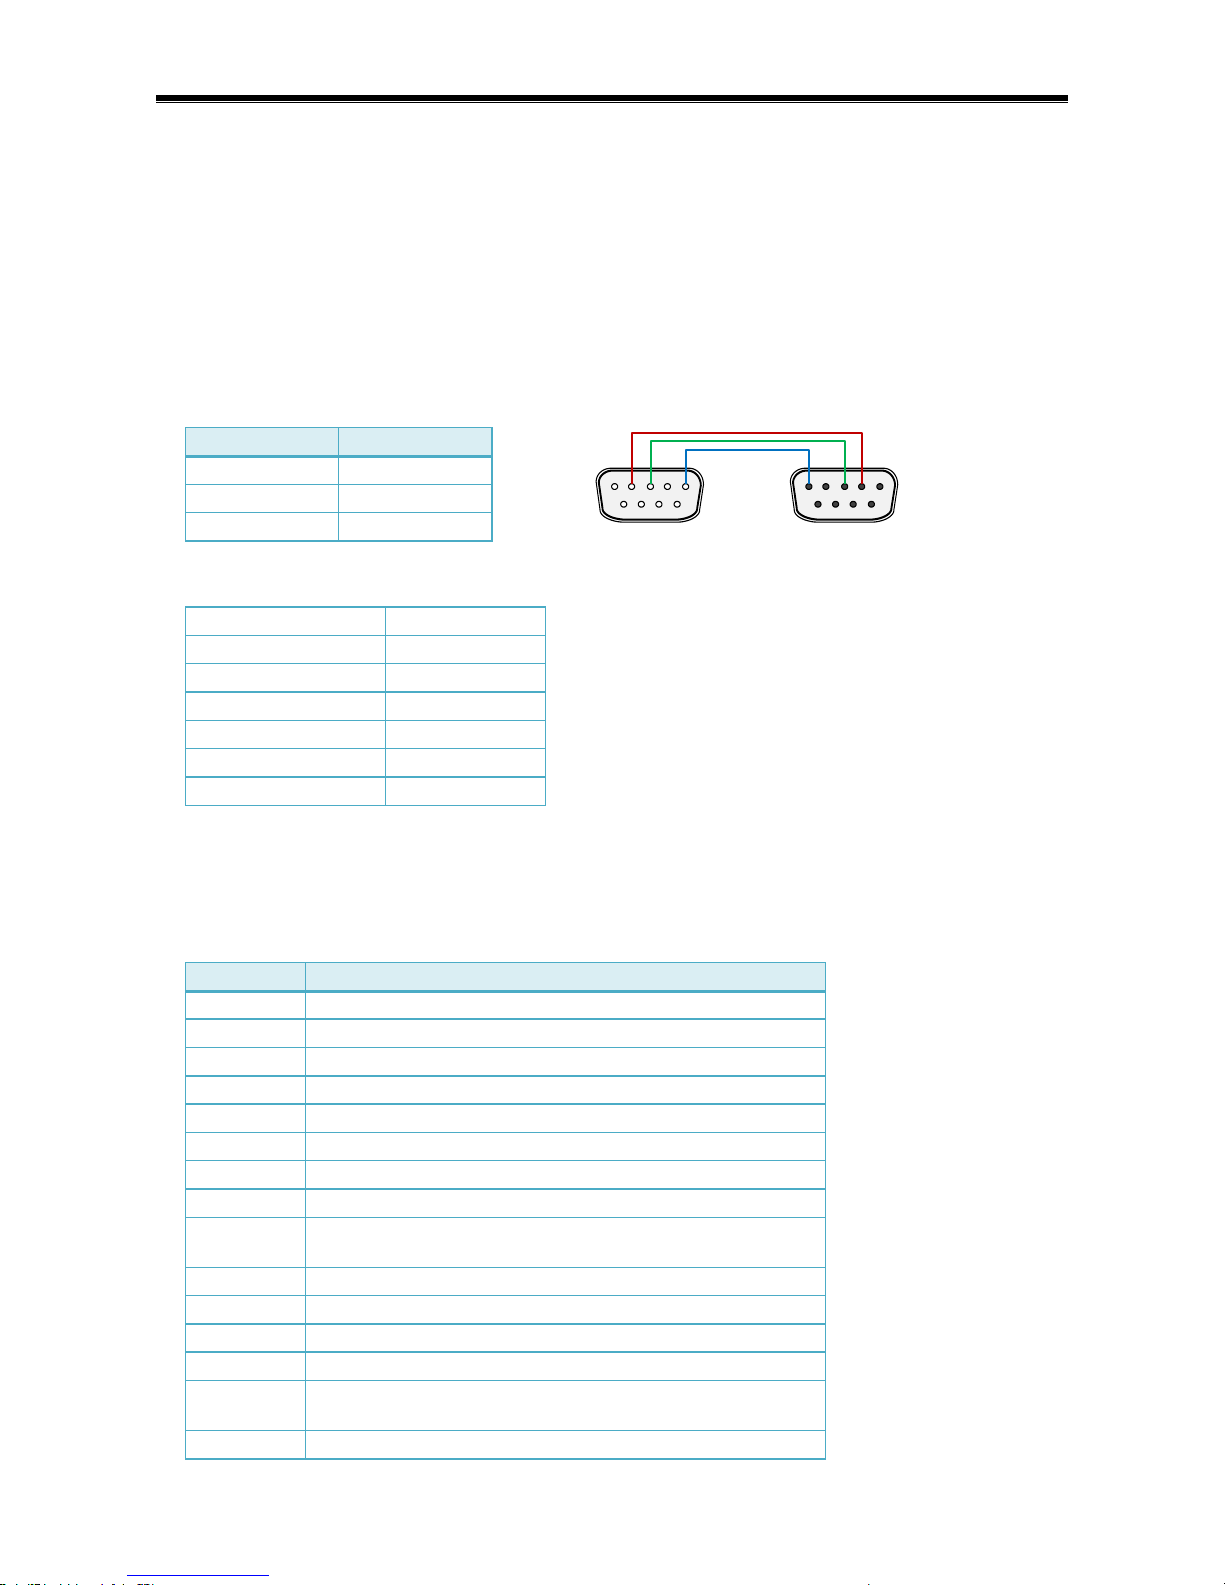
For configuration and control requirements a PC is connected to the FM analyzer via standard RS-232 interface
provided by D-SUB9 female connector (DCE) on the FM analyzer side. On the PC side locate an unused COM port.
If the free port exists in a form of 25-pin connector, use a standard D-SUB9 (male) to D-SUB25 (female) adapter.
It’s preferable to use standard modem serial cable with one male and one female connector. Any USB to RS-232
adapter can be also used.
The P175 version allows direct USB connection. Using appropriate drivers the device will appear as a new COM
port in the system so the method of software access is the same for both the RS-232 or USB connections.
FM analyzer
PC
2 (TxD)
2 (RxD)
3 (RxD)
3 (TxD)
5 (GND)
5 (GND)
Configure the communication parameters as follows:
Transmission speed
19200 bps
Data bits
8
Parity
None
Stop bits
1
Flow control
None
Parity checking
No
Carrier detection
No
List of commands and configuration registers
Note 1: There is no need to validate the commands by any additional character or key, such as <Enter>.
Note 2: Some commands have their equivalent in the FM analyzer’s menu.
Command
Meaning
*+
Tune up (one step).
*-
Tune down (one step).
*P
Switch on the modulation power sending.
*p
Switch off the modulation power sending.
*M
Switch on the MAX value sending.
*m
Switch off the MAX value sending.
*R
Switch on RDS groups content sending
*r
Switch off RDS groups content sending
*F
Tune to a frequency entered in kHz.
Example (tune to 96.2 MHz): 096200*F
*S
Save settings to EEPROM, incl. DIP switches and alarm registers
*E
Set the unit to measuring mode
*D
Set the unit to RDS decoding mode
*B
Set the unit to stereo decoding mode
*L
Load station data saved in EEPROM memory.
Example (load file 3): 03*L
*C
Clear data.
1 2 3 4 5
6 7 8 9
DB9 male
5 4 3 2 1
9 8 7 6
DB9 fem ale
Page 24

24
RESET*X
Hardware reset.
DIPx:y*X
Set DIP switch.
Example (set tuning step to 100 kHz): DIP2:1*X
ARx:yy*X
Set alarm register.
Example (set silence detector threshold to 25 kHz): ARA:25*X
*1 to *6
Switch the LCD view to page 1 to 6.
*0
Activate the LCD backlight.
Commands returning value
Command
Meaning
?B
Return all basic data.
?F
Return actual receiver frequency.
?R
Return the RDS deviation value.
?L
Return the pilot deviation value.
?P
Return actual modulation power value.
?M
Return actual frequency deviation MAX value.
?A
Return actual frequency deviation AVE value.
?N
Return actual frequency deviation MIN value.
?O
Return actual frequency deviation MIN Hold value.
?Q
Return the signal quality (0-5).
?D
Return RDS data.
?T
Return RDS group statistics.
?E
Return the pilot-to-RDS phase difference.
?G
Return the signal information (strength, IF, noise).
?H
Return the frequency deviation histogram data.
?I
Return the 2nd IF.
?C
Return the channel balance (Hz*100/Hz*100, stereo mode only).
?X
Return actual frequency deviation MAX Hold value.
?S
Return actual FFT data.
?U
Return signal level (P175 only)
?V
Return firmware version.
No response: version 1.3a or older
1: version 1.3b, 2: version 1.3c, 3: version 1.4, 4: version 1.5
?a
Return address content in ASCII format.
Syntax: (address),(length)?a
Example (return actual radiotext): 19C,040?a
?h
Return address content in HEX format.
Syntax: (address),(length)?h
Example (return actual PI): 032,002?h
Note:
See Annexes for commented memory map.
Page 25
25
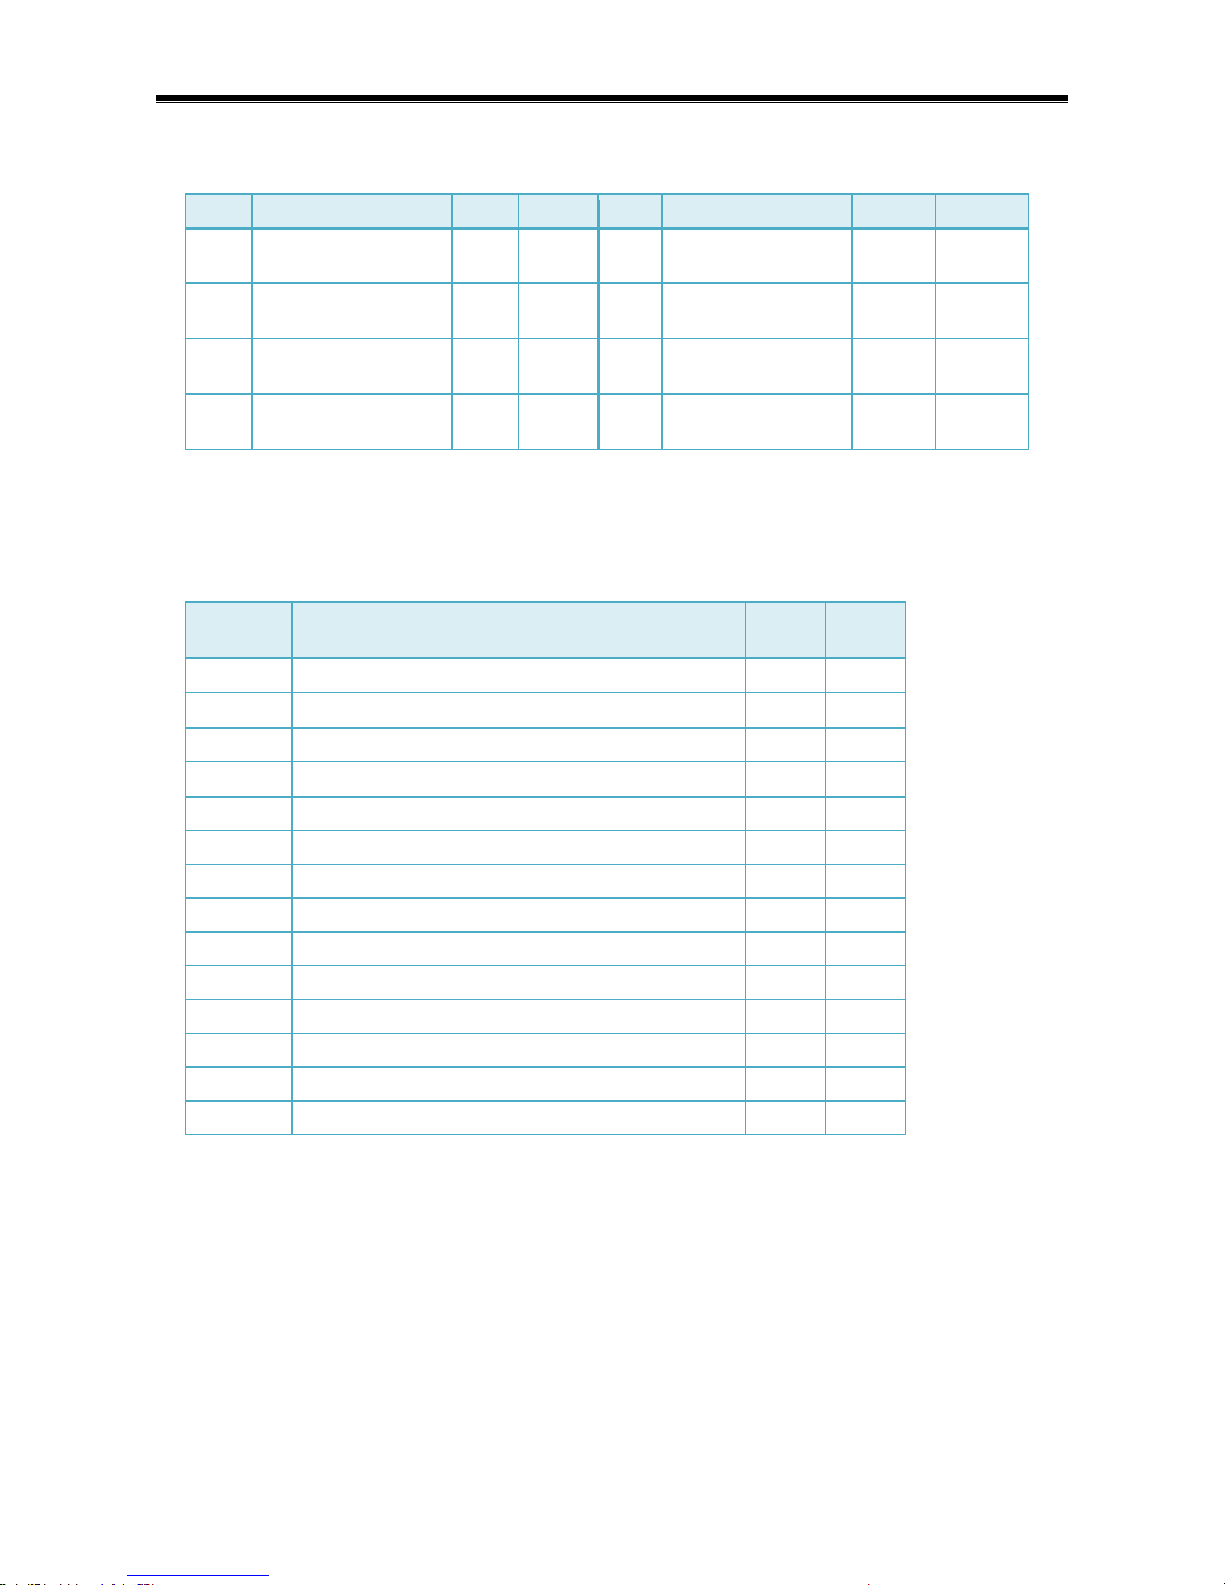
DIP switches
Meaning
0 1
Meaning
0
1
DIP0
LCD backlight
Auto
Manual
DIP1
Manual LCD
backlight
Off
On
DIP2
Tuning step
50
kHz
100
kHz
DIP3
Scan sensitivity
Low
High
DIP4
Optional LED bargraph
hardware installed
No
Yes
DIP5
J3 pin 2 state (P75)
J2 pin 1 state (P175)
0
1
DIP6
Noise cancellation
between stations
Off
On
Note:
By default, all DIP switches are set to 0 except for DIP2.
Alarm registers (P175)
Register
Meaning
Default
value
Unit
A
Silence detector F AVE minimum
25
kHz
B
Overmodulation F MAX Hold maximum
88
kHz
C
Overmodulation Histogram MAX At maximum
78
kHz
D
Overmodulation F AVE maximum
78
kHz
E
Pilot minimum
58
kHz/10
F
Pilot maximum
77
kHz/10
G
RDS minimum
00
kHz/10
H
RDS maximum
85
kHz/10
I
Signal lost time duration
03
s*10
J
Silence time duration
06
s*10
K
Overmodulation time duration
06
s*10
L
Pilot or RDS error time duration
06
s*10
M
Alarm time hysteresis (common to all alarms)
01
s N (Reserved – currently it may be used to store any value)
00
-
Notes (Alarm registers):
1. The alarm registers value range is 00 to 99 (DEC).
2. The built-in alarm feature works independently from any alarms realized in the Windows control software.
3. Due to characteristics of common radio signals it is not recommended to set very short time duration and
very long time hysteresis.
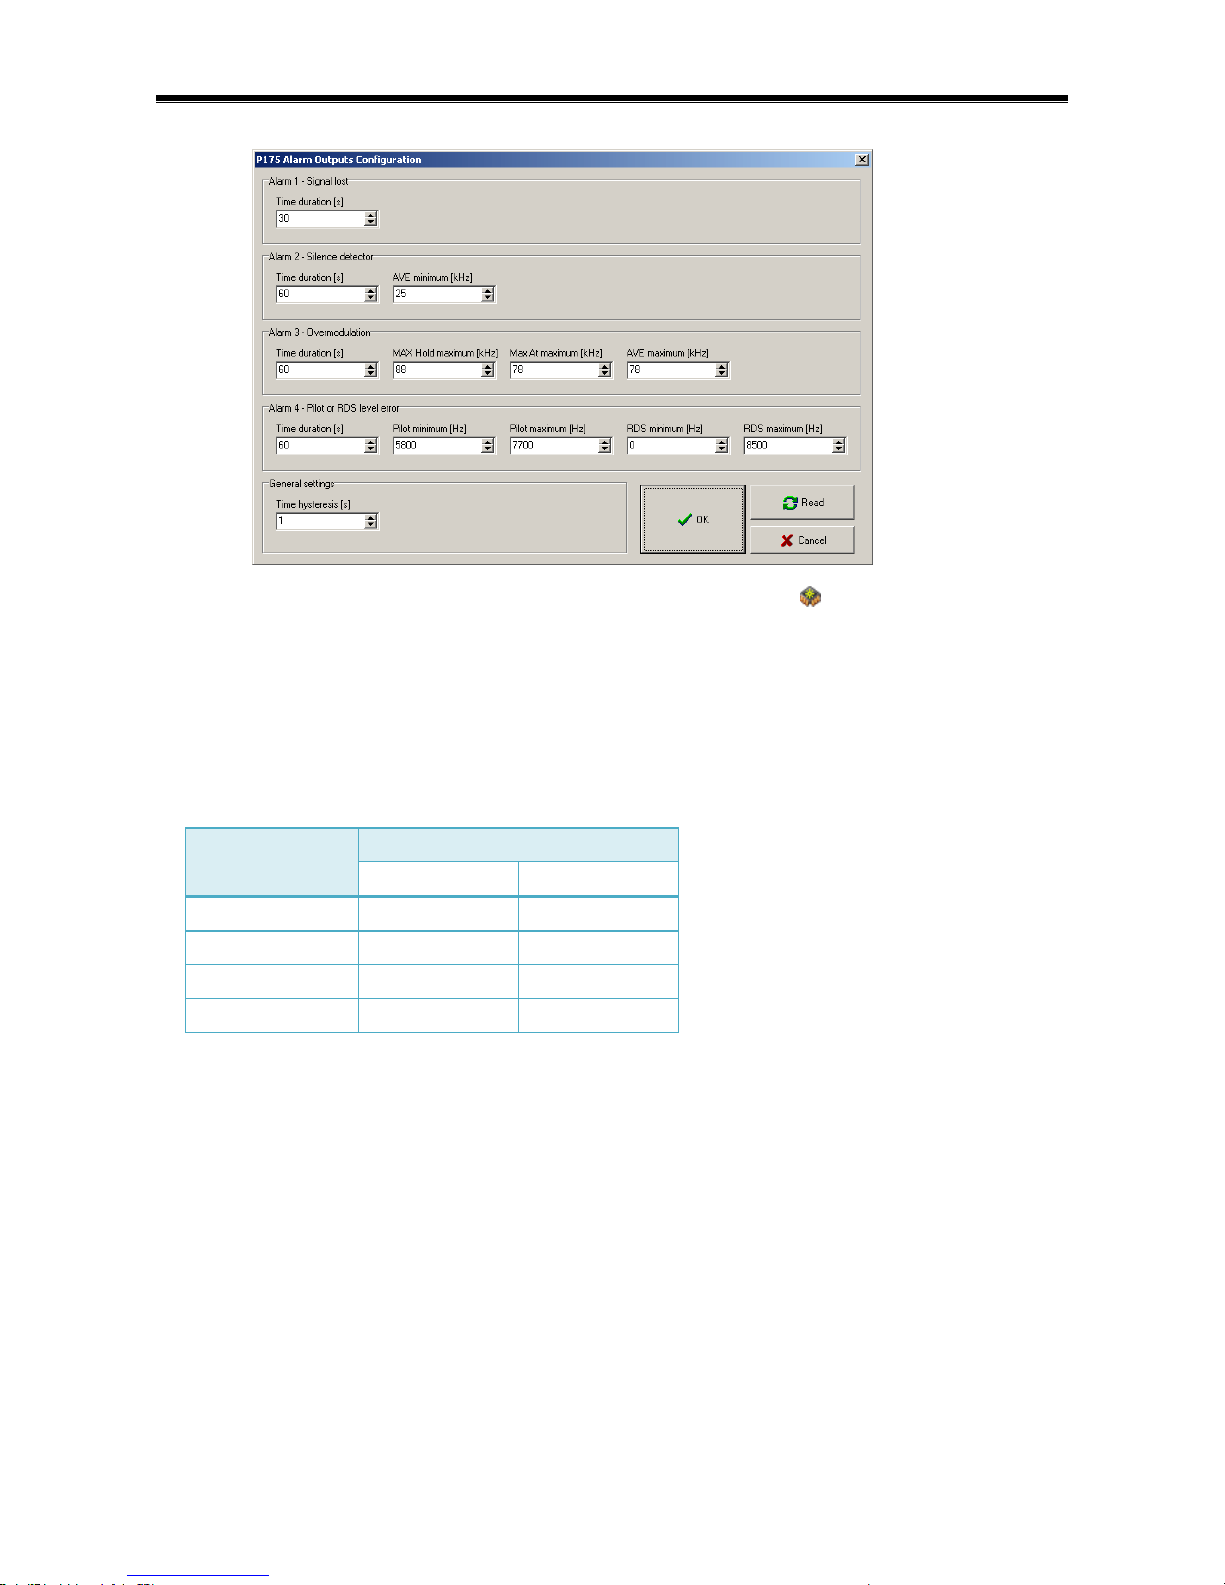
4. For user-interactive setting of the alarm feature use the Windows FM Scope application.
Select Options – Alarm Outputs in the main menu:
Page 26
26
To store the settings to a non-volatile EEPROM memory, use the button in tool bar.
Using the Alarm output pins as general purpose outputs (P175)
Storing a special value to the time duration alarm registers (I to L) the alarm output is overridden by user defined
state. This special value can be either GD for logical low (0) or GH for logical high (1).
This feature can be used for switching of external circuits using up to four independent logical outputs. General
purpose outputs can be controlled regardless of the operating mode.
J1 – Alarm output
pin number
Command required
to force low (0)
to force high (1)
2
ARI:GD*X
ARI:GH*X
3
ARJ:GD*X
ARJ:GH*X
4
ARK:GD*X
ARK:GH*X
5
ARL:GD*X
ARL:GH*X
Notes:
1. Pin 1 is located on the right.
2. It may take up to one second before the pin state is updated.
3. To control the pin state from the FM Scope script, use the command send, for example:
send(ARI:GD*X)
4. To reactivate all alarms, place valid numerical values (00-99) into the time duration registers. Optionally
store the setting to EEPROM and restart the unit.
Page 27
27
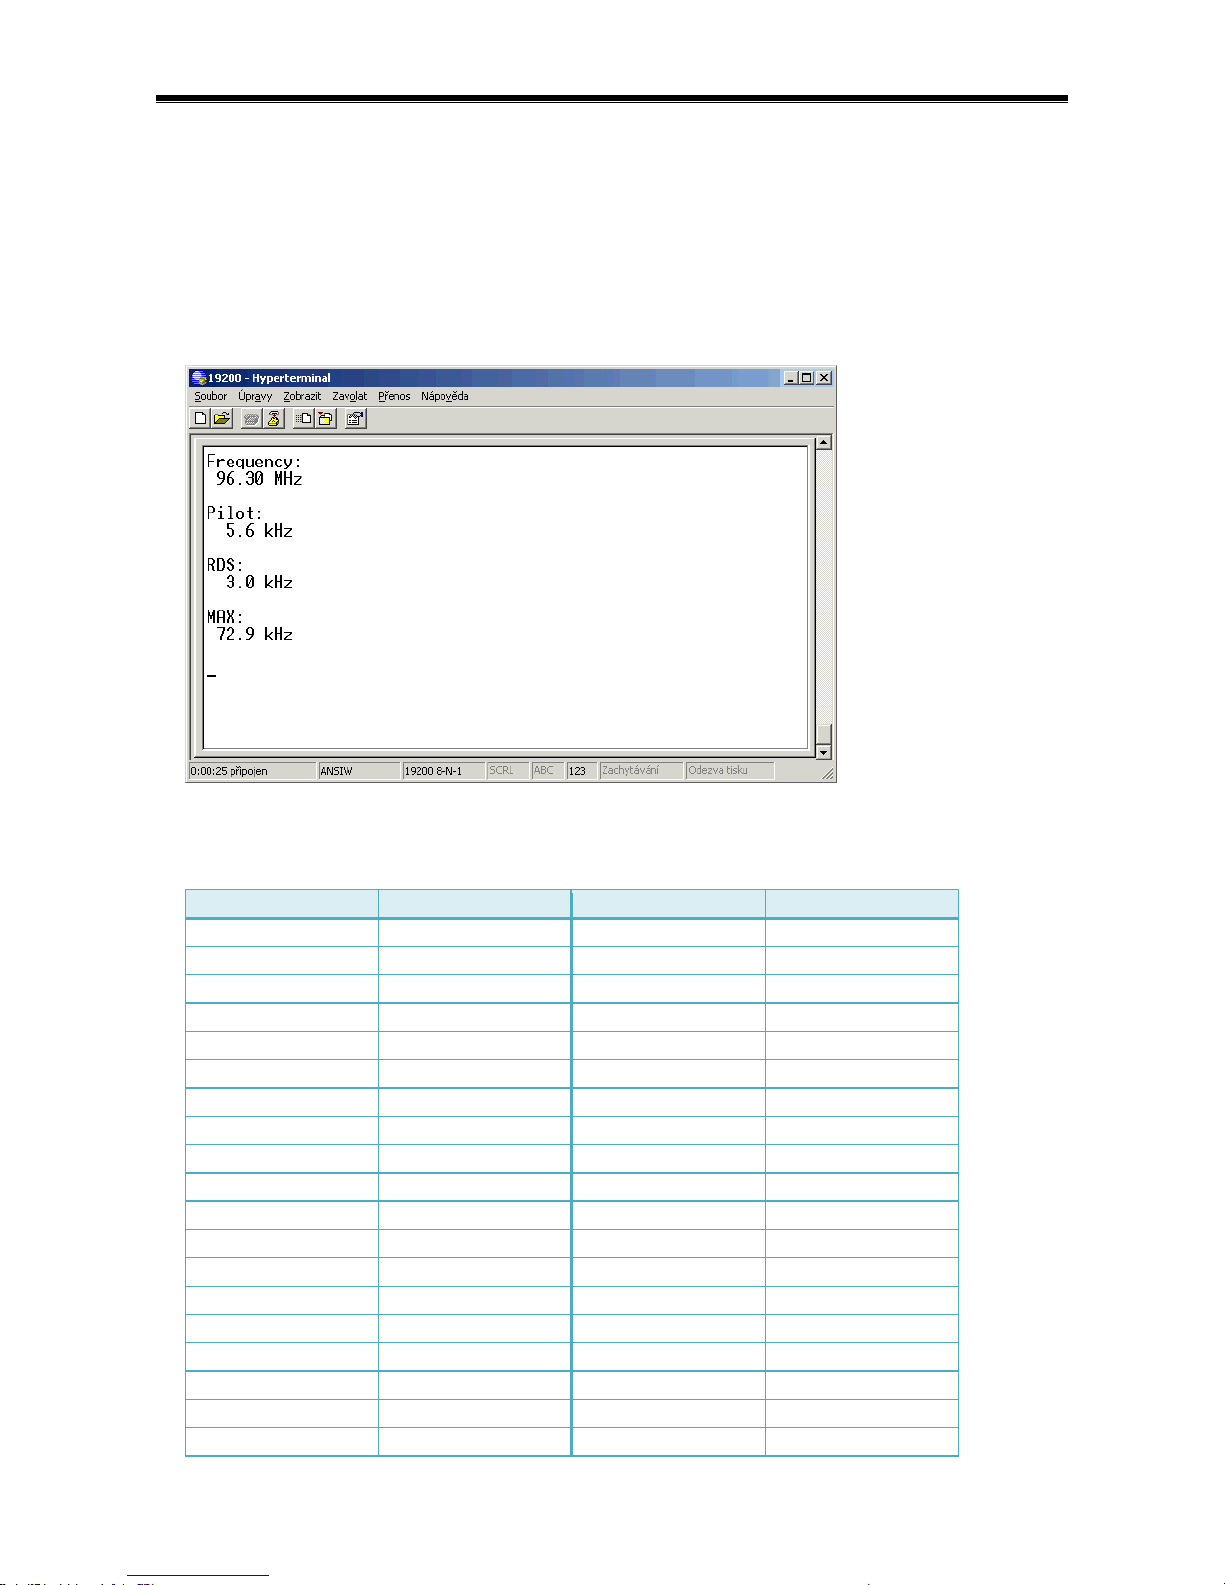
Data format
The format of all data returned by the device is defined as follows:
key+":"+Chr(13)+Chr(10)+Chr(13)+Chr(10)
(if return value is empty)
key+":"+Chr(13)+Chr(10)+value+Chr(13)+Chr(10)+Chr(13)+Chr(10)
(otherwise)
Example of the outputs when using Windows HyperTerminal. Local echo is off.
List of keys
Key
Invoked by
Key
Invoked by
Frequency
?F
Pilot
?L
G
*R
RDS
?R
PS
?D
RDS Group Statistics
?T
PI
?D
MAX
?M or *M
RT
?D
AVE
?A
LTO
?D
MIN
?N
CT
?D
IF
?I
PTY
?D
ASCII
xxx,xxx?a
MS
?D
HEX
xxx,xxx?h
TP
?D
FV
?V
TA
?D
Signal Quality
?Q
AF
?D
Fast Signal Info
?G
DI
?D
Modulation Power
?P
EON
?D
Pm
*P
ECC
?D
RDS Phase Difference
?E
LIC
?D
Histogram Data
?H
PTYN
?D
FFT Data
?S
PIN
?D
MAX Hold
?X
R/L
?C
Level
?U
Page 28
28
Service Part
Firmware update
The FM analyzer has a firmware update capability. This allows easily implementing of new features. When a new
firmware version is released, a special simple Windows application provides the firmware update. The firmware
updates are provided at no additional costs.
1. Connect the FM analyzer to any local COM port or USB port (P175).
2. Run the update utility, select the COM port and click Start! button.
3. Turn on the FM analyzer if not done yet.
4. The upgrade process is fully automated and takes about 1 minute.
Please refer to the web site for more information.
Don’t forget to download also actual control software and manual with the new firmware! Keep all parts the same
version!
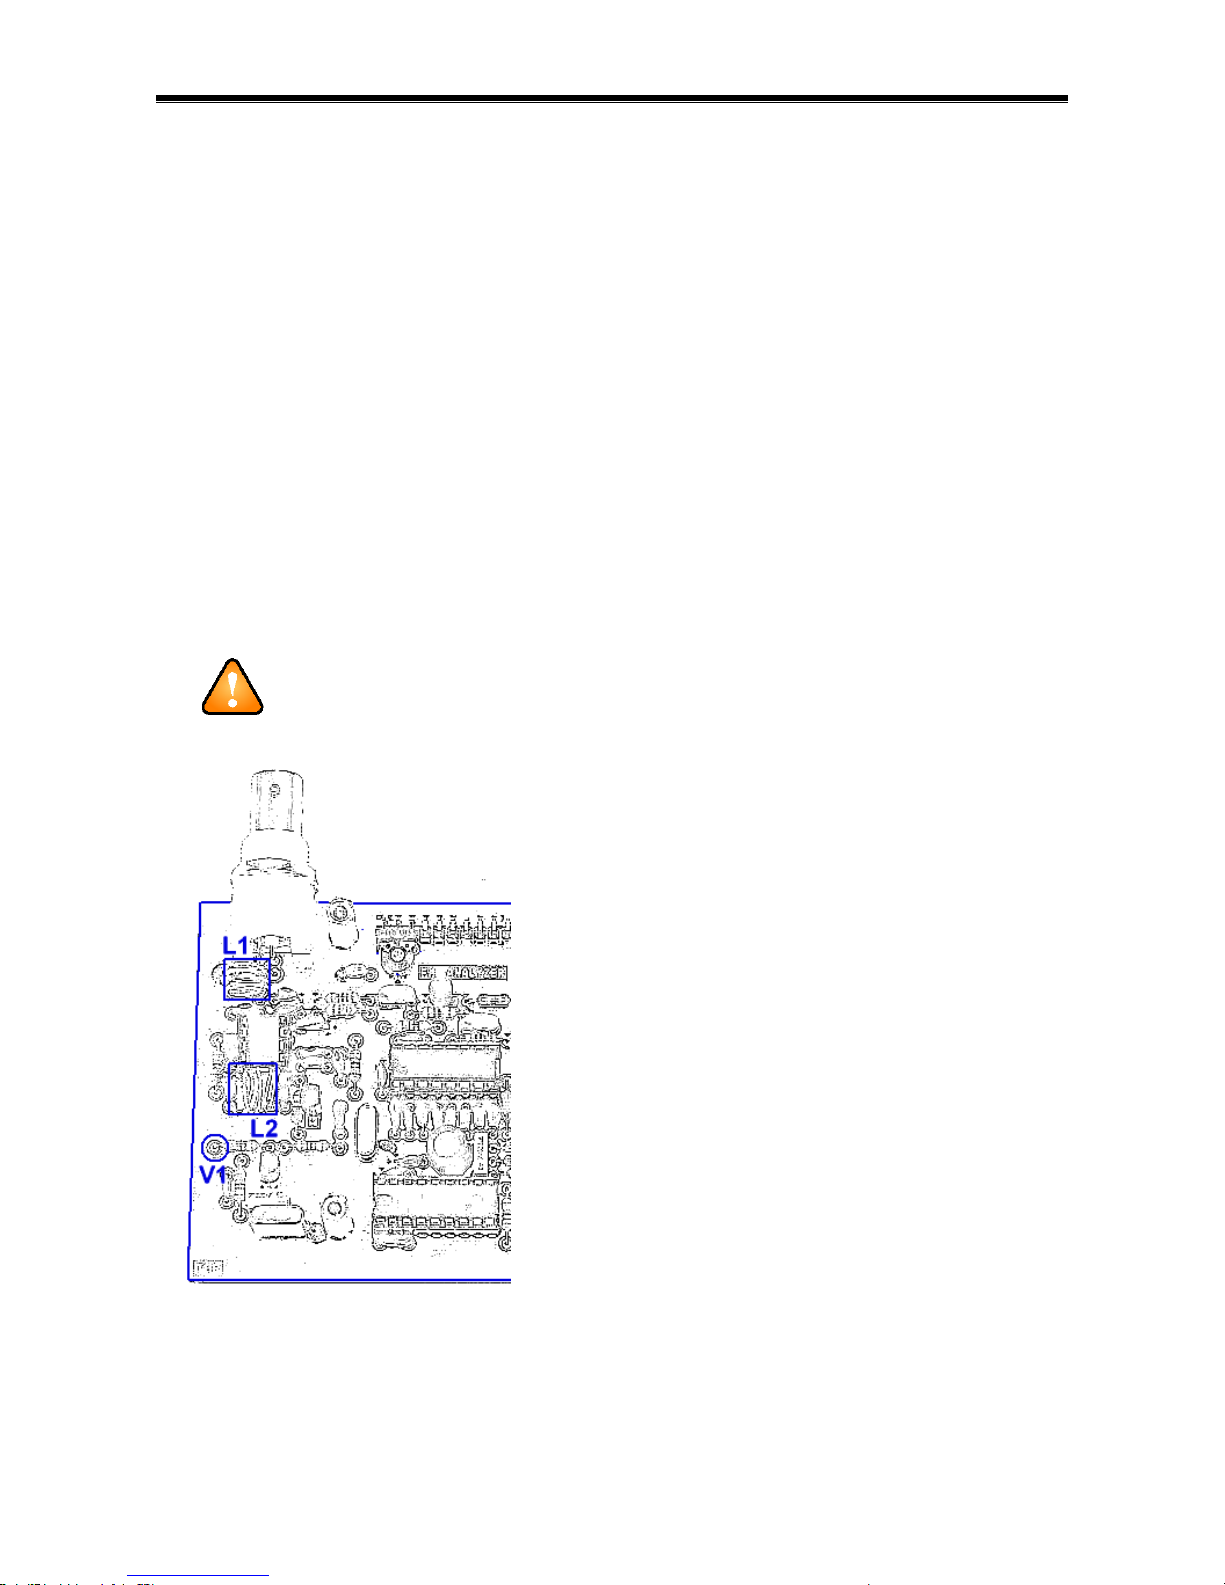
Superheterodyne receiver ganging
This operation should make a qualified person only!
Under normal conditions there is no need to proceed this operation!
The device comes optimally adjusted from factory!
User should not touch the coils!
L1 – Antenna coil
L2 – Oscillator coil
V1 / Ut – Tuning voltage
1. Tune the unit to 108.0 MHz.
2. Adjust the tuning voltage to 4.0 V by oscillator coil. The tuning voltage tolerance at 108.0 MHz is ±0.1 V.
3. With the antenna connected tune any station in range 89.0-92.0 MHz and adjust antenna coil to the best
(strongest) signal.
Page 29

29
Annexes
Memory map
Address
Length
Content
Unit
01A
002
Actual receiver frequency raised by 1065
kHz*10
020
002
DIP switches (bit 0 = DIP0)
-
024
002
Pilot deviation
Hz*10
026
002
RDS deviation
Hz*10
028
002
Pilot to RDS phase difference
deg.
02A
002
ΔF MAX
Hz*10
02C
002
ΔF AVE
Hz*10
02E
002
Modulation power (linear)
1/100
030
002
ΔF MIN Hold
Hz*10
032
002
RDS PI
-
034
008
RDS static PS
-
03C
001
RDS PTY
-
03E
002
RDS status bits,
bit 10: CT indicator, bit 9: RT indicator, bit 8: RT Type (A/B), bit 7:
AF indicator, bit 6: TP, bit 5: TA, bit 4: MS, bits 3 to 0: DI.
-
040
020
RDS group counters (0a, 0b, 1a, 1b, ... 15b)
-
060
01A
RDS AF list
channel No.
07A
008
RDS EON PI (up to 4)
-
082
001
Signal quality
-
088
002
ΔF MAX Hold
Hz*10
08E
001
Amplitude modulation (0xFF = not available)
%
144
002
ΔF in last 50 ms time period (0xFFFF = not available due to noise)
Hz*10
146
002
Noise level averaged over 1 sec.
-
19C
040
RDS RT
-
1DC
008
RDS PTYN
-
1E4
001
RDS CT Hour
-
1E6
001
RDS CT Minute
-
1EA
003
RDS MJD
-
1EE
001
RDS RT+ group type
-
1EF
001
RDS RT+ status
-
1F0
001
RDS RT+ item 1 type
-
1F1
001
RDS RT+ item 1 start
-
1F2
001
RDS RT+ item 1 length
-
1F3
001
RDS RT+ item 2 type
-
1F4
001
RDS RT+ item 2 start
-
1F5
001
RDS RT+ item 2 length
-
1F8
001
RDS PIN day
-
1F9
001
RDS PIN hour
-
1FA
001
RDS PIN minute
-
1FB
001
RDS LIC
-
1FC
001
RDS ECC
-
1FD
001
RDS CT local time offset
half of hour
Page 30

30
48C
002
Instant Modulation power (linear)
1/1755
4CE
001
Alarm - Silence detector F AVE minimum
kHz
4CF
001
Alarm - Overmodulation F MAX Hold maximum
kHz
4D0
001
Alarm - Overmodulation Histogram MAX At maximum
kHz
4D1
001
Alarm - Overmodulation F AVE maximum
kHz
4D2
001
Alarm - Pilot minimum
kHz/10
4D3
001
Alarm - Pilot maximum
kHz/10
4D4
001
Alarm - RDS minimum
kHz/10
4D5
001
Alarm - RDS maximum
kHz/10
4D6
001
Alarm - Signal lost time duration
s*10
4D7
001
Alarm - Silence time duration
s*10
4D8
001
Alarm - Overmodulation time duration
s*10
4D9
001
Alarm - Pilot or RDS error time duration
s*10
4DA
001
Alarm - Alarm time hysteresis
s
572
0F4
ΔF Histogram
-
Important notes:
Lower byte is carried first (higher byte is placed at Address+1 for 2-bytes variables).
The Address and Length values are in HEX format.
 Loading...