

Page 1

Interplay® Central Services
Service and Server Clustering Overview
Version 1.8
Page 2

Legal Notices
Product specifications are subject to change without notice and do not represent a commitment on the part of Avid Technology, Inc.
This product is subject to the terms and conditions of a software license agreement provided with the software. The product may
only be used in accordance with the license agreement.
This product may be protected by one or more U.S. and non-U.S patents. Details are available at www.avid.com/patents
This document is protected under copyright law. An authorized licensee of Interplay Central may reproduce this publication for the
licensee’s own use in learning how to use the software. This document may not be reproduced or distributed, in whole or in part, for
commercial purposes, such as selling copies of this document or providing support or educational services to others. This document
is supplied as a guide for Interplay Central. Reasonable care has been taken in preparing the information it contains. However, this
document may contain omissions, technical inaccuracies, or typographical errors. Avid Technology, Inc. does not accept
responsibility of any kind for customers’ losses due to the use of this document. Product specifications are subject to change without
notice.
Copyright © 2014 Avid Technology, Inc. and its licensors. All rights reserved.
The following disclaimer is required by Apple Computer, Inc.:
APPLE COMPUTER, INC. MAKES NO WARRANTIES WHATSOEVER, EITHER EXPRESS OR IMPLIED, REGARDING THIS
PRODUCT, INCLUDING WARRANTIES WITH RESPECT TO ITS MERCHANTABILITY OR ITS FITNESS FOR ANY PARTICULAR
PURPOSE. THE EXCLUSION OF IMPLIED WARRANTIES IS NOT PERMITTED BY SOME STATES. THE ABOVE EXCLUSION
MAY NOT APPLY TO YOU. THIS WARRANTY PROVIDES YOU WITH SPECIFIC LEGAL RIGHTS. THERE MAY BE OTHER
RIGHTS THAT YOU MAY HAVE WHICH VARY FROM STATE TO STATE.
The following disclaimer is required by Sam Leffler and Silicon Graphics, Inc. for the use of their TIFF library:
Copyright © 1988–1997 Sam Leffler
Copyright © 1991–1997 Silicon Graphics, Inc.
Permission to use, copy, modify, distribute, and sell this software [i.e., the TIFF library] and its documentation for any purpose is
hereby granted without fee, provided that (i) the above copyright notices and this permission notice appear in all copies of the
software and related documentation, and (ii) the names of Sam Leffler and Silicon Graphics may not be used in any advertising or
publicity relating to the software without the specific, prior written permission of Sam Leffler and Silicon Graphics.
THE SOFTWARE IS PROVIDED “AS-IS” AND WITHOUT WARRANTY OF ANY KIND, EXPRESS, IMPLIED OR OTHERWISE,
INCLUDING WITHOUT LIMITATION, ANY WARRANTY OF MERCHANTABILITY OR FITNESS FOR A PARTICULAR PURPOSE.
IN NO EVENT SHALL SAM LEFFLER OR SILICON GRAPHICS BE LIABLE FOR ANY SPECIAL, INCIDENTAL, INDIRECT OR
CONSEQUENTIAL DAMAGES OF ANY KIND, OR ANY DAMAGES WHATSOEVER RESULTING FROM LOSS OF USE, DATA OR
PROFITS, WHETHER OR NOT ADVISED OF THE POSSIBILITY OF DAMAGE, AND ON ANY THEORY OF LIABILITY, ARISING
OUT OF OR IN CONNECTION WITH THE USE OR PERFORMANCE OF THIS SOFTWARE.
The following disclaimer is required by the Independent JPEG Group:
This software is based in part on the work of the Independent JPEG Group.
This Software may contain components licensed under the following conditions:
Copyright (c) 1989 The Regents of the University of California. All rights reserved.
Redistribution and use in source and binary forms are permitted provided that the above copyright notice and this paragraph are
duplicated in all such forms and that any documentation, advertising materials, and other materials related to such distribution and
use acknowledge that the software was developed by the University of California, Berkeley. The name of the University may not be
used to endorse or promote products derived from this software without specific prior written permission. THIS SOFTWARE IS
PROVIDED ``AS IS'' AND WITHOUT ANY EXPRESS OR IMPLIED WARRANTIES, INCLUDING, WITHOUT LIMITATION, THE
IMPLIED WARRANTIES OF MERCHANTABILITY AND FITNESS FOR A PARTICULAR PURPOSE.
Copyright (C) 1989, 1991 by Jef Poskanzer.
Permission to use, copy, modify, and distribute this software and its documentation for any purpose and without fee is hereby
granted, provided that the above copyright notice appear in all copies and that both that copyright notice and this permission notice
appear in supporting documentation. This software is provided "as is" without express or implied warranty.
Copyright 1995, Trinity College Computing Center. Written by David Chappell.
.
2
Page 3

Permission to use, copy, modify, and distribute this software and its documentation for any purpose and without fee is hereby
granted, provided that the above copyright notice appear in all copies and that both that copyright notice and this permission notice
appear in supporting documentation. This software is provided "as is" without express or implied warranty.
Copyright 1996 Daniel Dardailler.
Permission to use, copy, modify, distribute, and sell this software for any purpose is hereby granted without fee, provided that the
above copyright notice appear in all copies and that both that copyright notice and this permission notice appear in supporting
documentation, and that the name of Daniel Dardailler not be used in advertising or publicity pertaining to distribution of the software
without specific, written prior permission. Daniel Dardailler makes no representations about the suitability of this software for any
purpose. It is provided "as is" without express or implied warranty.
Modifications Copyright 1999 Matt Koss, under the same license as above.
Copyright (c) 1991 by AT&T.
Permission to use, copy, modify, and distribute this software for any purpose without fee is hereby granted, provided that this entire
notice is included in all copies of any software which is or includes a copy or modification of this software and in all copies of the
supporting documentation for such software.
THIS SOFTWARE IS BEING PROVIDED "AS IS", WITHOUT ANY EXPRESS OR IMPLIED WARRANTY. IN PARTICULAR,
NEITHER THE AUTHOR NOR AT&T MAKES ANY REPRESENTATION OR WARRANTY OF ANY KIND CONCERNING THE
MERCHANTABILITY OF THIS SOFTWARE OR ITS FITNESS FOR ANY PARTICULAR PURPOSE.
This product includes software developed by the University of California, Berkeley and its contributors.
The following disclaimer is required by Paradigm Matrix:
Portions of this software licensed from Paradigm Matrix.
The following disclaimer is required by Ray Sauers Associates, Inc.:
“Install-It” is licensed from Ray Sauers Associates, Inc. End-User is prohibited from taking any action to derive a source code
equivalent of “Install-It,” including by reverse assembly or reverse compilation, Ray Sauers Associates, Inc. shall in no event be liable
for any damages resulting from reseller’s failure to perform reseller’s obligation; or any damages arising from use or operation of
reseller’s products or the software; or any other damages, including but not limited to, incidental, direct, indirect, special or
consequential Damages including lost profits, or damages resulting from loss of use or inability to use reseller’s products or the
software for any reason including copyright or patent infringement, or lost data, even if Ray Sauers Associates has been advised,
knew or should have known of the possibility of such damages.
The following disclaimer is required by Videomedia, Inc.:
“Videomedia, Inc. makes no warranties whatsoever, either express or implied, regarding this product, including warranties with
respect to its merchantability or its fitness for any particular purpose.”
“This software contains V-LAN ver. 3.0 Command Protocols which communicate with V-LAN ver. 3.0 products developed by
Videomedia, Inc. and V-LAN ver. 3.0 compatible products developed by third parties under license from Videomedia, Inc. Use of this
software will allow “frame accurate” editing control of applicable videotape recorder decks, videodisc recorders/players and the like.”
The following disclaimer is required by Altura Software, Inc. for the use of its Mac2Win software and Sample Source
Code:
©1993–1998 Altura Software, Inc.
The following disclaimer is required by 3Prong.com Inc.:
Certain waveform and vector monitoring capabilities are provided under a license from 3Prong.com Inc.
The following disclaimer is required by Interplay Entertainment Corp.:
The “Interplay” name is used with the permission of Interplay Entertainment Corp., which bears no responsibility for Avid products.
This product includes portions of the Alloy Look & Feel software from Incors GmbH.
This product includes software developed by the Apache Software Foundation (http://www.apache.org/
© DevelopMentor
).
This product may include the JCifs library, for which the following notice applies:
JCifs © Copyright 2004, The JCIFS Project, is licensed under LGPL (http://jcifs.samba.org/). See the LGPL.txt file in the Third Party
Software directory on the installation CD.
3
Page 4

Avid Interplay contains components licensed from LavanTech. These components may only be used as part of and in connection
with Avid Interplay.
This product includes FFmpeg, which is covered by the GNU Lesser General Public License.
This product includes software that is based in part of the work of the FreeType Team.
This software is based in part on the work of the Independent JPEG Group.
This product includes libjpeg-turbo, which is covered by the wxWindows Library License, Version 3.1.
Portions copyright 1994, 1995, 1996, 1997, 1998, 1999, 2000, 2001, 2002 by Cold Spring Harbor Laboratory. Funded under Grant
P41-RR02188 by the National Institutes of Health.
Portions copyright 1996, 1997, 1998, 1999, 2000, 2001, 2002 by Boutell.Com, Inc.
Portions relating to GD2 format copyright 1999, 2000, 2001, 2002 Philip Warner.
Portions relating to PNG copyright 1999, 2000, 2001, 2002 Greg Roelofs.
Portions relating to gdttf.c copyright 1999, 2000, 2001, 2002 John Ellson (ellson@lucent.com).
Portions relating to gdft.c copyright 2001, 2002 John Ellson (ellson@lucent.com).
Portions relating to JPEG and to color quantization copyright 2000, 2001, 2002, Doug Becker and copyright (C) 1994, 1995, 1996,
1997, 1998, 1999, 2000, 2001, 2002, Thomas G. Lane. This software is based in part on the work of the Independent JPEG Group.
See the file README-JPEG.TXT for more information. Portions relating to WBMP copyright 2000, 2001, 2002 Maurice Szmurlo and
Johan Van den Brande.
Permission has been granted to copy, distribute and modify gd in any context without fee, including a commercial application,
provided that this notice is present in user-accessible supporting documentation.
This does not affect your ownership of the derived work itself, and the intent is to assure proper credit for the authors of gd, not to
interfere with your productive use of gd. If you have questions, ask. "Derived works" includes all programs that utilize the library.
Credit must be given in user-accessible documentation.
This software is provided "AS IS." The copyright holders disclaim all warranties, either express or implied, including but not limited to
implied warranties of merchantability and fitness for a particular purpose, with respect to this code and accompanying
documentation.
Although their code does not appear in gd, the authors wish to thank David Koblas, David Rowley, and Hutchison Avenue Software
Corporation for their prior contributions.
This product includes software developed by the OpenSSL Project for use in the OpenSSL Toolkit (http://www.openssl.org/)
Interplay Central may use OpenLDAP. Copyright 1999-2003 The OpenLDAP Foundation, Redwood City, California, USA. All Rights
Reserved. OpenLDAP is a registered trademark of the OpenLDAP Foundation.
Avid Interplay Pulse enables its users to access certain YouTube functionality, as a result of Avid's licensed use of YouTube's API.
The charges levied by Avid for use of Avid Interplay Pulse are imposed by Avid, not YouTube. YouTube does not charge users for
accessing YouTube site functionality through the YouTube APIs.
Avid Interplay Pulse uses the bitly API, but is neither developed nor endorsed by bitly.
Attn. Government User(s). Restricted Rights Legend
U.S. GOVERNMENT RESTRICTED RIGHTS. This Software and its documentation are “commercial computer software” or
“commercial computer software documentation.” In the event that such Software or documentation is acquired by or on behalf of a
unit or agency of the U.S. Government, all rights with respect to this Software and documentation are subject to the terms of the
License Agreement, pursuant to FAR §12.212(a) and/or DFARS §227.7202-1(a), as applicable.
4
Page 5

Trademarks
003, 192 Digital I/O, 192 I/O, 96 I/O, 96i I/O, Adrenaline, AirSpeed, ALEX, Alienbrain, AME, AniMatte, Archive, Archive II, Assistant
Station, AudioPages, AudioStation, AutoLoop, AutoSync, Avid, Avid Active, Avid Advanced Response, Avid DNA, Avid DNxcel, Avid
DNxHD, Avid DS Assist Station, Avid Ignite, Avid Liquid, Avid Media Engine, Avid Media Processor, Avid MEDIArray, Avid Mojo, Avid
Remote Response, Avid Unity, Avid Unity ISIS, Avid VideoRAID, AvidRAID, AvidShare, AVIDstripe, AVX, Beat Detective, Beauty
Without The Bandwidth, Beyond Reality, BF Essentials, Bomb Factory, Bruno, C|24, CaptureManager, ChromaCurve,
ChromaWheel, Cineractive Engine, Cineractive Player, Cineractive Viewer, Color Conductor, Command|24, Command|8,
Control|24, Cosmonaut Voice, CountDown, d2, d3, DAE, D-Command, D-Control, Deko, DekoCast, D-Fi, D-fx, Digi 002, Digi 003,
DigiBase, Digidesign, Digidesign Audio Engine, Digidesign Development Partners, Digidesign Intelligent Noise Reduction,
Digidesign TDM Bus, DigiLink, DigiMeter, DigiPanner, DigiProNet, DigiRack, DigiSerial, DigiSnake, DigiSystem, Digital
Choreography, Digital Nonlinear Accelerator, DigiTest, DigiTranslator, DigiWear, DINR, DNxchange, Do More, DPP-1, D-Show, DSP
Manager, DS-StorageCalc, DV Toolkit, DVD Complete, D-Verb, Eleven, EM, Euphonix, EUCON, EveryPhase, Expander,
ExpertRender, Fader Pack, Fairchild, FastBreak, Fast Track, Film Cutter, FilmScribe, Flexevent, FluidMotion, Frame Chase, FXDeko,
HD Core, HD Process, HDpack, Home-to-Hollywood, HYBRID, HyperSPACE, HyperSPACE HDCAM, iKnowledge, Image
Independence, Impact, Improv, iNEWS, iNEWS Assign, iNEWS ControlAir, InGame, Instantwrite, Instinct, Intelligent Content
Management, Intelligent Digital Actor Technology, IntelliRender, Intelli-Sat, Intelli-sat Broadcasting Recording Manager, InterFX,
Interplay, inTONE, Intraframe, iS Expander, iS9, iS18, iS23, iS36, ISIS, IsoSync, LaunchPad, LeaderPlus, LFX, Lightning, Link &
Sync, ListSync, LKT-200, Lo-Fi, MachineControl, Magic Mask, Make Anything Hollywood, make manage move | media, Marquee,
MassivePack, Massive Pack Pro, Maxim, Mbox, Media Composer, MediaFlow, MediaLog, MediaMix, Media Reader, Media
Recorder, MEDIArray, MediaServer, MediaShare, MetaFuze, MetaSync, MIDI I/O, Mix Rack, Moviestar, MultiShell, NaturalMatch,
NewsCutter, NewsView, NewsVision, Nitris, NL3D, NLP, NSDOS, NSWIN, OMF, OMF Interchange, OMM, OnDVD, Open Media
Framework, Open Media Management, Painterly Effects, Palladium, Personal Q, PET, Podcast Factory, PowerSwap, PRE,
ProControl, ProEncode, Profiler, Pro Tools, Pro Tools|HD, Pro Tools LE, Pro Tools M-Powered, Pro Transfer, QuickPunch,
QuietDrive, Realtime Motion Synthesis, Recti-Fi, Reel Tape Delay, Reel Tape Flanger, Reel Tape Saturation, Reprise, Res Rocket
Surfer, Reso, RetroLoop, Reverb One, ReVibe, Revolution, rS9, rS18, RTAS, Salesview, Sci-Fi, Scorch, ScriptSync,
SecureProductionEnvironment, Serv|GT, Serv|LT, Shape-to-Shape, ShuttleCase, Sibelius, SimulPlay, SimulRecord, Slightly Rude
Compressor, Smack!, Soft SampleCell, Soft-Clip Limiter, SoundReplacer, SPACE, SPACEShift, SpectraGraph, SpectraMatte,
SteadyGlide, Streamfactory, Streamgenie, StreamRAID, SubCap, Sundance, Sundance Digital, SurroundScope, Symphony, SYNC
HD, SYNC I/O, Synchronic, SynchroScope, Syntax, TDM FlexCable, TechFlix, Tel-Ray, Thunder, TimeLiner, Titansync, Titan, TL
Aggro, TL AutoPan, TL Drum Rehab, TL Everyphase, TL Fauxlder, TL In Tune, TL MasterMeter, TL Metro, TL Space, TL Utilities,
tools for storytellers, Transit, TransJammer, Trillium Lane Labs, TruTouch, UnityRAID, Vari-Fi, Video the Web Way, VideoRAID,
VideoSPACE, VTEM, Work-N-Play, Xdeck, X-Form, Xmon and XPAND! are either registered trademarks or trademarks of Avid
Technology, Inc. in the United States and/or other countries.
Adobe and Photoshop are either registered trademarks or trademarks of Adobe Systems Incorporated in the United States and/or
other countries. Apple and Macintosh are trademarks of Apple Computer, Inc., registered in the U.S. and other countries. Windows
is either a registered trademark or trademark of Microsoft Corporation in the United States and/or other countries. All other
trademarks contained herein are the property of their respective owners.
Avid Interplay Central Services — Service and Server Clustering Overview • XXXX-XXXXXX-XX Rev A • May 2014
• Created 5/27/14 • This document is distributed by Avid in online (electronic) form only, and is not available for
purchase in printed form.
5
Page 6

Contents
Using This Guide. . . . . . . . . . . . . . . . . . . . . . . . . . . . . . . . . . . . . . . . . . . . . . . . 8
Chapter 1 Overview . . . . . . . . . . . . . . . . . . . . . . . . . . . . . . . . . . . . . . . . . . . . . . . . . . . . . . 9
Single Server Deployment . . . . . . . . . . . . . . . . . . . . . . . . . . . . . . . . . . . . . . . . . . . . . . . 10
Cluster Deployment. . . . . . . . . . . . . . . . . . . . . . . . . . . . . . . . . . . . . . . . . . . . . . . . . . . . . 10
How a Failover Works . . . . . . . . . . . . . . . . . . . . . . . . . . . . . . . . . . . . . . . . . . . . . . . . . . . 11
How Load Balancing Works . . . . . . . . . . . . . . . . . . . . . . . . . . . . . . . . . . . . . . . . . . . . . . 13
Chapter 2 System Architecture . . . . . . . . . . . . . . . . . . . . . . . . . . . . . . . . . . . . . . . . . . . . 15
Disk and File System Layout. . . . . . . . . . . . . . . . . . . . . . . . . . . . . . . . . . . . . . . . . . . . . . 18
ICS Services and Databases in a Cluster . . . . . . . . . . . . . . . . . . . . . . . . . . . . . . . . . . . . 19
Clustering Infrastructure Services . . . . . . . . . . . . . . . . . . . . . . . . . . . . . . . . . . . . . . . . . . 20
DRBD and Database Replication . . . . . . . . . . . . . . . . . . . . . . . . . . . . . . . . . . . . . . . . . . 21
GlusterFS and Cache Replication. . . . . . . . . . . . . . . . . . . . . . . . . . . . . . . . . . . . . . . . . . 23
Clustering and RabbitMQ . . . . . . . . . . . . . . . . . . . . . . . . . . . . . . . . . . . . . . . . . . . . . . . . 24
Chapter 3 Services, Resources and Logs . . . . . . . . . . . . . . . . . . . . . . . . . . . . . . . . . . . 26
Services vs Resources . . . . . . . . . . . . . . . . . . . . . . . . . . . . . . . . . . . . . . . . . . . . . . . . . . 26
Tables of Services, Resources and Utilities . . . . . . . . . . . . . . . . . . . . . . . . . . . . . . . . . . 27
Interacting with Services . . . . . . . . . . . . . . . . . . . . . . . . . . . . . . . . . . . . . . . . . . . . . . . . . 32
Interacting with Resources . . . . . . . . . . . . . . . . . . . . . . . . . . . . . . . . . . . . . . . . . . . . . . . 33
Services Start Order and Dependencies. . . . . . . . . . . . . . . . . . . . . . . . . . . . . . . . . . . . . 35
Working with Cluster Logs . . . . . . . . . . . . . . . . . . . . . . . . . . . . . . . . . . . . . . . . . . . . . . . 37
Understanding Log Rotation and Compression . . . . . . . . . . . . . . . . . . . . . . . . . . . . 38
Viewing the Content of Log Files . . . . . . . . . . . . . . . . . . . . . . . . . . . . . . . . . . . . . . . 39
Retrieving Log Files . . . . . . . . . . . . . . . . . . . . . . . . . . . . . . . . . . . . . . . . . . . . . . . . . 40
Important Log Files at a Glance . . . . . . . . . . . . . . . . . . . . . . . . . . . . . . . . . . . . . . . . . . . 40
RHEL Logs in /var/log . . . . . . . . . . . . . . . . . . . . . . . . . . . . . . . . . . . . . . . . . . . . . . . 42
RHEL Subdirectories in /var/log . . . . . . . . . . . . . . . . . . . . . . . . . . . . . . . . . . . . . . . . 43
ICS Logs in /var/log . . . . . . . . . . . . . . . . . . . . . . . . . . . . . . . . . . . . . . . . . . . . . . . . . 44
Page 7

ICS Subdirectories in /var/log. . . . . . . . . . . . . . . . . . . . . . . . . . . . . . . . . . . . . . . . . . 45
Chapter 4 Validating the Cluster . . . . . . . . . . . . . . . . . . . . . . . . . . . . . . . . . . . . . . . . . . . 46
Verifying Cluster Configuration . . . . . . . . . . . . . . . . . . . . . . . . . . . . . . . . . . . . . . . . . . . . 46
Verifying the Contents of the Hosts File . . . . . . . . . . . . . . . . . . . . . . . . . . . . . . . . . . . . . 49
Verifying the Lookup Service Order . . . . . . . . . . . . . . . . . . . . . . . . . . . . . . . . . . . . . . . . 50
Verifying the Cluster IP Addresses and NIC Names. . . . . . . . . . . . . . . . . . . . . . . . . . . . 51
Verifying Node Connectivity . . . . . . . . . . . . . . . . . . . . . . . . . . . . . . . . . . . . . . . . . . . . . . 52
Checking DRBD Status. . . . . . . . . . . . . . . . . . . . . . . . . . . . . . . . . . . . . . . . . . . . . . . . . . 56
Identifying the Master, Slave, and Load-Balancing Nodes . . . . . . . . . . . . . . . . . . . . . . . 58
Forcing a Failover . . . . . . . . . . . . . . . . . . . . . . . . . . . . . . . . . . . . . . . . . . . . . . . . . . . . . . 60
Resetting Fail Counts . . . . . . . . . . . . . . . . . . . . . . . . . . . . . . . . . . . . . . . . . . . . . . . . . . . 62
Chapter 5 Cluster Maintenance and Administrator Best Practices . . . . . . . . . . . . . . . 64
Checking Cluster Status . . . . . . . . . . . . . . . . . . . . . . . . . . . . . . . . . . . . . . . . . . . . . . . . . 64
Understanding the Cluster Resource Monitor Output . . . . . . . . . . . . . . . . . . . . . . . . . . . 65
Verifying Clock Synchronization . . . . . . . . . . . . . . . . . . . . . . . . . . . . . . . . . . . . . . . . . . . 67
Verifying the AAF Generator Service . . . . . . . . . . . . . . . . . . . . . . . . . . . . . . . . . . . . . . . 68
Shutting Down / Rebooting a Single Node . . . . . . . . . . . . . . . . . . . . . . . . . . . . . . . . . . . 69
Shutting Down / Rebooting an Entire Cluster . . . . . . . . . . . . . . . . . . . . . . . . . . . . . . . . . 70
Performing a Rolling Shutdown / Reboot . . . . . . . . . . . . . . . . . . . . . . . . . . . . . . . . . . . . 72
Responding to Automated Cluster Email . . . . . . . . . . . . . . . . . . . . . . . . . . . . . . . . . . . . 74
Chapter 6 Cluster Troubleshooting. . . . . . . . . . . . . . . . . . . . . . . . . . . . . . . . . . . . . . . . . 76
Common Troubleshooting Commands . . . . . . . . . . . . . . . . . . . . . . . . . . . . . . . . . . . . . . 76
Troubleshooting DRBD . . . . . . . . . . . . . . . . . . . . . . . . . . . . . . . . . . . . . . . . . . . . . . . . . . 78
Manually Connecting the DRBD Slave to the Master . . . . . . . . . . . . . . . . . . . . . . . . . . . 81
Correcting a DRBD Split Brain . . . . . . . . . . . . . . . . . . . . . . . . . . . . . . . . . . . . . . . . . . . . 82
Chapter 7 Frequently Asked Questions . . . . . . . . . . . . . . . . . . . . . . . . . . . . . . . . . . . . . 84
7
Page 8

Using This Guide
This guide is intended for the person responsible for installing, maintaining or administering a
cluster of Avid Interplay Common Services (ICS) servers. It provides background and technical
information on clustering in ICS. It provides an inventory of ICS services along with instructions
on how to interact with them for maintenance purposes. Additionally, it explains the specifics of
an ICS cluster, how each service operates in a cluster, and provides guidance on best practices
for cluster administration. Its aim is to provide a level of technical proficiency to the person
charged with installing, maintaining, or troubleshooting an ICS cluster.
For a general introduction to Interplay Central Services, including ICS installation and clustering
steps, see the Avid Interplay Central Services Installation and Configuration Guide. For
administrative information for Interplay Central, see the Avid Interplay Central Administration
Guide.
Page 9

1 Overview
Interplay Central Services (ICS) is a collection of software services running on a server,
supplying interfaces, video playback and other services to Avid Solutions including Interplay
Central, Interplay Sphere, Interplay MAM and mobile applications. A cluster is a collection of
servers that have ICS and additional clustering infrastructure installed. The cluster is configured
to appear to the outside world as a single server. The primary advantages of a cluster are
high-availability, and additional playback capacity.
High availability is obtained through automatic failover of services from one node to another.
This can be achieved with a cluster of just two servers, a primary (master) and secondary (slave).
All ICS services run on the primary. Key ICS services also run on the secondary node. In the
event that a service fails on the primary node, the secondary node automatically takes over,
without the need for human intervention.
When additional capacity is the aim, multiple additional servers can be added to the master-slave
cluster. In this case, playback requests (as always, fielded by the master) are automatically
distributed to the available servers, which perform the tasks of transcoding and serving the
transcoded media. This is referred to as load-balancing. A load-balanced cluster provides better
performance for a deployment supporting multiple, simultaneous users or connections.
An additional benefit of a load-balanced cluster is cache replication, in which media transcoded
by one server is immediately distributed to all the other nodes in the cluster. If another node
receives the same playback request, the material is immediately available without the need for
further effort.
In summary, an ICS server cluster provides the following:
• Redundancy/High-availability. If any node in the cluster fails, connections to that node are
automatically redirected to another node.
• Scale/Load balancing. All incoming playback connections are routed to a single cluster IP
address, and are subsequently distributed evenly to the nodes in the cluster.
• Replicated Cache. The media transcoded by one node in the cluster is automatically
replicated on the other nodes. If another node receives the same playback request, the media
is immediately available without the need to re-transcode.
• Cluster monitoring. A cluster resource monitor lets you actively monitor the status of the
cluster. In addition, If a node fails (or if any other serious problem is detected, e-mail is
automatically sent to one or more e-mail addresses.
Page 10
Single Server Deployment
In a single server deployment, all ICS services (including the playback service) run on the same
server. This server also holds the ICS database and the RAID 5 file cache. Since there is only one
server, all tasks, including transcoding, are performed by the same machine. The single server
has a host name and IP address. This is used, for example, by Interplay Central users to connect
directly to it using a web browser.
The following diagram illustrates a typical single-server deployment.
Single Server Deployment
Cluster Deployment
In a basic deployment, a cluster consists of one master-slave pair of nodes configured for
high-availability. Typically, other nodes are also present, in support of load-balanced transcoding
and playback. As in a single node deployment, all ICS traffic is routed through a single node —
the master, in this case, which is running all ICS services. Key ICS services and databases are
replicated on the slave node — some are actively running, some are in "standby" mode — which
is ready to assume the role of master at any time.
Playback requests, handled by the ICPS playback service, are distributed by the master to all
available nodes. The load-balancing nodes perform transcoding, but do not participate in
failovers; that is, without human intervention, they can never take on the role of master or slave.
10
Page 11
How a Failover Works
An interesting difference in a cluster deployment is at the level of IP address. In a single server
deployment, each server owns its host name and IP address, which is used, for example, by
Interplay Central users to connect using a web browser. In contrast, a cluster has a virtual IP
address (and a corresponding host name) defined at the DNS level. Interplay Central users enter
the cluster IP address or host name in the browser's address bar, not the name of an individual
server. The cluster redirects the connection request to one of the servers in the cluster, which
remains hidden from view.
The following diagram illustrates a typical cluster deployment.
How a Failover Works
Failovers in ICS operate at two distinct levels: service, and node. A cluster monitor oversees both
levels. A service that fails is swiftly restarted by the cluster monitor, which also tracks the
service's fail count. If the service fails too often (or cannot be restarted), the cluster monitor gives
responsibility for the service to another node in the cluster, in a process referred to as a failover.
A service restart in itself is not enough to trigger a failover. A failover occurs when the fail count
for the service reaches the threshold value.
The node on which the service failed remains in the cluster, but no longer performs the duties
that have failed. Until you manually reset the fail count, the failed service will not be restarted.
11
Page 12
How a Failover Works
In order to achieve this state of high-availability, one node in the cluster is assigned the role of
master node. It runs all the key ICS services. The master node also owns the cluster IP address.
Thus all incoming requests come directly to this node and are serviced by it. This is shown in the
following illustration:
Should any of the key ICS services running on the master node fail without recovery (or reach
the failure threshold) the node is automatically taken out of the cluster and another node takes on
the role of master node. The node that takes over inherits the cluster IP address, and its own ICS
services (that were previously in standby) become fully active. From this point, the new master
receives all incoming requests. Manual intervention must be undertaken to determine the cause
of the fault on the failed node and to restore it to service promptly.
In a correctly sized cluster, a single node can fail and the cluster will properly service its users.
n
However, if two nodes fail, the resulting cluster is likely under-provisioned for expected use and
will be oversubscribed.
This failover from master to slave is shown in the following illustration.
12
Page 13
How Load Balancing Works
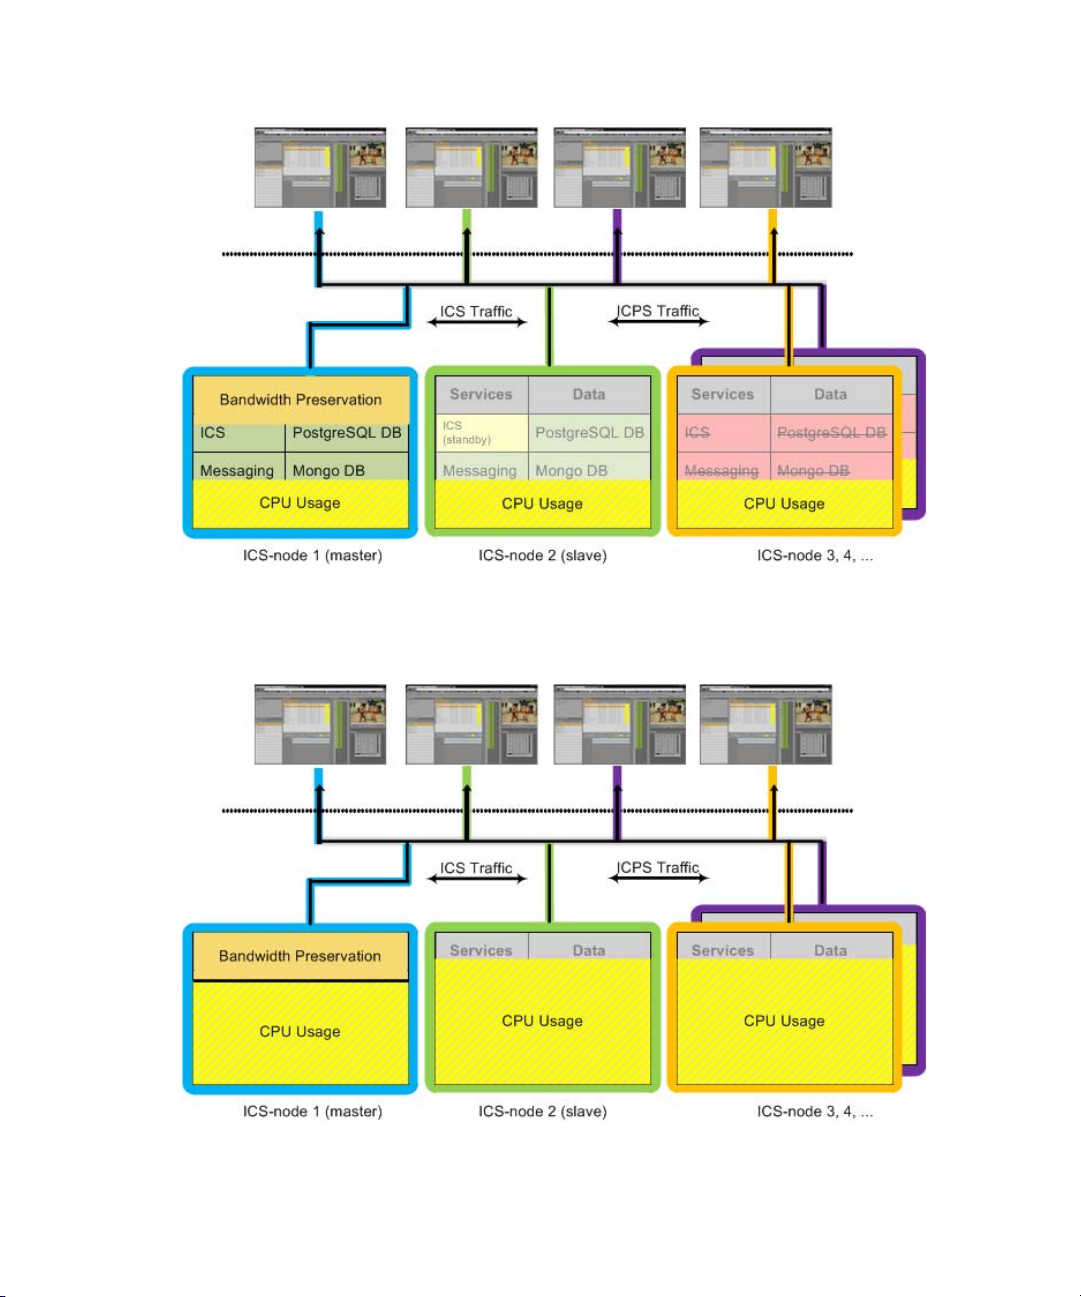
How Load Balancing Works
In ICS the video playback service is load-balanced, meaning incoming video playback requests
are distributed evenly across all nodes in the cluster. This can be done because the Interplay
Central Playback Service (ICPS) is actively running on all nodes in the cluster concurrently. A
load-balancing algorithm controlled by the master node monitors the clustered nodes, and
determines which node gets the job.
The exception is the master node, which is treated differently. A portion of its CPU capacity is
preserved for the duties performed by the master node alone, which include serving the UI,
handling logins and user session information, and so on. When the system is under heavy usage,
the master node will not take on additional playback jobs.
The following illustration shows a typical load-balanced cluster. The colored lines indicate that
playback jobs are sent to different nodes in the cluster. They are not meant to indicate a particular
client is bound to a particular node for its entire session, which may not be the case. Notice the
master node’s bandwidth preservation.
13
Page 14
How Load Balancing Works
The next illustration shows a cluster under heavy usage. As illustrated, CPU usage on the master
node will not exceed a certain amount, even when the other nodes approach saturation.
14
Page 15
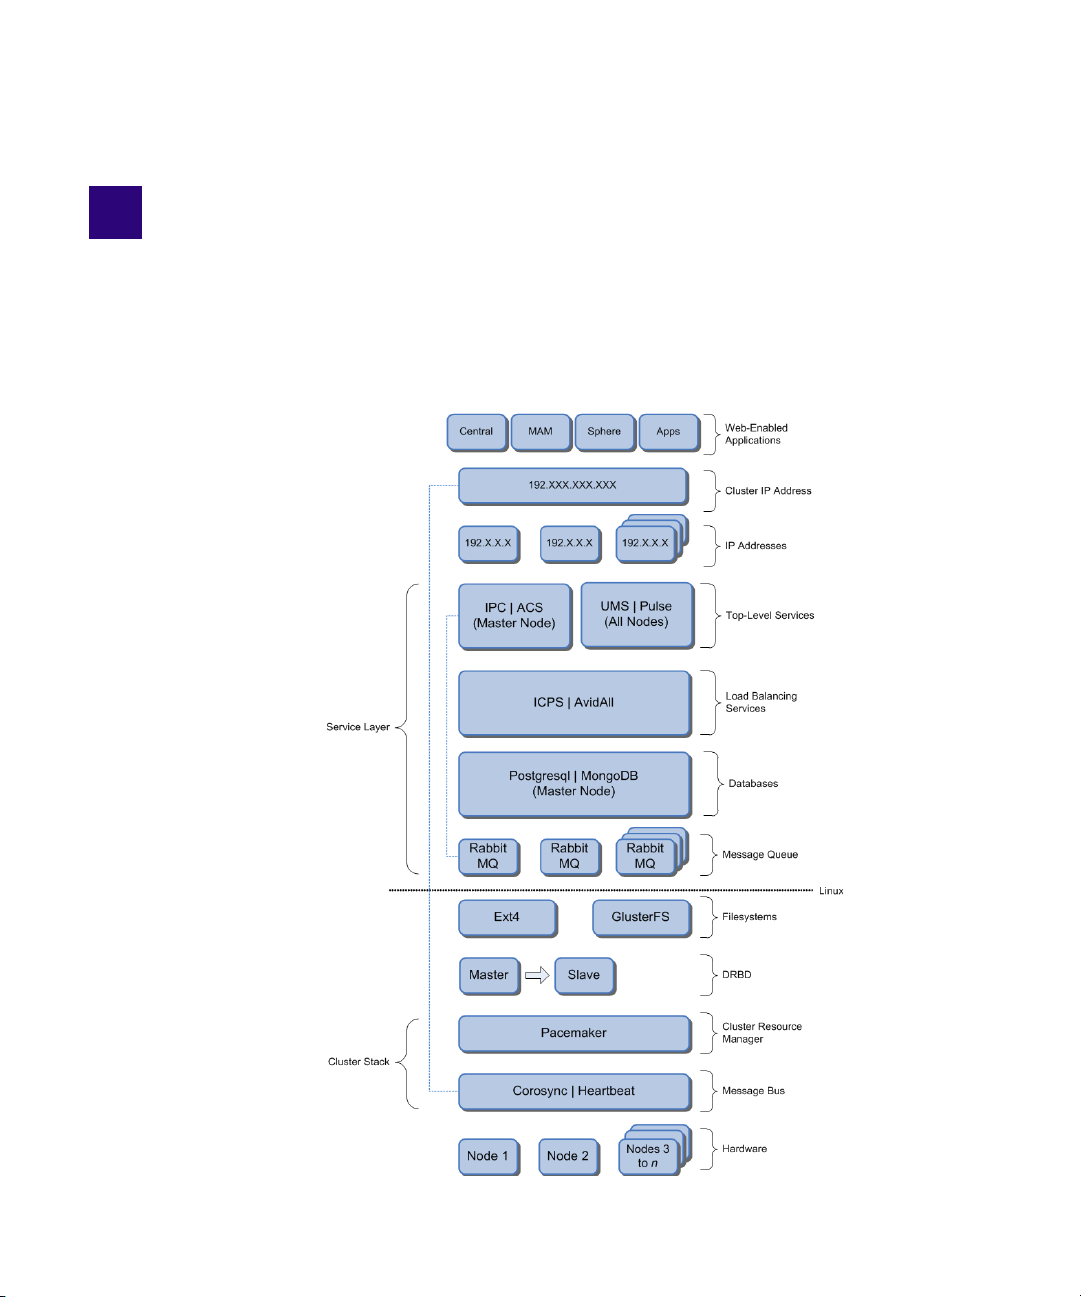
2 System Architecture
ICS features messaging systems, cluster management infrastructure, user management services,
and so on. Many are interdependent, but they are nevertheless best initially understood as
operating at logically distinct layers of the architecture, as shown in the following illustration.
Page 16

The following table explains the role of each layer:
System Architecture Layer Description
Web-Enabled Applications A the top of the food chain are the web-enabled client
applications that take advantage of the ICS cluster. These include
Interplay Central, Interplay MAM, Sphere and the iOS apps.
Cluster IP Address All client applications gain access to ICS via the cluster IP
address. This is a virtual address, established at the network level
in DNS and owned by the node that is currently master. In the
event of a failover, ownership of the cluster IP address is
transferred to the slave node.
The dotted line in the illustration indicates it is Corosync that
manages ownership of the cluster IP address. For example, during
a failover, it is Corosync that transfers ownership of the cluster IP
address from the master node to the slave node.
Node IP Addresses While the cluster is seen from the outside as a single machine
with one IP address and host name, it is important to note that all
the nodes within the cluster retain individual host names and IP
addresses. Network level firewalls and switches must allow the
nodes to communicate with one another.
Top-Level Services At the top level of the service layer are the ICS services running
on the master node only. These include:
• IPC - Interplay Central core services (aka "middleware")
• ACS - Avid Common Service bus (aka "the bus")
(configuration & messaging uses RabbitMQ.
• UMS - User Management Services
• Pulse - Interplay Pulse services (aka "multi-platform
distribution")
The dotted line in the illustration indicates the top level services
communicate with one another via ACS, which, in turn, uses
RabbitMQ.
Load Balancing Services The mid-level service layer includes the ICS services that are
load-balanced. These services run on all nodes in the cluster.
• ICPS - Interplay Central Playback Services: Transcodes and
serves transcoded media.
• AvidAll - Encapsulates all other ICPS back-end services.
16
Page 17

System Architecture Layer Description
Databases The mid-level service layer also includes two databases:
• PostgreSQL: Stores data for several ICS services (UMS,
ACS, ICPS, Pulse).
• MongoDB: Stores data related to ICS messaging.
Both these databases are synchronized from master to slave for
failover readiness.
RabbitMQ Message Queue RabbitMQ is the message broker ("task queue") used by the ICS
top level services.
RabbitMQ maintains its own independent clustering system. That
is, RabbitMQ is not managed by Pacemaker. This allows
RabbitMQ to continue delivering service requests to underlying
services in the event of a failure.
Filesystem The standard Linux filesystem.
This layer also conceptually includes GlusterFS, the Gluster
"network filesystem" used for cache replication. GlusterFS
performs its replication at the file level.
Unlike the Linux filesystem, GlusterFS operates in the "user
space" - the advantage being any GlusterFS malfunction does not
bring down the system.
DRBD Distributed Replicated Block Device (DRBD) is responsible for
volume mirroring.
DRBD replicates and synchronizes the system disk's logical
volume containing the PostgreSQL and MongoDB databases
across the master and slave, for failover readiness. DRBD carries
out replication at the block level.
Pacemaker The cluster resource manager. Resources are collections of
services grouped together for oversight by Pacemaker.
Pacemakers sees and manages resources, not individual services.
Corosync and Heartbeat Corosync and Heartbeat are the clustering infrastructure.
Corosync uses a multicast address to communicate with the other
nodes in the cluster. Heartbeat contains Open Cluster Framework
(OCF) compliant scripts used by Corosync for communication
within the cluster.
17
Page 18
System Architecture Layer Description
Hardware At the lowest layer is the server hardware.
It is at the hardware level that the system disk is established in a
RAID1 (mirror) configuration.
Note that this is distinct from the replication of a particular
volume by DRBD. The RAID 1 mirror protects against disk
failure. The DRBD mirror protects against node failure.
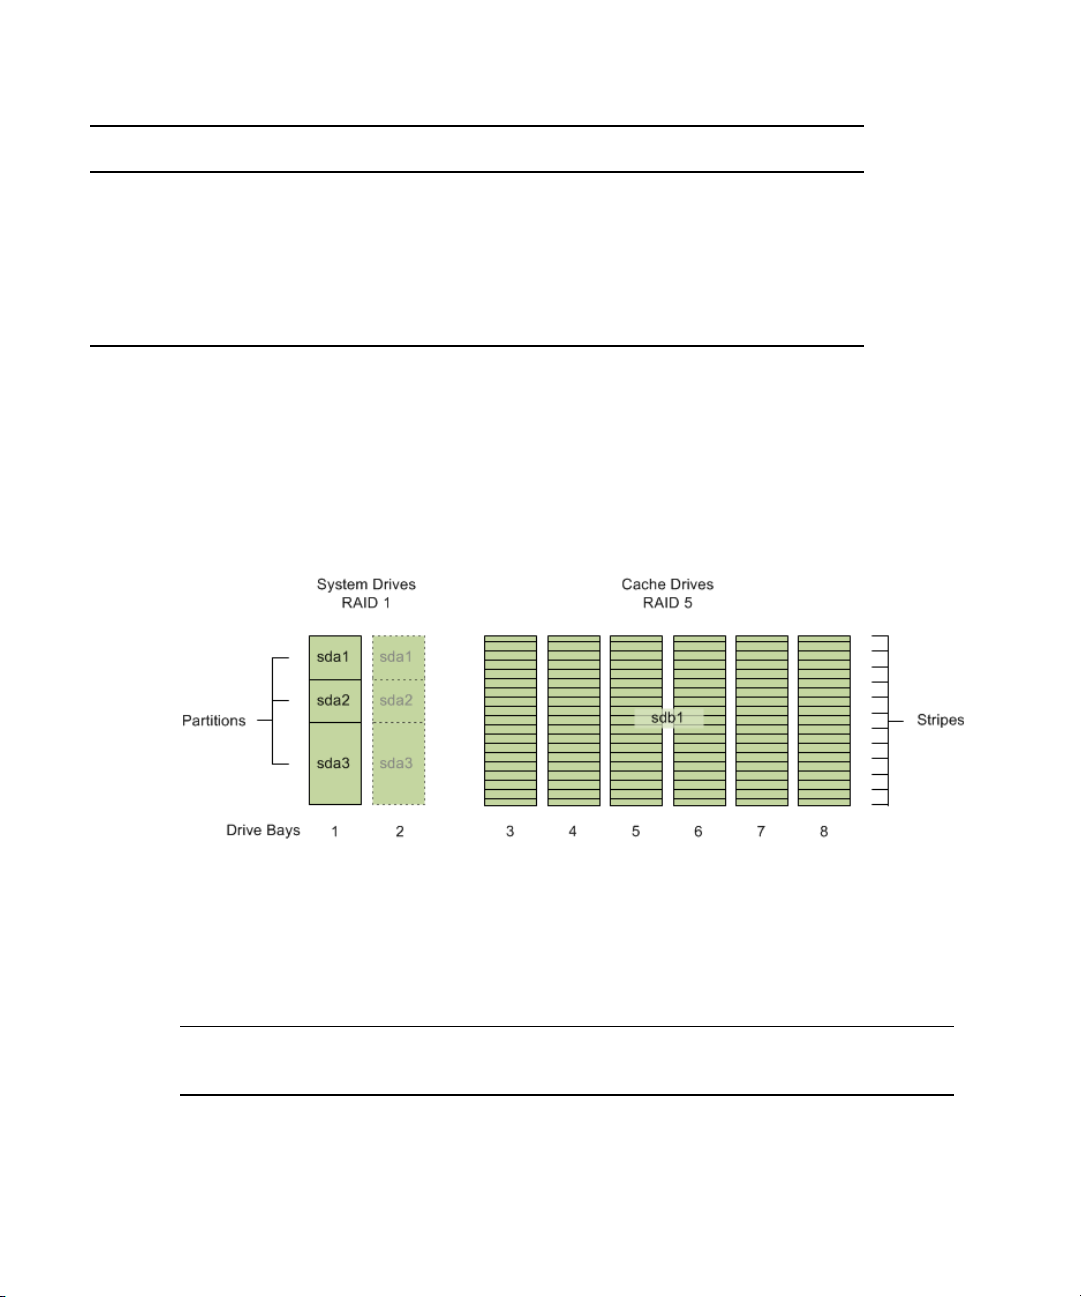
Disk and File System Layout
It is helpful to have an understanding of a node's disk and filesystem layout. The following
illustration represents the layout of a typical node:
Disk and File System Layout
In ICS 1.5 a RAID 5 cache was required for multi-cam, iOS, and MAM non-h264 systems only.
n
As of ICS 1.6 a separate cache is required, but it does not always need to be RAID 5.
The following table presents contents of each volume:
Physical
Volumes (pv)
sda1 /boot RHEL boot
sda2 /dev/drbd1 ICS databases
Volum e
Groups (vg)
Logical
Volumes (lv) Directory Content
partition
18
Page 19

ICS Services and Databases in a Cluster
Physical
Volumes (pv)
sda3 icps swap
sdb1 ics cache /cache ICS file cache
Volum e
Groups (vg)
Logical
Volumes (lv) Directory Content
/dev/dm-0
root
/
Note the following:
• sda1 is a standard Linux partition created by RHEL during installation of the operating
system
• sda2 is a dedicated volume created for the PostgreSQL (UMS, ACS, ICS, Pulse) and
MongoDB (ICS messaging) databases. The sda2 partition is replicated and synchronized
between master and slave by DRBD.
• sda3 contains the system swap disk and the root partition.
• sdb1 is the RAID 5 cache volume used to store transcoded media and various other
temporary files.
ICS Services and Databases in a Cluster
swap space
RHEL system
partition
The following table lists the most important ICS services that take advantage of clustering, and
where they run:
19
Page 20
ICS Services and Databases in a Cluster
Services
ICS IPC Core Services
(“the middleware”)
(avid-interplay-central)
User Management Service
(avid-um)
Avid Common Services bus
(“the bus”)
(acs-ctrl-core)
AAF Generator
(avid-aaf-gen)
ICS Messaging
(acs-ctrl-messenger)
Playback Services
(“the back-end”)
(avid-all)
Interplay Pulse (avid-mpd) MPD
Load Balancing (avid-icps-manager) XLB
IPC ON OFF OFF OFF
UMS
ACS
AAF
ICPS
ics-node 1
(Master)
ON OFF OFF OFF
ON OFF OFF OFF
ON ON OFF OFF
ON ON ON ON
ON ON ON ON
ON ON ON ON
ON ON ON ON
ON ON ON ON
ics-node 2
(Slave) ics-node 3 ics-node n
= ON (RUNNING) = OFF (STANDBY) = OFF (DOES NOT RUN)
Note the following:
• All ICS services run on the Master node in the cluster.
• Most ICS services are off on the Slave node but start automatically during a failover.
• On all other nodes, the ICS services never run.
• Some services spawned by the Avid Common Service bus run on the master node only (in
standby on the slave node); others are always running on both nodes.
• The Playback service (ICPS) runs on all nodes for Performance Scalability (load balancing
supports many concurrent clients and/or large media requests) and High Availability (service
is always available).
The following table lists the ICS databases, and where they run:
20
Page 21
Clustering Infrastructure Services
ICS Databases ICS-node 1
(Master)
ICS Database PostgreSQL ON OFF OFF OFF
Service Bus
Messaging
Database
= ON (RUNNING) = OFF (STANDBY) = OFF (DOES NOT RUN)
MongoDB
ON OFF OFF OFF
ICS-node 2
(Slave) ICS-node 3 ICS-node n
Clustering Infrastructure Services
The ICS services and databases presented in the previous section depend upon the correct
functioning a clustering infrastructure. The infrastructure is supplied by a small number of
open-source software designed specifically (or very well suited) for clustering. For example,
Pacemaker and Corosync work in tandem to restart failed services, maintain a fail count, and
failover from the master node to the slave node, when failover criteria are met.
The following table presents the services pertaining to the infrastructure of the cluster:
Software Function
RabbitMQ Cluster Message
Broker/Queue
GlusterFS File Cache Mirroring
DRBD Database Volume
Mirroring
Pacemaker Cluster Management &
Service Failover
Corosync Cluster Engine Data Bus
Heartbeat Cluster Message Queue
= ON (RUNNING) = OFF (STANDBY) = OFF
Node 1
(Master)
ON ON ON ON
ON ON ON ON
ON ON OFF OFF
ON ON ON ON
ON ON ON ON
ON ON ON ON
21
Node 2
(Slave) Node 3 Node n
(DOES NOT RUN)
Page 22
Note the following:
• RabbitMQ, the message broker/queue used by ACS, maintains its own clustering system. It
is not managed by Pacemaker.
• GlusterFS mirrors media cached on an individual RAID 5 drive to all other RAID 5 drives in
the cluster.
• DRBD mirrors the ICS databases across the two servers that are in a master-slave
configuration.
• Pacemaker: The cluster resource manager. Resources are collections of services
participating in high-availability and failover.
• Corosync and Heartbeat: The fundamental clustering infrastructure.
• Corosync and Pacemaker work in tandem to detect server and application failures, and
allocate resources for failover scenarios.
DRBD and Database Replication
Recall the filesystem layout of a typical node. The system drive (in RAID1) consists of three
partitions: sda, sda2 and sda3. As noted earlier, sda2 is the partition used for storing the ICS
databases, stored as PostgreSQL databases.
DRBD and Database Replication
The following table details the contents of the databases stored on the sda2 partition:
22
Page 23
GlusterFS and Cache Replication
Database Directory Contents
PostgreSQL /mnt/drbd/postgres_data UMS - User Management Services
ACS - Avid Common Service bus
ICPS - Interplay Central Playback Services.
MPD - Multi-platform distribution (Pulse)
MongoDB /mnt/drbd/mongo_data ICS Messaging
In a clustered configuration, ICS uses the open source Distributed Replicated Block Device
(DRBD) storage system software to replicate the sda2 partition across the Master-Slave cluster
node pair. DRBD runs on the master node and slave node only, even in a cluster with more than
two nodes. PostgreSQL maintains the databases on sda2. DRBD mirrors them.
The following illustration shows DRBD volume mirroring of the sda2 partition across the master
and slave.
GlusterFS and Cache Replication
Recall that the ICS server transcodes media from the format in which it is stored on the ISIS (or
standard filesystem storage) into an alternate delivery format, such as an FLV, MPEG-2
Transport Stream, or JPEG image files. In a deployment with a single ICS server, the ICS server
maintains a cache where it keeps recently-transcoded media. In the event that the same media is
requested again, the ICS server can deliver the cached media, without the need to re-transcode it.
23
Page 24

Clustering and RabbitMQ
In an ICS cluster, caching is taken one step farther. In a cluster, the contents of the RAID 5
volumes are replicated across all the nodes, giving each server access to all the transcoded
media. The result is that each ICS server sees and has access to all the media transcoded by the
others. When one ICS server transcodes media, the other ICS servers can also make use of it,
without re-transcoding.
The replication process is set up and maintained by GlusterFS, an open source software solution
for creating shared filesystems. In ICS, Gluster manages data replication using its own highly
efficient network protocol. In this respect, it can be helpful to think of Gluster as a "network
filesystem" or even a "network RAID" system.
GlusterFS operates independently of other clustering services. You do not have to worry about
starting or stopping GlusterFS when interacting with ICS services or cluster management
utilities. For example, if you remove a node from the cluster, GlusterFS itself continues to run
and continues to replicate its cache against other nodes in the Gluster group. If you power down
the node for maintenance reasons, it will re-synchronize and 'catch up' with cache replication
when it is rebooted.
The correct functioning of the cluster cache requires that the clocks on each server in the cluster
n
are set to the same time. See “Verifying Clock Synchronization” on page 67.
Clustering and RabbitMQ
RabbitMQ is the message broker ("task queue") used by the ICS top level services. ICS makes
use of RabbitMQ in an active/active configuration, with all queues mirrored to exactly two
nodes, and partition handling set to ignore. The RabbitMQ cluster operates independently of the
ICS master/slave failover cluster, but is often co-located on the same two nodes. The ICS
installation scripts create the RabbbitMQ cluster without the need for human intervention.
Note the following:
• All RabbitMQ servers in the cluster are active and can accept connections
• Any client can connect to any RabbitMQ server in the cluster and access all data
• Each queue and its data exists on two nodes in the cluster (for failover & redundancy)
• In the event of a failover, clients should automatically reconnect to another node
• If a network partition / split brain occurs (very rare), manual intervention will be required
The RabbitMQ Cookie
A notable aspect of the RabbitMQ cluster is the special cookie it requires, which allows
RabbitMQ on the different nodes to communicate with each other. The RabbitMQ cookie must
be identical on each machine, and is set, by default, to a predetermined hardcoded string.
24
Page 25

Clustering and RabbitMQ
Powering Down and Rebooting
With regards to RabbitMQ and powering down and rebooting nodes:
• If you take down the entire cluster, the last node down must always be the first node up. For
example, if "ics-serv3" is the last node you stop, it must be the first node you start.
• Because of the guideline above, it is not advised to power down all nodes at exactly the same
time. There must always be one node that was clearly powered down last.
• If you don't take the whole cluster down at once then the order of stopping/starting servers
doesn't matter.
For details, see
Handling Network Disruptions
“Shutting Down / Rebooting an Entire Cluster” on page 70.
• RabbitMQ does not handle network partitions well. If the network is disrupted on only some
of the machines and then it is restored, you should shutdown the machines that lost the
network and then power them back on. This ensures they re-join the cluster correctly. This
happens rarely, and mainly if the cluster is split between two different switches and only one
of them fails.
• On the other hand, If the network is disrupted to all nodes in the cluster simultaneously (as
in a single-switch setup), no special handling should be required.
Suggestions for Further Reading
•Clustering: http://www.rabbitmq.com/clustering.html
• Mirrored queues: http://www.rabbitmq.com/ha.html
• Network Partitions:
http://www.rabbitmq.com/partitions.html
25
Page 26

3 Services, Resources and Logs
Services and resources are key to the correct operation and health of a cluster. As noted in
“System Architecture” on page 15, services are responsible for all aspects of ICS activity, from
the ACS bus, to end-user management and transcoding. Additional services supply the clustering
infrastructure. Some ICS services are managed by Pacemaker, for the purposes of
high-availability and failover readiness. Services overseen by Pacemaker are called resources.
All services produce logs that are stored in the standard Linux log directories (under /var/log), as
detailed later in this chapter.
Services vs Resources
A typical cluster features both Linux services and Pacemaker cluster resources. Thus, it is
important to understand the difference between the two. In the context of clustering, resources
are simply one or more Linux services under management by Pacemaker. Managing services in
this way allows Pacemaker to monitor the services, automatically restart them when they fail,
and shut them down on one node and start them on another when they fail too many times.
It can be helpful to regard a cluster resource as Linux service inside a Pacemaker “wrapper”. The
wrapper includes the actions defined for it (start, stop, restart, etc.), timeout values, failover
conditions and instructions, and so on. In short, Pacemaker sees and manages resources, not
services.
For example, the Interplay Central (avid-interplay-central) service is the core Interplay Central
service. Since the platform cannot function without it, this service is overseen and managed by
Pacemaker as the AvidI PC resource.
As is known, the status of a Linux service can be verified by entering a command of the
following form at the command line:
service <servicename> status
In contrast, the state of a cluster resource is verified via the Pacemaker Cluster Resource
Manager, crm, as follows:
crm status <resource>
For details see:
Page 27

Tables of Services, Resources and Utilities
• “Interacting with Services” on page 32
• “Interacting with Resources” on page 33
Tables of Services, Resources and Utilities
The tables in this section provide lists of essential services that need to be running in a clustered
configuration. It includes three tables:
• All Nodes: The services that must be running on all nodes.
• Master Node: The services that must be running on the master node only. These services do
not need to be, and should not be running on the any other node.
• Pacemaker Resources: The are the services under management by Pacemaker. They run on
the master node, but can fail over to the slave node.
The lists are not exhaustive. They are lists of essential services that need to be running in a
clustered configuration.
All Nodes
The following table presents the services that must be running on all nodes.
All Nodes
Service Description
avid-all Encapsulates all ICPS back-end services:
• avid-config
• avid-isis
• avid-fps
• avid-jips
• avid-spooler
• avid-edit
pacemaker Cluster Management and Service Failover
Management
corosync Cluster Engine Data Bus
glusterd GlusterFS daemon responsible for cache
replication.
27
Page 28

Tables of Services, Resources and Utilities
All Nodes
Service Description
rabbitmq-server Messaging broker/queue for the ACS bus.
Maintains its own cluster functionality to
deliver high-availability.
avid-aaf-gen AAF Generator service, the service responsible
for saving sequences.
To reduce bottlenecks when the system is under
heavy load, five instances of this service run
concurrently, by default.
Installed on all nodes but only used on the
master or slave node, depending on where the
IPC Core service (avid-interplay-central) is
running.
This service is not managed by Pacemaker,
therefore you should check its status regularly,
and restart it if any instance has failed. See
“Verifying the AAF Generator Service” on
.
page 68
acs-ctrl-messenger The services related to the IPC end-user
messaging feature:
• "messenger" service (handles delivery of
user messages)
• "mail" service (handles mail-forwarding
feature)
This service registers itself on the ACS bus. All
instances are available for handling requests,
which are received by way of the bus via a
round-robin-type distribution system.
This service operates independently, and is not
managed by Pacemaker.
avid-mpd Interplay Pulse services.
Operates similarly to the acs-ctrl-messenger
service described above.
This service is only available when Interplay
Pulse (separate installer) is installed on the
system.
28
Page 29

Tables of Services, Resources and Utilities
All Nodes
Service Description
avid-ics A utility script (not a service) that can be used
to verify the status of all the major ICS services.
Verifies the status of the following services:
- avid-all
- avid-interplay-central
- acs-ctrl-messenger
- acs-ctrl-core
- avid-ums
The utility script enables you to stop, start and
view the status of all the services it
encapsulates at once:
avid-ics status
avid-ics stop
avid-ics start
Note that the utility script cannot be invoked
like a true service. The form "service avid-ics
status" will not work. Use the following form
instead:
avid-ics <command>
Master Node Only
The following table presents the services that must be running on the master node.
Master Node
Service Description
avid-interplay-central IPC Core services (“the middleware”)
29
Page 30

Tables of Services, Resources and Utilities
Master Node
Service Description
acs-ctrl-core Avid Common Service bus (“the bus”)
Essential bus services needed for the overall
platform to work:
• "boot" service (provides registry services to
bus services)
• "attributes" services (provides system
configuration of IPC)
• "federation" service (initializes multi-zone
configurations)
The acs-ctrl-core service is a key service. The
following services will not start or function
correctly if as acs-ctrl-core is not running.
• avid-icps-manager
• avid-ums
• avid-interplay-central
• avid-all
• acs-ctrl-messenger
• avid-mpd
avid-ums User Management Service
avid-icps-manager Manages the ICPS connection and load
balancing services.
postgresql-9.1 PostgreSQL database for user management and
attributes data
mongod MongoDB database for data from the following
services:
• ICS Messaging (acc-ctrl-messenger) data
• ACS bus (acs-ctrl-core) registry
30
Page 31

Tables of Services, Resources and Utilities
Master Node
Service Description
drbd DRBD (Distributed Replicated Block Device)
is used to mirror the system disk partition
containing the two databases from master to
slave, for failover readiness:
• PostGreSQL
• MongoDB
DRBD is fully functional on both master and
slave. It is included in this table for
convenience.
Pacemaker Resources
The following table presents the cluster resources overseen and managed by
Pacemaker/Corosync. The underlying resources must be running on the master node, but will fail
over to the slave node.
Managed by Pacemaker/Corosync
Resource Description
drbd_postgres Encapsulates:
•drbd
• postgresql-9.1
AvidIPC Encapsulates:
• avid-interplay-central
AvidUMS Encapsulates:
• avid-ums
AvidACS Encapsulates:
• acs-ctrl-core
MongoDB Encapsulates:
• mongod
31
Page 32

Managed by Pacemaker/Corosync
Resource Description
AvidAll Encapsulates:
AvidICPS Encapsulates:
Pacemaker and Corosync manage numerous other cluster resources. The table lists the most
n
important ones. For a complete list, query the Cluster Resource Manager using the following
command at the command-line:
crm configure show
In the output that appears, “primitive” is the token that defines a cluster resource.
Interacting with Services
Interacting with Services
• avid-all
• avid-icps-manager
ICS services are standard Linux applications and/or daemons, and you interact with them
following the standard Linux protocols.
The command line for interacting with services follows the standard Linux format:
service <servicename> <action>
Standard actions include the following (some services may permit other actions):
status returns the current status of the service
stop tops the service
start starts the service
restart stops then restarts the service
The command line for interacting with services follows the standard Linux format:
For example:
service avid-ums restart
32
Page 33

Interacting with Resources
Cluster resources are Linux services that are under management by Pacemaker. These should not
normally be touched using typical Linux tools. You must interact with cluster resources using the
Pacemaker Cluster Resource Manager, crm. If you try to stop the underlying service directly —
that is, without going through the Cluster Resource Manager — Pacemaker will do its job and
restart it immediately.
Under special circumstances (such as during troubleshooting), you can shut down Pacemaker
n
and Corosync, then directly stop, start and re-start the underlying services managed by
Pacemaker. The simplest way to gain direct access to a node’s managed services is by taking the
node offline. See “Recommended Approach: Remove Node from Cluster” on page 34.
The command line for interacting with resources uses a format particular to the Cluster Resource
Manager:
crm resource <action> <resourcename>
For example:
crm resource status AvidIPC
Interacting with Resources
Returns information similar to the following:
resource AvidIPC is running on: icps-mam-large
Issuing the above command without specifying a resource returns the status of all cluster
resources.
crm resource status
Returns information similar to the following:
AvidConnectivityMonEverywhere [AvidConnectivityMon]
Started: [ icps-mam-large icps-mam-med icps-mam-small ]
AvidClusterMon (lsb:avid-monitor) Started
MongoDB (lsb:mongod) Started
Resource Group: postgres
postgres_fs (ocf::heartbeat:Filesystem) Started
AvidClusterIP (ocf::heartbeat:IPaddr2) Started
pgsqlDB (ocf::avid:pgsql_Avid) Started
Master/Slave Set: ms_drbd_postgres [drbd_postgres]
Masters: [ icps-mam-large ]
Slaves: [ icps-mam-med ]
Clone Set: AvidAllEverywhere [AvidAll]
Started: [ icps-mam-small icps-mam-med icps-mam-large ]
33
Page 34

Interacting with Resources
AvidIPC (lsb:avid-interplay-central) Started
AvidUMS (lsb:avid-ums) Started
AvidACS (lsb:acs-ctrl-core) Started
Clone Set: AvidICPSEverywhere [AvidICPS]
Started: [ icps-mam-small icps-mam-med icps-mam-large ]
For more information see the discussion of the Cluster Resource Monitor tool, crm, in “Verifying
Cluster Configuration” on page 46
Stopping the Underlying Services Directly: Two Approaches
If you stop a resource's underlying service directly — that is, without going through the cluster
resource manager — Pacemaker will attempt to restart it immediately. This not only restarts the
service, it also increases the failover count of the corresponding resource, and can result in an
unexpected failover. Always use the cluster resource manager utility.
The exception to this rule is during cluster installation, upgrading, or troubleshooting. For
example, if you incorrectly complete an installation and configuration procedure, you might
need to back up a few steps, and redo the procedure. In order for the new settings to take hold,
you might need to restart the corresponding service or services directly. Similar arguments can
be made for upgrading and troubleshooting. In these cases, there are two main approaches.
Recommended Approach: Remove Node from Cluster
The recommended approach is to temporarily remove the node from the cluster using the cluster
resource manager:
crm node standby <node>
Putting a node into standby shuts down Pacemaker and Corosync, freeing all services from
management as resources.
To bring a node back online issue the following command (which restarts Pacemaker and puts its
services back under management):
crm node online <node>
Alternative Approach: Stop Pacemaker and Corosync
An alternative approach is to shut down Pacemaker and Corosync directly:
service pacemaker stop
service corosync stop
Restart them in the reverse order.
34
Page 35

Services Start Order and Dependencies
Services Start Order and Dependencies
When direct intervention with a service is required, take special care with regards to stopping,
starting, or restarting. The services on a node operate within a framework of dependencies.
Services must be stopped and started in a specific order. This order is particularly important
when you have to restart an individual service (in comparison to rebooting the entire server).
Before doing anything, identify and shut down the services that depend on the target service.
If Pacemaker and Corosync are running on the node 1) stop Pacemaker 2) stop Corosync (in that
n
order). Otherwise, Pacemaker will automatically restart the service. If the node is actively part
of a cluster, putting it into standby using the Cluster Resource Manager utility (crm) will stop
Pacemaker and Corosync for you. See “Interacting with Services” on page 32.
The start order and dependencies relationships of the main cluster services are summarized in the
following illustration.
35
Page 36

Services Start Order and Dependencies
The following table summarizes the order in which services can be safely started.
Start
Order Service Name Process Name Notes
1DRBD drbd
2 PostgreSQL postgresql-9.1
3 MongoDB mongod
4 RabbitMQ rabbitmq-server
5 Avid Common Service bus
(ACS: “the bus”)
6 Node.js avid-icps-manager
7 User Management Services
(UMS)
8 AAF Generator avid-aaf-gen Five instances of this service
9 IPC Core Services avid-interplay-central
10 ICPS Backend Services avid-all
11 ICS Messaging acs-ctrl-messenger
12 Pulse avid-mpd
acs-ctrl-core
avid-ums
should always be running. See
“Verifying the AAF Generator
Service” on page 68
.
Example: Restarting the User Management Services
A simple example will demystify the illustration and table. Suppose you need to restart the User
Management Services (avid-ums).
1. Identify its position in the dependency table (#7).
2. Identify all the services that are directly or indirectly dependent on it (service #8, #9 & #12).
3. Since the avid-ums and avid-interplay-central are managed by Pacemaker, stop Pacemaker
and Corosync by putting the node into standby mode.
4. Stop the dependent services first in order from most dependencies to least dependencies.
5. That is, stop, service #12 first, then #9, #8, and #7.
36
Page 37

Working with Cluster Logs
6. Restart UMS (#7).
7. Restart services #8 through #12, in that order.
For a closer look at the start orders assigned to Linux services, see the content of the /etc/rc3.d
directory. The files in this directory are prefixed Sxx or Kxx (e.g. S24, S26, K02). The prefix Sxx
indicates the start order. Kxx indicates the shutdown order.
The content of a typical /etc/rc3.d directory is shown below:
The Linux start order as reflected in the /etc/rc3.d and the other run-level (“/etc/rcX.d”)
n
directories reflect the boot order and shut-down order for the server. They do not always reflect
dependencies within ICS itself.
rr
Working with Cluster Logs
ICS and its associated open-source services — such as Pacemaker, Corosync, and RabbitMQ —
produce numerous logs. These are stored in the standard RHEL directory and subdirectories:
/var/log
Typically, log files have a name of the following form:
<process>.log
37
Page 38

Working with Cluster Logs
For example:
spooler.log
spooler.log-201310.25.gz
spooler.log.old20131024_141055
Note the following:
• *.log are current log files, for the active process.
• *.gz are "rotated out" log files, compressed and with a date appended.
• *.old are backlogs.
Log files are rotated (replaced), compressed and eventually deleted automatically by the Linux
logrotate log management utility. In addition, most ICS logs have the following characteristics,
determined by the logrotate configuration file (/etc/logrotate.conf):
• Fresh logs are begun with each reboot
• New log files are uncompressed text files (some are binaries)
• Older logs are rotated (replaced) weekly
• Older logs are stored in the gzip format
• Four weeks worth of backlogs are kept
• A new empty log file is created after rotating out the old one
• Date is appended as suffix on the rotated file
Specific processes can override the logrotate configuration file settings by supplying their own
n
configuration file in the /etc/logrotate.d directory. If a log file is not behaving as expected, check
there.
Understanding Log Rotation and Compression
The Linux logrotate utility runs and compresses the old logs daily. Although it is invoked by the
Linux cron daemon, the exact runtime for logrotate cannot be stated with accuracy. It varies, for
example, depending on when the system was most recently rebooted, but it does not run at a
fixed time after the reboot. This is by design, in order to vary and minimize the impact on other
system resources. By default, rotated logs files are store as gzip (.gz) compressed files.
The production of logs is controlled by the following files:
• /etc/cron.daily/logrotate specifies the job to be run and the file containing configuration
parameters
• /usr/sbin/logrotate is the job that is run
38
Page 39

• /etc/logrotate.conf is the file containing configuration parameters
• /etc/logrotate.d is a directory containing additional configuration information that might
override the default instructions
Further details on the log rotation configuration files are beyond the scope of this document. For
more information, see the Linux man page for logrotate by typing the following at the Linux
command line:
man logrotate
Viewing the Content of Log Files
You can search and examine the contents of logs from the Linux command line using the usual
Linux tools and commands:
• vi - Opens the log file for editing.
• tail - Displays the last few lines of a log file, in real-time. An excellent tool for monitoring
"growing" files (such as log files.)
To view the content of multiple log files in real time, use the "-f" option:
tail -f <file1> -f <file2>
Working with Cluster Logs
For example the following command displays the last few lines of both the edit.log and
isis.log files in the same shell:
tail -f /var/log/avid/edit.log /var/log/avid/isis.log
• more - Outputs the content of a file one screen at time.
• less - Like more, but permitting forwards and backwards movement through the file.
• grep - Use the grep command to search for regular expressions within a log file from the
command line.
For example the following command searches all log files in the current directory for the
term "fail-count":
grep fail-count *.log
The following more general form of the grep command searches all log files in the current
directory and all subdirectories:
grep -r <searchterm> *.log
• gzip - Use the gzip command to unzip rotated log files for viewing. Rotated log files are
stored as compressed gzip files by default.
The general form of the gzip command for uncompressing .gz files is as follows:
grep -d <logfile>.log.gz
39
Page 40

Retrieving Log Files
In addition to viewing logs directly on the Linux server as outlined above, it can be convenient to
copy logs of interest to a desktop machine. To do so, you need access via the network to the
server of interest, and log in credentials. You also need a secure shell (SSH) file transfer protocol
(FTP) client — commonly abbreviated SFTP — installed on the desktop machine.
WinSCP is the recommended free, open-source Windows client for securely copying files from a
Linux server to a desktop machine (Windows only). It can be downloaded at the following
location:
To copy files using WinSCP:
1. Connect to the server of interest using WinSCP as the root user.
WinSCP uses the standard TCP port 22 for its SSH connection. If you can establish an SSH
n
connection to the server outside of WinSCP, you can use WinSCP.
2. If a Warning dialog that appears, click Ye s /U p da t e as appropriate to accept the key.
3. WinSCP opens an interface providing a view of the Windows filesystem on the left and the
http://winscp.net
The root user has the necessary permission levels to establish the connection.
RHEL filesystem on the right.
Important Log Files at a Glance
WinSCP automatically opens in the home directory of the logged in user. Since you logged in as
n
the root user, this is /root on the RHEL machine. This should not be confused with the Linux root
directory itself (/).
4. Navigate to the directory on the Windows machine where you want to put log files.
5. Navigate to the directory on the Linux server containing the logs of interest (for example,
/var/log/avid).
6. Select the log files of interest. Shift-click to select multiple files.
7. Drag and drop the files to the Windows side of the WinSCP interface. Alternately, press the
Copy button for more options.
WinSCP copies the files from the Linux server to the Windows machine.
Important Log Files at a Glance
The following table presents the most important logs for clustering:
40
Page 41

Important Log Files at a Glance
Log File Description
/var/log/cluster Corosync log files.
/var/log/mongo MongoDB log files.
/var/log/rabbitmq RabbitMQ log files.
/var/log/avid avid-db.log - Log file of the avid-db database management
tool.
ICPS (playback service / "back-end") logs:
• config.log IPC configuration information, as found in the
System Settings panels. Produced by avid-config service.
• edit.log Traffic between the back-end and the editors
(NewsCutter/MediaComposer), including host and log-in
information, timeline warnings, and so on. Produced by
avid-edit service.
• fps.log Flash Player Security (FPS) information, relating to
the player appearing in the IPC UI. Produced by avid-fps
service.
• isis.log Information pertaining to ISIS mounting and
connections. Produced by avid-isis service.
jips.log Java Interplay Production service. Contains
information pertaining to low-level connections between
the ICS back-end services and the Interplay Production
services used to obtain AAF metadata. Produced by
avid-jips service.
• reconfigure.log Activity associated with running "service
avid-all reconfigure", which runs during setup.
• spooler.log Information relating to playback. Produced by
avid-spooler service.
All the above bulleted logs are produced by the named
services, which in turn are overseen by the avid-all service.
/var/log/avid/acs • acs-app-server.log Log file for the ACS Administrative
web pages, to be used for troubleshooting only (not on by
default)
• acs-ctrl-boot.log Log file for the ACS Boot Service (which
serves as a registry of services)
• acs-ctrl-generic.log Log file for most other ACS services,
but in the IPC 1.3 case, this is only Attributes Service
41
Page 42

Important Log Files at a Glance
Log File Description
/var/log/avid/avid-aaf-gen AAF Generators logs. This is the service responsible for saving
sequences.
/var/log/avid/avid-interplay-central Contains the Interplay Central Java middleware logs (including
httpd information).
· interplay_central_x.log Interplay Central server log
· YYYY_MM_DD.request.log -- Per day request logs,
currently empty
· health-check Internal health-check logs directory
· interplay Internal production connection logs directory
· performance Interplay performance logs directory, disabled
by default.
/var/log/avid/avid-register-ics-zone Reserved for future use.
/var/log/avid/avid-register-workgroup Reserved for future use.
/var/log/avid/avid-ums service.log - this information is being prepared.
session.log - log-in requests and session information.
/var/log/avid/qm Quality Manager (relink) logs.
RHEL Logs in /var/log
The following table presents the standard RHEL logs found in the /var/log directory:
Log File Description
/var/log/anaconda.log Linux installation messages.
/var/log/boot.log Information pertaining to boot time.
/var/log/btmp.log Failed login attempts.
/var/log/cron Information logged by the Linux cron daemon.
/var/log/dmesg Information about hardware detected by the kernel at boot
time. The Linux dmesg command shows the contents of this
log.
42
Page 43

Important Log Files at a Glance
Log File Description
/var/log/dracut.log Log file of the Linux initramfs image creation process.
/var/log/lastlog Most recent log-in for all system users. Use Linux lastlog
command to view the contents of this log.
/var/log/maillog Mail server log.
/var/log/mcelog The machine check events (memory and CPU error) log.
/var/log/messages Global system messages, including startup messages, logins,
packet logging.
/var/log/secure Authentication and authorization messages.
/var/log/spooler Usenet and uucp log.
/var/log/tallylog Failed login attempts.
/var/log/wtmp Current login records. Use the Linux who command to display
the contents.
/var/log/yum.log Information about packages installed using Linux yum utility.
RHEL Subdirectories in /var/log
The following table presents the standard RHEL subdirectories found in the /var/log directory:
Log File Description
/var/log/audit Logs stored by the RHEL audit daemon.
/var/log/ConsoleKit Logs stored related to user sessions. Deprecated.
/var/log/cups Logs related to printing.
/var/log/httpd The Apache web server access and error logs. As of ICS 1.8
Apache is no longer used.
43
Page 44

Important Log Files at a Glance
Log File Description
/var/log/ntpstats Logs relating to the NTP daemon.
To enable NTP logging, add lines similar to the following to
/etc/ntp.conf:
statistics clockstats cryptostats loopstats
peerstats
logconfig =all
logfile /var/log/ntp
statsdir /var/log/ntpstats/
/var/log/prelink Information related to the Linux prelink program that speeds
up the startup process.
/var/log/rhsm Logs related to the Red Hat Subscription Manager.
/var/log/sa Information collected and stored by the Linux sar performance
monitoring utility (CPU, memory, I/O, network statistics, and
so on). The sar utility is part of the larger Linux sysstat
package. It reports local information only (i.e. it is not
cluster-ready).
/var/log/samba Logs related to the Samba programs.
/var/log/sssd Information stored by the Linux system security services
ICS Logs in /var/log
The following table presents the standard ICS logs found in the /var/log directory:
Log File Description
/var/log/fuse_avidfos.log Logs related to the Linux fuse interface, used by the avid-isis
/var/log/ICS_installer_
<version>_<build>.log
/var/log/ICS_install.log Logs related primarily to the installation of ICS services.
daemon responsible for access to remote directories and
authentication.
backend service to mount the ISIS.
Logs related primarily to the Linux phase of the installation.
44
Page 45

ICS Subdirectories in /var/log
Log File Description
/var/log/avid Logs for numerous Avid services.
/var/log/avid-syslog • edit.log - deprecated.
/var/log/cluster Corosync log files.
/var/log/mongo MongoDB log files.
/var/log/rabbitmq RabbitMQ log files.
Important Log Files at a Glance
See “Important Log Files at a Glance” on page 40.
• spooler.log - deprecated.
“Important Log Files at a Glance” on page 40.
See
45
Page 46

4 Validating the Cluster
This chapter presents a series of verifications and tests for determining if a cluster is behaving
normally and its network connections are optimal. It covers what to test, and what to expect, and
how to remedy the situation if you find evidence of incorrect or suboptimal conditions.
Normally, you should only need to run through the procedures in this chapter once, after setting
up the cluster. However, if a node has been added, or you suspect conditions on the network have
changed (for example, if a network switch has been altered or replaced), you ought to run
through some of the validation procedures again.
This section is intended for use primarily on a newly set up cluster, or when a node has been
added or permanently removed. For information and procedures directed towards regular
maintenance activities, see
Verifying Cluster Configuration
The simplest way to verify that all nodes are participating in the cluster and all resources are up
and running is via the Pacemaker Cluster Resource Monitor, crm. This utility lets you view and
monitor (in real time) the status of the cluster.
“Cluster Maintenance and Administrator Best Practices” on page 64.
To monitor the status of the cluster, log in to any node in the cluster as root and enter the
following command.
crm_mon [-f]
The output of this command presents the status of the main resources (and underlying services)
controlled by Pacemaker, and the nodes on which they are running. The optional -f switch adds
fail counts to the output.
Example: A Cluster Consisting with Three Nodes
To illustrate the Cluster Resource Monitor, consider an cluster consisting of three nodes:
• icps-mam-small
• icps-mam-med
• icps-mam-large
Page 47

Verifying Cluster Configuration
Logging in to one of the above nodes and issuing the crm command results in the following
output:
============
Last updated: Wed Apr 30 13:11:30 2014
Last change: Wed Apr 9 08:24:44 2014 via crmd on icps-mam-large
Stack: openais
Current DC: icps-mam-large - partition with quorum
Version: 1.1.7-6.el6-148fccfd5985c5590cc601123c6c16e966b85d14
3 Nodes configured, 3 expected votes
19 Resources configured.
============
Online: [ icps-mam-med icps-mam-large icps-mam-small ]
Clone Set: AvidConnectivityMonEverywhere [AvidConnectivityMon]
Started: [ icps-mam-large icps-mam-med icps-mam-small ]
AvidClusterMon (lsb:avid-monitor): Started icps-mam-large
MongoDB (lsb:mongod): Started icps-mam-large
Resource Group: postgres
postgres_fs (ocf::heartbeat:Filesystem): Started icps-mam-large
AvidClusterIP (ocf::heartbeat:IPaddr2): Started icps-mam-large
pgsqlDB (ocf::avid:pgsql_Avid): Started icps-mam-large
Master/Slave Set: ms_drbd_postgres [drbd_postgres]
Masters: [ icps-mam-large ]
Slaves: [ icps-mam-med ]
Clone Set: AvidAllEverywhere [AvidAll]
Started: [ icps-mam-small icps-mam-med icps-mam-large ]
AvidIPC (lsb:avid-interplay-central): Started icps-mam-large
AvidUMS (lsb:avid-ums): Started icps-mam-large
AvidACS (lsb:acs-ctrl-core): Started icps-mam-large
Clone Set: AvidICPSEverywhere [AvidICPS]
Started: [ icps-mam-small icps-mam-med icps-mam-large ]
Note the line identifying the master node:
• AvidClusterIP
Note that the master node always runs the following services:
• AvidIPC (avid-interplay-central)
• AvidUMS (avid-ums)
• AvidACS (acs-ctrl-core)
In the bullet list above — as in the crm output — the actual service name, as it would appear at
the Linux command line, is shown in parentheses.
47
Page 48

Verifying Cluster Configuration
The prefix lsb shown in the Cluster Resource Monitor indicates the named service conforms to
n
the Linux Standard Base (LSB) project, meaning these services support standard Linux
commands for scripts (e.g. start, stop, restart, force-reload, status). The prefix ocf indicates the
named entity is a cluster resource, compliant with the Open Cluster Framework (OCF). OCF
can be understood as an extension of LSB for the purposes of clustering.
For details on Cluster Resource Monitor output, see “Understanding the Cluster Resource
n
Monitor Output” on page 65.
Notice also that while all services are running on one node — icps-mam-large, in the sample
output — only some of the services are running on the others (icps-mam-small &
icps-mam-med). This is because icps-mam-large is the master node. The icps-mam-med node is
the slave node, and runs database replication and video playback services only. The
icps-mam-small node runs video playback services only.
Example: Fail Counts
As noted, running crm_mon with the -f switch adds fail counts (if any) to the output, for
example:
Migration summary:
* Node icps-mam-large:
AvidAll:2: migration-threshold=1000000 fail-count=7
AvidUMS: migration-threshold=2 fail-count=1
AvidACS: migration-threshold=20 fail-count=1
* Node icps-mam-med:
* Node icps-mam-small:
AvidAll:0: migration-threshold=1000000 fail-count=9
Failed actions:
AvidUMS_monitor_25000 (node=icps-mam-large, call=188, rc=7,
status=complete): not running
AvidACS_monitor_25000 (node=icps-mam-large, call=189, rc=7,
status=complete): not running
AvidAll:0_monitor_25000 (node=icps-mam-small, call=76, rc=7,
status=complete): not running
To reset all the fail counts for a cluster:
If you see fail counts or failed action errors in the Cluster Resource Monitor, you can easily reset
them for all nodes by entering the following command (as root):
/usr/maxt/maxedit/cluster/resources/cluster rsc-cleanup
For additional ways to reset fail counts, “Cluster Maintenance and Administrator Best Practices”
on page 64
.
48
Page 49

Verifying the Contents of the Hosts File
Verifying the Contents of the Hosts File
The hosts file (/etc/hosts) is used by Linux to map host names to IP addresses, allowing network
transactions on the computer to resolve the right targets on the network when the instructions
carry a host name (more human readable) instead of an IP address.
In an ICS cluster, it is very important for each node in the cluster to resolve host names and IP
addresses for all nodes in the same cluster as quickly as possible. As a result, it is important to:
• Resolve the hosts own host name independently of the localhost entry
• Add entries to the hosts file to resolve the host names for other nodes in the cluster
To verify the content of the hosts file:
1. Open edit the /etc/hosts file for editing and locate the following line(s):
127.0.0.1 localhost localhost.localdomain localhost4
localhost4.localdomain4
::1 localhost localhost.localdomain localhost6 localhost6.localdomain6
Note the following:
- 127.0.0.1: This entry maps the default localhost IP address (127.0.0.1) to localhost.
- ::1: This entry performs the same mapping function for IPv6 networking. “::1” is
shorthand for the long sequence of zeros and colons representing the default IPv6
localhost IP address.
2. In some cases, the entries might include an explicit call-out of the computer's own host name
(shown in italics, below):
127.0.0.1 localhost localhost.localdomain localhost4
localhost4.localdomain4 ics-node1
::1 localhost localhost.localdomain localhost6 localhost6.localdomain6
ics-node1
In the above sample network:
- ics-node-1: Is the host name of the local machine.
In a cluster the above entry must be considered an error. When another node queries
n
"ics-node-1" for its IP address, it will receive "127.0.0.1" in response. Thereafter, the node that
did the querying will send messages to itself instead of the real "ics-node-1", and clustering will
be thrown into disarray.
3. If an entry contains the machine's own host name, remove the host name from the entry.
49
Page 50

For example, in the above sample output, you would removed “ics-node-1” from the end of
both entries.
4. In addition, the /etc/hosts file should contain lines resolving host names to IP addresses for
all nodes in the cluster (including the local host). The form of each line is as follows:
<IP Address> <FQDN> <hostname>
For a four node cluster, for example, the /etc/hosts files should contain entries similar to the
following:
127.0.0.1 localhost localhost.localdomain localhost4
localhost4.localdomain4
::1 localhost localhost.localdomain localhost6 localhost6.localdomain6
10.106.131.41 burl-ics1.csglobal.lab ics-node-1
10.106.131.42 burl-ics2.csglobal.lab ics-node-2
10.106.131.43 burl-ics3.csglobal.lab ics-node-3
10.106.131.44 burl-ics4.csglobal.lab ics-node-4
5. If it does not, add the appropriate information, save, and exit the file.
Verifying the Lookup Service Order
Verifying the Lookup Service Order
A Linux server can look up host names and IP addresses in different places. For example, it can
resolve a host name to an IP address by looking into the /etc/hosts file or via a DNS server.
Editing /etc/hosts files to map host names and IP addresses for a network of many computers can
be tedious and is prone to error. Using a DNS server is a more efficient way in many cases.
However, the lookup process that uses a DNS server is vulnerable to network latency and
occasionally timeouts.
For an ICS cluster, it is very important to minimize the time it takes to resolve server names to IP
addresses. As a result, using the local /etc/hosts file need to be given priority over a DNS server.
It is therefore important to configure all ICS nodes in a cluster to first try to resolve host names to
IP addresses using the hosts file, and if the host name is not declared in that file, then refer to a
DNS.
To verify the lookup service order:
1. Open the /etc/nsswitch.conf file for editing:
vi /etc/nsswitch.conf
2. Find the hosts section where the lookup order is specified (about halfway into the file):
#hosts: db files nisplus nis dns
hosts: files dns
3. Make sure that in the uncommented hosts line, the term files appears before the term dns.
50
Page 51

Verifying the Cluster IP Addresses and NIC Names
If not, edit the file, then save it and exit.
Verifying the Cluster IP Addresses and NIC Names
In order for the cluster to operate correctly, end-users must be able to connect to it via the cluster
IP address, which is a "virtual" IP address hosted by the master node (and managed by
Pacemaker). In addition, the master node (and all other nodes) must be able to connect to the
ISIS (or file system storage).
The NIC interface named eth0 is used by each node in the cluster to connect to storage. A
"virtual" NIC interface named eth0:cl0 (for "cluster 0") is used to represent the cluster to the
outside world. Both these NIC interfaces must be visible for the cluster to function.
To verify visibility of the Cluster IP Addresses and NIC Names:
On the master node, enter the following command as root:
ifconfig
For help identifying the master node, see “Identifying the Master, Slave, and Load-Balancing
n
Nodes” on page 58.
This command returns detailed information on the currently active network interfaces, with
output similar to the following (eth0, eth0:cl0 and lo should be present on the master):
eth0 Link encap:Ethernet HWaddr 00:26:55:E6:46:6A
inet addr:172.24.18.226 Bcast:172.24.18.255 Mask:255.255.255.0
inet6 addr: fe80::226:55ff:fee6:466a/64 Scope:Link
UP BROADCAST RUNNING MULTICAST MTU:1500 Metric:1
RX packets:80365428 errors:0 dropped:0 overruns:0 frame:0
TX packets:98852170 errors:0 dropped:0 overruns:0 carrier:0
collisions:0 txqueuelen:1000
RX bytes:31780097451 (29.5 GiB) TX bytes:83538170989 (77.8 GiB)
Interrupt:26 Memory:fbfe0000-fc000000
eth0:cl0 Link encap:Ethernet HWaddr 00:26:55:E6:46:6A
inet addr:172.24.18.60 Bcast:172.24.18.188 Mask:255.255.255.255
UP BROADCAST RUNNING MULTICAST MTU:1500 Metric:1
Interrupt:26 Memory:fbfe0000-fc000000
lo Link encap:Local Loopback
inet addr:127.0.0.1 Mask:255.0.0.0
inet6 addr: ::1/128 Scope:Host
UP LOOPBACK RUNNING MTU:16436 Metric:1
RX packets:47938974 errors:0 dropped:0 overruns:0 frame:0
51
Page 52

TX packets:47938974 errors:0 dropped:0 overruns:0 carrier:0
collisions:0 txqueuelen:0
RX bytes:40479536558 (37.6 GiB) TX bytes:40479536558 (37.6 GiB)
Note the following:
• eth0 indicates the NIC interface named "eth0" is up and running. This is the interface used to
connect to the ISIS (by default).
• eth0:cl0 indicates this node has a virtual NIC interfaces defined for it. Technically, this is an
alias, a construct permitting two IP addresses to be assigned to the same NIC interface. The
cluster NIC alias is cl0 (for "cluster 0"). Only the master node will show the "eth0:cl0"
information, which indicates it owns the virtual cluster IP address.
• Under eth0:cl0, the IP address ("inet addr") must match the cluster IP address
• lo is the loopback interface.
Verifying Node Connectivity
Recall that as seen from the outside (and by end-users) the cluster appears as a single machine
with one host name and IP address. Nevertheless, within a cluster, nodes communicate with one
another using their individual host names and IP addresses. In addition, ICS itself depends on
excellent connectivity for its success.
Verifying Node Connectivity
First, it is important to determine that the nodes are visible to one another over the network. It is
also important to determine how packets are routed through the network — you do not want too
many "hops" involved (ideally, there should be just one hop). The Linux ping command is the
simplest way to verify basic network connectivity. Routing information is revealed by the Linux
traceroute command.
When establishing the cluster (using setup-corosync) you made use of a "pingable IP" address.
n
The pingable IP address is used by ICS nodes for self-diagnosis, to determine if they themselves
have dropped out of the cluster, or if it is network connectivity that is the issue. Be sure to run
traceroute on the pingable IP address to verify it is within easy reach and is unlikely to be made
unreachable, for example, by inadvertent changes to network topology.
In this section you:
1. Obtain the “always on” pingable address from the Cluster Information Base.
2. Use the address to verify network connectivity.
3. Verify the routing of packets between nodes.
4. Verify DNS host name resolution.
52
Page 53

Verifying Node Connectivity
Obtaining the “Always-On” IP Address
The “always-on” IP address is used by Connectivity Monitor cluster components to determine if
a particular nodes is still in the cluster. For example, if the Connectivity Monitor on a slave node
can no longer communicate with the master node, it “pings” the always-on IP address (in
practice, usually a router). If the always-on address responds, the node concludes it is the master
node that has gone off-line, and it takes on the role of master itself. If the always-on address does
not respond, the slave node concludes there is a network glitch; hence it does not attempt to take
on the master role.
To obtain the pingable IP address:
On any node in the cluster type the following command:
crm configure show
This displays the contents of the Cluster Information Base in human-readable form. The
pingable IP address is held by the AvidConnectivityMon primitive (shown below).
primitive AvidConnectivityMon ocf:pacemaker:ping \
params host_list="172.XX.XX.X" multiplier="100" \
op start interval="0" timeout="20s" \
op stop interval="0" timeout="20s" \
op monitor interval="10s" timeout="30s"
Verifying Network Connectivity
Verifying basic network connectivity between cluster nodes by manually pinging the nodes of
interest is a quick way to ensure the nodes can communicate with one another.
To verify network connectivity:
On any network connected machine (preferably one of the cluster nodes), use the Linux ping
command to reach the host in question:
ping -c 4 <hostname/ipaddres>
For example:
ping -c 4 ics-dl360-1
53
Page 54

Verifying Node Connectivity
The system responds by outputting its efforts to reach the specified host, and the results. For
example, output similar to the following indicates success:
PING ics-dl360-1.fqdn.com (172.XXX.XXX.XXX) 56(88) bytes of data
64 bytes from ics-dl360-1.fqdn.com (172.XXX.XXX.XXX):
64 bytes from ics-dl360-1.fqdn.com (172.XXX.XXX.XXX):
64 bytes from ics-dl360-1.fqdn.com (172.XXX.XXX.XXX):
64 bytes from ics-dl360-1.fqdn.com (172.XXX.XXX.XXX):
A summary of the results is also presented.
Testing the Number of Network “hops” between Nodes
Network “hops” refer to the number of routers or network switches that data must pass through
on the way from the source node to its destination. For efficiency, it is important that there are as
few network hops as possible between the clustered nodes. Ideally, there should be at most one
hop.
To view the route packets take between nodes:
On one of the cluster nodes connected machine, use the Linux traceroute command to reach
another node:
traceroute <hostname>
For example, issuing a traceroute on "localhost" (always your current machine) will result in
output similar to the following:
1 traceroute to localhost (127.0.0.1), 30 hops max, 60 byte packets
localhost (127.0.0.1) 0.020 ms 0.003 ms 0.003 ms
The above output indicates the packets traveled over a single hop.
For a machine that is three network hops away, the results will resemble the following:
1 172.24.18.1 (172.24.18.1) 0.431 ms 0.423 ms 0.416 ms
2 gw-mtl-isis-lab1.global.avidww.com (172.24.32.7) 0.275ms 0.428 ms 0.619
ms
3 mtl-sysdira.global.avidww.com (172.24.48.40) 0.215 ms 0.228 ms 0.225 ms
54
Page 55

Verifying Node Connectivity
Verifying DNS Host Naming
It is important that the DNS servers correctly identify the nodes in the cluster. This is true of all
nodes, not just the master and slave. The Linux dig (domain information groper) command
performs name lookups and displays the answers returned by the name servers that are queried.
To verify that each host is recognized by DNS:
For each node, enter the following command as root.
dig +search <host>
The +search option forces dig to use the DNS servers defined in the /etc/resolve.conf file, in the
order they are listed in the file.
The dig command as presented above returns information on the "A" record for the host name
submitted with the query, for example:
dig +search icps-mam-large
Returns output similar to the following:
; <<>> DiG 9.8.2rc1-RedHat-9.8.2-0.10.rc1.el6 <<>> +search icps-mam-large
;; global options: +cmd
;; Got answer:
;; ->>HEADER<<- opcode: QUERY, status: NOERROR, id: 27390
;; flags: qr rd ra; QUERY: 1, ANSWER: 1, AUTHORITY: 0, ADDITIONAL: 0
;; QUESTION SECTION:
;icps-mam-large.global.avidww.com. IN A
;; ANSWER SECTION:
icps-mam-large.global.avidww.com. 480 IN A 172.24.18.242
;; Query time: 31 msec
;; SERVER: 172.24.32.12#53(172.24.32.12)
;; WHEN: Thu May 1 16:38:26 2014
;; MSG SIZE rcvd: 66
The key information in the above output is the status (NOERROR) in the “->>HEADER<<-”
section, and the “Answer Section” which contains the Fully Qualified Domain Name (FQDN),
even though you only submitted the host name. This proves the domain name server has the
information it needs to resolve the host name.
The following table presents the possible return codes:
55
Page 56

Return Code Description
NOERROR DNS Query completed successfully
FORMERR DNS Query Format Error
SERVFAIL Server failed to complete the DNS request
NXDOMAIN Domain name does not exist
NOTIMP Function not implemented
REFUSED The server refused to answer for the query
YXDOMAIN Name that should not exist, does exist
XRRSET RRset that should not exist, does exist
NOTAUTH Server not authoritative for the zone
NOTZONE Name not in zone
Checking DRBD Status
Checking DRBD Status
Recall that DRBD is responsible for mirroring the ICS database on the two servers in the
master-slave configuration. It does not run on any other nodes. In this section you run the DRDB
drdb-overview utility to ensure there is connectivity between the two DRBD nodes, and to verify
database replication is taking place.
To view the status of DRBD, log in to the node of interest and issue the following command:
drbd-overview
A healthy master node will produce output similar to the following:
1:r0/0 Connected Primary/Secondary UpToDate/UpToDate C r----- /mnt/drbd
ext4 20G 907M 18G 5%
A healthy slave node will return the following:
1:r0/0 Connected Secondary/Primary UpToDate/UpToDate C r-----
If the master and slave nodes do not resemble the above output, see “Troubleshooting DRBD”
n
on page 78.
The following table explains the meaning of the output:
56
Page 57

Element Description
Checking DRBD Status
1:r0/0
The DRBD device number (“1”) and name (“r0/0”).
Connected The connection state. Possible states include:
• Connected - Connection established and data mirroring is
active.
• Standalone - No DRBD network connection (i.e., not yet
connected, explicitly disconnected, or connection
dropped). In ICS this usually indicates a “split brain” has
occurred.
• WFConnection - The node is waiting for the peer node to
become visible on the network.
Primary/Secondary
The roles for the local and peer (remote) DRBD resources.
The local role is always presented first (i.e. local/peer).
• Primary - The active resource.
• Secondary - The resource that receives updates from its
peer (the primary).
• Unknown - The resource’s role is currently not known.
This status is only ever displayed for the peer resource (i.e.
Primary/Unknown).
UptoDate/UptoDate
The resource’s disk state. The local disk state is presented first
(i.e. local/peer). Possible states include:
• UptoDate - Consistent and up to date. The normal state.
• Consistent - Data is consistent, but the node is not
connected to its peer.
• Inconsistent - Data is not consistent. This occurs on both
nodes prior to first (full) sync, and on the synchronization
target during synchronization.
• DUnknown - No connection to peer. This status is only
ever displayed for the peer resource (i.e.
UptoDate/Unknown).
C
r-----
The replication protocol. Should be “C” (synchronous).
I/O flags. The first entry should be “r” (running).
57
Page 58

Identifying the Master, Slave, and Load-Balancing Nodes
Element Description
/mnt/drbd ext4 20G 907M 18G 5%
The DRBD partition mount point and other standard Linux
filesystem information. This indicates the DRBD partition is
mounted on this node. This should be the case on the master
node only.
Identifying the Master, Slave, and Load-Balancing
Nodes
Recall that there are three types of nodes in a cluster: master, slave, and load-balancing. The
master “owns” the cluster IP address. The slave assumes the role of master in the event of a
failover. Any extra nodes play a load-balancing role, but can never take on the role of master or
slave.
This section provides instructions for quickly identifying the different nodes in a cluster using the
n
Cluster Resource Monitoring utility, crm. For more details on its output, see “Understanding the
Cluster Resource Monitor Output” on page 65.
To identify the master node, slave node, and load balancing nodes:
1. Log in to any node in the cluster as root and open the cluster resource monitoring utility:
crm_mon
This returns the status of all cluster-related services on all nodes, with output similar to the
following example using three nodes (e.g. icps-mam-small, icps-mam-medium and
icps-mam-large).
============
Last updated: Wed Apr 30 13:11:30 2014
Last change: Wed Apr 9 08:24:44 2014 via crmd on icps-mam-large
Stack: openais
Current DC: icps-mam-large - partition with quorum
Version: 1.1.7-6.el6-148fccfd5985c5590cc601123c6c16e966b85d14
3 Nodes configured, 3 expected votes
19 Resources configured.
============
Online: [ icps-mam-med icps-mam-large icps-mam-small ]
Clone Set: AvidConnectivityMonEverywhere [AvidConnectivityMon]
Started: [ icps-mam-large icps-mam-med icps-mam-small ]
58
Page 59

Identifying the Master, Slave, and Load-Balancing Nodes
AvidClusterMon (lsb:avid-monitor): Started icps-mam-large
MongoDB (lsb:mongod): Started icps-mam-large
Resource Group: postgres
postgres_fs (ocf::heartbeat:Filesystem): Started icps-mam-large
AvidClusterIP (ocf::heartbeat:IPaddr2): Started icps-mam-large
pgsqlDB (ocf::avid:pgsql_Avid): Started icps-mam-large
Master/Slave Set: ms_drbd_postgres [drbd_postgres]
Masters: [ icps-mam-large ]
Slaves: [ icps-mam-med ]
Clone Set: AvidAllEverywhere [AvidAll]
Started: [ icps-mam-small icps-mam-med icps-mam-large ]
AvidIPC (lsb:avid-interplay-central): Started icps-mam-large
AvidUMS (lsb:avid-ums): Started icps-mam-large
AvidACS (lsb:acs-ctrl-core): Started icps-mam-large
Clone Set: AvidICPSEverywhere [AvidICPS]
Started: [ icps-mam-small icps-mam-med icps-mam-large ]
============
2. In the output of the command, look for the line containing “AvidClusterIP” — this service
runs on the master node only (icps-mam-large in the above example):
- AvidClusterIP
For example:
AvidClusterIP (ocf::heartbeat:IPaddr2): Started icps-mam-large
The sample output above identifies the master as icps-mam-large.
Note that the master node always runs the following services:
- AvidIPC (avid-interplay-central)
- AvidUMS (avid-ums)
- AvidACS (acs-ctrl-core)
For example:
AvidIPC (lsb:avid-interplay-central): Started icps-mam-large
AvidUMS (lsb:avid-ums): Started icps-mam-large
AvidACS (lsb:acs-ctrl-core): Started icps-mam-large
3. To identify the slave, look for the line containing “Master/Slave Set”.
For example:
Master/Slave Set: ms_drbd_postgres [drbd_postgres]
Masters: [ icps-mam-large ]
Slaves: [ icps-mam-med ]
The sample output above identifies the slave as icps-mam-med.
4. To identify the load-balancing nodes, look for the “online” or any of the “started” entries.
59
Page 60

For example:
Online: [ icps-mam-med icps-mam-large icps-mam-small ]
Started: [ icps-mam-large icps-mam-med icps-mam-small ]
The sample output above identifies the load-balancing node as icps-mam-small.
Forcing a Failover
You can verify the cluster is working as expected by putting the master node into standby mode
and observing the failover. You can then bring the node back up and observe as it rejoins the
cluster.
To force a failover in the cluster:
1. Log in to any node in the cluster as root and open the cluster resource monitoring utility:
crm_mon
This returns the status of all cluster-related services on all nodes, with output similar to the
following example using three nodes (e.g. icps-mam-small, icps-mam-medium and
icps-mam-large).
============
Last updated: Wed Apr 30 13:11:30 2014
Last change: Wed Apr 9 08:24:44 2014 via crmd on icps-mam-large
Stack: openais
Current DC: icps-mam-large - partition with quorum
Version: 1.1.7-6.el6-148fccfd5985c5590cc601123c6c16e966b85d14
3 Nodes configured, 3 expected votes
19 Resources configured.
============
Forcing a Failover
Online: [ icps-mam-med icps-mam-large icps-mam-small ]
Clone Set: AvidConnectivityMonEverywhere [AvidConnectivityMon]
Started: [ icps-mam-large icps-mam-med icps-mam-small ]
AvidClusterMon (lsb:avid-monitor): Started icps-mam-large
MongoDB (lsb:mongod): Started icps-mam-large
Resource Group: postgres
postgres_fs (ocf::heartbeat:Filesystem): Started icps-mam-large
AvidClusterIP (ocf::heartbeat:IPaddr2): Started icps-mam-large
pgsqlDB (ocf::avid:pgsql_Avid): Started icps-mam-large
Master/Slave Set: ms_drbd_postgres [drbd_postgres]
Masters: [ icps-mam-large ]
Slaves: [ icps-mam-med ]
Clone Set: AvidAllEverywhere [AvidAll]
Started: [ icps-mam-small icps-mam-med icps-mam-large ]
60
Page 61

Forcing a Failover
AvidIPC (lsb:avid-interplay-central): Started icps-mam-large
AvidUMS (lsb:avid-ums): Started icps-mam-large
AvidACS (lsb:acs-ctrl-core): Started icps-mam-large
Clone Set: AvidICPSEverywhere [AvidICPS]
Started: [ icps-mam-small icps-mam-med icps-mam-large ]
============
2. Note the line identifying the master node:
- AvidClusterIP
This is the node you will put into standby mode to observe failover (icps-mam-large in the
above example).
Note that the master node always runs the following services:
- AvidIPC (avid-interplay-central)
- AvidUMS (avid-ums)
- AvidACS (acs-ctrl-core)
3. In a separate terminal session log in to any node as root and bring the master node into
standby mode:
crm node standby <master node name>
In the above command, replace <master node name> with the name of the master node (e.g.
icps-mam-large).
4. Observe the failover in the crm_mon utility within the other terminal session as the master
node is reassigned to the slave node, and the associated services are brought up on the new
master.
Note too that any active Interplay Central client windows will receive a message indicating
the need to log back in. Playback might be briefly affected.
5. Bring the standby node back online:
crm node online <original master node name>
6. Observe in the crm_mon window as the off-line node is brought back up and rejoins the
cluster.
7. If you want to restore the original node to the role of master, temporarily put the current
master into standby mode, so control fails over again, back to the original master node.
61
Page 62

Resetting Fail Counts
Note that a node fail count is retained by the system, and should be reset after a failover. This is
somewhat critical, as the threshold for failures is two (2), the default for all services except
AvidAll. The cluster will fail over automatically when the threshold is reached. Using the
cleanup command will reset the fail count.
To view the fail counts:
1. Exit the cluster resource monitor (if still active), then launch it again, this time with the
option to view the fail counts:
crm_mon -f
2. The Cluster Resource Monitor outputs the status of the cluster, which now includes a
"Migration Summary" section, similar to the following:
Migration summary:
* Node <master node>:
* Node <slave node>:
* Node <load-balancing node>:
For example, if the AvidUMS resource — which encapsulate the UMS service — has failed
on the master node of a three-node cluster, the output would resemble the following:
Migration summary:
* Node <master node>:
AvidUMS: migration-threshold=2 fail-count=1
* Node <slave node>:
* Node <load-balancing node>:
Resetting Fail Counts
A fail-count of 1 indicates the underlying service failed and was restarted. Should it fail
again (reaching the “migration threshold”), Pacemaker will remove this node from the
cluster and failover to the slave node.
To reset a fail count:
1. Reset the fail count for the node directly:
crm resource failcount <resource> set <hostname> 0
Here <resource> is the name of the resource for which you want to reset the failcount:
- Avid ACS (avid-ctrl-core)
- Avid UMS (avid-ums)
- Avid IPC (avid-interplay-central)
- AvidAllEverywhere (avid-all)
62
Page 63

Resetting Fail Counts
And where <hostname> is the hostname of the node on which the service is running.
For example:
crm resource failcount AvidACS set icps-mam-large 0
2. Alternately, use the cleanup command to reset all fail counts for all nodes in the cluster:
/usr/maxt/maxedit/cluster/resources/cluster rsc-cleanup
3. Run crm_mon again to observe the results:
crm_mon -f
63
Page 64

5 Cluster Maintenance and Administrator
Best Practices
Under most conditions, Pacemaker perform more than adequately as an ICS cluster
administrator. It restarts the services under its management and sends e-mail alerts when a node
has been removed from the cluster, without the need for human intervention. This section
provides additional guidance for an ICS cluster administrator, with information and procedures
to ensure the cluster remains healthy and running optimally.
Checking Cluster Status
For all important events such as a master node failover, the cluster sends automated emails to
cluster administrator email address(es). It is nevertheless important to regularly check up on the
cluster manually. Recall that cluster resources are Linux services under management by
Pacemaker. By regularly checking the fail counts of cluster resources, for example, you can
identify trouble spots before a failover actually takes place. Similarly, examining the status of
DRBD will ensure database replication proceeds as expected.
The following table lists the main tools for examining the status of a cluster:
Tool Name Notes
crm The Pacemaker Cluster Resource Manager utility.
crm_mon A shortcut for "crm resource status". In addition,
the following form of the command outputs
cluster status plus fail count information:
crm_mon -f
If a service has reached a fail-count of 2 and a has
been removed, that server should be examined.
drdb-overview A utility that outputs DRBD connectivity status.
Page 65

Understanding the Cluster Resource Monitor Output
Understanding the Cluster Resource Monitor Output
This section provides a line-by-line explanation of typical crm_mon output (line numbers have
been added, for reference).
1. ============
2. Last updated: Wed Apr 30 13:11:30 2014
3. Last change: Wed Apr 9 08:24:44 2014 via crmd on icps-mam-large
4. Stack: openais
5. Current DC: icps-mam-large - partition with quorum
6. Version: 1.1.7-6.el6-148fccfd5985c5590cc601123c6c16e966b85d14
7. 3 Nodes configured, 3 expected votes
8. 19 Resources configured.
9. ============
10. Online: [ icps-mam-med icps-mam-large icps-mam-small ]
11. Clone Set: AvidConnectivityMonEverywhere [AvidConnectivityMon]
12. Started: [ icps-mam-large icps-mam-med icps-mam-small ]
13. AvidClusterMon (lsb:avid-monitor): Started icps-mam-large
14. MongoDB (lsb:mongod): Started icps-mam-large
15. Resource Group: postgres
16. postgres_fs (ocf::heartbeat:Filesystem): Started icps-mam-large
17. AvidClusterIP (ocf::heartbeat:IPaddr2): Started icps-mam-large
18. pgsqlDB (ocf::avid:pgsql_Avid): Started icps-mam-large
19. Master/Slave Set: ms_drbd_postgres [drbd_postgres]
20. Masters: [ icps-mam-large ]
21. Slaves: [ icps-mam-med ]
22. Clone Set: AvidAllEverywhere [AvidAll]
23. Started: [ icps-mam-small icps-mam-med icps-mam-large ]
24. AvidIPC (lsb:avid-interplay-central): Started icps-mam-large
25. AvidUMS (lsb:avid-ums): Started icps-mam-large
26. AvidACS (lsb:acs-ctrl-core): Started icps-mam-large
27. Clone Set: AvidICPSEverywhere [AvidICPS]
28. Started: [ icps-mam-small icps-mam-med icps-mam-large ]
Line(s) Description
1-9 Header information
2 Last time something changed in the cluster status (for example, a service stopped, was
restarted, and so on).
3 Last time the cluster configuration was changed, and from where it was changed.
65
Page 66

Understanding the Cluster Resource Monitor Output
Line(s) Description
4 Name of the Corosync stack (includes Pacemaker, Corosync and Heartbeat). Always named
"openais".
5 Displays the current holder of the configuration. If you change something on a machine, the
change must be "approved" by the Current DC.
6 Version number of the Corosync stack.
7 The number of nodes configured. Expected votes relates to quorums (unused).
8 Number of resources (services and groups of services) under management by Pacemaker.
This includes the cluster IP address.
For example, referring to lines 15-18. Lines 16, 17, & 18 represent resources. Line 15 (the
resource group) is also a resource.
10 Lists the nodes that are online and/or offline.
11-12 The resource monitoring the pingable IP address you specified when creating the cluster.
13 The resource that sends the automated emails.
14 The MongoDB resource
15-18 The PostgreSQL resource group.
· postgres_fs: Responsible for mounting the drbd device as a filesystem.
· AvidClusterIP: The virtual cluster IP address.
· pgsqlDB: The PostgreSQL database.
19-21 The master/slave set for DRBD.
22-23 The playback services. "Clone Set" indicates it is running on all nodes in the cluster.
24 Interplay Central resource.
25 The User Management Services resource.
26 The Avid Common Services bus (“the bus”).
27-28 The Avid Interplay Central Playback Services (the “back end” services).
66
Page 67

Verifying Clock Synchronization
Verifying accuracy in clock synchronization across multiple networked servers in Linux is a
challenge, and there is no simple way to do it that provides entirely satisfactory results. The
major impediment is the nature of the Linux NTP itself. Time synchronization is particularly
important in a cluster, since Pacemaker and Corosync, the cluster management software, rely on
time stamps for accuracy in communication.
Recall that during ICS installation you set up a cron job for the NTP daemon to synchronize each
particular system to an NTP time server. Recall too that the time adjustment is not instantaneous
— it can take some time for the NTPD daemon to adjust the local system time to the value
retrieved from the NTP time server. Further, network congestion can result in unpredictable
delays between each server seeking accurate time, and accurate time being returned to it.
For all the reasons given above, it can be understood that even with NTP, there is no guarantee all
systems see the same time at the same moment. Nevertheless, some basic checking can be
performed:
• Verify the NTP configuration file (/etc/ntp.conf) contains the address of an in-house NTP
server
• Ensure any out-of-house servers (e.g. "0.rhel.pool.ntp.org") are commented out (for
security)
Verifying Clock Synchronization
•Verify a cron job (/etc/cron.d/ntpd) has been set up
• Verify the NTP server in the NTP configuration file is reachable from each server in the
cluster:
ntpdate -q <server_address>
• Open a shell on each server in the cluster and visually verify the system time and date:
date
• If needed, use NTP to adjust the time and date:
/usr/sbin/ntpd -q -u ntp:ntp
Some industry literatures suggests a server's time can take some time to "settle down" after a
n
reboot, or after requesting a clock synchronization using NTP. It is not unusual for there to be
delays of up to an hour or two before clock accuracy is established.
For more information see "Synching the System Clock" in the ICS Installation and Configuration
Guide.
67
Page 68

Verifying the AAF Generator Service
The AAF Generator service (avid-aaf-gen) is responsible for saving sequences. To reduce the
possibility of bottlenecks when many users attempt to save sequences at the same time, multiple
instances of the service run simultaneously (by default, five). As a result, Interplay Central has
the ability to save multiple sequences concurrently, significantly reducing overall wait-times
under heavy load.
In a cluster deployment, this service is installed and running on all nodes. However, it is only
involved in saving sequences on the node where the IPC core service (avid-interplay-central) is
currently running.
The service is not managed by Pacemaker. It is therefore important to regularly verify its status.
If one or more instances of it have failed, restart the service. An instance can fail, for example, if
an invalid AAF is used within a sequence. If all instances fail, responsibility for saving transfers
to the Interplay Central core service (avid-interplay-central), and bottlenecks can arise.
Logs are stored in /var/log/avid/avid-aaf-gen/log_xxx.
To verify the status and/or stop the AAF Generator service:
1. Log in to both the master and slave nodes as root.
Verifying the AAF Generator Service
Though the AAF Generator service is active in saving sequences only on the master node,
you should verify its status on the slave node too, to prepare for any failover.
2. Verify the status of the AAF Generator service:
service avid-aaf-gen status
The system outputs the status of each instance, similar to the following:
avid-aaf-gen_1 process is running [ OK ]
avid-aaf-gen_2 process is running [ OK ]
avid-aaf-gen_3 process is running [ OK ]
avid-aaf-gen_4 process is running [ OK ]
avid-aaf-gen_5 process is running [ OK ]
An error would look like this:
avid-aaf-gen_1 process is not running [WARNING]
3. In the event of an error, restart the service as follows:
service avid-aaf-gen restart
68
Page 69

Shutting Down / Rebooting a Single Node
Output similar to the following indicates the service has restarted correctly:
Starting process avid-aaf-gen_1 - Stat: 0 [ OK ]
Starting process avid-aaf-gen_2 - Stat: 0 [ OK ]
Starting process avid-aaf-gen_3 - Stat: 0 [ OK ]
Starting process avid-aaf-gen_4 - Stat: 0 [ OK ]
Starting process avid-aaf-gen_5 - Stat: 0 [ OK ]
4. If you need to stop the service this must be done in two steps. First, configure 0 instances of
the service (there are 5 by default):
echo 0 > /opt/avid/avid-aaf-gen/DEFAULT_NUM_PROCESSES
5. With zero instances configured, you can stop the service normally:
service avid-aaf-gen-stop
To restart the service, reset the number of instances to the default (5) then restart it in the
usual way.
Shutting Down / Rebooting a Single Node
The Linux reboot process is thorough and robust, and automatically shuts down and restarts all
the ICS and clustering infrastructure services on a server in the correct order. However, when the
server is a node in an ICS cluster, care must be taken to remove the node from a cluster — that is,
stop all clustering activity first — before shutting down or rebooting the individual node.
Failing to observe the correct procedures can have unexpected consequences. In the best case,
rebooting a server without first excluding it from the cluster can result in an unnecessary
failovers, for example. In the worst case, it can throw the cluster into disarray.
Before Shutting Down and Restarting:
• Alert end-users to exit Interplay Central or risk losing unsaved work.
To shut down and reboot an individual node:
1. Log in to any machine in the cluster as root, and open two shell windows.
It is not necessary for you to log in to the node you want to reboot.
2. In the first shell, start the Pacemaker Cluster Resource Manager:
crm_mon
69
Page 70

Shutting Down / Rebooting an Entire Cluster
The Pacemaker Cluster Resource Manager presents information on the state of the cluster.
For details, see “Understanding the Cluster Resource Monitor Output” on page 65
3. In the second shell, bring the node of interest into standby mode:
crm node standby <node name>
Putting the node into standby automatically stops Pacemaker (and Corosync). These are the
services responsible for restarting halted services and failing over from master to slave node.
Putting the node into standby before rebooting also eliminates the impact on the failover count.
n
If it is the current master node you put into standby, an orderly failover to the slave node will
take place, without incrementing a fail count on the master node.
4. Observe in the Pacemaker Cluster Resource Monitor shell as the node drops out of the
cluster.
5. Reboot the cluster node, as desired:
- If your shell is open on the node you want to reboot:
reboot
- To reboot a different node from the current shell:
ssh root@<node name> reboot
.
6. Once the node has rebooted, issue the command to rejoin it to the cluster:
crm node online <node name>
In a moment or two, the rebooted node shows up in the Pacemaker cluster resource monitor
shell.
Shutting Down / Rebooting an Entire Cluster
When shutting down and restarting an entire cluster, nodes themselves must be shut down and
restarted in a specific order. Rebooting nodes in the incorrect order can cause DRBD to become
confused about which node is master, resulting in a "split brain" situation. Rebooting in the
incorrect order can also cause RabbitMQ to enter into a state of disarray, and hang. Both DRBD
and RabbitMQ malfunctions can present misleading symptoms and can be equally difficult to
remedy. For these reasons, a strict shutdown and reboot order and methodology is advised.
When shutting down and restarting an entire cluster, allow each node to power down completely
n
before shutting down the next one. Similarly, on restart, allow each node to power up completely
and “settle” before restarting the next.
70
Page 71

Shutting Down / Rebooting an Entire Cluster
The following list shows the correct order for shutting down and restarting an entire cluster:
1. Shut down load-balancing nodes
2. Shut down slave
3. Shut down master
4. Bring up original master
5. Bring up slave
6. Bring up load-balancing nodes
When bringing the cluster back up, it is important to bring up the original master first. This was
n
the last node down, and must be the first back up. This is primarily for the sake of RabbitMQ,
which runs on all nodes and maintains its own “master” (called a “disc node” in RabbitMQ
parlance). The non-master RabbitMQ nodes (called “ram nodes”) look to the last known disc
node for their configuration information. If the disc node is not available, the RabbitMQ cluster
will hang and services that depend on it — such as the ACS bus — will report errors.
Before Shutting Down and Restarting:
• Alert end-users to exit Interplay Central or risk losing unsaved work.
• After shutting down and restarting an entire cluster, it is good practice to check and reset any
fail counts using the Pacemaker Cluster Resource Manager.
To shut down and restart an entire cluster:
1. Log in to any machine in the cluster as root.
2. Use the Pacemaker Cluster Resource Manager to identify the master node:
crm_mon
3. Identify the master node by locating the line containing "AvidClusterIP" — this service runs
on the master server only.
For example, if the crm_mon command output will contain a line similar to the following:
AvidClusterIP (ocf::heartbeat:IPaddr2): Started icps-mam-large
The above output identifies the master node as icps-mam-large.
For details on identifying the master, slave and load-balancing nodes, see “Identifying the
n
Master, Slave, and Load-Balancing Nodes” on page 58.
4. Identify the slave node by locating the "Master/Slave Set" entry.
71
Page 72

Performing a Rolling Shutdown / Reboot
For example, the crm_mon command output will contain an entry similar to the following:
Master/Slave Set: ms_drbd_postgres [drbd_postgres]
Masters: [ icps-mam-large ]
Slaves: [ icps-mam-med ]
The above output identifies the slave node as icps-mam-med.
5. Perform the next operations on each node in the following order:
a. Load-balancing nodes
b. Slave node
c. Master node
6. Stop the clustering services:
service pacemaker stop
service corosync stop
Run the above commands on the load-balancing nodes first, slave node next, then on the master
n
node last. The load-balancing nodes themselves can have their clustering services stopped in
any order.
7. Reboot nodes in the following order:
- Original master node first
- Original slave node second
- Other nodes in any order
Allow the master node to come back up and "settle" before rebooting the slave node. Otherwise,
n
both nodes may attempt to become master, resulting in hung behavior for some processes.
8. After shutting down and restarting an entire cluster, it is good practice to instruct the
Pacemaker cluster resource manager to perform its housekeeping tasks:
crm resource cleanup <resource> [<node>]
For more information, see “Resetting Fail Counts” on page 62.
Performing a Rolling Shutdown / Reboot
A rolling shutdown is one in which several — possibly all — machines in a cluster are shut down
and rebooted, in sequence. Significantly, only one machine at a time is off-line. At no time is
more than one machine off-line. A rolling shut down can be useful if you need to reboot multiple
machines, since it does so in a controlled manner, with minimal disruption of services.
72
Page 73

Performing a Rolling Shutdown / Reboot
The following list shows the correct order for a rolling shutdown / reboot:
1. Power-cycle the load-balancing nodes
2. Power-cycle the slave node
3. Power-cycle the master node
When power-cycling the master and slave servers, first power-cycle one and wait until it has
n
rejoined the cluster before power-cycling the other.
To perform a rolling shutdown / reboot:
1. Log in to any machine in the cluster as root.
2. Use the Pacemaker Cluster Resource Manager to identify the master node:
crm_mon
3. Identify the master node by locating the line containing "AvidClusterIP" — this service runs
on the master server only.
For example, if the crm_mon command output will contain a line similar to the following:
AvidClusterIP (ocf::heartbeat:IPaddr2): Started icps-mam-large
The above output identifies the master node as icps-mam-large.
For details on identifying the master, slave and load-balancing nodes, see “Identifying the
n
Master, Slave, and Load-Balancing Nodes” on page 58.
4. Identify the slave node by locating the "Master/Slave Set" entry.
For example, the crm_mon command output will contain an entry similar to the following:
Master/Slave Set: ms_drbd_postgres [drbd_postgres]
Masters: [ icps-mam-large ]
Slaves: [ icps-mam-med ]
The above output identifies the slave node as icps-mam-med.
5. Power-cycle the load balancing node before any other nodes:
service pacemaker stop
service corosync stop
reboot
6. Power-cycle the slave node next:
service pacemaker stop
service corosync stop
reboot
73
Page 74

Responding to Automated Cluster Email
7. Power-cycle the master node last:
service pacemaker stop
service corosync stop
reboot
8. After performing a rolling shutting / reboot of an entire cluster, it is good practice to instruct
the Pacemaker cluster resource manager to perform its housekeeping tasks:
crm resource cleanup <resource> [<node>]
For more information, see “Resetting Fail Counts” on page 62.
Responding to Automated Cluster Email
By default Pacemaker is configured to send automated emails to notify the cluster administrators
of important events. The following table presents the email types that can be sent and the
remedial action needed.
Email Type Description Action Needed
Node Up /Joined Cluster • A node that was put into
standby has added back into
the cluster
• During installation, a new
node has successfully joined
the cluster.
Node Down/ Removed from
Cluster
• A failover has taken place
and the offending node has
been removed from the
cluster.
• A node has been put into
standby mode
None.
In the case of a failed node, the
cluster requires immediate
attention. Getting it operational
and back in the cluster is a
priority.
Be sure to reset the failover
count on the failed node, once
the situation has been corrected.
“Resetting Fail Counts” on
See
.
page 62
74
Page 75

Responding to Automated Cluster Email
Email Type Description Action Needed
DRBD Split Brain • DRBD is operating
independently on the two
nodes where it is running
DRBD Split Brain Recovery • DRBD has been
successfully reconfigured.
The cluster requires immediate
attention to remedy the
situation.
To remedy, wipe out the DRBD
database on one of the nodes,
then rejoin that node to the
DRBD primary node.
See “Correcting a DRBD Split
Brain” on page 82
.
None.
75
Page 76

6 Cluster Troubleshooting
This chapter presents troubleshooting tips and procedures.
Common Troubleshooting Commands
The following table lists some helpful commands for general troubleshooting.
Command Description
ics_version Prints ICS version information to the screen.
drbd-overview Prints DRBD status information to the screen Alternate form: service
drbd status.
crm_mon [-f] Opens the Pacemaker cluster resource manager.
The -f option displays the failover count for all services under
management by Pacemaker.
crm Launches the Pacemaker cluster resource manager.
crm command mode
crm
Once in the cluster resource monitor shell, tab twice for a list of
options at each level (including help).
gluster Queries GlusterFS peers. e.g.
gluster peer [command]
gluster peer probe
Page 77

Common Troubleshooting Commands
Command Description
cluster [rsc-start | rcs-cleanup] Various cluster troubleshooting functions, found in the following
directory (version 1.5+):
/opt/avid/cluster/
To start all services on a cluster:
cluster rcs-start
To clean up resource errors found in crm_mon:
cluster rcs-cleanup
acs-query Tests the RabbitMQ message bus.
corosync-cfgtool -s Returns the IP and other stats for the machine on which you issue the
command:
corosync-cfgtool -s
corosync-objctl |grep member Returns the IP addresses of all nodes in the cluster:
corosync-objctl |grep member
avid-db dumpall Backs up the ICS database
system-backup [-b | -r] Backs up the system settings and ICS database (useful before an
upgrade:
system-backup.sh -b
Restores from the backup:
system-backup.sh -r
avid-interplay-central
[start |stop | restart| status]
Starts, stops and returns the status of the Avid Interplay Central
service, e.g.:
service avid-interplay-central status
acs-ctrl-core
[ start |stop | restart| status ]
acs-ctrl-message
[ start |stop | restart| status ]
Starts stops and returns the status of ACS bus service, e.g.:
service acs-ctrl-core status
Starts, stops and returns the status of ACS messaging service, e.g.:
acs-ctrl-message status
77
Page 78

Troubleshooting DRBD
Recall that DRBD runs on the master and slave nodes only, and is responsible for mirroring the
contents of a partition between master and slave. The partition it mirrors is used by ICS to store
the ICS database and the datbase used by MongoDB, For details, see
Replication” on page 21
This section presents common DRBD problems and solutions. Typical problems in DRBD
include:
• A lack of primary-secondary connectivity
• The secondary operating in standalone mode
• Both nodes reporting connectivity but neither one in the role of master.
• Both nodes reporting themselves in the role of master
The following examples show how to recognize the problems described above.
Master Node: WFConnection
.
Troubleshooting DRBD
“DRBD and Database
1:r0/0 WFConnection Primary/Unknown UpToDate/DUnknown C r----- /mnt/drbd
ext4 20G 397M 18G 3%
Summary: The DRBD master node cannot connect to the DRBD slave node:
Details:
WFConnection
Primary/Unknown
UpToDate/DUnknown
Action Required: Make the connection manually. Refer to the instructions in
Connecting the DRBD Slave to the Master” on page 81
If the master node reports WFConnection while the slave node reports StandAlone — it indicates
n
a DRBD split brain. See “Correcting a DRBD Split Brain” on page 82.
The master node is waiting for a connection from the slave node (i.e. the slave
node cannot be found on the network).
This node is the master, but the slave node cannot be reached.
The database on the master is up to date, but the state of the database on the
slave node is not known.
“Manually
.
78
Page 79

Troubleshooting DRBD
Slave Node: Standalone
1:r0/0 StandAlone Secondary/Unknown UpToDate/DUnknown r-----
Summary: The slave cannot connect to the master.
Details:
StandAlone
Secondary/Unknown
UpToDate/DUnknown
Action Required: Make the connection manually. Refer to the instructions in
Connecting the DRBD Slave to the Master” on page 81
If the master node reports WFConnection while the slave node reports StandAlone — it indicates
n
a DRBD split brain. See “Correcting a DRBD Split Brain” on page 82.
Both Nodes: Secondary/Secondary
1:r0/0 Connected Secondary/Secondary UpToDate/UpToDate C r-----
The slave node is operating in on its own. (StandAlone)
The slave node is the secondary, but the primary cannot be found
(Secondary/Unknown)
The database on the slave node is up to date, but the state of the one on the
master is unknown (UpToDate/DUnknown)
“Manually
.
Summary: The nodes are connected, but neither is master.
Details:
Connected
A connection is established.
Secondary/Secondary
UpToDate/Unknown
Both nodes are operating as the slave node. That is, each is acting as the peer
that receives updates.
The database on the master is up to date, but the state of the database on the
slave node is not known.
Action needed: This usually indicates a failure within the Pacemaker PostgreSQL resource
group. For example, if Pacemaker cannot mount the DRBD device as a filesystem, DRBD will
start successfully, but writing data to disk and database replication cannot take place.
79
Page 80

Troubleshooting DRBD
To investigate the issue further:
1. Use the Pacemaker Cluster Resource Manager to verify if all services are running.
crm_mon -f
For details, see “Verifying Cluster Configuration” on page 46.
2. Reset fail counts.
For details, see
“Resetting Fail Counts” on page 62.
3. Restart failed Pacemaker resources or the underlying Linux services.
For details, see:
“Interacting with Services” on page 32
-
- “Interacting with Resources” on page 33
4. If all services in the PostgreSQL resource group are operating as expected, the problem may
lie at a deeper level of the Linux operating system.
For details, see
“Working with Cluster Logs” on page 37.
Solving this issue can be complex. If the above suggestions do not resolve the problem,
consult your Avid representative for further troubleshooting.
Both Nodes: Standalone and Primary
1:r0/0 StandAlone Primary/Unknown UpToDate/DUnknown C r----- /mnt/drbd ext4
20G 397M 18G 3%
1:r0/0 StandAlone Primary/Unknown UpToDate/DUnknown C r-----
Summary: A DRBD “split brain” has occurred. Both nodes are operating independently,
reporting themselves as the master node, and claiming their database is up to date.
StandAlone
Primary/Unknown
UpToDate/Unknown
The master node is waiting for a connection from the slave node (i.e. the slave
node cannot be found on the network).
This node is the master, but the slave node cananot be reached.
The key indicator of this type of DRBD split brain is both nodes reporting
n
themselves as the Primary.
The database on the master is up to date, but the state of the database on the
slave node is not known.
Action Needed: Discard the data on the slave node and reconnect it to the DRBD resource on the
master node. Refer to the instructions in DRBD
80
“Correcting a DRBD Split Brain” on page 82.
Page 81

Manually Connecting the DRBD Slave to the Master
Manually Connecting the DRBD Slave to the Master
When the master and slave nodes are not connecting automatically, you will have to make the
connection manually. You do so by telling the slave node to connect to the resource owned by the
master.
To manually connect the DRBD slave to the master:
1. Log in to any node in the cluster as root and start the Pacemaker Cluster Resource Monitor
utility:
crm_mon
2. To identify the slave, look for the line containing “Master/Slave Set”.
For example:
Master/Slave Set: ms_drbd_postgres [drbd_postgres]
Masters: [ icps-mam-large ]
Slaves: [ icps-mam-med ]
The sample output above identifies the slave as icps-mam-med.
For details on identifying the slave node, see
Load-Balancing Nodes” on page 58
.
“Identifying the Master, Slave, and
3. On the slave run the following command
drbdadm connect r0
4. Verify the reconnection was successful:
drbd-overview
5. The output on the master node should resemble the following:
1:r0/0 Connected Primary/Secondary UpToDate/UpToDate C r----- /mnt/drbd
ext4 20G 397M 18G 3%
6. The output on the slave node should resemble the following:
1:r0/0 Connected Secondary/Primary UpToDate/UpToDate C r-----
81
Page 82

Correcting a DRBD Split Brain
A DRBD split brain describes the situation in which both DRBD nodes are operating completely
independently. Further, there is no connection between them, hence data replication is not taking
place. A DRBD split brain must be remedied as soon as possible, since each node is updating its
own database, but, since database synchronization is not taking place, data can easily be lost.
To recover from a split brain, you must force the ICS master node to take on the role of DRBD
master node too. You then discard the database associated with the DRBD slave node, and
reconnect it to the established master.
Discarding the database on the slave node does not result in a full re-synchronization from
n
master to slave. The slave node has its local modifications rolled back, and modifications made
to the master are propagated to the slave.
To recover from a DRBD split brain:
1. Log in to any node in the cluster as root and start the Pacemaker Cluster Resource Monitor
utility:
crm_mon
Correcting a DRBD Split Brain
2. Identify the master node.
In the output that appears, the cluster IP address (AvidClusterIP). This is the master node.
For details on identifying the master node, see
Load-Balancing Nodes” on page 58
3. On the master run the following command:
drbdadm connect r0
This ensures the master node is connected to the r0 resource. This is the DRBD resource
holding the databases, and was given the name r0 when you installed ICS.
4. On the slave run the following command
drbdadm connect --discard-my-data r0
After issuing the above command, you may receive the following error message on the slave
node:
Failure: (102) Local address (port) already in use.
The above error is due to the Linux kernel retaining an active connection to the r0 resource.
If that is the case, explicitly disconnect the slave node from the resource using the following
command, then try Step 4 again:
drbdadm disconnect r0
.
82
“Identifying the Master, Slave, and
Page 83

Correcting a DRBD Split Brain
5. Verify the recovery was successful:
drbd-overview
6. The output on the master node should resemble the following:
1:r0/0 Connected Primary/Secondary UpToDate/UpToDate C r----- /mnt/drbd
ext4 20G 397M 18G 3%
7. The output on the slave node should resemble the following:
1:r0/0 Connected Secondary/Primary UpToDate/UpToDate C r-----
83
Page 84

7 Frequently Asked Questions
What triggers a failover?
If a service fails once, it is immediately restarted on the server and its fail-count is set to one. No
email is sent in this case. A second failure of the same service results in a failover from master to
slave, and the sending out of an automated email.
What impact does a failover have upon users?
Most service failures result in an immediate service restart on the same node in the cluster. In
such cases, users generally do not notice the failure. At worst, their attempts to interact with the
service in question may return errors for a few seconds but full functionality is quickly restored
with no data loss.
If a service fails for a second time on a node and forces the removal of that node from the cluster,
users will be impacted by a system that returns errors until the new master node takes over. This
can take 20-30 seconds, and if a user loses patience and leaves the page or closes the browser
they will lose unsaved changes.
How important are failovers?
In most cases service failures are benign, and the automated restart is sufficient. You may want to
monitor cluster status regularly. If services on some nodes are occasionally reporting a fail-count
of 1, take some initiative to verify that server hardware is OK, and that disk space is not
compromised. You can even look at the time of the failure and retrieve logs.
However, a node may have failed because of a lack of disk space or a hardware failure, in which
cases it should only be added back to the cluster only after it has been repaired.
Do I need to investigate every time I see a fail count?
No. Most service failures are due to software issues, and in this case services reliably restart or
failover to another node in the cluster. If the fail count appears to be the result of a benign service
failure (or a pure software failure), simply reset the service's failure-count. That way if it fails
again it will restart without triggering a failover.
The most seamless recovery is a service restart on the same node, so we strongly encourage
administrators to monitor their cluster regularly for a fail-counts. Following confirmation that the
server is OK (from a hardware perspective), simply reset the fail-count.
Page 85

A failover has taken place, but now some (or all) connections are lost, the UI is
unresponsive, and logging in is not possible. What can be done?
This is a problem that can have numerous different causes. The following table offers some
explanations and recovery steps.
Possible Cause Recovery Steps
Master node unexpectedly but properly reboots,
triggers failover, but services do not start properly.
Temporary power loss to master node triggers
failover, but services do not start properly
Network failure (cable disconnected/severed, or
other general network failure).
System disk drive is full. Stop the cluster, investigate the system disk and
Stop the cluster, reboot nodes, reset fail-count for
all services, restart cluster.
Stop the cluster, power down all nodes. Consult
network administrator to repair network. Reboot
nodes, reset fail-count for all services, restart
cluster.
remove files to make space, reboot nodes, reset
fail-count for all services, restart cluster.
85
 Loading...