

Installation and User Guide
TM
10Spec
10 Degree Specular Reflectance
Accessory

The information in this publication is provided for reference only. All
information contained in this publication is believed to be correct and
complete. PIKE Technologies, Inc. shall not be liable for errors contained herein
nor for incidental or consequential damages in connection with the furnishing,
performance, or use of this material. All product specifications, as well as the
information contained in this publication, are subject to change without notice.
This publication may contain or reference information and products protected
by copyrights or patents and does not convey any license under the patent
rights of PIKE Technologies, Inc. nor the rights of others. PIKE Technologies, Inc.
does not assume any liability arising out of any infringements of patents or
other rights of third parties.
This document contains confidential or proprietary information of PIKE
Technologies, Inc. Neither this document nor the information herein is to be
reproduced, distributed, used or disclosed, either in whole or in part, except as
specifically authorized by PIKE Technologies, Inc.
PIKE Technologies, Inc. makes no warranty of any kind with regard to this
material including, but not limited to, the implied warranties of merchantability
and fitness for a particular purpose.
Copyright 1991-2018 by PIKE Technologies, Inc., Madison, WI 53719. Printed in
the United States of America. All world rights reserved. No part of this
publication may be stored in a retrieval system, transmitted, or reproduced in
any way, including but not limited to, photocopy, photograph, magnetic or
other record, without the prior written permission of PIKE Technologies, Inc.
Address Comments to:
PIKE Technologies, Inc.
6125 Cottonwood Drive
Madison, WI 53719
Phone (608) 274-2721
Fax (608) 274-0103
E-mail info@piketech.com
Web Site www.piketech.com
Jan. 1, 2018
PN 350-010000-05

Introduction
1
Optical Diagram
1
Unpacking Your Accessory
2
Packing List
2
Installation
3
Accessory Installation
3
Accessory Alignment
3
Performance Verification
5
Using Your 10Spec Accessory
5
Reflectance Spectra and Applications
6
Free Standing Films
6
Effect of Dispersion
7
Kramers-Kronig Transform
8
Precautions
9
Maintenance Parts
9
Contents
PN 350-010000-05
Introduction
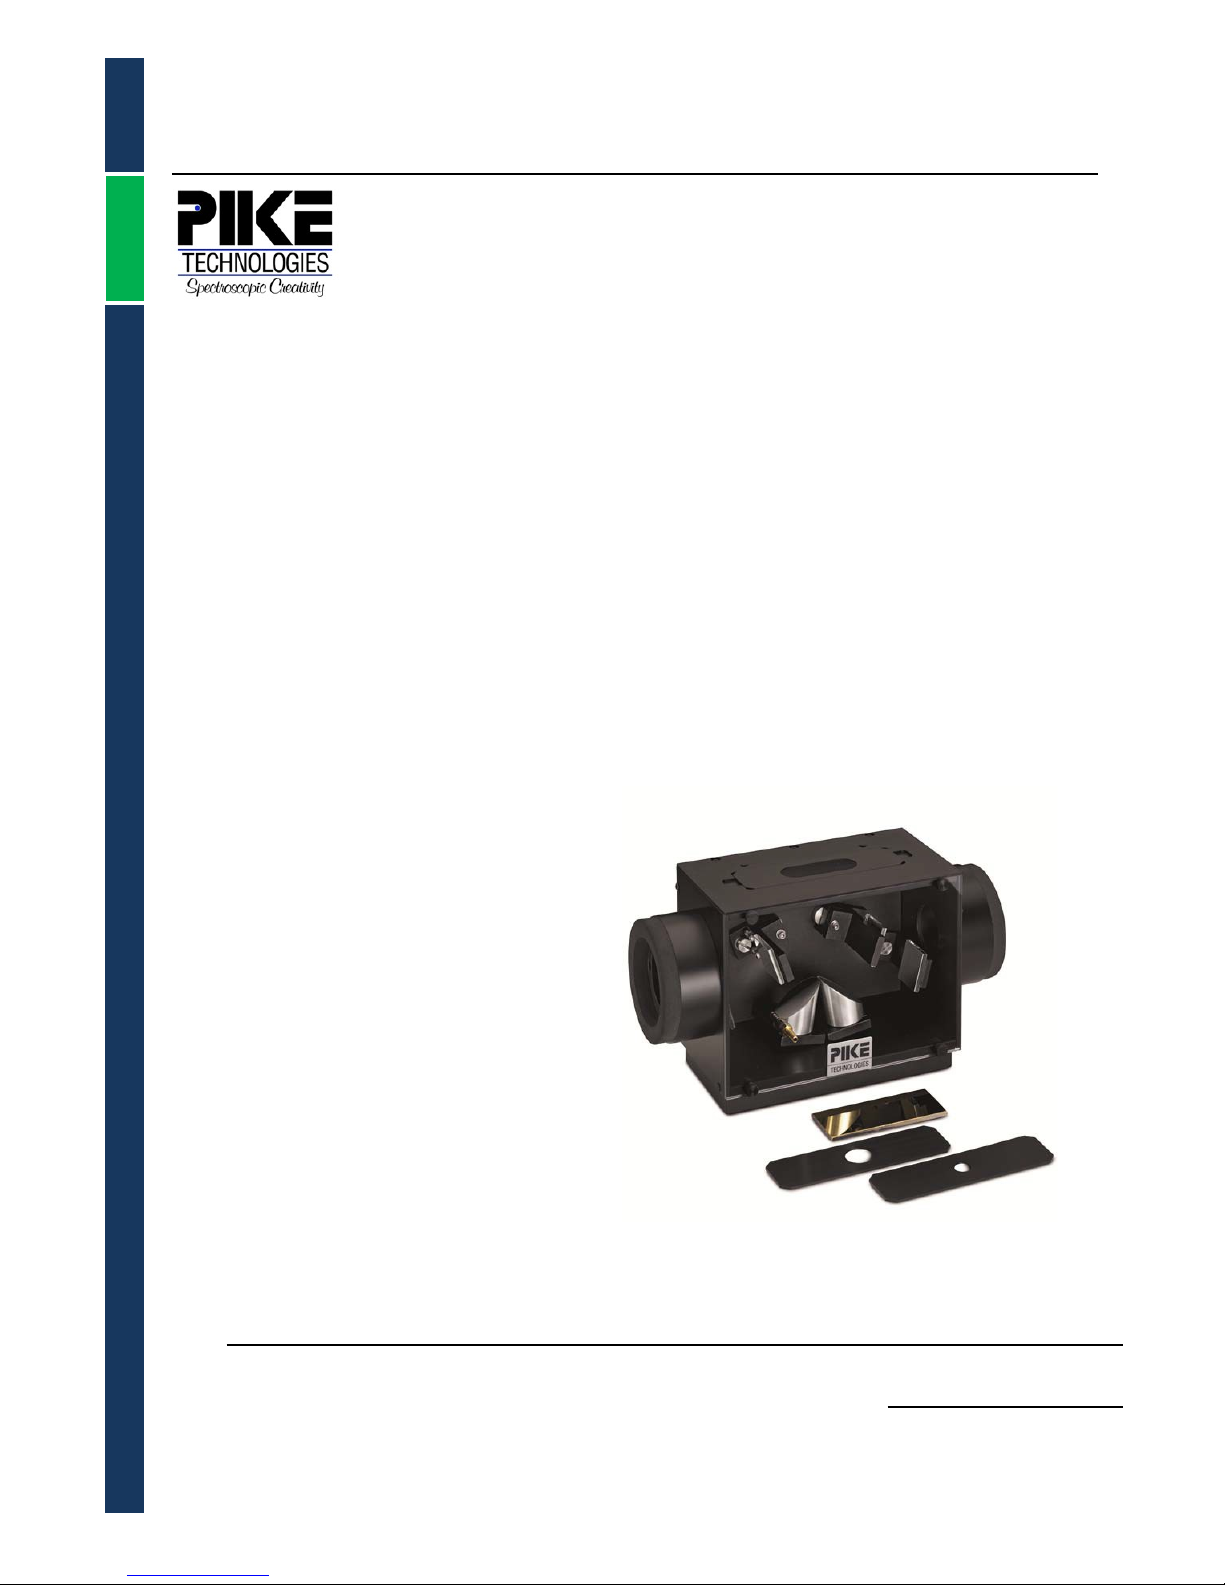
The 10Spec features a collimated beam that strikes the sample at a 10° angle of incidence. The size of
the collimated beam at the sample is approximately 12 mm. The accessory may be used to measure the
reflectivity of glass per ASTM Standard E1585-93 and other specular reflectance experiments. The
10Spec is well suited for specular reflectance measurements of polymers, reflectivity studies of polished
metals and transmission-reflectance work.
Figure 1: Optical diagram of 10Spec Accessory
PN 350-010000-05 Page | 1

10Spec Manual
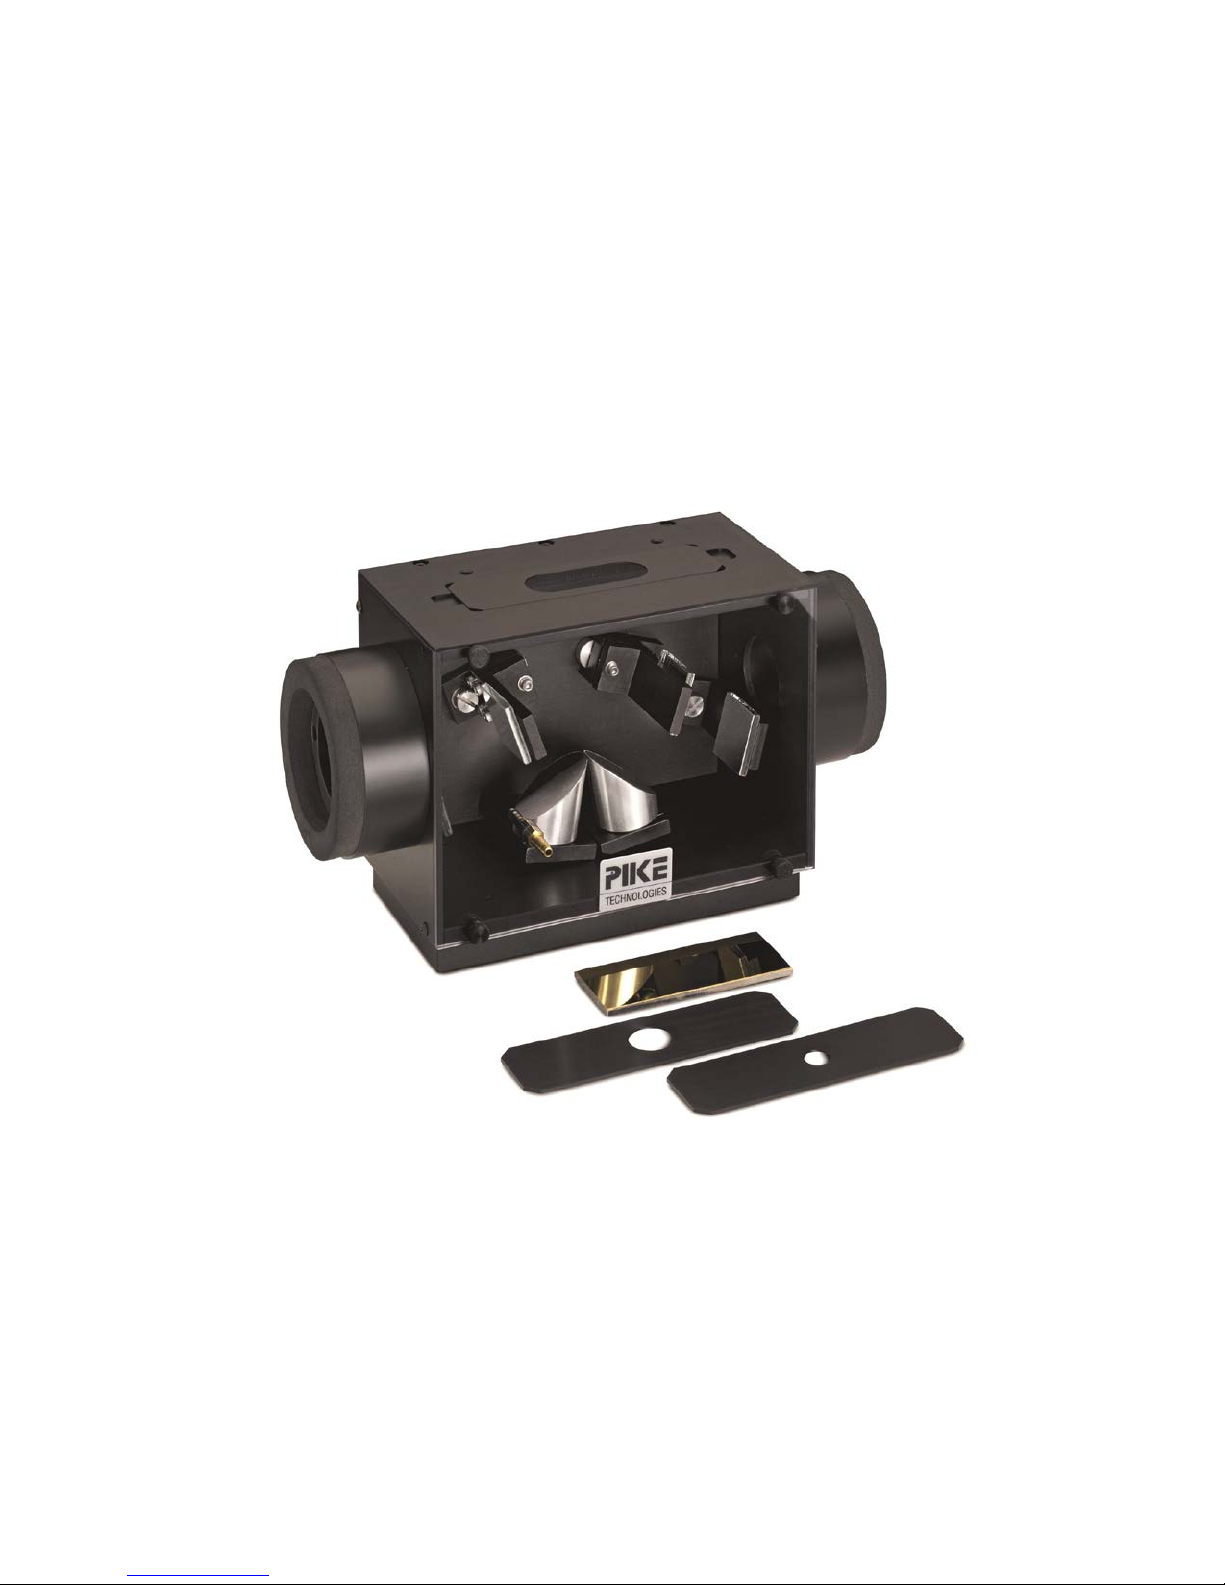
10Spec Accessory
Sample Masks (3/8”, 5/8”, 2”)
PN 350-010000
PN 010-10XX
PN 010-3010
Quantity 1
Quantity 1
Quantity 1 Set
Gold Substrate Alignment Mirror
Hex Wrench Set
PN 300-0002
Quantity 1
Quantity 1
Unpacking Your Accessory
In order for you to quickly verify receipt of your accessory, we have included a packing list. Please
inspect the package carefully.
Packing List
PN 350-010000-05 Page | 2

Installation
The 10Spec accessory has been aligned and tested in the PIKE Technologies facility on the make of your
FTIR spectrometer to ensure that it performs to specifications. However, some variation in optical
alignment can occur from spectrometer to spectrometer. To allow for this difference, there are
alignment screws located within the 10Spec assembly for fine-tuning once the accessory is installed in
the spectrometer.
Accessory Installation
1. Set your FTIR spectrometer to collect data at 4 cm-1 spectral resolution (including the FTIR J-stop).
2. The 10Spec accessory fits into the sample compartment of the FTIR spectrometer. Your 10Spec is
provided with the appropriate sample compartment baseplate for the model FTIR instrument you
specified. Before inserting the accessory in the sample compartment, ensure that your
spectrometer is aligned. If the instrument is not aligned, maximize the interferogram signal (the IR
energy throughput) of your FTIR spectrometer. This should be performed by following the
manufacturer’s instructions.
3. Fasten the accessory directly into the FTIR sample compartment or onto the FTIR sample
compartment baseplate. In order to locate the accessory in the correct position, simply place the
entire accessory into the FTIR sample compartment with the 10Spec label facing the front and line
up the baseplate provided with the holes/pins in your model FTIR spectrometer.
4. Tighten the mounting screws to firmly position the accessory baseplate onto the FTIR sample
compartment baseplate.
Accessory Alignment
The 10Spec accessory may not require any alignment when installed - see page 5 for minimum energy
throughput values. However, should you choose to fine-tune the accessory, follow these steps:
1. Place the 10Spec into the sample compartment. Using the large mask (2 inch), place the gold mirror
over the mask opening (sample position).
2. Remove the front panel of the 10Spec by removing thumb screws.
3. Display the live interferogram of the FTIR spectrometer and adjust the output (detector) side tilt
mirror. The location of this mirror is shown in Figure 2 (page 4). Turn the individual screws clockwise
PN 350-010000-05 Page | 3

and check the energy signal. If it increases, continue until the maximum signal is obtained. If it
decreases, turn the screw counterclockwise to get the highest possible reading.
4. Next adjust the rotation output (detector) again while maximizing the energy shown on the live
interferogram. The rotation output mirror is accessed from the back of the accessory (Figure 3).
5. Adjust the input tilt mirror located on the inside of the accessory while maximizing the energy
shown on the live interferogram.
6. Next adjust the rotation output (detector) again while maximizing the energy shown on the live
interferogram. The rotation output mirror is accessed from the back of the accessory.
7. Repeat the entire procedure two to three times to fine-tune the accessory. This is an initial
alignment procedure which optimizes the 10Spec
to work with an individual optical bench. Once
completed, the alignment does not have to be repeated unless the accessory adjustments have
been moved or it has been placed in a different FTIR instrument. You are now ready to verify the
10Spec optical throughput performance.
Figure 2: Tilt Mirror Adjustment Figure 3: Rotation Mirror Adjustment
For right to left spectrometer beam path the output (detector) mirror is located on the left side of the
accessory and the input is located on the right. For left to right spectrometers beam path, the output
(detector) mirror is located on the right side of the accessory and the input is located on the left side.
PN 350-010000-05 Page | 4

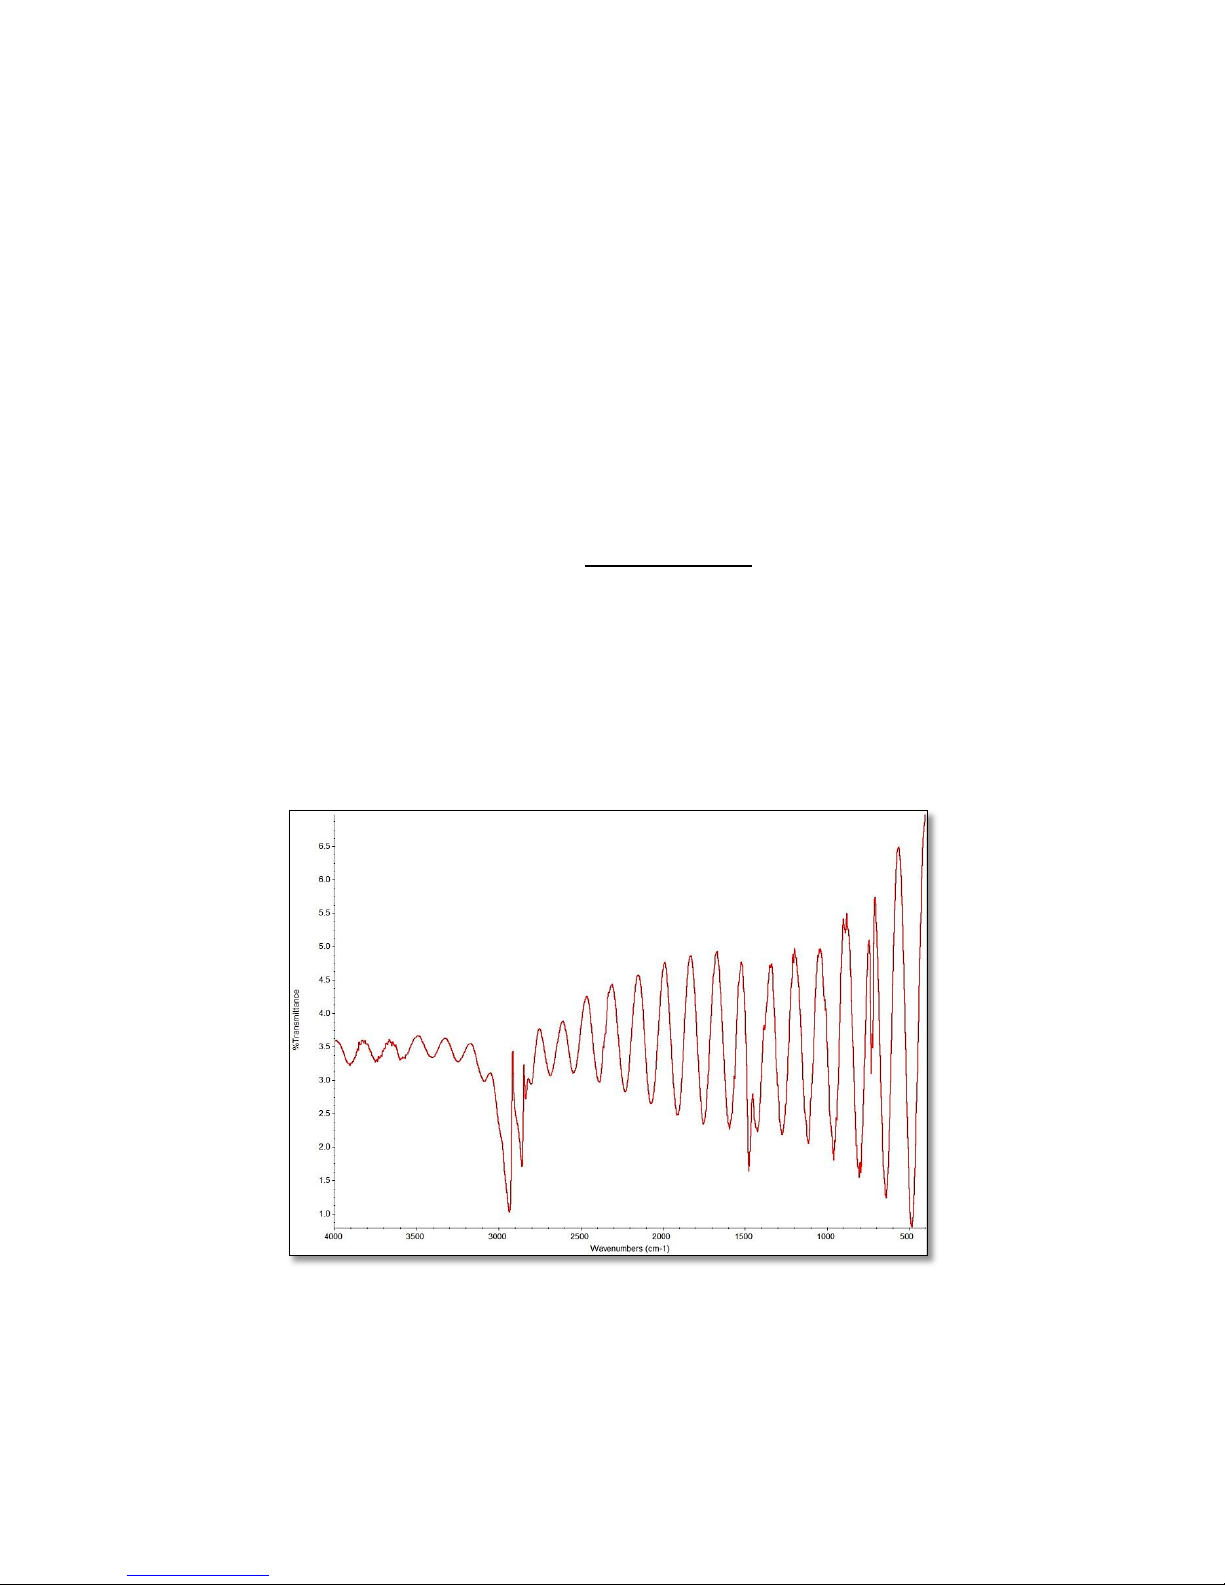
Performance Verification
With the accessory removed from the sample compartment, collect a background spectrum. Place the
10Spec accessory in the sample compartment with the alignment mirror face down on the top surface
of the accessory. Collect a transmission spectrum using the same collection parameters as used to
collect the background spectrum.
The minimum transmission of the accessory should be at least 15% at 1000 cm
not meet this minimum value, contact PIKE Technologies. Please have ready the serial number of your
accessory (found on rear of accessory).
-1
. If your accessory does
Figure 4. Typical 10Spec energy throughput spectrum.
Using Your 10Spec Accessory
In order to collect a spectrum with your 10Spec accessory perform the following steps:
1. Place the alignment mirror face down on the top surface of the accessory.
2. Collect a background spectrum.
3. Remove the alignment mirror and place your sample face down on the top of the accessory.
4. Collect a sample spectrum.
PN 350-010000-05 Page | 5
10,000 (m)
Thickness (µ) =
Reflectance Spectra and Applications
Reflectance spectroscopy is useful for the measurement of films on metallic substrates, the thickness of
free standing transmitting films and for the characterization of samples which do not transmit IR
radiation and so cannot be measured by other techniques.
Free Standing Films
Free standing films exhibit a fringe pattern in the collected spectrum due to constructive and destructive
interference caused by reflection from both sides of the thin film. Measurement of the period of the
fringes will give the thickness of the film as long as the refractive index is known. For an angle of
incidence and a refractive index n, the equation governing this measurement is:
Δ · 2 · (n2-sin2 θ)
where m is the number of fringes counted, Δ is the wavelength difference between the first and last
fringe (cm
-1
), and θ is the angle of incidence. This interference fringe effect can create problems when
measuring thin film samples. The interference fringes can hide spectral features and cause quantitation
problems since the fringe position and spacing is sensitive to the thickness of the sample. Note the low
level of the spectrum, since only a small percentage of the infrared energy is reflected from the sample.
1/2
Figure 5: Reflectance fringe pattern of polyethylene film
PN 350-010000-05 Page | 6

The spectrum below is a reflection-absorption spectrum of the plastic film. The sample is placed on the
Refractive Index n1
Sample,
(n1 – n2)
2
(n1 + n2)2
Figure 6: R-A spectrum of polyethylene film
accessory and a mirror is placed on top of the sample. The spectrum shows no sign of interference
fringes. The band shapes are correct and have twice the absorption of the transmission case, consistent
with the double passage of the infrared beam through the sample. The technique of using a mirror
behind the sample works well as long as the sample is smooth, flat and non-scattering.
Effect of Dispersion
The spectra of many samples are distorted by anomalous dispersion in the sample. The reflectivity of
a sample is dependent upon the refractive index of the sample and is governed by the Fresnel
equations. For light hitting a sample at normal incidence, the reflection at the sample is given by the
following equation:
For example, the amount of reflection at the first glass surface is equal to R= (0.5/2.5)
passing through a pane of glass, which has a refractive index of about 1.5.
R=
Refractive Index n2
2
= 4% for light
PN 350-010000-05 Page | 7

Absorption Absorption Wavelength
Band Band
In the vicinity of an absorption band the refractive index varies considerably, an effect known as
anomalous dispersion. So a reflection spectrum is formed because the refractive index changes around
an absorption band.
Refractive Index
Figure 7: Spectrum exhibiting anomalous dispersion
Kramers-Kronig Transform
In order to produce a spectrum that is corrected for this anomalous dispersion, a correction known as a
Kramers-Kronig transformation may be performed on the spectrum. This transformation attempts to
produce a spectrum that does not contain any derivative peak shapes. The raw data and the result of a
Kramers-Kronig transform are shown below.
Figure 8: Reflectance spectrum of Poly (Methyl Methacrylate)
PN 350-010000-05 Page | 8

Figure 9: KKT absorption spectrum of Poly (Methyl Methacrylate)
The above curve is generated using the double FFT algorithm. Note that Kramers-Kronig transforms are
approximations and the resulting spectra should be used with caution when attempting quantitation.
The transform should only be performed on spectra that show derivative peaks. If a Kramers-Kronig
transform is performed on a spectrum with non-derivative peaks, the results may be erroneous.
Precautions
In order to provide the maximum transmission in the infrared, with the minimum spectral interferences,
the mirrors used in this device are uncoated (bare) aluminum on a glass substrate. Since the coatings are
soft, care must be taken to avoid damage. Normally, these mirrors will not need cleaning, since they are
contained within the housing of the accessory. If they do need cleaning, they may be gently wiped with
a lint-free, abrasive-free cloth, such as lens tissue, or with a camel hair brush. Under no circumstances
must the mirrors be rubbed with paper products such as “Kleenex” since this will produce scratching of
the mirror coating.
Maintenance Parts
The following parts may be ordered separately:
Description Part Number
10Spec Alignment Mirror 300-0002
10Spec Sample Mask Set 010-3010
PN 350-010000-05 Page | 9

6125 Cottonwood Drive · Madison, WI 53719-5120 · (608) 274-2721 (TEL) · (608) 274-0103 (FAX)
info@piketech.com · www.piketech.com
 Loading...