

Page 1

TRL calibration for SMT devices
using the PicoVNA 108
AR548-1
© Pico Technology 2021
1/12
Nils Nazoa
1. Introduction
The TRL (Thru-Reflect-Line) calibration technique (1) was originally developed as a way of
enhancing calibration accuracy in coaxial lines. The improvement is based on the fact that
the impedance reference is a coaxial air line, which can be manufactured very accurately
to provide a precise known impedance. The other calibration Standards required are a
zero-length through (very simple to implement) and a pair of high-reflection mismatches.
The latter do not need to be known accurately but need to provide the same value of
reflection.
The air line reference is required to provide a phase shift of significantly greater than 0º
and significantly less than 180º. This gives rise to the key difficulty with TRL. At lower
frequencies (i.e. longer wavelengths) it is not possible to obtain air lines that are long
enough to provide sufficient phase shift. In addition, the characteristic impedance of the
line becomes appreciably complex and frequency-dependent, due to skin depth effects.
In general, these problems start to become significant below approximately 1 GHz so the
easiest solution is to restrict the TRL technique to frequencies above 2 GHz, say.
TRL calibration lends itself well to characterizing surface mount devices. The air line is
replaced with a microstrip line whose characteristic impedance can be controlled and also
reasonably well measured at microwave frequencies. The Reflect Standards can be either
open circuits or short circuits, both easily implemented in surface mount technology.
2. TRL on a printed circuit board
As mentioned already, the TRL technique is well suited for implementing on a surface
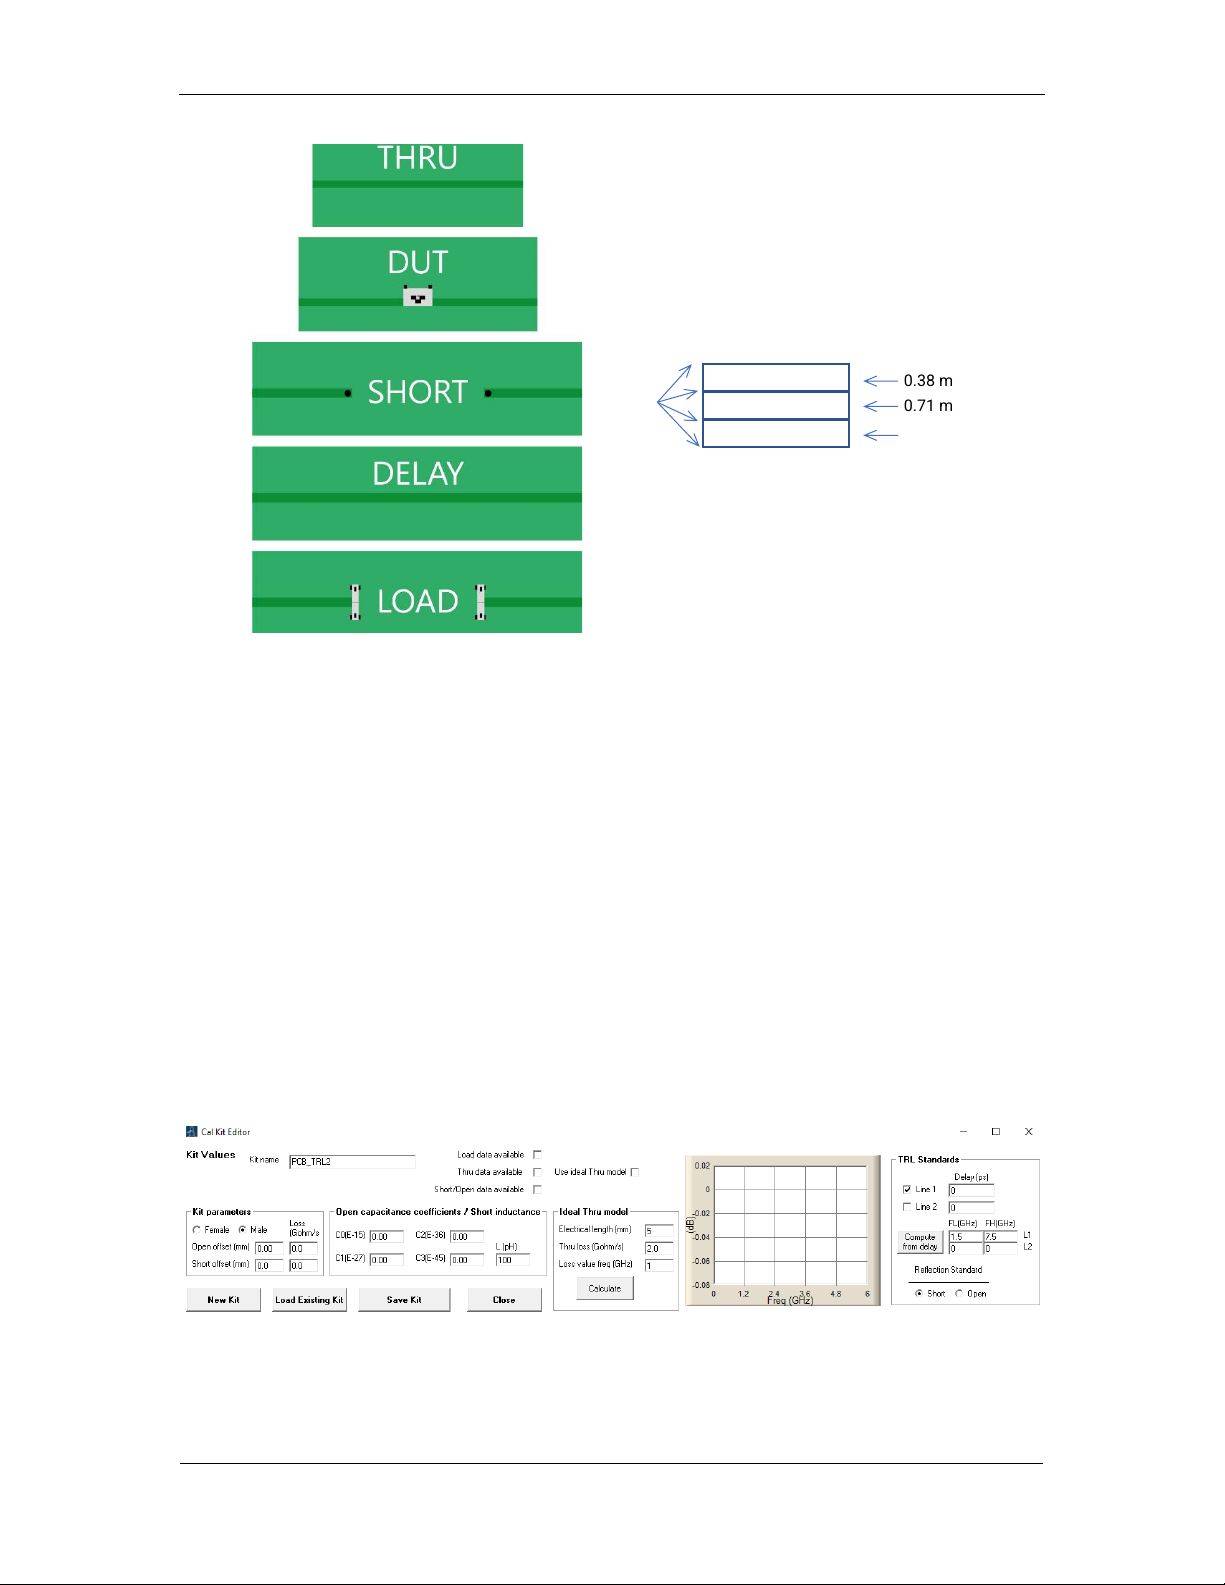
mount printed circuit board. The Standards are easy to define and implement. Fig. 1
shows the various components required, laid out on PCB. There are four 2-port circuit
blocks.
• Through line
• Reflect Standards (Shorts)
• Reference line (Delay)
• DUT (device under test)
Connections to each of the circuit blocks is by means of edge connectors. These must all
be identical and with complete soldering underneath to provide the best grounding. The
microstrip length, L, is not significant. It is chosen to be a convenient length to handle and
populate the board with the edge connectors. The short circuits are simply via-holes to
the ground plane.
Page 2

TRL calibration for SMT devices using the PicoVNA 108
AR548-1
© Pico Technology 2021
2/12
As an aid to clarity, Fig.1 includes the equivalent connections for TRL using coaxial
components. It is instructive to note where the measurement plane(s) is for each of the
Standard measurements illustrated in Fig. 1. Note particularly that the ‘Through’ is zero
length and equivalent to the coaxial ‘insertable’ Through connection which is zero length
and zero loss. For all calibration and DUT measurement steps, the measurement plane of
each of the instrument’s ports is on the PCB and, for this technique to work well, it is
critically important that all L/2 sections illustrated in Fig. 1 are made identical and that the
L/2 sections lengths are precisely half the length L of the Through.
Reference line length
It is generally recommended that the line length, L, is selected to provide no less than
20º and no more than 160º of phase shift with respect to the thru length over the band of
operation. In practice, best results are achieved by restricting the range to around 30º to
150º.
The required reference line length can be calculated as follows.
∆𝐿=
∅
360
(
𝑐
𝑓√ε
eff
)
∅ = phase shift in degrees
f = frequency
c = speed of light
ε
eff
= effective dielectric constant
Further, as mentioned already, it is sensible to avoid lower microwave frequencies in order
to avoid skin depth effects. So, keeping to 1.5 or 2 GHz and above may be a good idea.
Page 3

TRL calibration for SMT devices using the PicoVNA 108
AR548-1
© Pico Technology 2021
3/12
Figure 1: PCB circuit blocks for TRL calibration and measurement
For example, assuming a nominal 50 Ω line with resulting effective dielectric constant of
3.35, to achieve 30º phase shift at, say, 1.5 GHz, we find that:
∆L = 9.1 mm
This reference line length of 9.1 mm would in turn provide 150º of phase shift at 7.5 GHz.
So, the useable bandwidth for this line, as a TRL line standard, is 1.5 GHz to 7.5 GHz.
Test PCB
A test board made to illustrate the operation of the TRL technique with the PicoVNA is
shown below in Fig. 2. This includes an additional DUT and a pair of matched loads.
These loads are used by the software to perform a TRM (Thru-Reflect-Match) calibration
at frequencies below the lowest frequency of the TRL calibration (set by the length of the
TRL reference line).
Zero length
Thru
Reflect
Length = L
L/2
L/2
Delay
∆L
DUT
L/2
L/2
Measurement
plane
Measurement
plane
Shorts
Shorts
Line
L/2
L/2
Delay line
DUT
DUT
(Measurement)
Basic TRL Calibration steps
(TRM Load step not shown)
TRL on PCB
Equivalent TRL setup using coaxial components
Note: The absolute value of L is not important.
However, all L/2 sections shown must be
identical and be exactly half the value of L.
Page 4
TRL calibration for SMT devices using the PicoVNA 108
AR548-1
© Pico Technology 2021
4/12
Figure 2: Test board for TRL calibration and measurement
Lower frequencies
The PicoVNA 108 automatically switches to TRM at frequencies below those supported
by the TRL reference line. The TRM technique relies on matched loads to set the reference
impedance. This approach works well since good matched loads can easily be
implemented at lower microwave frequencies (< 2 GHz). The frequency range of the TRL
reference line is set in the calibration kit definition and is described in the following
section.
TRL calibration kit
In order to perform a TRL calibration with the PicoVNA 108, a calibration kit file needs to
be created. This can be done very easily using the calibration kit editor (Tools > Calibration
kit > Cal Kit Editor).
Figure 3: Use the calibration kit editor to create the TRL cal kit file
0.38 mm dielectric
0.71 mm dielectric
0.38 mm dielectric
Example FR4 layer build-up
εr =4.6
Copper
layers
50 Ω microstrip line width = 0.67 mm
Page 5

TRL calibration for SMT devices using the PicoVNA 108
AR548-1
© Pico Technology 2021
5/12
TRL calibration kit – entering the reference line information
In our test board (Fig.2) there is only one reference line (‘Delay’) so we check just the box
next to ‘Line 1’ to indicate that the cal kit has only one reference line. The Line 2 box is left
unchecked as shown in Fig. 3.
Now, we can either enter the electrical delay in ps and click the button ‘Compute from
delay’ to set the frequency range of the line, or preferably, enter directly the frequency
range we wish to assign to the reference line. The low frequency is entered into the box
labelled ‘FL’ and the high frequency into the box ‘FH’. Both values are in GHz.
TRL calibration kit – entering the Reflect Standard information
The next step is to select whether the Reflect Standard is going to be a short or an open
circuit. Click on the appropriate radio button as required. Note that it is only necessary to
know approximately the value of the reflection coefficient of the Reflect Standard. So, in
the case of our test PCB, we will use short circuits implemented with vias to ground. For
this, we can enter 100 pH as an approximate value of the inductance into the box labelled
‘L (pH)’.
Finally, we enter the desired Kit name in the top left box and click on ‘Save Kit’ to save the
file to disk.
3. Performing the TRL/TRM calibration and measured results
Performing the TRL/TRM Calibration is simple. The first step is to load the TRL calibration
kit file created for the test PCB. This is done using the calibration kit form (Tools >
Calibration kit) which is shown below.
The cal kit files for the test PCB are loaded for both port 1 and port 2 by clicking on the
‘Load P1 kit’ and ‘Load P2 kit’ in turn. Thereafter, click on ‘Apply’ and close the form.
Page 6

TRL calibration for SMT devices using the PicoVNA 108
AR548-1
© Pico Technology 2021
6/12
Figure 4: Load the TRL calibration kit files for ports 1 and 2
Once the calibration kit files have been loaded, the sweep plan can be set (if needed)
and the calibration completed using the Calibration Form. See Fig. 5.
Once the Measurement is set to ‘Insertable DUT (TRL/TRM)’ proceed to connect to each
of the PCB calibration Standards (see Fig. 6) and then click on the corresponding button
on the Calibration form. So, for example, after connecting to the Short circuits, click on the
Reflect button on the form to measure these Standards.
Once all the Standards have been measured, click on the ‘Apply Cal’ button to complete
the calibration. The Calibration form will close and the DUT can then be connected and
measured.
Page 7

TRL calibration for SMT devices using the PicoVNA 108
AR548-1
© Pico Technology 2021
7/12
Figure 5: The calibration form is used to set the sweep plan and carry out the calibration
Figure 6: Connect to each Standard in turn to complete the calibration
Select TRL
Connect and click on
each Standard to
complete the calibration
Page 8
TRL calibration for SMT devices using the PicoVNA 108
AR548-1
© Pico Technology 2021
8/12
Example measurement results
DUT 1: Mini-Circuits BFCN-2700+ bandpass filter
The first DUT on the test PCB is a LTCC (Low Temperature Co-fired Ceramic) bandpass
filter manufactured by Mini-Circuits. This device has a nominal pass band 200 MHz wide
centred on 2.7 GHz.
Figure 7a shows the measured value of S21 compared to the data published by the
manufacturer. It can be seen that the measurement taken using the PicoVNA 108 is in
good agreement with the manufacturer’s data. It is not known how the manufacturer data
was taken but it does show some apparent measurement anomalies above 4 GHz. It is
interesting to see that the measurements from the PicoVNA 108 show somewhat lower
loss and deeper sidelobe responses.
Figure 7a: Bandpass filter (BFCN-2700+) S21 measurement
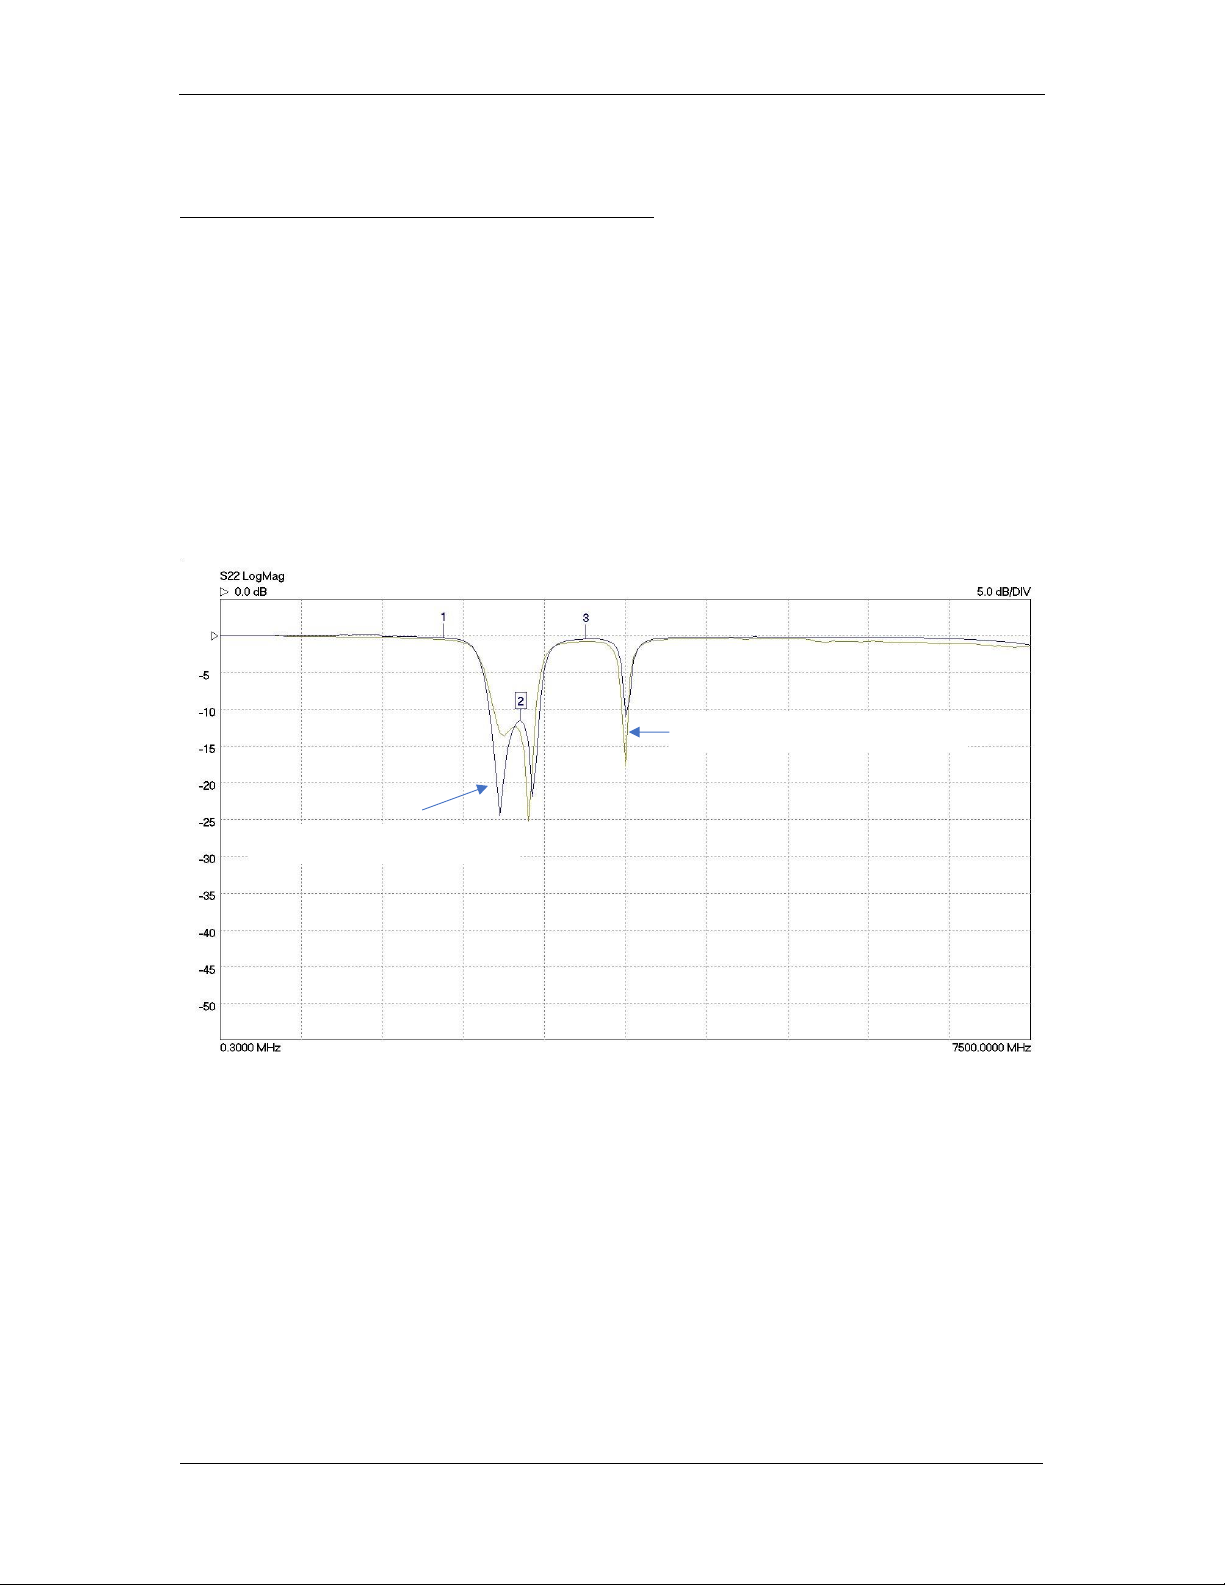
Figure 7b shows the measured value of S22 compared to the data published by the
manufacturer. As before there is general good agreement, including the presence of an
out-of-band resonance at about 3.8 GHz.
Manufacturers’ published data
LA19-13-04B Measurement
PicoVNA measurement
Manufacturer’s published data
Page 9

TRL calibration for SMT devices using the PicoVNA 108
AR548-1
© Pico Technology 2021
9/12
Figure 7b: Bandpass filter (BFCN-2700+) S22 measurement
Reference line impedance correction
It is very likely that using low-cost FR4 boards for this kind of evaluation leads to an error
in the characteristic impedance of the TRL reference line. This can be measured using the
TDR facility in the PicoVNA 108. The result, in terms of the line’s linear reflection
coefficient, is shown below in Fig. 8. Marker 2 indicates a value of Z0 of 52.2 Ω.
Figure 8: Reference line Z0 can be determined from the reflection coefficient, measured
using TDR
Manufacturer’s published data
LA19-13-04B measurement
Page 10

TRL calibration for SMT devices using the PicoVNA 108
AR548-1
© Pico Technology 2021
10/12
In order to be able to carry out a TDR measurement of the reference line, it is important to
bear in mind the available time resolution (or effective rise time) of the VNA TDR
measurement. This is equivalent to the inverse of the frequency span (stop frequency
minus the start frequency) used. By selecting the widest available span, we end up with a
time resolution value of around 118 ps. Therefore, it is sensible to ensure that the overall
length of the reference line, plus the interconnecting lines to the edge connectors,
amounts to at least 2.5 x 118 ps. This will allow an unambiguous TDR impedance
measurement to be made as shown in Fig. 8.
Once the impedance of the reference line has been determined as described, the value
can be entered in the Enhancement Set Up form as shown in Fig. 9. Once the value is
entered and the box next to the corresponding line is checked, all TRL measurements will
be corrected using impedance conversion back to the system impedance, typically 50 Ω.
Note that the correction will only be applied over the frequency range applicable to the line
selected.
Figure 9: TRL Measurement can be corrected using known Reference line Z0
Enter TRL Reference line Z0 value to
allow live correction of measurement
Page 11
TRL calibration for SMT devices using the PicoVNA 108
AR548-1
© Pico Technology 2021
11/12
Reference line impedance correction example
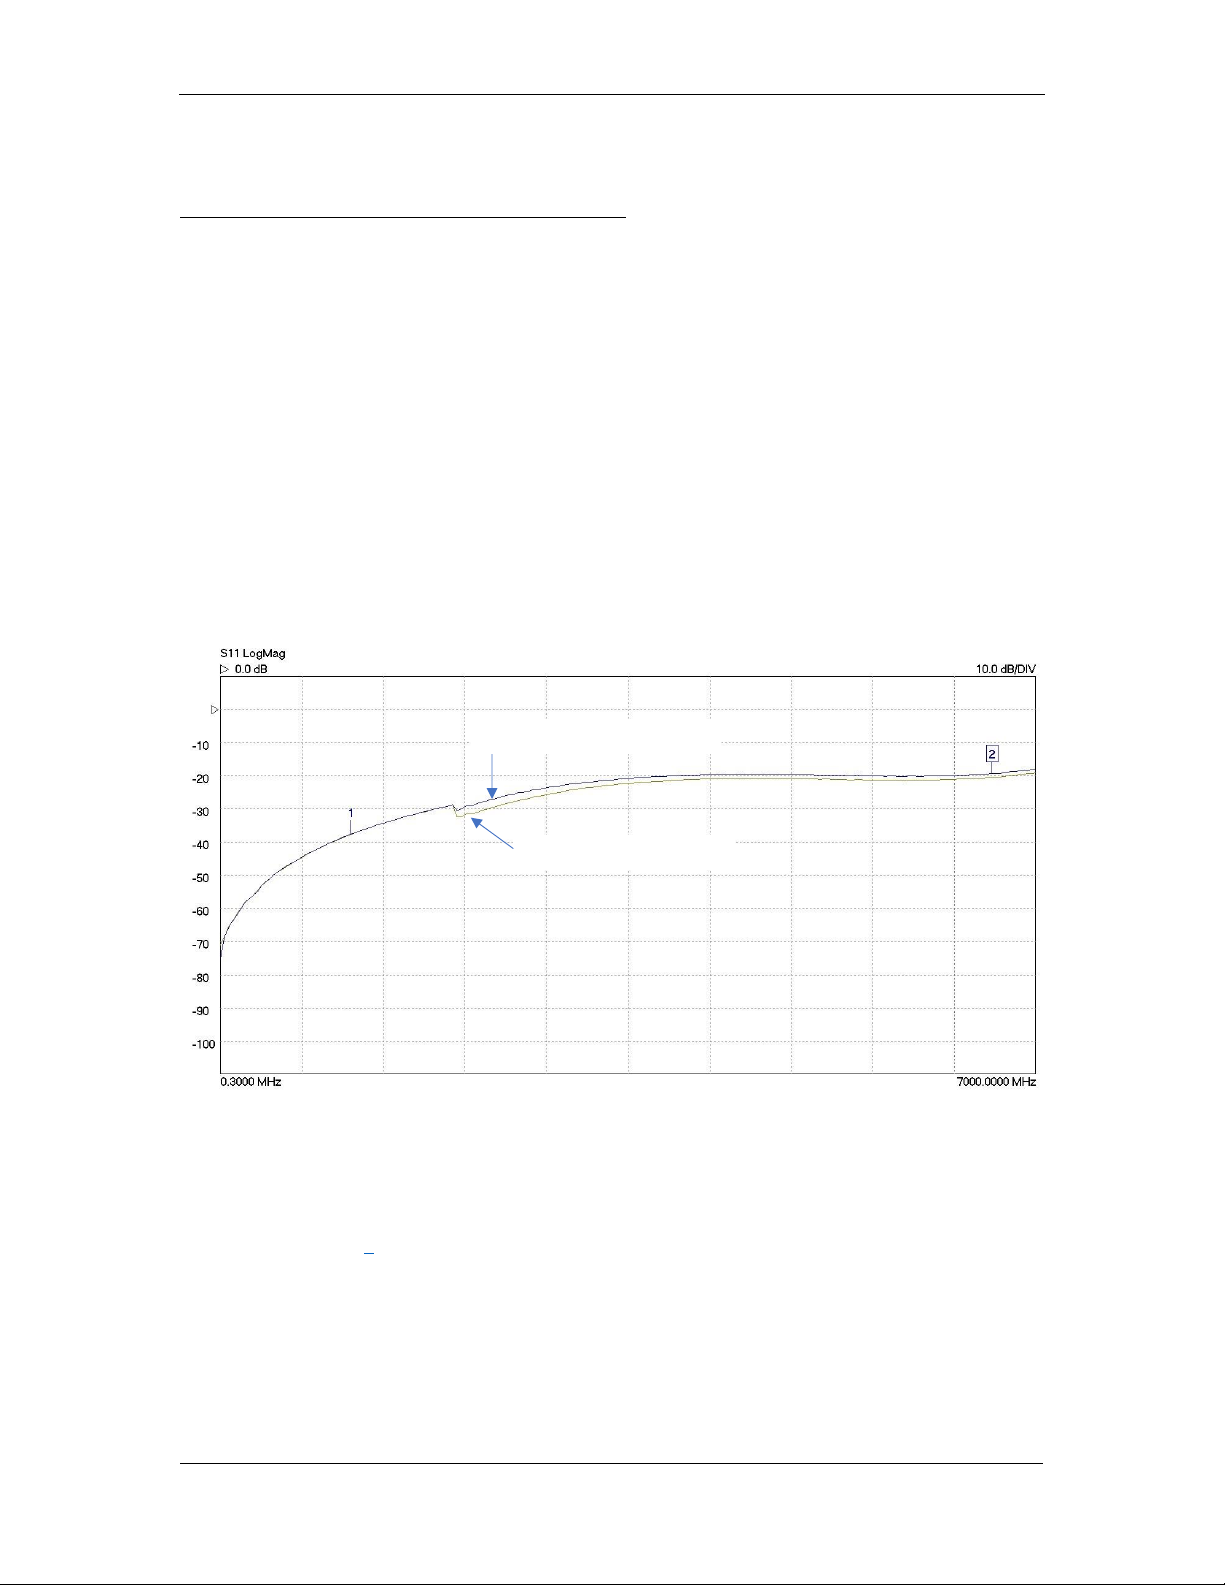
DUT2: Mini-Circuits 0805 6 dB chip attenuator
The second DUT on the test board (see Fig.2) is a 6 dB chip attenuator. It provides broadband performance from DC to beyond 7 GHz. Figs. 10a and 10b show the measured S11
and S21 of the attenuator.
The measured data show a step at 2 GHz. This is the frequency chosen where the
calibration switches between TRM and TRL. As a reminder, this frequency is set in the TRL
calibration kit file. In particular, it is the lowest frequency where the reference line is used
as a standard, which was chosen to be 2 GHz for this measurement.
The effect of applying the impedance correction is evident in Figs. 10a and 10b. In
particular, the reduction in the step size in S11 is clear to see. The residual error may be
likely to be associated with the imperfect 50 Ω loads used on the board for the TRM
calibration. Although a small error of around 1 dB it is nevertheless clearly evident.
Figure 10a: 0805 6 dB attenuator S11 measurement
It is worth commenting that reducing the transition frequency below 2 GHz to reduce the
error introduced by the 50 Ω loads in turn leads to other sources of errors, in particular
skin depth effects (2) that are likely to begin affecting the characteristic impedance
(making Z0 complex) of the microstrip reference line.
No impedance adjustment
52.2 Ω Impedance adjustment
Page 12

TRL calibration for SMT devices using the PicoVNA 108
AR548-1
© Pico Technology 2021
12/12
Figure 10b: 0805 6 dB attenuator S21 measurement
4. Conclusions
This application note has described how to use the TRL/TRM calibration technique
available on the PicoVNA 108 to characterize SMT components. In particular, it details
how a suitable test PCB can be designed and used to measure components over the
operating bandwidth of the VNA.
A way to reduce measurement errors arising from incorrect characteristic impedance of
the reference line has been described and details of two measurement examples have
been given.
Overall, the TRL/TRM feature on the PicoVNA 108 provides another useful option for
accurately characterizing SMT components on low-cost PCBs.
5. References
1. Engen, Glenn F. and Hoer, Cletus A. “Thru-Reflect-Line”: An Improved Technique for
Calibrating the Dual Six-Port Automatic Network Analyzer, IEEE Transactions Microwave
Theory and Techniques, Vol MTT-27, No.12, Dec 1979. New York, NY, USA : IEEE, 1979.
Electronic ISSN: 1557-9670.
2. Johnson, Howard W. and Graham, Martin. High-Speed Signal Propagation: Advanced
Black Magic. Hoboken, NJ, USA : Prentice Hall, 2005. ISBN 013084408X.
52.2 Ω Impedance adjustment
No impedance adjustment
 Loading...