

Page 1

PicoScope 6.0
PC Oscilloscope Software
User Guide
PSW044-2.0
Copyright 2006 Pico Technology Limited. All rights reserved.
Page 2

PicoScope 6 User GuideI
Table of Contents
1 Welcome
2 Version 6.0 update
3 Introduction
4 Using PicoScope for the first time
5 PicoScope and oscilloscope primer
.............................................................................................1
.............................................................................................2
.............................................................................................3
1 Legal statement
2 Contact information
3 How to use this manual
4 System requirements
...................................................................................................4
...................................................................................................5
...................................................................................................5
...................................................................................................5
.............................................................................................6
.............................................................................................7
1 Oscilloscope basics
2 PCO basics
3 PicoScope basics
4 Capture window
5 Custom probes
6 Frequency legend
7 Measurements table
8 Oversampling
9 Post-trigger arrow
10 Ruler legend
11 Scope view
12 Cursor position tool tip
13 Time rulers
14 Trigger marker
15 Signal rulers
16 Windows, views and viewports
...................................................................................................7
...................................................................................................8
...................................................................................................8
...................................................................................................9
...................................................................................................10
...................................................................................................10
...................................................................................................11
...................................................................................................12
...................................................................................................13
...................................................................................................13
...................................................................................................14
...................................................................................................14
...................................................................................................15
...................................................................................................16
...................................................................................................17
...................................................................................................18
6 Menus
7 Toolbars
PSW044-2.0
.............................................................................................19
1 File menu
2 Edit menu
3 Help menu
4 Measurements menu
5 Tools menu
6 Toolbar menu
7 Window menu
...................................................................................................20
...................................................................................................23
...................................................................................................24
...................................................................................................25
...................................................................................................27
...................................................................................................42
...................................................................................................43
.............................................................................................44
1 Buffer Navigation toolbar
2 Capture Windows toolbar
...................................................................................................45
...................................................................................................45
Copyright 2006 Pico Technology Limited. All rights reserved.
Page 3

Contents
II
8 How to...
9 Reference
3 Channel Setup toolbar
4 Customization dialog
5 Help toolbar
6 Measurements toolbar
7 Scope Setup toolbar
8 Signal Generator toolbar
9 Start / Stop toolbar
10 Triggering toolbar
11 Zooming and Scrolling toolbar
12 Demo Signals toolbar
...................................................................................................47
...................................................................................................48
...................................................................................................52
...................................................................................................52
...................................................................................................53
...................................................................................................54
...................................................................................................56
...................................................................................................57
...................................................................................................58
...................................................................................................59
.............................................................................................60
1 How to change to a different scope device
2 How to use rulers to measure a signal
3 How to measure a time difference
4 How to move a view
...................................................................................................61
...................................................................................................61
...................................................................................................62
...................................................................................................62
.............................................................................................63
1 Measurement types
2 Trigger timing (part 1)
3 Trigger timing (part 2)
4 Keyboard shortcuts
5 Glossary
...................................................................................................63
...................................................................................................65
...................................................................................................66
...................................................................................................67
...................................................................................................68
Index
......................................................................................................69
Copyright 2006 Pico Technology Limited. All rights reserved.
PSW044-2.0
Page 4

1
PicoScope 6 User Guide
1
Welcome
Welcome to PicoScope, the PC Oscilloscope software from Pico Technology Limited.
With a scope device from Pico Technology, PicoScope turns your PC into a powerful
PC Oscilloscope with all the features and performance of a bench-top oscilloscope
7
at a fraction of the cost.
How to use this manual
What's new in this version?
Software version: PicoScope 6.0 beta v0.8.0.0
8
5
2
8
Copyright 2006 Pico Technology Limited. All rights reserved.PSW044-2.0
Page 5

Version 6.0 update
2
2
Version 6.0 update
PicoScope 6.0 is a major new release of PicoScope, Pico Technology's software for PC
Oscilloscopes.
Higher performance
• Faster capture rates, making it easier to see fast-moving signals
• Faster data processing
• Better support for the latest PicoScope USB oscilloscopes
Improved usability and appearance
• Clearer graphics and text
• Tooltips and help messages to explain all features
• Easy point-and-click tools for panning and zooming
• User-configurable toolbars - you can put all the controls where you want them
New features
• The latest Windows .NET technology helps us get new features to you quicker
• New digital low-pass filtering
• Custom probes manager to make it easy for you to use your own probes and
sensors with PicoScope
• Multiple views of the same data, with individual zoom, pan and filter settings for
each view
27
48
Copyright 2006 Pico Technology Limited. All rights reserved. PSW044-2.0
Page 6
3
PicoScope 6 User Guide
3
Introduction
PicoScope is a comprehensive software application for Pico Technology PC
Oscilloscopes. Used with a scope device from Pico Technology, it creates a virtual
oscilloscope, spectrum analyser and multimeter on your PC.
PicoScope 6.0 supports the following scope devices:
PicoScope 2000 Series
PicoScope 3000 Series
ADC-212 variants
PicoScope 6.0 runs on any 32-bit computer with Windows 98SE, ME, 2000 or XP. (See
System requirements for further recommendations.)
Legal statement
Contact information
How to use this manual
How to use PicoScope 6.0
Getting started: see using PicoScope for the first time , and PicoScope's Features.
7
For further information: see descriptions of Menus and Toolbars , and the
Reference section.
63
For step-by-step tutorials, see the "How to " section.
5
4
5
5
6
19 44
60
Copyright 2006 Pico Technology Limited. All rights reserved.PSW044-2.0
Page 7

Introduction
4
3.1
Legal statement
The material contained in this release is licensed, not sold. Pico Technology Limited
grants a licence to the person who installs this software, subject to the conditions
listed below.
Access
The licensee agrees to allow access to this software only to persons who have been
informed of these conditions and agree to abide by them.
Usage
The software in this release is for use only with Pico products or with data collected
using Pico products.
Copyright
Pico Technology Limited claims the copyright of, and retains the rights to, all material
(software, documents etc) contained in this release. You may copy and distribute the
entire release in its original state, but must not copy individual items within the
release other than for backup purposes.
Liability
Pico Technology and its agents shall not be liable for any loss, damage or injury,
howsoever caused, related to the use of Pico Technology equipment or software,
unless excluded by statute.
Fitness for purpose
No two applications are the same: Pico Technology cannot guarantee that its
equipment or software is suitable for a given application. It is your responsibility,
therefore, to ensure that the product is suitable for your application.
Mission-critical applications
This software is intended for use on a computer that may be running other software
products. For this reason, one of the conditions of the licence is that it excludes usage
in mission-critical applications, for example life-support systems.
Viruses
This software was continuously monitored for viruses during production, but you are
responsible for virus-checking the software once it is installed.
Support
If you are dissatisfied with the performance of this software, please contact our
technical support staff, who will try to fix the problem within a reasonable time. If you
are still dissatisfied, please return the product and software to your supplier within 14
days of purchase for a full refund.
Upgrades
We provide upgrades, free of charge, from our web site at www.picotech.com. We
reserve the right to charge for updates or replacements sent out on physical media.
Trademarks
Windows is a registered trademark of Microsoft Corporation. Pico Technology Limited
and PicoLog are internationally registered trade marks.
Copyright 2006 Pico Technology Limited. All rights reserved. PSW044-2.0
Page 8
5
PicoScope 6 User Guide
3.2
3.3
Contact information
Address: Pico Technology Limited
The Mill House
Cambridge Street
St Neots
Cambridgeshire
PE19 1QB
United Kingdom
Phone: +44 (0)1480 396395
Fax: +44 (0)1480 396296
Office hours: 09:00 to 17:00 Mon-Fri
Technical support email: support@picotech.com
Sales email: sales@picotech.com
Web site: www.picotech.com
How to use this manual
You are using a PDF viewer to read this manual. You can turn the pages of the manual
as if it were a book, using the back and forward buttons in your viewer. These
buttons should look something like this:
3.4
back
forward
You can also print the entire manual for reading away from your computer. Look for a
print button similar to this:
print
For your first introduction to PicoScope, we suggest that you start with these topics:
Using PicoScope for the first time
Oscilloscope basics
PCO basics
PicoScope basics
8
7
8
6
System requirements
PicoScope 6.0 runs on any Windows computer with the following specifications.
Operating system Windows 98SE, ME, 2000 or XP
Processor Any 32-bit Intel or Intel-compatible CPU
RAM At least 256 MB
Copyright 2006 Pico Technology Limited. All rights reserved.PSW044-2.0
Page 9
Using PicoScope for the first time
6
4
Using PicoScope for the first time
We have designed PicoScope to be as easy as possible to use, even for newcomers to
oscilloscopes. Once you have followed the introductory steps listed below, we hope
that you will soon become a PicoScope expert.
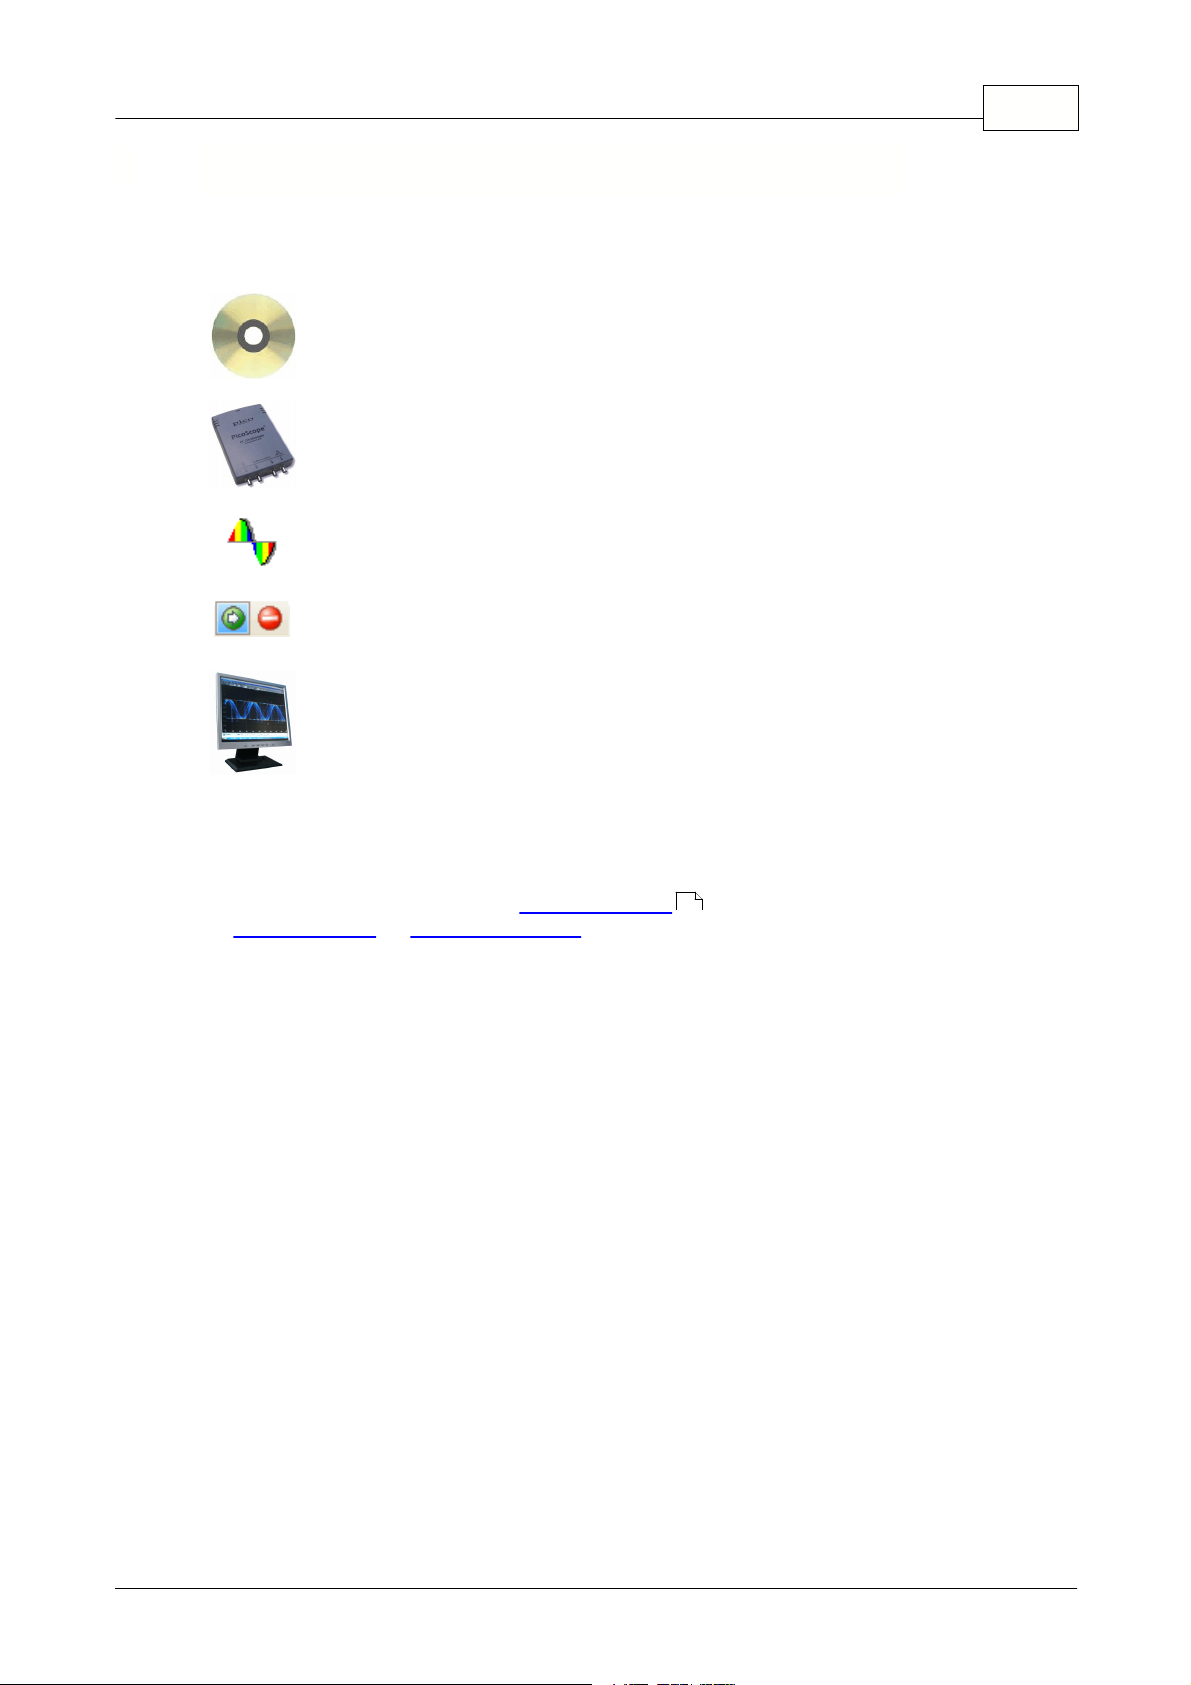
1. Install the software. Load the CD-ROM that is included with your scope
device, then click the "Install Software" link and follow the on-screen
instructions.
2. Plug in your scope device. Windows will recognise it and make the
necessary changes to allow your computer to work with it. Wait until
Windows tells you that the device is ready to use.
3. Click the new PicoScope icon on your Windows desktop.
4. PicoScope will detect your scope device and configure itself, ready to
display a waveform. The green Start button will be highlighted to show
that PicoScope is ready.
5. Connect a signal to one of the scope device's input channels and see
your first waveform!
"It didn't do what I expected!"
Help is at hand! Our technical support staff are always ready to answer your telephone
call during office hours (see our Contact Details ). At other times, you can contact
our support forum or send us an email.
5
Copyright 2006 Pico Technology Limited. All rights reserved. PSW044-2.0
Page 10
7
PicoScope 6 User Guide
5
5.1
PicoScope and oscilloscope primer
This chapter explains the fundamental concepts that you will need to know before
working with the PicoScope software. If you have used an oscilloscope before, then
most of these ideas will be familiar to you. If not, please take a few minutes to read at
least the "Oscilloscope basics " and "PicoScope basics " topics, and then return
here to read the more detailed topics in this chapter when you need them.
Oscilloscope basics
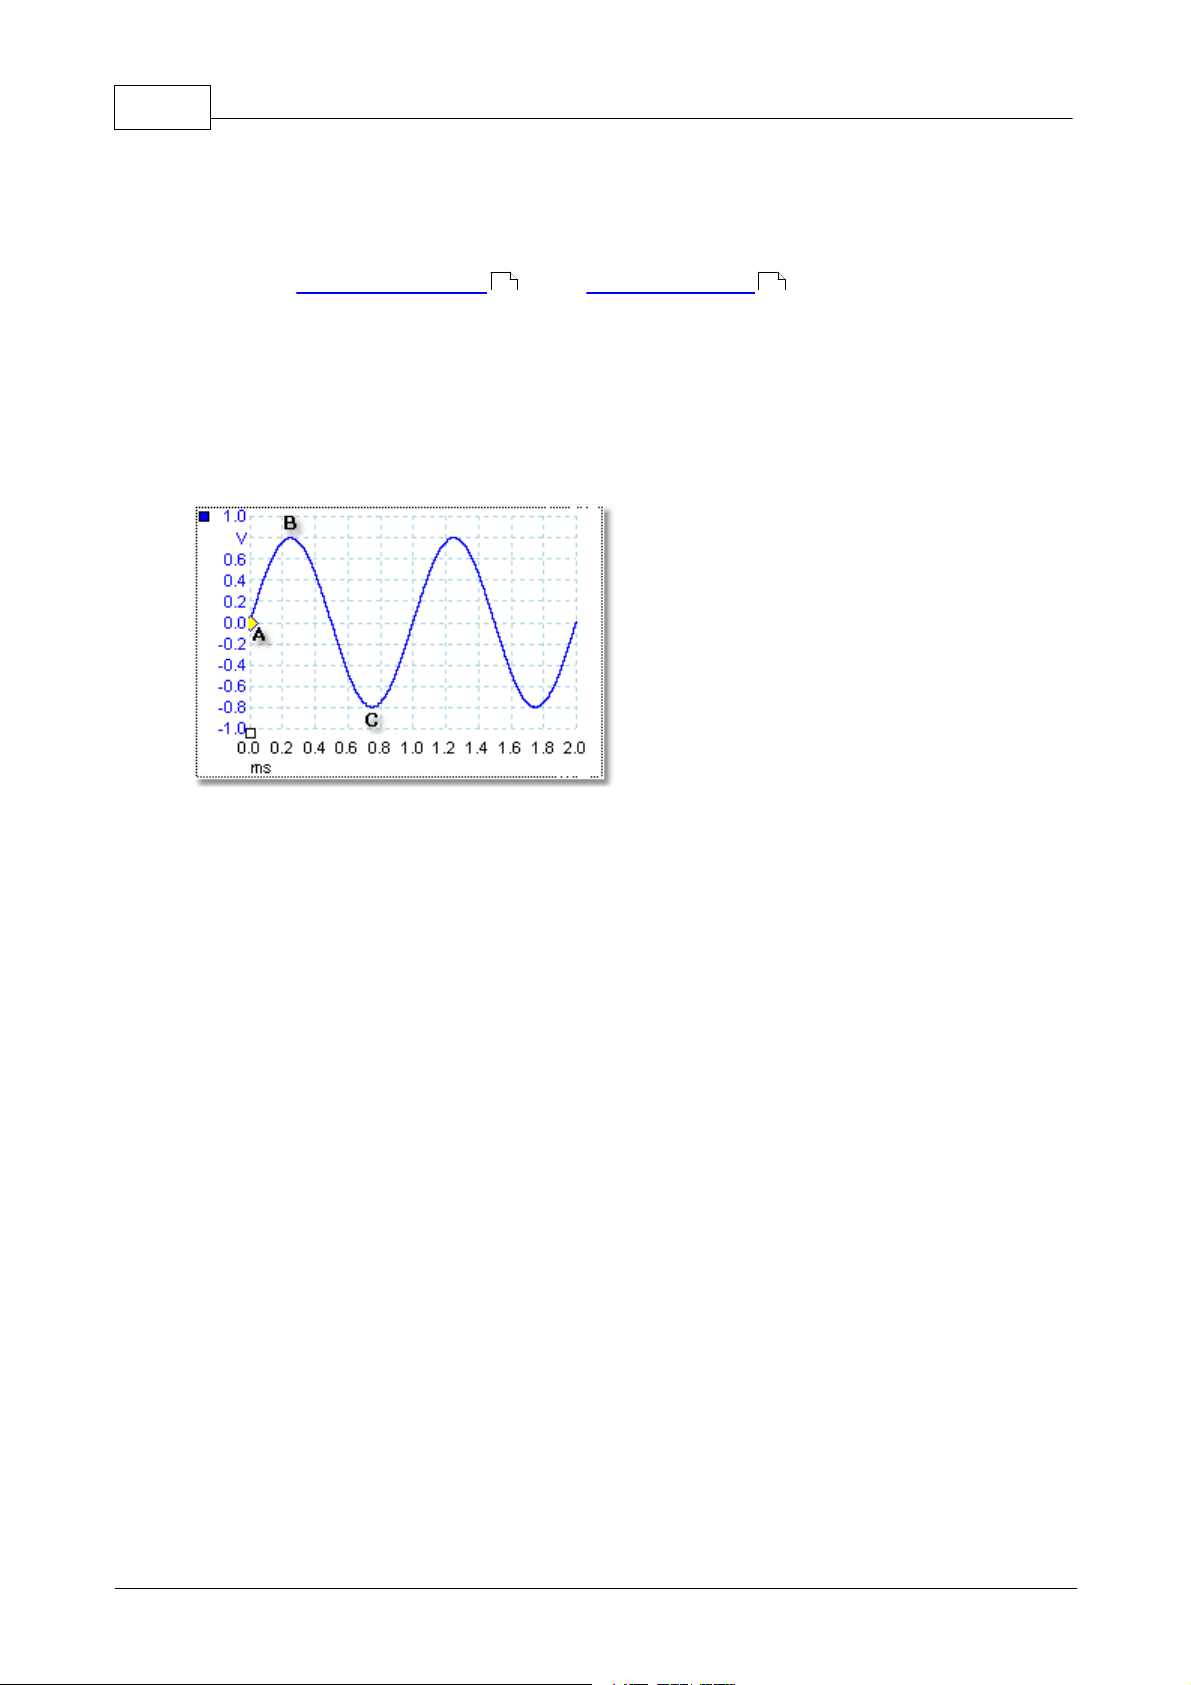
An oscilloscope is a measuring instrument that displays a graph of voltage against
time. For example, the picture below shows a typical display on an oscilloscope
screen when a varying voltage is connected to one of its input channels.
7 8
Oscilloscope displays are always read from left to right. The blue line, called the
"trace", begins at point A, where the voltage is 0.0 volts. At point B, 0.25 milliseconds
later, the voltage has risen to its positive peak of 0.8 volts. At point C, 0.75
milliseconds after the start, the voltage has dropped to its negative peak of -0.8 volts.
After 1 millisecond, the voltage has risen back to 0.0 volts and a new cycle is about to
begin. This type of signal is called a sine wave, and is one of a huge number of signal
types that you will encounter.
All oscilloscopes allow you to adjust the vertical and horizontal scales of the display.
The vertical scale is called the voltage range (in the most common case, when the
signal is measured in volts). The horizontal scale is called the time base and is
measured in seconds or, as in this example, fractions of a second.
Copyright 2006 Pico Technology Limited. All rights reserved.PSW044-2.0
Page 11
PicoScope and oscilloscope primer
8
5.2
5.3
PCO basics
A PC Oscilloscope (PCO) is an oscilloscope that consists of a scope device and a PC
running a special software program. Oscilloscopes were introduced long before digital
computers existed, and were self-contained electronic instruments with limited
abilities. Later, oscilloscopes began to use the new digital technology to introduce
more functions, but they remained highly specialised and expensive instruments. PC
Oscilloscopes are the latest step in the evolution of oscilloscopes, combining the
measuring power of Pico Technology's scope devices with the convenience of the PC
that's already on your desk.
7
+ =
PC scope device PCO
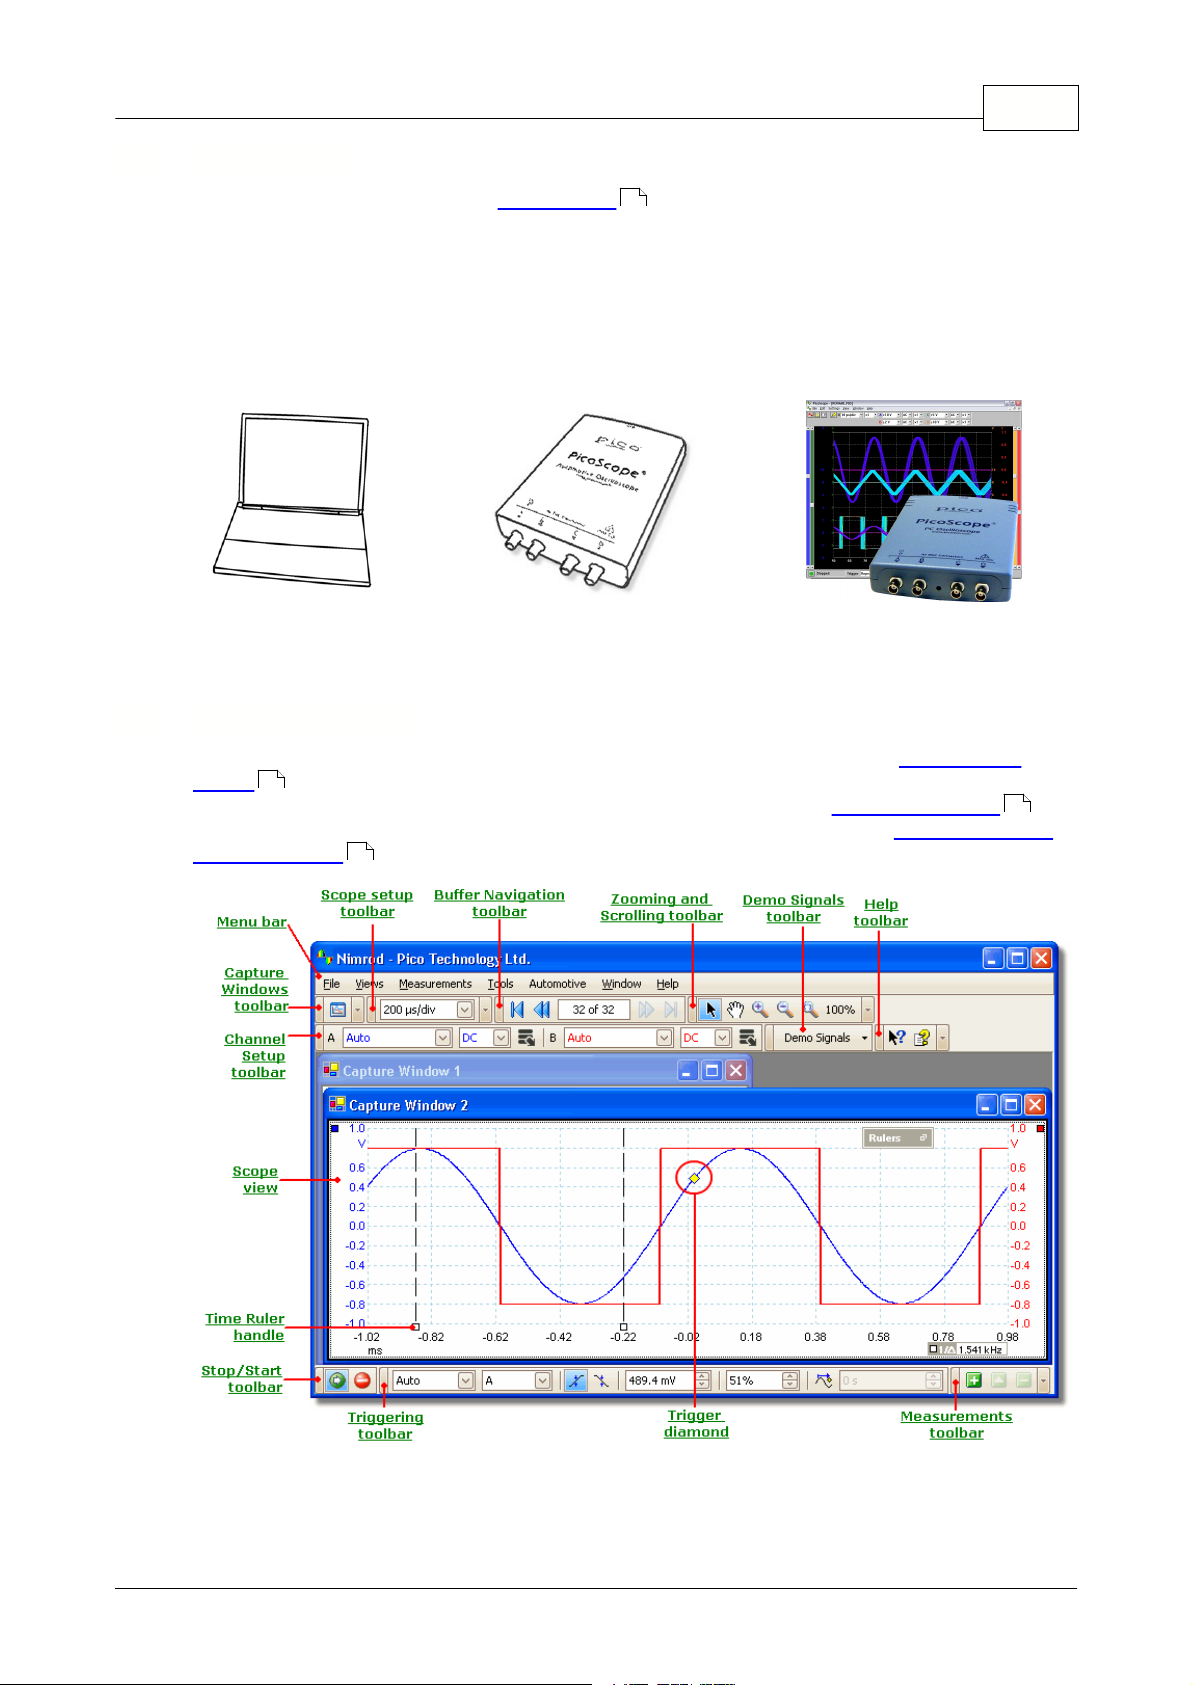
PicoScope basics
PicoScope can simple waveforms such as the example we saw in the "Oscilloscope
basics " topic, but also has many advanced features. The screen shot below shows
the main window of PicoScope, which in this case contains two capture windows .
Click on any of the underlined labels to learn more. Also, please see "Windows, views
and viewports" for an explanation of these important concepts.
7
9
18
Copyright 2006 Pico Technology Limited. All rights reserved. PSW044-2.0
Page 12
9
PicoScope 6 User Guide
5.4
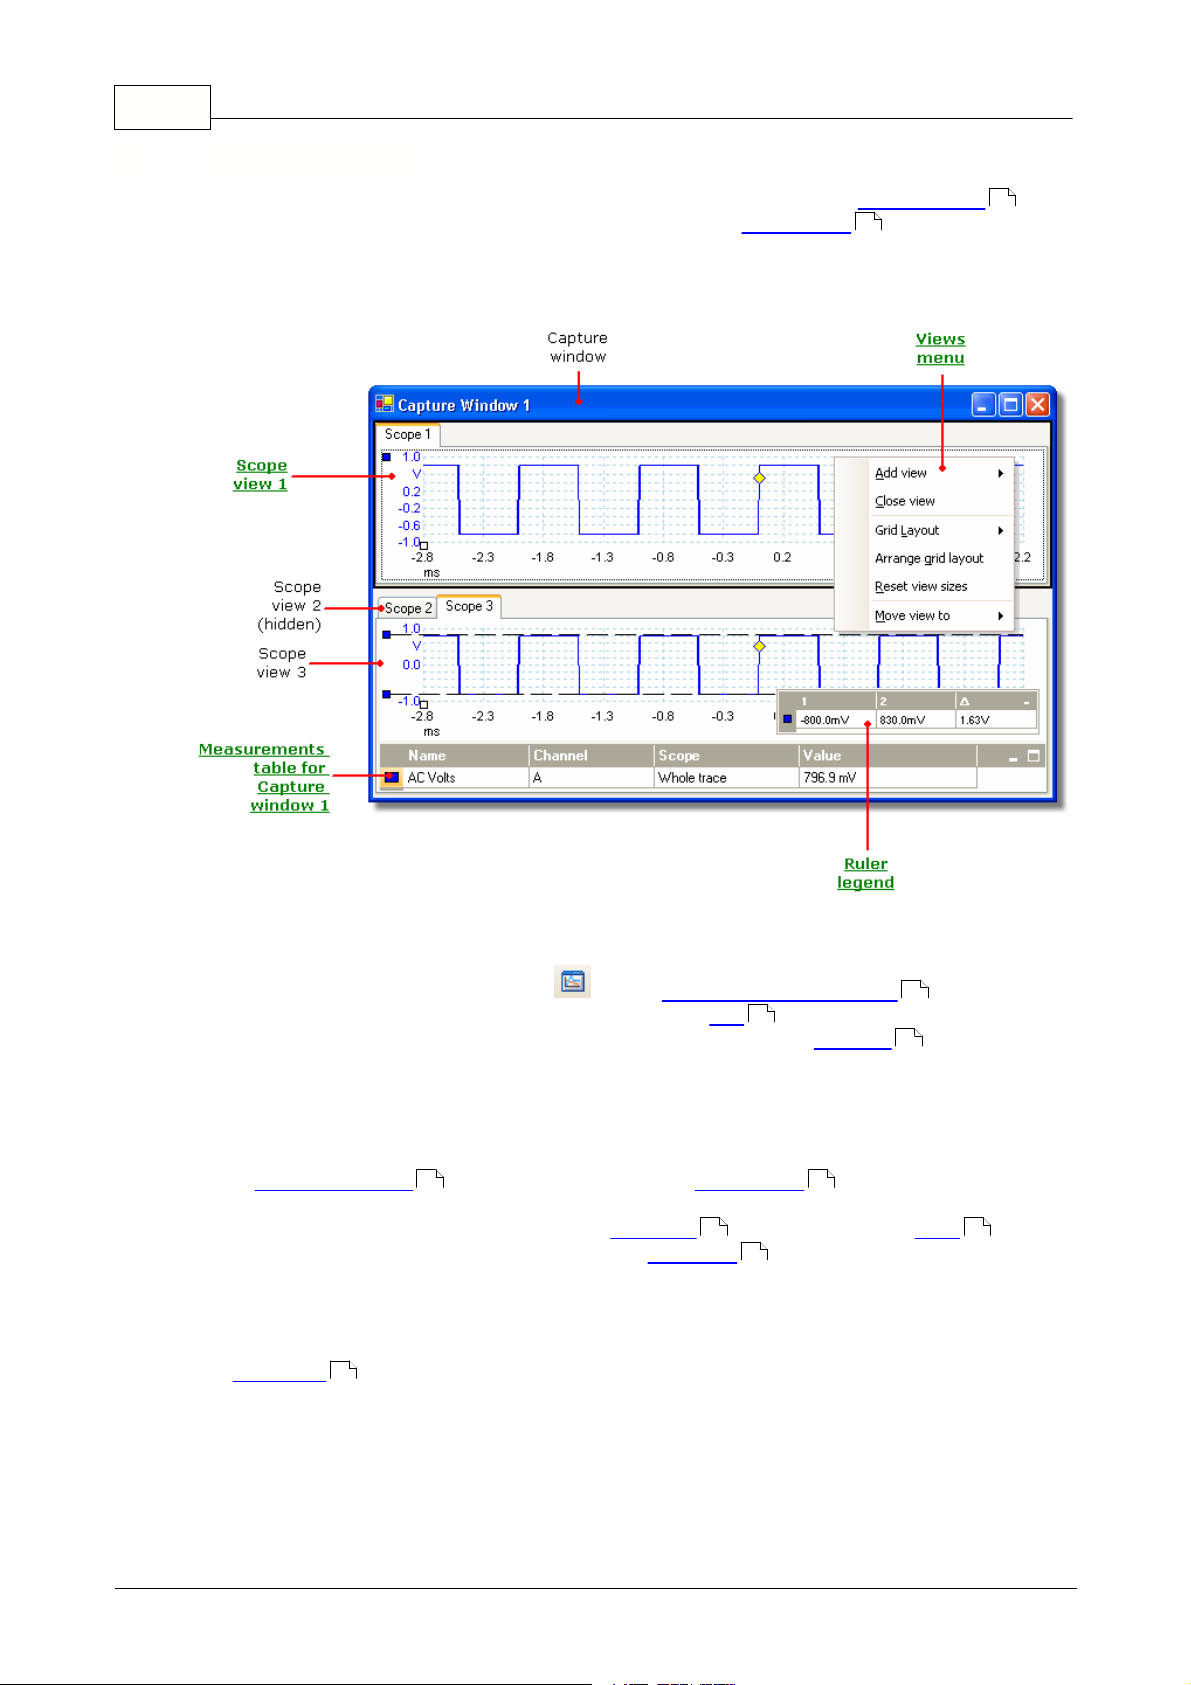
Capture window
A capture window shows a block of data captured from a single scope device .
When you first open a capture window it contains one scope view , but you can add
14
more views by clicking Add view in the Views menu. The screen shot below shows all
the main features of a capture window. Click on the underlined labels for more
information.
68
To open a new capture window
Click the capture window button in the capture window toolbar , or select
the Create New Scope Window command in the File menu. PicoScope can
20
display many capture windows, but only one window can be "in focus " at any time.
45
68
Any commands you issue — by clicking on buttons, for example — will affect only this
window. To bring a window into focus, just click on it.
To arrange the scope views within the capture window
If the capture window contains more than one scope view , then PicoScope will
9 14
arrange them in a grid. This is laid out automatically, but you can customize it if you
wish. Each location in the grid is called a viewport . You can move a view to a
different viewport by dragging its name tab (show me ), but you cannot move it
68 68
62
outside the capture window that it belongs to. You can also put more than one view in
a viewport, by dragging a view and dropping it on top of another.
For further options, right-click on a view to obtain the View menu, or select View from
the Menu bar , then select one of the menu options to arrange the views.
19
Copyright 2006 Pico Technology Limited. All rights reserved.PSW044-2.0
Page 13
PicoScope and oscilloscope primer
10
5.5
5.6
Custom probes
A probe is any connector, transducer or measuring device that you connect to the
input channel of your scope device . PicoScope has a built-in library of common
68
probe types, such as the x1 and x10 voltage probes used with most oscilloscopes, but
if your probe is not included in this list you can use the Custom Probes dialog to
27
define a new one. Custom probes can have any voltage range within the capabilities of
the oscilloscope, display in any units, and have either linear or nonlinear
characteristics.
Custom probe definitions are particularly useful when you wish to display the probe's
output in units other than volts, or to apply linear or nonlinear corrections to the data.
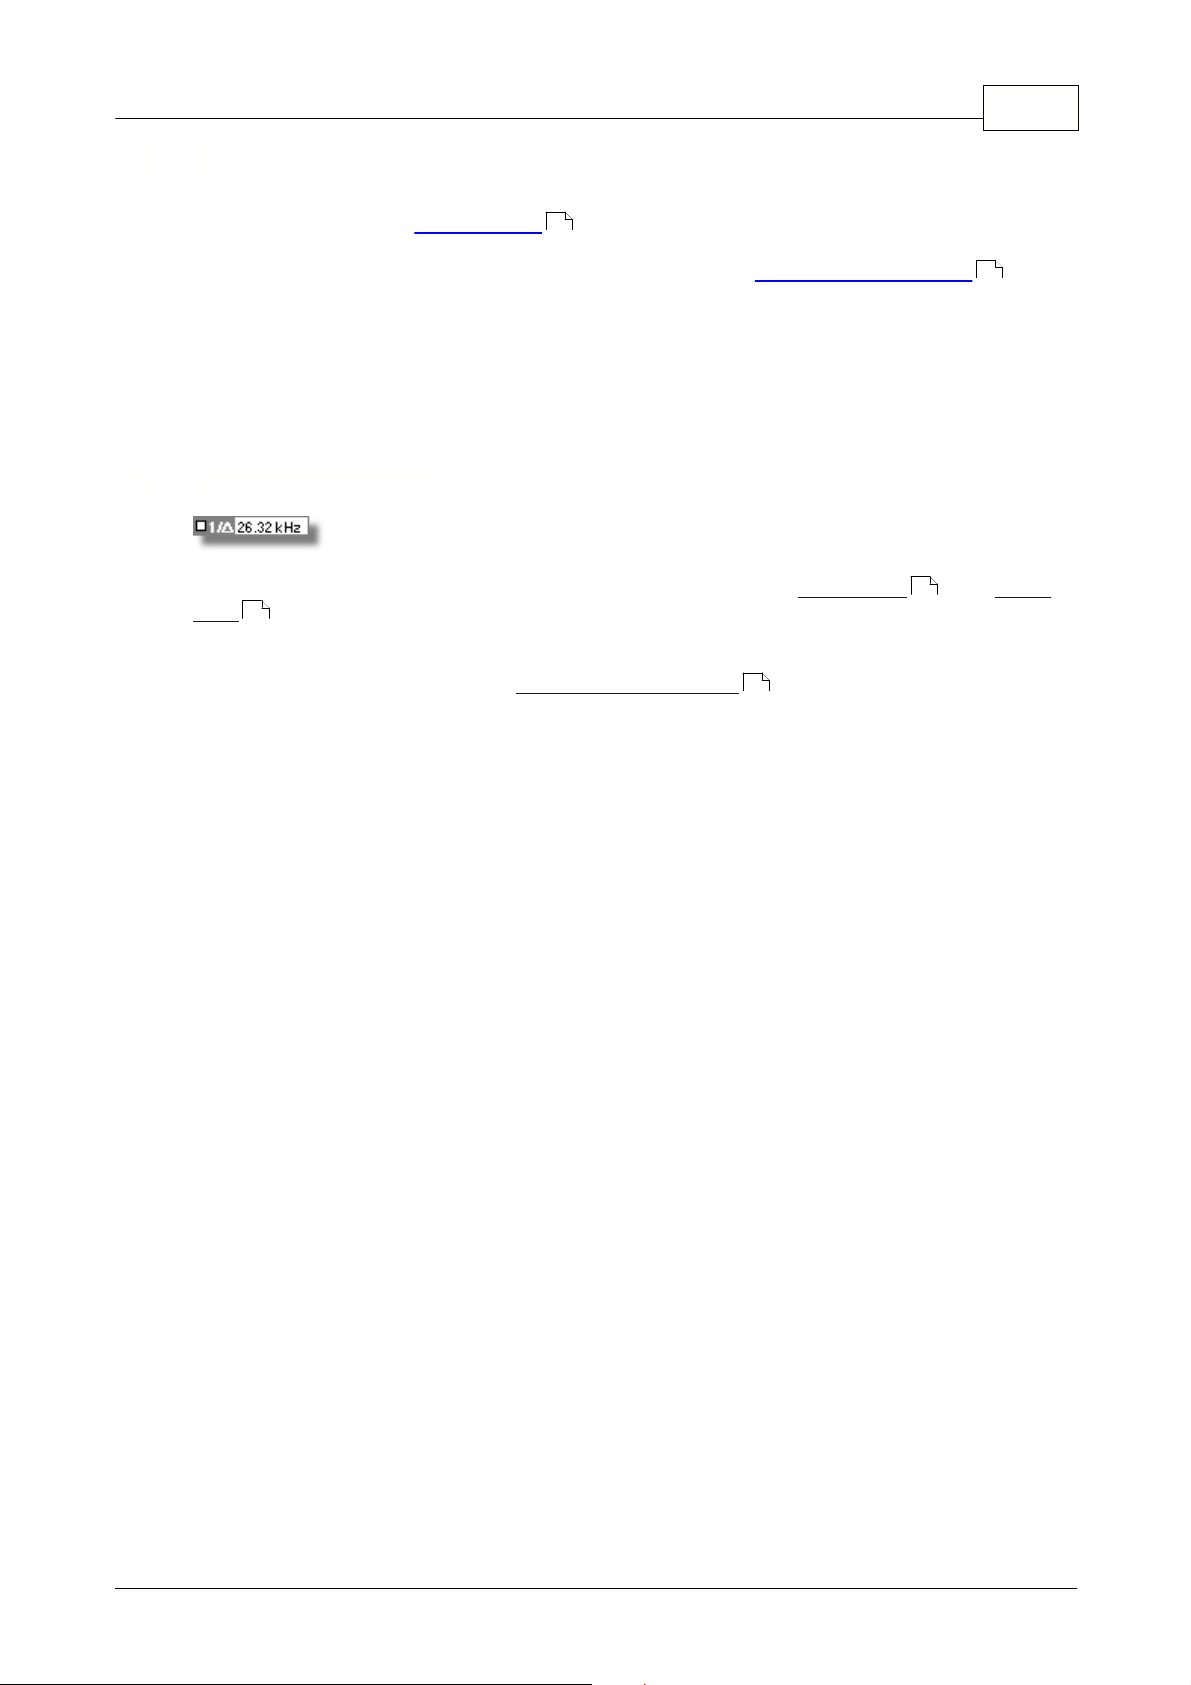
Frequency legend
The frequency legend appears when you have placed two time rulers on a scope
14
view . It shows 1/D in hertz, where D is the time difference between the two rulers.
You can use this to estimate the frequency of a periodic waveform, but you will get
more accurate results by creating a frequency measurement using the Add
Measurements button on the Measurements toolbar .
52
15
Copyright 2006 Pico Technology Limited. All rights reserved. PSW044-2.0
Page 14
11
PicoScope 6 User Guide
5.7
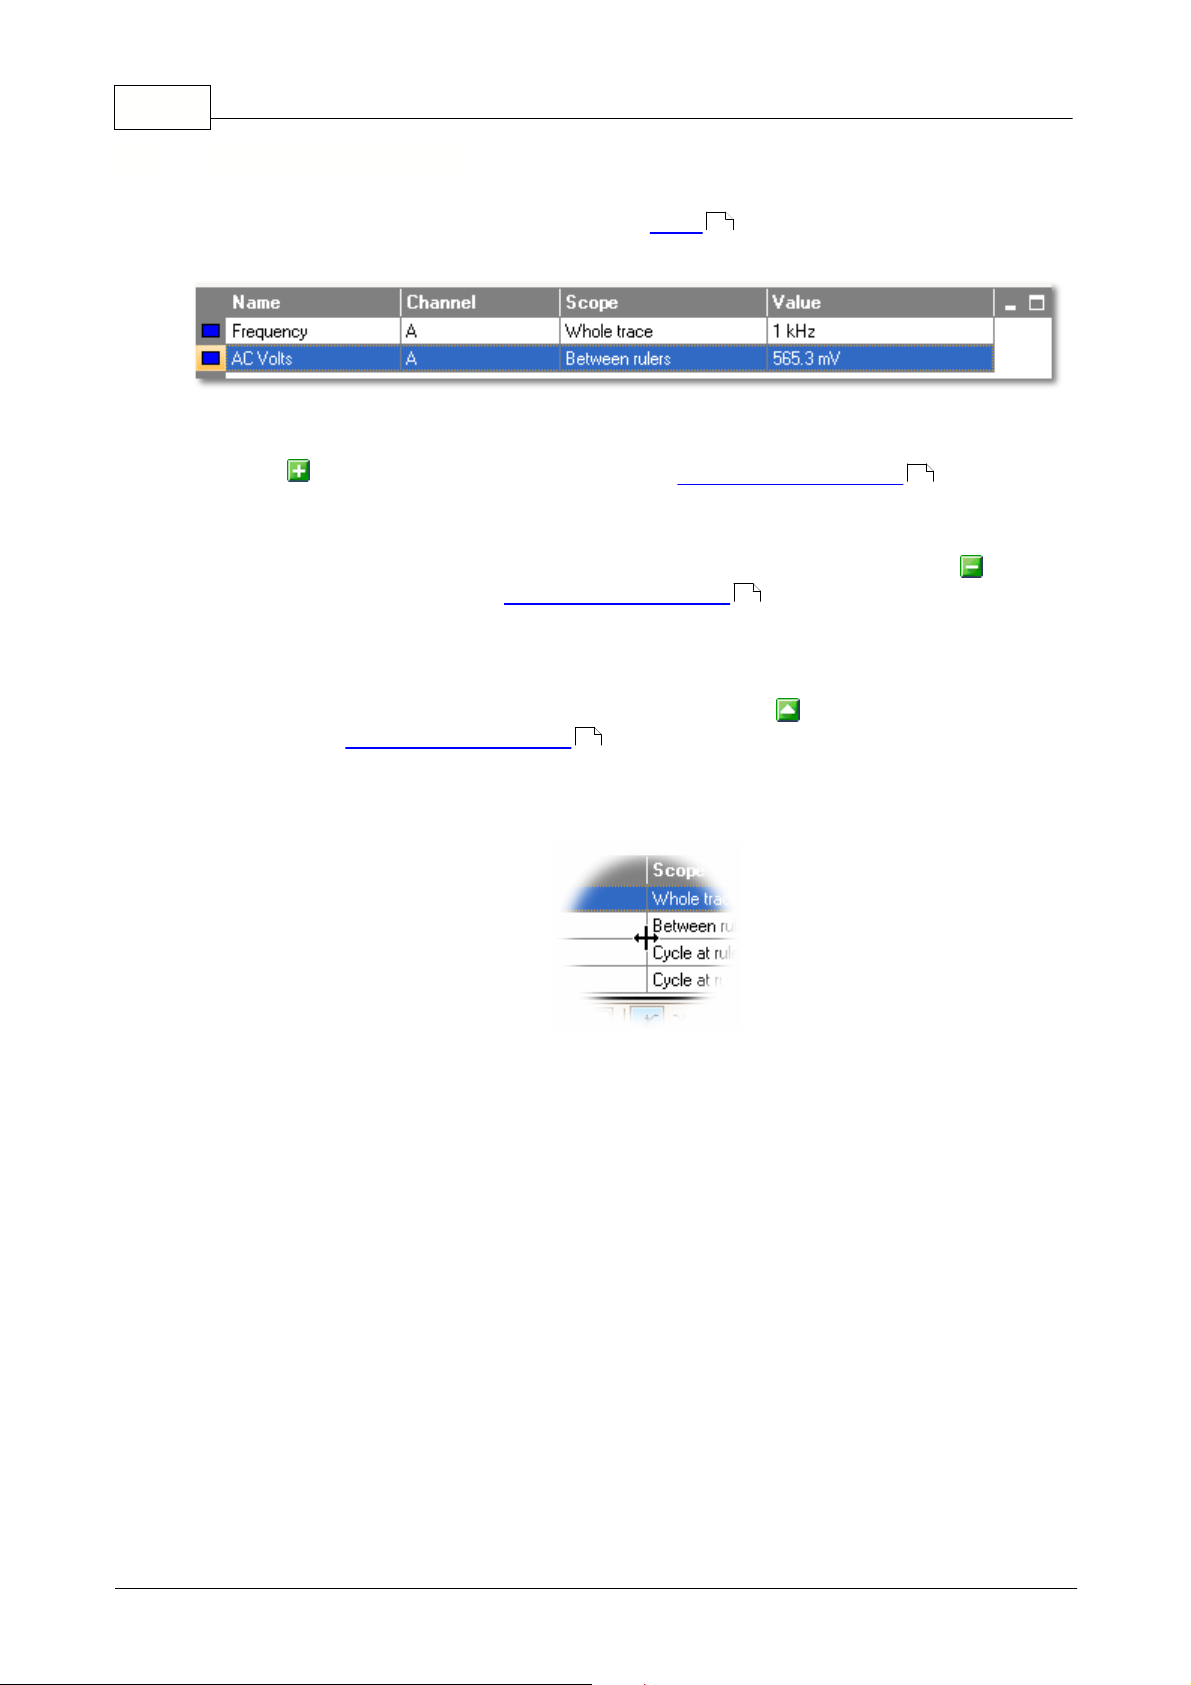
Measurements table
A measurements table contains the automatic measurements that you have
instructed PicoScope to make on a particular view. You can add, delete or edit
measurements from this table.
To add a measurement
Click the Add Measurement button on the measurements toolbar .
To delete a measurement
Select a measurement in the table by clicking once on it, and then click the Delete
Measurement button on the measurements toolbar . If you delete the only
measurement in the table, the table will be removed.
To edit a measurement
If the measurement you wish to edit is selected, click the Edit Measurement
button on the measurements toolbar . Otherwise, double-click on the
52
measurement.
14
52
52
To change the width of a measurement column
Drag the column's border to create
the column width you need. The
cursor will change to a column
resize symbol as shown here.
Copyright 2006 Pico Technology Limited. All rights reserved.PSW044-2.0
Page 15

PicoScope and oscilloscope primer
12
5.8
Oversampling
Oversampling is a technique of capturing samples n times faster than the requested
sampling rate, then replacing each group of n adjacent samples with the average of
that group. If the signal contains a small amount of noise, the result of oversampling
is a waveform with increased effective resolution. The amount of oversampling
available depends on how fast your scope device can sample.
Procedure
First make sure that the Oversampling control is displayed on the Scope Setup
toolbar . If it is not, add this control to the toolbar as explained in the "Toolbars
44
53
" topic.
Use the Oversampling control to adjust the oversampling factor (n). PicoScope
allows oversampling factors in the range 1 (no oversampling) to 256.
How to choose the oversampling factor
To obtain an increase in effective resolution of n bits, you should choose an
oversampling factor of 4n. Conversely, an oversampling factor of f will give an
increase in effective resolution of log(f) / n log(4).
For example, if a scope device has a stated resolution of 8 bits, then an oversampling
factor of 4 will, under ideal conditions, increase this to 9 bits. An oversampling factor
of 16 will increase the effective resolution to 10 bits, and a factor of 256 will increase
it to 12 bits.
68
These calculations assume that the noise is Gaussian (follows a normal distribution).
This is approximately true for noise from natural sources, such as thermal noise in
resistors and sensors, but not be true for man-made noise such as radio interference
and mains (line) hum. The scope device itself often produces enough low-amplitude
noise to make oversampling successful.
The benefit of oversampling comes at the cost of having to increase the sampling rate.
If your scope device is already running at its maximum sampling rate in order to
capture high-frequency details in the signal, then it will not be able to oversample.
Copyright 2006 Pico Technology Limited. All rights reserved. PSW044-2.0
Page 16
13
PicoScope 6 User Guide
5.9
Post-trigger arrow
The post-trigger arrow appears temporarily while you are setting up a post-trigger
delay, or dragging the trigger marker after setting up a post-trigger delay. (What is a
post-trigger delay? )
The left-hand end of the arrow indicates the trigger point, and is aligned with zero on
the time axis. If zero on the time axis is outside the scope view, then the left-hand
end of the post-trigger arrow appears like this:
66
5.10
The right-hand end of the arrow (temporarily replacing the trigger marker )
16
indicates the trigger reference point.
Use the buttons on the Triggering toolbar to set up a post-trigger delay.
57
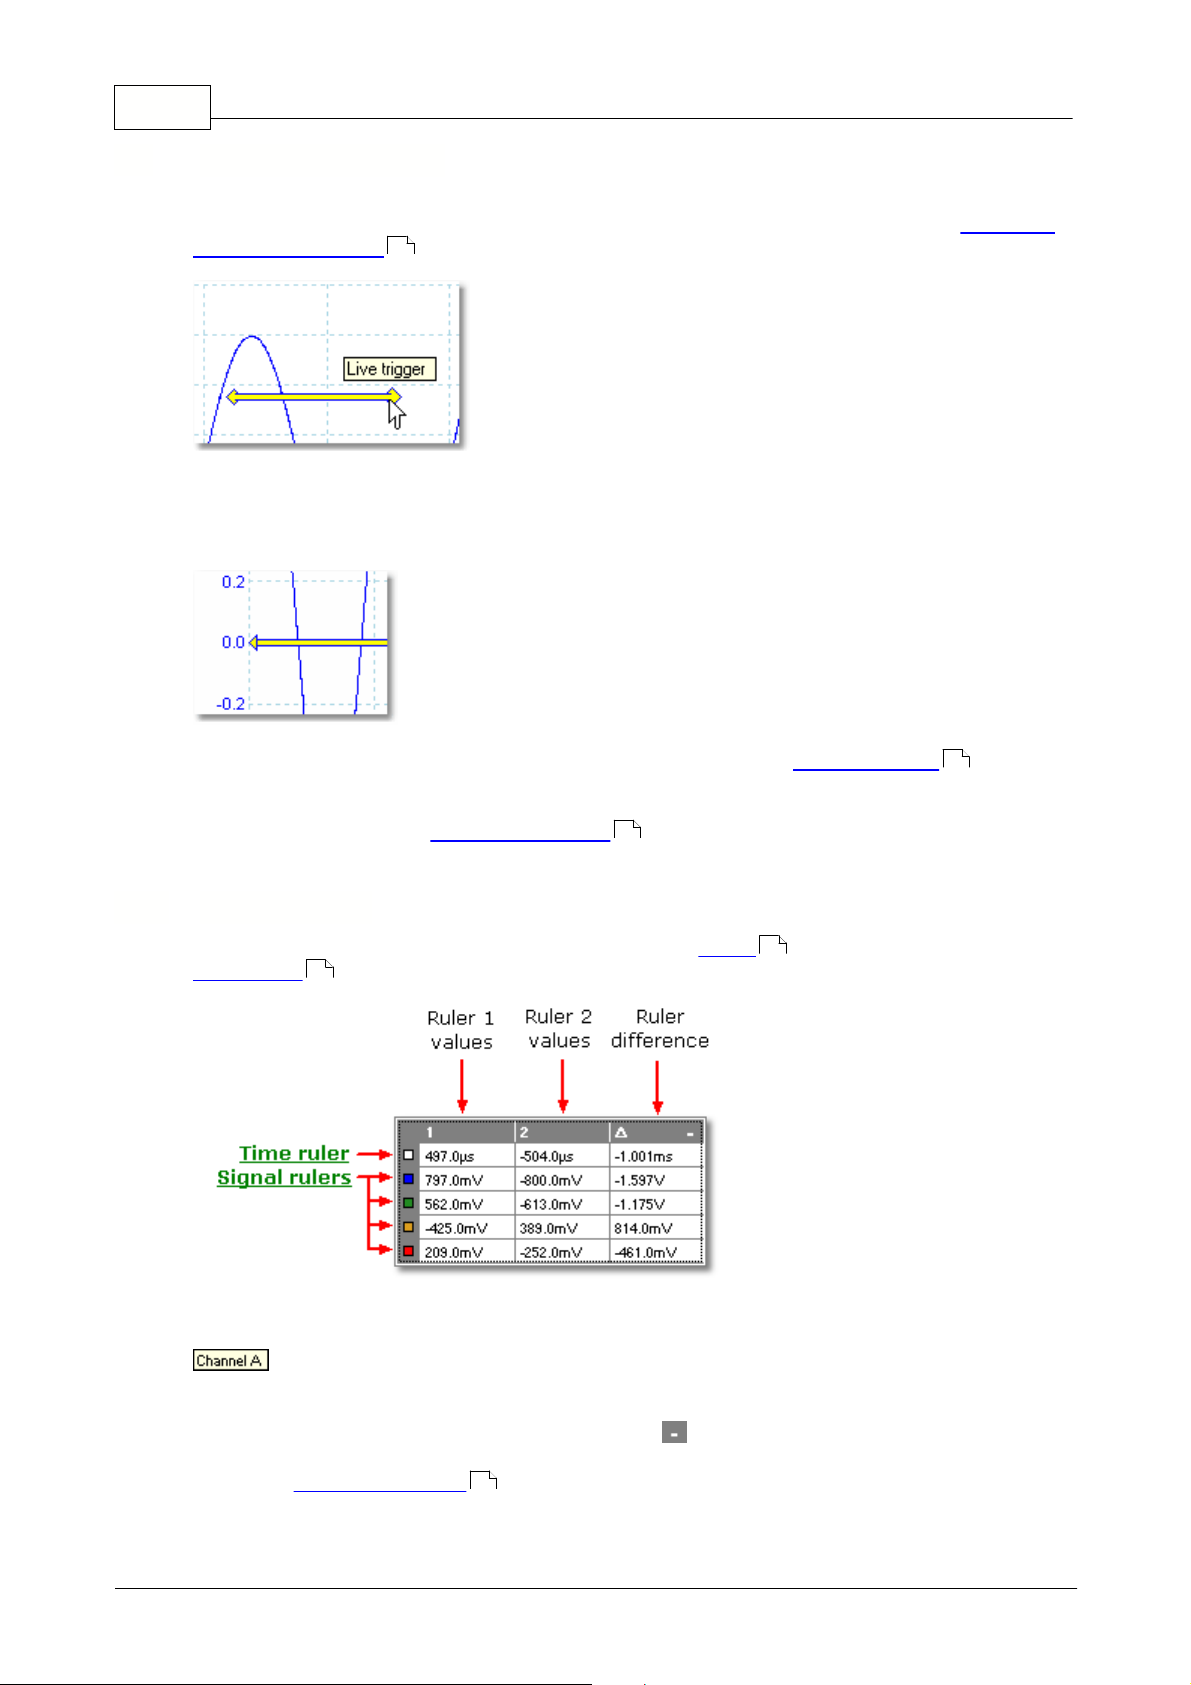
Ruler legend
The ruler legend displays the positions of all the rulers you have placed on the
scope view . It appears automatically whenever there is a ruler on the screen.
14
For a reminder of which row refers to which signal, point using the mouse to one of
the colour-coded boxes in the left-hand margin and a label will appear, like this:
.
68
You can drag the legend around the scope view, resize it by dragging one of its edges,
or minimise it by clicking the minimise button in the top right-hand corner.
See also: frequency legend (which shows 1/D, where D is the time difference).
10
Copyright 2006 Pico Technology Limited. All rights reserved.PSW044-2.0
Page 17
PicoScope and oscilloscope primer
14
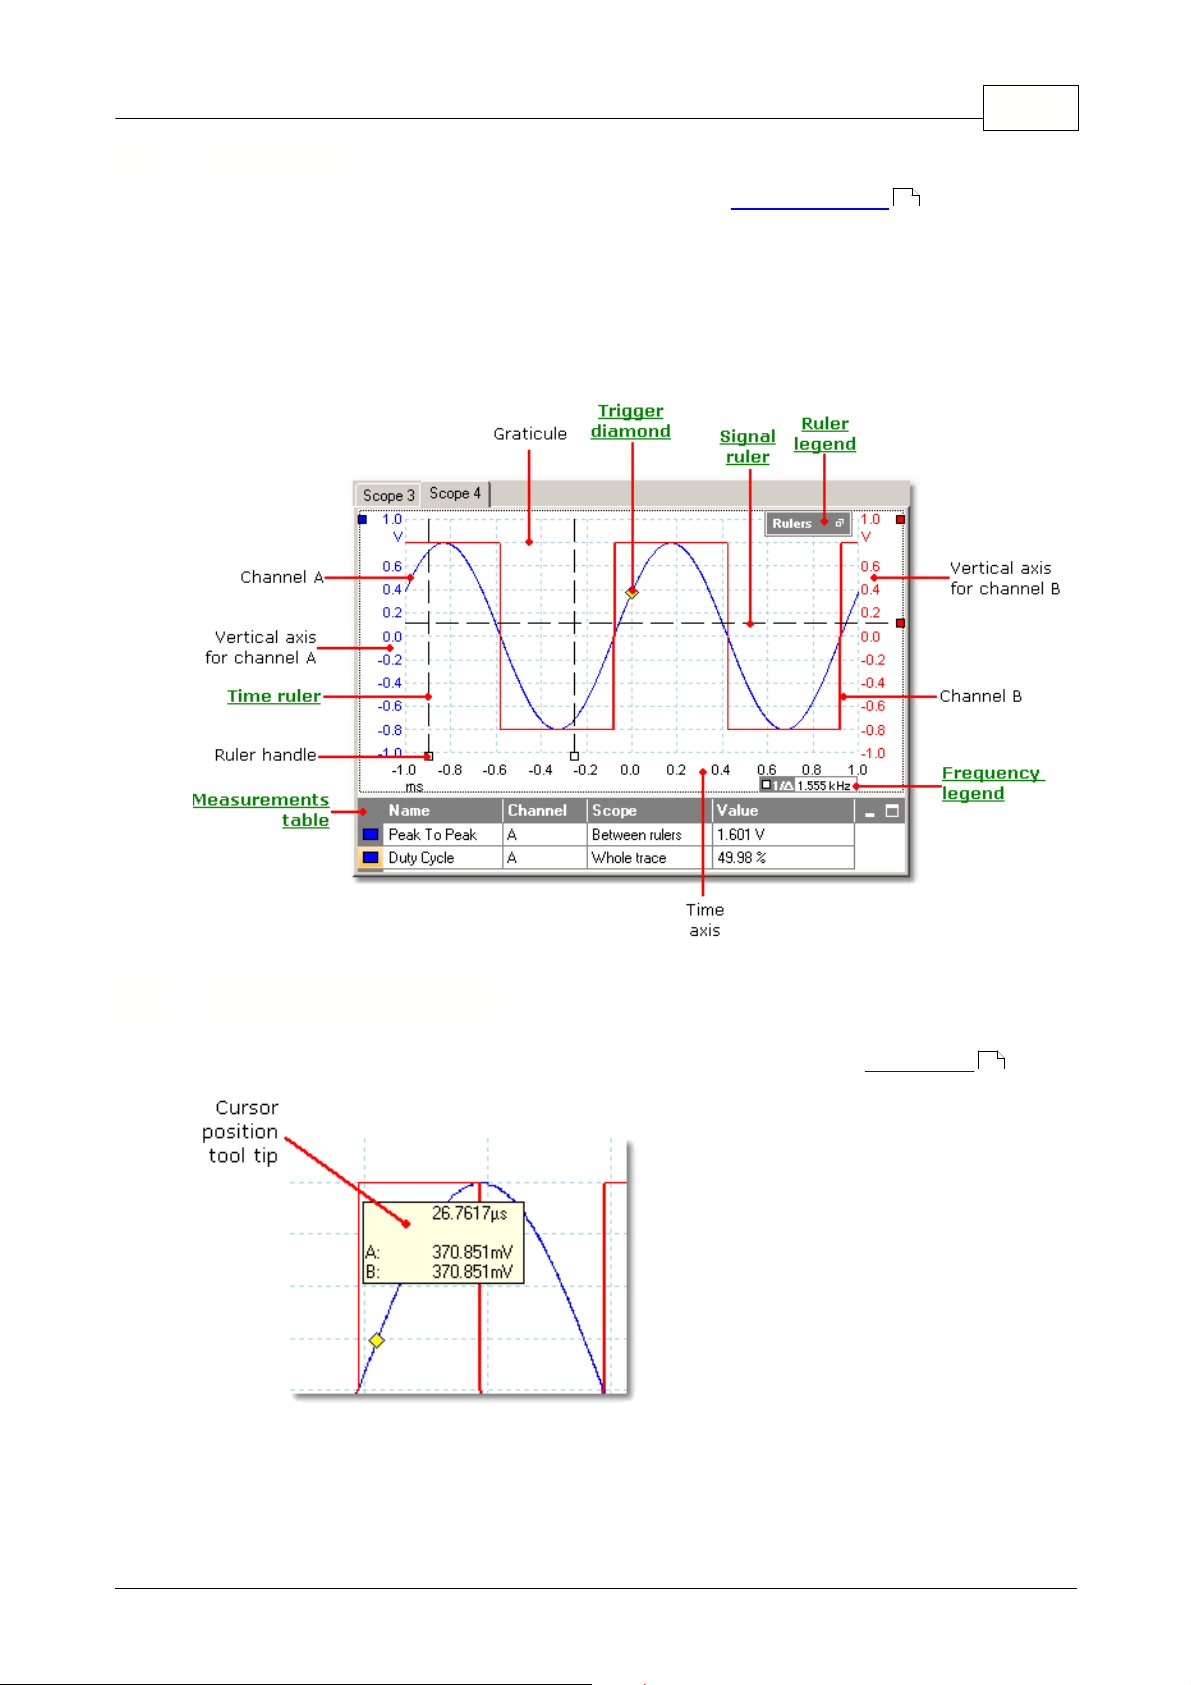
5.11
Scope view
A scope view is one view of the data belonging to a capture window . Each capture
window opens with a single view, but you can add more views by using the views
menu. Similar to the screen of a conventional oscilloscope, a scope view shows you
one or more waveforms with a common time axis. A waveform is a diagram of signal
level on a vertical axis plotted against time on the horizontal axis. Each view can have
as many waveforms as the scope device has channels. Click on one of the labels below
to learn more about a feature.
9
5.12
Cursor position tool tip
The cursor position tool tip is a box that displays the signal and time values at the
cursor. It appears temporarily when you click the background of a scope view .
14
Copyright 2006 Pico Technology Limited. All rights reserved. PSW044-2.0
Page 18
15
PicoScope 6 User Guide
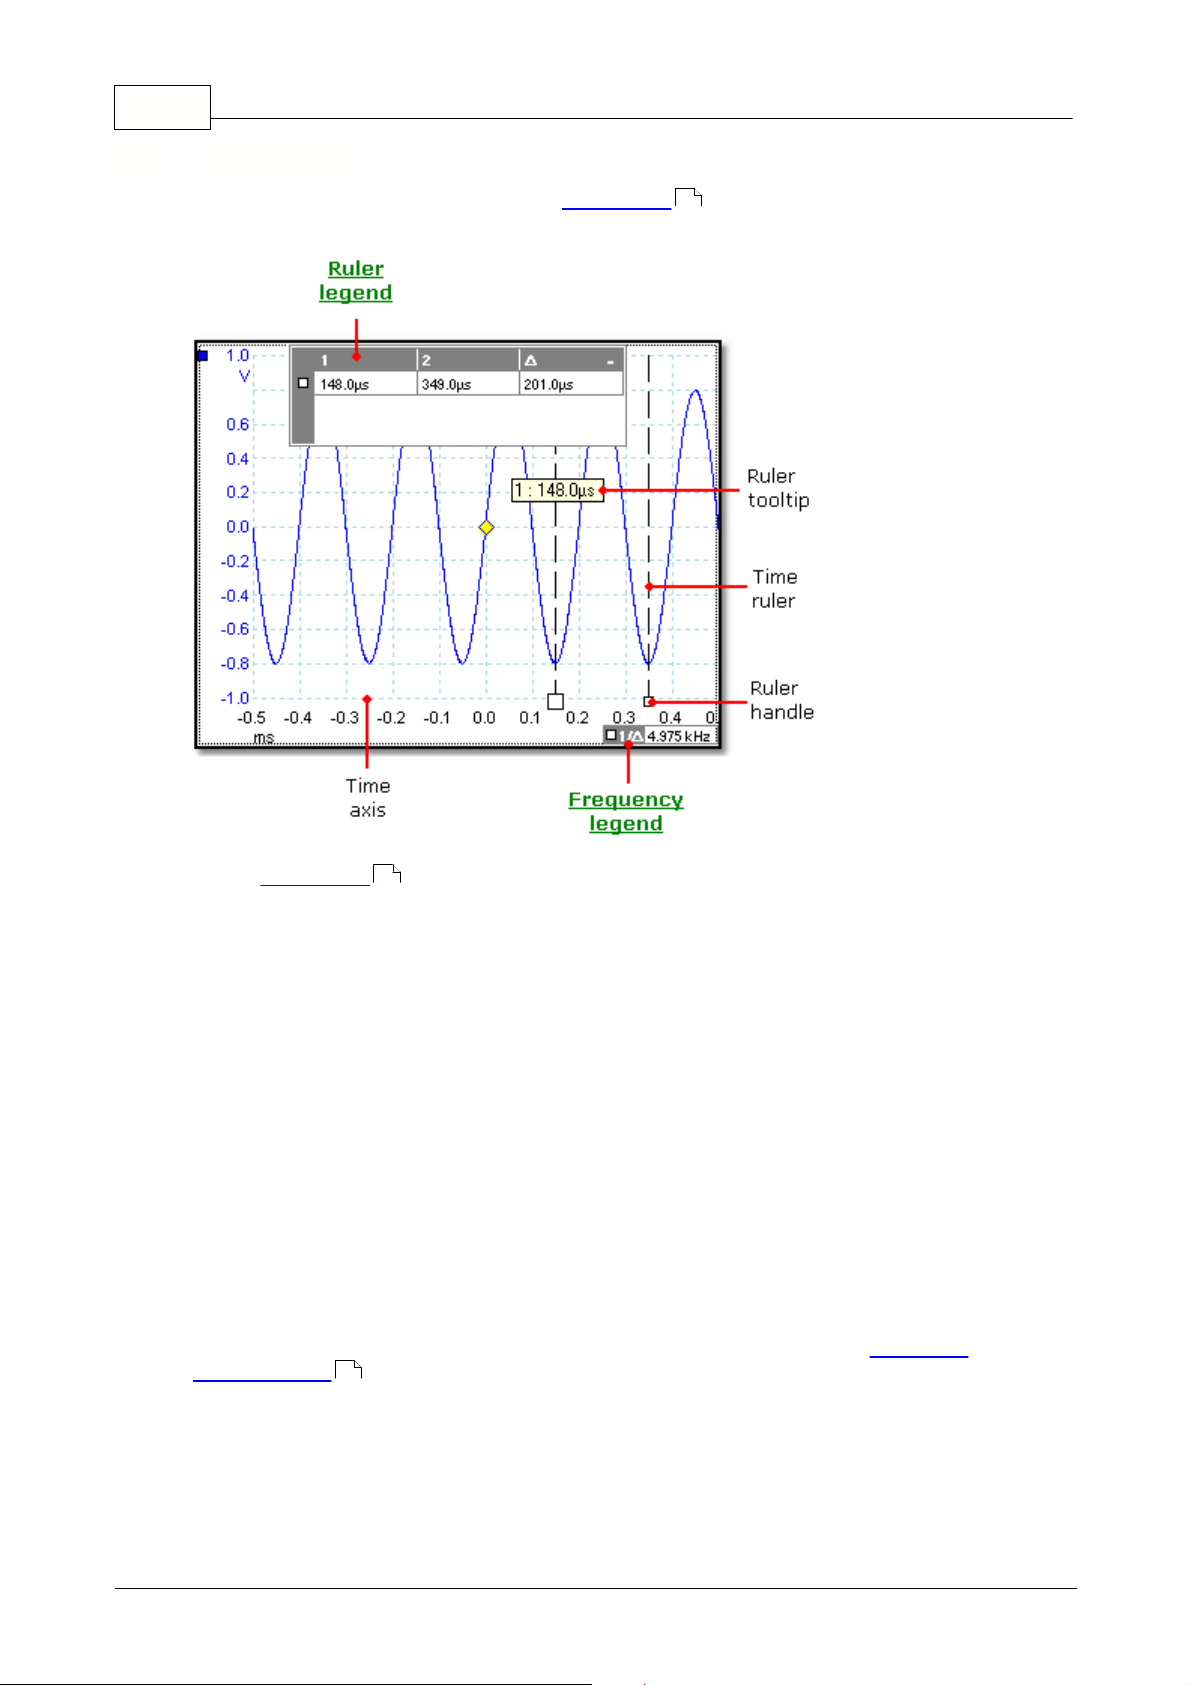
5.13
Time rulers
The time rulers measure time on a scope view or frequency on a spectrum view (if
available).
14
In the scope view above, the two white squares on the time axis are the time ruler
14
handles. You can drag these from the bottom left corner to the positions on the time
axis you want to measure. The two vertical dashed lines are the time rulers.
Ruler tool tip
If you point to one of the rulers, as we have done in the example above, PicoScope
displays a tool tip with the ruler number and the time value of the ruler.
Ruler legend
The table at the top of the view is the ruler legend. In this example, the table shows
that time ruler 1 is at 148.0 microseconds, ruler 2 is at 349.0 microseconds and the
difference between them is 201.0 microseconds.
Frequency legend
The frequency legend in the bottom right-hand corner shows 1/D, where D is the
time difference between the two rulers. 1/D is 4.975 kilohertz in this example. The
accuracy of this calculation depends on the accuracy with which you have positioned
the time rulers. For greater accuracy with periodic signals, use the frequency
measurement function built in to PicoScope.
63
Copyright 2006 Pico Technology Limited. All rights reserved.PSW044-2.0
Page 19
PicoScope and oscilloscope primer
16
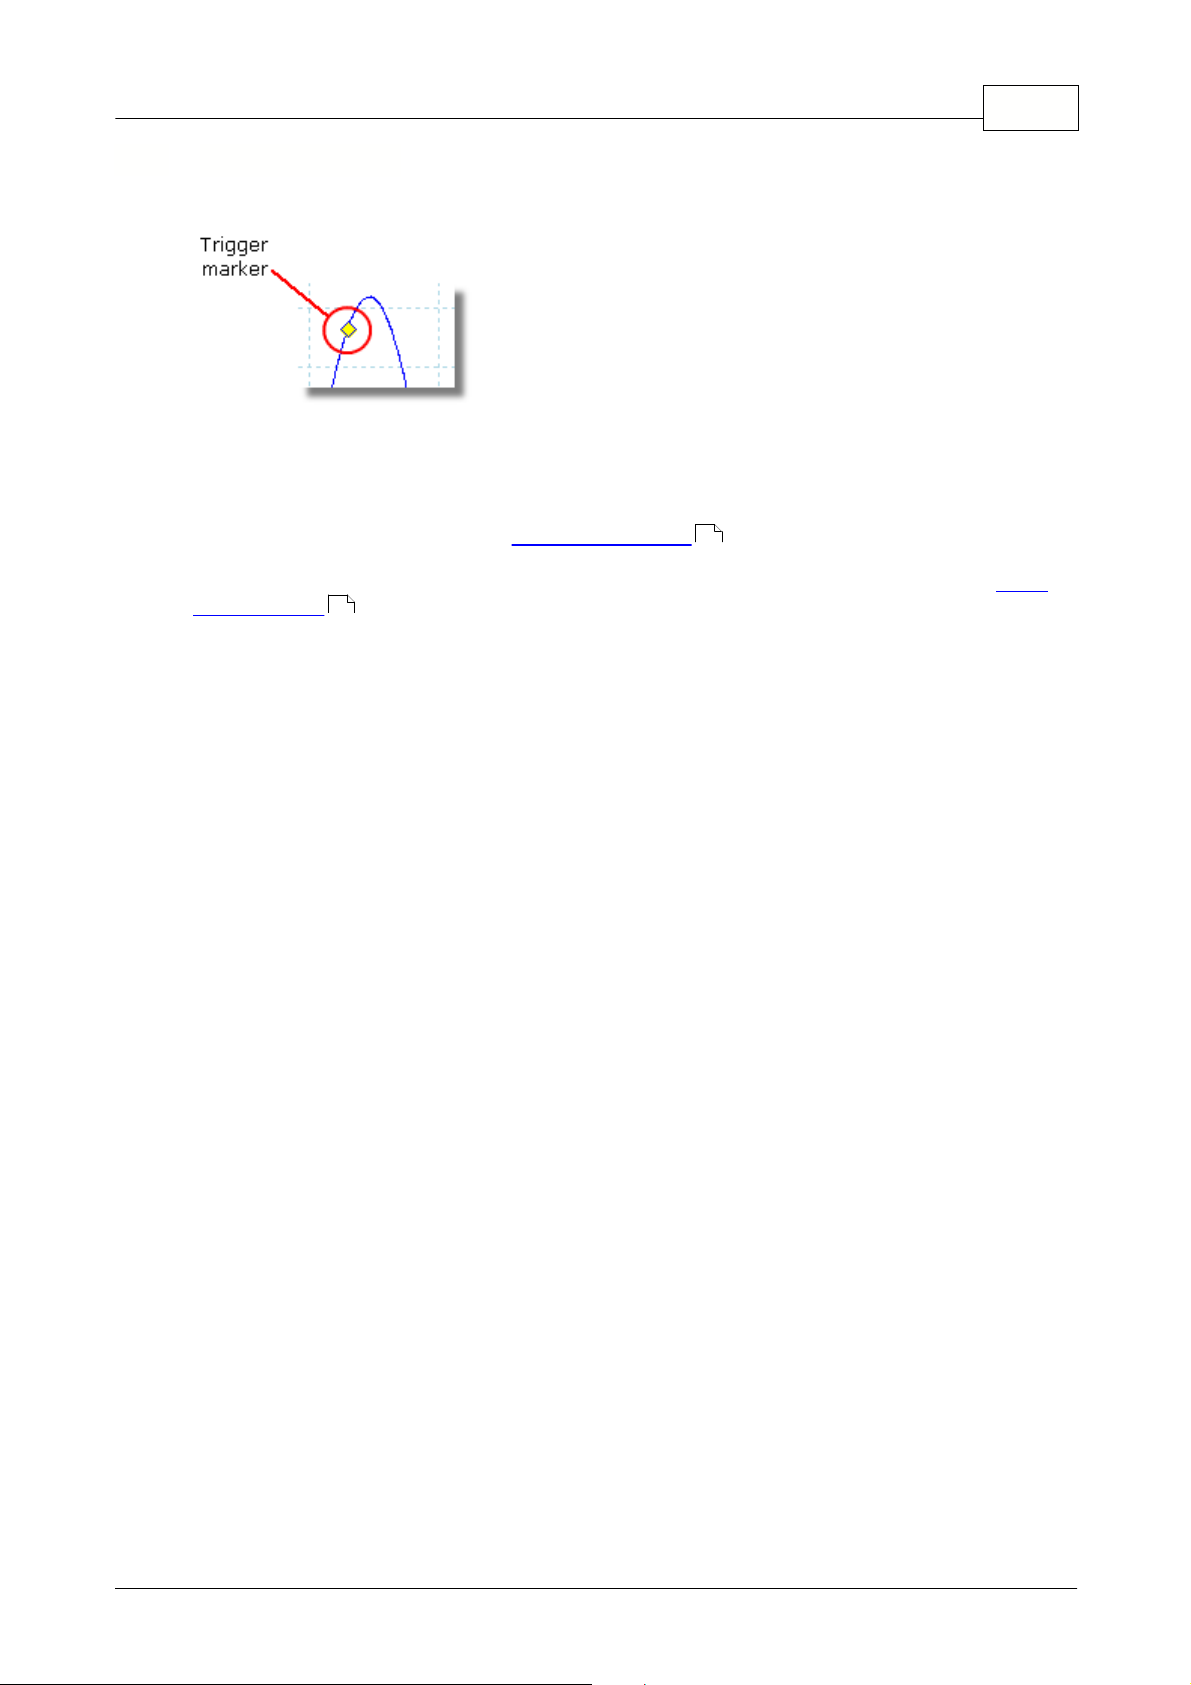
5.14
Trigger marker
The trigger marker shows the level and timing of the trigger point.
The height of the marker on the Y axis shows the level at which the trigger is set, and
its position on the X axis shows the time at which it occurs.
You can move the trigger marker by dragging it with the mouse or, for numerical
control, use the buttons on the Triggering toolbar .
In post-trigger delay mode, the trigger marker is temporarily replaced by the post-
trigger arrow while you adjust the post-trigger delay.
13
57
Copyright 2006 Pico Technology Limited. All rights reserved. PSW044-2.0
Page 20

17
PicoScope 6 User Guide
5.15
Signal rulers
The signal rulers are to help you measure signal levels with respect to ground, or
signal differences, on a scope view .
14
In the scope view above, the two coloured squares to the left of the vertical axis
14
are the ruler drag-handles. You can drag these from the top-left corner to the
positions you want to measure on the waveform. The two horizontal dashed lines are
the signal rulers.
Ruler legend
The table at the top of the view is the ruler legend. In this example, the table shows
that ruler 1 is at 807 millivolts, ruler 2 is at -811.0 millivolts and the difference
between them is -1.618 volts. If you prefer to see the difference as a positive value,
swap the positions of the two rulers by dragging them.
Ruler tooltip
If you move the mouse pointer over one of the rulers, PicoScope displays a tooltip
68
with the ruler number and the signal level of the ruler. You can see an example of this
in the picture above.
Copyright 2006 Pico Technology Limited. All rights reserved.PSW044-2.0
Page 21

PicoScope and oscilloscope primer
18
5.16
Windows, views and viewports
PicoScope's display area contains one or more capture windows . Each one
corresponds to a block of data captured from a scope device . The simplest case is a
single scope device that produces a single capture, with the result shown in a single
capture window.
A capture window contains one or more views . When you first open a capture
window, it contains a single view. You can zoom and pan this to show various
14
58
different waveforms based on the data that the scope device captured. If you wish,
you can add more views to a capture window (how?). Each view is a differently
zoomed and panned section of the same capture.
Multiple views in a capture window are always arranged in a grid. Each location in the
grid is called a viewport, and can be empty or occupied by one or more views.
Upgrading from PicoScope 5
PicoScope 5 allowed you to have multiple scope views. PicoScope 6.0 retains this
ability, although it calls them capture windows. The views feature is new to
9 14
PicoScope 6.0.
9
68
Copyright 2006 Pico Technology Limited. All rights reserved. PSW044-2.0
Page 22
19
PicoScope 6 User Guide
6
Menus
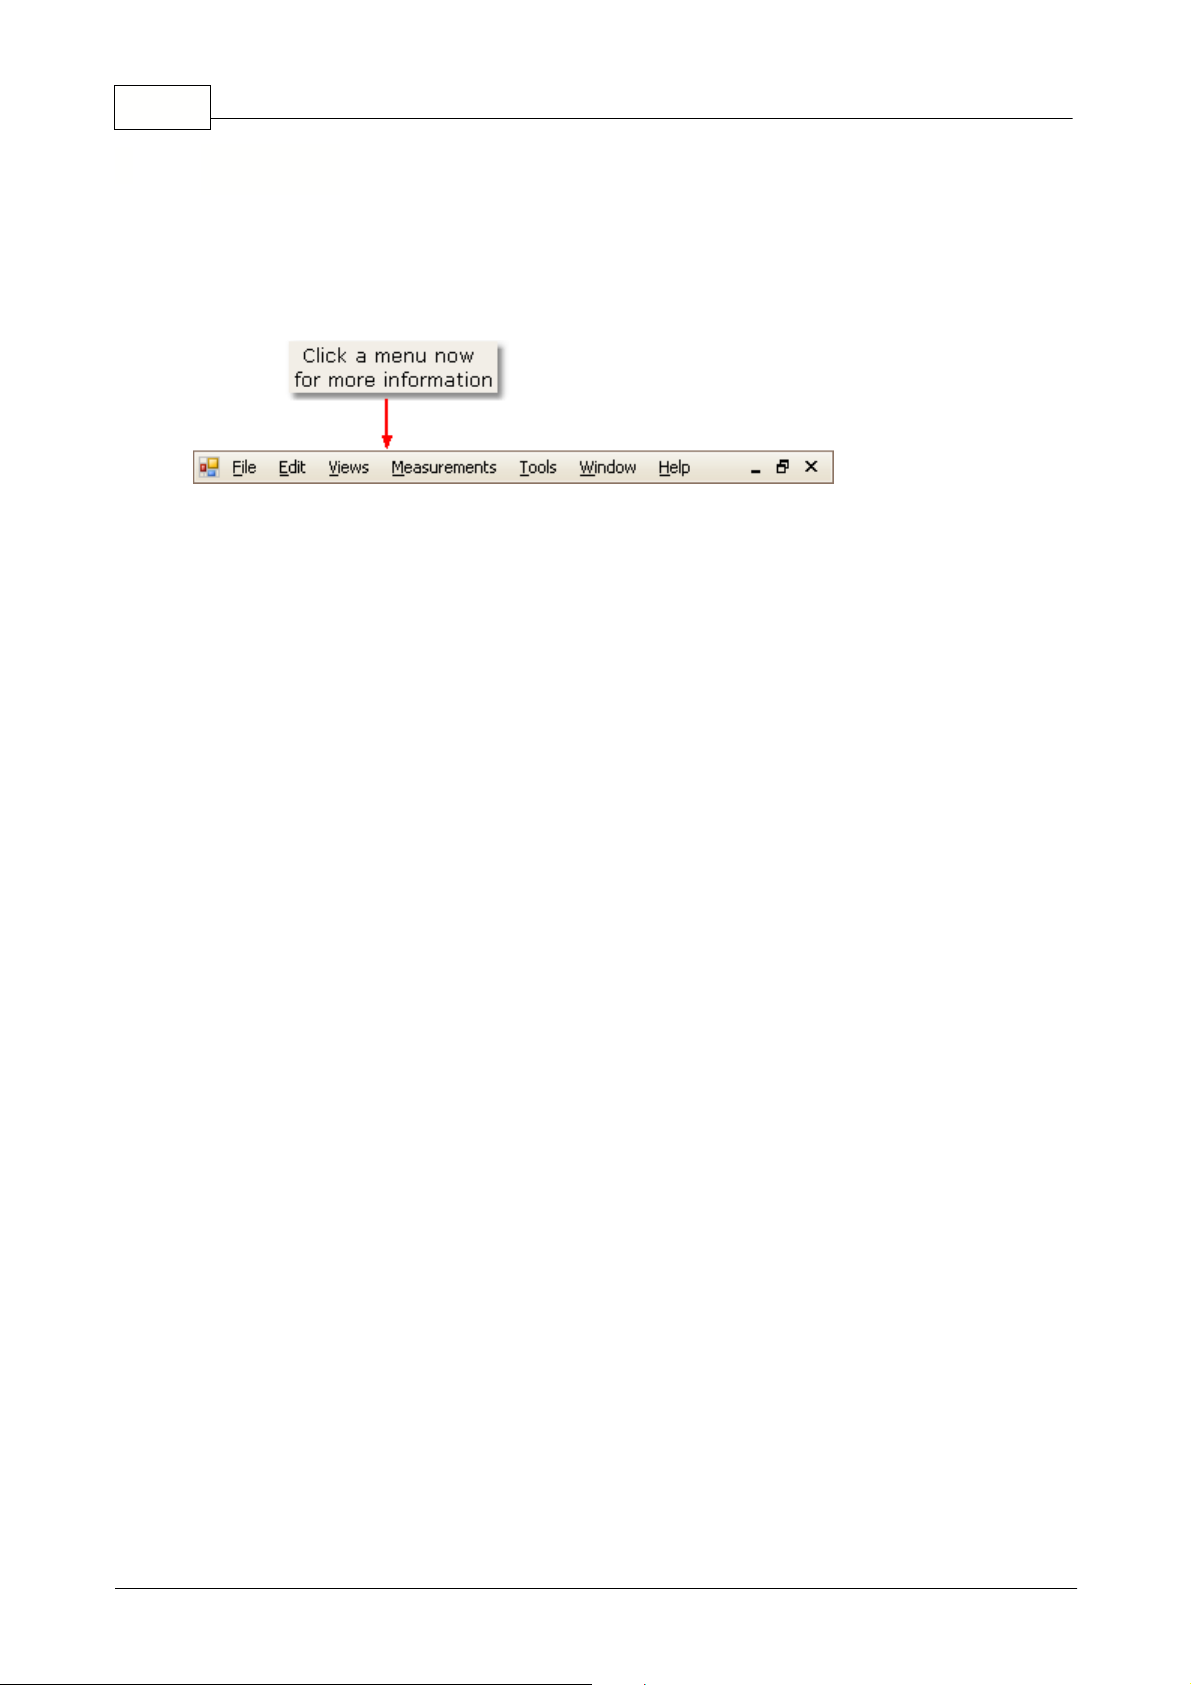
Menus are the quickest way to get to PicoScope's main features. The Menu bar is
always present at the top of the PicoScope main window, just below the window's title
bar. You can click any of the menu items, or press the Alt key and then navigate to
the menu using the cursor keys, or press the Alt key followed by the underlined letter
in one of the menu items.
The list of items in the menu bar may vary depending on the windows that you have
open within PicoScope.
Copyright 2006 Pico Technology Limited. All rights reserved.PSW044-2.0
Page 23
Menus
20
6.1
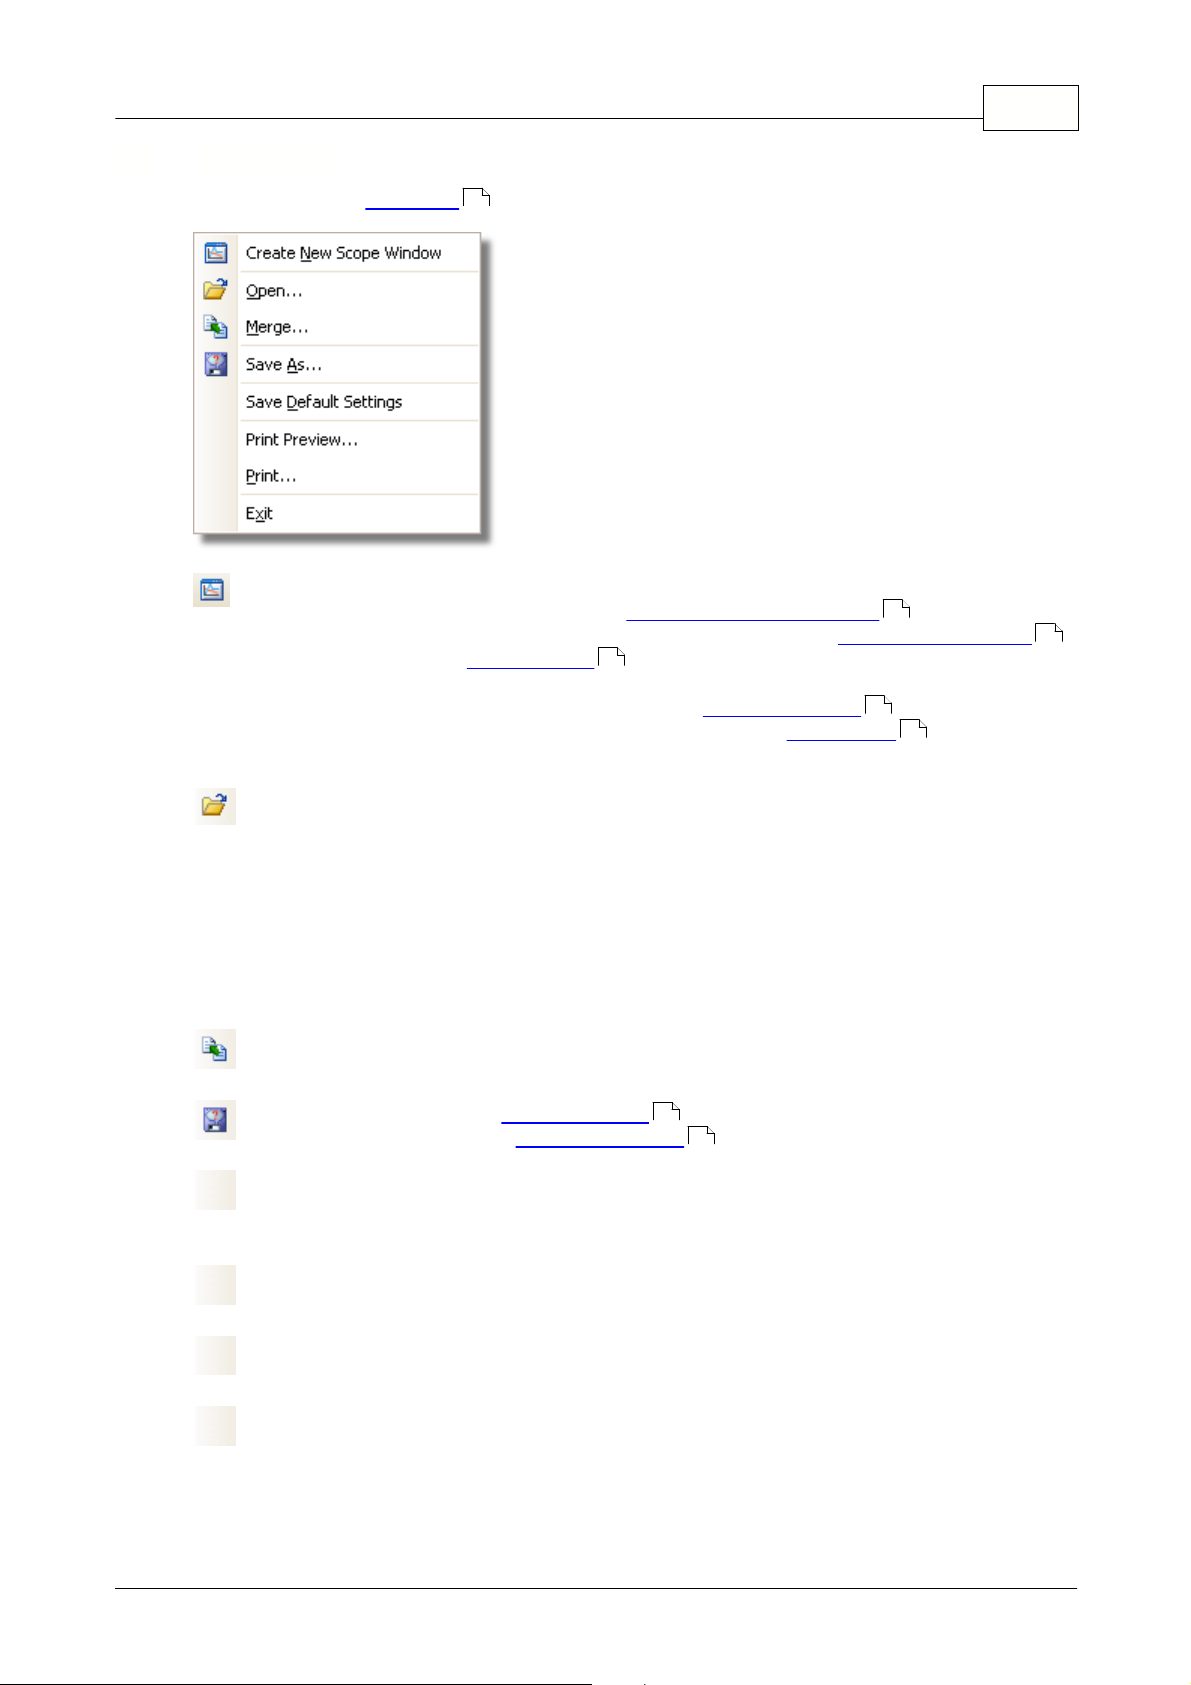
File menu
Click File on the Menu bar .
Create New Scope Window. This command is equivalent to the New
Capture Window button on the Capture Windows toolbar . If PicoScope
has not yet found a scope device, it will first open the Open Device dialog
to ask you which scope device to use; otherwise, it will assume that you
wish to use the same scope device as was used for the previous capture
window. PicoScope will then open a new capture window for the chosen
scope device, and will fill the window with a new scope view . You can
open up to five capture windows.
19
45
46
68
9
14
Open. Allows you to select the file you want to open. PicoScope can open
psdata
and
settings, and
files, which contain both waveform data and scope device
*.psd
*.pssettings
and
*.pss
files, which contain only scope device
*.
settings. You can create your own files using the Save and Save As...
commands, described below. If the file was saved using a different scope
device from the one that is presently connected, PicoScope may need to
modify the saved settings to suit the present device.
Opening a new file will close any capture windows that are currently open.
Merge. Opens a settings or waveforms file without closing any that are
currently open. You cannot exceed a total of ten capture windows.
Save As. Opens the Save As dialog , which allows you to save the settings
and waveforms for all capture windows in various formats.
21
9
Save Default Settings. Saves the current settings so that they become the
defaults. The new default settings will then be loaded the next time you start
PicoScope.
Print Preview. Opens the Print Preview window, which allows you to see
how your workspace will be printed when you select the Print command.
Print. Opens a standard Windows Print dialog, which allows you to choose a
printer, set printing options and then print the selected view.
Exit. Close PicoScope without saving any data.
Copyright 2006 Pico Technology Limited. All rights reserved. PSW044-2.0
Page 24

21
PicoScope 6 User Guide
6.1.1
Save As dialog
The Save As dialog allows you to save your waveforms and settings to a file in
various formats. To open it, go to the File menu and click "Save As".
20
Type your chosen file name in the "File name" box, and then select a file format in the
"Save as type" box. You can save data in the following formats:
Data files (*.psdata) Stores all waveforms and settings from the current
scope device. Can be opened on any computer
running PicoScope.
Settings files (*.pssettings) Stores all settings (but not waveforms) from the
current scope device. Can be opened on any
computer running PicoScope.
CSV (Comma delimited) (*.csv) Stores waveforms as a text file with comma-
separated values. This format is suitable for
importing into spreadsheets such as Microsoft
Excel. The first value on each line is the time
stamp, and it is followed by one value for each
active channel.
Copyright 2006 Pico Technology Limited. All rights reserved.PSW044-2.0
Page 25

Menus
22
Text (Tab delimited) (*.txt) Stores waveforms as a text file with tab-separated
values. The values are the same as those in the
CSV format.
Bitmap Image (*.bmp) Stores the graticule , rulers and waveforms
68 68
in Windows bitmap format. The image is 800
pixels wide by 600 pixels high, in 16 million
colours, and uncompressed. BMP files are suitable
for importing into Windows desktop publishing
programs.
GIF Image (*.gif) Stores the graticule , rulers and waveforms
68 68
in Compuserve GIF format. The image is 800
pixels wide by 600 pixels high, in 256 colours, and
compressed. GIF files are widely used to illustrate
web pages.
PNG Image (*.png) Stores the graticule , rulers and waveforms
68 68
in Portable Network Graphics format. The image is
800 pixels wide by 600 pixels high, in 16 million
colours, and compressed.
Copyright 2006 Pico Technology Limited. All rights reserved. PSW044-2.0
Page 26

23
PicoScope 6 User Guide
6.2
6.2.1
Edit menu
Click Edit on the Menu bar .
Copy as Image. Copies the active view to the clipboard as a bitmap. You
can then paste the image into any application that accepts bitmap images.
Copy as Text. Copies the data in the active view to the clipboard as text.
You can paste the data into a spreadsheet or other application. The text
format is the same as that used by the Save As *.txt command, and is
explained in the Save As dialog topic.
Notes. Opens a Notes area at the bottom of the active capture window.
You can enter any explanatory text that you wish to in this area.
Notes area
19
21
23
A Notes area can be displayed at the bottom of any capture window. You can enter
any text you wish in this area.
To display the Notes area, click on the Edit menu, then select Notes.
Copyright 2006 Pico Technology Limited. All rights reserved.PSW044-2.0
Page 27

Menus
24
6.3
Help menu
Click Help on the Menu bar .
What's This? Select this item, then click on a toolbar button to see a brief help
message on that button. The toolbar must be docked - that is, attached to the
main window - to work with What's This?
Reference Manual. This is the main help manual, containing information on
every menu item, button and dialog in the program.
About PicoScope... Shows information about this version of PicoScope.
19
Copyright 2006 Pico Technology Limited. All rights reserved. PSW044-2.0
Page 28

25
PicoScope 6 User Guide
6.4
Measurements menu
Click Measurements on the Menu bar .
Add measurement. Adds a row to the measurements table , and opens
the Edit Measurement Dialog . You can also find this button on the
Measurements toolbar .
Edit measurement. This takes you to the Edit Measurement Dialog .
You can find this button on the Measurements toolbar , or you can edit a
measurement by double-clicking on a row of the measurements Table .
Delete measurement. Removes the selected row from the measurements
11 52
table . You can also find this button on the Measurements toolbar .
19
52
11
26
26
52
11
Grid font size. Sets the font size for the entries in the measurements
11
table .
Column Auto-width. If this button is pressed, the columns of the
measurements table will continually adjust to fit the contents whenever
11
the table changes. Click again to release the button.
Copyright 2006 Pico Technology Limited. All rights reserved.PSW044-2.0
Page 29

Menus
26
6.4.1
Add / Edit Measurement dialog
This dialog allows you to add a measurement of a waveform to the selected capture
window , or edit an existing measurement. PicoScope automatically refreshes the
measurement every time it updates the waveform. If this is the first measurement for
the capture window, PicoScope will create a new measurements table to display the
measurement; otherwise, it will add the new measurement to the bottom of the
existing table.
Where to find it
Click the Add Measurement or Edit Measurement button on the
Measurements toolbar or in the Views menu, or double-click a measurement in the
measurements table .
9
11
52
11
Channel: Select one of the scope device 's channels to measure.
68
Type: PicoScope can calculate a wide range of measurements for waveforms.
See Measurement Types for details.
Section: You can measure the whole trace, just the section between rulers , or a
63
68
single cycle that you point to using one of the rulers.
Where to find it
Click the Edit Measurement button on the Measurements toolbar or in the
52
Views menu,
Copyright 2006 Pico Technology Limited. All rights reserved. PSW044-2.0
Page 30

27
PicoScope 6 User Guide
6.5
6.5.1
Tools menu
Click Tools on the Menu bar .
Custom Probes: Opens the Custom probes dialog, which allows you to
define new probes and copy, delete, move and edit existing ones.
Preferences: Opens the Preferences dialog , which contains various
options that control PicoScope's behaviour.
Toolbars. Opens the Toolbar menu , which allows you to control which
toolbars appear and which are hidden.
44
Custom Probes dialog
This dialog allows you to define your own probes and set up custom probes . To
open this dialog, choose Custom Probes in the Tools menu or click the
Channel Advanced Options button.
19
27
40
42
10
27
Understanding the probe list
All the probes that PicoScope knows about are listed under three main headings:
Built-in, Library and Loaded. The probe list is preserved between sessions, so that
PicoScope will never forget your custom probes unless you delete them.
Copyright 2006 Pico Technology Limited. All rights reserved.PSW044-2.0
Page 31

Menus
Built-in probes. The built-in probes are supplied by Pico Technology and do not
change unless you download an authorised update from us. As a safeguard,
PicoScope does not allow you to edit or delete these probes. If you want to modify
one of them, you can copy it to your library by clicking Duplicate, and then edit
the copy in your library.
Library probes. These are the probes that you have created using any of the
methods described in this topic. You can edit, delete or duplicate any of these
probes by clicking the appropriate button in this dialog.
Loaded probes. Probes in PicoScope data files
pssettings)
that you have opened appear here until you copy them to your
(*.psdata)
or settings files
library. You cannot edit or delete these probes directly, but you can click Duplicate
to copy them to your library where you can edit them. You can also import probes
from the custom ranges stored in PicoScope 5
*.psd
and
*.pss
files, but these lack
many of the features provided by PicoScope 6. (See "Upgrading from PicoScope 5
2
" for more details.)
Adding a new probe to your library
There are three ways to create a new probe:
1. Create a duplicate of an existing probe as described above.
2. Click New Probe... to define a new probe.
28
(*.
6.5.2
3. Click Import to load a probe definition from a
*.psprobe
file and add it to your
library. These files are normally supplied by Pico, but you can also create your own
by defining a new probe and then clicking Export.
The second and third methods open the Custom Probe Wizard to guide you through
28
the probe definition process.
Custom Probe wizard
The Custom probe wizard allows you to define custom probes and set up custom
ranges.
The first dialog in the series is either the Create a new Custom Probe dialog or the
Edit an existing Custom Probe dialog .
30
10
29
Copyright 2006 Pico Technology Limited. All rights reserved. PSW044-2.0
Page 32

29
PicoScope 6 User Guide
6.5.2.1
Create New Custom Probe dialog
This dialog introduces you to the process for creating a new custom probe. To open it,
click the New Probe button in the Custom Probes dialog .
27
How to use the dialog
Click Next to continue to the Probe Output Units dialog .
31
Copyright 2006 Pico Technology Limited. All rights reserved.PSW044-2.0
Page 33

Menus
30
6.5.2.2
Edit Existing Custom Probe dialog
This dialog introduces you to the process for editing an existing custom probe. Get
here by clicking the Edit button in the Custom Probes dialog .
27
How to use the dialog
Click Next to continue to the Probe Output Units dialog , where you can edit the
31
custom probe.
Click Jump forward... if you have already set up the custom probe's basic
characteristics and want to add or change a custom range manually.
Copyright 2006 Pico Technology Limited. All rights reserved. PSW044-2.0
Page 34
31
PicoScope 6 User Guide
6.5.2.3
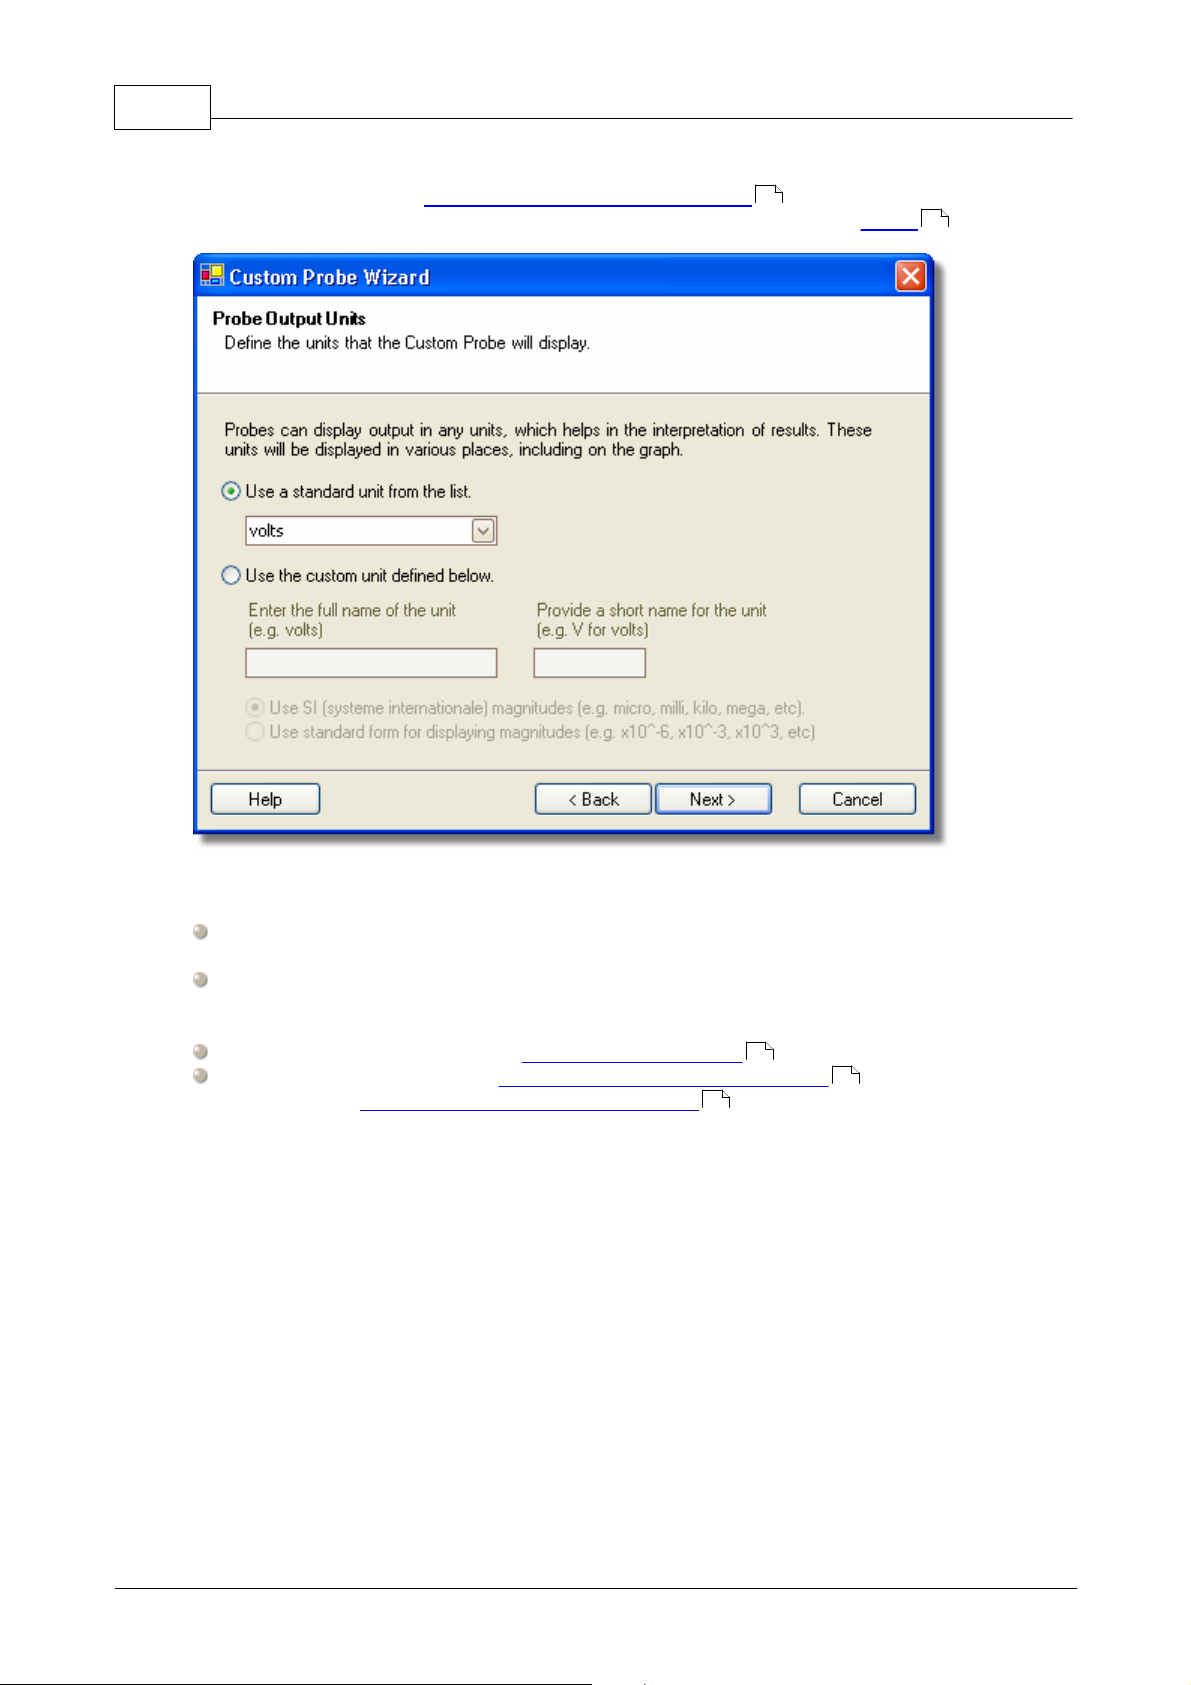
Probe Output Units dialog
This dialog follows the Create new Custom Probe dialog . It allows you to choose the
units that PicoScope will use to display the output of your custom probe .
29
68
How to use the dialog
To choose a standard SI unit, click Use a standard unit from the list and select
one from the list.
To enter a custom unit, click Use the custom unit defined below and type the
unit name and symbol.
Click Next to continue to the Scaling Method dialog .
Click Back to return to the Create New Custom Probe dialog if this is a new
probe, or the Edit Existing Custom Probe dialog if this is an existing probe.
32
29
30
Copyright 2006 Pico Technology Limited. All rights reserved.PSW044-2.0
Page 35

Menus
32
6.5.2.4
Scaling Method dialog
This dialog follows the Probe Output Units dialog . It allows you to define the
31
characteristic that PicoScope will use to convert the probe's voltage output to a
measurement on the display.
How to use the dialog
If you do not require any scaling or offset, click the Don't apply any scaling
button.
If the probe requires linear scaling, click the Use a linear equation button and
enter the gradient (or scale factor) m and the offset c in the equation y = mx + c,
where y is the displayed value and x is the probe's voltage output.
If you wish to apply a nonlinear function to the probe's output, choose Use a look-
up table..., then click the Create a Lookup Table... button to create a new
lookup table. This will take you to the Lookup-table Scaling dialog .
Click Next to continue to the Range Management dialog .
Click Back to return to the Probe Output Units dialog .
34
31
33
Copyright 2006 Pico Technology Limited. All rights reserved. PSW044-2.0
Page 36
33
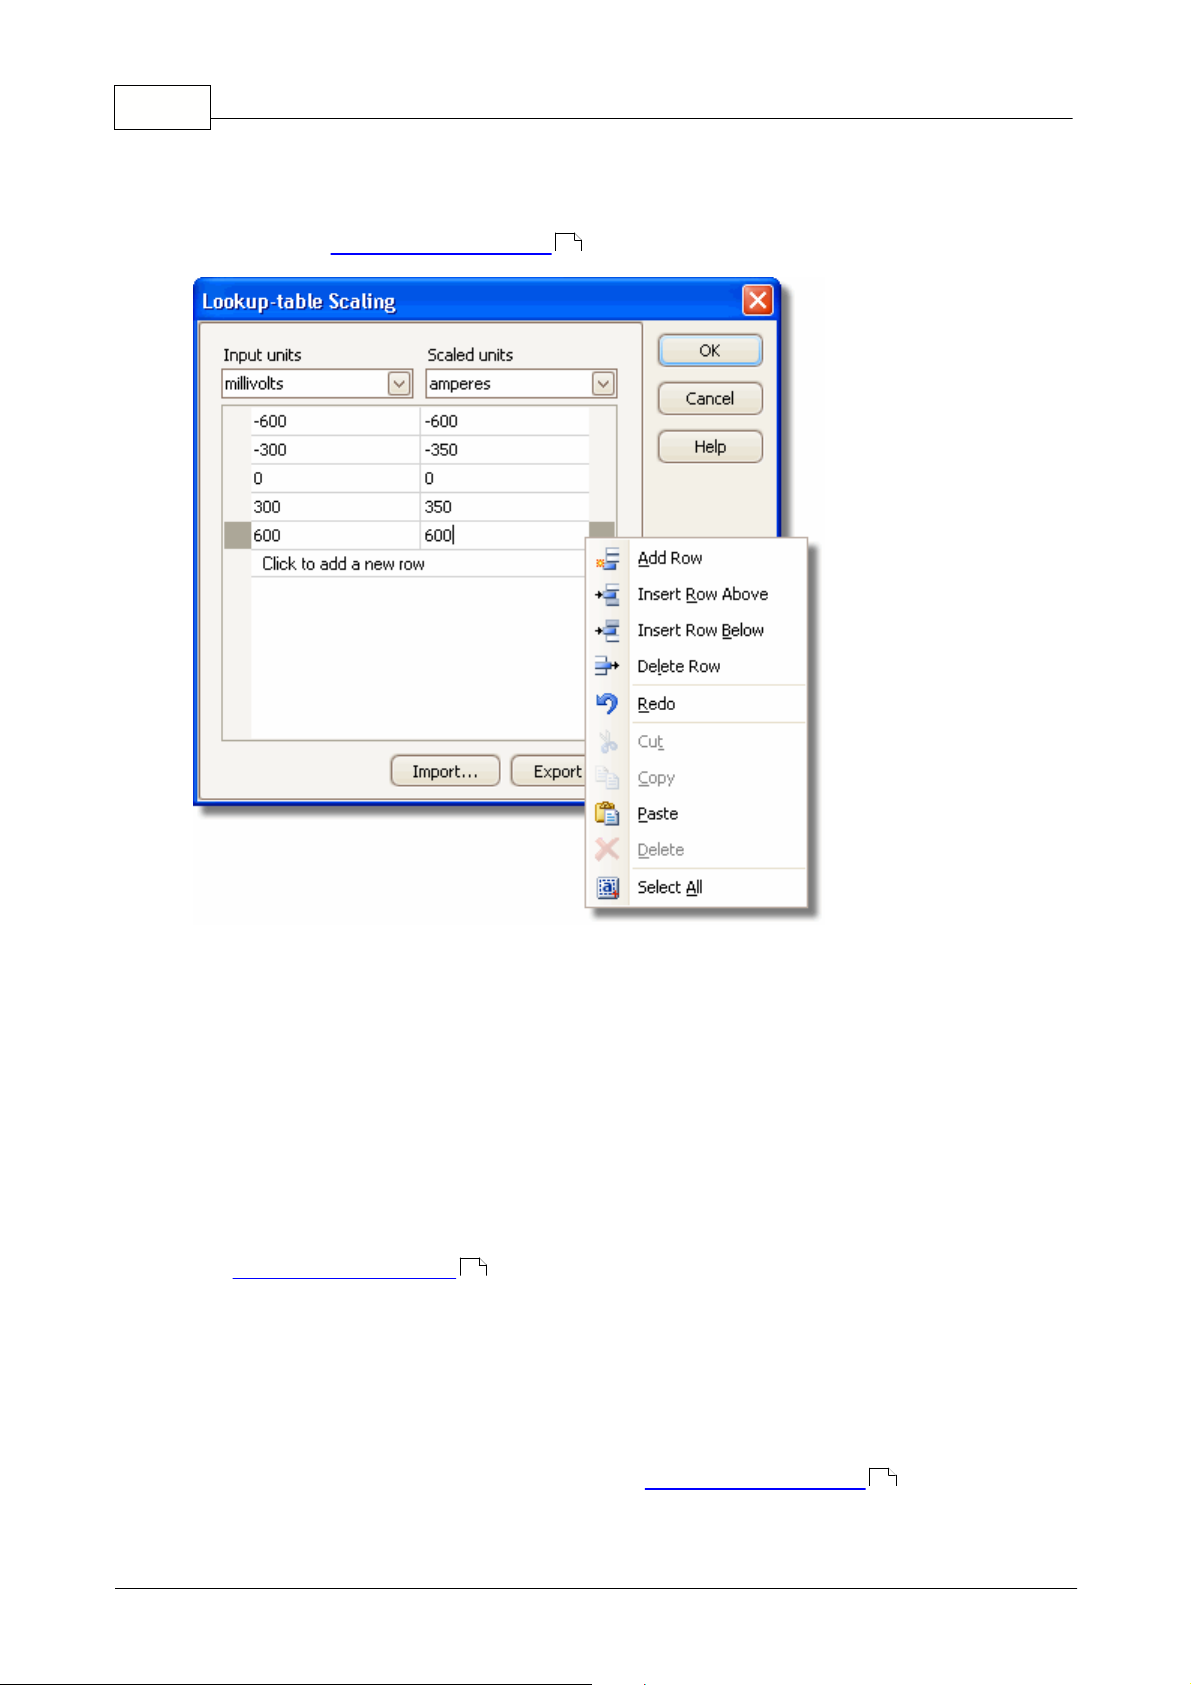
6.5.2.4.1 Lookup-table Scaling dialog
PicoScope 6 User Guide
This dialog allows you to enter a look-up table to calibrate a custom probe. You can
get here by clicking the Create a Look-up Table button or Edit the Lookup Table...
button in the Scaling Method dialog .
32
Editing the Look-up Table
First, select suitable values in the Input units and Scaled units drop-down boxes.
For example, if your probe is a current clamp that outputs one millivolt per ampere
over the range -600 to +600 amperes, select Input units of millivolts and Output
units of amperes.
Next, enter some data in the scaling table. Click the first empty cell at the top of the
table and type "-600", then hit the Tab key and type "-600". When you are ready to
enter the next pair of values, press the Tab key again to start a new row. You can also
right-click on the table to obtain a more detailed menu of options, as shown in the
picture. In the example above, we have entered a slightly nonlinear response; if the
response had been linear then it would have been easier to use the linear option in
the Scaling Method Dialog .
32
Import/Export
Using the Import and Export buttons, you can fill the look-up table from data in a
comma-separated or tab-delimited text file, and save the look-up table to new file.
Finishing
Clicking OK or Cancel will return you to the Scaling Method dialog .
32
Copyright 2006 Pico Technology Limited. All rights reserved.PSW044-2.0
Page 37

Menus
34
6.5.2.5
Range Management dialog
This dialog follows the Scaling Method dialog . It allows you to override PicoScope's
32
automatic range-creation feature for custom probes. In most cases, the automatic
procedure will be ideal.
How to use the dialog
If you select Let the software manage my ranges for me automatically, then
clicking Next will take you to the Custom Probe Identification dialog .
38
PicoScope's automatic ranges should be ideal for most applications.
If you select I will manage the Custom Probe Ranges manually, clicking Next
will take you to the Manual Ranges Setup dialog .
Click Back to return to the Scaling Method dialog .
35
32
What is Auto-ranging?
When the Auto-ranging function is selected, PicoScope continually monitors the input
signal and adjusts the range when necessary to allow it to display the signal with
maximum resolution. This function is available on all standard ranges, and can be
used with custom ranges only if you select Let the software manage my ranges
for me automatically in this dialog.
Copyright 2006 Pico Technology Limited. All rights reserved. PSW044-2.0
Page 38
35
PicoScope 6 User Guide
6.5.2.6
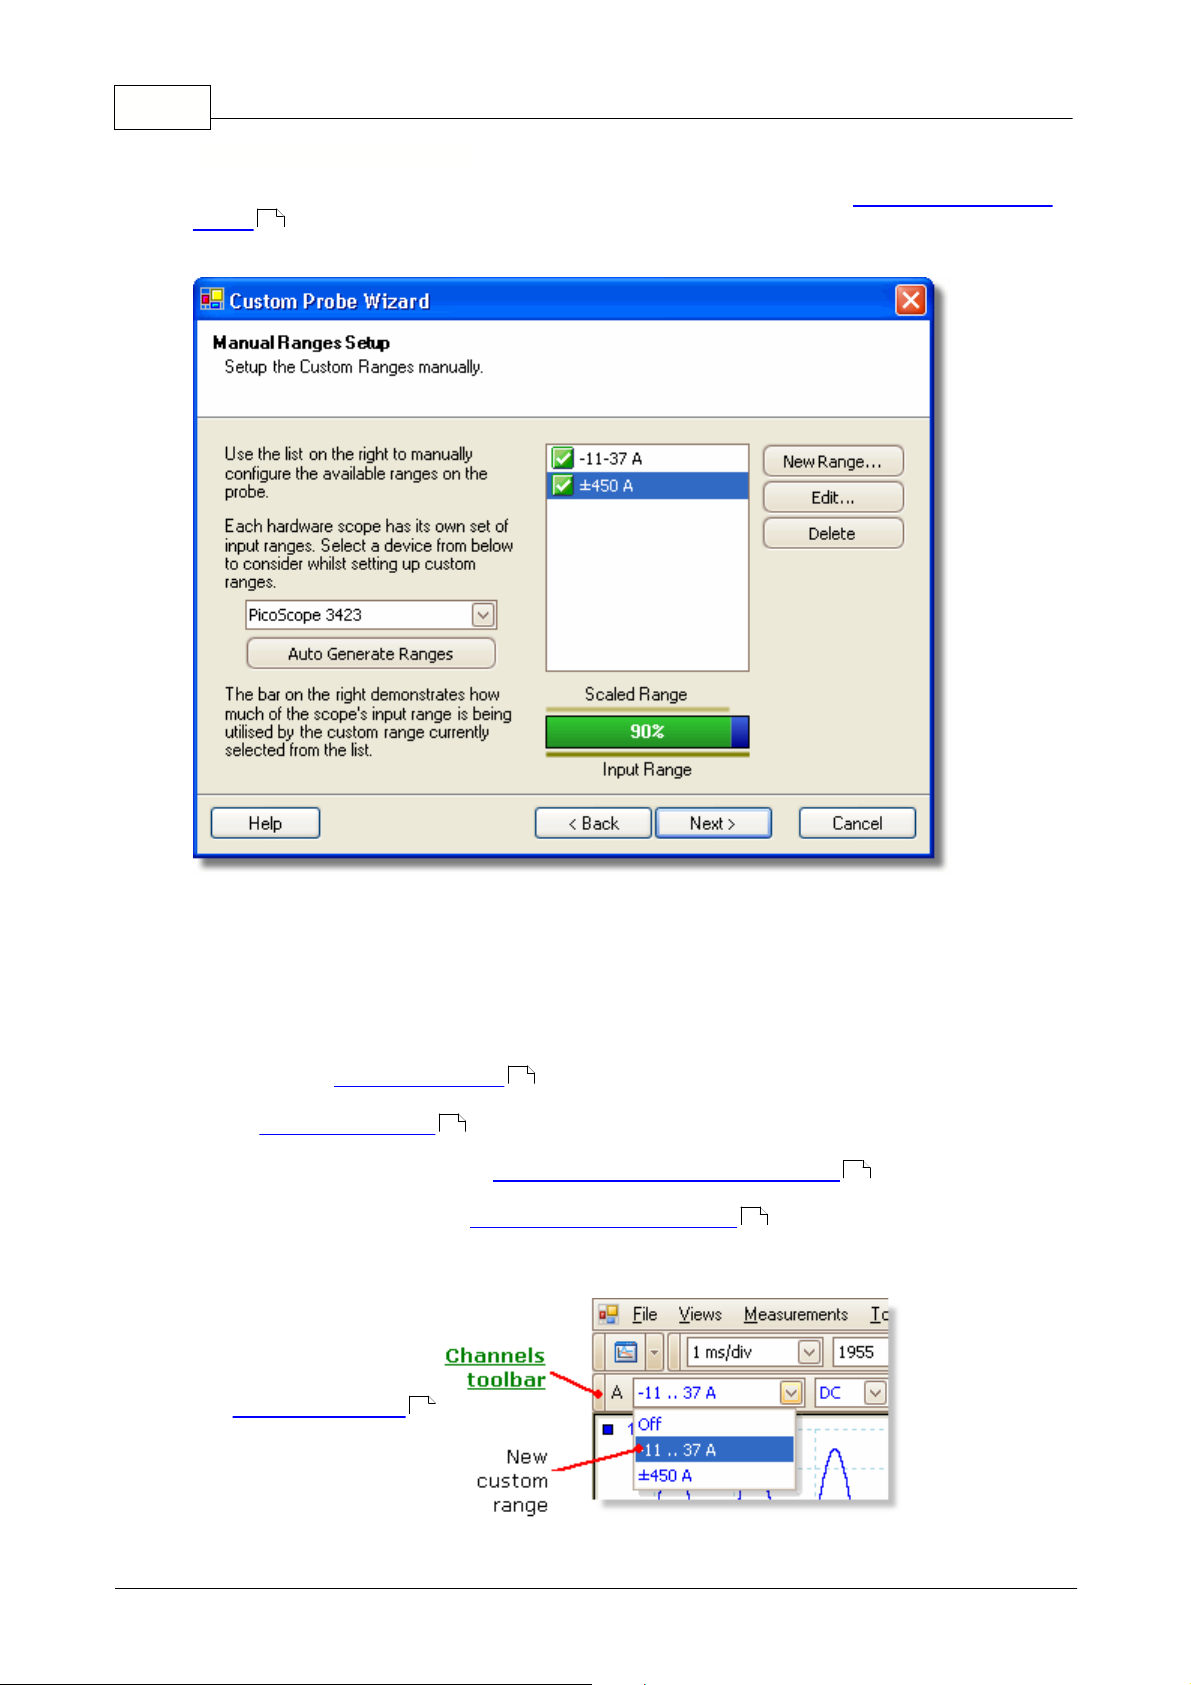
Manual Ranges Setup dialog
This dialog appears when you select the Advanced option in the Range Management
dialog and then click Next >. It allows you to create ranges manually for your
34
custom probe.
How to use the dialog
If you wish, you can click Auto Generate Ranges and the program will create a
number of ranges for the selected device. This will create the same list of ranges that
you would have obtained by selecting Let the software manage my ranges for me
automatically in the previous dialog. When you select a range, a diagram below the
list will show its relationship to the scope device's input range — this is explained
further under Edit range dialog . You can then edit the ranges by clicking Edit, or
36
you can also add a new range by clicking New Range. Both of these buttons take you
to the Edit Range dialog .
Click Next to continue to the Custom Probe Identification dialog .
Click Back to return to the Range Management dialog .
36
38
34
How to use a new custom range
After you have created
a custom range, it will
appear in the dropdown list of ranges in
the channels toolbar,
47
like this:
Copyright 2006 Pico Technology Limited. All rights reserved.PSW044-2.0
Page 39

6.5.2.6.1 Edit Range dialog
This dialog allows you to edit a manual range for a custom probe.
You can get here by clicking the Edit or New Range buttons in the Manual Ranges
Setup dialog .
Menus
35
36
Automatic mode
If you leave the "Automatic" radio button pressed, the program will automatically
determine the best hardware input range for the device as you change the Scaled
range limits. This is the best mode to use for almost all ranges. You should set the
Scaled range limits to the maximum and minimum values you wish to see on the
vertical axis of the scope display.
Fixed range mode
If you press the "Hardware input range" radio button and select a hardware input
range from the drop-down box, PicoScope will then use that hardware input range
whatever scaled range limits you choose. Set the upper and lower scaled range limits
to the limits you wish to appear at the top and bottom of the vertical axis in
PicoScope's scope view.
What is an input range?
An input range is the signal range, usually in volts, on the input channel of the scope
device . Your scaled range should match this as closely as possible to make the
68
most of the scope's resolution.
What is a scaled range?
The scaled range is the range that will appear on the vertical axis of the scope display
when the probe is selected.
The scaling that you chose on the Scaling Method page defines the relationship
32
between the input range and the scaled range. This dialog enables you to set up
ranges to display the scaled data on the scope view.
Copyright 2006 Pico Technology Limited. All rights reserved. PSW044-2.0
Page 40

37
PicoScope 6 User Guide
The range utilisation bar
This diagram at the bottom of the dialog represents the relationship between the
scaling and the hardware input range of the scope device
.
• Green - The section of the input range that is used by the scaled range. This
should be as large as possible, to maximise the use of the scope device's
resolution.
• Blue - Areas of the input range that are not being used. These indicate wasted
resolution.
• Grey - Parts of the scaled range that are not covered by the input range. These
will result in wasted space on the graph. The range utilisation bar may not
represent these areas accurately when non-linear scaling is being used, so you
should always test the scaled range limits on the scope view.
Finishing
Clicking OK or Cancel will return you to the Manual Ranges Setup dialog .
35
Copyright 2006 Pico Technology Limited. All rights reserved.PSW044-2.0
Page 41

Menus
38
6.5.2.7
Custom Probe Identification dialog
This dialog follows the Range Management dialog . It allows you to enter text to
34
identify the custom probe.
How to use the dialog
Click Back to return to the Range Management dialog (or the Manual Ranges Setup
dialog if you chose manual setup).
35
34
The probe name will appear in the probe list.
The description is not used in the present version of the software.
Fill in the text fields and click Next to continue to the Custom Probe Finished dialog
39
.
Copyright 2006 Pico Technology Limited. All rights reserved. PSW044-2.0
Page 42

39
PicoScope 6 User Guide
6.5.2.8
Custom Probe Finished dialog
This dialog follows the Custom Probe Identification dialog . It displays a summary of
38
the custom probe that you have just set up.
How to use the dialog
Click Back to return to the Custom Probe Identification dialog .
38
Click Finish to accept your custom probe settings and return to the Custom Probes
dialog .
27
Copyright 2006 Pico Technology Limited. All rights reserved.PSW044-2.0
Page 43

Menus
40
6.5.3
6.5.3.1
Preferences dialog
This dialog allows you to set miscellaneous options for the PicoScope software. Click
one of the tabs on the screen shot below to learn more.
Where to find it
Click the Preferences command in the Tools menu on the Menu bar .
General dialog
This dialog contains general controls for PicoScope.
27 19
Reset: Click this button to restore any missing dialogs that you asked PicoScope not
to show again.
Where to find it
Click the Preferences command in the Tools menu on the Menu bar .
Copyright 2006 Pico Technology Limited. All rights reserved. PSW044-2.0
27 19
Page 44

41
PicoScope 6 User Guide
6.5.3.2
Performance dialog
The performance settings limit the speed at which PicoScope captures data from the
scope device. The other PicoScope settings, the type of scope device and the speed
68
of the computer will all affect whether this limit can actually be reached. PicoScope
automatically selects the appropriate limit according to whether your computer is
running on batteries or on mains (line) power.
The settings are in captures per second. By default, the capture rate is set to
"Unlimited" when your computer is running on AC Mains power, for maximum
performance. If other applications run too slowly on your PC whilst PicoScope is
capturing, then reduce the capture rate limit. When your computer is running on
Battery power, PicoScope imposes a performance limit to save the battery. You can
increase this limit manually, but this will cause the battery power to drain very
quickly.
Where to find it
Click the Preferences command in the Tools menu on the Menu bar .
27 19
Copyright 2006 Pico Technology Limited. All rights reserved.PSW044-2.0
Page 45

Menus
42
6.6
Toolbar menu
This menu lists the toolbars and allows you to display or hide each one.
Where to find it
Right-click on any toolbar or on the background of the toolbar area. The
Customization dialog has a similar menu on its Toolbars page .
48 49
44
44
How to use it
Click one of the ticks to remove a toolbar, or click in the empty margin next to a
toolbar name to add that toolbar.
Copyright 2006 Pico Technology Limited. All rights reserved. PSW044-2.0
Page 46

43
PicoScope 6 User Guide
6.7
Window menu
Click Window on the Menu bar .
The commands in this menu instruct PicoScope to arrange the capture windows
within its main window.
Tile Horizontal: Arranges the capture windows in a grid that fills the main window,
making the capture windows as wide as possible.
Tile Vertical: Arranges the capture windows in a grid that fills the main window,
making the capture windows as tall as possible.
Cascade: Sets all capture windows to a standard size and arranges them in
an overlapping pattern.
19
9
Arrange Icons: Arranges any minimised capture windows in a row at the bottom of
the main window.
Copyright 2006 Pico Technology Limited. All rights reserved.PSW044-2.0
Page 47

Toolbars
44
7
Toolbars
A toolbar is a collection of buttons and controls with related functions. The
Measurements toolbar , for example, looks like this:
Toolbars are normally stored, or docked, in rows at the top and bottom edges of the
window, but you can drag them to new locations if you wish. If you drop them on any
of the four edges of the main window, they attach themselves to the edge. (They are
then said to be "docked".) If you drop them anywhere else, they become individual
"undocked" windows with their own close button, like this:
If you have closed a toolbar and want to reopen it, right-click anywhere in the toolbar
area to open the Toolbar menu , then select the desired toolbar from the list.
Customizing
You can customize some of the toolbars by clicking their menu button ( or ) to
open the Customization dialog . You can also right-click on any of the toolbars or
the toolbar background to open the Toolbar menu .
52
42
48
42
Copyright 2006 Pico Technology Limited. All rights reserved. PSW044-2.0
Page 48

45
PicoScope 6 User Guide
7.1
Buffer Navigation toolbar
The Buffer Navigation toolbar allows you to select one waveform from the buffer of
stored waveforms.
The waveform buffer
When you click the Start button , PicoScope clears the waveform buffer and then
adds a new waveform every time the scope device captures data, until the buffer is
full or you click the Stop button .
You can review the waveforms stored in the buffer using these buttons:
First waveform button. Displays waveform 1.
Previous waveform button. Displays the previous waveform in the
buffer.
Waveform number indicator. Shows which waveform is currently
displayed, and how many waveforms the buffer holds. You can edit the
number in the box and press Enter, and PicoScope will jump to the
specified waveform.
56
56
7.2
Next waveform button. Displays the next waveform in the buffer.
Last waveform button. Displays the last waveform in the buffer.
Capture Windows toolbar
The Capture Window toolbar allows you to open a capture window .
The toolbar contains the following button:
New Capture Window button. If PicoScope has not yet found a scope
device, clicking this button first opens the Open Device dialog to allow
you to select a scope device , then opens a new capture window for
68 9
the selected scope device. If a capture window is already open, this button
simply opens another capture window for the same scope device. To
switch scope devices, you must close and then restart PicoScope.
9
46
Copyright 2006 Pico Technology Limited. All rights reserved.PSW044-2.0
Page 49

Toolbars
46
7.2.1
Open Device dialog
When PicoScope is not sure which scope device to use, it displays a list of all the
units attached to your computer and allows you to select which one to use.
68
Where to find it
PicoScope always tries to locate the correct scope device to use without asking you.
This dialog appears only there is no suitable scope, or when there is more than one
scope and you have not yet specified which one to use.
See "How to change to a different scope device " if you wish to switch to a different
61
scope device later.
You will also see this dialog if you click the New Capture Window button when no
45
scope device is connected.
Procedure
To restrict the selection to a particular series of devices, click on the device dropdown box and select a device series; otherwise, click the Find All button.
Wait for a list of devices to appear in the grid.
Select one device and click the OK button.
PicoScope will open a new capture window and scope view for the selected
9 14
scope device.
Use the toolbars to set up the scope device and the scope view to display
44 68 14
your signals.
Demo mode
To experiment with PicoScope with no scope device connected, choose one of the
Demo devices from the drop-down list. The Demo Signals dialog will then appear,
68
59
allowing you to set up one or more test signals.
Copyright 2006 Pico Technology Limited. All rights reserved. PSW044-2.0
Page 50

47
PicoScope 6 User Guide
7.3
Channel Setup toolbar
The Channel Setup toolbar controls the settings for each vertical input channel .
The screen shot below shows the toolbar for a four-channel scope device , but
68
different scope devices may have different numbers of channels.
Each channel has its own set of buttons:
Scale Control. Determines the maximum and minimum signal
levels at the top and bottom of the Y axis for this channel. The
number of options depends on the selected scope device and
probe . If you select Auto, PicoScope will continually adjust the
68
vertical scale so that the height of the waveform fills as much of
the view as possible.
Coupling Control. Selects AC coupling or DC coupling .
68 68
Advanced Options button. Opens the Probe drop-down menu
to allow you to select a probe for this channel.
68
68
68
47
7.3.1
Probe Drop-Down menu
The Probe drop-down menu appears when you click the Advanced Options
button on the Channels toolbar . Use it to tell PicoScope what type of probe is
connected to a channel. By default, the probe is assumed to be x1, which means that
a one-volt signal at the input to the probe will appear as one volt on the display.
Expand probe list. Click this to select from a list of probes.
Open Custom Probes dialog. The Custom Probes dialog allows you to edit
your library of custom probes.
47
27
Copyright 2006 Pico Technology Limited. All rights reserved.PSW044-2.0
Page 51
Toolbars
48
7.4
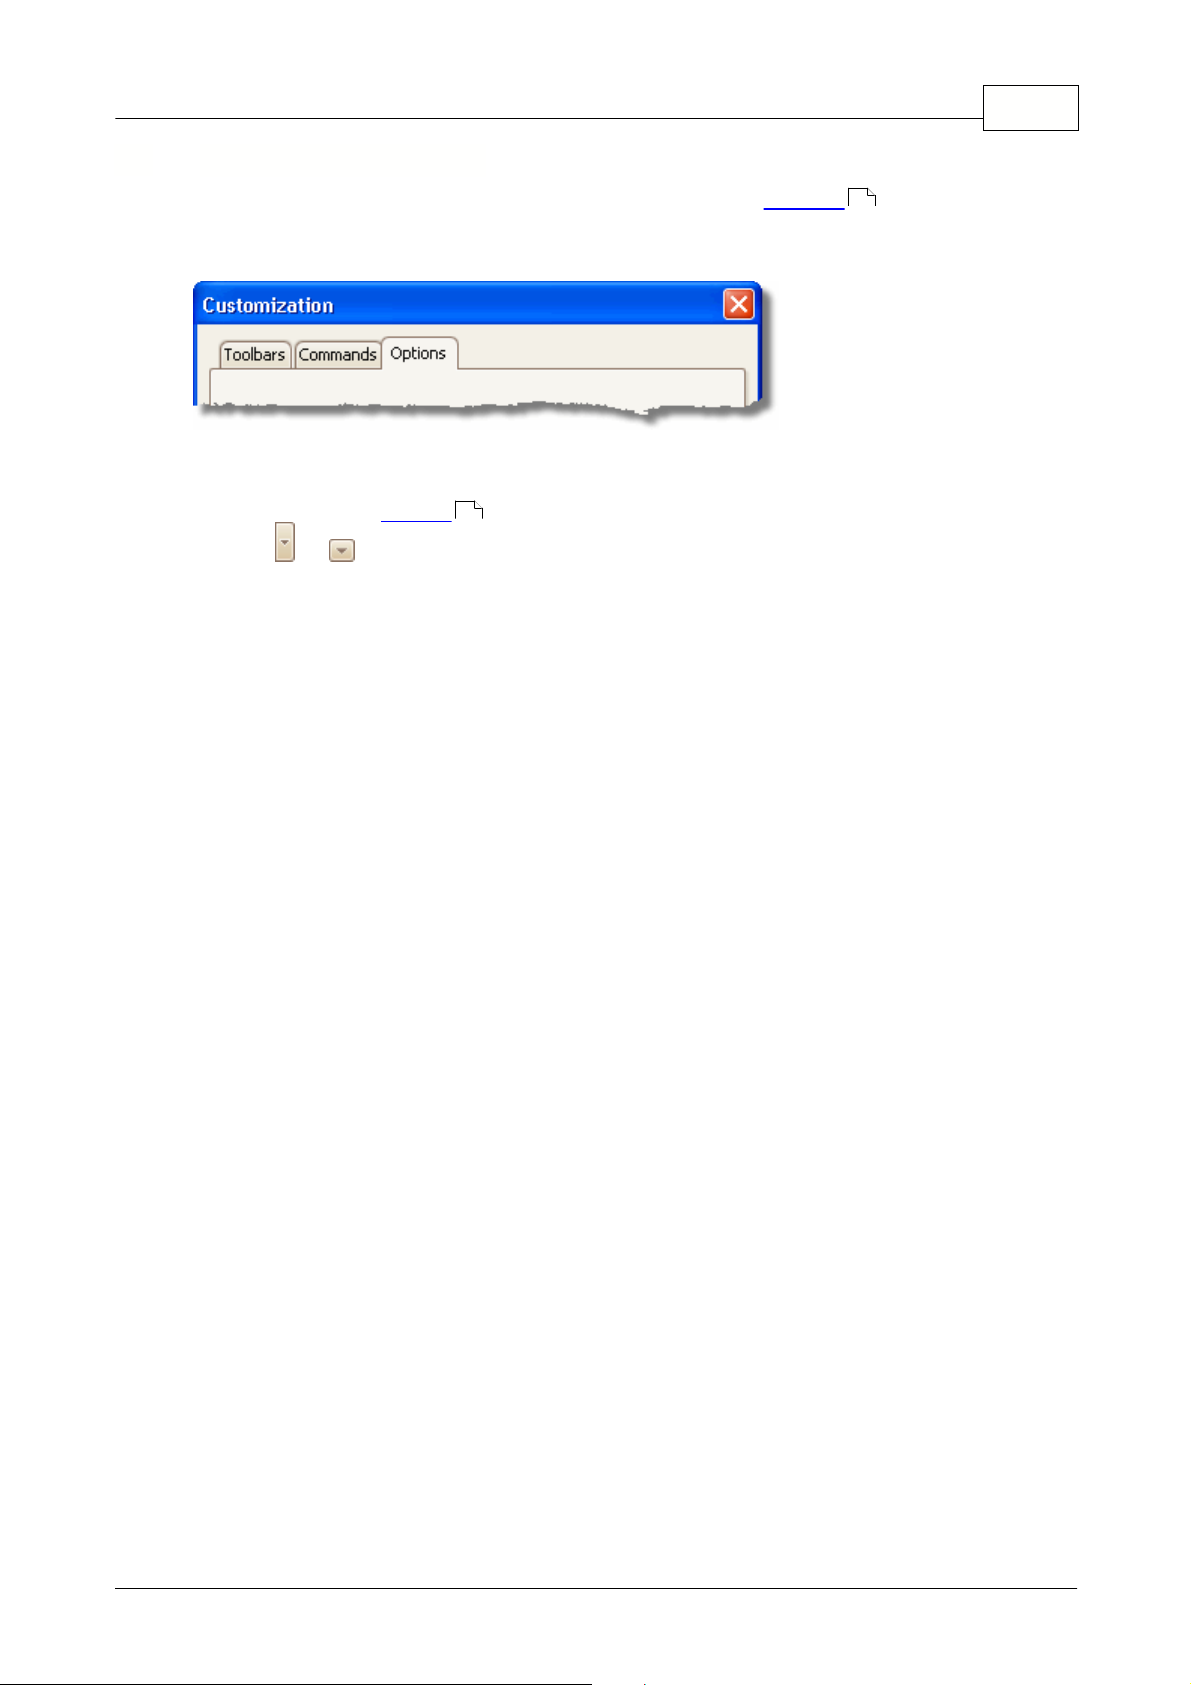
Customization dialog
The Customization dialog allows you to customize the toolbars . Click on one of
the tabs in the screen shot below for more information on the relevant page of the
dialog.
Where to find it
Right-click on any toolbar or on the toolbar background area, or click the menu
44
button ( or ) on any toolbar, then select the Customize command.
44
Copyright 2006 Pico Technology Limited. All rights reserved. PSW044-2.0
Page 52

49
PicoScope 6 User Guide
7.4.1
Customization Toolbars page
The Toolbars page of the Customization dialog allows you to make the toolbars
visible or invisible.
48 44
Checkboxes: Tick or clear the checkboxes to make each toolbar appear or
44
disappear.
New: Create an empty toolbar, with your choice of name, which you can
populate with buttons and controls using the Commands tab of this
dialog box.
Rename: Change the name of a toolbar that you have created. You cannot
rename the standard toolbars.
Delete: Remove the selected toolbar. You cannot delete the standard toolbars.
Reset: Restore the selected toolbar to its default state.
Copyright 2006 Pico Technology Limited. All rights reserved.PSW044-2.0
Page 53

Toolbars
50
7.4.2
Customization Commands page
The Commands tab of the Customization dialog allows you to add commands to,
or remove them from, the toolbars .
44
48
To add a command, select its category from the Categories list, then drag it from
the Commands list to the appropriate toolbar.
To remove a command, drag it from its toolbar and drop it anywhere on the
Customization dialog.
Copyright 2006 Pico Technology Limited. All rights reserved. PSW044-2.0
Page 54

51
PicoScope 6 User Guide
7.4.3
Customization Options page
The Options tab of the Customization dialog controls the appearance of the
Toolbars .
44
48
Always show full menus. PicoScope can hide the least-used commands in its menus
to save space. Tick this box if you do not want it to do this.
Show full menus after a short delay. If this box is ticked, PicoScope first shows
abbreviated menus, then after a short delay changes to the full menu.
Reset my usage data. If you are using abbreviated menus and some of the
commands you want to use have disappeared, click this button to restore all the
hidden commands.
Large icons. Increase the size of all the toolbar icons.
Show ScreenTips on toolbars. If this box is ticked, PicoScope displays tool tips
(short explanatory messages) whenever you point to a toolbar control or button.
44
Show shortcut keys in ScreenTips. Some toolbar controls and buttons have
shortcut keys (combinations of keys that you can press to achieve the same effect).
You can choose whether or not to be reminded of these shortcuts whenever a
ScreenTip appears.
Menu animations. This option lets you choose what happens when you click on a
menu title in the menu bar . You can make the menu appear instantly, or you can
19
experiment with other animation effects.
Copyright 2006 Pico Technology Limited. All rights reserved.PSW044-2.0
Page 55
Toolbars
52
7.5
7.6
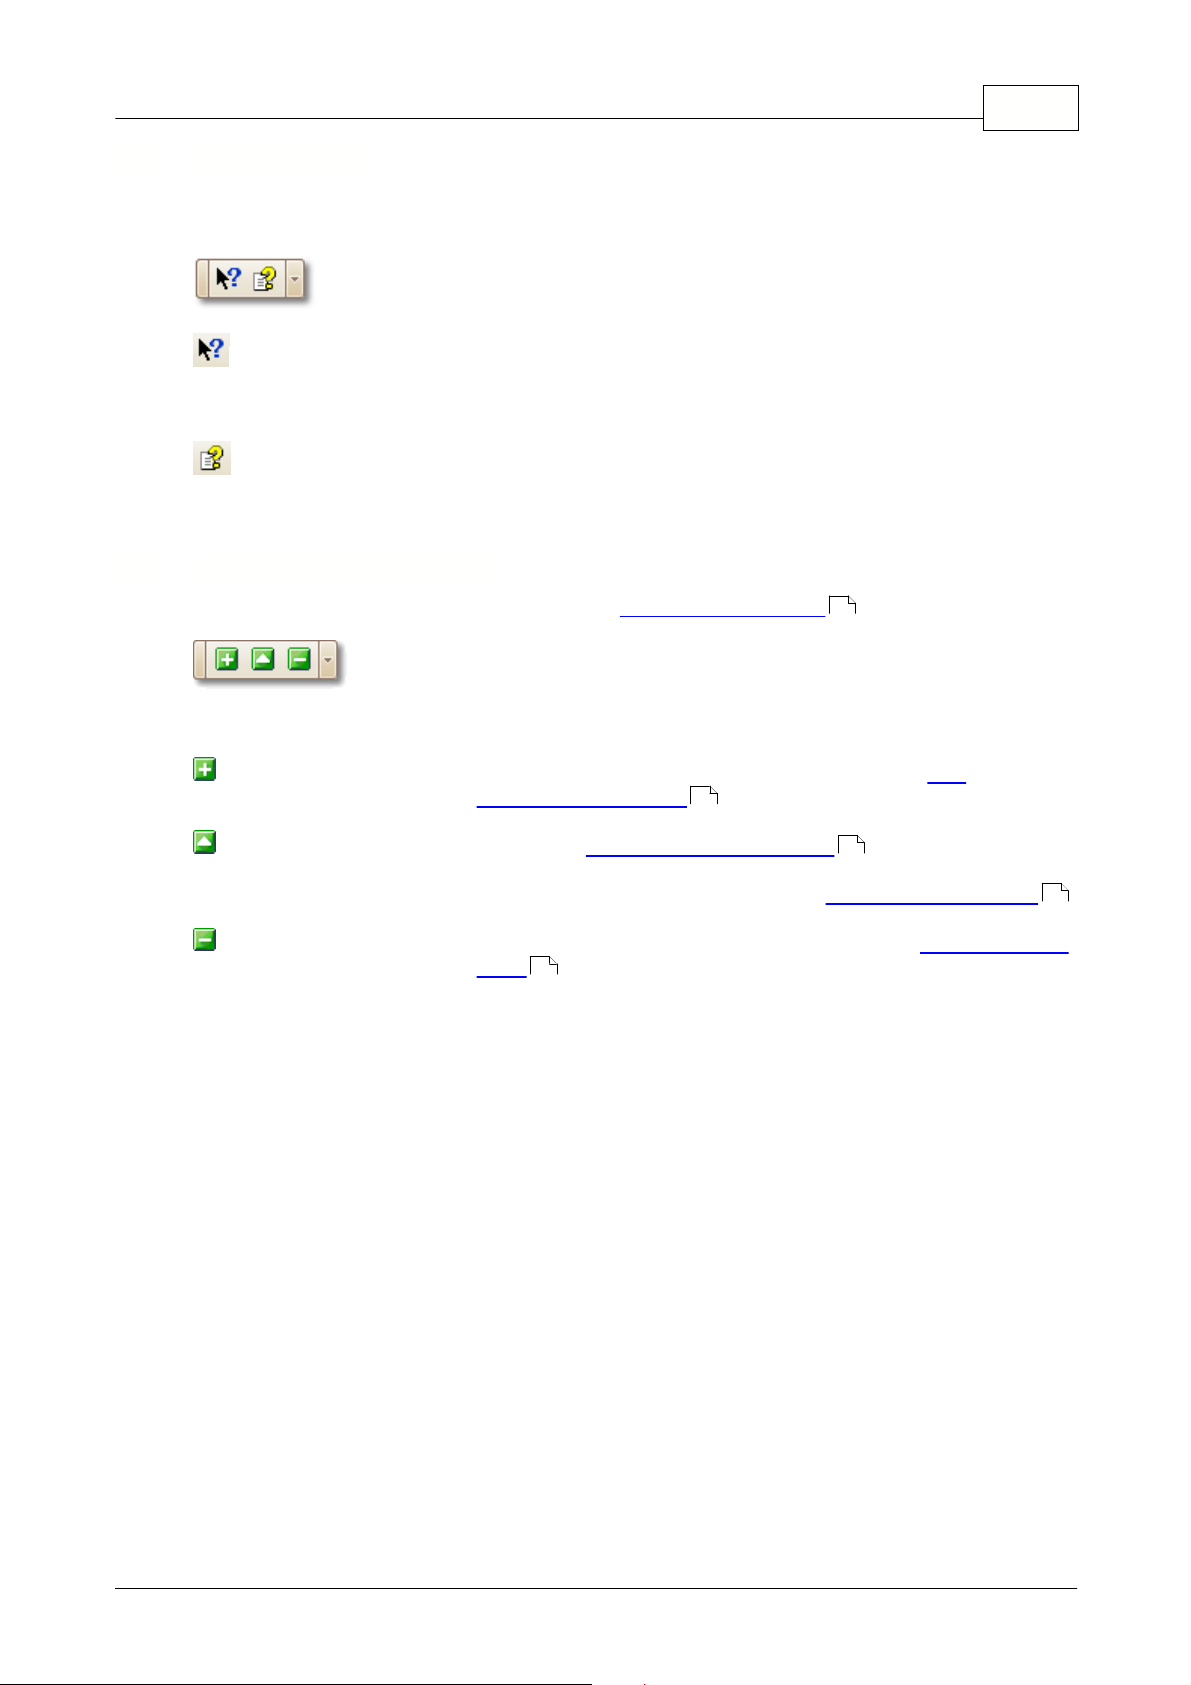
Help toolbar
The Help toolbar gives you access to "What's This?" help and the reference manual
that you are now reading.
What's This? Help. Click this button, then click a toolbar control or button to
see a short description. Use it only on toolbars that are attached to the edge of the
PicoScope window.
Reference Manual. Opens this reference manual, which has information on
every menu, dialog and control.
Measurements toolbar
The Measurements toolbar controls the measurements table .
It contains the following buttons:
11
Add Measurement. Adds a row to the table, and then opens the Add
Measurement dialog.
Edit Measurement. Opens the Edit Measurement dialog for the currently
26
26
selected measurement. You can also edit a measurement
by double-clicking on a row of the measurements table.
Delete Measurement. Deletes the currently selected row from the measurements
11
table . If you delete the last measurement, the table
disappears.
11
Copyright 2006 Pico Technology Limited. All rights reserved. PSW044-2.0
Page 56
53
PicoScope 6 User Guide
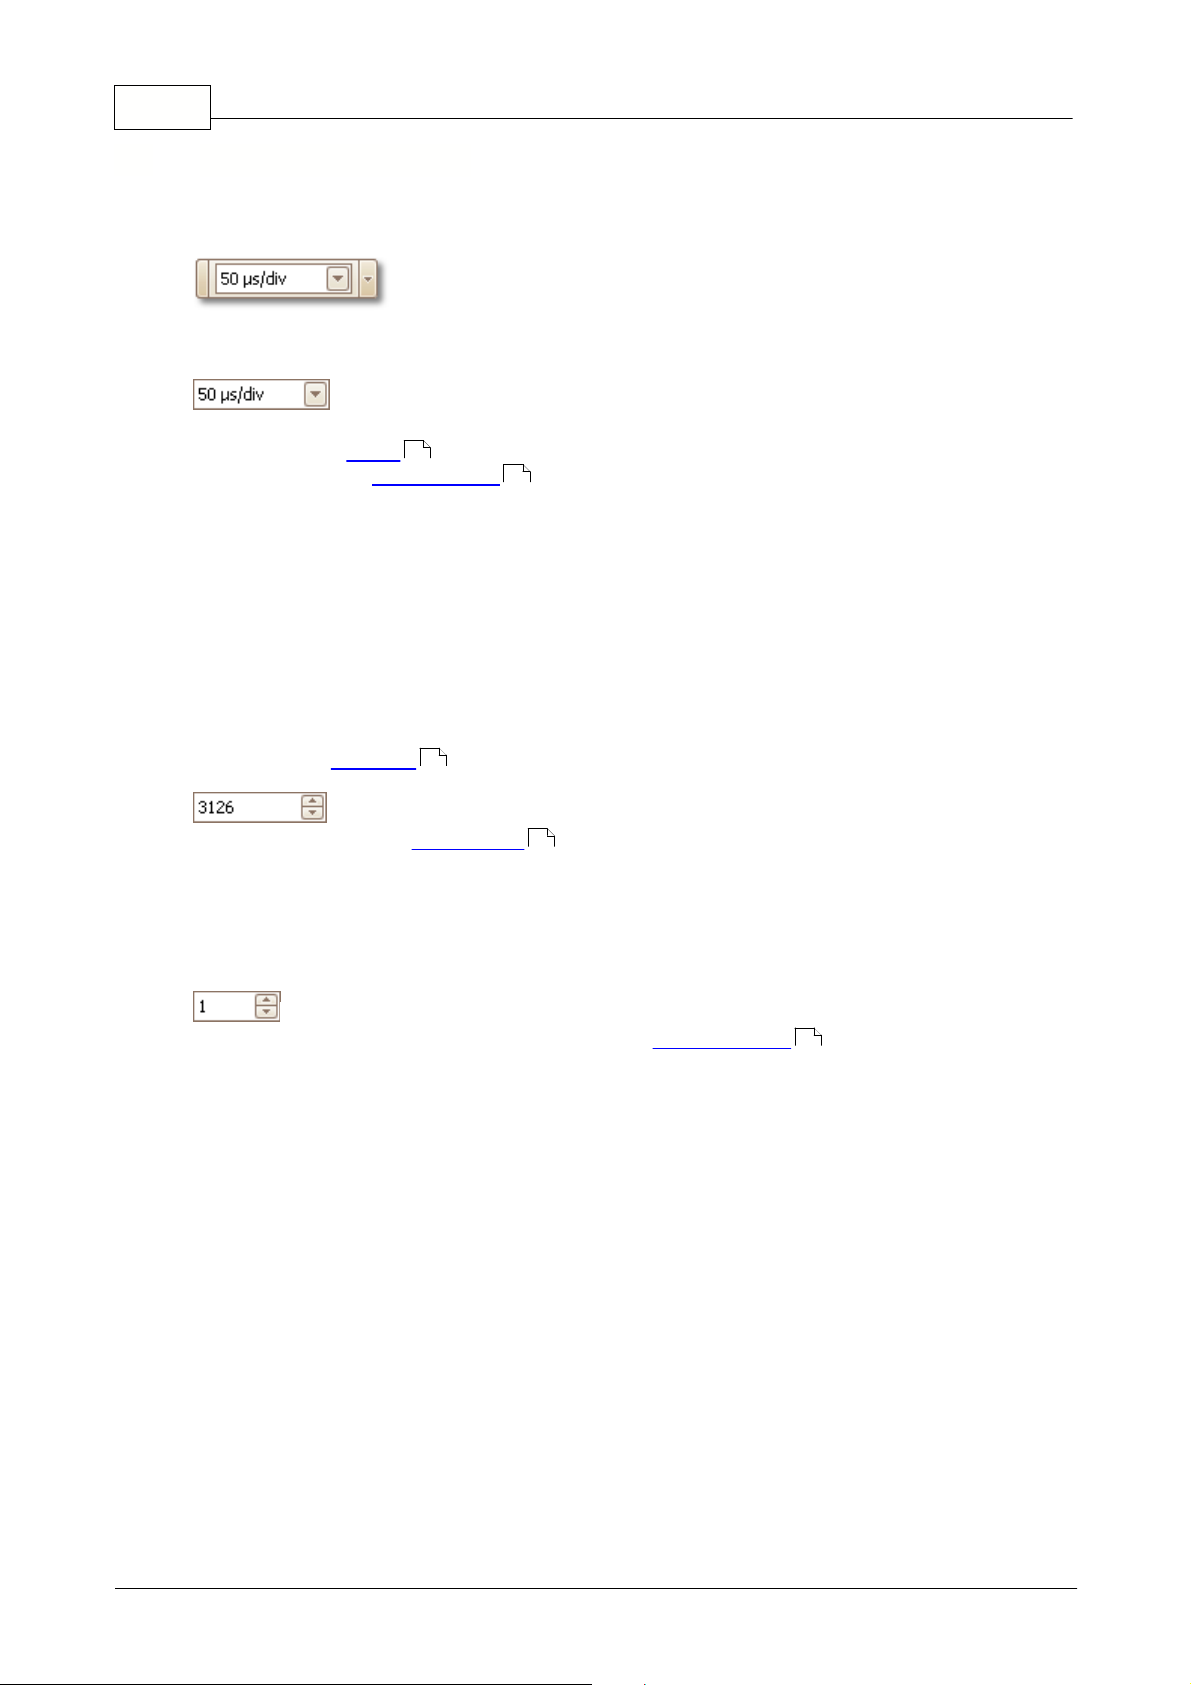
7.7
Scope Setup toolbar
The Scope Setup toolbar controls the time-related settings of your oscilloscope. It
normally looks like this:
Standard controls
Timebase control. When the active view is a scope view, this sets the
time represented by a single division of the horizontal axis when the
zoom factor is 100%. The timebases available depend on the type
of scope device you are using.
Choosing a timebase of 200 ms/div or slower causes PicoScope to
switch to roll mode. Instead of redrawing the whole waveform many
times every second, roll mode causes the waveform to move
continuously from right to left, with old data disappearing off the lefthand side and new data being added on the right-hand side. This mode
is more convenient for viewing slowly changing data.
Additional controls
You can customize the Scope Setup toolbar to include the following additional
controls. See Toolbars for instructions on customizing.
58
68
44
Samples control. Sets the number of samples that fit across the width
of the Scope view . Increasing this number increases the time
14
resolution of the display. If PicoScope will not let you select as many
samples as you would like, try:
1. Reducing the oversampling factor
2. Selecting a slower timebase.
Oversampling control. This is set to 1 by default, so that
oversampling is disabled. See Oversampling for more information.
12
Copyright 2006 Pico Technology Limited. All rights reserved.PSW044-2.0
Page 57

Toolbars
54
7.8
7.8.1
Signal Generator toolbar
The Signal Generator toolbar allows you to set up your scope device 's test signal
output. If the scope device has no test signal output, this toolbar will not appear.
Signal Generator. The "E" on this control stands for "External",
and refers to the "E" label on the scope device's test signal output.
Clicking the control opens the Signal Generator dialog .
Signal Generator dialog
This dialog controls the scope device 's built-in signal generator. It is not available if
the selected scope device does not have a signal generator. The number of controls in
the dialog may vary according to the type of scope device in use.
68
68
54
Left:
Signal generator dialog for the PicoScope
3206
Copyright 2006 Pico Technology Limited. All rights reserved. PSW044-2.0
Page 58

55
PicoScope 6 User Guide
How to use it
Signal On: Tick this box to enable the signal generator.
Frequency: Type in this box or use the spin buttons to
select the frequency. If the scope device has a frequency
sweep generator, then this box will set the start frequency
of the sweep.
Sweep Mode Active. Tick this box to enable sweep mode.
Otherwise, the generator will operate at a fixed frequency
set by the Start Frequency box.
Repeat Signal. Tick this box to generate a repetitive
sweep. Otherwise, the generator will reach Stop Frequency
and then remain there.
Dual Slope. In normal mode, the generator will increase
the frequency linearly from Start Frequency to Stop
Frequency, and then immediately begin again at Start
Frequency. In Dual Slope mode, it will reach Stop
Frequency and then decrease the frequency linearly to
Start Frequency before beginning again.
Stop Frequency. In Sweep Mode, the generator will stop
increasing the frequency when it reaches Stop Frequency.
Frequency Increment. In Sweep Mode, the generator will
increase or decrease the frequency by this amount every
Increment Time Interval.
Increment Time Interval. In Sweep Mode, the generator
will increase or decrease the frequency by Frequency
Increment once every time interval of this duration.
Where to find it
Click the menu button on the Signal Generator toolbar .
54
Copyright 2006 Pico Technology Limited. All rights reserved.PSW044-2.0
Page 59

Toolbars
56
7.9
Start / Stop toolbar
The Start / Stop toolbar allows you to start and stop the selected scope device
(the scope device whose scope view is currently in focus ). The Start button is
highlighted if the selected scope device is sampling; otherwise, the Stop button is
highlighted.
Start button. Start sampling on the selected scope device.
Stop button. Click to stop sampling on the selected scope device. Shift-click
to stop sampling only in the active capture window.
You can also use the space bar to start and stop sampling.
68
68
Copyright 2006 Pico Technology Limited. All rights reserved. PSW044-2.0
Page 60

57
PicoScope 6 User Guide
7.10
Triggering toolbar
The Triggering toolbar tells the scope device in the selected capture window when to
start capturing data.
Trigger Mode.
None: PicoScope acquires waveforms repeatedly without waiting for
specific events.
Auto: PicoScope tries to wait for a trigger event before displaying
data. If there is no trigger event within a specified time, it displays
data anyway. It repeats this process until you click the Stop button
56
. "Auto" mode does not set up the trigger level automatically; you
still need to do this yourself.
Repeat: PicoScope waits for a trigger event before displaying data;
but if there is no trigger event, it displays nothing. It repeats this
process until you click the Stop button .
Single: PicoScope waits once for a trigger event, then stops
sampling. To repeat a single trigger, click the Start button .
Trigger Source. This is the channel that PicoScope monitors for
the trigger condition.
68
56
56
Rising Edge. Click to trigger on the rising edge of the waveform.
Falling Edge. Click to trigger on the falling edge of the waveform.
Trigger Level. Sets the trigger level. You can also set the trigger
level by dragging the trigger marker up or down on the screen.
68
16
Pre-trigger Time (0% to 100%). This parameter controls how
much of the waveform appears before the trigger point. It defaults
to 50%, which puts the trigger marker is in the middle of the
16
screen. You can also control this parameter by dragging the trigger
marker to the left or right.
16
Post-trigger Delay. Click this button to toggle the Post-trigger
Delay control (see next item).
Post-trigger Delay. The post-trigger delay is the time that
PicoScope waits after the trigger point before sampling. You can also
modify this parameter by dragging the trigger marker while the
16
Post-trigger Delay button is enabled. As you drag the marker,
you will see the post-trigger arrow displayed briefly. For this
13
control to have an effect, you must first make sure that the Posttrigger Delay button is enabled.
Technical Note
See the reference topic "Trigger Timing " for information on how the Pre-trigger
65
Time and Post-trigger Delay controls interact.
Copyright 2006 Pico Technology Limited. All rights reserved.PSW044-2.0
Page 61

Toolbars
58
7.11
Zooming and Scrolling toolbar
The Zooming and Scrolling toolbar allows you to move around a scope view .
There is a keyboard shortcut for each button.
Normal Selection tool (Ctrl+S or Escape). This button turns the pointer
into a standard arrow that you can use to click buttons, drag rulers and
operate any other controls that appear in the PicoScope window.
Hand tool (panning) (Ctrl+D). This button turns the pointer into a hand
tool that you can use to click and drag the scope view to pan it
14
vertically and horizontally when you are zoomed in. You can also pan
using the scroll bars. Press the Escape key to return to the Normal
Selection tool.
Zoom In tool (Ctrl+I). This button turns the pointer into a zoom-in tool.
Click the tool on the scope view to double the magnification of the
14
horizontal and vertical axes. Scroll bars will appear, which you can drag to
pan around the view, or you can pan by using the Hand tool (see above).
Press the Escape key to return to the Normal Selection tool.
Zoom Out tool (Ctrl+O). This button turns the pointer into a zoom-out
tool. Click the tool on the scope view to zoom out both horizontally and
14
vertically by a factor of two. You cannot zoom out beyond 100% (normal
size). Press the Escape key to return to the Normal Selection tool.
14
68
Marquee Zoom tool (Ctrl+M). This button turns the pointer into a
marquee zoom tool. Use it to draw a box called a marquee on the scope
14
view and PicoScope will magnify that box to fill the view. Scroll bars
will appear, which you can drag to pan around in the view, or you can pan
by using the Hand tool (see above). Press the Escape key to return to
the Normal Selection tool.
100% (Ctrl+U). Resets the scope view to normal size. The view will no
14
longer have scroll bars, and panning will no longer be possible.
Copyright 2006 Pico Technology Limited. All rights reserved. PSW044-2.0
Page 62
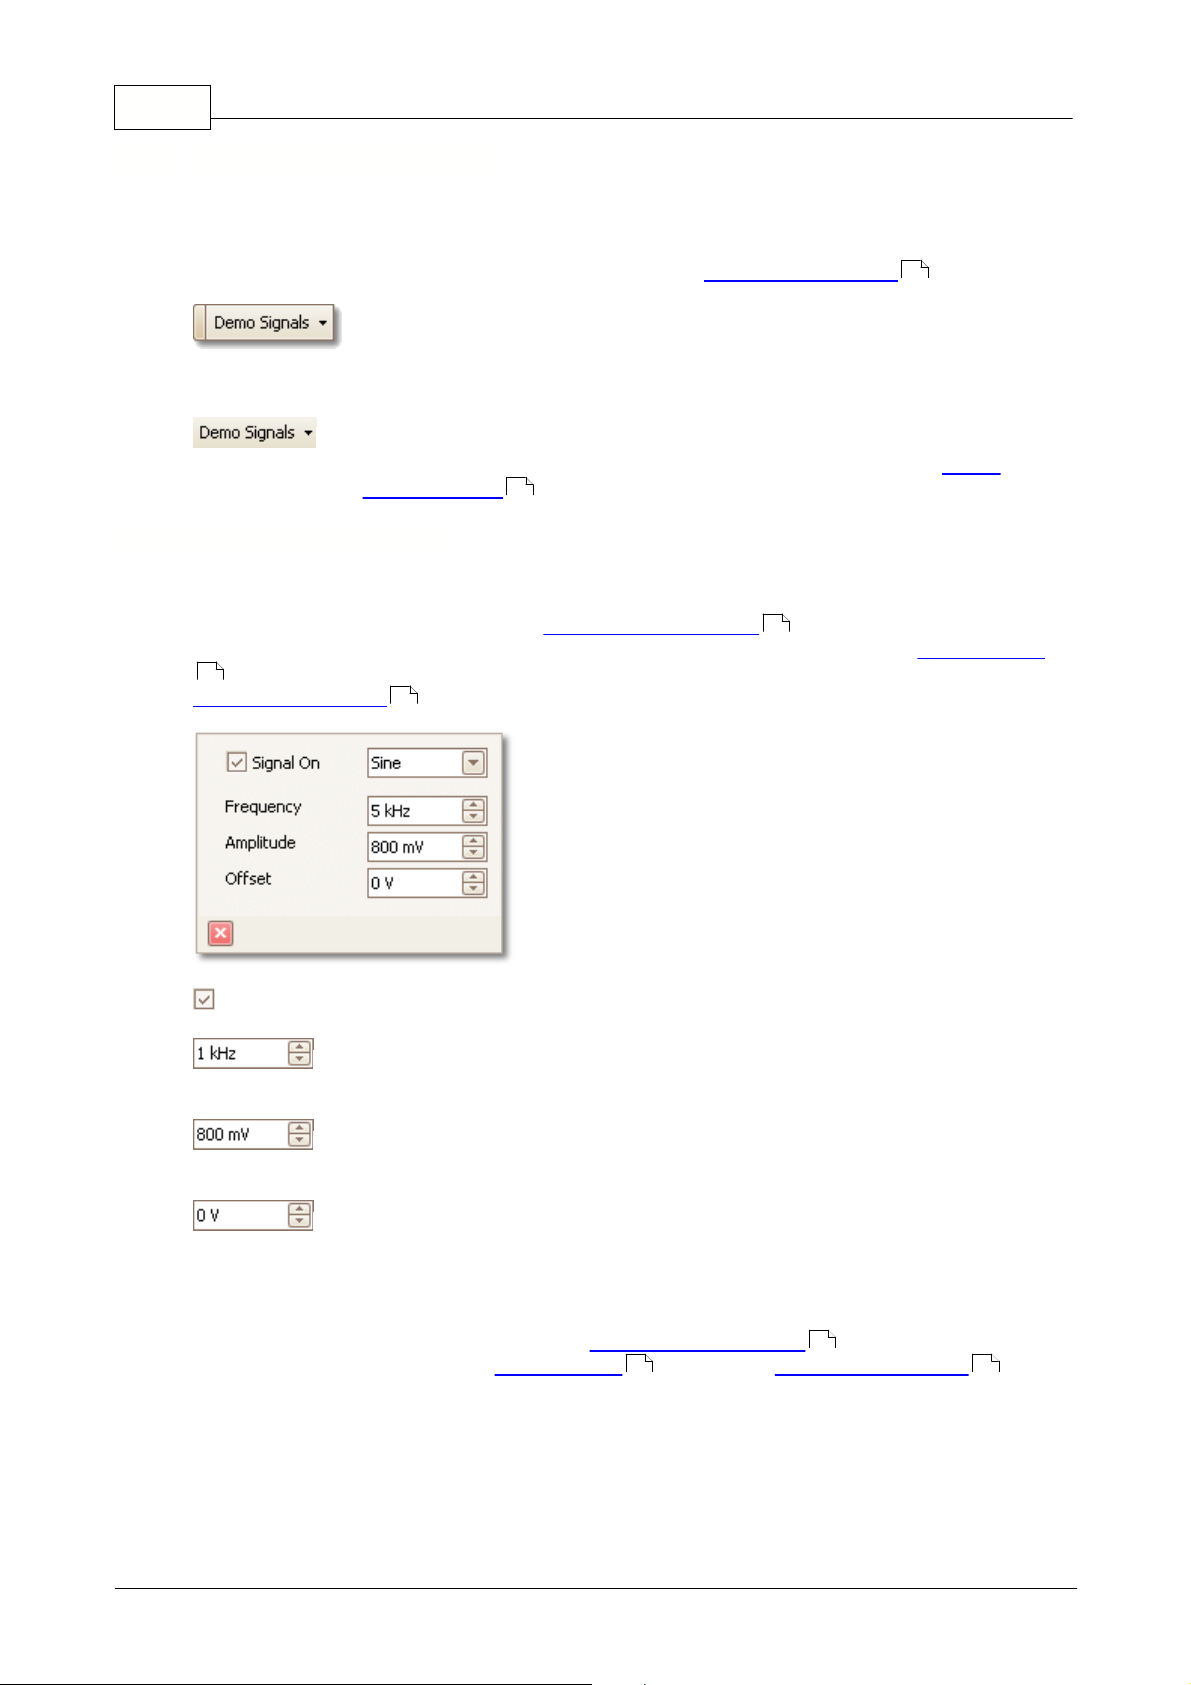
59
PicoScope 6 User Guide
7.12
7.12.1
Demo Signals toolbar
The Demo Signals toolbar allows you to set up test signals, so that you can
experiment with PicoScope when no scope device is connected. To use this feature,
close PicoScope, unplug all scope devices and then restart PicoScope. The program
will prompt you to select a Demo device using the Open Device dialog .
The toolbar contains the following buttons.
When you click this button, you will see a drop-down list of all the
available channels. Click one of the channels to open the Demo
Signals dialog , which will allow you to set up that channel.
59
Demo Signals dialog
This dialog controls one channel of the demo signal generator, a feature of PicoScope
that creates a variety of test signals to simulate a scope device. Open it by clicking
the Demo Signals button on the Demo Signals toolbar and then selecting a
channel. It is available only when you start PicoScope without having a scope device
68
connected to your computer, and then select a scope device type of "Demo" in the
Open Device dialog .
46
59
46
Signal On: Tick this box to enable the demo signal generator.
Frequency: Type your desired frequency in hertz here, or use the spin
buttons.
Amplitude: Type your desired amplitude in millivolts here, or use the
spin buttons.
Offset: Enter a number here to add a d.c. offset to the demo signal. By
default, the demo signals have a mean value of zero volts.
Where to find it
Click the Demo Signals button on the Demo Signals toolbar . You must have
previously selected a "Demo" scope device type in the Open Device dialog .
68 46
59
Copyright 2006 Pico Technology Limited. All rights reserved.PSW044-2.0
Page 63

How to...
60
8
How to...
This chapter explains how to achieve some common tasks.
How to...
Change to a different scope device
Use rulers to measure a signal
Measure a time difference
Move a view
62
62
61
61
Copyright 2006 Pico Technology Limited. All rights reserved. PSW044-2.0
Page 64
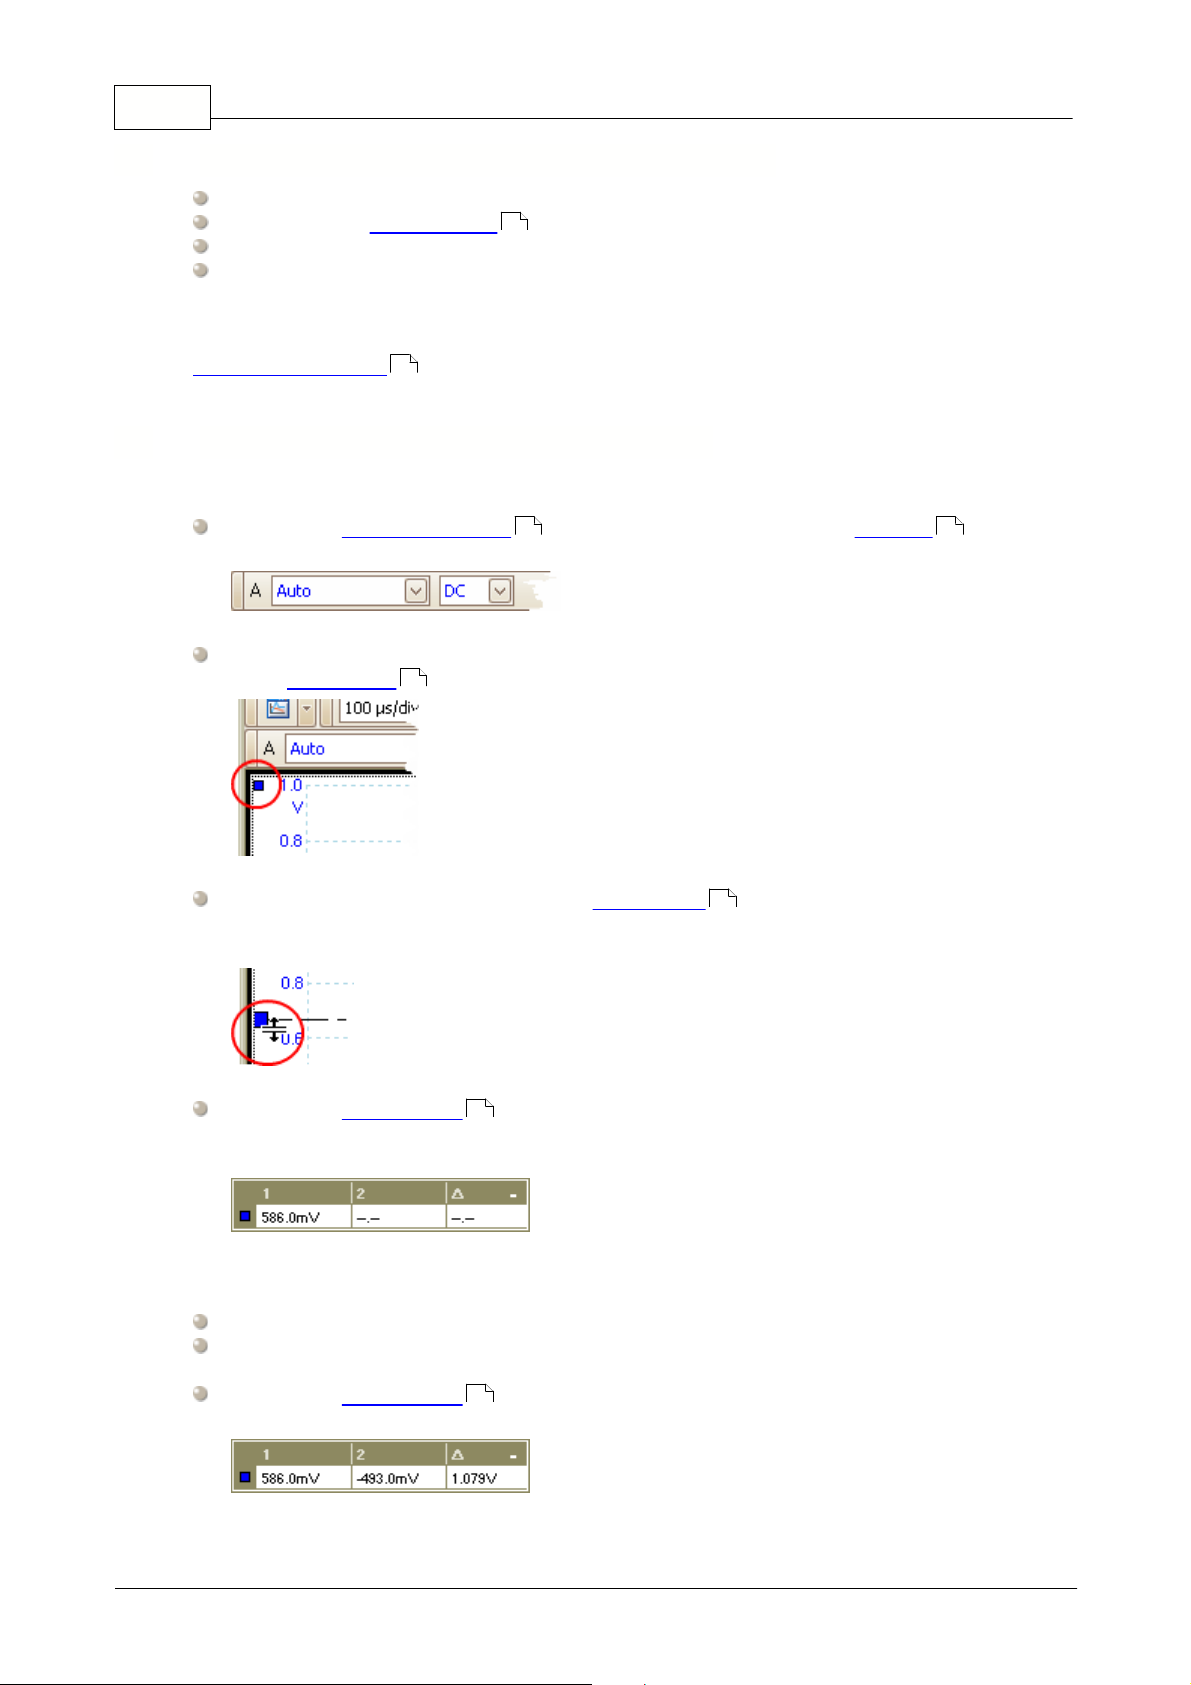
61
PicoScope 6 User Guide
8.1
8.2
How to change to a different scope device
Close PicoScope
Unplug the old scope device
68
Plug in the new scope device
Restart PicoScope
PicoScope will detect that the scope device has changed and will immediately start
using the new scope device. If there is more than one scope device connected, the
Open Device dialog will appear to let you choose a scope.
46
How to use rulers to measure a signal
Using a single ruler for signal-to-ground measurements
Look at the Channels toolbar to find the colour code for the channel you wish
to measure:
Find the ruler handle (the small coloured square in the top-left or top-right corner
of the scope view ) of this colour:
14
47 68
Drag the ruler handle downwards. A signal ruler (horizontal broken line) will
17
appear across the scope view. Release the ruler handle when the ruler is where
you want it.
Look at the ruler legend (the small table that appears on the scope view). It
13
should have a row marked by a small coloured square matching the colour of your
ruler handle. The first column shows the signal level of the ruler.
Using two rulers for differential measurements
Follow the steps above for "using a single ruler".
Drag the second ruler handle of the same colour downwards until its ruler is at the
signal level to be measured.
Look at the ruler legend again. The second column now shows the signal level of
13
the second ruler, and the third column shows the difference between the two rulers.
Copyright 2006 Pico Technology Limited. All rights reserved.PSW044-2.0
Page 65

How to...
62
8.3
8.4
How to measure a time difference
Find the time ruler handle (the small white square in the bottom left corner of the
scope view ).
Drag the ruler handle to the right. A time ruler (vertical broken line) will appear
14
15
on the scope view. Release the ruler handle when the ruler is at the time you wish
to use as the reference.
Drag the second white ruler handle to the right until its ruler is at the time to be
measured.
Look at the ruler legend (the small table that appears on the scope view). It
13
should have a row marked by a small white square. The first two columns show the
times of the two rulers, and the third column shows the time difference.
The frequency legend shows 1/D, where D is the time difference.
10
You can use the same method to measure a frequency difference on a spectrum view,
if this is available.
How to move a view
You can easily drag a view from one viewport to another in a capture window .
This example shows a capture window with four viewports. The viewports contain
scope views called "Scope 1" to "Scope 4". Suppose you wish to move the "Scope 4"
view to the top left viewport.
18 68 9
1. Click on the name tab of the "Scope 4" view and
hold the mouse button down.
2. Drag the mouse pointer to the new location next
to the name tab of the "Scope 1" view.
3. Release the mouse button, and the view will
move to the new location.
Copyright 2006 Pico Technology Limited. All rights reserved. PSW044-2.0
Page 66

63
PicoScope 6 User Guide
9
9.1
Reference
This is where you can find detailed information on the workings of PicoScope.
Measurement types
Trigger timing
Keyboard shortcuts
Glossary
68
Measurement types
The Edit Measurement dialog allows you to select one of a range of measurements
that PicoScope can calculate for the selected waveform. Here is a list of the available
measurements:
AC Volts: The root mean square (RMS) value of the AC component of the
Burn Time: For a secondary ignition waveform, the duration of the spark.
Burn Voltage: For a secondary ignition waveform, the voltage across the spark
63
65
67
26
waveform. This measurement subtracts any DC offset from the
waveform. It is equivalent to a ripple measurement.
gap during the burn time.
Crank RPM: The turning rate of the crankshaft, as measured by the
crankshaft sensor. Expressed in revolutions per minute.
Cycle Time
DC Volts
Duty Cycle
Dwell Angle
Dwell Time: In a primary ignition waveform, the time during which battery
Fall Time: The time the signal takes to fall from 80% to 20% of its peak
Falling Rate: The rate at which the signal voltage falls, in signal units per
:
:
:
:
PicoScope will attempt to find a repeated pattern in the
waveform and measure the duration of one cycle.
The mean value of the waveform.
The amount of time that a signal spends above its mean value,
expressed as a percentage of the signal period. A duty cycle of
50% means that the high time is equal to the low time.
In a primary ignition waveform, dwell time converted to an
angle, using the formula:
dwell angle = (dwell time * crankshaft RPM / 60) * 360 degrees.
current flows in the ignition coil, as the magnetic field builds up
in its winding.
values.
second. Measured between 80% and 20% of its peak-to-peak
value.
Frequency
High Pulse Width: The amount of time that the signal spends above its mean
:
The number of cycles of the waveform per second.
value.
Copyright 2006 Pico Technology Limited. All rights reserved.PSW044-2.0
Page 67

Reference
64
Injector Duration: The duration of the fuel injector pulse, as battery current flows
through the injector coil.
Low Pulse Width: The amount of time that the signal spends below its mean
value.
Maximum: The highest level reached by the signal.
Minimum: The lowest level reached by the signal.
Peak Burn Voltage: For a secondary ignition waveform, the voltage of the initial
peak as the spark begins.
Peak To Peak: The difference between maximum and minimum.
Rise Time: The time the signal takes to rise from 20% to 80% of its peak-
to-peak value.
Rising Rate: The rate at which the signal rises, in signal units per second.
Measured between 20% and 80% of its peak-to-peak value.
Copyright 2006 Pico Technology Limited. All rights reserved. PSW044-2.0
Page 68

65
PicoScope 6 User Guide
9.2
Trigger timing (part 1)
The pre-trigger time control and post-trigger delay control functions are
described individually under "Triggering toolbar ", but the interaction between the
two controls is also important to understand. Here is a screen shot of a capture
window with post-trigger delay enabled:
9
57
First, notice that the trigger reference point ( ) does not lie on the waveform. This is
because the post-trigger delay is set to 3.3 ms, which means that the trigger occurred
3.3 ms before the reference point, somewhere off the left-hand edge of the scope
view. The time axis is aligned so that the trigger reference point is at 3.3 ms.
14
Second, the pre-trigger delay is set to 30%, which forces the trigger reference point to
appear 30% of the way across the scope view, measured from the left-hand edge.
Third, PicoScope often limits the trigger-to-reference-point delay to the total capture
time. Once you have reached this limit, the program will not let you increase the pretrigger delay, and if you increase the post-trigger delay, PicoScope will reduce the pretrigger delay to stop the total exceeding the limit.
Copyright 2006 Pico Technology Limited. All rights reserved.PSW044-2.0
Page 69

Reference
66
9.3
Trigger timing (part 2)
"Trigger timing (part 1) " introduced the concepts of pre-trigger delay and the
post-trigger delay . This diagram below shows how they are related.
65 57
57
The pre-trigger delay positions the capture window in relation to the trigger
9
reference point so that you can choose how much of the waveform should be before
the reference point, and how much after it.
The post-trigger delay is like the delayed trigger of a conventional oscilloscope.
PicoScope waits for this time, minus the pre-trigger delay, before capturing data.
scope devices have a limit to the number of sampling intervals that can pass between
the trigger event and the end of the capture window, so the software may adjust the
pre-trigger delay to keep within this limit.
Tip
If you have set up a post-trigger delay, you can click the post-trigger delay button
while the scope is running whenever you want to switch between viewing the trigger
event and the trigger reference point.
Copyright 2006 Pico Technology Limited. All rights reserved. PSW044-2.0
Page 70

67
PicoScope 6 User Guide
9.4
Keyboard shortcuts
You can activate all of PicoScope's functions using the menu system, but some
functions also have keyboard shortcuts. These can save time on tasks that you
repeat often.
Ctrl-C Copy the current view to the Windows clipboard. You can then switch to
another application and paste the contents of the clipboard as a picture.
The method for doing this varies, but many applications use the Ctrl-V
key or a "Paste" button.
Ctrl-D Hand tool. Use to pan the waveform when zoomed in. Equivalent to the
"Hand tool" button on the Zooming and Scrolling toolbar.
Ctrl-I Zoom-in tool. Click on the waveform to zoom in. Equivalent to the "Zoom-
in tool" button on the Zooming and Scrolling toolbar.
Ctrl-M Marquee zoom tool. Click on the waveform and drag to draw a box (a
marquee), and PicoScope will zoom in to make the box fill the view.
Equivalent to the "Marquee zoom tool" button on the Zooming and
Scrolling toolbar.
58
Ctrl-O Zoom-out tool. Click on the waveform to zoom out. Equivalent to the
"Zoom-out tool" button on the Zooming and Scrolling toolbar.
Ctrl-S or
Escape
Cancels a zoom or pan mode and restores the pointer to a standard
selection tool. Equivalent to the "Normal selection tool" button on the
Zooming and Scrolling toolbar.
58
58
58
58
Ctrl-U Zoom to 100% scale. Restores a view to its normal state. Equivalent to
the "Zoom to 100% scale" button on the Zooming and Scrolling toolbar.
58
Space bar Starts and stops the active capture window.
Copyright 2006 Pico Technology Limited. All rights reserved.PSW044-2.0
Page 71

Reference
68
9.5
Glossary
AC coupling. In this mode, the scope device very low signal frequencies below a few
hertz. This allows you to use the full resolution of the scope to measure a.c. signals
accurately, ignoring any d.c. offset. You cannot measure the signal level with respect
to ground in this mode.
Channel. A scope device has one or more channels, each of which can sample one
signal. High-speed scope devices typically have one BNC connector per channel.
DC coupling. In this mode, the scope device measures the signal level relative to
signal ground. This shows maximum information about the signal, including d.c. and
a.c. components.
Graticule. The pattern of broken grey lines in every scope view window. These help
you estimate the amplitude and time of features on the waveform.
Grid. The arrangement of viewports in a capture window. The number of grid rows
and the number of grid columns can each be either 1, 2, 3 or 4.
In focus. PicoScope can display several capture windows, but one window is drawn in
stronger colours than the others. This is the window that is in focus. When you click a
toolbar button, it will usually affect only the window that is in focus. To bring a
window into focus, click on it.
68
Oversampling. Collecting samples at a faster rate than requested, then combining
the excess samples by averaging. This technique can increase the effective resolution
of a scope device when there is a small amount of noise on the signal.
Probe. An accessory that attaches to your oscilloscope and picks up a signal to be
measured. A probe can pick up any form of signal, but it always delivers a voltage
signal to the oscilloscope. PicoScope knows about standard probes, but also allows you
to define custom probes.
Roll mode. Normally, PicoScope redraws the waveform in a scope view many times
every second. At timebases slower than 200 ms/div, however, it switches to roll mode.
This causes the waveform to move continuously from right to left, with old data
disappearing off the left-hand side and new data being added on the right-hand side.
This mode is more convenient for viewing slowly changing data.
Ruler. A vertical or horizontal dashed line that can be dragged into place on a
waveform in a Scope View. PicoScope displays the signal level, time value or
frequency value of all rulers in a Ruler Legend box.
Scope device
your computer into a PC Oscilloscope.
Tooltip. A label that appears when you move the mouse pointer over some parts of
the PicoScope screen, such as buttons, controls and rulers.
.
box of electronics that, with the help of the PicoScope software, turns
A
Trigger. A device that detects when the waveform rises or falls past a preset signal
level. When this event occurs, the program may begin to acquire data.
View. A presentation of data from a particular scope device. Each scope device may
have zero, one or more views, all of which are displayed inside the capture window for
that scope device. The only type of view currently available is the scope view.
Viewport. A rectangular space in a capture window that can contain one or more
views, or can be empty.
Copyright 2006 Pico Technology Limited. All rights reserved. PSW044-2.0
Page 72

PicoScope 6 User Guide69
Index
.
.bmp files, saving 21
.csv files, saving 21
.gif files, saving 21
.png files, saving 21
.psdata files, saving 21
.pssettings files, saving 21
.txt files, saving 21
A
AC mains power 41
AC volts measurement 63
Access 4
Add Measurement dialog 26
Adding a measurement 11, 25, 26
Address 5
Axis
horizontal 14
vertical 14
B
Battery power 41
Buffer Navigation toolbar 45
Burn time measurement 63
Burn voltage measurement 63
Cursor position tool tip 14
Custom Probe wizard 28
Create New Custom Probe dialog 29
Edit Existing Custom Probe dialog 30
Edit Range dialog 36
Finished dialog 39
Lookup-table Scaling dialog 33
Manual Ranges Setup dialog 35
Probe ID dialog 38
Probe Output Units dialog 31
Range Management dialog 34
Scaling Method dialog 32
Custom probes 10, 27
Custom Probes dialog 27
Customization dialog 48
Commands page 50
Options page 51
Toolbars page 49
Cycle time measurement 63
D
DC volts measurement 63
Deleting a measurement 11, 25
Demo mode 46, 59
Demo Signals dialog 59
Demo Signals toolbar 59
Display elements 7
Duty cycle measurement 63
Dwell angle measurement 63
Dwell time measurement 63
E
C
Capture rate 41
Capture window 9, 45
Capture Windows toolbar 45
Channel Setup toolbar 47
Clipboard 23
Close file 20
Column auto-width 25
Contact information 5
Converter, how to change 61
Copy as image 23
Copy as text 23
Copyright 4
Crank RPM measurement 63
Create New Custom Probe dialog 29
Create New Scope Window 20
Edit Existing Custom Probe dialog 30
Edit menu 23
Edit Range dialog 36
Editing a measurement 11, 25
Email addresses 5
Escape key 67
Exit 20
F
Fall time measurement 63
Falling edge button 57
Falling rate measurement 63
Fax number 5
File menu 20
Fitness for purpose 4
Frequency legend 10, 15
Copyright 2006 Pico Technology Limited. All rights reserved.PSW044-2.0
Page 73

Index
70
Frequency measurement 63
G
General dialog 40
Glossary 68
Graticule 9, 14
H
Hand tool 58
Help menu 24
Help toolbar 52
High pulse width measurement 63
Horizontal axis 14
I
Image, saving as 21
Injector duration measurement 63
Introduction 3
K
Keyboard shortcuts 67
L
Legal statement 4
Liability 4
Lookup-Table Scaling dialog 33
Low pulse width measurement 63
M
Mains power 41
Manual Ranges Setup dialog 35
Marquee Zoom tool 58
Maximum measurement 63
Measurements
adding 11, 26
deleting 11
editing 11
font size 25
list of types 63
menu 25
table 11
toolbar 52
Menus 19
Merge 20
Minimum measurement 63
Mission-critical applications 4
N
New features 2
Normal Selection tool 58
Notes area 23
O
Open Device dialog 46
Open file 20
Oscilloscope 7
Oscilloscopes 7
Oversampling 12, 53
P
PC Oscilloscope 8
PCO 8
Peak burn voltage measurement 63
Peak to peak measurement 63
Performance dialog 41
PicoScope 8
how to use 3, 6, 7
version 1
version 6.0 2
Post-trigger delay 65
arrow 13
control 57, 65
Preferences 27
dialog 40
Pre-trigger delay 65
control 57, 65
Print 20
Print preview 20
Probe ID dialog 38
Probe Manager 27
Probe Output Units dialog 31
Probes
custom 10
R
Range Management dialog 34
Reference manual 24
Reset 'Don't show this again' dialogs 40
Resolution 12
Copyright 2006 Pico Technology Limited. All rights reserved. PSW044-2.0
Page 74

PicoScope 6 User Guide71
Rise time measurement 63
Rising edge button 57
Rising rate measurement 63
Ruler legend 13
Rulers
handles 14
time 14
voltage 14
S
Sales email address 5
Save As 20
dialog 21
Save file 20
Scaling Method dialog 32
Scope Setup toolbar 53
Scope view 14
Selection tool, normal 58
Signal difference, how to measure 61
Signal Generator
dialog 54
toolbar 54
Signal rulers 14, 17
Software version 1
Space bar 56, 67
Spreadsheet, exporting to 21
Start/Stop toolbar 56
Support 4
System requirements 5
timing 65
toolbar 57
U
Upgrades 4
Usage 4
V
Version 1
Version 6.0 update 2
Vertical axis 14
Viewports 18
Views 18
how to move 62
scope views 14
Viruses 4
W
Waveform 7, 14
What's new 2
What's This? help 24
Window menu 43
Windows 18
Z
Zooming and Scrolling toolbar 58
T
Technical support email address 5
Telephone number 5
Text, exporting as 21
Time difference, how to measure 62
Time rulers 14, 15
Timebase controls 53
Toolbar menu 27
Toolbars 44
customizing 44, 49
menu 42
reopening 44
Tools menu 27
Trace 7
Trademarks 4
Trigger
marker 16
mode control 57
reference point 65
Copyright 2006 Pico Technology Limited. All rights reserved.PSW044-2.0
Page 75

PSW044-2.0 25.7.06
Pico Technology Ltd
The Mill House
Cambridge Street
St Neots PE19 1QB
United Kingdom
Tel: +44 (0) 1480 396 395
Fax: +44 (0) 1480 396 296
Web: www.picotech.com
 Loading...