

Page 1

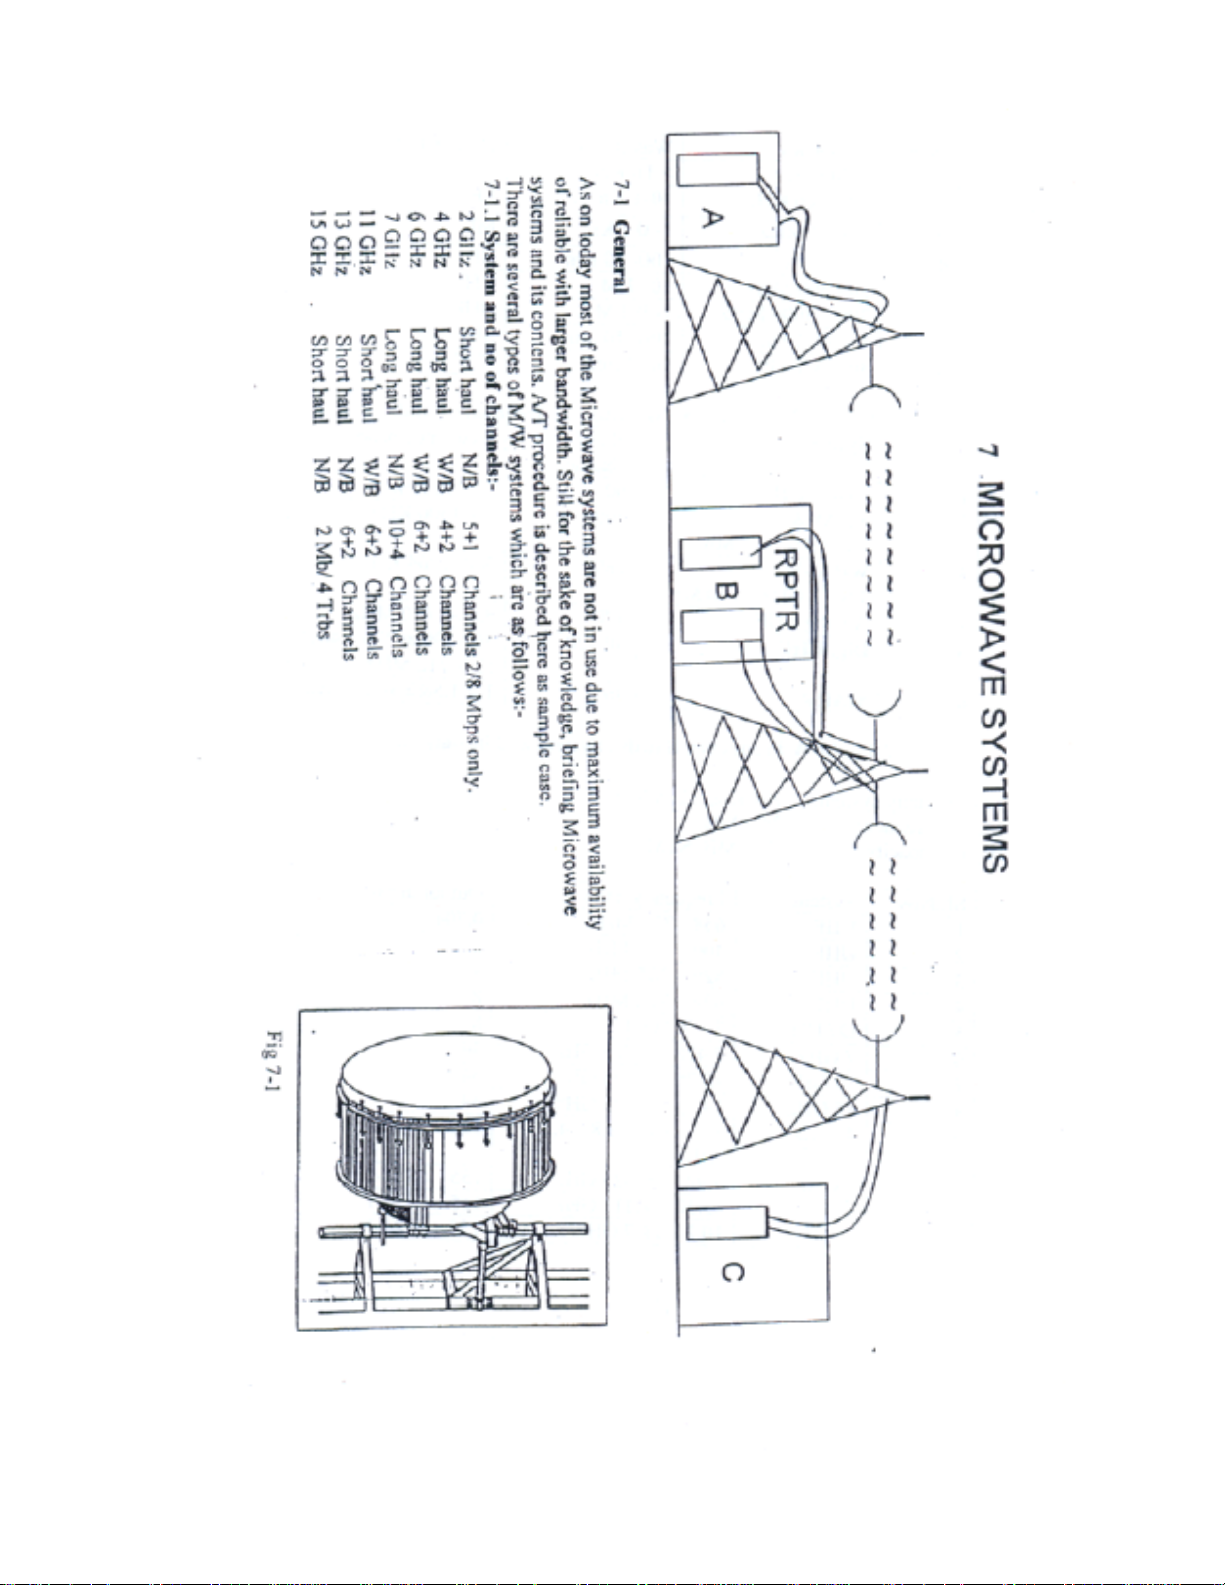
Chapter 7
Page 2
153
Page 3
154
Page 4
155
Page 5
Page 6
157
Page 7
158
Page 8

7-1.5
Meters for M/W System
1. Power Meter Anritsu - ML 4803 A
2. Power Meter HP - 437 B, 4368, Philips 3350
3. Spectrum Analyzer- Anritsu MS 7101 B,10 KHz- 23 GHz, 22 GHz- 140 GHz.
4. M/W System Analyzer (MSA) Transmitter & Receiver ME 538 M
Anritsu 4510 B Transmitter and Receiver.
5. M/W frequency counter Anritsu MF 76 A
6. Sweep Generator programmable Marconi instrument 10Mhz-20 GHz
7. VSWR Meters: -- HP Scalar network analyzer 8757 A
- HP Sweep Generator 8350 B
- Wiltron scalar network analyzer 56100 A
- Wiltron Synthesized sweep generator 68147 B
- Radart 2424 Synthesized signal generator 10 KHz – 10.4 GHz
- Adaptor S/N 9610-63090 MFR 63661
- Anritsu open/short model 22 N 50
8. Power sensors - Low power -70 to -20 dBm,
- High power -20 to + 20 dBm
9. Attenuators :- 10,20 dB HP or Anritsu
10. Jitter modulator oscillator Anritsu MH 370 A
11. Anritsu DTA Set ( Transmitter and Receiver)
12. Directional Bridge HP 85020127
13. PCM Mux Tester.
14. ANT-20
15. M/W Variable Attenuator
16. VF Oscillator
159
Page 9

7-1.6 Before proceeding any M/W system A/T ---------
1] Get TT-O, TT-1 duly filled in all respect,
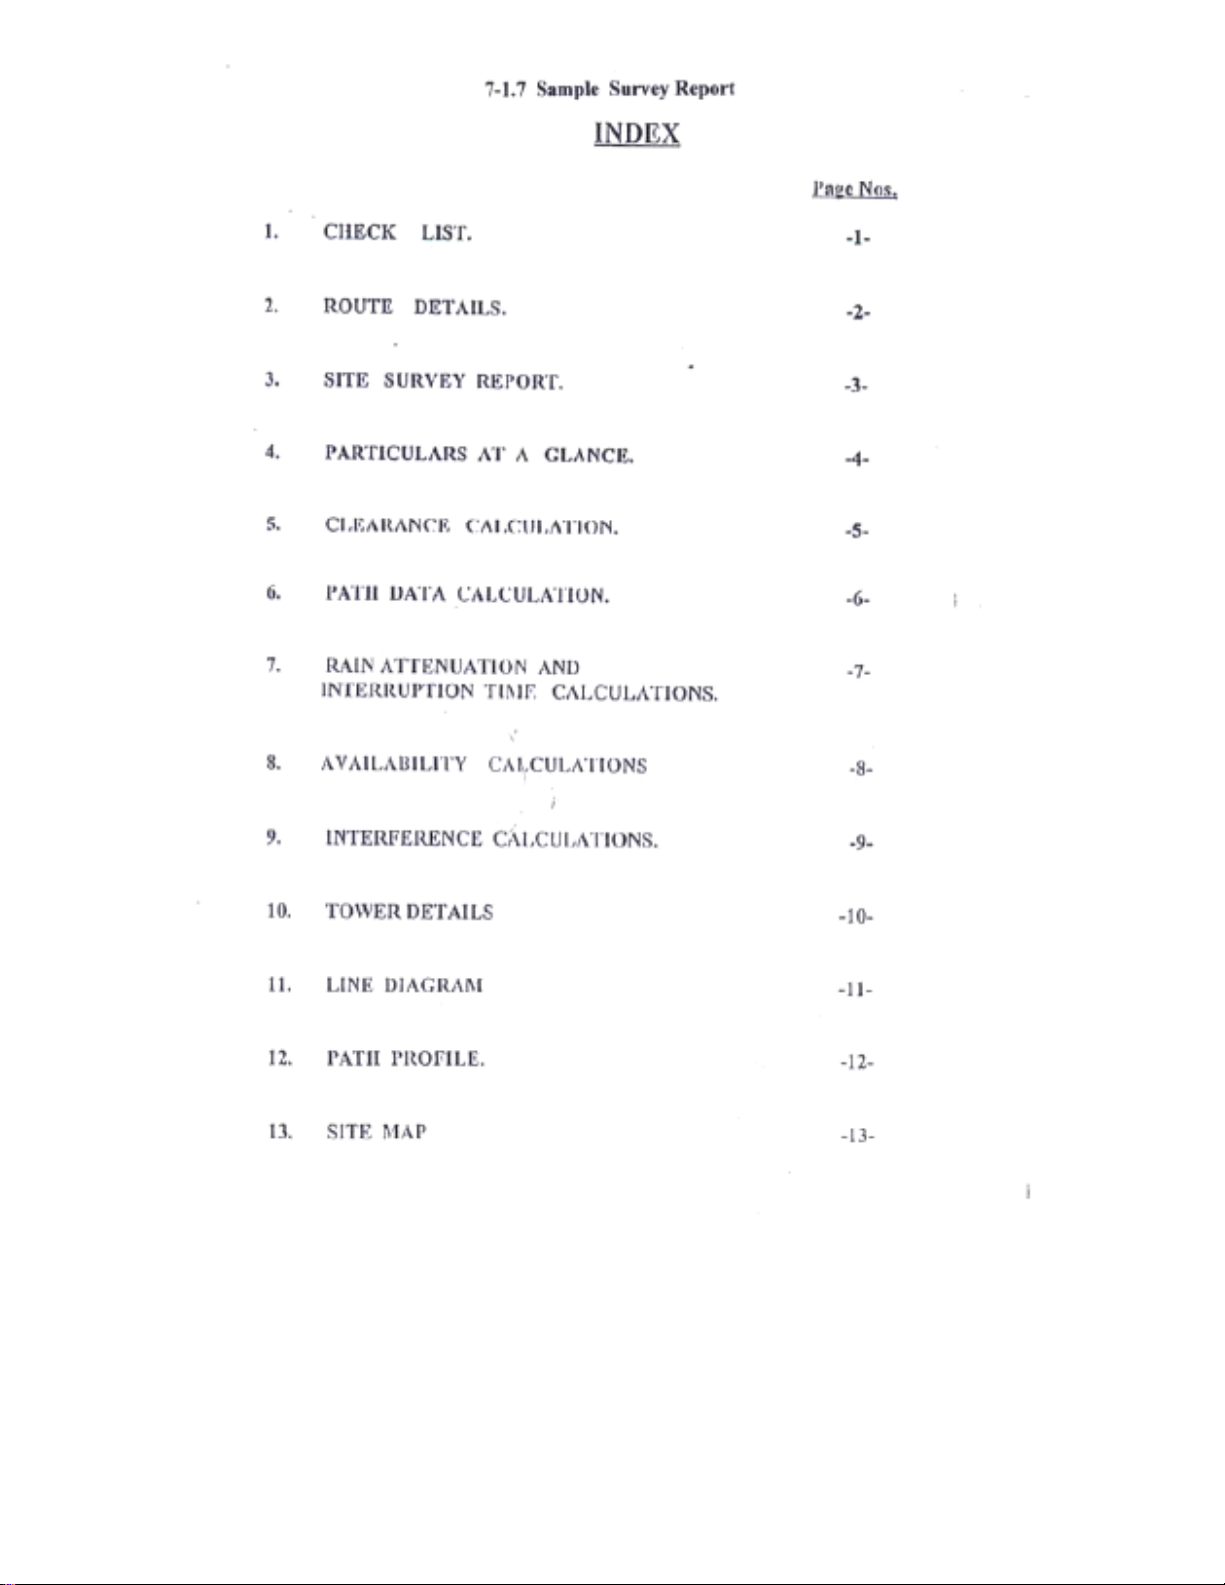
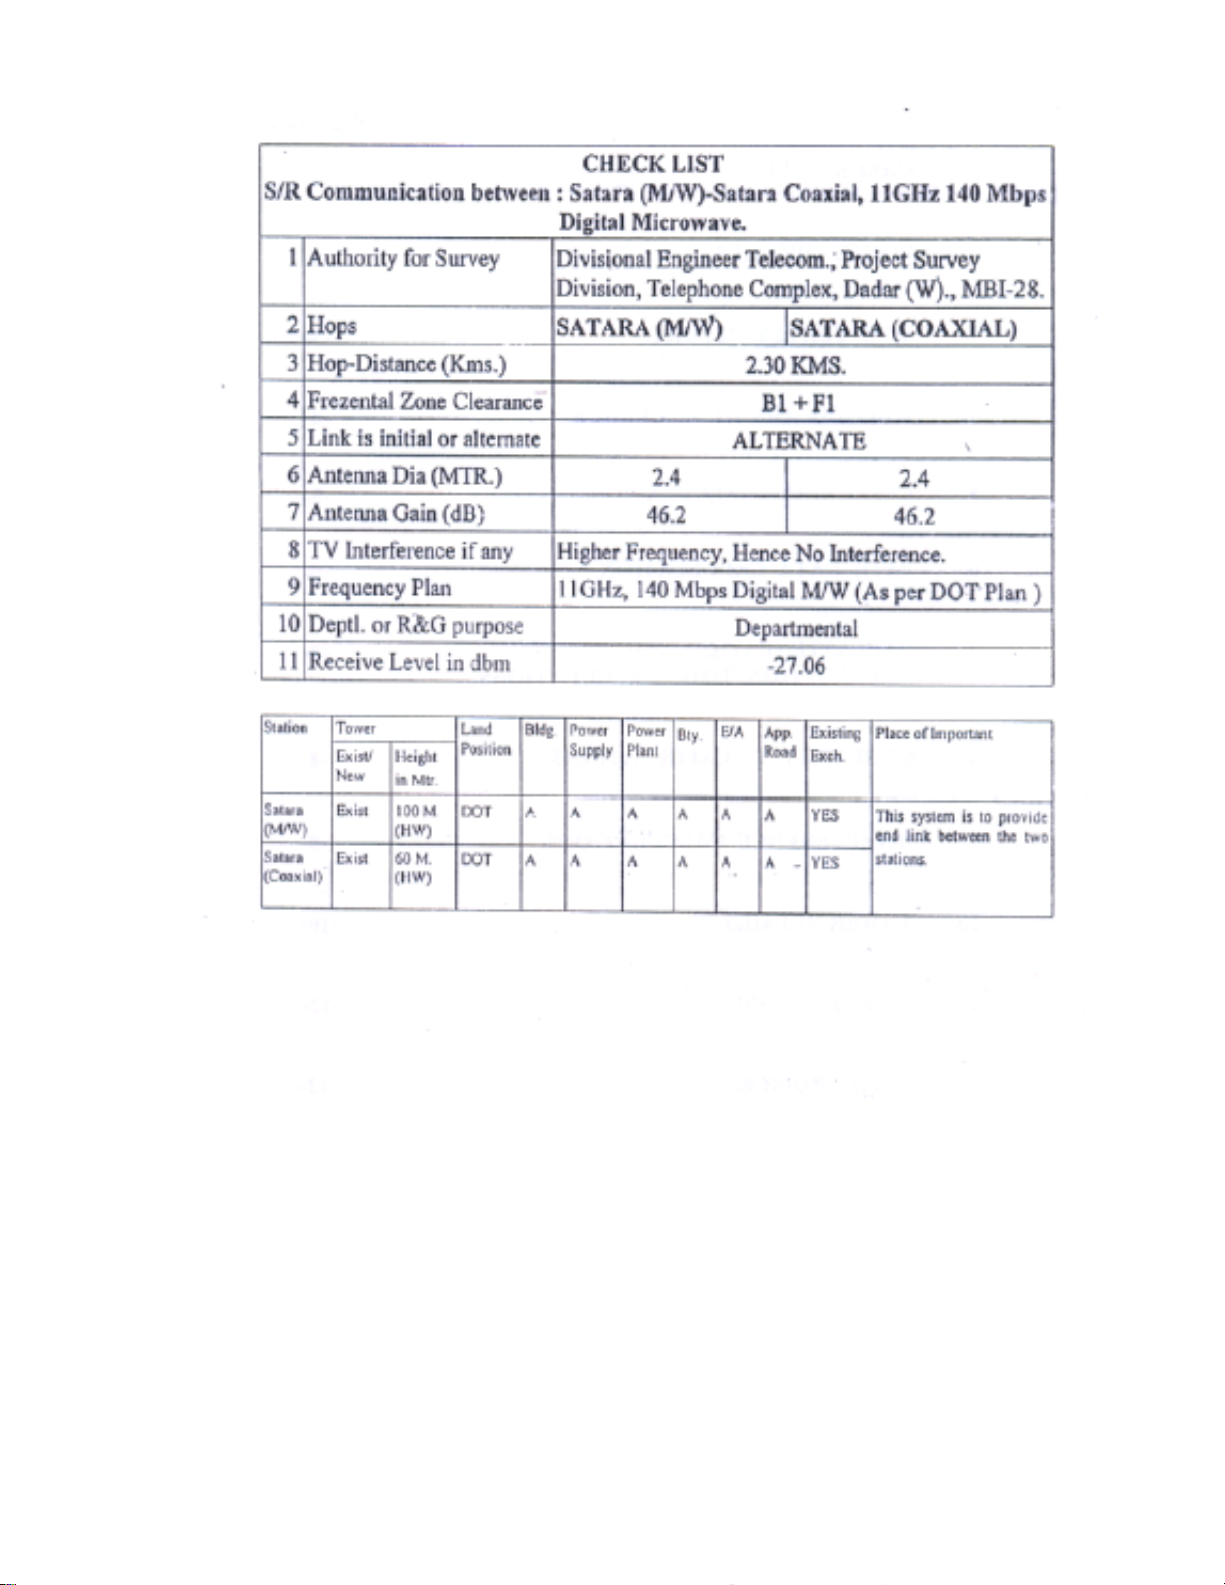
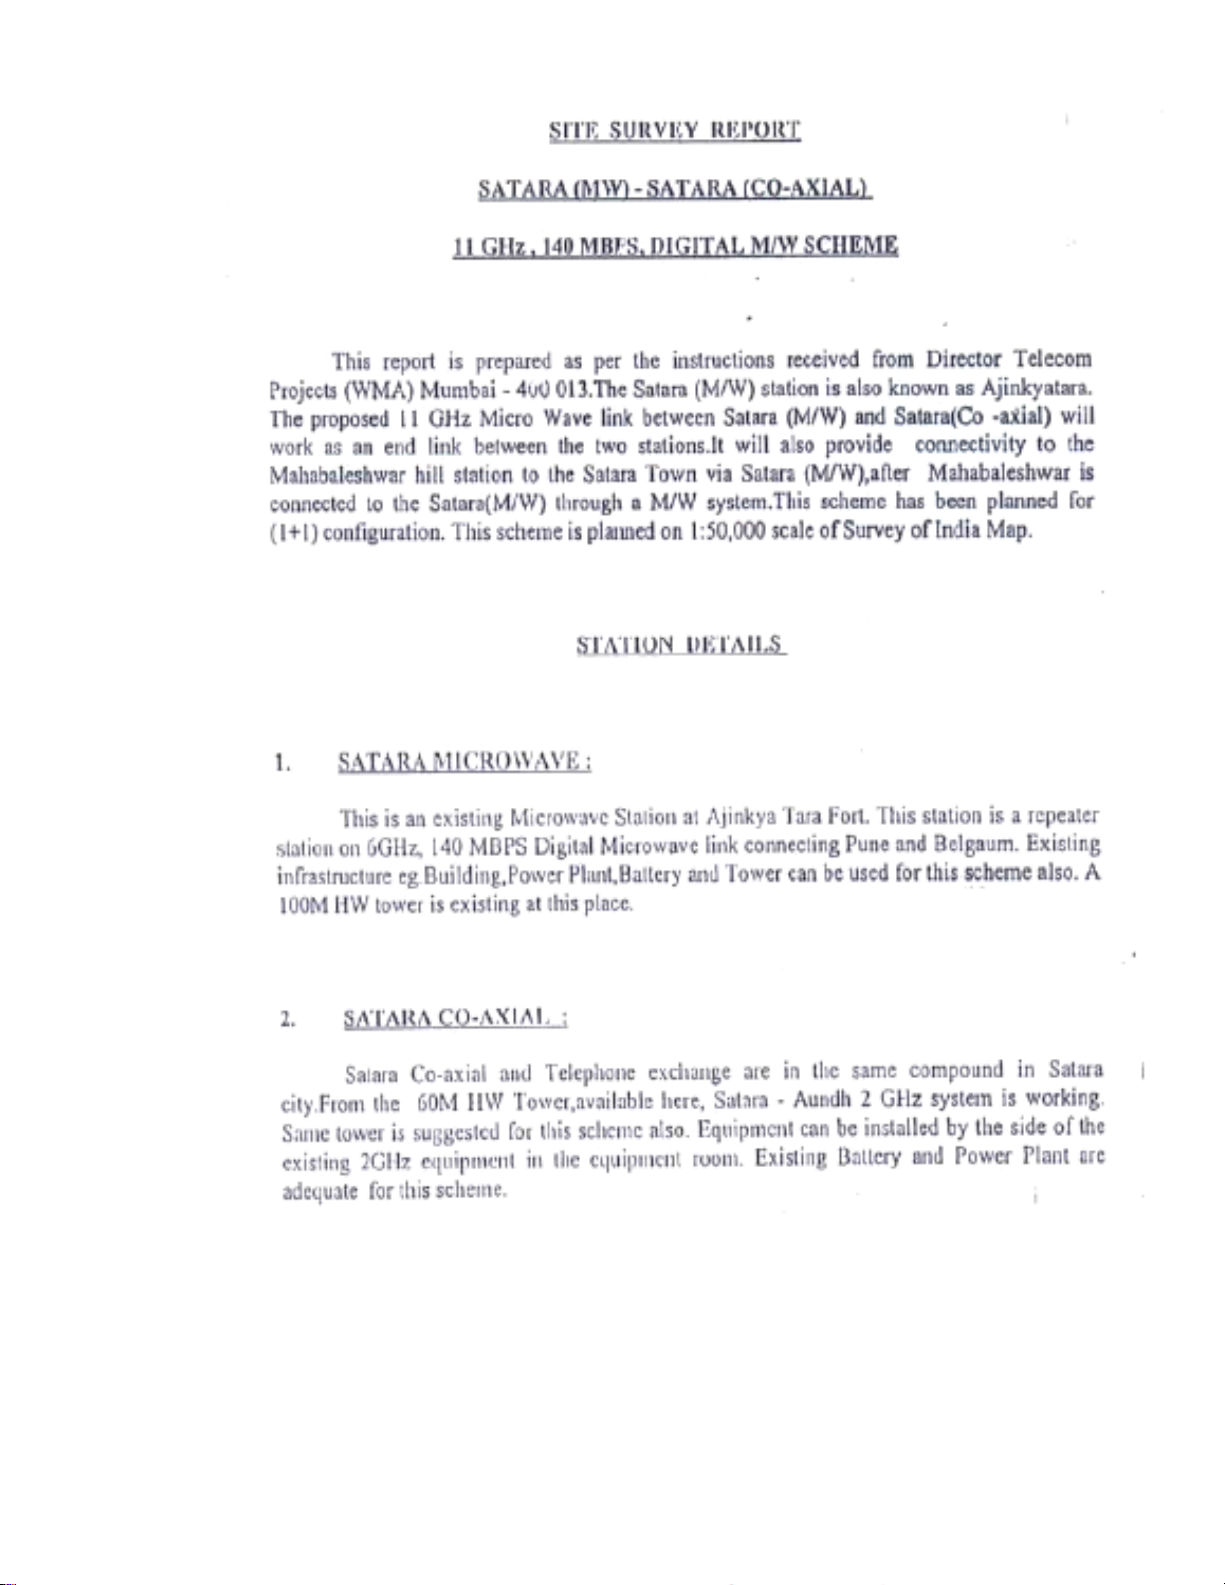
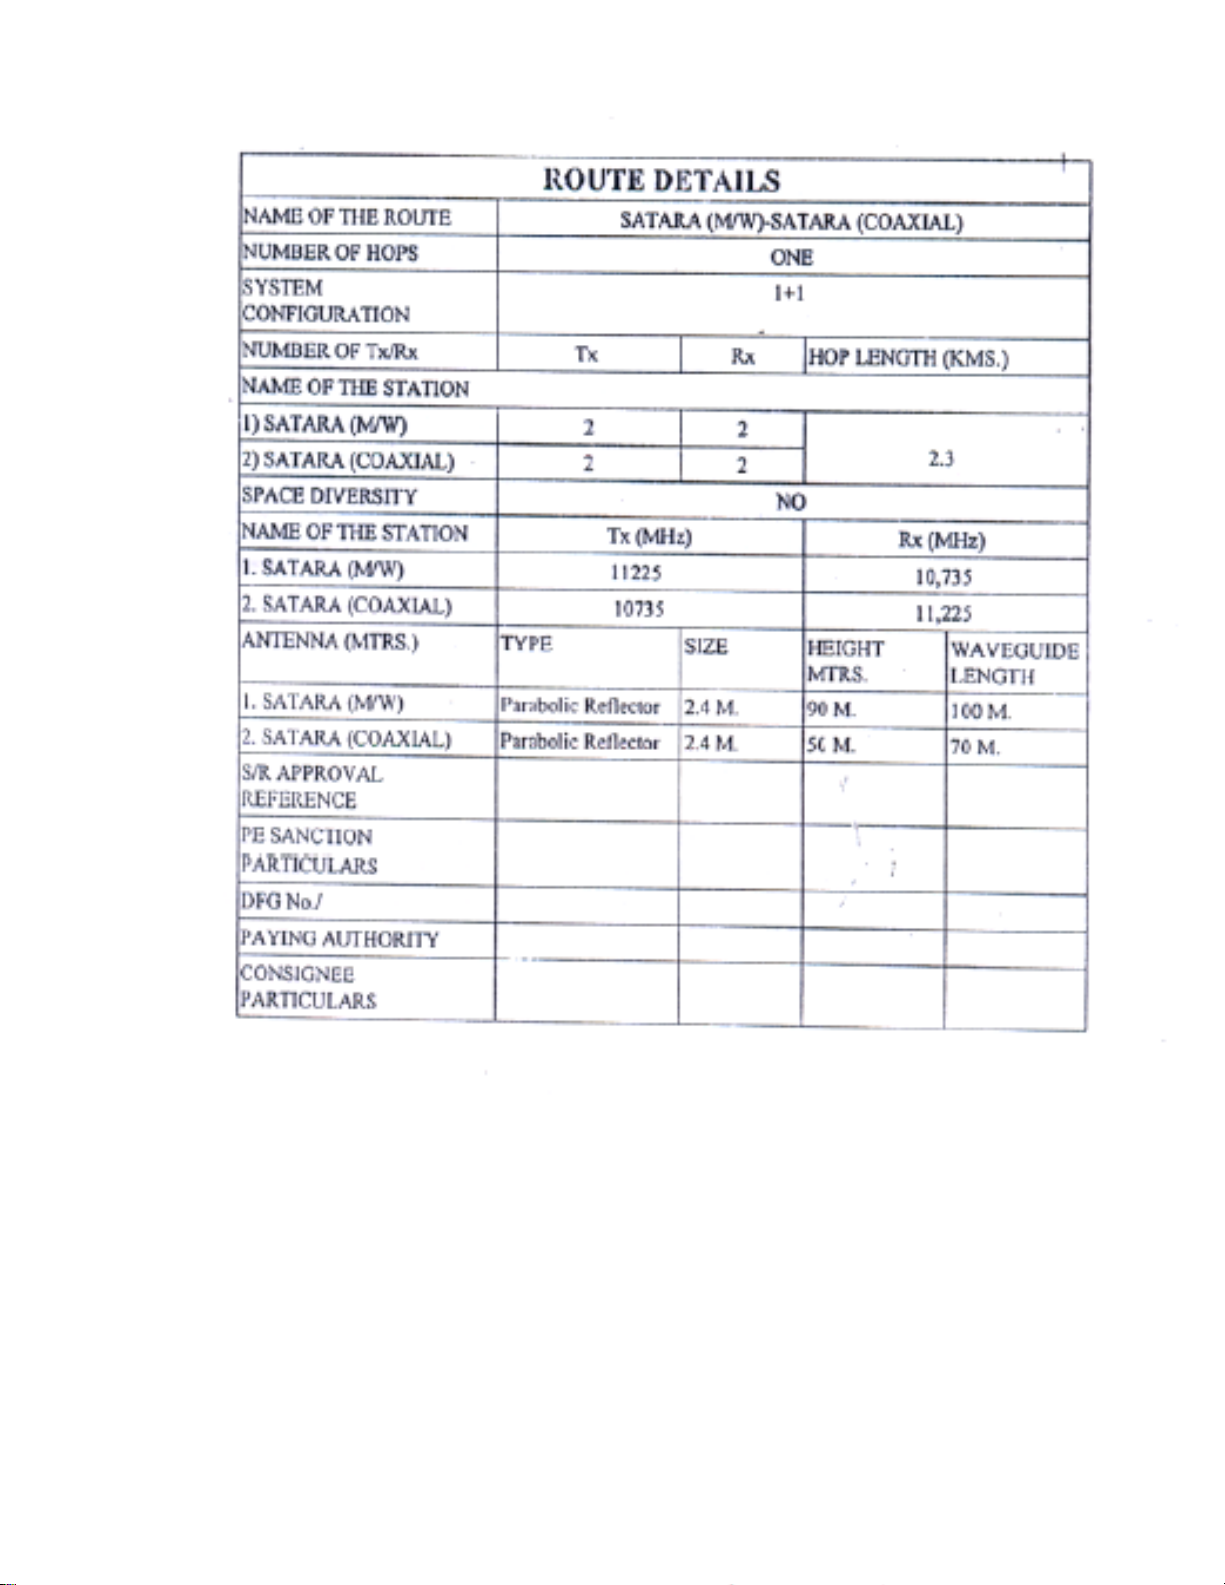
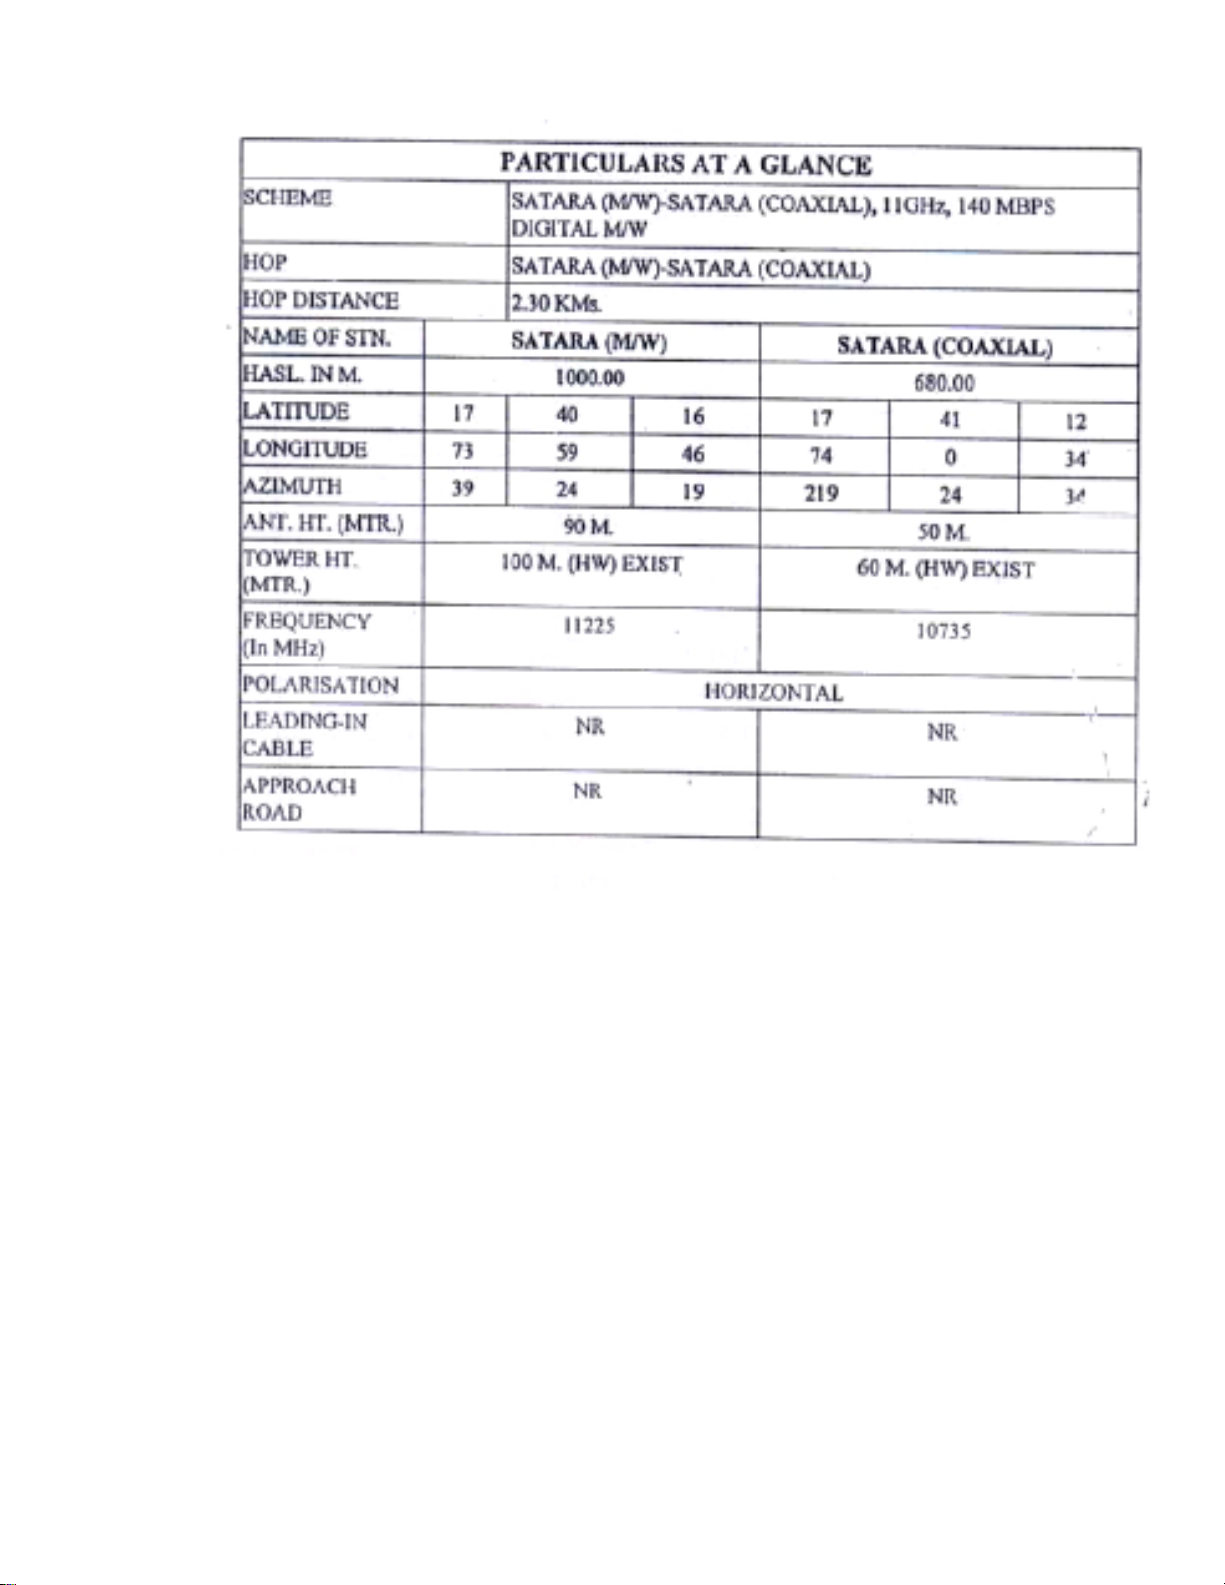
2] Collect Survey report which includes,
- Check list
- Route details
- Site survey report
- Particulars at a glance
- Clearance calculation
- Path data calculation
- Rain attenuation calculation
- Availability calculation
- Interference calculation
- Tower diagram
- Line diagram
- Path profile
- Site map
Here you have to check the deviation in survey and nominal level which should not be
more than ±3 dBm.
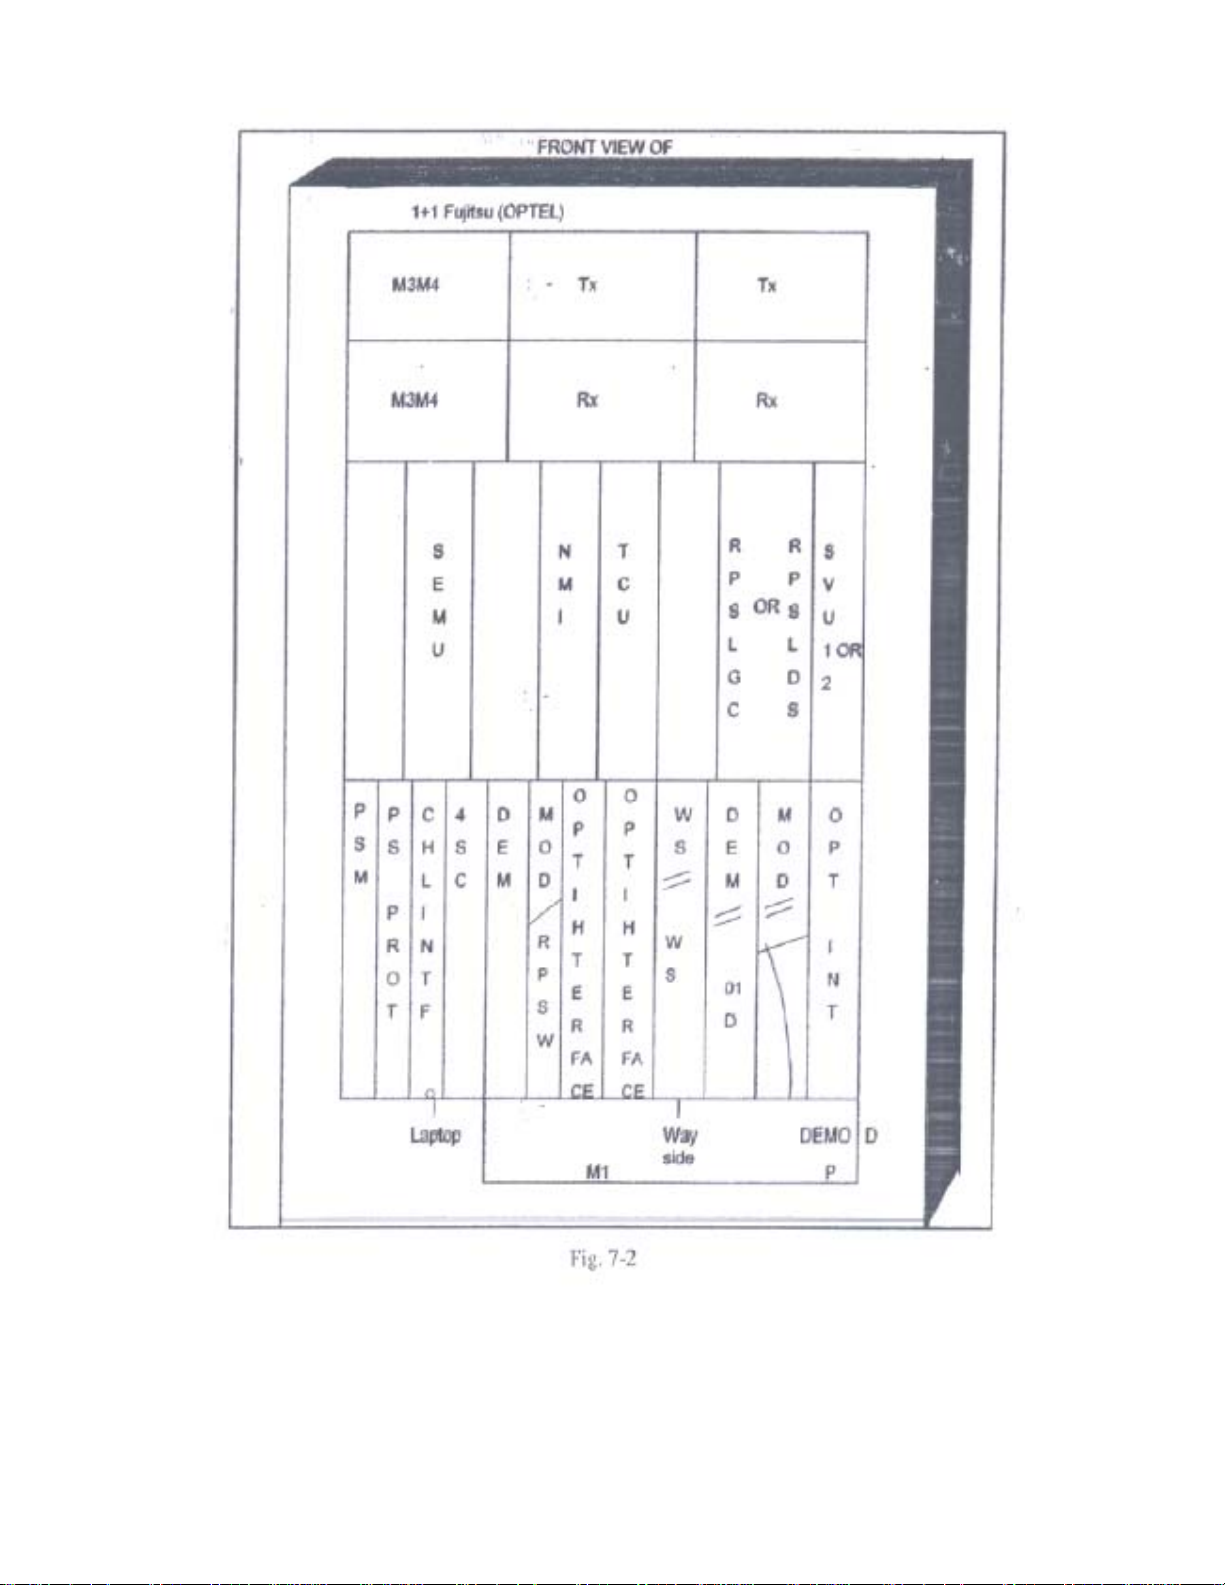
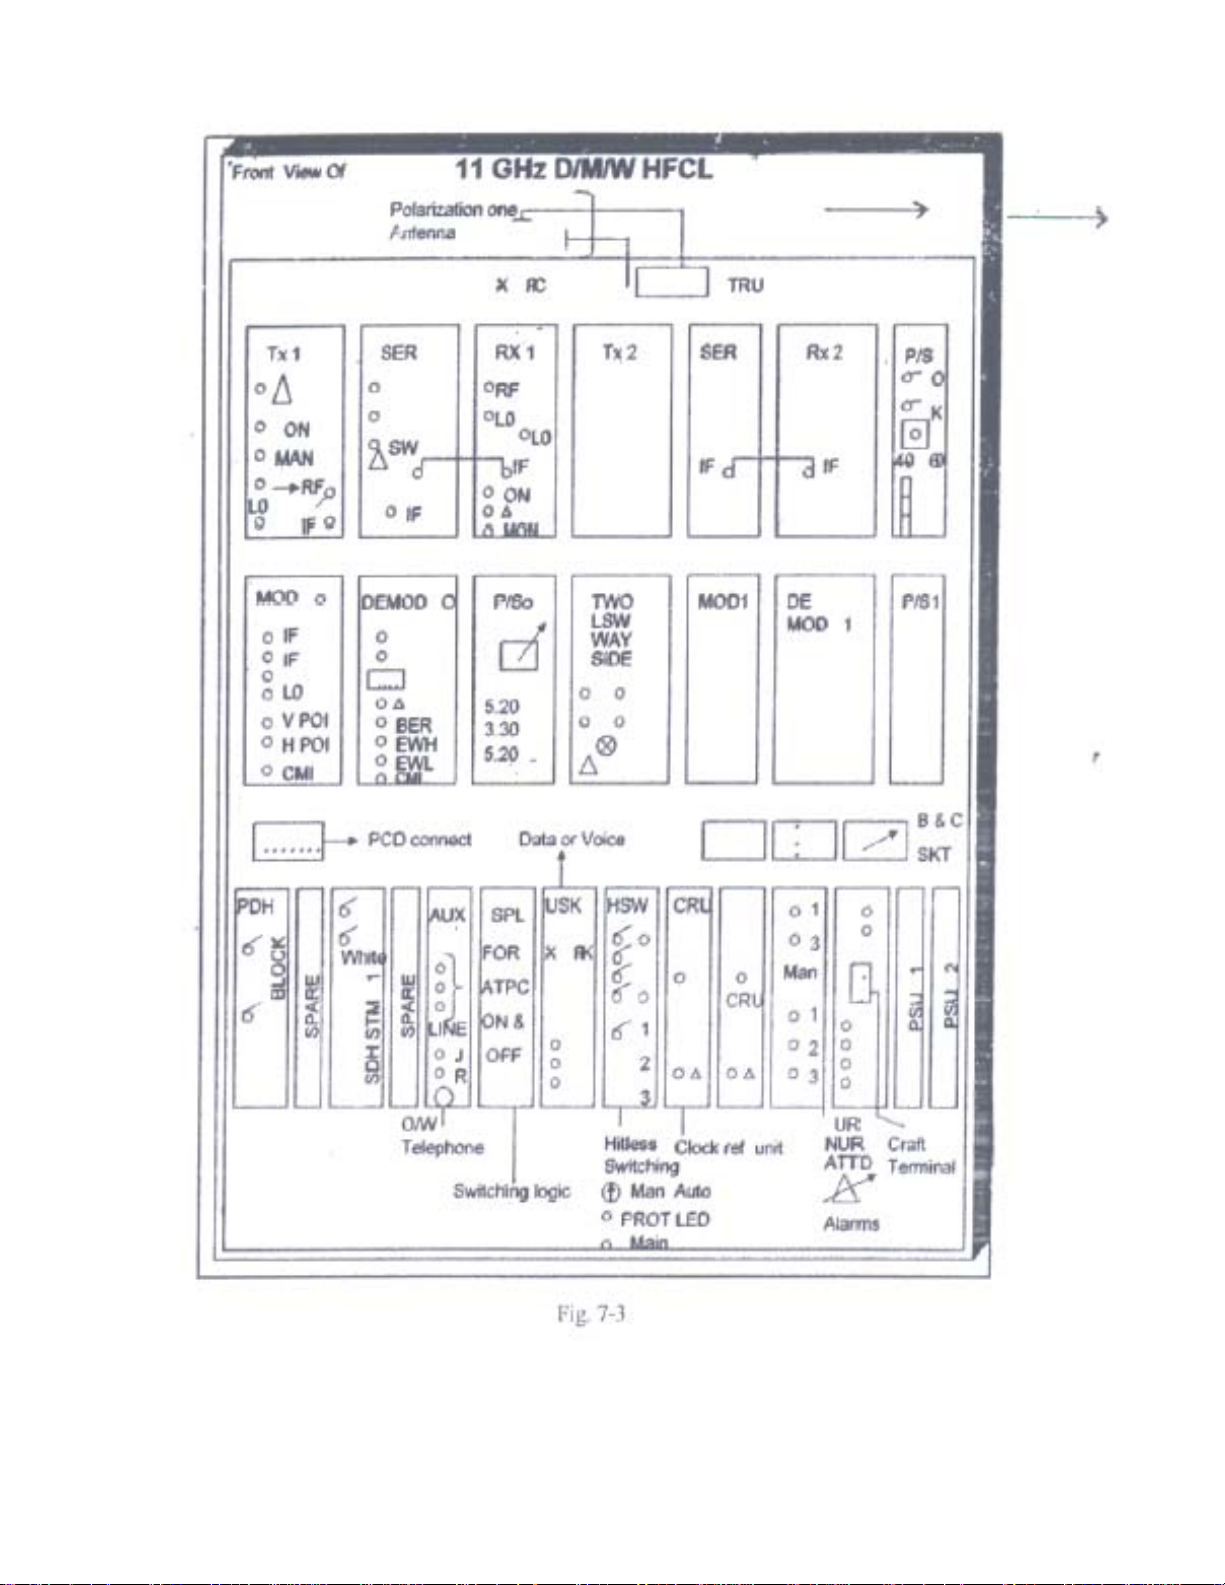
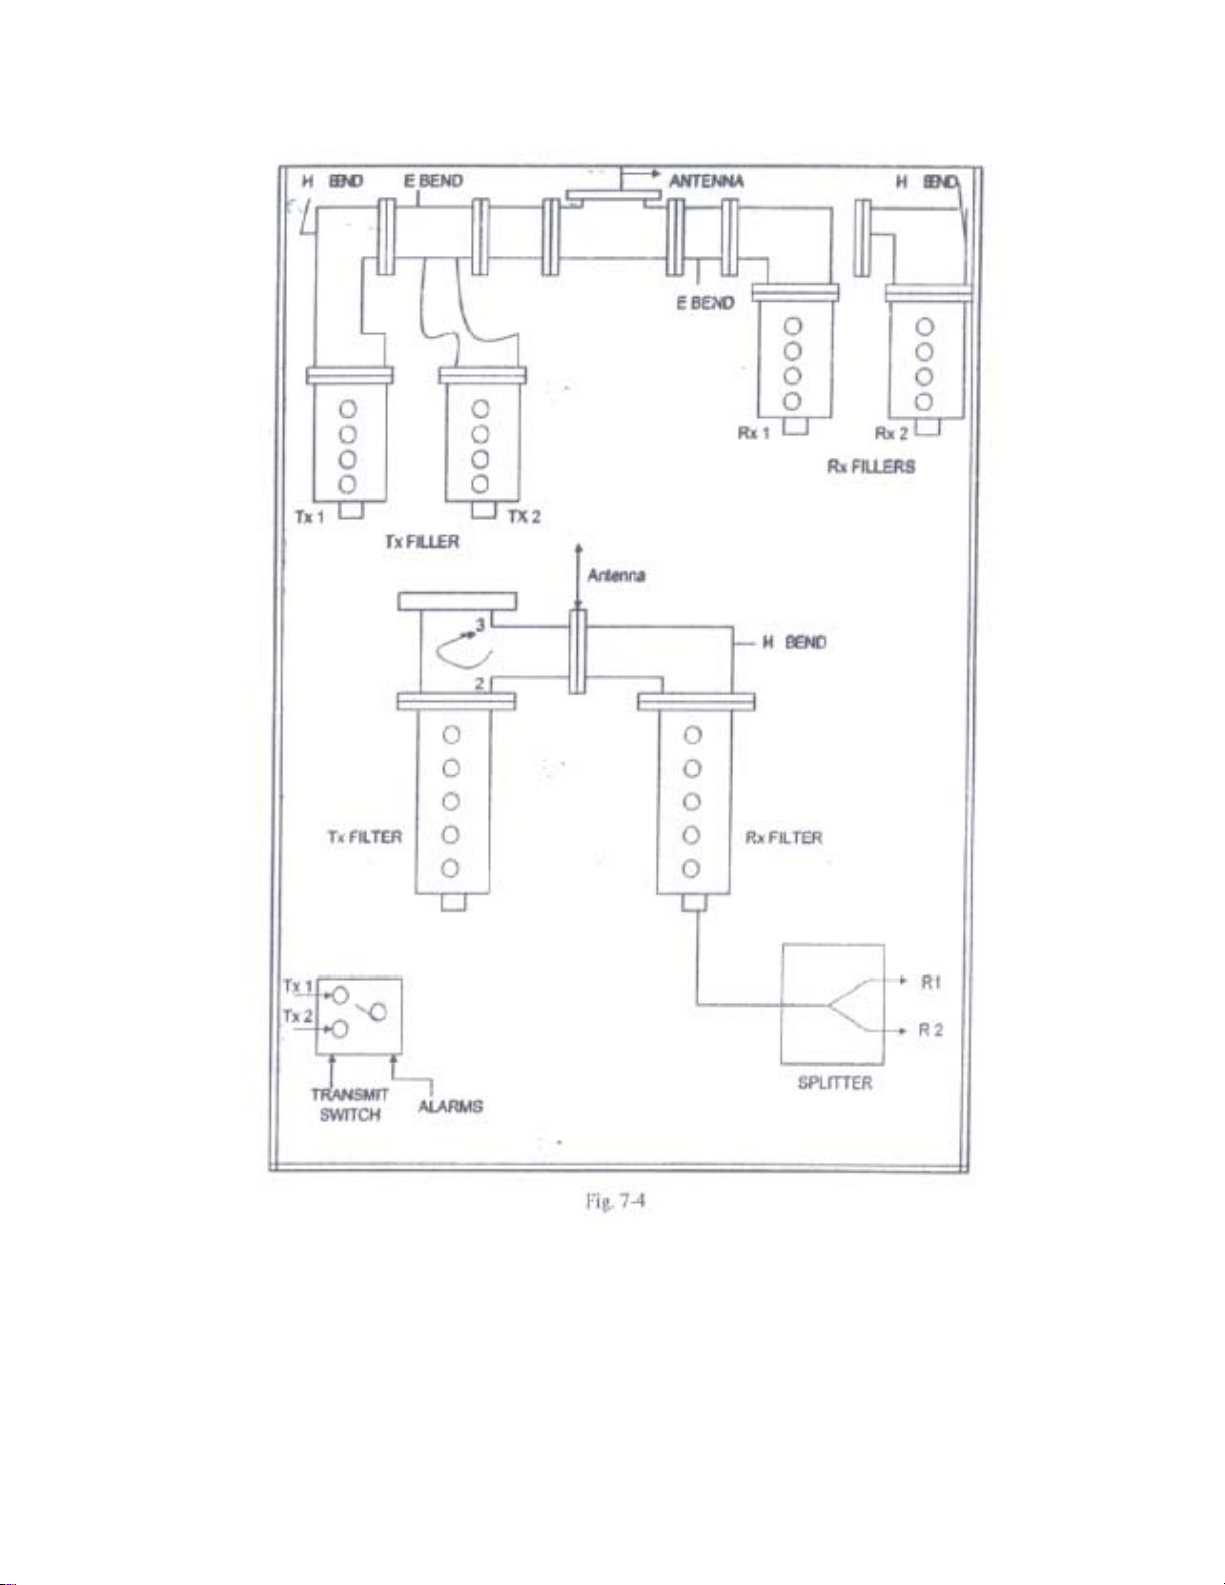
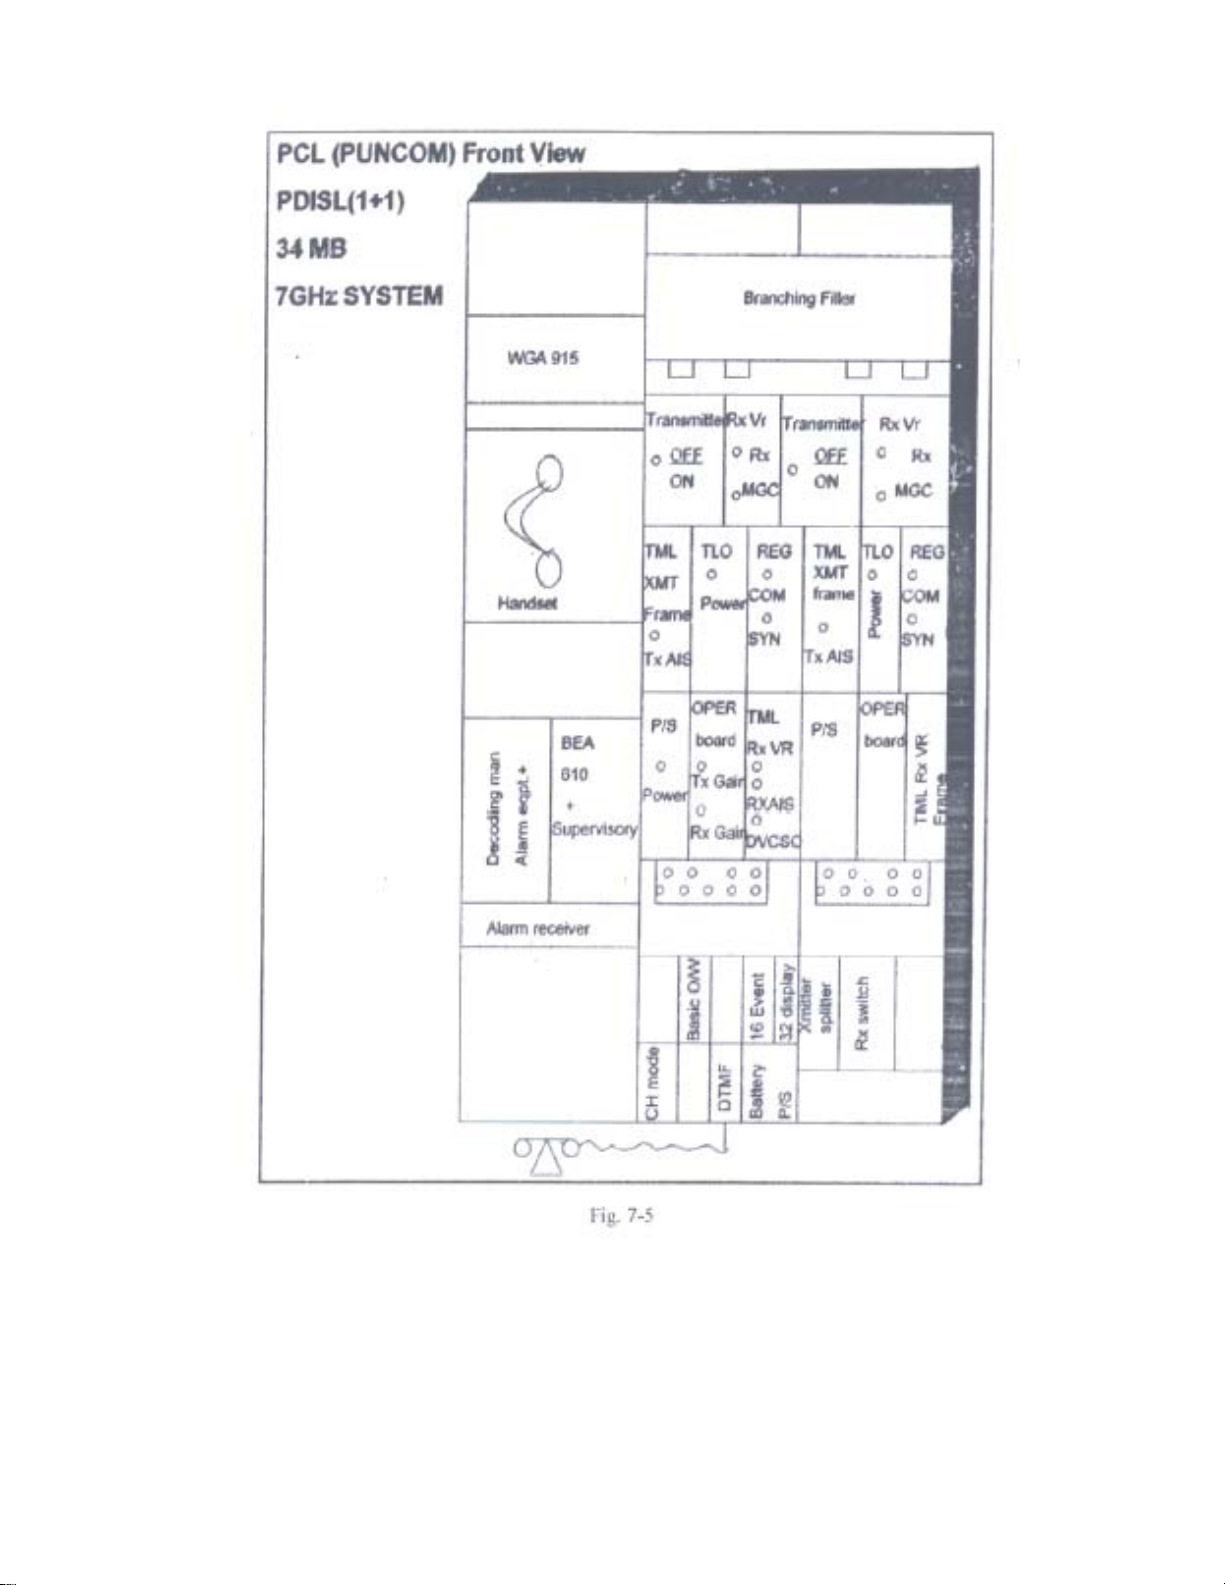
N.B. Nominal system level and sample survey report 14 pages attached h/w and just for
reference Optel, HFCL,PCL system’s front views are shown in Fig. nos. 7-2, 7-3, 7-5.
3] Check whether Tower is new or existing, carry out Earth measurement in both the
cases. Limit of Ring Earth is 0.5 ohms.
4] Before starting local A/T carry out a physical inspection of installation, Tower, W/G
Earthing and its entrance in equipment room.
5] Confirm that all required meters, RF cords, available or not? This is important
because so many types of meters and cords are required in M/W A/T.
6] Check whether W/G entry is through hatch plate or not?
7] Obtain equipment room layout of all stations along with repeaters, duly approved
by DET Maintenance.
8] Take the information regarding antenna diameter, gain etc. also confirm whether
orientation of antenna is over or not, receive level is within limit or not.
9] Whether -50V is taken from MCB with proper gauge wire or not.
10] Check QA stamp or QA approval of the system
11] Obtain SACFA clearance, if not available or if applied then note down the
registration number along with the date.
12] Note down earth resistance measured by maintenance within 6 months or
otherwise carry out earth audit.
160
Page 10
161
Page 11
162
Page 12
163
Page 13
164
Page 14
165
Page 15

166
Page 16

167
Page 17

168
Page 18

169
Page 19

170
Page 20

171
Page 21

172
Page 22

7-2 MICROWAVE SYSTEM A/T
Microwave A/T comprises of - Local A/T of all stations, and Repeaters.
- Hop Test.
- Through Test.
7-2.1 Local A/T:-
There are several makes of Narrow / Wide band microwave systems, near
about all test are same except power supply points, access points. Here for example
Satara M/W station to T.E. end link of 11 GHz (1+ 1) digital M/W system MakeHFCL, is described.
1. Check of power supply:-
Measure voltage at Battery point and Bay input, note down the voltage drop. Limit :- 1.0
V. If not within limit then measure voltages step by step that is from battery- OCB
distribution- Equipment room distribution-Suit distribution and find out in which section
it is more.
Check the gauges of wires and loose connections.
Output voltages:- some systems are not having access points to measure the output
voltages.
a. Modem shelf PSU
+5.2 V, +3.3 V and -5.2V
Limit: - ±0.25V ±0.15V and ±0.25V
b. RSA shelf PSU
+5.3V +12.0V -5.5V
Limit: - ±0.25V ±0.5V ±0.25V
2. Test on Transmitter:-
- TLO: - Write down the assigned frequency of TLO and measure by Microwave
frequency counter at TLO Mon,
- Press impedance 50ohms, resolution, KHz
- Press offset and get deviation which should be within the limit of ±20 PPM
E.g. Assigned TLO frequencies 11295 MHz
Measured ------“-------------11294.935.207MHz
Deviation ----------------- -5.7PPM
Here 647993 Hz frequency is less than the assigned frequency and deviation is -5.73, so
in PPM it is how much?
PPM =
Assigned frequency in MHz 11295
-TLO O/P level (Mon):- Measure output power by spectrum analyzer by tuning TLO
frequency or by Power meter. Limit: - ≥-12 dBm
Out Hz = 64793 = 5.73 PPM
173
Page 23

174
Page 24

3. Test on receiver:-
- Check of RLO frequency :- Check of RLO frequency with unritsu or HP
frequency counter, measure frequency and offset
- Write assigned measured and deviation in PPM limit ±20 PPM
- Measure RLO output level at RLO mon limit ≥-12 dBm
- Feed Receive RF frequency at a level of -30 dBm at RX, RF and record
- 1.RF frequency limit ±250Khz
2. If level at AGC out (IF out) limit -5 ±1 dBm
3. IF level at AGC Mon Socket limit -10 ±1dBm
AGC calibration at Rx Rec I/P level
RF in
AGC
20 dB
Attenuator
SW Generator
Multimeter
IF out
MSA Receiver
Fig. 7-7
-Make test set up as per above diagram no 7-7 for 7 GHz system.
- Sweep oscillator output is to be calibrated with spectrum analyzer with -20 dB
attenuator for -20 dBm level.
- Adjust -3 dBm by IF level potentiometer and then vary AGC input level by microwave
Variable attenuator.
- Start by -20 dBm as -17 is overload and note down the BITE reading and DC Mon
voltage.
- Go low by 10 dB step up to -70 dBm and after that lower the level by 1 dBm until a
receive alarm is monitored. The level at which Rx fail LED glows , is a threshold level
for BER of 1x 10
-3
and squelch will be monitored when BER 1x 10 -5 i.e. degradation
starts and change over takes place, say at a level 2 to 3 dBm less than the threshold level.
- Now go to back to restore the squelch and note down difference. This is hysterics
reading.- Limit . -17 dBm overload, -75 dBm receive threshold Range 50 dB from
threshold.
175
Page 25

7-2.2 VSWR: - Voltage standing wave ratio
Standing wave :- If the impedance of the load (Antenna) and source ( Generator ) is not
equal, that is not matching then part of the energy is reflected back towards the source.,
some power is absorbed and rest is reflected .this interference form one set of waves V &
I traveling towards the load and reflected set travels back to generator. These two sets of
traveling wave moving in opposite direction 180 out of phase. This reflected wave which
varies in Voltage/ Current combines with transmitted wave and summation of both
produces a wave called standing wave. It forms a set of interference in the form of
standing wave. See Fig. 7-8
Fig. 7-8
SWR: - The ratio of maximum voltage to minimum voltage along with a transmission
line is called SWR. When impedance of source (Transmitter), media (Waveguide), and
load (Antenna) is matching perfectly then SWR = 1.
VSWR: - Due to the irregularities in waveguide, voltage tends to add to get maximum
voltage and due to phase difference voltage tends to minimum also.
Cause of worst VSWR: - Inside damage of waveguide, bends, inside water, loose
connections, inside holes etc.
If not within limit then required receive level is not possible at distant end , degradation
of services, poor coverage in case of GSM.
Return Loss: - It is a ratio of amplitude of reflected wave to the amplitude of incident
wave. This loss shows reduction in amplitude of reflected energy compared to
transmitted energy. Is is expressed in dB. It is a measure of irregularities in W/G. Return
loss should be always more to suppress echo distortion, inter modulation noise and to
maintain group delay and response within limit.
Vr
Return Loss = - 20 Log ρ (Reflection coefficient) = ---------------- Vi
Vr: - Reflected voltage wave and Vi: - Incident voltage wave.
How to measure Return loss:-
- Make set up of System Analyzer Transmitter, Receiver, Termination Bridge as
per diagram no. 7-9, 7-10, 7-11.
- adjust sweep oscillator for desired band of frequency, confirmed by frequency
counter.
- Calibrate level with open/ short and load connectors.
- remove Connectors and connect W/G to the test port.
- Read the trace and return loss over the required frequency band.
176
Page 26

177
Page 27

-10 IF in
MSA Transmitter
IF O/P
201 70
MSA Receiver
Counter
IIF return loss
Fig. 7-10
Conversion chart of VSWR, Return Loss and SWR.
VSWR Return loss
In dB
Reflection
Coefficient
1.01 46.1 0.5 0.086
1.02 40.1 1.0 0.172
1.03 36.6 1.5 0.257
1.04 34.2 2.0 0.341
1.05 32.3 2.4 0.424
1.06 30.7 2.9 0.506
1.07 29.4 3.4 0.588
1.08 28.3 3.8 0.668
1.09 27.3 4.3 0.749
1.10 26.4 4.8 0.828
1.11 25.7 5.2 0.906
1.12 24.9 5.7 0.984
1.13 24.3 6.1 1.06
1.14 23.7 6.5 1.04
1.15 23.1 7.0 1.14
1.18 21.7 8.3 1.21
1.20 20.8 9.1 1.44
1.30 17.7 13.0 1.58
1.50 14.0 19.95 2.28
1.43 15.0 17.78
1.38 16.0 15.85
1.33 17.0 14.13
1.29 18.0 12.59
1.25 19.0 11.12
1.222 20.0 10.00
1.196 21.0 8.93
1.173 22.0 7.943
1.152 23.0 7.079
1.135 24.0 6.310
1.119 25.0 5.563
1.106 26.0 5.012
1.094 27.0 4.467
75 Ω
termination
IF in on Rx card
SWR
In dB
178
Page 28

179
Page 29

180
Page 30

Please see the Wiltron diagram,
Anritsu detector converts power into voltages.
- Connect Open , select
- Connect Short , select
- Connect device ,
- Start select,
- Function,
- Max /select -20 dBm,
- Min / select -34 dBm,
- Cursor also move for max to minimum.
Wiltron Generator: - See Fig. 7-12, 7-13.
- Take 10.7 to 11.7 GHz
- Level +10 dBm ( + 7 to + 12 can be taken ) and calibrate Analyzer,
- Start calibration ,
- Select Open / Short ,
- Calibration completed,
- Connect device,
- Move cursor on; get trace for max and minimum.
Open
short
Analyzer with sensor
Generator blue cord
Compiler
Fig. 7-13
- Select 11 GHz band, take marker on max and min by function switch and select
max -26 & -34 dBm.
7-2.3 Some General test: Image Frequency Rejection test: -
- Image Frequency = Receive frequency + 2 IF
- Feed Image frequency at a nominal level of the system, at antenna port.
- Measure IF Out level at RRF out.
- Image frequency Suppression should be > -65 dBm.
181
Page 31

. Check of BER with IF Loop: -
4
oop IF Trans to If Receive and test 140 Mb/ STM-1 on DTA set for 0 PPM and ± 15
L
PPM. The result should be 0.00 E
-11
5. a) Trans Branching Filter loss: -
The difference between Trans Power at PA out and antenna port will be a Trans
Branching Filter loss.
b) Receive Filter loss: -
Feed RF Frequency at a nominal level to antenna port and measure at Rx in,
Calculate receive filter loss.
Limit: - Tx + Rx combined filter loss should be 6 dB max.
6. Isolation between Transmitter and Receiver:-
- TX – Rx
- Keep Transmitter ON, for Tx – Rx isolation.
- Tune the transmitter frequency at RRF in point on spectrum analyzer.
- Limit: Better than 70 dB
- Rx-Tx
- Feed Rx RF at antenna port and measure at co-axial cable connected to PA out ,
- Limit: Better than 70 dB
7. Waveguide pressurization in Kg/ Cm
- Note down Waveguide pressure in Kg/ Cm
2
2
8. Some test of 7 GHz system: - ALC Test (Automatic level control)
- Make the test set up as below Fig. 7-14
- feed -3 dBm to IF in
- Adjust +30 dBm at PA out
- Vary IF level from -1 to -7 dBm
- Observe level at PA out which should be near about constant , one example,
- IF PA
-1 +30.000
-3 +30.05
-5 +29.99
-7 +30.05
System
analyzer
IF O/P Level
is varied
IF O/P
70 MHz
RF out at Eqpt. top
Power meter
Fig. 7-14
Low Transpower alarm:-
- Same set up ALC and go IF level low to see Transpower alarm LED to glow
by 3 dB minimum
- This alarm on display shows at > 33 dBm and < 25 dBm Transpower
- Go low by 1 dB step to get this alarm.
182
182
Page 32

7-2.4 HOP A/T OF 11 GHz 140 Mbps or STM-1
1] Receive level: - Note down Surveyed level, Nominal level and measure Rx RF level
at Rx IN by power meter with suitable sensor and pad by removing the W/G from RF IN.
m - The same Rx RF level can be easured with calibrated spectrum analyzer and by
tuning the required frequency of a channel, deviation between measured and survey
should be within ±1 dBm.
- The deviation betw
As per the test schedule of DOT ML section..
(If provided)
an -30 dBmo from measured RF level or better. be Better th
2] ea and at Mon skt Limit -10 dBm.
M sure IF level at AGC out. Limit is -5 ± 1 dBm
Me r this is for
asu e AGC voltage at connector M-69 pin 1-8, reading may be -6.0 V,
refe n
re ce only.
3] Group delay and IF response:- See Fig. 7-15
It is the transit time delay effect. The transit time for a transmission path is a
tim
time is given by the rate of phase shift & a
Ta tke est in MGC (Manual Gain control) only, keep al
MLA Transmitter at one end MLA receive
een surveyed and nominal level should be within ±3 dBm.
ain and Protection channel with ATPC ON , - Measure Rx level on all M
rization (i- Measure Rx level at RF Rx IN due to X- Pola
or current to travel through the transmission path. This e required by a specific voltage
ngular frequency.
l station MOD off.
f provided) which should
r at other end
ed
193 10 90
-3
IF IN on
Transm
Front
- Blinking O
- X select IF -Character ON
- Counter -PLL out frequency high
- P chose frequen T Tr P
- Auto at 83.5 KHz -Threshold EXT Off
- IF (BB frequency) - EXT/Line selector
Line marker selector
Received CF – 70 MHz
Sweep width – Type A ± 10 or Type B ± 6 or ± 9.5 as per system, Adjust IF to -3 F = 200
KHz rms, BF= 250 MHz
Y1=
Y2 = Delay 16.1 nanosec. P-P
conditions
itter
Rear
N -BB select NML
-P cy -CR ace CM O/
IF Amp1.87dB P-P,
ent 200 KHz deviation, Sweep ±10 or ±6 MHz, 7 MHz and 250 KHz BF,-3.0
- S 0
dBm from MLA Transm
- Distance station will receive on display.
Sweep shows 0.00MHz. Adjust AGC and MGC
- When IF is through
for -3 dBm and then from MSA generator.
itter at IF in
P-P
IF O/P
I/P
IF
Fig. 7-15
183
Page 33

4] BER measurement:-
- Ask distant station loop on 140 Mb or STM-1 which is installed.
- Carry out BER Test as usual for 0 and ± 15/20 PPM.
- Take out printout for each channel/PPM ,
- Limit: - 1x 10 E
-11
5] i
J tter measurement :- ( as mentioned in OFC systems Pl)
Carr on channels for the following
freq
Filters as HP-1+LP & HP-2 +LP.
o
y out I/P Jitter test for both Main and Protecti
uencies: - 200 Hz, 500 Hz, 10 KHz, 3500 KHz, and note down the results in UIPP.
O/P Jitter: - Select
F r Limits pl see the table.
6] AIS measurement:-
Measure AIS frequency by frequency counter when there is no data input at other
end. Limit: -
± 15 or 20 PPM
.
7] BER performance at different Receive RF level:-
Arrange Microwave variable attenuator; connect it in RF Receive path. Check BER
performance at various levels e.g. -40, -65, -70, -75 dBm a
t 0 PPM, note down the ber
along with AGC voltage in each case.
8] Check of ORDER WIRE:-
Feed -3.5 dBm tone at various frequencies in O/W Tx pin point and measure at O/W
Rx in point at other station , check O/W response 0.3 KHz to 3.5 KHz
over
Limit :- ± 2 dBm.
- Measure idle channel no ,
ise
- Check O/W availability of O/W in the absence of data ,
- for signaling and speech by dialing all stations order wire
Check O/W nos.
9] Protection Switching: - Protection switching may be carried out as per test schedule
under various conditions.
10] Monitoring with BITE: - If Hand
then Tx , Rx power and other 10 to 12 parameters ar
held terminal (BITE) is provided with system
e to be checked as per sheet.
11] Remote Supervision on PC, in service
Alarms like RF IF , DEMOD, X-PIC Tx power
monitoring :- Trans , Receive power ,
are to be monitored with PC.
12] Way side droppin
g test: - Arrange 2 Mb loops from distant station and check
BER for 0 and ± 50 PPM. The result should be no Error.
184
Page 34

7-3 Microwave constituents
7-3.1 1. Antenna: - It is a metallic device
in the form of electrom
, GSM and CDMA network.
M/W
agnetic waves. Antenna used for the transmission of Radio, TV,
There are two types of antennas. 1. Omni directional (radiates equall
which transmits and receives Radio signals
y in all direction)
It is a simple rod.
2. Directional (radiates in one direction only)
- Yagi : - Directio
nd its components are Reflector, Feed, Support (Tie beam)
a
- Parabolic: - It is made up of 2 to 4 meter diameter
nal antenna of array of dipoles.
Antenna gain: - = 4 П A (equivalent area of antenna.) 4n (frequency) A (area)
----------------
Λ
2
(Wavelength) 2
------------------------------ Or ------------
- If size of antenna is reduced, gain is reduced.
- If frequency is increased, gain increased.
- Size of antenna depends upon operating frequency, Atmospheric losses and Rain losses.
Antenna Gain as per the system and diameter:-
2.0 – 2.3 GHz 0.6 M dia 19.6 dB
1.2 M dia 25.6 dB
1
.8 M dia 28.9 dB
12.75 – 13.25 GHz 1.2 M dia 41.7 dB
1.8 M dia 45.1 dB
Dia t
me er 2 G 6G 7 G 11 G
1.8 M 29 38.3 39.2 43.8 dB
2.4 M 31.5 40.2 41.2 46.2 dB
3.0 M 33.4
43.0 45.0 48.1 dB
3.7 M 35.0 44.8 46.4 49.6 dB
2. Wave-guide Pressurization and dehydration:-
It is to be done to avoid moisture, dirt, and corrosive gasses. W/G are
to be filled by gas and it is to be properly sealed. Pressure may go down for any leakage.
The machine to generate this slight pressure is called Dehydrator. Som
pressure is als
o required for sealing against leaks. One of such dehydrator is from High
etime high
Tech Pneumatics Dehydrator. LEDs are provided on front panel such as,
- Compressor O
N,
- Low power,
- Overload ,
- Alarm, and
- Pressure and Humidity indicators.
aximum operating Pressure: - 0.25 Kg / cm2
M
inimum -------‘’------------ -:- 0.10 Kg / cm2
M
ow pressure alarm : - 0.08 Kg / cm2
L
ressure should hold for 12 Hours.
P
185
Page 35

7-3.2 3. Link Budget:-
Link budget is to calcula Receive level taking into
consideration all gains and losses in the ne rk. It accounts attenuation of transmitted
signal due to propagation.
Formula: - Pt + Gt + Gr – L –
Pt – A Transmitter power.
Gt + Gr - Antenna gain in both directio
L - Free space loss.
FL – Feeder cable loss in both directions.
Br – Branching filter loss at both end.
This Receive power to be calculated for RF IN or Rx IN and
e.g. Free space loss = 20 log FD + 92.4 = 144.60 dB
.
Branching filter loss = 5.60 dB
Feeder loss = 7.52 dB (4.70 dB / 100
Total loss = 157.72 dB
Antenna gain = 45.60 X 2
Trans power =
Total gain = 121.20 dB
Calculated Receive level = - 36.52 dBm
4. Wave guide: - It is a hallow copper corrugated w
For carrying electromagnetic waves. It provides most efficient path for electrical
energy at higher frequencies. It is guided
Three types of waveguides: -
1. Rectangular
2. Circular
3. Elliptical
Rectangular and circular waveguides are rigid and ellipti
Rectangular wave guide: - Loss
4 GHz WR229 0.85/100ft
6 GHz WR137 2.0/100 ft
WR159 1.4/100 ft
-8 GHz WR112 2.7/100 ft
7
11 GHz WR90 3.5/100 ft
13 GHz WR75 4.5/100 ft
Used where Critical application and low VSWR is required.
Circular wave guide: - Lowest loss, Support to orthogonal polarization.
Loss:- 4 GHz 1.5 dBm /100 M
6 GHz
11GHz
3. Elliptical W/G RF Band Type Loss/Meter
6.425-7.125 GHz
7.725-8.275 GHz CWSP 8M 0.060 dB
10.7-11.7 GHz CW
te particular M/W system
two
FL – Br Where
ns.
not for at antenna port.
Meter.)
91.20 dB
30.0 dBm
ith thick blanket in different shape
electrical energy to flow just like a water pipe.
cal waveguide is flexible.
1.9 dBm /100 M
1.8 dBm /100 M
CWSP 7L 0.046 dB
SP 8M 0.090 dB
186
Page 36

7-3.3
5. Fresnel zone: -
No. of concentric ellipsoid revolutions which defines volumes in radiation pattern of
ircular aperture and it is due to diffraction by circular aperture
c
The first zone is circular; sub second zones are annul
with first.
This zone concept is used to analyze interference by obstacle
Second
by r
T A R
Hilly Terrain
6. Fading: - It is a distortion in micro media and introduces errors
There are two types of fading: -
1. Slow (shadow) fading: - It is on large scale due to movements of mobile or
obstruction within propagation environment.
2. Past fading/ Multipath
by superimposition
in attenua
This is by
signal caused by changes in transmission media. It occurs with small mov
of mobile obstacle.
Remedy: - Diversity through multip
Fade Margin: - There should be sufficient
fading to achieve the requisite system qu
reduced without causing system performan
e.g. let Rx level -40 dBm and system wil
margin is 40 dB
7. X- PIC: - Cross polarization interference cancellers: -
Frequency reuse technique is adopted in micro system due to
a microwave signal is transmitted to both vertical and horizontal feeds and are coupled, in
the antenna. These two vertical and horizontal polarized signals
interference due to cross polarization, due to rain or hydrom
polarization interference the reasons are rain, hydro, mult
characteristics the cross pick use to cancel the effect of XPD of both signal i
direction
E.g. now station A transmit power on M1 channel measure at station B on r
channel.
ow let M2 channel transmit the power, measure receive power at station B of M1
N
hannel again so
c
PD will be difference of these two readings.
X
PD: - Both received signals are decoupled by XPD of antenna at the receiving end.
X
tion, delay and phase shift while traveling from the source to receiver.
attenuation of single signal. It refers to the time variation of received
fading / Slow fading: - It is due to multipath propagation
of transmitted signal that have experiences due to diffraction,
TR – Direct path and TAR –
le antenna.
margin or sensitivity to accommodate expected
ality. It is margin by which Rx level may be
ce to fall below a specific value.
l continue to work till -80 dBm. It means fade
ar in cross section and concentric
near the path of radio beam.
ary transmission path
eflection of M/W energy from A.
in radio system
ement
limited frequency spectrum
can cause the
eters which is called cross
ipath propagation, antenna
n received
eceive of M1
187
Page 37

-3.4 8. Rain attenuation: - As the water droplets scatters and absorbs radiation the effect of
7
rain go
compared to 4 and 6
Formula A (dB) = 0.0308 f – 0.1872R, R - Rain rate at that location = ------------
Where f = operating frequency within 10-15 GHz
This rain attenuation can be reduced by interconnecting two stations separated by di
greater than
9, Diversity: - If channel is affected by loading then second channel will take load here
configuration, Parallel system is provided so that two systems can carry the same
equipment/ frequency diversity. As it is required two sets of equipment/ frequenci
equipment is more. Signal is spread out over a large frequency band width.
Types of diversity: -
es on increasing with the increase of frequencies i.e. it is more in 13 GHz system
GHz
stance
likely size of rain cell i.e. by space diversity.
in 1+1
traffic, called
es, cost of the
1. Time diversity: - Multiple
instance which is useful for forward error correction.
2. Frequency diversity: - A parallel stem is provided 1+1 so that both systems should
carry the same traffic. It requires two set
equipm
reliability as fading is least likely to af
ent as well as frequency diversity so it is expensive. This technique a high order of
X
X
X
X
version of the same signal are transmitted at different time
sy
s of frequencies. This method is providing both
fect both frequencies.
RCC1
CONBINER
RCC 2
O/P
TR
I/P
TR
Fig. 7-16
3. Space diversity: - It is applicable in W/B system for larger ho
two Antennas. Main antenna at station A transmits signals of all frequencies, at station B signal
received by both antennas main and space diversity which will detect the signal with lowe
loss between two sites.
X
X
X
X
Tx
X
X
X
X
ps. Each site is provided with
RX 1
RX 2
st path
O/P
188
Page 38

Antenna diversity: - In this diversity schem microwave signals are transmitted along
e
with different propagation path with the help of second antenna at receiving end to
improve received performance.
7-3.5
10. Hot stand by: -
If main equipment fails automatic switch over takes place on a stand by equipment set i.e.
a complete set of parallel equipment is switched in almo
st instantaneously on failure of
operating equipment. This is also called a equipment diversity. It requires only one set of
frequency for frequency for a particular route. Here there is no frequency diversity so one
band of frequency is saved. In this Configuration system is 1+1 on 6+1 i.e. 1 or 6 main
channel and one is protection channel.
11
. Hitless switching [Error less switching]:-
Thi
s is carried out at base band stage only for fading condition and manual switching is
for
maintenance purpose. Protection switching is inhibited at receive side and change
ove
r taken place when,
1. B
ER> 10
2. Frame Synch loss when BER >10
-3
3. CMI O/P to Mux is lost
Here Priority is 3>2>1
Process:-
- Fault in reg annel detected at receiving end.
- Faulty cha l switching control is transmitte received end to transm
ular ch
nne d from itted
end.
- Transmitted end switch control disconnect radio pilot signal from the protection
channel and transmit the I/C regular and Prot. channel is detected.
- Hitless switching for regular to protection channel takes place.
12. Free Space loss: -
It is the lo ilar antennas in free Space where there is no ground
ss between two sim
interference, obstruction.
Free space loss = 32.45 +20 log D+ 20 log F
Where D= Distance in Km
F= Frequency in MHz or
Free loss = 20 Log FD+92.4
Loss of signal strength due to absorbing, diffracting, obstructing, Refracting, Scattering
and reflecting when two Antennas are is free space without connector, Cable loss.
189
Page 39

13. Wayside dropping: - If any small station in any hop requires 2 MB stream, an
additional card is provided in system so as to handle the traffic of small station
along with main M/W system.
14. IF DADE: - Di
fferential Absolute Delay Equalizer.
It is to adjust the phase difference between signals received through
main and space diversity antenna. This phase difference causes loss of bits. DADE
cable is used and it is placed between IF out and RX2 IN. It contains a delay cable of
length L to compensate the delay time difference between main and Receiver and space
diversity receiver.
15. ATPC: - Automatic Trans Power Control.
ATPC facility was introduced first time by BOSCH in 6 GHz M/W system. It
is available in order to reduce interference from neighboring system this can be
achieved by strapping in conf. management facility in craft terminal. There are three
types of settings, Auto
40,-50, or -
60. Receive power can be adjusted to -33 to -50 dBm by adjusting Trans
power at distant end. This is achieved
ON strap between 8 to 9 an
, Tran’s power high and Low. ATPC threshold also cab be set to -
by some strapping in MOD unit. e.g. for ATPC
d ATPC OFF strap between 10 to 8 .
16 i urve
. S gnature Test :- ( M curve test ) See Fig. 7-18 for C
This test is to see how much notch depth can be tolerated for 10
rate. For this test Fade simulator is required.
20 db
10 db
5 db
2 db
Fig. 7-1
8
-3
190
Page 40

7-4 2 GHz / 8 MB D/ UHF System A/T
Make: - ARM-2208-M3
Specification: - 7-4.1
- Frequency band 2.0 to 2.3 GHz.
- Bit Rate 8.448 MHz 75 Ω.
- Tx- Rx Spacing 161 MHz.
- RF Tx: +30 to +32 dBm at antenna port.
- Receive IF frequency 70 MHz.
- Transmitter PA out +34 dBm max.
- AGC dynamic
range 45 dBm for threshold.
- Ref Rec. I/P level -42 dBm ± 1 dBm.
- Overload of LNA -35 dBm or better.
- Receive Threshold for BER of 1 x 10
-3
-86 d
Bm at Rx In.
- O/W response ± 2 dBm.
- Noise level -53 dBm.
7
-4.2 Before starting Local A/T,
- Ensure availability of M/W testing meters.
- Ask for purchase order/ allotment letter of the system.
- Get Q/A report /stamp.
- Ask for survey report and check surveyed level and nomi
nal level, the deviation
should not be more than ± 3 dBm.
- Mostly towers are existing but whether Tower is A/Td or not? Insist for Tower
clearance letter.
- Mostly SACFA is not applied or registered for clearance, Please note down
registration no.
- Carry out physical inspection of equipment installation, W/G up to the bay and
vertical runway above the bay for power cable is provided or not? And W/G is
properly earthed or not?
- Al
- Carry anc
s ake care regarding Air conditioning, Fire detector/ Extinguisher, Sufficient
o t
mination Light etc.
illu
out earth resist e test of Equipment, tower and if it is not checked within
6 months.
: - ARM Sub- Rack.New-7-19 & 20
Make
P/S-1
+ 12.8
0
+12.8
0
0
- 48
P/S-2
Trans
receiver
TLO In
Mon
Diplexer
Trans
Receiver
TLO In
Mon
MUX
0 T
0 R
0
0
0
0
0
O/W
+
SUPY
0
Fig. 7-19
191
Page 41

192
Page 42

- Disconnect RF cable from Rx In.
- Make a test set up as above for AGC calibration.
- Select RF frequency and level say -40 dBm and calibrate it for the correct O/P
level.
- Put ON RF O/P and monitor AGC voltage.
- Note down AGC voltage up to -75 dBm in steps of -10 dBm and there after in 5
dBm steps when E
-3
LED lights.
- Reading will be -86 to -89 dBm.
- Limit is -86 dBm at Rx IN.
- This will be a squelch point,
- Though -35 dBm is an overload point but do not take risk to reach at -35 dBm just
to avoid damage of receiver.
- Go back to restore the E
-3
LED to monitor hysterics point.
- Repeat test for protection channel.
4. Check of alarms: -
Verify the following alarm by simulating the conditions.
a. Rx select
b. Tx select
c. Tx power low
-6
d. E
e. E
AGC voltage
-3
Ground
f. Data unlock
g. RLO unlock
h. Data fail
i. RF fail
j. Synch. fail
k. BER LED O.K
l. Alarm in BITE O.K
m. AIS
5. Bay Meter readings: -
- AGC voltage for both channels.
- P/S checks -48 and +12.8 V.
- BER E
-3
and E
-6.
6. Check of Mux Equipment :-
- There are four 2 Mb tributaries.
- Loop IF Out to IF In.
- Connect DTA set TX and Rx to1
st
Trbs TX and Rx on DDF.
- Observe loop OK and monitor for 5 minutes for 0 and ±50 PPM.
- Repeat BER test for other 3 Trbs also.
lease note that after Local A/T is over write Punch points to the installer and
P
roceed for Through A/T only when all points have been attended by the installer.
p
193
Page 43

7-4.4 HOP/ through A/T
1. Receive level: -
- Measure RF Rx level at Rx IN and compare it with surveyed level.
Deviat- ion between surveyed and measured level should be within ±1 dBm.
(Ref: - DOT ML sector 7 GHz/ 34 Mb)
2. BER test: - Ask distant station to loop all four tributaries and check BER on all
four Trbs for 0 and ± 50 PPM for
Limit: - 0.00 E
-10
, No Error.
3. Check of switching operatio
- Take loop on one tributary fro
- Connect DTA to 1
- r channel.
Now put OFF main transmitte
st
tributary and monitor loop getting O.K.
- Observe that loop getting still OK, It means that data h
5 minutes each.
n: -
m distant station.
as been switched to
protection channel.
Same observe by making receiver off.
-
- d ask other end to observe protection switching.
Repeat test vice versa an
4. O/W function: -
- O/W response: - Feed 0.3 to 3.4 KHz tone at 0 level and measure at Rx pts of
O/W at the other end.
- Limit: 2 dB for 1 KHz
- Measu op.
- Check ally O.K or not O.K.
5. BITE M
-10 dB ± 1 dBm / ±
re noise performance -53 dBm
O/W for speech and sign
onitoring: -
The following observations can be red on supervisory channel by operating mode
parame k / Remote etc on supervisory channel on front of sub rack.
ter eys Local
- AIS status enables.
- Buzzer K
- BER is
- termina ta O.K
- PS
O.
zero.
l s tus: - Tx-1 O.K Tx-2
+12.8 and PS2 : - +12.8
1
- Equipment status O.K
-
Transmission status: - O.K
- Tran’s selection TXA- Auto.
- HDB-3 I/P O.K
- Tx frequency 2.06
Tx power A : - +33 dBm B: - +33 dBm
-
-
Receive status: - O.K, O.K.
25 GHz
- Rx Selection: Rx Auto.
- RF level: - -46 to -5
5 dBm A
-46 to -55 dBm B
- Rx synch A: - O.K B:- O.K
- Rx Synthesizer lock.
- Rx frequency 2.2235 GHz.
- Rx path O.K, O.K
- User alarm US1, US2 – OFF
194
Page 44

- Tele command status TC1, TC2 OFF.
6. BITE Alarms: -
- Eqpt fail: - Any Eqpt failure.
- System fail: - Any System failure.
- supervisory card out.
Microprocessor fail: - When processor in
- OB call tone busy: - When Bus call is sent
-
EOW: - When O/W call is in progress.
7. Alarms: - Monitor following vari
- Data fail T/R unit when I/P HDB3 data failure.
ous alarm on Transmitter.
- RF fails in BITE. When power <+30 dBm.
- TLO unlock when synthesizer goes out
Receiver
- / front panel synthesizer goes 0/0 lock.
RLO unlock in BITE
- Synch fail in BITE when synch is not r
- BER LED in BITE BER worst than E
ecovered.
-3.
8. Check all Tower A/T points as per test schedule along with Earth measurement.
9. Stability: - Put ON stability for 24 Hours by
Limit: - % ES 0.18
% SES 0.003 revised 0.00045
arranging loop from other station.
% DM 0.045
7-4.5 C
omponents of System in brief:-
- Feeder cable: - Coax
- Cable LCF, 7
- Inner Cu tube
/8 coaxial Cu 50 Ω.
9.1 mm.
ial Feeder.
- Dielectric foam : - P.E 22.0mm
Outer conductor 24.9mm
- Jacket: - polythene black
28.9 mm
- Attenuation 6.5 dB/ 100 m
- Antenna
- 2.4 meter diamet
er.
- Grid parabolic.
195
 Loading...