

Page 1

TDC (tomo density control) and how it works
As in all AEC (automatic exposure control) techniques the generator sets a density voltage according to
- the chamber type
- the kV value
- the FSC = film-screen-combination (using cassettes, imaging plates or digital detectors) or the image
intensifier.
This density voltage should be achieved during the exposure.
It is coming in via the Amplimat input plugs EZX 21/22/31/32/41 of the generator, controlled by "dose rate
control" which is physically located on-board of CU EZ139.
For AEC falling load or kV-fixed current the dose signal will more (fixed current) or less (falling load) be
constant until the dose ramp reached the density voltage setpoint value and the exposure is terminated.
The resulting exposure time is determined by the patient size and of course the application.
At TDC the density voltage setpoint is known by the exposure parameters and the FSC.
The exposure time is always fixed depending on the time which is assigned to various trajectories.
APR data for TDC have to be set according to the sensitivity of the film-screen-combination similar to the
APR settings for straight Bucky use.
The average mAs value of the application and patients sizes must be programmed, the mA value with which
the exposure will be started is calculated by the generator.
During the exposure dose rate control tries to drive an emission current to achieve a dose ramp which is
almost linear throughout the exposure.
At the end of the tomo exposure time (fixed) the density setpoint value should be achieved.
If exposure parameters are not exactly known one can easily set them during an examination:
Tomo series are typically started with a Bucky exposure.
Bucky and tomo RGDV chambers are the same, the selected FSC data set will also be the same.
Multiply the post indication mAs value of the Bucky exposure with 1.2 …1.4 to set the start mA or mAs value
for the tomo exposure.
The advantage of TDC is that if the first tomo sweep has been carried out with parameters far out of range
finally the second exposure will get the customer a perfect tomo exposure with a linear dose throughout the
exposure (as long as he does not push the APR button which will get him the default data set again).
The following pages show all data, details and their explanations one can see during TDC operation of a
tomo system hooked up to an Optimus.
A Bucky TH2 system with sensing was used in this case, but it can be any geometry.
A series of 10 TDC exposures has been carried out with properly preset TDC APR and start values out of
range to show the abilities of TDC.
Oscilloscope screenshots shall clarify what happens in the generator and what one can see as result in the
form of a dose signal.
TDC-calculation-process-pictures.doc Mar – 30 – 2005 page 1 - 20
Page 2
Basic test conditions:
Optimus RAD 80kW with SRO33100 tube
110cm SID
40° tomo sweep 2000ms
collimator opening size 15x15cm, only center field of Amplimat chamber 9890 000 01615
50mm Al filter at the collimator.
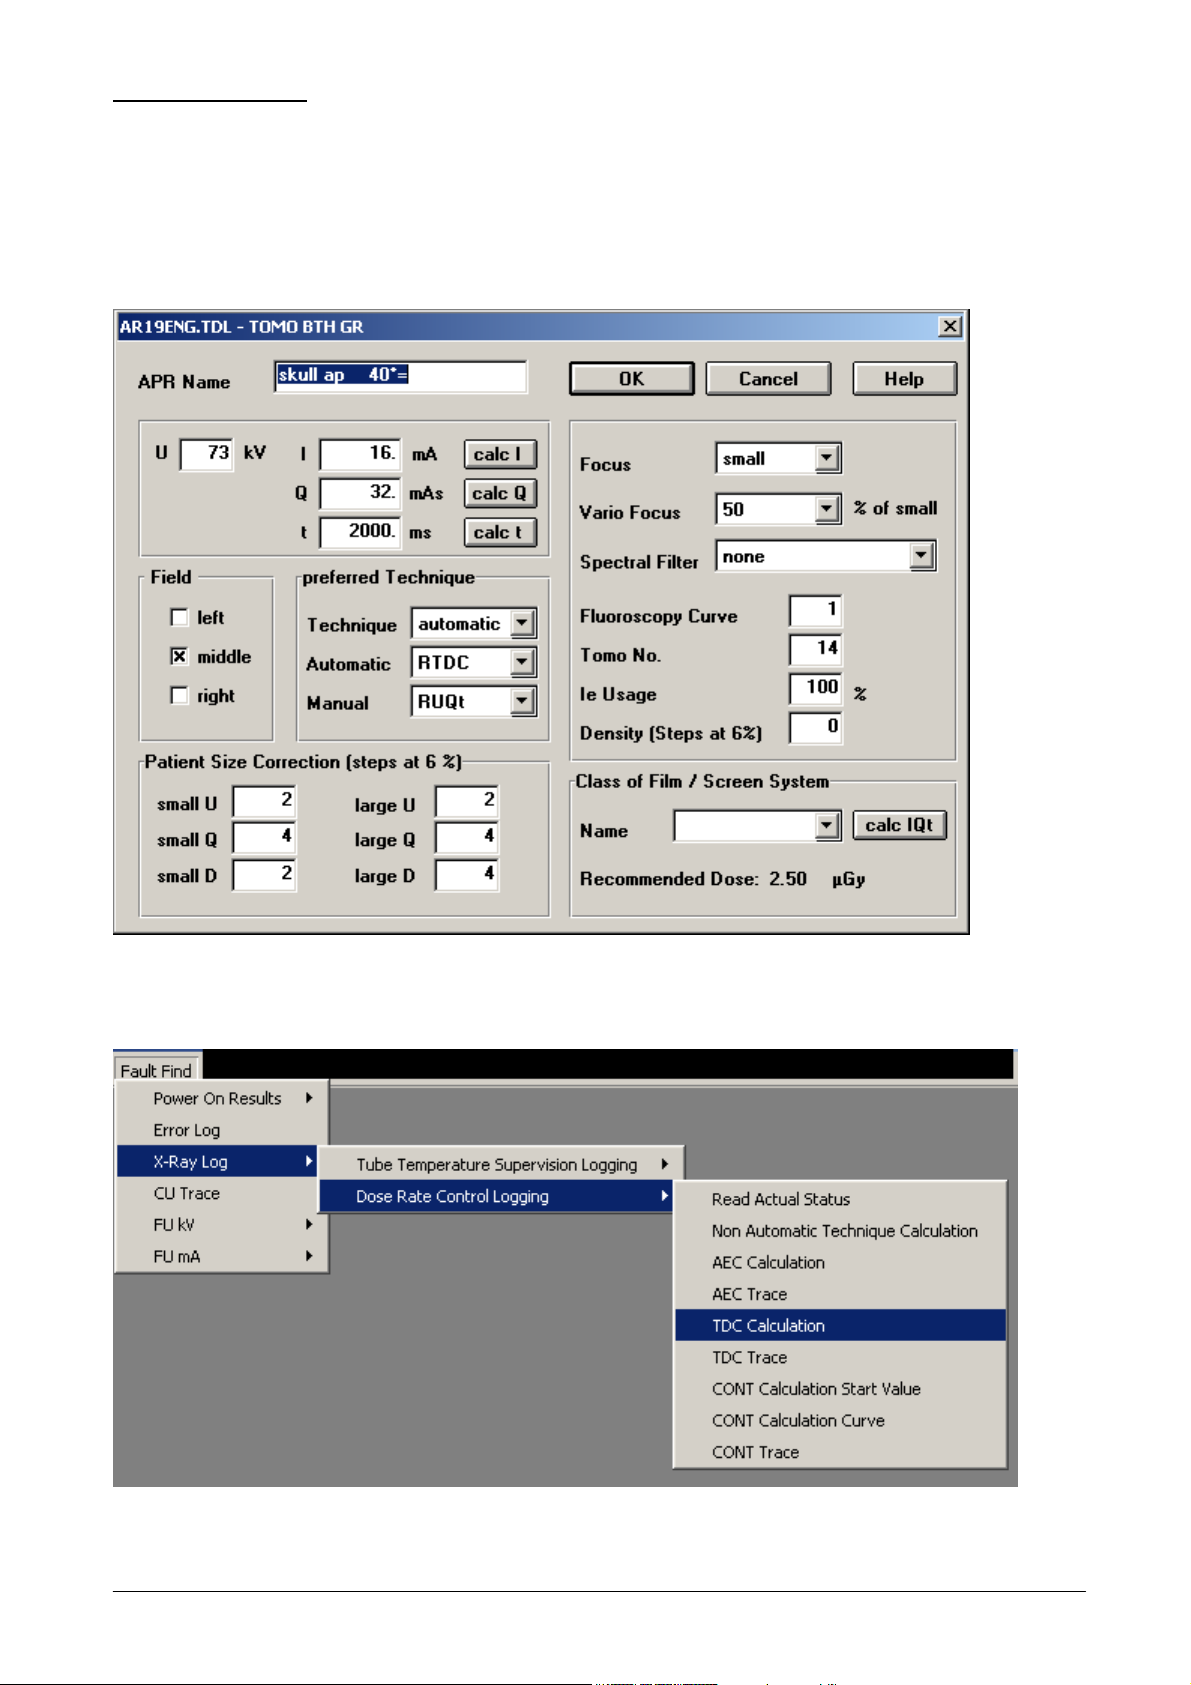
A random APR
was selected.
To see what density voltage and other TDC relevant parameters one should expect, select path:
TDC-calculation-process-pictures.doc Mar – 30 – 2005 page 2 - 20
Page 3
TDC initial APR Calculation
Fr 11. Mrz 07:58:45 2005
U nominal : 73 kV
I start : 16 mA
t backup : 2000 ms
C eff ht : 4.550 nF
dose measurement input : EZX21
film screen comb. : 1
dose nominal : 1 OD
I max : 410.958 mA
I min : 1 mA
I max NOMO : 234.109 mA
dose calculated : 322
kV factor : 0.960
U off : 0.785 V
t corrected : 1994.811 ms
number of steps : 49
time/sample : 40.710 ms
Explanation of the calculation screen:
U nominal kV setpoint = 73kV
I start emission current start value; in this case calculated by the selected manual technique RUQt
(radiographic kV-mAs-ms) – setpoint 32mAs and 2000ms = 16mA
t backup time at which CU is finally terminating the exposure if DRC (dose rate control) didn’t
C eff ht programmed cable capacity (length dependent) and HT transformer capacity; determines
the exposure termination kV and load dependent to pass the 75% high tension within the
exposure time set during kV discharge
t corrected (next page) is the calculated high tension off command time
dose measurement input physical input plug of the dose sensor
film screen comb. one out of five possible FSC data sets
dose nominal indicates the density correction value with + or – correction; 1.00 without correction
“dose nominal : xx OD” optical density correction values at 12.5% steps programmed
- 4 - 3 - 2 - 1 no + 1 + 2 + 3 + 4
0.63 0.71 0.8 0.9 1 1.1 1.25 1.4 1.6
I max max emission current kV dependent of the selected focus (might be limited by the max
emission current of the generator e.g. 650mA Optimus 50)
I min smallest possible emission current, always 1mA
I max NOMO if the exposure would be set
non-AEC in kV-mAs-ms or
kV-ma-ms technique the max
emission current in this case is
234.109mA for 2000ms at 73kV
TDC-calculation-process-pictures.doc Mar – 30 – 2005 page 3 - 20
Page 4

dose calculated DRC calculation parameter (value without dimension calculated from the FSC speed)
kV factor kV correction factor relative to 70kV (determined by the chamber and screen characteristic)
U off density voltage kV dependent (determined by the chamber and screen characteristic)
t corrected see C eff ht explanation
number of steps number of calculation steps throughout the set exposure time
time/sample time of a sample step (multiply number of steps and time/sample = exposure time)
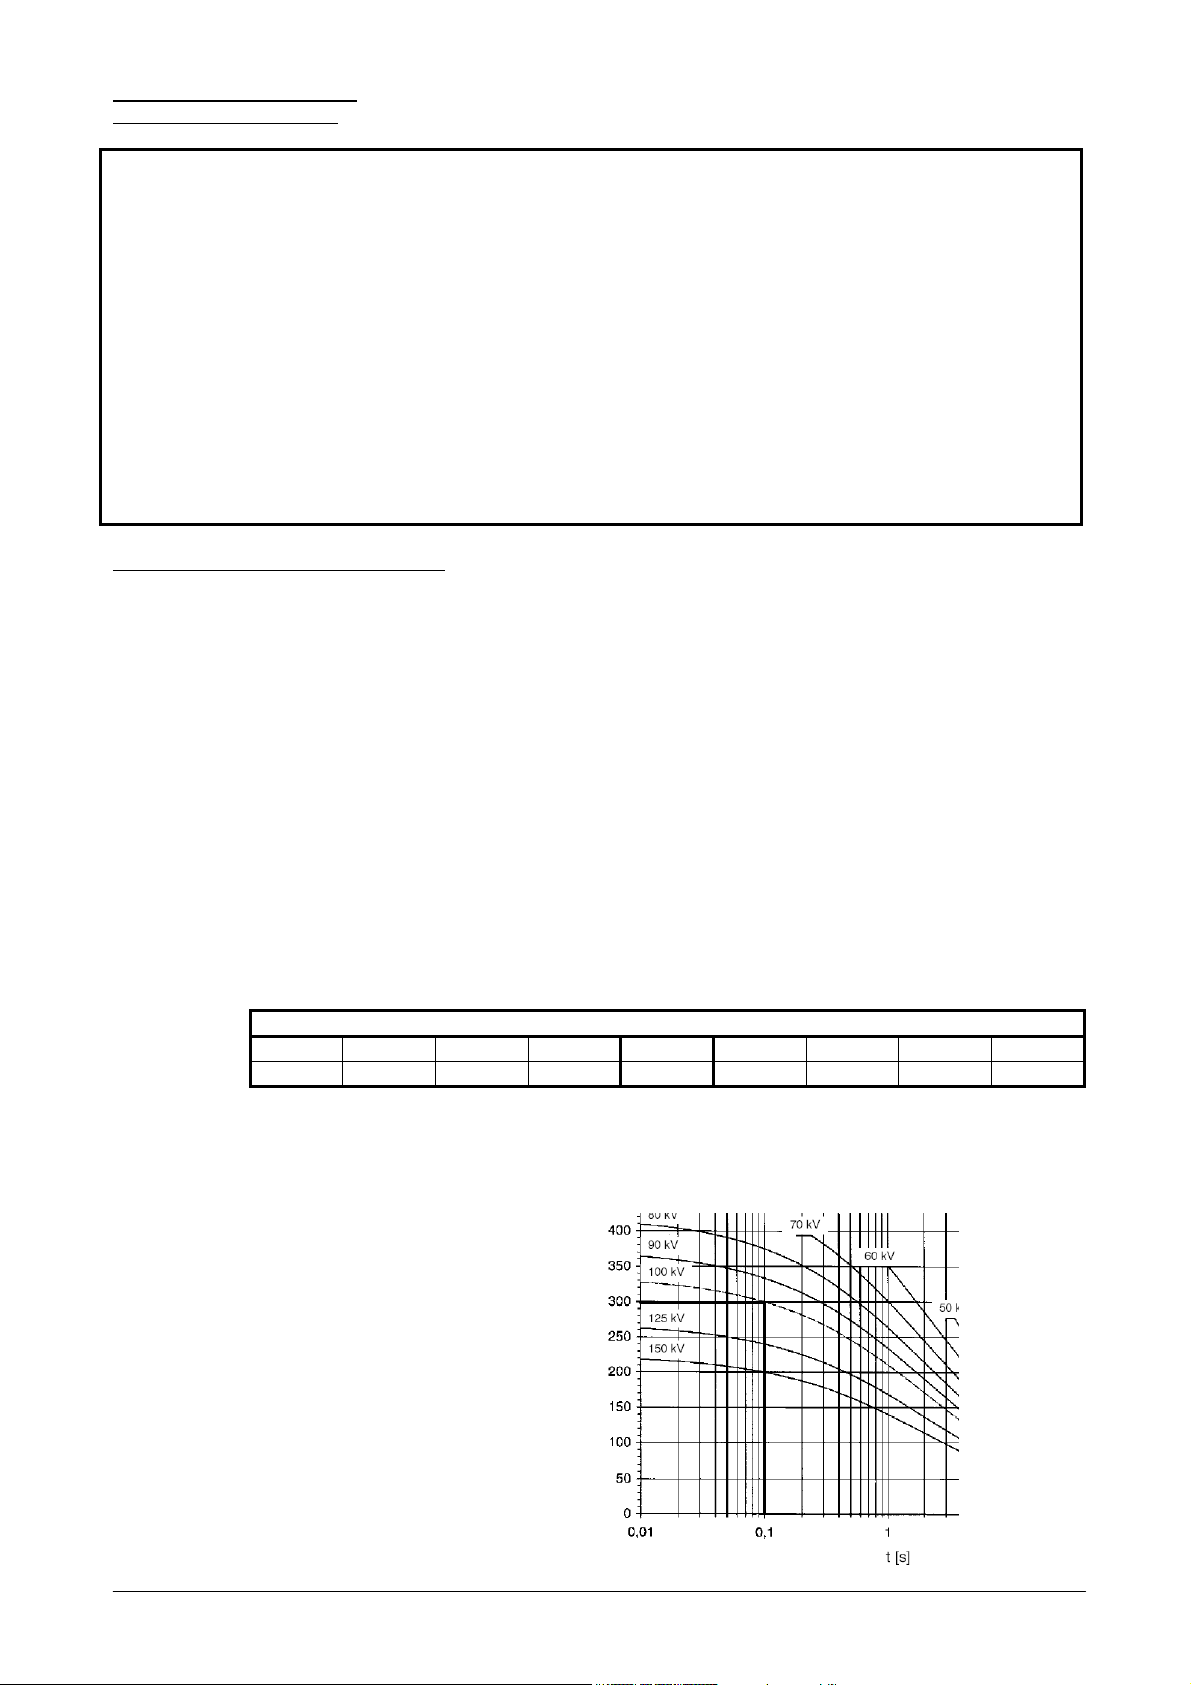
With the initial default APR data set one gets the following dose ramp and filament current curve:
If a deviation of the emission current has to be compensated or if the dose has to be controlled during a TDC
exposure the filament control unit uses only two filament current values to achieve the fastest change of the
emission current:
- minimum filament current 500mA
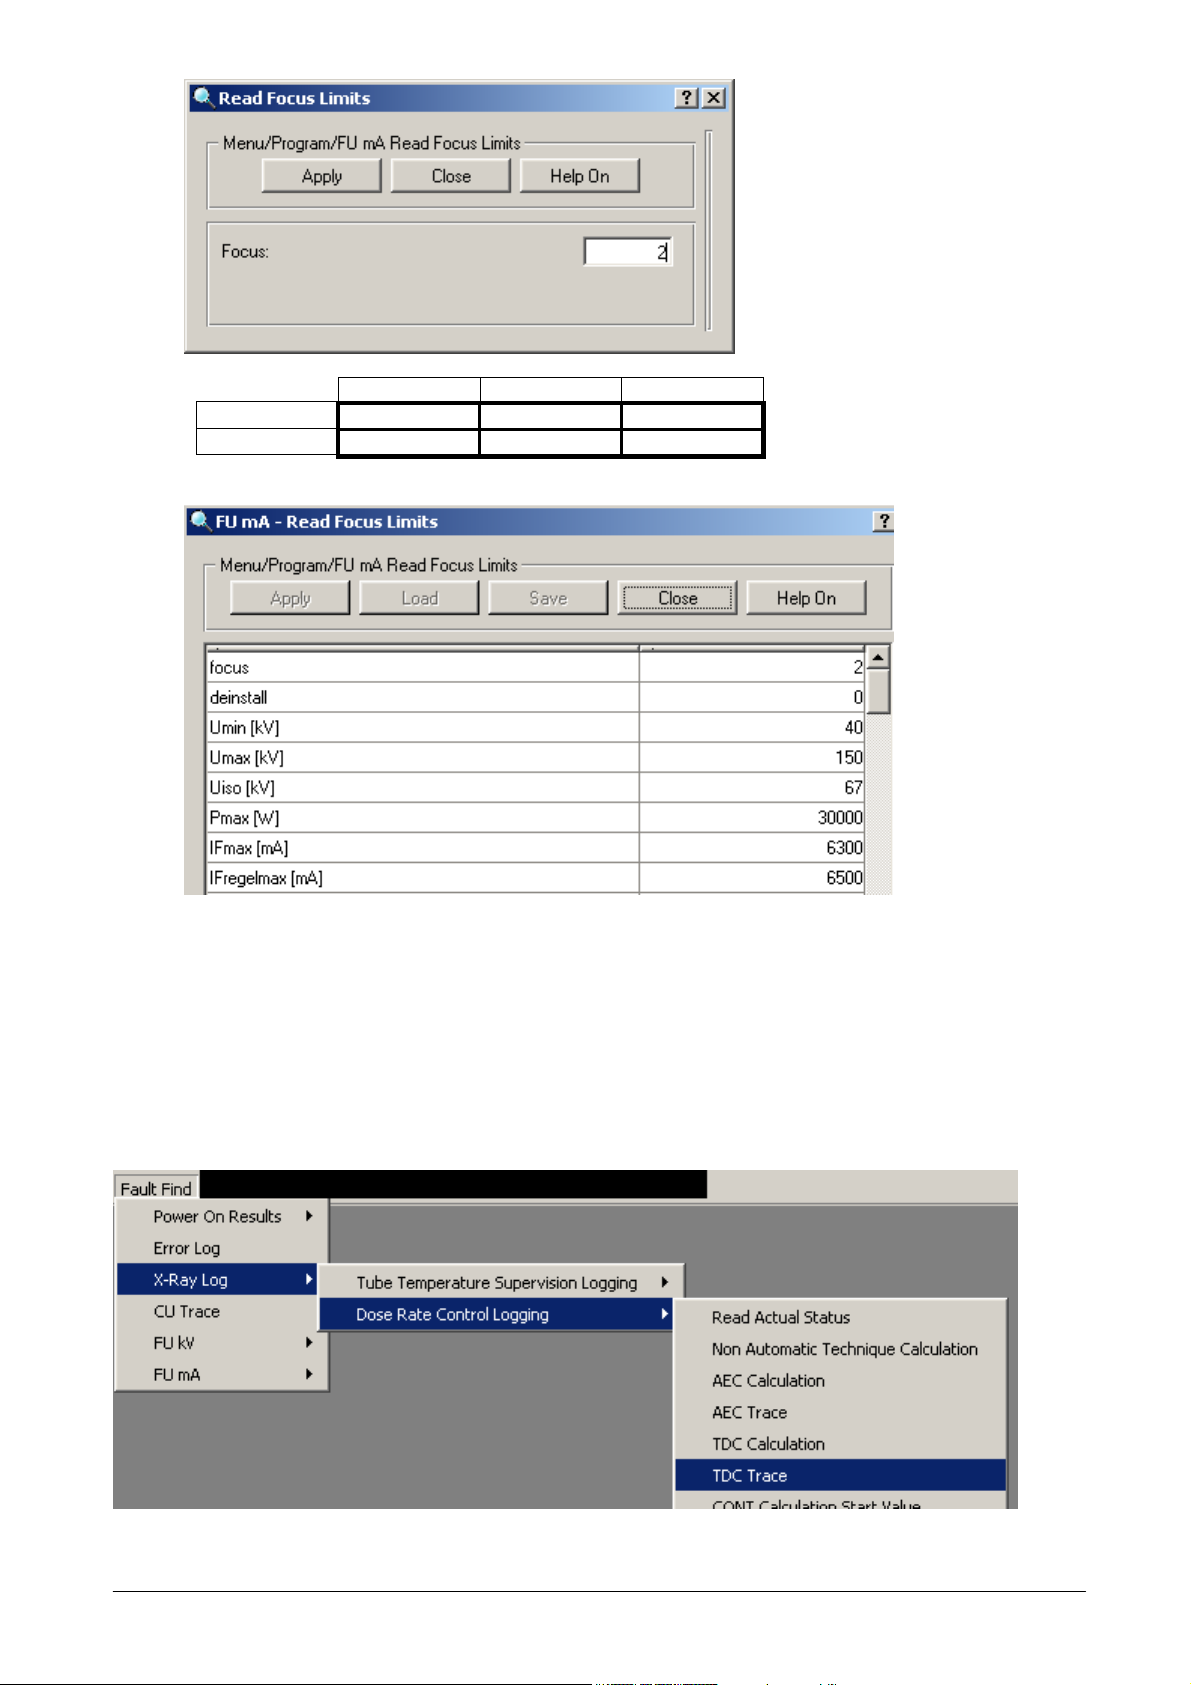
- maximum filament current; tube type and focus specific; to see the max value go path:
TDC-calculation-process-pictures.doc Mar – 30 – 2005 page 4 - 20
Page 5
tube 1 tube 2 tube 3
large focus
small focus
1 3 5
2 4 6
small focus data SRO33100
Ifmax [mA] max filament current for the small focus SRO33100
Ifregelmax [mA] offset value to compensate the filament cooling due to the work
function; offset value only active during high tension
A perfect TDC exposure is when the dose ramp is a straight line from the exposure start to the density
voltage setpoint at the end of the exposure.
A second indication is when the filament current value at the end is the same as in the beginning.
There might of course be a lot of control amplitudes up and down throughout the exposure caused by the
non-linear penetration of the exposed region.
A trace data table can be read from the generator after the exposure:
TDC-calculation-process-pictures.doc Mar – 30 – 2005 page 5 - 20
Page 6

TDC Trace
Fr 11. Mrz 08:05:02 2005
idx dose nominal dose actual dose rate reg in reg out new I
----------------------------------------------------------------------------
0 +0.0E+0 +0 +0.0E+0 +0.0E+0 +0.0E+0 +0.0E+0
1 +0.0E+0 +0 +0.0E+0 +0.0E+0 +0.0E+0 +1.6000E+1
2 +1.8E+0 +2 +2.0E+0 +0.0E+0 +1.000E+2 +1.6000E+1
3 +7.4E+0 +5 +3.0E+0 +6.0E-1 +1.081E+2 +1.7296E+1
4 +1.48E+1 +12 +7.0E+0 +1.03E+0 +1.035E+2 +1.7895E+1
5 +2.22E+1 +19 +7.0E+0 +1.18E+0 +1.020E+2 +1.8247E+1
6 +2.96E+1 +27 +8.0E+0 +9.6E-1 +9.96E+1 +1.8167E+1
7 +3.70E+1 +33 +6.0E+0 +2.00E+0 +1.100E+2 +1.9976E+1
8 +4.44E+1 +39 +6.0E+0 +3.45E+0 +1.138E+2 +2.2725E+1
9 +5.19E+1 +47 +8.0E+0 +3.13E+0 +1.003E+2 +2.2788E+1
10 +5.93E+1 +55 +8.0E+0 +2.15E+0 +9.65E+1 +2.1982E+1
11 +6.67E+1 +64 +9.0E+0 +9.9E-1 +9.51E+1 +2.0902E+1
12 +7.41E+1 +74 +1.00E+1 +0.0E+0 +9.55E+1 +1.9959E+1
13 +8.15E+1 +82 +8.0E+0 -5.0E-2 +1.002E+2 +1.9989E+1
14 +8.89E+1 +91 +9.0E+0 -5.2E-1 +9.69E+1 +1.9360E+1
15 +9.63E+1 +99 +8.0E+0 -9.9E-1 +9.65E+1 +1.8682E+1
16 +1.037E+2 +107 +8.0E+0 -1.22E+0 +9.77E+1 +1.8250E+1
17 +1.111E+2 +114 +7.0E+0 -1.07E+0 +1.000E+2 +1.8250E+1
18 +1.185E+2 +121 +7.0E+0 -9.2E-1 +9.99E+1 +1.8231E+1
19 +1.259E+2 +129 +8.0E+0 -1.14E+0 +9.74E+1 +1.7756E+1
20 +1.333E+2 +136 +7.0E+0 -9.9E-1 +1.000E+2 +1.7750E+1
21 +1.408E+2 +143 +7.0E+0 -5.5E-1 +1.021E+2 +1.8122E+1
22 +1.482E+2 +151 +8.0E+0 -1.03E+0 +9.58E+1 +1.7358E+1
23 +1.556E+2 +160 +9.0E+0 -2.20E+0 +9.17E+1 +1.5909E+1
24 +1.630E+2 +167 +7.0E+0 -2.00E+0 +9.99E+1 +1.5884E+1
25 +1.704E+2 +174 +7.0E+0 -1.80E+0 +9.92E+1 +1.5752E+1
26 +1.778E+2 +181 +7.0E+0 -1.18E+0 +1.026E+2 +1.6159E+1
27 +1.852E+2 +186 +5.0E+0 -8.0E-2 +1.080E+2 +1.7442E+1
28 +1.926E+2 +193 +7.0E+0 +0.0E+0 +9.98E+1 +1.7405E+1
29 +2.000E+2 +201 +8.0E+0 -1.0E-1 +9.93E+1 +1.7278E+1
30 +2.074E+2 +209 +8.0E+0 -4.0E-1 +9.79E+1 +1.6907E+1
31 +2.148E+2 +216 +7.0E+0 -1.2E-1 +1.019E+2 +1.7221E+1
32 +2.222E+2 +224 +8.0E+0 -4.5E-1 +9.74E+1 +1.6772E+1
33 +2.297E+2 +232 +8.0E+0 -5.7E-1 +9.90E+1 +1.6602E+1
34 +2.371E+2 +240 +8.0E+0 -1.07E+0 +9.60E+1 +1.5936E+1
35 +2.445E+2 +246 +6.0E+0 -3.7E-1 +1.049E+2 +1.6710E+1
36 +2.519E+2 +252 +6.0E+0 +0.0E+0 +1.021E+2 +1.7060E+1
37 +2.593E+2 +257 +5.0E+0 +5.7E-1 +1.049E+2 +1.7895E+1
38 +2.667E+2 +264 +7.0E+0 +9.9E-1 +1.034E+2 +1.8498E+1
39 +2.741E+2 +272 +8.0E+0 +5.2E-1 +9.75E+1 +1.8027E+1
40 +2.815E+2 +280 +8.0E+0 +3.7E-1 +9.98E+1 +1.7983E+1
41 +2.889E+2 +288 +8.0E+0 +9.0E-2 +9.85E+1 +1.7710E+1
42 +2.963E+2 +296 +8.0E+0 +0.0E+0 +9.97E+1 +1.7656E+1
43 +3.037E+2 +302 +6.0E+0 +4.2E-1 +1.035E+2 +1.8267E+1
44 +3.111E+2 +309 +7.0E+0 +5.2E-1 +1.009E+2 +1.8424E+1
45 +3.186E+2 +316 +7.0E+0 +9.6E-1 +1.038E+2 +1.9119E+1
46 +3.260E+2 +322 +6.0E+0 +2.00E+0 +1.095E+2 +2.0925E+1
47 +3.334E+2 +331 +9.0E+0 +6.0E-1 +9.21E+1 +1.9267E+1
48 +3.408E+2 +338 +7.0E+0 +1.03E+0 +1.049E+2 +2.0203E+1
49 +3.482E+2 +344 +6.0E+0 +2.10E+0 +1.098E+2 +2.2179E+1
50 +3.556E+2 +352 +8.0E+0 +1.80E+0 +9.94E+1 +2.2036E+1
51 +3.630E+2 +0 +0.0E+0 +0.0E+0 +0.0E+0 +0.0E+0
Explanation of trace screen columns:
(some values appear as exponential values, e.g.: +2.2036E+1 = 2.2036 x 101 = 22.036)
idx index number of step
dose nominal dose setpoint value generated from the dose calculated parameter of the TDC calculation
screen; typically slightly higher compared to the calculated value
TDC-calculation-process-pictures.doc Mar – 30 – 2005 page 6 - 20
Page 7

dose actual actual cumulated dose value measured by DRC; identical to oscilloscope dose signal
dose rate actual slope of the dose ramp
reg in internal control signals, no not help for troubleshooting
reg out internal control signals, no not help for troubleshooting
new I new emission current setpoint in [mA], see formula above
Comments to the trace table:
The new I column starts with a 16mA emission current, remains almost constant and terminates with an
emission current of 22.036mA.
The individual dose rate values are more or less identical, which means that the dose ramp slope is almost
constant. That’s what one can also see on the oscilloscope screenshot TDC-TH01.pcx.
After the first TDC exposure one gets the calculation for the next exposure:
TDC Calculation
Fr 11. Mrz 08:05:30 2005
U nominal : 73 kV
I start : 22.036 mA
t backup : 2000 ms
C eff ht : 4.550 nF
dose measurement input: EZX21
film screen comb. : 1
dose nominal : 1 OD
I max : 410.958 mA
I min : 1 mA
I max NOMO : 234.109 mA
dose calculated : 322
kV factor : 0.960
U off : 0.785 V
t corrected : 1996.226 ms
number of steps : 49
time/sample : 40.739 ms
The emission current start value I start taken from of the previous TDC exposure trace can now be seen.
t corrected increased due to the higher emission current, time/sample as well.
TDC-calculation-process-pictures.doc Mar – 30 – 2005 page 7 - 20
Page 8

There is no difference to the first exposure. The post indication mAs value changed from 36.4mAs to
36.5mAs.
TDC Trace
Fr 11. Mrz 08:07:35 2005
idx dose nominal dose actual dose rate reg in reg out new I
----------------------------------------------------------------------------
0 +0.0E+0 +0 +0.0E+0 +0.0E+0 +0.0E+0 +0.0E+0
1 +0.0E+0 +0 +0.0E+0 +0.0E+0 +0.0E+0 +2.2036E+1
2 +1.8E+0 +2 +2.0E+0 +0.0E+0 +1.000E+2 +2.2030E+1
3 +7.4E+0 +8 +6.0E+0 -6.0E-2 +9.95E+1 +2.1919E+1
4 +1.48E+1 +16 +8.0E+0 -1.2E-1 +9.96E+1 +2.1822E+1
5 +2.22E+1 +25 +9.0E+0 -1.03E+0 +9.40E+1 +2.0510E+1
6 +2.96E+1 +34 +9.0E+0 -2.20E+0 +9.19E+1 +1.8848E+1
7 +3.70E+1 +41 +7.0E+0 -2.00E+0 +9.99E+1 +1.8821E+1
8 +4.44E+1 +47 +6.0E+0 -9.6E-1 +1.061E+2 +1.9968E+1
9 +5.19E+1 +53 +6.0E+0 -1.1E-1 +1.051E+2 +2.0977E+1
10 +5.93E+1 +61 +8.0E+0 -4.2E-1 +9.72E+1 +2.0382E+1
11 +6.67E+1 +70 +9.0E+0 -1.22E+0 +9.46E+1 +1.9279E+1
12 +7.41E+1 +79 +9.0E+0 -3.13E+0 +8.68E+1 +1.6726E+1
13 +8.15E+1 +85 +6.0E+0 -1.75E+0 +1.092E+2 +1.8258E+1
14 +8.89E+1 +92 +7.0E+0 -1.14E+0 +1.017E+2 +1.8560E+1
15 +9.63E+1 +100 +8.0E+0 -1.85E+0 +9.34E+1 +1.7335E+1
16 +1.037E+2 +107 +7.0E+0 -1.22E+0 +1.032E+2 +1.7884E+1
17 +1.111E+2 +115 +8.0E+0 -1.95E+0 +9.32E+1 +1.6664E+1
18 +1.185E+2 +122 +7.0E+0 -1.75E+0 +9.99E+1 +1.6643E+1
19 +1.259E+2 +128 +6.0E+0 -5.2E-1 +1.080E+2 +1.7971E+1
20 +1.333E+2 +135 +7.0E+0 -4.2E-1 +9.94E+1 +1.7862E+1
21 +1.408E+2 +143 +8.0E+0 -5.5E-1 +9.86E+1 +1.7609E+1
22 +1.482E+2 +151 +8.0E+0 -1.03E+0 +9.62E+1 +1.6931E+1
23 +1.556E+2 +159 +8.0E+0 -1.25E+0 +9.77E+1 +1.6540E+1
24 +1.630E+2 +166 +7.0E+0 -1.11E+0 +9.99E+1 +1.6523E+1
25 +1.704E+2 +174 +8.0E+0 -1.80E+0 +9.39E+1 +1.5512E+1
26 +1.778E+2 +179 +5.0E+0 -1.2E-1 +1.136E+2 +1.7619E+1
27 +1.852E+2 +185 +6.0E+0 +0.0E+0 +9.96E+1 +1.7539E+1
28 +1.926E+2 +193 +8.0E+0 +0.0E+0 +1.000E+2 +1.7530E+1
29 +2.000E+2 +200 +7.0E+0 +0.0E+0 +1.000E+2 +1.7530E+1
30 +2.074E+2 +208 +8.0E+0 -6.0E-2 +9.96E+1 +1.7459E+1
31 +2.148E+2 +216 +8.0E+0 -1.2E-1 +9.96E+1 +1.7380E+1
32 +2.222E+2 +224 +8.0E+0 -4.5E-1 +9.76E+1 +1.6962E+1
33 +2.297E+2 +231 +7.0E+0 -1.3E-1 +1.021E+2 +1.7316E+1
34 +2.371E+2 +240 +9.0E+0 -1.07E+0 +9.35E+1 +1.6184E+1
35 +2.445E+2 +246 +6.0E+0 -3.7E-1 +1.052E+2 +1.7021E+1
36 +2.519E+2 +251 +5.0E+0 +9.0E-2 +1.031E+2 +1.7547E+1
37 +2.593E+2 +257 +6.0E+0 +5.7E-1 +1.037E+2 +1.8188E+1
38 +2.667E+2 +264 +7.0E+0 +9.9E-1 +1.035E+2 +1.8816E+1
39 +2.741E+2 +272 +8.0E+0 +5.2E-1 +9.75E+1 +1.8339E+1
40 +2.815E+2 +280 +8.0E+0 +3.7E-1 +9.98E+1 +1.8293E+1
41 +2.889E+2 +288 +8.0E+0 +9.0E-2 +9.85E+1 +1.8015E+1
42 +2.963E+2 +296 +8.0E+0 +0.0E+0 +9.97E+1 +1.7955E+1
43 +3.037E+2 +303 +7.0E+0 +7.0E-2 +1.006E+2 +1.8057E+1
44 +3.111E+2 +310 +7.0E+0 +1.1E-1 +1.003E+2 +1.8104E+1
45 +3.186E+2 +316 +6.0E+0 +9.6E-1 +1.071E+2 +1.9385E+1
46 +3.260E+2 +323 +7.0E+0 +1.11E+0 +1.016E+2 +1.9690E+1
47 +3.334E+2 +331 +8.0E+0 +6.0E-1 +9.75E+1 +1.9197E+1
48 +3.408E+2 +338 +7.0E+0 +1.03E+0 +1.043E+2 +2.0015E+1
49 +3.482E+2 +344 +6.0E+0 +2.10E+0 +1.098E+2 +2.1970E+1
50 +3.556E+2 +352 +8.0E+0 +1.80E+0 +9.94E+1 +2.1838E+1
51 +3.630E+2 +0 +0.0E+0 +0.0E+0 +0.0E+0 +0.0E+0
The exposure started with 22.036mA as predicted, the start value for the next exposure would be
21.838mA.
TDC-calculation-process-pictures.doc Mar – 30 – 2005 page 8 - 20
Page 9

The next TDC series was started from the same default APR data set, but now the kV were lowered to 66kV:
TDC Calculation
Fr 11. Mrz 08:29:12 2005
U nominal : 66 kV
I start : 16 mA
t backup : 2000 ms
C eff ht : 4.550 nF
dose measurement input: EZX21
film screen comb. : 1
dose nominal : 1 OD
I max : 378 mA
I min : 1 mA
I max NOMO : 258.939 mA
dose calculated : 345
kV factor : 1.030
U off : 0.843 V
t corrected : 1995.308 ms
number of steps : 49
time/sample : 40.720 ms
All bold marked parameters changed due to the different kV value.
Since nothing changed in the geometry the dose ramp starts with a little delay (green circle) due to the lower
kV with the same attenuator in the beam.
The filament current is instantly increased to its max value at the beginning to increase the emission current
and with it the dose.
After about 400ms the filament current remains almost constant for the rest of the exposure. One can see
that the filament current at the end of the exposure is higher compared to the start value.
The dose requirement with 86.6mAs was 2.7 times higher at the end compared to the default 32mAs, but the
dose ramp is almost linear and the result should have got us a perfect exposure.
In the trace next page one can see what was set during the exposure:
TDC-calculation-process-pictures.doc Mar – 30 – 2005 page 9 - 20
Page 10

TDC Trace
Fr 11. Mrz 08:30:51 2005
idx dose nominal dose actual dose rate reg in reg out new I
-----------------------------------------------------------------------------
0 +0.0E+0 +0 +0.0E+0 +0.0E+0 +0.0E+0 +0.0E+0
1 +0.0E+0 +0 +0.0E+0 +0.0E+0 +0.0E+0 +1.6000E+1
2 +1.9E+0 +1 +1.0E+0 +9.0E-2 +1.036E+2 +1.6576E+1
3 +7.9E+0 +3 +2.0E+0 +3.13E+0 +1.465E+2 +2.4275E+1
4 +1.59E+1 +6 +3.0E+0 +9.10E+0 +1.676E+2 +4.0676E+1
5 +2.38E+1 +12 +6.0E+0 +1.144E+1 +1.253E+2 +5.0959E+1
6 +3.18E+1 +20 +8.0E+0 +1.144E+1 +1.099E+2 +5.5994E+1
7 +3.97E+1 +29 +9.0E+0 +1.016E+1 +1.024E+2 +5.7333E+1
8 +4.76E+1 +38 +9.0E+0 +8.83E+0 +1.016E+2 +5.8247E+1
9 +5.56E+1 +47 +9.0E+0 +7.65E+0 +1.014E+2 +5.9055E+1
10 +6.35E+1 +56 +9.0E+0 +6.37E+0 +9.97E+1 +5.8872E+1
11 +7.14E+1 +67 +1.10E+1 +2.20E+0 +8.24E+1 +4.8508E+1
12 +7.94E+1 +77 +1.00E+1 +6.0E-1 +9.47E+1 +4.5929E+1
13 +8.73E+1 +86 +9.0E+0 +1.3E-1 +9.85E+1 +4.5231E+1
14 +9.53E+1 +95 +9.0E+0 +0.0E+0 +9.96E+1 +4.5049E+1
15 +1.032E+2 +104 +9.0E+0 -8.0E-2 +9.96E+1 +4.4859E+1
16 +1.111E+2 +111 +7.0E+0 +0.0E+0 +1.005E+2 +4.5074E+1
17 +1.191E+2 +120 +9.0E+0 -9.0E-2 +9.94E+1 +4.4799E+1
18 +1.270E+2 +127 +7.0E+0 +0.0E+0 +1.006E+2 +4.5058E+1
19 +1.350E+2 +135 +8.0E+0 +0.0E+0 +1.000E+2 +4.5050E+1
20 +1.429E+2 +144 +9.0E+0 -1.1E-1 +9.93E+1 +4.4734E+1
21 +1.508E+2 +152 +8.0E+0 -1.2E-1 +9.99E+1 +4.4685E+1
22 +1.588E+2 +161 +9.0E+0 -5.5E-1 +9.72E+1 +4.3428E+1
23 +1.667E+2 +170 +9.0E+0 -1.22E+0 +9.55E+1 +4.1466E+1
24 +1.747E+2 +179 +9.0E+0 -2.15E+0 +9.34E+1 +3.8723E+1
25 +1.826E+2 +187 +8.0E+0 -2.20E+0 +9.81E+1 +3.7984E+1
26 +1.905E+2 +194 +7.0E+0 -1.75E+0 +1.010E+2 +3.8359E+1
27 +1.985E+2 +199 +5.0E+0 -5.0E-2 +1.124E+2 +4.3105E+1
28 +2.064E+2 +207 +8.0E+0 -6.0E-2 +9.89E+1 +4.2625E+1
29 +2.143E+2 +216 +9.0E+0 -4.2E-1 +9.77E+1 +4.1639E+1
30 +2.223E+2 +225 +9.0E+0 -9.9E-1 +9.62E+1 +4.0048E+1
31 +2.302E+2 +232 +7.0E+0 -4.5E-1 +1.033E+2 +4.1361E+1
32 +2.382E+2 +241 +9.0E+0 -1.03E+0 +9.56E+1 +3.9540E+1
33 +2.461E+2 +250 +9.0E+0 -1.95E+0 +9.35E+1 +3.6969E+1
34 +2.540E+2 +256 +6.0E+0 -5.0E-1 +1.101E+2 +4.0692E+1
35 +2.620E+2 +263 +7.0E+0 -1.0E-1 +1.014E+2 +4.1259E+1
36 +2.699E+2 +270 +7.0E+0 +0.0E+0 +1.003E+2 +4.1373E+1
37 +2.779E+2 +277 +7.0E+0 +9.0E-2 +1.006E+2 +4.1618E+1
38 +2.858E+2 +284 +7.0E+0 +4.5E-1 +1.027E+2 +4.2733E+1
39 +2.937E+2 +292 +8.0E+0 +4.2E-1 +1.000E+2 +4.2730E+1
40 +3.017E+2 +300 +8.0E+0 +4.2E-1 +1.004E+2 +4.2900E+1
41 +3.096E+2 +308 +8.0E+0 +4.0E-1 +1.002E+2 +4.2985E+1
42 +3.176E+2 +317 +9.0E+0 +6.0E-2 +9.83E+1 +4.2249E+1
43 +3.255E+2 +324 +7.0E+0 +3.7E-1 +1.026E+2 +4.3338E+1
44 +3.334E+2 +331 +7.0E+0 +6.0E-1 +1.019E+2 +4.4153E+1
45 +3.414E+2 +339 +8.0E+0 +6.0E-1 +1.004E+2 +4.4326E+1
46 +3.493E+2 +346 +7.0E+0 +1.22E+0 +1.052E+2 +4.6624E+1
47 +3.572E+2 +353 +7.0E+0 +2.10E+0 +1.074E+2 +5.0069E+1
48 +3.652E+2 +362 +9.0E+0 +1.18E+0 +9.56E+1 +4.7857E+1
49 +3.731E+2 +370 +8.0E+0 +1.14E+0 +1.014E+2 +4.8519E+1
50 +3.811E+2 +378 +8.0E+0 +1.14E+0 +1.011E+2 +4.9043E+1
51 +3.890E+2 +0 +0.0E+0 +0.0E+0 +0.0E+0 +0.0E+0
Started with 16mA the exposure the exposure terminated with 49.043mA which is the start value for the next
one.
TDC-calculation-process-pictures.doc Mar – 30 – 2005 page 10 - 20
Page 11

TDC Calculation
Fr 11. Mrz 08:31:29 2005
U nominal : 66 kV
I start : 49.043 mA
t backup : 2000 ms
C eff ht : 4.550 nF
dose measurement input: EZX21
film screen comb. : 1
dose nominal : 1 OD
I max : 378 mA
I min : 1 mA
I max NOMO : 258.939 mA
dose calculated : 345
kV factor : 1.030
U off : 0.843 V
t corrected : 1998.468 ms
number of steps : 49
time/sample : 40.785 ms
Now one can see in the green circle that the dose ramp starts straight from the beginning and has a perfect
linear course towards the end. There is almost no control or deviation of the filament current.
Both exposures are almost identical from the load of 86.6mAs (1
st
) or 86.8mAs (2nd).
The trace next page shows the parameters.
TDC-calculation-process-pictures.doc Mar – 30 – 2005 page 11 - 20
Page 12

TDC Trace
Fr 11. Mrz 08:32:49 2005
idx dose nominal dose actual dose rate reg in reg out new I
----------------------------------------------------------------------------
0 +0.0E+0 +0 +0.0E+0 +0.0E+0 +0.0E+0 +0.0E+0
1 +0.0E+0 +0 +0.0E+0 +0.0E+0 +0.0E+0 +4.9043E+1
2 +1.9E+0 +2 +2.0E+0 +0.0E+0 +1.000E+2 +4.9040E+1
3 +7.9E+0 +8 +6.0E+0 +0.0E+0 +1.000E+2 +4.9040E+1
4 +1.59E+1 +16 +8.0E+0 +0.0E+0 +1.000E+2 +4.9040E+1
5 +2.38E+1 +25 +9.0E+0 -1.2E-1 +9.93E+1 +4.8696E+1
6 +3.18E+1 +34 +9.0E+0 -5.5E-1 +9.73E+1 +4.7375E+1
7 +3.97E+1 +42 +8.0E+0 -5.7E-1 +9.96E+1 +4.7180E+1
8 +4.76E+1 +49 +7.0E+0 -1.4E-1 +1.026E+2 +4.8406E+1
9 +5.56E+1 +56 +7.0E+0 +0.0E+0 +1.005E+2 +4.8642E+1
10 +6.35E+1 +64 +8.0E+0 -5.0E-2 +9.96E+1 +4.8445E+1
11 +7.14E+1 +74 +1.00E+1 -9.6E-1 +9.46E+1 +4.5824E+1
12 +7.94E+1 +82 +8.0E+0 -9.6E-1 +9.97E+1 +4.5682E+1
13 +8.73E+1 +91 +9.0E+0 -1.85E+0 +9.34E+1 +4.2665E+1
14 +9.53E+1 +99 +8.0E+0 -1.85E+0 +9.88E+1 +4.2148E+1
15 +1.032E+2 +108 +9.0E+0 -3.07E+0 +9.05E+1 +3.8136E+1
16 +1.111E+2 +115 +7.0E+0 -1.95E+0 +1.058E+2 +4.0341E+1
17 +1.191E+2 +122 +7.0E+0 -1.07E+0 +1.036E+2 +4.1792E+1
18 +1.270E+2 +129 +7.0E+0 -5.0E-1 +1.024E+2 +4.2792E+1
19 +1.350E+2 +136 +7.0E+0 -1.0E-1 +1.020E+2 +4.3645E+1
20 +1.429E+2 +145 +9.0E+0 -5.2E-1 +9.70E+1 +4.2330E+1
21 +1.508E+2 +153 +8.0E+0 -5.5E-1 +9.96E+1 +4.2160E+1
22 +1.588E+2 +161 +8.0E+0 -5.5E-1 +9.95E+1 +4.1949E+1
23 +1.667E+2 +169 +8.0E+0 -5.7E-1 +9.94E+1 +4.1688E+1
24 +1.747E+2 +178 +9.0E+0 -1.22E+0 +9.54E+1 +3.9762E+1
25 +1.826E+2 +187 +9.0E+0 -2.20E+0 +9.30E+1 +3.6976E+1
26 +1.905E+2 +193 +6.0E+0 -9.2E-1 +1.085E+2 +4.0112E+1
27 +1.985E+2 +199 +6.0E+0 -5.0E-2 +1.050E+2 +4.2115E+1
28 +2.064E+2 +207 +8.0E+0 -6.0E-2 +9.94E+1 +4.1857E+1
29 +2.143E+2 +215 +8.0E+0 -7.0E-2 +9.99E+1 +4.1808E+1
30 +2.223E+2 +224 +9.0E+0 -4.2E-1 +9.78E+1 +4.0880E+1
31 +2.302E+2 +231 +7.0E+0 -8.0E-2 +1.023E+2 +4.1820E+1
32 +2.382E+2 +240 +9.0E+0 -4.5E-1 +9.74E+1 +4.0732E+1
33 +2.461E+2 +248 +8.0E+0 -4.7E-1 +9.97E+1 +4.0607E+1
34 +2.540E+2 +257 +9.0E+0 -1.11E+0 +9.55E+1 +3.8773E+1
35 +2.620E+2 +263 +6.0E+0 -1.0E-1 +1.073E+2 +4.1600E+1
36 +2.699E+2 +270 +7.0E+0 +0.0E+0 +1.000E+2 +4.1600E+1
37 +2.779E+2 +276 +6.0E+0 +4.7E-1 +1.037E+2 +4.3139E+1
38 +2.858E+2 +284 +8.0E+0 +4.5E-1 +1.000E+2 +4.3130E+1
39 +2.937E+2 +292 +8.0E+0 +4.2E-1 +1.002E+2 +4.3216E+1
40 +3.017E+2 +300 +8.0E+0 +4.2E-1 +1.004E+2 +4.3382E+1
41 +3.096E+2 +308 +8.0E+0 +4.0E-1 +1.002E+2 +4.3466E+1
42 +3.176E+2 +317 +9.0E+0 +6.0E-2 +9.83E+1 +4.2721E+1
43 +3.255E+2 +325 +8.0E+0 +5.0E-2 +1.002E+2 +4.2805E+1
44 +3.334E+2 +332 +7.0E+0 +1.4E-1 +1.007E+2 +4.3099E+1
45 +3.414E+2 +339 +7.0E+0 +6.0E-1 +1.035E+2 +4.4598E+1
46 +3.493E+2 +346 +7.0E+0 +1.22E+0 +1.049E+2 +4.6774E+1
47 +3.572E+2 +354 +8.0E+0 +1.18E+0 +1.005E+2 +4.7003E+1
48 +3.652E+2 +362 +8.0E+0 +1.18E+0 +1.012E+2 +4.7564E+1
49 +3.731E+2 +369 +7.0E+0 +2.05E+0 +1.077E+2 +5.1222E+1
50 +3.811E+2 +378 +9.0E+0 +1.14E+0 +9.56E+1 +4.8966E+1
51 +3.890E+2 +0 +0.0E+0 +0.0E+0 +0.0E+0 +0.0E+0
Started with 49.043mA the exposure ended with 48.966mA, start point for the next sweep if required.
TDC-calculation-process-pictures.doc Mar – 30 – 2005 page 12 - 20
Page 13

New tomo series start:
The system parameters are still the same:
110cm SID, 15x15cm format, 40° 2000ms, 50mm Al filter at collimator.
Exposure data were changed to monitor what happens if the initial APR settings do not match with the
“organ” or attenuator. New settings: 81kV 50mAs.
TDC Calculation
Fr 11. Mrz 08:33:57 2005
U nominal : 81 kV
I start : 25 mA
t backup : 2000 ms
C eff ht : 4.550 nF
dose measurement input: EZX21
film screen comb. : 1
dose nominal : 1 OD
I max : 370.370 mA
I min : 1 mA
I max NOMO : 210.987 mA
dose calculated : 291
kV factor : 0.870
U off : 0.712 V
t corrected : 1996.315 ms
number of steps : 49
time/sample : 40.741 ms
The start mA value is too high. The dose signal rises very quickly (green circle).
With constant 25mA the density voltage would be achieved in less than a second.
TDC instantly reacts by decreasing the filament current.
A constant value is found at 300…400ms, then the dose ramp is constant and linear throughout the rest of
the sweep.
In the trace table next page one can see the set values.
TDC-calculation-process-pictures.doc Mar – 30 – 2005 page 13 - 20
Page 14

TDC Trace
Fr 11. Mrz 08:35:22 2005
idx dose nominal dose actual dose rate reg in reg out new I
-----------------------------------------------------------------------------
0 +0.0E+0 +0 +0.0E+0 +0.0E+0 +0.0E+0 +0.0E+0
1 +0.0E+0 +0 +0.0E+0 +0.0E+0 +0.0E+0 +2.5000E+1
2 +1.6E+0 +4 +4.0E+0 -6.0E-1 +8.92E+1 +2.2300E+1
3 +6.7E+0 +18 +1.40E+1 -1.073E+1 +5.00E+1 +1.1150E+1
4 +1.34E+1 +33 +1.50E+1 -1.960E+1 +5.53E+1 +6.165E+0
5 +2.01E+1 +41 +8.0E+0 -2.090E+1 +7.55E+1 +4.650E+0
6 +2.68E+1 +47 +6.0E+0 -2.020E+1 +8.06E+1 +3.747E+0
7 +3.35E+1 +51 +4.0E+0 -1.750E+1 +9.68E+1 +3.620E+0
8 +4.02E+1 +54 +3.0E+0 -1.380E+1 +1.111E+2 +4.021E+0
9 +4.69E+1 +55 +1.0E+0 -6.88E+0 +1.767E+2 +7.103E+0
10 +5.36E+1 +60 +5.0E+0 -4.67E+0 +1.056E+2 +7.497E+0
11 +6.02E+1 +66 +6.0E+0 -4.23E+0 +9.62E+1 +7.205E+0
12 +6.69E+1 +73 +7.0E+0 -4.45E+0 +9.31E+1 +6.703E+0
13 +7.36E+1 +78 +5.0E+0 -2.20E+0 +1.157E+2 +7.751E+0
14 +8.03E+1 +84 +6.0E+0 -1.85E+0 +9.85E+1 +7.633E+0
15 +8.70E+1 +92 +8.0E+0 -3.20E+0 +8.79E+1 +6.706E+0
16 +9.37E+1 +97 +5.0E+0 -1.22E+0 +1.158E+2 +7.758E+0
17 +1.004E+2 +102 +5.0E+0 -4.0E-1 +1.044E+2 +8.091E+0
18 +1.071E+2 +108 +6.0E+0 -9.0E-2 +1.015E+2 +8.211E+0
19 +1.138E+2 +115 +7.0E+0 -1.2E-1 +9.95E+1 +8.168E+0
20 +1.205E+2 +123 +8.0E+0 -9.2E-1 +9.41E+1 +7.678E+0
21 +1.272E+2 +129 +6.0E+0 -4.5E-1 +1.035E+2 +7.938E+0
22 +1.339E+2 +135 +6.0E+0 -1.1E-1 +1.020E+2 +8.088E+0
23 +1.406E+2 +143 +8.0E+0 -6.0E-1 +9.61E+1 +7.764E+0
24 +1.473E+2 +151 +8.0E+0 -1.85E+0 +9.05E+1 +7.022E+0
25 +1.540E+2 +157 +6.0E+0 -1.11E+0 +1.051E+2 +7.378E+0
26 +1.607E+2 +162 +5.0E+0 -1.3E-1 +1.072E+2 +7.900E+0
27 +1.673E+2 +167 +5.0E+0 +0.0E+0 +1.002E+2 +7.915E+0
28 +1.740E+2 +174 +7.0E+0 +0.0E+0 +1.000E+2 +7.910E+0
29 +1.807E+2 +181 +7.0E+0 +0.0E+0 +1.000E+2 +7.910E+0
30 +1.874E+2 +188 +7.0E+0 -6.0E-2 +9.96E+1 +7.878E+0
31 +1.941E+2 +195 +7.0E+0 -9.0E-2 +9.98E+1 +7.854E+0
32 +2.008E+2 +203 +8.0E+0 -5.5E-1 +9.66E+1 +7.583E+0
33 +2.075E+2 +210 +7.0E+0 -9.2E-1 +9.68E+1 +7.337E+0
34 +2.142E+2 +216 +6.0E+0 -4.5E-1 +1.032E+2 +7.564E+0
35 +2.209E+2 +222 +6.0E+0 -1.1E-1 +1.020E+2 +7.711E+0
36 +2.276E+2 +227 +5.0E+0 +6.0E-2 +1.011E+2 +7.794E+0
37 +2.343E+2 +233 +6.0E+0 +1.3E-1 +1.005E+2 +7.828E+0
38 +2.410E+2 +239 +6.0E+0 +5.0E-1 +1.033E+2 +8.078E+0
39 +2.477E+2 +247 +8.0E+0 +7.0E-2 +9.72E+1 +7.844E+0
40 +2.544E+2 +253 +6.0E+0 +1.4E-1 +1.010E+2 +7.918E+0
41 +2.611E+2 +260 +7.0E+0 +1.1E-1 +9.99E+1 +7.902E+0
42 +2.678E+2 +266 +6.0E+0 +4.5E-1 +1.031E+2 +8.144E+0
43 +2.744E+2 +272 +6.0E+0 +6.0E-1 +1.016E+2 +8.270E+0
44 +2.811E+2 +278 +6.0E+0 +1.14E+0 +1.053E+2 +8.708E+0
45 +2.878E+2 +285 +7.0E+0 +1.03E+0 +1.000E+2 +8.700E+0
46 +2.945E+2 +291 +6.0E+0 +1.75E+0 +1.077E+2 +9.369E+0
47 +3.012E+2 +298 +7.0E+0 +1.18E+0 +9.70E+1 +9.079E+0
48 +3.079E+2 +304 +6.0E+0 +1.95E+0 +1.087E+2 +9.859E+0
49 +3.146E+2 +311 +7.0E+0 +1.80E+0 +1.005E+2 +9.899E+0
50 +3.213E+2 +319 +8.0E+0 +5.7E-1 +9.30E+1 +9.197E+0
51 +3.280E+2 +0 +0.0E+0 +0.0E+0 +0.0E+0 +0.0E+0
From the 9
th
idx step onwards one gets an almost constant average mA value,
Ignoring step zero of the table the time can be calculated:
(idx steps) x (time/sample) = 8 x 40.741 = 326ms, which matches with the chamber dose signal on the
oscilloscope screenshot.
The follwing exposure will be started with the last mA value of this exposure = 9.197mA.
TDC-calculation-process-pictures.doc Mar – 30 – 2005 page 14 - 20
Page 15

TDC Calculation
Fr 11. Mrz 08:36:10 2005
U nominal : 81 kV
I start : 9.197 mA
t backup : 2000 ms
C eff ht : 4.550 nF
dose measurement input: EZX21
film screen comb. : 1
dose nominal : 1 OD
I max : 370.370 mA
I min : 1 mA
I max NOMO : 210.987 mA
dose calculated : 291
kV factor : 0.870
U off : 0.712 V
t corrected : 1989.875 ms
number of steps : 49
time/sample : 40.609 ms
The dose ramp starts straight from the beginning and has is linear throughout the rest of the sweep.
The filament current is almost constant and ends where it started, the trace table next page starts with
9.197mA and ends with 9.321mA.
TDC-calculation-process-pictures.doc Mar – 30 – 2005 page 15 - 20
Page 16

TDC Trace
Fr 11. Mrz 08:38:10 2005
idx dose nominal dose actual dose rate reg in reg out new I
----------------------------------------------------------------------------
0 +0.0E+0 +0 +0.0E+0 +0.0E+0 +0.0E+0 +0.0E+0
1 +0.0E+0 +0 +0.0E+0 +0.0E+0 +0.0E+0 +9.197E+0
2 +1.6E+0 +2 +2.0E+0 +0.0E+0 +1.000E+2 +9.190E+0
3 +6.7E+0 +7 +5.0E+0 +0.0E+0 +1.000E+2 +9.190E+0
4 +1.34E+1 +14 +7.0E+0 -6.0E-2 +9.96E+1 +9.153E+0
5 +2.01E+1 +21 +7.0E+0 -9.0E-2 +9.98E+1 +9.131E+0
6 +2.68E+1 +28 +7.0E+0 -1.2E-1 +9.97E+1 +9.102E+0
7 +3.35E+1 +35 +7.0E+0 -3.7E-1 +9.79E+1 +8.908E+0
8 +4.02E+1 +41 +6.0E+0 -8.0E-2 +1.022E+2 +9.095E+0
9 +4.69E+1 +47 +6.0E+0 +0.0E+0 +1.003E+2 +9.117E+0
10 +5.36E+1 +54 +7.0E+0 +0.0E+0 +1.000E+2 +9.110E+0
11 +6.02E+1 +62 +8.0E+0 -4.5E-1 +9.67E+1 +8.809E+0
12 +6.69E+1 +70 +8.0E+0 -1.14E+0 +9.48E+1 +8.342E+0
13 +7.36E+1 +76 +6.0E+0 -6.0E-1 +1.038E+2 +8.656E+0
14 +8.03E+1 +84 +8.0E+0 -1.85E+0 +8.99E+1 +7.776E+0
15 +8.70E+1 +90 +6.0E+0 -1.11E+0 +1.051E+2 +8.166E+0
16 +9.37E+1 +97 +7.0E+0 -1.22E+0 +9.73E+1 +7.939E+0
17 +1.004E+2 +103 +6.0E+0 -9.6E-1 +1.008E+2 +7.993E+0
18 +1.071E+2 +110 +7.0E+0 -1.07E+0 +9.79E+1 +7.822E+0
19 +1.138E+2 +116 +6.0E+0 -5.5E-1 +1.032E+2 +8.070E+0
20 +1.205E+2 +123 +7.0E+0 -9.2E-1 +9.61E+1 +7.755E+0
21 +1.272E+2 +129 +6.0E+0 -4.5E-1 +1.032E+2 +7.998E+0
22 +1.339E+2 +136 +7.0E+0 -5.2E-1 +9.86E+1 +7.878E+0
23 +1.406E+2 +143 +7.0E+0 -6.0E-1 +9.89E+1 +7.783E+0
24 +1.473E+2 +150 +7.0E+0 -9.9E-1 +9.63E+1 +7.492E+0
25 +1.540E+2 +157 +7.0E+0 -1.11E+0 +9.82E+1 +7.355E+0
26 +1.607E+2 +163 +6.0E+0 -5.7E-1 +1.034E+2 +7.599E+0
27 +1.673E+2 +167 +4.0E+0 +0.0E+0 +1.047E+2 +7.946E+0
28 +1.740E+2 +175 +8.0E+0 -1.0E-1 +9.89E+1 +7.852E+0
29 +1.807E+2 +181 +6.0E+0 +0.0E+0 +1.008E+2 +7.912E+0
30 +1.874E+2 +189 +8.0E+0 -4.0E-1 +9.70E+1 +7.672E+0
31 +1.941E+2 +196 +7.0E+0 -4.7E-1 +9.93E+1 +7.616E+0
32 +2.008E+2 +202 +6.0E+0 -1.2E-1 +1.025E+2 +7.800E+0
33 +2.075E+2 +209 +7.0E+0 -3.7E-1 +9.77E+1 +7.620E+0
34 +2.142E+2 +215 +6.0E+0 -8.0E-2 +1.022E+2 +7.787E+0
35 +2.209E+2 +222 +7.0E+0 -1.1E-1 +9.95E+1 +7.741E+0
36 +2.276E+2 +227 +5.0E+0 +6.0E-2 +1.015E+2 +7.856E+0
37 +2.343E+2 +233 +6.0E+0 +1.3E-1 +1.005E+2 +7.889E+0
38 +2.410E+2 +239 +6.0E+0 +5.0E-1 +1.033E+2 +8.140E+0
39 +2.477E+2 +247 +8.0E+0 +7.0E-2 +9.72E+1 +7.912E+0
40 +2.544E+2 +254 +7.0E+0 +0.0E+0 +9.99E+1 +7.902E+0
41 +2.611E+2 +259 +5.0E+0 +5.2E-1 +1.050E+2 +8.295E+0
42 +2.678E+2 +266 +7.0E+0 +4.5E-1 +9.97E+1 +8.265E+0
43 +2.744E+2 +273 +7.0E+0 +1.4E-1 +9.81E+1 +8.103E+0
44 +2.811E+2 +279 +6.0E+0 +5.2E-1 +1.037E+2 +8.399E+0
45 +2.878E+2 +286 +7.0E+0 +4.5E-1 +9.98E+1 +8.373E+0
46 +2.945E+2 +291 +5.0E+0 +1.75E+0 +1.132E+2 +9.474E+0
47 +3.012E+2 +297 +6.0E+0 +2.10E+0 +1.042E+2 +9.867E+0
48 +3.079E+2 +303 +6.0E+0 +3.13E+0 +1.114E+2 +1.0984E+1
49 +3.146E+2 +311 +8.0E+0 +1.80E+0 +9.29E+1 +1.0200E+1
50 +3.213E+2 +319 +8.0E+0 +5.7E-1 +9.38E+1 +9.567E+0
51 +3.280E+2 +328 +9.0E+0 +0.0E+0 +9.75E+1 +9.321E+0
52 +0.0E+0 +0 +0.0E+0 +0.0E+0 +0.0E+0 +0.0E+0
To check whether the CTRL_X/ signal was active throughout the selected exposure time one can see it
indirectly reading the exposure time logged by the generator.
TDC-calculation-process-pictures.doc Mar – 30 – 2005 page 16 - 20
Page 17

The screen
has the following information:
Read Actual Status
Fr 11. Mrz 08:38:57 2005
selected mode : TDC
time measured : 1999.511 ms
last I : 9.321 mA
last U : 81 kV
dose relative : 100.300 %
dose offset : 0
last dose measured : 0
detected spikes : 0
LOCK IN state : UNLOCK
DRL (dose rate limitation) state: OFF
One can see the selected technique and the exposure time, which is measured
between 75% of the set kV when it rises and 75% of the kV when it falls.
The prediction of the calculation screen was a little shorter, but it is related to the start mA.
To detect problems with the tomo geometry of any kind the RGDV Dats Sets A should always have
so that the generator can turn the underexposure light on when the geometry exposure command
CTRL_X/ via the signal bus
or
CTRL_X/ via a release circuit adaptation unit WA/WB
was too short.
TDC-calculation-process-pictures.doc Mar – 30 – 2005 page 17 - 20
Page 18

The last TDC test was made with the same conditions as the one before, but with a higher kV = 90kV as well
with a higher start mA value of 40mA.
TDC Calculation
Fr 11. Mrz 08:40:31 2005
U nominal : 90 kV
I start : 40 mA
t backup : 2000 ms
C eff ht : 4.550 nF
dose measurement input: EZX21
film screen comb. : 1
dose nominal : 1 OD
I max : 333.333 mA
I min : 1 mA
I max NOMO : 189.888 mA
dose calculated : 271
kV factor : 0.810
U off : 0.662 V
t corrected : 1997.441 ms
number of steps : 49
time/sample : 40.764 ms
This will not be a good tomo exposure from the resolution point of view.
Almost 40% of the density is already achieved after about 200ms of 2000ms total time.
For about 350ms the filament current is off to decrease the filament temperature as fast as possible.
After 50% of the exposure time the filament current increases again with a 100ms filament max heat-up
phase to find a constant ramp to the final density voltage value.
TDC-calculation-process-pictures.doc Mar – 30 – 2005 page 18 - 20
Page 19

TDC Trace
Fr 11. Mrz 08:41:52 2005
idx dose nominal dose actual dose rate reg in reg out new I
-----------------------------------------------------------------------------
0 +0.0E+0 +0 +0.0E+0 +0.0E+0 +0.0E+0 +0.0E+0
1 +0.0E+0 +0 +0.0E+0 +0.0E+0 +0.0E+0 +4.0000E+1
2 +1.5E+0 +13 +1.30E+1 -1.115E+1 +5.00E+1 +2.0000E+1
3 +6.2E+0 +50 +3.70E+1 -4.380E+1 +5.00E+1 +1.0000E+1
4 +1.24E+1 +81 +3.10E+1 -6.860E+1 +5.00E+1 +5.000E+0
5 +1.87E+1 +101 +2.00E+1 -8.230E+1 +5.00E+1 +2.500E+0
6 +2.49E+1 +114 +1.30E+1 -8.910E+1 +5.00E+1 +1.250E+0
7 +3.11E+1 +121 +7.0E+0 -8.990E+1 +5.00E+1 +1.000E+0
8 +3.73E+1 +125 +4.0E+0 -8.770E+1 +5.00E+1 +1.000E+0
9 +4.36E+1 +128 +3.0E+0 -8.440E+1 +5.00E+1 +1.000E+0
10 +4.98E+1 +129 +1.0E+0 -7.920E+1 +5.00E+1 +1.000E+0
11 +5.60E+1 +131 +2.0E+0 -7.500E+1 +5.00E+1 +1.000E+0
12 +6.22E+1 +133 +2.0E+0 -7.080E+1 +5.00E+1 +1.000E+0
13 +6.85E+1 +134 +1.0E+0 -6.550E+1 +5.00E+1 +1.000E+0
14 +7.47E+1 +135 +1.0E+0 -6.030E+1 +5.00E+1 +1.000E+0
15 +8.09E+1 +138 +3.0E+0 -5.710E+1 +5.00E+1 +1.000E+0
16 +8.71E+1 +138 +0.0E+0 -5.090E+1 +5.00E+1 +1.000E+0
17 +9.34E+1 +140 +2.0E+0 -4.660E+1 +5.00E+1 +1.000E+0
18 +9.96E+1 +141 +1.0E+0 -4.140E+1 +6.49E+1 +1.000E+0
19 +1.058E+2 +143 +2.0E+0 -3.720E+1 +6.58E+1 +1.000E+0
20 +1.120E+2 +145 +2.0E+0 -3.300E+1 +7.62E+1 +1.000E+0
21 +1.183E+2 +146 +1.0E+0 -2.770E+1 +1.020E+2 +1.020E+0
22 +1.245E+2 +147 +1.0E+0 -2.250E+1 +1.123E+2 +1.145E+0
23 +1.307E+2 +149 +2.0E+0 -1.830E+1 +1.067E+2 +1.216E+0
24 +1.369E+2 +151 +2.0E+0 -1.410E+1 +1.172E+2 +1.418E+0
25 +1.432E+2 +154 +3.0E+0 -1.026E+1 +1.179E+2 +1.662E+0
26 +1.494E+2 +155 +1.0E+0 -4.08E+0 +1.774E+2 +2.944E+0
27 +1.556E+2 +158 +3.0E+0 -6.0E-1 +1.298E+2 +3.816E+0
28 +1.618E+2 +163 +5.0E+0 -1.2E-1 +1.007E+2 +3.836E+0
29 +1.681E+2 +169 +6.0E+0 -9.0E-2 +9.98E+1 +3.822E+0
30 +1.743E+2 +176 +7.0E+0 -4.2E-1 +9.72E+1 +3.713E+0
31 +1.805E+2 +181 +5.0E+0 -5.0E-2 +1.034E+2 +3.836E+0
32 +1.867E+2 +188 +7.0E+0 -1.3E-1 +9.91E+1 +3.795E+0
33 +1.930E+2 +194 +6.0E+0 -1.0E-1 +1.001E+2 +3.793E+0
34 +1.992E+2 +200 +6.0E+0 -8.0E-2 +1.000E+2 +3.790E+0
35 +2.054E+2 +205 +5.0E+0 +0.0E+0 +1.006E+2 +3.812E+0
36 +2.116E+2 +210 +5.0E+0 +4.0E-1 +1.039E+2 +3.958E+0
37 +2.179E+2 +215 +5.0E+0 +1.07E+0 +1.068E+2 +4.218E+0
38 +2.241E+2 +221 +6.0E+0 +1.14E+0 +1.014E+2 +4.268E+0
39 +2.303E+2 +228 +7.0E+0 +5.7E-1 +9.67E+1 +4.119E+0
40 +2.365E+2 +234 +6.0E+0 +9.2E-1 +1.043E+2 +4.286E+0
41 +2.428E+2 +240 +6.0E+0 +1.03E+0 +1.019E+2 +4.361E+0
42 +2.490E+2 +248 +8.0E+0 +1.0E-1 +9.41E+1 +4.102E+0
43 +2.552E+2 +254 +6.0E+0 +1.2E-1 +1.010E+2 +4.141E+0
44 +2.614E+2 +259 +5.0E+0 +6.0E-1 +1.049E+2 +4.342E+0
45 +2.677E+2 +264 +5.0E+0 +1.85E+0 +1.128E+2 +4.895E+0
46 +2.739E+2 +270 +6.0E+0 +1.95E+0 +1.023E+2 +5.002E+0
47 +2.801E+2 +278 +8.0E+0 +5.2E-1 +9.13E+1 +4.565E+0
48 +2.863E+2 +284 +6.0E+0 +5.7E-1 +1.023E+2 +4.664E+0
49 +2.926E+2 +289 +5.0E+0 +1.80E+0 +1.130E+2 +5.265E+0
50 +2.988E+2 +296 +7.0E+0 +1.03E+0 +9.49E+1 +4.991E+0
51 +3.050E+2 +0 +0.0E+0 +0.0E+0 +0.0E+0 +0.0E+0
The final emission current setpoint of the TDC trace is the start value for the next exposure.
The calculation screen was lost, but the oscilloscope screenshot next page shows a perfect dose ramp.
TDC-calculation-process-pictures.doc Mar – 30 – 2005 page 19 - 20
Page 20

mAs value of the first sweep with start values way too high and the mAs of the 2
Read Actual Status
Fr 11. Mrz 08:43:41 2005
selected mode : TDC
time measured : 1999.405 ms
last I : 4.820 mA
last U : 90 kV
dose relative : 100.900 %
dose offset : 1
last dose measured : 0
detected spikes : 0
LOCK IN state : UNLOCK
DRL (dose rate limitation) state: OFF
The exposure time is correct, no problems with the hardware release signals.
nd
exposure are very close.
TDC-calculation-process-pictures.doc Mar – 30 – 2005 page 20 - 20
 Loading...