


Copyright © PHABRIX Ltd 2012
PHABRIX Rx Operation Manual
PHABRIX
®
®
broadcast excellence
Software Release 0.03.0015
Manual Revision 2
PHRX2000-200 2

Contents
About this Manual
Notice
The information in this document has been produced by PHABRIX Ltd with care and is believed
to be accurate. PHABRIX Ltd does not assume responsibility for loss or damage resulting from
errors, omissions or inaccuracies herein. This document is subject to change and revisions may
be made and issued to include such changes.
No part of this document may be reproduced, stored in a retrieval system or transmitted in any
form or by any means, electronic, mechanical, recorded or otherwise without the prior written
consent of PHABRIX Ltd.
Copyright © PHABRIX Ltd. All rights reserved. Software products licensed are owned by
PHABRIX Ltd and are protected by international treaty provisions and national copyright laws.
Revision
This manual is a revision controlled document. Any changes to any page content will be
reflected in the overall revision status of the whole manual.
Revision Date Software Version Comment
1 08/08/2012 0.03.0012 First release of manual
2 29/08/2012 0.03.0015
Phabrix® Limited
Omega House,
Enterprise Way,
Thatcham,
Berkshire
RG19 4AE
United Kingdom
tel + 44 (0)1635 873030
email: info@phabrix.com www.phabrix.com
ii PHRX2000-200 2Contents 08/12

Getting Started
Package Contents
The shipping box should contain the following
PHABRIX Rx unit
Power Supply Unit
Mains lead
CD Manual
Allen Key
The shipping box will also contain this Manual on a CD, note that the Web Site always contains
the latest version of the manual. The version of software that this manual supports is on the
front page.
General Safety
Avoiding Personal Injury
Contents
This instrument is designed for use by qualified personnel only.
No user serviceable parts are provided. Units should be returned to your local
PHABRIX agent for servicing.
The Operator should NOT remove the case from the unit.
Do not spill any liquid onto the unit or its power adaptor.
Power Supply
Make sure that the unit is connected to the correct power supply voltage. A power supply
adaptor is supplied with the unit which may be connected to any AC power supply between
100 and 240VAC at 50-60Hz. Only the supplied power adaptor should be used with the
unit. Do not use a damaged AC cable with the unit as it may cause a shock or fire hazard.
Replacement AC cables are available from your local PHABRIX agent.
PHABRIX Rx Operation Manual iiiPHRX2000-200 2

Contents
Installation Environment
Operating Temperature
The unit should only be operated between 0 and 40 °Centigrade. If the unit is
operated at a higher temperature there is a possibility of a fire hazard. If the
temperature is changed rapidly from a cold environment to a hot environment,
moisture can be created internally which can cause malfunction or damage the
unit. Allow the unit to sit for 30 minutes without power applied to reduce any
possibility of condensation. If the temperature rises above 60°Centigrade a
warning dialog will be given. If the temperature rises above 65°Centigrade the
unit will be turned OFF. Under both conditions, an event will be added to the
event log to show what happened.
Input/Output Terminals
Do not connect the input or output BNC connectors to external power as this can damage the
internal circuitry and cause the unit to work incorrectly.
When Not In Use
Disconnect the unit from the power supply and AC power source when not in use.
Maintenance
Wipe the case, and knobs gently with a soft cloth, lightly dampened with a neutral cleaning
agent. A screen cleaning cloth may be used to clean the LCD. Do not apply force to the LCD
when cleaning or it may be damaged.
Remove the power supply from the unit and turn OFF before cleaning. Do not
allow any water or other liquid to enter the unit while cleaning.
Disposal of Equipment
This product is subject to the European WEEE (Waste Electrical and
Electronic Equipment) directive and should be disposed of according to the
regulations of each country.
iv PHRX2000-200 2Contents 08/12

Contents
Contents
Getting Started iii
Package Contents ........................................................................................................iii
General Safety.............................................................................................................iii
Avoiding Personal Injury .........................................................................................iii
Power Supply .........................................................................................................iii
Installation Environment .............................................................................................iv
Operating Temperature ..........................................................................................iv
Input/Output Terminals ...........................................................................................iv
When Not In Use ....................................................................................................iv
Maintenance ..........................................................................................................iv
Disposal of Equipment ................................................................................................iv
Description
Rx Platform 1–3
Overview ..................................................................................................................... 1–3
Rx2000 ...................................................................................................................... 1–4
Description ............................................................................................................. 1–4
Front Panel .............................................................................................................1–4
Rear Panel ............................................................................................................. 1–4
Specifications ......................................................................................................... 1–4
Rx1000 Rasteriser ......................................................................................................1–5
Description ............................................................................................................. 1–5
Front Panel .............................................................................................................1–5
Rear Panel ............................................................................................................. 1–5
Specifications ......................................................................................................... 1–5
Rx500 Rasteriser ........................................................................................................ 1–6
Description ............................................................................................................. 1–6
Front Panel .............................................................................................................1–6
Rear Panel ............................................................................................................. 1–6
Specifications ......................................................................................................... 1–6
Rx Modules ................................................................................................................. 1–7
Overview ................................................................................................................ 1–7
CPU Module ........................................................................................................... 1–7
Single Analyzer, Dual Input ..................................................................................... 1–8
Single Analyzer, Dual Input, Physical Layer Measurement ..................................... 1–8
Single Analyzer, Single Generator ........................................................................... 1–9
Single Analyzer, Single Generator, Physical Layer Measurement ............................ 1–9
Dual Output Generator Module .............................................................................. 1–10
Rx Software Options ................................................................................................... 1–11
Overview ................................................................................................................ 1–11
3G-SDI and advanced formats upgrade for Rx chassis ........................................... 1–11
HD/SD-SDI Data Analyzer and Ancillary Packet analyzer ....................................... 1–11
Dolby - E analysis ................................................................................................... 1–12
Dual analyzer for SDI input modules ...................................................................... 1–12
Advanced physical layer analysis ...........................................................................1–12
Contents
PHABRIX Rx Operation Manual vPHRX2000-200 2

Contents
Front Panel Control 1–13
Rx2000 ...................................................................................................................... 1–13
Turning on and off the instrument ........................................................................... 1–13
Main Menu ............................................................................................................ 1–13
Instrument Status ................................................................................................... 1–14
Using the Menus .................................................................................................... 1–14
Multiple Analyzers .................................................................................................. 1–15
Rx1000 & Rx500 ....................................................................................................... 1–16
Turning on and off the instrument ........................................................................... 1–16
Navigation ............................................................................................................. 1–16
Monitor Output 1–19
Overview ..................................................................................................................... 1–19
Display Area .......................................................................................................... 1–19
Window Panel Types .................................................................................................... 1–20
New Picture ............................................................................................................ 1–20
New Waveform ....................................................................................................... 1–20
New Vectorscope .................................................................................................... 1–21
New Eye ................................................................................................................. 1–21
New Jitter ............................................................................................................... 1–21
New SDI Errors ....................................................................................................... 1–22
New Input Status .................................................................................................... 1–22
New Input Timing ................................................................................................... 1–22
New Data View ....................................................................................................... 1–23
New ANC Status ..................................................................................................... 1–23
New ANC Inspector ................................................................................................ 1–23
New Audio Meters .................................................................................................. 1–24
New Audio Status ................................................................................................... 1–24
New Dolby Meta-data ............................................................................................1–24
New Generator ....................................................................................................... 1–25
New Generator Audio 1-4 ....................................................................................... 1–25
New Generator Audio 5-8 ....................................................................................... 1–25
New Generator Reference ....................................................................................... 1–26
New Event Log ....................................................................................................... 1–26
New Log setup ....................................................................................................... 1–26
New Eye Log setup ................................................................................................. 1–27
New ANC Log setup ................................................................................................ 1–27
Network Setup ....................................................................................................... 1–27
System Info ............................................................................................................ 1–28
Engineer Setup ....................................................................................................... 1–28
Date/Time Setup ..................................................................................................... 1–28
HDMI/CPU SDI Setup ............................................................................................. 1–29
System Status ........................................................................................................ 1–29
Setup Login ............................................................................................................ 1–29
Managing the Monitor Output .................................................................................... 1–30
Closing Open Panels (Windows) .............................................................................. 1–30
Working with Multiple Analyzers ............................................................................ 1–30
Working with Multiple Generators .......................................................................... 1–31
Saving Monitor Display Layouts ............................................................................. 1–31
Contents
Browser Control 1–33
Overview ..................................................................................................................... 1–33
Using the Menus .................................................................................................... 1–34
vi PHRX2000-200 2Contents 08/12

Menu Reference
Generator Menu 2–3
Video Out.................................................................................................................... 2–3
Output On .............................................................................................................. 2–3
Standard ................................................................................................................ 2–3
Colour Format ........................................................................................................ 2–3
Pattern ................................................................................................................... 2–4
EDH ........................................................................................................................ 2–6
Errors ..................................................................................................................... 2–6
SMPTE 352 ............................................................................................................ 2–6
Ident ...................................................................................................................... 2–6
Genlock Menu ............................................................................................................. 2–7
Source .................................................................................................................... 2–7
Audio Group Menu ...................................................................................................... 2–8
Group n .................................................................................................................. 2–8
Source .................................................................................................................... 2–8
Inv .......................................................................................................................... 2–8
Link ........................................................................................................................ 2–8
Master ................................................................................................................... 2–8
AES O/P ................................................................................................................. 2–8
Dolby .......................................................................................................................... 2–9
Overview ................................................................................................................ 2–9
Dolby E .................................................................................................................. 2–9
Dolby Synchronisation - Generator Reference ........................................................ 2–10
Editing Program Information ..................................................................................2–10
Program Meta Data Editing ................................................................................... 2–11
Default Program Meta Data ................................................................................... 2–13
Embedding Dolby on SDI Stream ............................................................................ 2–13
Embedding Dolby Signals on AES Stream ............................................................... 2–13
Contents
Analyzer Menu 2–15
Overview ..................................................................................................................... 2–15
Picture ........................................................................................................................ 2–16
Signal Data ................................................................................................................. 2–17
Type ....................................................................................................................... 2–17
Source .................................................................................................................... 2–17
Waveform Monitor ......................................................................................................2–18
Cursors ................................................................................................................... 2–19
Setup Button Dialogue ........................................................................................... 2–19
Vectorscope ................................................................................................................. 2–20
Eye .............................................................................................................................. 2–21
Eye Display ............................................................................................................ 2–22
Jitter Filters ............................................................................................................ 2–23
Jitter Meter Ranges ............................................................................................... 2–23
Setup ..................................................................................................................... 2–24
Advanced Jitter Analysis (Option)...........................................................................2–25
Jitter ........................................................................................................................... 2–26
PHABRIX Rx Operation Manual viiPHRX2000-200 2

Contents
Signal Information Menu 2–27
Overview ..................................................................................................................... 2–27
Video Status ................................................................................................................ 2–27
EDH/CRC ERRORS .................................................................................................. 2–27
EDH DATA .............................................................................................................. 2–27
Cable Length .......................................................................................................... 2–28
Active Picture CRC .................................................................................................. 2–28
MISC Status ................................................................................................................ 2–29
Payload ID – SMPTE 352 ...................................................................................... 2–29
Video Format ......................................................................................................... 2–29
Video Timing ............................................................................................................... 2–30
ANC Status (ANC Option) ........................................................................................... 2–31
ANC Inspector (SDI Data Option) ................................................................................ 2–32
ANC Inspector Setup .............................................................................................. 2–33
Error Triggers ......................................................................................................... 2–33
Audio Menu 2–35
Audio Meters ..............................................................................................................2–35
Audio Status ...............................................................................................................2–36
Dolby-E Status (Dolby-E Analyzer Option) ................................................................... 2–37
Overview ................................................................................................................ 2–37
Dolby E .................................................................................................................. 2–37
Analyser Reference ................................................................................................ 2–38
Source selection ..................................................................................................... 2–38
Dolby Framing Values ............................................................................................ 2–38
Programme configuration ....................................................................................... 2–39
Programme Metadata ............................................................................................ 2–40
Peak Metering ........................................................................................................2–41
System Menu 2–43
Memories .................................................................................................................... 2–43
Saving Memories ................................................................................................... 2–43
Recalling Memories ................................................................................................ 2–43
Renaming Memories .............................................................................................. 2–43
Adding Additional Memories .................................................................................. 2–44
Clearing Memories ................................................................................................. 2–44
Exporting Memories ............................................................................................... 2–44
Disk Space ............................................................................................................. 2–44
Network ...................................................................................................................... 2–45
Misc ............................................................................................................................ 2–46
Changing The Date/Time ........................................................................................ 2–46
Changing the Date Format: .................................................................................... 2–46
Setting LCD Brightness ........................................................................................... 2–46
Setting User Language ........................................................................................... 2–46
Changing Options Security Code ............................................................................ 2–46
Utils ............................................................................................................................ 2–47
Dealer Features ......................................................................................................2–47
Board (Module) ...................................................................................................... 2–47
Hardware Status .................................................................................................... 2–47
System Temperature ............................................................................................... 2–47
Voltages ................................................................................................................. 2–48
SFP ........................................................................................................................ 2–48
viii PHRX2000-200 2Contents 08/12

Engineer...................................................................................................................... 2–49
Clear Memories ...................................................................................................... 2–49
Default Settings ...................................................................................................... 2–49
Set User Login ........................................................................................................ 2–49
Adding/Deleting Users ............................................................................................ 2–49
Editing The Prompt Text ......................................................................................... 2–50
Software Upgrade ..................................................................................................2–50
HDMI/SDI Output ....................................................................................................... 2–52
Logging Menu 2–53
Overview ..................................................................................................................... 2–53
Event Log .................................................................................................................... 2–53
Log Setup.................................................................................................................... 2–54
Audio Thresholds ....................................................................................................2–54
Video Status ........................................................................................................... 2–54
AES Status ............................................................................................................. 2–55
Dolby-E Status (Requires Dolby-E Analysis Option) ................................................ 2–55
Logging .................................................................................................................. 2–55
Log Time Limit ........................................................................................................ 2–55
Log Eye Jitter .............................................................................................................. 2–56
Jitter Thresholds .................................................................................................... 2–56
Eye Timings ............................................................................................................ 2–56
Eye Amplitude ........................................................................................................ 2–56
Log ANC Status ........................................................................................................... 2–57
Contents
Speaker Menu 2–59
Overview ..................................................................................................................... 2–59
Glossary
Glossary of Terms A–3
PHABRIX Rx Operation Manual ixPHRX2000-200 2

Contents
Specification
Rx Platform B–3
Overview .....................................................................................................................B–3
Rx2000 B–5
Description .................................................................................................................B–5
Description .............................................................................................................B–5
Environmental Requirements ......................................................................................B–5
Dimensions .................................................................................................................B–6
Front Panel Dimensions ..........................................................................................B–6
Back Panel Dimensions ..........................................................................................B–6
Top Panel Dimensions ............................................................................................. B–6
Side Panel Dimensions ...........................................................................................B–6
Front Panel .................................................................................................................B–7
Front Panel Display ................................................................................................B–7
Loud Speakers .......................................................................................................B–7
Headphone Output .................................................................................................B–7
Rear Panel ..................................................................................................................B–7
Power Connection ...................................................................................................B–7
External Locking Reference ....................................................................................B–8
AES Input ...............................................................................................................B–8
SDI Out ..................................................................................................................B–8
HDMI .....................................................................................................................B–8
Local Control ..........................................................................................................B–8
Networking .............................................................................................................B–8
GPIO - Terminal ...................................................................................................... B–9
GPIO - Longitudinal Timecode (LTC) .......................................................................B–9
GPIO - Analogue Audio Output ...............................................................................B–9
GPIO .....................................................................................................................B–9
Rx1000 Rasteriser B–11
Description .................................................................................................................B–11
Environmental Requirements ......................................................................................B–11
Dimensions .................................................................................................................B–12
Front Panel Dimensions ..........................................................................................B–12
Top Panel Dimensions ............................................................................................. B–12
Side Panel Dimensions ...........................................................................................B–12
Front Panel .................................................................................................................B–13
Front Panel Display ................................................................................................B–13
Rear Panel ..................................................................................................................B–13
Power Connection ...................................................................................................B–13
External Locking Reference ....................................................................................B–13
AES Input ...............................................................................................................B–14
SDI Out ..................................................................................................................B–14
HDMI .....................................................................................................................B–14
Local Control ..........................................................................................................B–14
Networking .............................................................................................................B–14
GPIO - Terminal ...................................................................................................... B–14
GPIO - Longitudinal Timecode (LTC) .......................................................................B–15
GPIO - Analogue Audio Output ...............................................................................B–15
GPIO - ...................................................................................................................B–15
x PHRX2000-200 2Contents 08/12

Rx500 Rasteriser B–17
Description .................................................................................................................B–17
Environmental Requirements ......................................................................................B–17
Dimensions .................................................................................................................B–18
Front Panel Dimensions ..........................................................................................B–18
Top Panel Dimensions ............................................................................................. B–18
Side Panel Dimensions ...........................................................................................B–18
Front Panel .................................................................................................................B–19
Front Panel Display ................................................................................................B–19
Rear Panel ..................................................................................................................B–19
Power Connection ...................................................................................................B–19
External Locking Reference ....................................................................................B–19
AES Input ...............................................................................................................B–20
SDI Out ..................................................................................................................B–20
HDMI .....................................................................................................................B–20
Local Control ..........................................................................................................B–20
Networking .............................................................................................................B–20
GPIO - Terminal ...................................................................................................... B–20
GPIO - Longitudinal Timecode (LTC) .......................................................................B–21
GPIO - Analogue Audio Output ...............................................................................B–21
GPIO - ...................................................................................................................B–21
Contents
Rx Modules B–23
Single Analyzer, Dual Input .........................................................................................B–23
Analyzer SDI Inputs ................................................................................................B–23
Analyzer SDI Outputs .............................................................................................B–23
Analyzer Optical Inputs ..........................................................................................B–23
Analyzer Functionality ............................................................................................B–24
Single Analyzer, Dual Input, Physical Layer Measurement ...........................................B–25
Analyzer SDI Inputs ................................................................................................B–25
Analyzer SDI Outputs .............................................................................................B–25
Analyzer Optical Inputs ..........................................................................................B–25
Analyzer Functionality ............................................................................................B–26
Single Analyzer, Single Generator ................................................................................B–27
Analyzer SDI Input ..................................................................................................B–27
Analyzer SDI Output ...............................................................................................B–27
Analyzer Optical Input ............................................................................................B–27
Generator Optical Ouput ........................................................................................B–27
Analyzer Functionality ............................................................................................B–28
Generator Functionality ..........................................................................................B–28
Single Analyzer, Single Generator, Physical Layer Measurement ..................................B–29
Analyzer SDI Input ..................................................................................................B–29
Analyzer SDI Output ...............................................................................................B–29
Analyzer Optical Input ............................................................................................B–29
Generator Optical Output ......................................................................................B–29
Generator Functionality ..........................................................................................B–30
Analyzer Functionality ............................................................................................B–30
Single/Dual Analyzer, Dual Input, Physical Layer Measurement ...................................B–31
Analyzer SDI Inputs ................................................................................................B–31
Analyzer SDI Outputs .............................................................................................B–31
Analyzer Optical Inputs ..........................................................................................B–31
Analyzer Functionality ............................................................................................B–32
PHABRIX Rx Operation Manual xiPHRX2000-200 2

Contents
Dual Output Generator Module ..................................................................................B–33
Generator Optical Outputs .....................................................................................B–33
Generator Functionality ..........................................................................................B–33
Supported Video Formats B–35
SD 270 Mb/s ..............................................................................................................B–35
HD 1.485 Gb/s (SMPTE 292M) ..................................................................................B–35
Dual Link 1.485 Gb/s (SMPTE 327M) .........................................................................B–36
3G Level-A 2.97 Gb/s (SMPTE 425M-A) .....................................................................B–38
3G Level-B 2.97 Gb/s (SMPTE 425-B) .........................................................................B–39
Built-in Generator Formats (CPU Module) ...................................................................B–40
Maintenance
Warranty C–3
Overview .....................................................................................................................C–3
Warranty Exceptions ...................................................................................................C–3
Product Registration ...................................................................................................C–3
Maintenance C–5
General Maintenance ..................................................................................................C–5
Preventative Maintenance ...........................................................................................C–5
Software Maintenance C–7
Installing New Software ...............................................................................................C–7
Using a USB Pen Drive ...........................................................................................C–7
Software Download from Internet ...........................................................................C–8
FTP Transfer from a connected PC ..........................................................................C–9
Reverting to a Earlier Version of Software ...................................................................C–9
FTP Connection ...........................................................................................................C–10
Rx File Structure .........................................................................................................C–10
Patterns .................................................................................................................C–10
Scripts ....................................................................................................................C–10
Setup .....................................................................................................................C–11
Idents .....................................................................................................................C–11
Fonts ......................................................................................................................C–11
xii PHRX2000-200 2Contents 08/12

PHABRIX
®
®
broadcast excellence
1
Description
PHABRIX Rx Operaon Manual 1–1PHRX2000-200 2

Description
1–2 PHRX2000-200 2Descripon 08/12

Rx Platform
Overview
The ‘Rx platform’ has been designed to serve the varied test and measurement needs of the
broadcast industry. PHABRIX has developed not a single product in the traditional sense but a
modular system from which specific broadcast client requirements can be satisfied.
Description
The Rx platform allows a flexible approach to test and measurement on a new technological
platform designed for longevity. The system has been created to allow broadcast engineers to
specify features according to the complexity of the required test and measurement application
by simply adding additional modules and software licenses to their chosen core chassis.
Adding modules is like adding independent new instruments, each module providing a
dedicated set of instruments for the task required.
The Rx Platform is available in a choice of chassis types:
Rx2000 – a unique audio video monitoring solution combining front panel
instrumentation, via dual TFT screens, and integrated full range stereo speakers. Unique
2U tapered ‘tilt-in-bay’ engineering with four Rx module bays.
Rx1000 rasterizer – a compact 1U 19” rack-mount chassis with OLED display interface
with four Rx module bays.
Rx500 rasterizer – a compact 1U ½ rack width chassis with OLED display interface with
two Rx module bays.
PHABRIX Rx Operaon Manual 1–3PHRX2000-200 2

Description
Rx2000
Description
The Rx2000 is a 2U rack mounted instrument that provides the following:
Two front panel TFT screens, one to display the selected input image and the other to
display the generator and analyzer menus and selected analyzer instrument panels such
as Waveform monitor, Vectorscope and Eye Pattern display.
Rasterised HDMI/SDI outputs to allow up to 16 individual instrument panels (windows)
to be displayed on a single DVI 1920 x 1080 resolution monitor. Ideal for outside
broadcast facilities and engineering bays where space is at a premium.
Individual input selection, for instant confidence and monitoring of feeds, using
dedicated source selection buttons.
Control via front panel controls, for in-bay use and remotely via a network connection
using a web browser.
Front panel audio monitoring, provided by high quality speakers and/or a head phone
socket, to allow the monitoring of the selected Audio channel.
4 Module slots allowing the installation of Analyzer and Generator modules.
Front Panel
The front panel provides access to the Video Confidence Display, the Instrument Display and
menu system.
Rear Panel
The rear panel provides the Rx instrument’s connections via the CPU module and the installed
Analyzer or Generator modules. See the “Modules” section for details of the different module
types.
The power for the Rx instrument is provided by a separate PSU unit that connects to the 4-pin
male XLR connector at the left of the instrument.
Specifications
See Appendix B for specifications
1–4 PHRX2000-200 2Descripon 08/12

Rx1000 Rasteriser
Description
The Rx1000 is a 1U rack mounted instrument that provides the following:
OLED display to allow the monitoring inputs and the selection of Monitor display,
Analyzer and Generator presets.
Rasterised HDMI/SDI outputs to allow up to 16 individual instrument panels (windows)
to be displayed on a single DVI 1920 x 1080 resolution monitor. Ideal for outside
broadcast facilities and engineering bays where space is at a premium.
Control via front panel controls, for in-bay use and remotely via a network connection
using a web browser.
Front panel audio monitoring, provided by high quality speakers and/or a head phone
socket, to allow the monitoring of the selected Audio channel.
4 Module slots allowing the installation of Analyzer and Generator modules.
Front Panel
Description
The front panel provides access to the LCD Display and menu system to allow the instrument
to be configured and preset Monitor display, Analyzer and Generator settings to be recalled.
Rear Panel
The rear panel provides the Rx instrument’s connections via the CPU module and the installed
Analyzer or Generator modules. See the “Modules” section for details of the different module
types.
The power for the Rx instrument is provided by a separate PSU unit that connects to the 4-pin
male XLR connector at the left of the instrument.
Specifications
See Appendix B for specifications
PHABRIX Rx Operaon Manual 1–5PHRX2000-200 2

Description
Rx500 Rasteriser
Description
The Rx500 is a 1U, half rack width instrument (available with optional rack mount kit) that
provides the following:
OLED display to allow the monitoring inputs and the selection of Monitor display,
Analyzer and Generator presets.
Rasterised HDMI/SDI outputs to allow up to 16 individual instrument panels (windows)
to be displayed on a single DVI 1920 x 1080 resolution monitor. Ideal for outside
broadcast facilities and engineering bays where space is at a premium.
Control via front panel controls, for in-bay use and remotely via a network connection
using a web browser.
Front panel head phone socket to allow the monitoring of the selected Audio channel.
2 Module slots allowing the installation of Analyzer and Generator modules.
Front Panel
The front panel provides access to the LCD Display and menu system to allow the instrument
to be configured and preset Monitor display, Analyzer and Generator settings to be recalled.
Rear Panel
The rear panel provides the Rx instrument’s connections via the CPU module and the installed
Analyzer or Generator modules. See the “Modules” section for details of the different module
types.
The power for the Rx instrument is provided by a separate PSU unit that connects to the 4-pin
male XLR connector at the left of the instrument.
Specifications
See Appendix B for specifications
1–6 PHRX2000-200 2Descripon 08/12

Rx Modules
REF
CPU
AES
IN
SDI
OUT
HDMI
USB LAN GPIO
REF
CPU
AES
IN
SDI
OUT
HDMI
USB LAN GPIO
Overview
The Rx range can be configured with a range of plug-in modules (printed circuit boards with
dedicated hardware for specific functions) that enable functionality in the software an allow
different menus to be selected on the front panel (Rx2000) and allow different Instrument
panels (windows) to be created on the Monitor output.
Note that the Monitor Output - “System Status” menu can be used to inspect which Modules
have been installed in the Rx instrument. See the “Monitor Output” section for details.
CPU Module
At the heart of every Rx product is the CPU module. Here signals from each installed
instrument module are processed to provide a variety of instrument displays. Unhindered by
stacked processing restraints, the CPU board creates an output display at an industry leading
1920 x 1080 pixels with perfect scaling via simultaneous HDMI and/or SDI outputs. In practice
the Rx acts like a Test & Measurement multi-viewer providing scaled instruments from any
selected video/audio input.
Description
The CPU board also provides AES input, Bi/Tri level looping reference, 8 channel GPI, LTC
input and stereo analogue audio output to meet ‘competitive tender’ requirements. Dual USB
ports are provided for mouse and keyboard control. Ethernet provides remote access via web
browser and is also the method for updating firmware and software from PHABRIX’s dedicated
server.
REF [75 Ω BNC] Is an SD-SDI or HD-SDI locking reference signal, high impeadance loop
through that allows the Rx instrument to be locked to a studio reference.
AES IN [75 Ω BNC] Is an AES audio input conforming to AES3-2003 and SMPTE-276M
SDI OUT [75 Ω BNC] Is an SD-SDI or HD-SDI signal generator output that provides test
signals generated by the on-board Generator module on the CPU board. This
output can also be used to provide an SDI monitor output tied to the HDMI
monitor output.
HDMI [HDMI Type A] Is a DVI 1920 x 1080 resolution monitor output that allows upto
16 individual instrument panels (or windows) to be displayed.
USB [USB Series A] Are standard USB 2 connections provided for connection of a
keyboard and mouse to control the HDMI monitor output.
LAN [RJ-45] Is a 10/100-base-T connection allowing the Rx instrument to be connected
into a network and accessed via TCP/IP so that it can be controlled remotely.
GPIO [26-way D-type] provides a GPI (general purpose input), LTC control and analogue
audio connections.
9
8
17
26 19202122232425
7 6
16
5
4 3 2
12131415
1
11
1018
1 Data Terminal Equipment - Transmit (TX) (RS-232 compatible)
2 Data Terminal Equipment - Receive (RX) (RS-232 compatible)
3 Data Terminal Equipment - Request to Send (RTS)
4 Data Terminal Equipment - Clear to Send (CTS)
PHABRIX Rx Operaon Manual 1–7PHRX2000-200 2

Description
5 Longitudinal Timecode (LTC) - Receive (RX) P (RS-422 compatible)
6 Longitudinal Timecode (LTC) - Receive (RX) N (RS-422 compatible)
7 Audio Line Out - Right (1V peak-to-peak analogue audio, full scale 0dBFS)
8 Audio Line Out - Left (1V peak-to-peak analogue audio, full scale 0dBFS)
9 5 Volt, current-limted GPIO supply for ‘open drain’ input/outputs.
10-18 signal ground / 0 Volt
19 GPIO - 0 (open drain with 10K ohm pull-up to +5 Volts)
20 GPIO - 1 (open drain with 10K ohm pull-up to +5 Volts)
21 GPIO - 2 (open drain with 10K ohm pull-up to +5 Volts)
22 GPIO - 3 (open drain with 10K ohm pull-up to +5 Volts)
23 GPIO - 4 (open drain with 10K ohm pull-up to +5 Volts)
24 GPIO - 5 (open drain with 10K ohm pull-up to +5 Volts)
25 GPIO - 6 (open drain with 10K ohm pull-up to +5 Volts)
26 GPIO - 7 (open drain with 10K ohm pull-up to +5 Volts)
Single Analyzer, Dual Input
OPTICAL
A AB LP2 IN2 LP1 IN1
The PHRXM-A module provides the following connections:
IN1 - LP1 [75 Ω BNC] Is an SD-SDI or HD-SDI signal, high impedance loop through
that allows the Rx instrument to analyse the connected input.
IN2 - LP2 [75 Ω BNC] Is a second SD-SDI or HD-SDI signal, high impedance loop
through that allows the Rx instrument to analyse the connected input.
OPTICAL Allows a Video Transceiver (SFP Optical) module to be installed.
Only single transmitter, single receiver modules that are compliant to
SMPTE 424M, SMPTE 292M, and SMPTE 259M are supported.
The PHRXM-A module allows 2 connected
SDI or Optical video signals to be present
continuously and switched for analysis or
display by the single analyzer channel as
required.
Single Analyzer, Dual Input, Physical Layer Measurement
OPTICAL
OPTICAL
AE AB LP2 IN2 LP1 IN1
AE AB LP2 IN2 LP1 IN1
The PHRXM-AE module provides the following connections:
The PHRXM-AE module allows 2 connected
SDI or Optical video signals to be present
continuously and selected for analysis or
display as required.
IN1 - LP1 [75 Ω BNC] Is an SD-SDI or HD-SDI signal, high impedance loop through
that allows the Rx instrument to analyse the connected input.
IN2 - LP2 [75 Ω BNC] Is a second SD-SDI or HD-SDI signal, high impedance loop
through that allows the Rx instrument to analyse the connected input.
OPTICAL Allows a Video Transceiver (SFP Optical) module to be installed.
Only single transmitter, single receiver modules that are compliant to
SMPTE 424M, SMPTE 292M, and SMPTE 259M are supported.
1–8 PHRX2000-200 2Descripon 08/12

Single Analyzer, Single Generator
Description
OPTICAL
OUT INOUTOUT
The PHRXM-AG module allows a single
connected SDI or Optical video signal to
AG ANAGEN
SDI
GEN
SDI
ANA
be monitored continuously and allows the
generation of a single SDI or Optical video
test signal.
The PHRXM-AG module provides the following connections:
SDI ANA IN [75 Ω BNC] Is an SD-SDI or HD-SDI signal, high impedance loop through
to “SDI ANA OUT” that allows the Rx instrument to analyse the connected
input.
SDI GEN OUT [75 Ω BNC] Are 2 identical SD-SDI or HD-SDI generator output that provide
a test signal generated by the PHRXM-AG module.
OPTICAL Allows a Video Transceiver (SFP Optical) module to be installed.
Only single transmitter, single receiver modules that are compliant to
SMPTE 424M, SMPTE 292M, and SMPTE 259M are supported.
GEN - provides a test signal generated by the PHRXM-AG module.
ANA - allows the Rx instrument to analyse the connected input.
Single Analyzer, Single Generator, Physical Layer Measurement
AGE ANAGEN
OPTICAL
SDI
GEN
OUT INOUTOUT
SDI
ANA
The PHRXM-AGE module allows a single
connected SDI or Optical video signal to
be monitored continuously and allows the
generation of a single SDI or Optical video
test signal.
SDI ANA IN [75 Ω BNC] Is an SD-SDI or HD-SDI signal, high impedance loop through
to “SDI ANA OUT” that allows the Rx instrument to analyse the connected
input.
SDI GEN OUT [75 Ω BNC] Are 2 identical SD-SDI or HD-SDI generator output that provide
a test signal generated by the PHRXM-AG module.
OPTICAL Allows a Video Transceiver (SFP Optical) module to be installed.
Only single transmitter, single reciever modules that are compliant to
SMPTE 424M, SMPTE 292M, and SMPTE 259M are supported.
GEN - provides a test signal generated by the PHRXM-AG module.
ANA - allows the Rx instrument to analyse the connected input.
PHABRIX Rx Operaon Manual 1–9PHRX2000-200 2

Description
Dual Output Generator Module
OPTICAL
GG GEN-AGEN-B
GG GEN-AGEN-B
OPTICAL
SDI
SDI
GEN-B
GEN-B
OUT OUTOUTOUT
OUT OUTOUTOUT
SDI
SDI
GEN-A
GEN-A
The PHRXM-GG module allows the
generation of a two independent SDI or
Optical video test signals with the same
video format, colour space and frame rate
for Dual link use.
SDI GEN-A OUT [75 Ω BNC] Are 2 identical SD-SDI or HD-SDI generator output that provide
a test signal generated by the PHRXM-GG module.
SDI GEN-B OUT [75 Ω BNC] Are 2 identical SD-SDI or HD-SDI generator output that provide
a test signal generated by the PHRXM-GG module.
OPTICAL Allows a Video Transceiver (SFP Optical) module to be installed.
Only a dual transmitter modules that is compliant to SMPTE 424M, SMPTE
292M, and SMPTE 259M are supported.
GEN-A - provides a test signal generated by the PHRXM-GG module.
GEN-B - provides a test signal generated by the PHRXM-GG module.
1–10 PHRX2000-200 2Descripon 08/12

Rx Software Options
Overview
The Rx range has a range of software options that can enhance the Rx functionality for specific
applications.
3G-SDI and advanced formats upgrade for Rx chassis
This option (PHRXO-3G) provides advanced
formats include 4:2:2 YUV, 4:4:4 RGB and
4:4:4 YUV at 10/12 bit and 3G level A and
B. For broadcast manufacturers this option
allows rigorous testing of many more
formats beyond the standard signals used
in traditional broadcasting.
Among the support for 3G level B is the ability to analyse signals such as SMPTE 425-B
carrying 1 x SMPTE 372M Dual-Link payload. Generation of these signals is activated if the
generator is present.
HD/SD-SDI Data Analyzer and Ancillary Packet analyzer
Description
The SDI analysis option (PHSXO-SD)
provides the engineer with a detailed view
of the data words contained within the
SDI stream. This allows the analysis of
complex faults and is particularly useful
when determining compatibility issues
between equipment and when debugging
new product developments particularly in a
R&D environment.
Detail within the active SDI stream can be viewed with continuous update.
The SDI Analysis option provides the following functional areas:
Grid displays the SDI data in the form of an array.
Stream allows the SDI continuous data stream to be viewed.
Component allows the video components to be displayed in separate columns.
Splt allows the video components to be display individually.
Ancillary Data allows the user to capture whole Ancillary data packets identified by their
data id (DID).
Ancillary Status allows additional ‘user defined’ selections with the appropriate DID or SDID
code.
Access to the SDI analysis functionality is via the Analyzer - Signal Data menu. See the
“Analyzer - Signal Data” section in chapter 2 for full details.
PHABRIX Rx Operaon Manual 1–11PHRX2000-200 2

Description
Dolby - E analysis
Dual analyzer for SDI input modules
The chassis option (PHBXO-AA) provides an additional separate analyzer to the standard single
analyzer board. This allows simultaneous instrumentation for dual SDI input modules. This
applies to the PHRXM-AG and PHRXM-AGE modules.
Advanced physical layer analysis
The Dolby-E analysis option (PHBRO-BDA)
displays meta data present in a selected
audio stream and determines whether
the Dolby-E packet is timed correctly on
the SDI video stream. The Dolby-E may
be monitored from any of the SDI input
embedded audio channel pairs or the AES
input. Peak audio levels metering is also
displayed.
The analysis option (PHRXO-EA) for the
PHABRIX Rx range adds an additional
jitter screen, plus enhancements to the eye
display. The extra features added to the
eye and jitter module are focussed toward
broadcast manufacturers who have a need
for high end analysis tools. Histograms,
decade filters, multiple eye display, full
screen jitter display and alignment and
timing thermometers are all available with
comprehensive logging.
The Advanced physical layer analysis option provides the following functional areas:
Multi eye display enables analysis when serialiser jitter is present: Products process video in
either a 10 or 20 bit parallel data domain which is subsequently transmitted
as a single bit serial data stream. By triggering every 10 or 20 eyes you
can reveal repetitive parallel/serial clock domain jitter in equipment being
analysed.
Histograms give statistical information which can be used to accurately measure rise
time, fall time and amplitude. These automatic accurate measurements can
then be logged for extended periods of time. Measurements like rise time
and fall time are notoriously difficult to make with SDI signals.
In addition to the standard timing and alignment jitter filters, decade filters
are provided allowing an engineer to analyse the frequency content of any
jitter present. The number of eyes displayed is adjustable from one eye up
to one frame of eyes.
Decade filters are provided allowing an engineer to analyse the frequency content of any
jitter present. The number of eyes displayed is adjustable from one eye up
to one frame of eyes.
Jitter display the separate full screen jitter analysis display incorporated into the
advanced option enables the engineer to analyse the nature of jitter present
using a graph of jitter versus time. Again, the decade filters are present and
the time base can be adjusted from 1 line through to 1 frame. By analysing
jitter in this detailed way an engineer can determine if a signal is in or out of
specification and also get a feel for where any problems lie.
1–12 PHRX2000-200 2Descripon 08/12

Front Panel Control
Rx2000
Turning on and off the instrument
To turn on your PHABRIX Rx2000 press the red button at the top right hand corner of the front
panel.
Description
Volume
Confidence Display
Input Selection Buttons Menu Selection Buttons
Once the system has started, pressing the button again will turn it off. If for some reason the
instrument stops responding, pressing and holding the button for a few seconds will turn it off.
Power
Navigation
Buttons
Main Menu
The Main menu, displayed on the right-hand OLED screen gives access to the software
modules available on the Rx2000 instrument.
The buttons beneath the screen correspond to the menu areas. Pressing on any of these
buttons will display the corresponding menu.
See chapter 2 : “Menu Reference for full details of these menus.
PHABRIX Rx Operaon Manual 1–13PHRX2000-200 2

Description
Instrument Status
The top line of the menus shows the instrument status and includes the Input Video status,
Genlock status and current time.
A red “Log” is shown on the status line if there are any events in the event log.
If a 3G video standard is selected the video standard display will be shown as 3GA if it is a
3G-Level A standard, 3GB if it is a 3G-Level B dual link standard, 3G2 if it is a 3G-level B dual
stream (two patterns) standard or DL if it is a dual link output.
The input video standard will be shown in red if the input signal has errors, but only if the
analyzer is connected to the input. If the analyzer is set to monitor the output, the input
standard will be shown in brown.
The output standard will be shown in red if the instrument is generating errors. The output
standard will show OFF if the generator output is Off.
The Jitter values will be shown in red if the jitter values are greater than the values specified on
the Log Setup page for the relevant jitter meter.
Using the Menus
The Menu buttons select which instrument is in use as well as selecting the options for the
instrument. The bottom of the LCD display shows the function of each Menu button.
When in a specific function eg Generator, Analyzer etc, the cursor controls () on the
right hand of the instrument select a field to edit. The current field has a red box around it.
Pressing the OK button starts or ends editing of that field. Check boxes are always in edit mode
and pressing the OK button inverts the current state.
When editing some types of fields, the menu buttons at the bottom take on different
functionality to allow cancelling edit mode or setting the value for the field. When lists of
options are displayed the menu buttons allow selection of the first/last item in the list as well
as paging through the available options. If the list of items is small, the available items may be
displayed on the menu buttons for instant access.
The buttons along the bottom of the LCD display change the currently displayed page when
not editing a data field. The left hand button always selects the top level menu and system
overview page. So for example pressing the first button will select the “Main Menu”, selecting
the second button will select the “Generator” menu, etc.
The Main menu is the top level menu from which all other menus are selected on the Rx2000
instrument. The main menus are:
Generator (only present if a Generator module is fitted) allows video test pattern
selection to be made and audio test tones to be selected.
Analyzer allows the selected input signal to be analysed in the form of a Picture,
Waveform monitor, Vectorscope and Eye Pattern display (option).
Sig Info allows detailed signal information about the video and audio status for the
analyzer source to be displayed.
Audio gives access to the Audio Meters and Audio Status displays.
System allows the setup of system wide settings including memories, date/time and
software.
Logging selects the logging page to view and setup the error logging system.
Speaker selects the speaker/headphone setup page.
1–14 PHRX2000-200 2Descripon 08/12

Multiple Analyzers
Only Analyzer 1 (ie the first analyzer channel found in the first occupied Module slot) is used
for the Front Panel Instrument display. Selecting the video input source (“SDI1a”, “FIB1a”,
“SDI1b”, “FIB1b”, etc) will also affect the Monitor output display.
Description
SDI1a FIB1a
SDI1b FIB1b
Analyser 1
SDI1b SDI1b SDI1b
XA : 1 SDI1
Picture
Line
21
Sample
0
Fld 1
Blue
XA : 1 SDI1
Waveform
Setup
Line
21
Sample
0
Fld 1
YCbCr
SDI2a FIB2a SDI2b FIB2b SDI3a FIB3a SDI3b FIB3b
Analyser 3
Vectorscope
Analyser 2
XA : 1 SDI1
Line
21
All
Fld 1
Zoom
x1
100%
SDI4a FIB4a
Analyser 4
SDI4b FIB4b
All of the different Instrument displays (Picture, Waveform Monitor, Vectorscope, etc) will use
Analyzer 1. The front panel buttons will just switch the instrument being displayed.
PHABRIX Rx Operaon Manual 1–15PHRX2000-200 2

Description
Rx1000 & Rx500
Turning on and off the instrument
To turn on your PHABRIX Rx1000 or Rx500 instrument, press the button at the top right hand
corner of the front panel.
Once the system has started, pressing the button again will turn it off. If for some reason the
instrument stops responding, pressing and holding the button for a few seconds will turn it off.
Navigation
The left and right cursor buttons can be used to move through the main menus. The currently
selected menu being the one in the centre of the display between the left and right arrow
symbols.
Presets allows pre-defined system pre sets to loaded. The buttons below the
LED screen can be used to select the presets (for example “Memory 1”,
“Memory 2”, etc) currently stored on the Rx instrument.
See the “Monitor Output” section for details about to create presets.
Inputs allows the video signals connected to the Rx instrument to be selected
for analysis. The buttons below the LED screen can be used to select the
inputs such as “SDI1a”, “SDI1b”, “SDI2a”, “FIB2a”, etc. The options that are
displayed here depend on the number and type of Rx modules that are
installed.
DHCP Mode allows the network Dynamic Host Configuration Protocol mode on the Rx
instrument to be turned on or off using the OK button. Note that if DHCP is
turned on, then the Rx instrument will automatically attempt to obtain an
IP address for the instrument from you organisation’s DHCP server. If DHCP
is turned off, then the instruments IP address, subnet mask and gateway
details will have to be entered manually.
Network Name displays the host name given to the Rx instrument, ie “PhabrixRx”.
IP Address allows the IP address for the Rx instrument to be viewed and setup. Note
that if DHCP mode is turned on, then the IP address will be populated
automatically. To enter or change the IP address:
Press the OK button to select the first number bank.
Use the up and down cursor buttons to change the number or select any
of the buttons below the LED screen (-1, +1, -10, +10, -100, +100) to
increment the value accordingly.
Select the right-hand cursor button to move to the next number bank
Repeat this process until the required IP address has been entered.
Gateway allows the network gateway address to be setup.
Sub Net Mask allows the network Subnet mask address to be setup.
1–16 PHRX2000-200 2Descripon 08/12

DNS Server allows the address of your organisation’s DNS (Domain Name Service)
server to be entered.
SDI allows the SD-SDI format for the CPU generator output to be selected. The
buttons below the LED screen allow the SDI output to be turned on.
SDI Pattern allows the test pattern on the CPU generator output to be selected.
HDMI allows the HDMI monitor to be turned on or off.
Brightness allows the LED screen brightness to be setup. The up and down cursor
buttons can be used to change the value and the buttons below the LED
screen can be used to increment the value.
Screensaver allows the LED screen saver to be turned on or off and allows the wait time
to be setup. The up and down cursor buttons can be used to change the
value and the buttons below the LED screen can be used to increment the
value.
Sw Version displays the current version of software that is installed on the Rx1000 or
Rx500 instrument.
Remote Control allows the Rx remote control to be turned on or off.
The six buttons below the LED display control the selection of the options within the currently
selected menu.
Description
PHABRIX Rx Operaon Manual 1–17PHRX2000-200 2

Description
1–18 PHRX2000-200 2Descripon 08/12

Monitor Output
Overview
The Rx range of products provide a Monitor output in the form of an HDMI output that can
display up to 16 instrument windows at 1920 x 1080 resolution. This Monitor output display
can display the pre-sets selected by the “Pre-set Buttons” and can be controlled by a USB
mouse and keyboard connected to the Rx instrument.
Description
Note that on the Rx 500 and Rx 1000 instruments, the Monitor Output is always enabled. But
on the Rx 2000 instrument, however, the Monitor output can be enable/disabled in the “HDMI/
SDI Output” menu that is available from the Instrument Display on the front of the instrument.
When an HDMI or SDI monitor is connected to the Rx instrument, it will display an “Input
Status Bar” along the bottom of the screen that shows the currently connected inputs SDI1a,
SDI1b, SDI2a, etc dependent on the number and type of input module that is installed.
Display Area
The display area above the “Input Status Bar” can be used to display any of the instrument
panels that are available with the installed hardware modules and software options. The
instrument panels that are display can be selected from pre-configured, already saved and/or
New instrument panels (or windows) created by right-clicking using the mouse.
PHABRIX Rx Operaon Manual 1–19PHRX2000-200 2

Description
Picture
XA : 1 SDI1
Line
21
Sample
0
Fld 1
Blue
XA : 1 SDI1
Window Panel Types
The types of instrument panels that are available include:
New Picture
Note that black “A : 1” in the top left corner is used to select the Analyzer to use,
the black “SDI#” or “FIB#”in the top left corner is used to select the input that the
Analyzer is to monitor and the white X in the top right corner is used to close the
panel.
Selecting New Picture will
create a new Picture panel
for the selected input.
See the “Analyzer” - “Picture” section in chapter 2 for details
New Waveform
Waveform
Setup
Line
21
Sample
0
Fld 1
YCbCr
See the Analyzer - “Waveform Monitor” section in chapter 2 for details.
Selecting New Waveform
will create a new waveform
monitor panel for the
selected input.
1–20 PHRX2000-200 2Descripon 08/12

New Vectorscope
XA : 1 SDI1
Description
Vectorscope
Line
21
All
Fld 1
Zoom
x1
100%
See the “Analyzer” - “Vectorscope” section in chapter 2 or details
New Eye
Selecting New Vectorscope
will create a new waveform
monitor panel for the
selected input.
Selecting New Eye will
create a new Eye Pattern
monitor panel for the
selected input. This allows
the jitter of the selected
input video signal to be
monitored using an Eye
Pattern display.
See the Analyzer - “Eye and Jitter” section in chapter 2 for details.
New Jitter
See the “Analyzer” - “Jitter” section in chapter 2 for details.
Selecting New Jitter will
create a new Jitter monitor
panel for the selected
input. This allows the jitter
of the selected input video
signal to be monitored
against time.
PHABRIX Rx Operaon Manual 1–21PHRX2000-200 2

Description
New SDI Errors
See the “Sys Info” - “Video Status” in chapter 2 for details.
New Input Status
Selecting New SDI Errors
will display the EDH or
CRC status of the analyzer
input as appropriate for
the video standard being
monitored. The status of
each EDH/ CRC count is
displayed as the number
of seconds since an error
occurred.
Selecting New Input Status
will create a new panel
displaying the “Input Status
& SMPTE 352 Status for
the selected input.
See the “Sys Info” - “Misc Status” section in chapter 2 for details.
New Input Timing
See the “Sys Info” - “Video Timing” section in chapter 2 for details.
Selecting New Input Timing
will create a new panel
displaying the “Input
Timing” for the selected
input. The timing of SDI
input signals is displayed
relative to the external
reference. If no reference
is present then an error
message is displayed.
1–22 PHRX2000-200 2Descripon 08/12

New Data View
See the “Analyzer” - “Signal Data” section in chapter 2 for details.
New ANC Status
Description
Selecting New Data View
will create a new panel
displaying the data values
for the selected SDI input.
This page shows the video
signal as a data stream
in several formats as
described below. In each
mode, the data may be
displayed in hexadecimal,
decimal or binary formats.
Selecting New ANC Status
will create a new panel
displaying the Ancillary
Packet Status for the
selected SDI input. The
ANC status shows which
ANC packets are present
on the SDI input and
whether they have any
errors.
See the “Sys Info” - “ANC Status” section in chapter 2 for details.
New ANC Inspector
Selecting New ANC
Inspector will create a
new panel displaying the
chosen packet data (for
example RP165 – EDH,
S272 – SD Audio Group 1,
S272 – SD Audio Group
2, etc) for the selected SDI
input.
See the “Sys Info” -“Ancillary Inspector” section in chapter 2 for information.
PHABRIX Rx Operaon Manual 1–23PHRX2000-200 2

Description
New Audio Meters
See the “Audio” - “Audio Meters” section in chapter 2 for details.
New Audio Status
Selecting New Audio
Meters will create a new
panel displaying the audio
metering for the selected
audio input. This page
shows up to 16 audio
channels. The source for
each block of 8 meters
may be independently
set to allow simultaneous
metering of 8 inputs and 8
outputs or all 16 channels
in an embedded SDI
stream.
Selecting New Audio
Status will create a new
panel displaying the audio
metering for the selected
audio input. The Channel
Status for the selected
audio channel is displayed
in decoded form as well as
a hexadecimal dump of the
bytes.
See the “Audio” - “Audio Status” section in chapter 2 for details.
New Dolby Meta-data
See the “Audio” - “Dolby” section in chapter 2 for details.
Selecting New Dolby
Meta-data will create a
new panel displaying the
Dolby audio meta-data for
the selected SDI or optical
input. The Dolby-E status
option allows display of the
Dolby-E meta data present
in the selected audio
stream and determines
whether the Dolby-E
packet is timed correctly
on the SDI video stream.
1–24 PHRX2000-200 2Descripon 08/12

New Generator
See the “Generator” - “Video Out” section in chapter 2 for details.
New Generator Audio 1-4
Description
Selecting New Generator
will create a new Generator
panel for the selected
output. The instrument
can create video test
signals for all supported
SD and HD SDI output
standards including
the 3GHz standards at
1080p/50/59/60. It will
support Y,Cr,Cb formats as
well as RGB formats.
Selecting New Generator
Audio 1-4 will create a new
Generator Audio panel to
allow a test signal to be
setup for Audio Groups 1
and 2.
See the “Generator” - “Audio Group 1/2” section in chapter 2 for details.
New Generator Audio 5-8
Selecting New Generator
Audio 5-8 will create a new
Generator Audio panel to
allow a test signal to be
setup for Audio Groups 3
and 4.
See the “Generator” - “Audio Group 3/4” section in chapter 2 for details.
PHABRIX Rx Operaon Manual 1–25PHRX2000-200 2

Description
New Generator Reference
See the “Generator” - “Gen Lock” section in chapter 2 for details.
New Event Log
Selecting New Generator
Reference will create a
new Generator Reference
panel to allow the Audio
reference mode to be
setup.
Selecting New Event Log
will create a new panel
displaying the log results
for any events (that have
been set up to be tracked
using the Log setup) that
have occurred.
See the “logging“-”Event” section in chapter 2 for details.
New Log setup
See the “logging“-”Log Setup” section in chapter 2 for details.
Selecting New Log Setup
will create a new panel
allowing specific events
to be tracked and then
recorded in the Event Log.
1–26 PHRX2000-200 2Descripon 08/12

New Eye Log setup
See the “logging“-”Eye Log Setup” section in chapter 2 for details.
New ANC Log setup
Description
Selecting New Eye Log
Setup will create a new
panel allowing logging
of Eye/Jitter to be setup
for inputs that are using
compatible Modules.
Selecting New ANC Log
Setup will create a new
panel allowing the logging
of ANC errors to setup.
See the “logging“-”ANC Log Setup” section in chapter 2 for details.
Network Setup
See the System - Network section in chapter 2 for details.
Selecting Network Setup
will open the “System” “Network” menu in a new
window to allow you to
set up the instrument’s
network connection. Note
also that thus menu can
also be displayed by
clicking on the IP address
displayed in the bottom
right of the Monitor Output
display.
PHABRIX Rx Operaon Manual 1–27PHRX2000-200 2

Description
System Info
See the System - Misc section in chapter 2 for details.
Engineer Setup
Selecting System Info
will display the system
software status and
options that are installed.
Note also that this menu
can also be displayed by
clicking on the software
version displayed in
the bottom right of the
Monitor Output display.
Selecting Engineer Setup
will open a copy of the
“System” - “Engineer”
menu in a new window.
This can then be used to
clear memories and reset
system settings back to
their default.
See the “System”-”Engineer” section in chapter 2 for details.
Date/Time Setup
See the “System”-”Misc” section in chapter 2 for details.
Selecting Date/Time Setup
will open the “Date/Time
Setup” menu in a new
window. This can then be
used to set the date and
time of the Rx instrument.
Note also that this menu
can also be displayed
by clicking on the date
displayed in the bottom
right of the Monitor Output
display.
1–28 PHRX2000-200 2Descripon 08/12

HDMI/CPU SDI Setup
System Status
Description
Selecting HDMI/CPU SDI
Setup will create a new
panel displaying the HDMI
/ SDI setup menu. This
controls the use of the SDI
output on the CPU board
and allows the built-in
generator to be used.
Selecting System Status
will open a copy of the
“Board Status” menu in
a new window. This can
then be used to inspect
which Modules have
been installed in the Rx
instrument.
See the “System”-”Utils” section in chapter 2 for details.
Setup Login
See the “System”-”Engineer” section in chapter 2 for details.
Selecting Setup Login will
open a copy of the “Set
User Login Information”
menu in a new window.
This can be used to
manage user access to the
Rx instrument.
PHABRIX Rx Operaon Manual 1–29PHRX2000-200 2

Description
Managing the Monitor Output
Closing Open Panels (Windows)
Any open panels can be closed using the “X” button in the top right corner of each panel. The
currently selected panel (the one with the blue bar) can be closed by right-clicking the mouse in
the display area above the “Input Status Bar” and selecting the “Close Window”. The “Close ALL
Windows” function will remove all of the instrument panels from the display area.
The functions within each Instrument panel on the Monitor Output display can be selected
using the mouse rather than the “Navigation Buttons” used with the front panel Instrument
Display.
Working with Multiple Analyzers
The analyzer channel that is required for the instrument panels can be chosen from the dropdown list in the top corner of the panel (“A : 1”, “A : 2”, “A ; 3” etc) and the input to be analyzed
can also be selected from a drop-down list (“SDI1a”,”FIB1a”, ”SDI1b”, “FIB1b”, “SDI2a”, etc).
These 2 values control a cross-point matrix that routes the selected input to the selected
analyzer as shown below:
SDI1a FIB1a
SDI1b FIB1b
Analyser 1
XA : 1 SDI1
Picture
Line
21
Sample
0
Fld 1
Blue
SDI1a SDI1a
SDI2a FIB2a SDI2b FIB2b SDI3a FIB3a SDI3b FIB3b
Analyser 2
XA : 1 SDI1
Waveform
Setup
Line
21
Sample
0
Fld 1
YCbCr
XA : 1 SDI1
Vectorscope
Line
21
All
Fld 1
Zoom
x1
100%
SDI1a
Analyser 3
Picture
FIB2b FIB2b
XA : 1 SDI1
Line
21
Sample
0
Fld 1
Blue
SDI4a FIB4a
Waveform
Setup
Line
21
Sample
0
Fld 1
YCbCr
XA : 1 SDI1
Analyser 4
Vectorscope
FIB2b
SDI4b FIB4b
XA : 1 SDI1
Line
21
All
Fld 1
Zoom
x1
100%
Note that Analyzer 1 is used by the Front Panel on the Rx2000 instrument so
if the input to analyzer 1 is changed on the Front Panel it will also change the
Monitor output.
Note that changing an input that has already be assigned to an analyzer will reassigned the input to all of the instrument panels that share the same analyzer.
Note also that an input can only be monitored by one analyzer channel at a time.
1–30 PHRX2000-200 2Descripon 08/12

Working with Multiple Generators
When the Rx instrument contains multiple Generator modules, the generator to be controlled
can be selected from the drop-down list in the corner of the panel (GEN1, GEN2, etc). Note
that the PHRXM-GG module has 2 outputs (GEN-A and GEN-B) but this is treated as a single
Generator as the outputs are locked together.
Saving Monitor Display Layouts
Elements of the currently displayed Instrument Panels can be saved as pre-sets using the
“Save” button in the “Pre-sets” section of “Input Status Bar”.
The “System Presets” panel then allows “HDMI Layout” check box to be chosen, a name given
to the preset before it is saved. Stored presets can then be recalled at a later time.
See the “Presets” section for details.
Description
PHABRIX Rx Operaon Manual 1–31PHRX2000-200 2

Description
1–32 PHRX2000-200 2Descripon 08/12

Browser Control
Overview
The Rx instrument can be controlled via a web browser that accesses the built-in web server. To
connect to the Rx instrument, find out the IP address (displayed in the bottom right corner of
the Monitor output and in the System - Network menu from the front panel) and Enter it into
the web browser.
Description
Browser operation has been tested using Firefox, Opera, Safari, Chrome and Internet Explorer
but should work with any browser which allows JavaScript.
Clicking on the buttons works exactly like the instrument that you are connected to (note that
auto-repeat doesn’t work due to browser speed limitations). The LCD screen on the browser
image is updated every 10 seconds but may be refreshed manually by clicking the LCD area on
the browser.
The “Log” link on the right hand side may be selected to fetch the current Event Log from the
Rx instrument.
The “Status” link on the right hand side may be selected to fetch the current instrument status
in XML format. It can be saved to a local PC for further processing. The control IDs displayed in
the XML file are determined by the file “/mnt/mmc/xmlformat.ini” which may be edited by the
user although note that it should be backed up as it will be over-written when software updates
take place.
The “Downloads” link displays a further page allowing screen dumps and report files (Command
script option) to be viewed.
PHABRIX Rx Operaon Manual 1–33PHRX2000-200 2

Description
Using the Menus
The Menu buttons select which instrument is in use as well as selecting the options for the
instrument. The bottom of the LCD display shows the function of each Menu button.
When in a specific function eg Generator, Analyzer etc, the cursor controls () on the
right hand of the instrument select a field to edit. The current field has a red box around it.
Pressing the OK button starts or ends editing of that field. Check boxes are always in edit mode
and pressing the OK button inverts the current state.
When editing some types of fields, the menu buttons at the bottom take on different
functionality to allow cancelling edit mode or setting the value for the field. When lists of
options are displayed the menu buttons allow selection of the first/last item in the list as well
as paging through the available options. If the list of items is small, the available items may be
displayed on the menu buttons for instant access.
The buttons along the bottom of the LCD display change the currently displayed page when
not editing a data field. The left hand button always selects the top level menu and system
overview page. So for example pressing the first button will select the “Main Menu”, selecting
the second button will select the “Generator” menu, etc.
The Main menu is the top level menu from which all other menus are selected on the Rx2000
instrument. The main menus are:
Generator (only present if a Generator module is fitted) allows video test pattern
selection to be made and audio test tones to be selected.
Analyzer allows the selected input signal to be analysed in the form of a Picture,
Waveform monitor, Vectorscope and Eye Pattern display (option).
Sig Info allows detailed signal information about the video and audio status for the
analyzer source to be displayed.
Audio gives access to the Audio Meters and Audio Status displays.
System allows the setup of system wide settings including memories, date/time and
software.
Logging selects the logging page to view and setup the error logging system.
Speaker selects the speaker/headphone setup page.
See chapter 2 for full details of each of the menus.
1–34 PHRX2000-200 2Descripon 08/12

PHABRIX
®
®
broadcast excellence
2
Menu Reference
PHRX2000-200 2
PHABRIX Rx Operation Manual
2–1

Menu Reference
2–2 PHRX2000-200 2Menu Reference 08/12

Generator Menu
Video Out
The Rx instrument can
create video test signals
for all supported SD
and HD SDI output
standards including
the 3GHz standards at
1080p/50/59/60. It will
support Y,Cr,Cb formats as
well as RGB formats.
Output On
The Output On function turns ON the output circuitry. On Rx instruments that have dual
generator modules, there is the option to turn on output 1 and output 2 which correspond to
the 2 generator outputs.
Menu Reference
Standard
The menus in the Standard section are used to select the desire video output format. The topleft box selects the basic mode of the Rx instrument and determines whether it is generating
normal SD/HD vide or 3G level A or level B video. Dual streams refer to the ability of the Rx
instrument to generate two separate pictures when transmitting 3G-level B in some formats.
Which mode is selected determines which formats are available.
Only valid frame rates for the output standard may be selected.
Colour Format
Currently only YCbCr 4:2:2 10 bit picture formats are supported by the standard product but
an Option may be purchased to enable other colour formats. The following colour modes may
be selected dependent on line standard selected:
YCbCr 422 10bit
YCbCr 444 12bit
YCbCr 444 10bit
YCbCrA 4444 10bit
YCbCr 422 12bit
RGB 444 10bit
RGBA 4444 10bit
RGB 444 12bit
PHABRIX Rx Operation Manual 2–3PHRX2000-200 2

Menu Reference
Pattern
This selects the video pattern that is output by the generator. Many standard patterns
are provided by the Rx instrument. You may also upload your own test patterns to the Rx
instrument into the ‘Patterns’ directory and then select them using the ‘User File’ option in
this field. See the ‘File Structure - Patterns’ section for file formats supported. If a ‘User File’
has been selected, the ‘i’ button beside the file can be selected to get information on the file
properties. Unsupported file types will be displayed as a black image. If the video standard is
changed while a user file is loaded and there is no file for the new standard present, a black
image will be loaded and the User File blanked.
The Check field/Pathological/PLL Check/EQ Check patterns will only look like the picture above
when a YCbCr 422 10 bit colour mode is selected. Other colour modes will have different
pictures but still create the SDI data stream required by SMPTE.
A bouncing Box may be overlaid on the current test pattern by selecting the Box checkbox
field.
If Check field/Pathological is selected when a dual stream format has been
selected, BOTH outputs will be forced to check field due to internal hardware
limitations. If another pattern is selected, the Check field pattern will be deselected. The exceptions to this are when Colour Field or Zone Plate are selected
as test patterns.
100% Bars
Check-field
Pathological
Legal Ramp
Bowtie
Grey Bars - 11
Black, Red, Green,
Blue, Yellow, Cyan,
Magenta, White,
Custom
Colour Field
75% Bars
EQ Test
Valid Ramps
Tartan Bars
Grey Bars – 11 vertical
Downloadable files
in bitmap(.bmp),
10bit DPX/YUV (.dpx,
.yuv), Targa (.tga) and
Phabrix .pat/.rgb/.yc4
compressed files
User File
75% Bars + Red
PLL Test
Multi-Burst
Grey Bars - 5
SMPTE 219/ARIB-28
Bars – 3 variants
SMPTE Bars
Luma Ramp
Pluge
Grey Bars – 5 -vertical
Zone plate
2–4 PHRX2000-200 2Menu Reference 08/12

Colour Field If colour field is the selected test pattern, another control selects which
colour to generate. Three user definable custom colours may be defined
using the “->” button. Custom colours are edited using the Red-Green-Blue
sliders. When setting the colour using the RGB sliders, the YCbCr values will
show the values for the current colour space. When setting the colour using
the YCbCr sliders, the RGB values will show the values for the current colour
space.
Zone Plate A basic zone plate generator is supplied with all Rx instruments. The zone
plate selector will contain 3 user customisable zone plates as well as several
pre-determined zone plates. The ‘->’ button displays a dialogue which allow
the parameters of the zone plate to be adjusted for the custom zone plates.
Any of the preset zone plates may be copied to the custom zone plates to
act as a starting point for a new zone plate. As the zone plate settings are
stored in user memories a large number of custom zone plates are available
for use.
Moving Zone-2H - A moving zone plate centred on the screen.
Static Zone-2H - A static zone plate centred on the screen from DC to the
nyquist frequency at left/right edges.
Static Zone-2V - A static zone plate centred on the screen from DC to the
nyquist frequency at top/bottom edges.
Sweep-Horiz - A horizontal sweep from DC to nyquist frequency horizontally.
Menu Reference
Sweep-Vert - A vertical sweep from DC vertically.
Grating-50kHz - A 50kHz frequency sine wave when using an HD output.
Grating-1MHz@HD - A 1MHz frequency sine wave when using an HD
output.
Grating-5MHz@HD - A 5MHz frequency sine wave when using an HD output
Custom This allows editing of Custom zone plate settings. Three custom zone plates
can be set up and can be copied from an existing presets using the ‘Copy
To’ button.
Mode - sets which type of Zone Plate is being produced. It may be Zone
Plate (circular pattern) Grating (Linear horizontal or vertical grid) Sweep
(Frequency sweeps from start to end Frequency)
Start Phase - sets the start phase of the sine wave generated by the zone
plate generator and is set in degrees from 0-360
Phase Rate - is used to set the rate of change of phase of the sine wave
and thus changes the speed that the zone plate moves at. It is specified in
degrees per frame.
Angle - changes the angle of the zone plate and thus can change a
horizontal sweep into a vertical sweep or rotate an elliptical zone plate
pattern.
PHABRIX Rx Operation Manual 2–5PHRX2000-200 2

Menu Reference
EDH
If the output signal is SD (PAL-625 or NTSC-525) the insertion of EDH information may be
turned on or off.
Errors
This field enables the insertion of CRC or EDH errors into the video signal. This allows checking
of third party error detection circuitry. In SD there is one EDH ancillary packet per field. When
errors are being inserted every EDH value gets deliberately corrupted. This creates one error
count per field. (Actually one AP error and one FF error). In HD there is a CRC value calculated
for each line. When errors are being inserted the CRC value on line number 1 gets deliberately
corrupted. This creates one CRC error count per frame. There is also the option to generate
CRC errors (not SD EDH errors) on only the switching line in field 1 which can be used to check
that any downstream equipment ignores errors on switching lines.
SMPTE 352
This checkbox allows the SMPTE 352 Payload ID field to be inserted into the video output
stream. The state of this checkbox is stored separately for SD, HD and HD-3G line standards.
Note that for HD-3G line standards the Payload ID should be turned ON.
XScale/Start Freq - sets the horizontal scale of grating patterns or the start
value of the zone plate sweep frequency.
YScale/End Freq - sets the vertical scale of grating patterns or the end value
of the zone plate sweep frequency.
Ident
An picture or text ‘Ident’ may be set to identify an SDI source. This Ident can be turned on/off
from this page but changing the text/font/bitmap is performed by selecting the Edit button to
bring up the Ident Dialog. An overview of what the Ident is can be seen beside the Edit button.
Note: If zone plate or colour field are selected, text cannot be overlaid over them.
A smaller version of the video output signal is displayed on this page with any overlaid ident.
This dialogue allows selection of either a user defined
bitmap picture which has been downloaded into the
‘Idents’ directory of the Rx instrument or user defined
text.
For both types, the position of the ident can be set to one of Top-Left, Top-Centre, Top-Right,
Left-Centre, Centre-Screen, Right Centre, Bottom-Left, Bottom-Centre, Bottom-Right. When text
ident is used, the font, font size and colour can be specified. Several fonts are built in to the Rx
instrument, other true-type (.ttf) fonts may be downloaded as required.
2–6 PHRX2000-200 2Menu Reference 08/12

When editing text,
the keyboard above is
displayed to allow easy
editing. Move the cursor
to select the key to ‘press’
and then press ‘Ok’ to
‘press’ it. The Shift menu
key causes the next
keyboard to change to
shift mode for the next key
press.
The Caps Lock menu key locks the keyboard in all capitals mode. The Alt Gr. key shows any
language dependent alternate keys that may be pressed. Several country keyboard styles are
provided. Note that not all fonts support all non-English characters.
Genlock Menu
The Rx instrument can
create video test signals
that are either free-running
or locked to a studio
reference signal.
Menu Reference
The Genlock menu is
used to select an external
locking reference or set the
instrument to free run.
Source
The generator may be locked to an input reference which may be either the reference input
which is a Bi-Level/Tri-Level sync or may be locked to the video input. Alternatively, the
generator may free run.
PHABRIX Rx Operation Manual 2–7PHRX2000-200 2

Menu Reference
Audio Group Menu
Group n
Each of the four groups may be separately enabled. When enabled, the source and level of
each channel in a pair can be selected.
Source
The source for each channel may be Silence, Fixed tone (a range of fixed frequencies), variable
tone (where the frequency can be set on 1Hz steps from 1Hz to 23.99kHz), white noise. The
AES input may also be selected if present. If the Dolby Generation option has been purchased,
the source may be set to ‘Dolby’ at which time the other channel in the audio pair is also set to
‘Dolby’ and gain control disabled.
The Rx instrument can
embed an audio signal on
all 16 embedded audio
outputs.
The Audio Group menu
controls which audio
channels, pairs or groups
have test tones applied
and the type of tone.
Inv
This check-box phase-inverts the audio signal to allow checking of third-party audio mixing.
Link
This links the left and right channels of a pair so that changing the level on the left hand
channel changes the level on the right hand channel.
Master
The master level sets the 0dB level for all the embedded audio channels. Thus if the Master
level is set to -18dB and group 1 pair 1 output is set to -2dB, the actual level output on that
pair is -20dB. This feature allows all embedded outputs to be adjusted together as well as
giving a simple method to change from -18dB to -20dB based standard levels. The Master level
will not adjust the level of an AES input signal selected for embedding on SDI output.
AES O/P
The AES o/p control selects the source for the AES output of the Rx instrument and can be:
The AES input (via the built-in sample rate converter) to allow easy conversion to 48kHz
sample rate AES signals.
A mirrored output of the specified embedded AES stream contained within the SDI
output to allow easy generation of audio tones or white noise.
One of the embedded input pairs on the SDI input to allow use as a de-embedder.
Off, if the output is not required.
Note that the AES output is always at a 48kHz sample rate. The AES input may be at any
sample rate from 32kHz to 192kHz.
2–8 PHRX2000-200 2Menu Reference 08/12

Dolby
The Rx instrument Dolby
software option allows
generation of Dolby-E
pre-encoded test signals
to check that they are
transferred transparently
through the broadcast
chain unaffected by
routers/switchers, satellite
links, etc.
The Dolby menu controls
the generation of Dolby
test data.
Note that with this software version Non-Keyed signals are generated which may
be incompatible with certain VTRs.
Overview
There are a number of Dolby broadcast digital audio standards that transport audio data over
an SMPTE 337M AES carrier with a 48kHz sample rate:
Menu Reference
Dolby Digital
Dolby Digital Plus
Dolby E
These standards can be used to transport mono, stereo, 5.1 and 7.1 audio programmes:
Dolby 5.1 - involves five channels for normal-range speakers (20 Hz – 20,000 Hz) (right
front, centre, left front, rear right, rear left) and one channel (20 Hz – 120 Hz allotted
audio) for the subwoofer driven low-frequency effects.
Dolby 7.1 uses six channels in the primary program (Independent Substream) for a
standard 5.1 surround sound mix and then the 2 remaining 2 channels in an ancillary
programme (Dependent Substream) to provide the additional down-mix.
Dolby E
Dolby E is an audio encoding and decoding technology developed by Dolby Laboratories that
allows up to 8 channels of audio (mono, stereo, 5.1 or 7.1) that for a primary programme
(Programme 1) and optional ancillary programs. These 8 channels are compressed (lossless)
into a digital stream that can be transferred between compatible devices and stored on a
standard stereo pair of audio tracks. The most elaborate mode in common use is Dolby 7.1
which uses all eight channels to provide surround sound.
PHABRIX Rx Operation Manual 2–9PHRX2000-200 2

Menu Reference
Dolby Synchronisation - Generator Reference
The Dolby audio test signal produced by the Rx instrument is affected by the use of a reference
signal connected to the Rx instrument and by the following settings:
Free Run - If the generator is not locked to reference, the Dolby signal will be generated
synchronous to the generator. If the generator is running at a fast progressive rate (50-60
fps) it will generate packets on every other frame.
External Reference/Ext SDI reference - If the generator is locked to an external signal, the
reference signal MUST be of an appropriate standard. See the table below for examples.
Video Output
Format
1080i50 1080i50, 625i50(PAL)
1080i59 1080i59, 525i59(NTSC)
1080p25 1080p25, 1080i50, 625i50(PAL)
1080p29 1080p29, 1080i59, 525i59(NTSC)
720p50 1080p25, 720p25, 1080i50, 625i50(PAL) – due to length of
720p59 1080p29, 720p29, 1080i59, 525i59(NTSC) – due to length of
1080p50 1080p25, 720p25, 1080i50, 625i50(PAL) – due to length of
1080p59 1080p29, 720p29, 1080i59, 525i59(NTSC) – due to length of
Valid Reference Formats
packet being over 1 frame long
packet being over 1 frame long
packetbeing over 1 frame long
packet being over 1 frame long
Editing Program Information
Stream type: Only Dolby-E streams can be generated with this software version.
Config, Bit Depth: The program configuration and Bit Depth can be changed to load the pre-
encoded file.
Stream contents: The tones generated are of a fixed predefined frequency. Four sets of pre-
encoded streams are provided:
Ramp Var - Each channel has a different frequency to allow checking of
channels. The levels are ramped so that different channels have different
levels.
-3dB Fixed - All the tones are at -3dB co-phased/timed and are at the same
frequency.
-18dB Fixed - All the tones are at -3dB co-phased/timed and are at the
same frequency.
-20dB Fixed - All the tones are at -3dB co-phased/timed and are at the
same frequency.
Fixed Frequency values for “Fixed level“streams above:
Frame Rate Normal Frequency LFE Frequency
23.98 4.8kHz 211Hz
24 6kHz 240Hz
25/50 6kHz 240Hz
29.97/59.84 6kHz 133Hz
30/60 6kHz 240Hz
2–10 PHRX2000-200 2Menu Reference 08/12

Dolby-E start line: The start line can be used to set valid or invalid ranges to allow checking of
the Dolby-E guard band on downstream equipment. If the start line is set
outside the valid range specified by Dolby, the line number will be displayed
in RED.
Relative to Ideal If this check box is checked, the line number displayed is relative to the
Dolby specified ideal line. A value of ‘0’ therefore starts the Dolby-E packet
on the ‘Ideal Line’ for that video format.
Frame Rate This is set by default to the currently generated frame rate but may be
modified by the user to test downstream equipment.
Original rate This is set by default to the currently generated frame rate but may be
modified by the user to test downstream equipment.
Note that if generating a progressive fast rate video standard such as 720p50,
720p59 or 720p60 etc. the Dolby-E signal will always be generated at the related
slower rate. This is a Dolby restriction as the packets are over 1 frame in length for
these video formats.
Program Meta Data Editing
Many of the meta-data fields may be edited to test downstream equipment. The Channel
Mode field may be edited to invalid settings but they will be shown in RED to show that they
are invalid. The settings currently being edited are for the selected program but multiple
program meta-data values can be modified and the settings for all programs are stored in
memories.
Menu Reference
Meta-data changes and line changes will happen cleanly so that no corruption to the Dolby
signal will occur.
A maximum of 30 characters may be used for program description text. If the text is longer
than this, extra characters will be ignored.
The “Generator” – “Dolby” menu allows the metadata for a Dolby E data stream to be setup for
testing purposes. The main purpose of setting these metadata fields is to check that they are
transferred transparently through the broadcast chain unaffected by routers/switchers, satellite
links, etc. For any programme this metadata would be created as part of Dolby E authoring
process. Using the Dolby generator, the following metadata can be setup for Program 1:
Dialogue Norm is the normal audio level for dialogue. Ideally all transmitted programs
would have the same value.
BsMod (Bitstream Mode) indicates the type of audio service that the bitstream
contains. Complete Main (CM) is the normal mode of operation and
contains a complete audio program including dialog, music, and effects.
Ctr DnMix (centre down-mix) is a weighting value used in the encoding and decoding of
surround sound mixes for a Dolby 5.1 Independent Substream.
Sur DnMix (surround down-mix) is a weighting value used in the encoding and decoding
of surround sound mixes for a Dolby 5.1 Independent Substream.
LRoCtrDnMix (left/right/stereo/centre down-mix) is a weighting value used in the encoding
and decoding of surround sound mixes for a Dolby 7.1 Dependent
Substream.
LRoSurDnMix (left/right/stereo/surround down-mix) is a weighting value used in the
encoding and decoding of surround sound mixes for a Dolby 7.1 Dependent
Substream.
LR CtrDnMix (left/right/centre down-mix) is a weighting value used in the encoding and
decoding of surround sound mixes for a Dolby 5.1 Independent Substream.
PHABRIX Rx Operation Manual 2–11PHRX2000-200 2

Menu Reference
LR SurDnMix (left/right/surround down-mix) is a weighting value used in the encoding and
Chan Mode defines the channel configuration for Program 1 (ie mono, stereo, 5.1
Line Mode this is an Operational Mode / Dynamic Compression Mode that is used
RFMode this is an Operational Mode / Dynamic Compression Mode that is used
Room Type this informational parameter indicates the type and calibration of the mixing
MixLevel the Surround Down mix Level parameter indicates the nominal Lo/Ro down
DolbySurnd the Dolby Surround Mode parameter indicates whether or not a two-
decoding of surround sound mixes for a Dolby 5.1 Independent Substream.
channels).
by consumer and professional decoder products that simplifies the
implementation of Dialogue Normalization, Dynamic Range Control, and
down mixing functions, all of which are necessary in Dolby Digital products.
by consumer and professional decoder products that simplifies the
implementation of Dialogue Normalization, Dynamic Range Control, and
down mixing functions, all of which are necessary in Dolby Digital products.
room used for the final audio mixing session.
mix level of the Surround channel(s) with respect to the Left and Right
channels
channel Dolby Digital bitstream is conveying a Dolby Surround encoded
program.
DownMixMod this controls the Down Mix Mode which is used by the content creator to
optimize Center and Surround channel levels for use in stereo down mix
mode for any two-channel programmes.
D Sur Ex this controls the Dolby Surround Ex channel that provides an extra audio
channel for Dolby 5.1. The extra surround channel of the Dolby Surround Ex
system is matrix-encoded onto the discrete left-surround and right-surround
channels of the 5.1 mix.
The following control bits can also be set:
LFE the LFE Channel parameter enables or disables the Low-Frequency Effects
(LFE) channel.
HPF this parameter can be used to activate the DC High pass filter for all input
channels.
LPF the LFE Low pass Filter parameter can be used to activate a 120 Hz low-
pass filter applied to the LFE input channel.
Sur 3dB Alt the Surround Channel 3 dB Attenuation function is use to apply a 3 dB
attenuation to the Surround channels of a multichannel soundtrack created
in a room with film style calibration, when encoding it for consumer home
theater playback.
Sur Ph+Filter the Surround Channel 90-Degree Phase-Shift feature is used for generating
multichannel Dolby Digital bitstreams that can be down-mixed in an
external two channel decoder to create a true Dolby Surround compatible
output.
Org Stream the Original Bitstream informational parameter sets the value of a single bit
within the Dolby Digital bitstream. This bit has a value of 1 (box checked)
if the bitstream is an original. If it is a copy of an original bitstream, it has a
value of 0.
Copyright the Copyright Bit informational parameter sets the value of a single bit
within the Dolby Digital bitstream. If this bit has a value of 1 (box checked),
the information in the bitstream is indicated as protected by copyright. If it
has a value of 0, it is not copyright protected.
2–12 PHRX2000-200 2Menu Reference 08/12

RF 0v Prot the RF Over-modulation Protection parameter determines whether or not
an RF pre-emphasis filter is used in the overload protection algorithm to
prevent RF over-modulation in set-top box decoders.
Default Program Meta Data
Pressing the “Default” button will return program meta-data settings to their default values.
Embedding Dolby on SDI Stream
To embed Dolby signals on an SDI stream, the Audio source for that channel should be set
to ‘Dolby’. These source selections are found on the Generator – Audio Group 1,2,3,4 pages.
Selecting one channel of an audio pair to ‘Dolby’ will force the other channel in the pair to
select ‘Dolby’ also. As the Dolby streams are data, the volume and phase controls are disabled.
Changing a channel from Dolby to another source will cause the other channel in the pair to
select silence.
Embedding Dolby Signals on AES Stream
To embed Dolby signals on the AES output, the Audio source for the AES output should be
set to ‘Dolby’. This selection is found on the right hand side of the Generator – Audio Group
1,2,3,4 pages.
Menu Reference
PHABRIX Rx Operation Manual 2–13PHRX2000-200 2

Menu Reference
2–14 PHRX2000-200 2Menu Reference 08/12

Analyzer Menu
Overview
The RX instrument signal analyzer displays the selected video input or output signal. The
source for the analyzer is set by the field at the bottom right of the page. The current line and
sample are the same for all pages of the analyzer and therefore when selecting a sample on the
Signal Data page, the cursor will show where that is on the ‘Full Picture’ page.
The different types of analyzer can be displayed on the front panel of the Rx2000 instrument
and as window panels on the HDMI monitor output.
Menu Reference
PHABRIX Rx Operation Manual 2–15PHRX2000-200 2

Menu Reference
Picture
From the Rx2000 front panel, if the focus cursor is moved to the picture window and OK
pressed, the cursor may be used to scroll around the window. Press OK again to cancel this
mode. When in zoom mode, the cursor is always in the centre of the window and the picture
scrolls behind it. If the cursor is moved to an area of interest on the picture, the same area will
be visible on the SDI data option (if purchased).
If the picture window is focussed and current tab button is pressed again to enter full-screen
mode, the cursors may be moved by pressing the OK button again.
With Picture selected, the
video picture is displayed
in a window as a downconverted display. The
picture will automatically
view the horizontal or
vertical blanking areas if
the line or sample values
are in the blanking area.
Note that the normal cursor menu keys may be used but are not visible. Press OK
again to cancel cursor adjustment mode.
Line: Specify the current line for analysis.
Sample: Specify the current sample for analysis.
Field: (Only for interlaced formats) This control selects the field for analysis. If the
current line is in Field 1, changing the field will change to the same line in
field 2. The field number will change to show the correct field for the current
line number.
Blue: Show only the Blue aspect of the picture Blue.
Aspect Ratio: The aspect ratio of PAL (625 lines) may be set to be either 4:3 or 16:9 as
required for the source signal. NTSC (525) signals are always 4:3 aspect
ratio and HD signals are always 16:9.
Zoom: If not checked, the picture displayed is a down-converted picture to fill
the window or the full screen as requested. If checked, then a pixel on the
Rx2000’s LCD display will reflect a pixel in the video signal. In zoom mode,
no filtering is used.
ActPix: If checked, only active picture is displayed for picture view and waveform
monitor, all other VBI data such as TRS words ANC data and audio is
blanked.
Cursor: A cursor may be turned ON over the area of the picture specified by the
specified line and sample.
Source: The analyzer can view either the video SDI input or the Generator output so
that comparisons can be made between input and output.
2–16 PHRX2000-200 2Menu Reference 08/12

Signal Data
The Signal Data menu
shows the video signal as
a data stream in several
formats as described
below. In each mode, the
data may be displayed in
hexadecimal, decimal or
binary formats. The binary
format is not available in
grid mode. The data may
also be displayed as 10-bit
or 8-bit format.
To simplify scrolling around the SDI signal view, use the cursor keys to move the red focus
rectangle to the data display and press OK. The focus rectangle should change to a blue colour
and the cursor keys allow the display to be scrolled in any direction. The menu keys at the
bottom allow the Line/Sample to be adjusted by 10 or 100 in any direction.
Note that the line number of a line of video changes at the end of active video.
This gives the strange side effect that the line number for pixels in horizontal
blanking is the same as the line number for the active picture after that line.
Menu Reference
Type
Grid: In this mode the data is shown in an X-Y format with lines and samples at the same
time. Thus this is a representation of the picture but in data format. If the cursor
keys are used to select the grid window and ‘OK’ pressed, the cursor keys will
scroll around the window. The luma (Y) channel is shown in white whilst the Cr and
Cb channels are shown in with a red or blue tint respectively.
Strm: This is one of 3 modes for displaying the samples on the current line only. The
cursor keys may be used to scroll the sample number when ‘OK’ has been
pressed. The ‘info’ column shows the type of data being displayed.
AP - Active picture
VBL - Vertical blanking
HBL - Horizontal blanking
Comp: This is a similar to the Strm mode above but in a component mode with Cr and Cb
in different columns. See Strm mode above for the info column description.
Split: This mode shows the 2 streams split into 4 parts to show Y, Y’, Cr and Cb in
separate columns. See Strm mode above for the info column description.
Source
The analyzer can view either the video SDI input or the Generator output so that comparisons
can be made between input and output.
In1 Input 1
Out1 Output 1
Note that when in Colour modes other than YCbCr 422 10 bit, the pixel RGB or
YCbCr values are packed into 10 bit values across the different streams and thus
will give unfamiliar values. When the ‘UnPack’ check box is checked the values in
the active picture are unpacked to RGB or YCbCr values.
PHABRIX Rx Operation Manual 2–17PHRX2000-200 2

Menu Reference
Waveform Monitor
The streams may be in YCbCr or GBR formats. The line, sample and field controls all track the
related controls on other pages.
The ‘All’ checkbox forces the waveform monitor to display all lines, overlaid on each other.
Otherwise the specified line is displayed.
The waveform display format is set using the ‘Setup’ button. The waveform monitor displays the
selected signal in one of 5 formats as set by the Mode control:
The Waveform menu
displays the selected input
in the form of a waveform
monitor.
The display may be
restricted to a single line or
all lines may be displayed
at the same time. The
display can be formatted
as all streams (Luma and
Chroma) or just a single
stream.
YCbCr The Y, Cr and Cb waveforms are shown as three separate waveforms in a Parade
format
Y Only the luminance channel is shown
Cb Only the blue chroma channel is shown
Cr Only the red chroma channel is shown
GBR The Green, Blue and Red waveforms are shown as three separate waveforms in a
Parade format
Red Only the red channel is shown
Green Only the blue chroma channel is shown
Blue Only the red chroma channel is shown
The next 2 controls show the vertical and horizontal magnifications. If either value is set to a
value other than x1, a vertical or horizontal offset will be shown on the bottom right edge of the
waveform display. The offsets are set by moving the focus cursor to the waveform window and
pressing OK. The menu keys can then be used to scroll around the window. The offset will be
the same for all magnifications values so switching between x1 and x5 will not lose the offset
used in x5 mode.
The vertical offset values are in signal level bits but displayed in the current scale units so
switching between scales will keep the same offsets.
2–18 PHRX2000-200 2Menu Reference 08/12

Cursors
Cursors may be displayed over the waveform to allow measurement of time or amplitude
values. The cursor may be set to several modes:
Off: Cursors are hidden
Pict: The cursor is displayed at the current pixel point. If in YCbCr or RGB mode, three
cursors are displayed. Otherwise a single cursor is displayed. The cursor position
tracks across the picture monitor and Signal Data tabs.
Ampl: Two cursors are displayed to allow measurement of signal amplitudes.
Time: Two cursors are displayed to allow measurement of signal timing.
Both: Amplitude and time cursors are displayed.
To use the cursors, use the navigation keys to move the focus to the waveform display and
press OK. You should then get a display similar to that below. Note that the menu keys shown
depend on the display mode and cursor mode.
Menu Reference
The navigation keys now move the selected cursor around the waveform display which will
scroll if moved out of the visible area. The x10 and x100 buttons magnify the action of the
navigation keys if held down.
The Select Window button is only available in YCbCr or RGB modes and selects the window
that the cursor is displayed in.
The Amplitude Cursor and/or the Timing Cursor buttons switch the currently active cursor. In
each direction two cursors are displayed. The currently active cursor is the one displayed as a
full line (rather than the dotted cursor). The bottom of the waveform screen shows the cursor
measurements in the current format which may be Decimal, Percentage or Hexadecimal for
amplitude measurements or Pixels/uS for timing measurements. The difference between the
two cursors is also displayed in absolute form.
The Cursor Mode button changes the current mode without having to leave the navigation
window.
Source: The analyzer can view either the video SDI input or the Generator output so that
comparisons can be made between input and output.
Setup Button Dialogue
The Waveform Setup menu allows the vertical and
horizontal scale of the waveform display to be setup.
Active Picture: If checked, only active picture is displayed for picture view and waveform
monitor, all other VBI data such as TRS words ANC data and audio is
blanked. This control tracks the state of the ActPix control on the Picture.
Vertical Scale: The axes and measurements for the waveform monitor can be displayed
either in percentages or in hex or decimal values as required.
Horizontal Scale: The timing measurements may be set in either pixels or micro-seconds (us)
PHABRIX Rx Operation Manual 2–19PHRX2000-200 2

Menu Reference
Vectorscope
Line allows a specific video line to be displayed. This is useful when test patterns
All the All check box forces the waveform monitor to display all lines, overlaid
Field the Fld 1 and Fld 2 modes allow specific video fields to be displayed.
Zoom allows the vector scope display to be zoomed-in to the Centre, Cyan, Yellow,
The Vectorscope menu
displays the selected
input in the form of a
vectorscope. This may
be set to show either
the 100% bar positions
or 75% positions. The
colour bar position boxes
will change according
to the colour space for
the current input video
standard.
are transmitted as part of a programme on specific video lines.
on each other. Otherwise the specified line is displayed.
Green, Magenta, Red or Blue positions at x1, x2, x5 or x10 magnifications.
100%/75% selects the graticule scale to match the colour bars being analyzed.
SDI1a selects the SDI input 1a as the analyser display.
2–20 PHRX2000-200 2Menu Reference 08/12
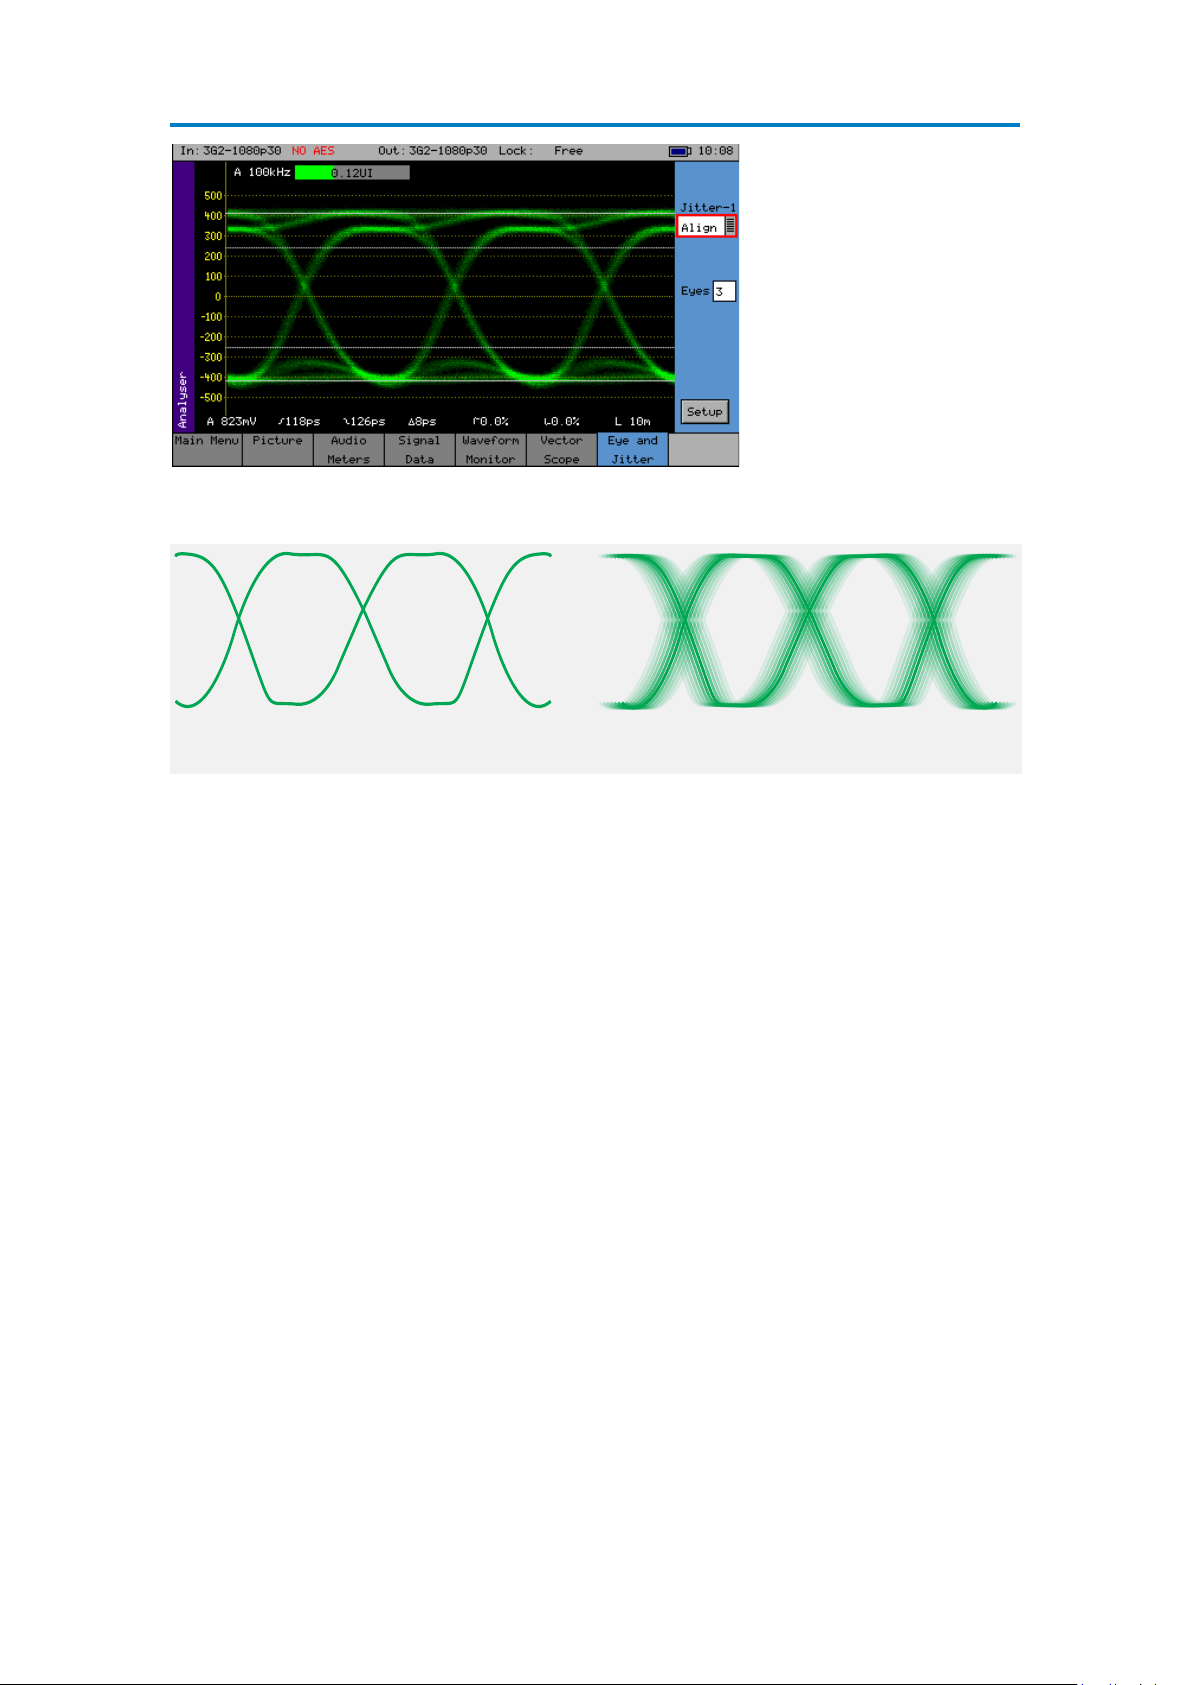
Eye
‘Open Eye’
Ideal Eye Paern
‘Closed Eye’
Displaying Jier
The Eye menu displays the
selected input in the form
of an Eye Pattern Display.
The name Eye Pattern is
given to the measurement
of SDI clock jitter display
that forms the shape
of an eye due to the 2
superimposed clock cycles.
The ‘open eye’ is displayed when monitoring a jitter free SDI signal and the eye closes
increasingly as the severity of the jitter on the SDI signal increases.
Menu Reference
The Eye Pattern is formed by displaying the clock signal from the SDI data stream then superimposing a delayed version of the clock signal at exactly half way through the duty cycle (or
unit interval) of the clock signal. This forms the recognisable eye shape.
When the SDI data steam is actually generated by a piece of equipment, ideally the leading
edge of the SDI clock is aligned exactly half way through the data sample. Distribution of the
SDI data stream via cabling, infrastructure, repeaters and distribution amplifiers can cause
distortions to the waveform and cause the data stream to be sampled earlier or later in the
duty cycle (or unit interval) which in turn will cause the wrong data samples to be taken.
The result of the incorrect data samples being taken is displayed as feint lines before and after
the ideal waveform. The greater the number of incorrect data samples that are taken the more
the eye closes.
The eye pattern can be used to display a range of different artefacts that can be isolated using
filters. Jitter occurs when a signal varies in time or amplitude outside of the ideal waveform
shape. The integrated circuits used within equipment contain 10s of thousands of individual
transistors that can all cause errors. Problems occur when these errors cause a level of jitter
outside the specified acceptable parameters.
Timing Jitter refers to a short-term time interval error above a low frequency threshold of
10 Hz (as defined in the SMPTE standards for SDI signals).
Alignment Jitter refer to artefacts above the specified threshold frequencies of (1 kHz for
SD-SDI signals and 100 kHz for HD-SDI signals). Typically video equipment
cannot tolerate Alignment Jitter which cause decoding errors due to
incorrect sampling of the data stream because the SDI Clock transition
occurs on the edge of the data sample instead of in the centre of the data
sample.
PHABRIX Rx Operation Manual 2–21PHRX2000-200 2

Menu Reference
Wander refers to a long-term time interval error, ie artefacts below 10 Hz. Typically
Random Jitter refers to artefacts caused by random events or processes such as thermal or
Eye Display
The “Eye and Jitter” display shows the Eye Pattern against a vertical graticule of +500mV
to -500mV. Four horizontal cursor lines show the 100%, 80%, 20% and 0% measurement
positions on the waveform. Along the bottom of the display are continuous automatic
measurements for:
all video equipment has the tendency to cause wander over a long period,
the display of these artefacts are not easily displayed in a meaningful way
but are better logged as errors that exceed tolerances over a long period.
shot noise that cause small amplitude variations in the clock edge position
or could cause large signal amplitude variations, though these typically
would be infrequent.
Amplitude – measured in mV
Rise time – measured in Pico seconds. The rise time measurement is specified as the
time between the 20% and 80% points on the eye waveform.
Fall time - measured in Pico seconds. The fall time measurement is specified as the time
between the 20% and 80% points on the eye waveform.
Rise/fall difference - measured in Pico seconds
Rising edge overshoot – measured as a percentage of the overall signal amplitude.
Falling edge overshoot – measured as a percentage of the overall signal amplitude.
Cable length – measured in Metres. The cable length display is only an approximate
value with 10m resolution thus a 5m cable will be shown as 0m long. The cable type
affects the length displayed which has been calibrated for Belden 1694A cables.
Any measurements which exceed the specification of the SDI signal are indicated in RED whilst
valid parameters are displayed in WHITE.
Note that if jitter values are too large, the automated measurements cannot be
made accurately and should NOT be relied on.
The eye display is only accurate when connected via a 1m cable, if a longer cable is used the
eye will begin to ‘close up’ and measurements will become harder to perform. Note that the
eye display is of the signal pre-equaliser, the equalizer in a system being used to compensate
for long cable lengths. There is no method for the Rx instrument to view the signal postequaliser.
2–22 PHRX2000-200 2Menu Reference 08/12

Jitter Filters
The “Jitter 1” and “Jitter 2” filter options allow the specific type of jitter to be applied to the
waveform and the thermometers displays. The options are:
Timing as determined by the SMPTE standard for the specific video standard (ie jitter
above the 10 Hz threshold)
Align as determined by the SMPTE standard for the specific video standard (ie jitter
above 1 kHz threshold for SD-SDI signals and 100 kHz for HD-SDI signals)
10Hz jitter above a 10Hz threshold
100 Hz jitter above a 100Hz threshold
1KHz jitter above a 1KHz threshold
10KHz jitter above a 10KHz threshold
100KHz jitter above a 100KHz threshold
Jitter filter selection affects both the jitter thermometer and eye pattern displays. Timing
and Alignment jitter filters are defined in the relevant SMPTE publication. The thermometer
automatically calibrates to the specification of the video standard and chosen filter. When
reading is in specification the thermometer bar is GREEN, when close to specification it is
YELLOW, and when out of specification it’s RED.
3G-SDI (2.97Gbps) HD-SDI (1.485Gbps) SD-SDI (270Mbps)
Alignment
Jitter
Alignment
Jitter
Upper limit -3 dB at 9.5 MHz low
SD-SDI (270Mbps) 100 KHz high pass 1 KHz high pass
10 Hz high pass 10 Hz high pass 10 Hz high pass
pass
-3 dB at 4.75 MHz low
pass
-3 dB at 0.86 MHz low
pass
Menu Reference
On screen horizontal cursors indicate where on the eye the rise time measurements are being
made.
Please note that the Rx instrument takes a little time to stabilise when the SDI input standard
changes.
Jitter Meter Ranges
3G-SDI (2.97Gbps) HD-SDI (1.485Gbps) SD-SDI (270Mbps)
Alignment
Full-Scale
Alignment
(Red Threshold)
Alignment
(Yellow Threshold)
Timing
Full Scale
Timing
(Red Threshold)
Timing
(Yellow Threshold)
0.52UI 0.34UI 0.34UI
0.3UI 0.2UI 0.2UI
0.2UI 0.14UI 0.14UI
3.4 UI 1.7UI 0.34UI
2UI 1UI 0.2UI
1.4UI 0.7UI 0.14UI
PHABRIX Rx Operation Manual 2–23PHRX2000-200 2

Menu Reference
Setup
Cable Type Selects the cable type used which affects the cable measurements.
Eye Colour The eye colour may be set to green or blue and may also be adjusted in
The Setup button shows a dialogue box that allows the
eye colour and cable type to be specified.
B8281 Belden 8281 B1505 Belden 1505
B1694A Belden 1694A B1855A Belden 1855A
CL5CSB Canare L-5CFB I-1000 Image 1000
gain to allow the eye display to show ‘hot spots’ where the majority of the
signal data is found.
2–24 PHRX2000-200 2Menu Reference 08/12

Advanced Jitter Analysis (Option)
The Advanced Jitter
Analysis option provides
the user with additional
tools on the Eye display to
help determine the nature
of jitter present in SDI
signals.
Histogram: Amp/Timing/Both. Histograms enable the operator to observe the distribution
of samples in both amplitude (Amp) and time (Time). The amplitude histogram
shows the distribution of samples over the complete visible eye picture. The time
histogram shows the distribution of samples at the zero point of the eye waveform
for two thirds of the visible time period.
Note that he time histogram overlays some of the automatic measurement display.
The measurements may still be read by Remote Control if purchased.
Menu Reference
Jitter-1: Timing/Align/10Hz/100 Hz/1KHz/10KHz/100KHz. This filter operates on both the
left hand jitter thermometer and the eye waveform. The different filters enable the
operator to understand more fully the nature of any jitter present. When in Timing
or Alignment modes, the meter range is set to show appropriate ranges for the
SMPTE specification at the current video input standard. .
Jitter-2: This is a second jitter measurement thermometer and may be set to Timing/Alig
n/10Hz/100Hz/1KHz/10KHz/100KHz. This filter operates on just the right hand
jitter thermometer. When in Timing or Alignment modes, the meter range is set to
show appropriate ranges for the SMPTE specification at the current video input
standard. When in other filter modes, the meter ranges are expanded so that
larger ranges may be viewed.
Update: This allows selection of the update rate to allow longer display persistence. This
may be set to 40ms (normal use) or infinite. When set to infinite, the Run and
Clear buttons are enabled.
Run: This check box stops the display from updating so that a waveform may be
investigated in more detail. It is only enabled when the update mode is set to
infinite update mode.
Clear: This button clears the eye display. It is only enabled when the update mode is set
to infinite update mode.
Eyes: Adjusts the number of eyes visible on the eye display. The 10 and 20 modes are
useful for observing serial-parallel conversion jitter, the H, 2H, V, and 2V are useful
for observing the effects of power supply born video synchronous noise in SDI
signals. (H/2H/V/2V not yet implemented)
PHABRIX Rx Operation Manual 2–25PHRX2000-200 2

Menu Reference
Jitter
Jitter-1: Timing/Align/10Hz/100Hz/1KHz/10KHz/100KHz. This filter operates on both the
Jitter-2: Timing/Align/10Hz/100Hz/1KHz/10KHz/100KHz. This filter operates on just the
Horiz: H/2H/V/Frame – horizontal sweep control for jitter trace.
UI/div: 0.1/0.2/0.5/1.0 – vertical gain control for the sweep trace.
The Advanced Analysis
package provides a jitter
display. This screen shows
a trace of jitter amplitude
versus time along with two
jitter thermometers and
has the following controls:
left hand jitter thermometer and the jitter trace.
right hand jitter thermometer.
Update: This allows selection of the update rate to allow longer display persistence. This
may be set to 40ms (normal use) or infinite. When set to infinite, the Run and
Clear buttons are enabled.
Run: This check box stops the display from updating so that a waveform may be
investigated in more detail. It is only enabled when the update mode is set to
infinite update mode.
Clear: This button clears the eye display. It is only enabled when the update mode is set
to infinite update mode.
2–26 PHRX2000-200 2Menu Reference 08/12

Signal Information Menu
Overview
These pages give a detailed view of the status of the input (or generator output) signal. They
are sub-divided into Video, Misc, Audio and Ancillary (ANC) status.
Video Status
The Video Status menu
display the status of the
selected video input and
displays any errors that
have been found in the
data stream.
Menu Reference
EDH/CRC ERRORS
This displays the EDH or CRC status of the analyzer input as appropriate for the video standard
being monitored. The status of each EDH/ CRC count is displayed as the number of seconds
since an error occurred. The individual CRC fields may be reset individually or together. The
‘running time’ field shows the time since the last error reset occurred. The error rate field shows
the number of errors per second. The running time will also be affected by the input being lost
or being intermittent. CRC errors are ignored on the switching line if the ‘Ignore switch line’
check box is checked.
ANC checksum errors are also detected and counted and may be logged.
When analysing a 3G-Level B signal, the CRC status is displayed for each link or stream present
according to the input video format. On an RX instrument with a Dual-Link module with 2 video
inputs, only one 3G-Level B may be analysed for CRC status at a time.
EDH DATA
If the signal is SD (PAL-625 or NTSC-525) the EDH values for both active picture (AP) and
full-field (FF) are displayed for each field. To enable engineers checking EDH integrity, the EDH
values calculated for active picture and full-field are also displayed.
Under normal conditions, the EDH-AP values should be constant, the full-field values may
change if audio or other ancillary data is embedded in the SDI signal.
The EDH flags for active picture, full-field and ancillary data are also displayed for diagnostic
purposes.
Edh: Error Detected Here - This is set to 1 if a SDI error was detected. In the case of ancillary
data, this means that one or more ANC data packets had an incorrect checksum.
Eda: Error Detected Already - This is set to 1 if a SDI error was detected in the signal received
by the previous device.
Idh: Internal error Detected Here - This is set to 1 if a hardware error was detected in the
previous device.
PHABRIX Rx Operation Manual 2–27PHRX2000-200 2

Menu Reference
Ida: Internal error Detected Already - This is set to 1 if an idh flag was received by the previous
device.
Ues: unknown error status: This is set to 1 if the previous device received an SDI signal from a
device not supporting EDH.
Note that there is only one EDH detector which is connected to the input currently being
analysed. On an Rx instrument with multiple video inputs, only the current input being
analysed can check for EDH errors.
Cable Length
The Rx instrument measures the cable length connected to the SDI input BNC and the
measurement is only an approximate value.
The cable type may be set to one of the following:
The selected cable type will affect the cable length measurement.
Active Picture CRC
Belden 8282, 1694A, 1505, 1855A.
Canare L-5CFB
Image 1000
16-bit CCITT CRCs are calculated for the active picture data of the received signal. This can be
used to give a known value for known static picture content and allows the user to determine if
the active picture content is as expected.
CRCs are calculated independently upon each 10-bit stream (luminance and chrominance) of
the interface.
For example the generated 1920x1080, 100% bars in YCC422-10 should always produce a
luminance CRC of 0x0AB4 and a chrominance CRC of 0xB88E, no matter what scanning mode
(interlaced, segmented frame or progressive) or frame rate is used.
Note: when using 4:4:4, 4:4:4:4 or 12-bit video formats (in dual-link or 3Gbps)
the CRCs are calculated for each of the packed 10-bit virtual interfaces and will
therefore generate different values from those for YCC422-10.
See the “Active Picture CRC Technical Information” section at the end of the manual for details
of CRC calculation.
2–28 PHRX2000-200 2Menu Reference 08/12

MISC Status
The Misc Status menu
display the status the
SMPTE 352 packets
embedded in the selected
video input and displays
any errors that have been
found.
Payload ID – SMPTE 352
If the Rx instrument has detected a SMPTE 352 ancillary packet, it will be displayed here in
hex and decoded format.
The display shows the transport media, frame rate and interlaced/progressive/segmented frame
mode, as well as colour format, bit depth, dynamic range and channel number. See the SMPTE
352 specification for further details.
Menu Reference
When analysing a 3G-Level B signal, the SMPTE 352 status is displayed for each link or stream
present according to the input video format. On an RX instrument with Dual-Link with 2 video
inputs, only one 3G-Level B may be analysed for 352 status at a time.
Video Format
This displays the currently detected line length for both active video and full line including
blanking as well as the number of active lines for the inputs present.
Note that the video frequency displayed is only correct if the Rx instrument has
been calibrated and free running or has been connected to an accurate reference
input.
If the input signal is not a known signal (i.e. the line count or pixel count is not recognised) The
input status on the top line will show “Invalid” but the values in this section will be updated
every few seconds.
The Re-sync counter displays the number of times the SDI data has been re-synchronised and
can help detect intermittent SDI signal problems.
PHABRIX Rx Operation Manual 2–29PHRX2000-200 2

Menu Reference
Video Timing
The timing of SDI input signals is displayed relative to the external reference. If no reference is
present then an error message is displayed. If the signal is timed to within +/- 2 samples the
values are displayed in black in lines and samples (spl) If mis-timed, then they will be displayed
in red. A bar graph also displays the timing value which may either be line timing (+/- 0.1 lines
or +/- 0.5 lines) or frame timing (+/- 0.5 frame). The total timing value is also displayed in
micro seconds.
The RED arrow on the bar shows the SDI input timing and the BLUE arrow shows the current
target timing point. The BROWN line shows the timing of the reference signal.
The Video Timing menu
displays the relationship
between the selected video
input with respect to the
locking reference input.
To compare timings of different signals, connect the signal to be compared to the SDI input and
select the “Offset” button to make this the current offset. All future timings will be relative to
this offset value.
To clear the current offset, move the focus to the 2 offset fields, press OK to edit them and then
press default.
Note that all timing measurements are relative to line 1 on the SDI signal and
line 1 on the reference signal. This can lead to different values to other test
and measurement instruments that include an SD (PAL/NTSC) offset in their
calculations. By comparing line 1 timings, the Rx instrument can be used to
accurately measure time delays through up/down/cross converters.
2–30 PHRX2000-200 2Menu Reference 08/12

ANC Status (ANC Option)
The ANC status menu
shows which ANC packets
are present on the SDI
input and whether they
have any errors. Each field
is colour coded according
to whether the ANC packet
is present (White), missing
(Grey), has errors (Red), or
has previously had errors
(yellow).
If the field has errors then a symbol beside the field shows which error type it is. The bottom of
the page shows the symbol for each type of error. The Reset button resets the “Previous Errors”
state.
The Setup button and dialog allows user defined ANC
packets to be configured.
Menu Reference
The packet name, data ID (DID) and SDID may be specified for up to 3 user-defined ancillary
packets. The stream field specifies whether the packet should be on the chroma stream, the
luminance stream or both.
PHABRIX Rx Operation Manual 2–31PHRX2000-200 2

Menu Reference
ANC Inspector (SDI Data Option)
The packet type can be selected using either the drop down list of known packets or the DID/
SDID number fields. If the DID/SDID values match a known type, then that type will be selected
in the drop down list. This may be further filtered using the Check Boxes on the Setup dialogue.
The Line and sample number of the detected packet is displayed to facilitate debugging of
generation equipment. The complete data packet is displayed as a hexadecimal grid at the
bottom of the page and may also be decoded into text above the grid.
If an error occurs in the packet, the header and checksum are displayed in red.
The SDI Data Option allows
Ancillary data packets to
be detected and checked
for errors.
The ANC Inspector menu
displays details of the ANC
packets.
The display of data may be frozen by pressing the Freeze check box.
The ‘Found’ description shows in which stream the ANC packet was detected, Chroma or Luma
and what kind of trigger was detected. This may be:
C Checksum Error
D DBN (Data block number) Error
P Parity Error
G ANC Gap error
Several of the above flags may be displayed at the same time.
The ANC packets detected may be filtered using the Setup dialogue. This allows a great deal of
freedom in setting when the display will be triggered.
If the On Trigger check box is checked the data packet will cause the display to be frozen and
the Freeze check box will turn red when a trigger condition is met. See the section on the ANC
Inspector setup dialog below. Un-checking the freeze button will restore normal operation.
The “->Cursor” button will copy the Line and Sample numbers to the SDI data view cursors to
simplify navigation to the ANC packet under investigation.
2–32 PHRX2000-200 2Menu Reference 08/12

ANC Inspector Setup
If the Setup button
is pressed a dialogue
box is shown to allow
the ANC packet trigger
parameters to be set. The
trigger parameters allow
only selected lines to be
checked or excluded when
checking for the presence
of packets.
Line Range Filer If either of the Line Range Filter check boxes are checked then the range
of lines that the ANC inspector will check is limited to that range. If the
Selection below the range is set to “Inside” then it will only check ANC
packets inside the range (including the start and end lines). If it is set to
“Outside” then it will only check ANC packets outside the specified range.
HANC/VANC Filter This is another filter for simpler selection of where to search for packets. It
may be selected to search the HANC are, the VANC area or both areas.
Menu Reference
VANC Area
HANC Area
Acve Picture
Error Triggers
If any of the “Errors” check boxes are checked, then the ANC packet data will only be displayed
if an error occurs. The error states detected are:
Checksum: A checksum error in a packet was detected. (Sum of data between DID and final
UDW)
DBN: A Data Block number error was detected in an audio packet. The DBN field (in the
same place as the SDID) of an audio packet should either be 0 and never change
OR increment from 1...255 and then start at 1 again.
Parity: A parity error was detected for the DID, SDID and DataCount words in a packet.
(Even Parity used and bit 9 is inverse of bit 8)
ANC Gaps The ANC packets were separated by a gap containing video blanking data. EDH
(DID=0xf4) packets are ignored. Note that if an EDH packet is marked for
deletion, this will result in an ANC GAP error.
The Setup dialogue also shows when an ANC packet has been detected and where it was
found. This makes changing a filter simpler as the effect of the filter can be determined without
closing the dialogue.
This dialogue also allows the user defined ANC packets to be configured.
PHABRIX Rx Operation Manual 2–33PHRX2000-200 2

Menu Reference
2–34 PHRX2000-200 2Menu Reference 08/12

Audio Menu
Audio Meters
Menu Reference
The Audio Meters menu
displays up to 16 audio
channels. The source for
each block of 8 meters
may be independently
set to allow simultaneous
metering of 8 inputs and 8
outputs or all 16 channels
in an embedded SDI
stream.
If AES inputs or outputs
are present then these
may also be metered. At
the bottom of each meter
is the current audio level
for that channel in dBFs
(decibels relative to 0dB
full-scale).
The scale used by the meters may be set to -18dB or -20dB according to the standard
operating level used.
If the Dolby option has
been purchased, the
meters may be set to
display the encoded Dolby
levels for the specified
audio pair or AES input.
Note that Dolby audio cannot be heard on the speaker as a Dolby decoder is not
present.
PHABRIX Rx Operation Manual 2–35PHRX2000-200 2

Menu Reference
Audio Status
The Audio Status menu
shows the Channel Status
for the selected audio
channel is displayed in
decoded form as well as
a hexadecimal dump of
the bytes. The source
may either come from the
input signal or from the
generator for comparison
purposes.
2–36 PHRX2000-200 2Menu Reference 08/12

Dolby-E Status (Dolby-E Analyzer Option)
The Dolby-E status option
allows display of the
Dolby-E meta-data present
in the selected audio
stream and determines
whether the Dolby-E
packet is timed correctly
on the SDI video stream.
This option therefore
allows the Dolby-E aspect
of the signal to be timed
correctly at all stages in a
broadcast chain.
Checks can be made to see that the Dolby E has been created correctly and transferred
transparently through the broadcast chain unaffected by routers/switchers, satellite links, etc.
Overview
There are a number of Dolby broadcast digital audio standards that transport audio data over
an SMPTE 337M AES carrier with a 48kHz sample rate:
Menu Reference
Dolby Digital
Dolby Digital Plus
Dolby E
These standards can be used to transport mono, stereo, 5.1 and 7.1 audio programmes:
Dolby 5.1 - involves five channels for normal-range speakers (20 Hz – 20,000 Hz) (right
front, centre, left front, rear right, rear left) and one channel (20 Hz – 120 Hz allotted
audio) for the subwoofer driven low-frequency effects.
Dolby 7.1 uses six channels in the primary program (Independent Substream) for a
standard 5.1 surround sound mix and then the 2 remaining 2 channels in an ancillary
programme (Dependent Substream) to provide the additional down-mix.
Dolby E
Dolby E is an audio encoding and decoding technology developed by Dolby Laboratories that
allows up to 8 channels of audio (mono, stereo, 5.1 or 7.1) that for a primary programme
(Programme 1) and optional ancillary programs. These 8 channels are compressed (lossless)
into a digital stream that can be transferred between compatible devices and stored on a
standard stereo pair of audio tracks. The most elaborate mode in common use is Dolby 7.1
which uses all eight channels to provide surround sound.
PHABRIX Rx Operation Manual 2–37PHRX2000-200 2

Menu Reference
SDI source with Dolby-E
embedded on a pair
OPTICAL
A AB LP2 IN2 LP1 IN1
Dolby-E AES Source
OPTICAL
A AB LP2 IN2 LP1 IN1
OPTICAL
A AB LP2 IN2 LP1 IN1
REF
CPU
AES
IN
SDI
OUT
HDMI
USB LAN GPIO
Reference
Analyser Reference
In order for the Dolby-E data to be decoded correctly, the internal audio circuitry requires a
reference that is synchronized to the input signal. The Generator Reference MUST therefore
NOT be set to Free-Run or Dolby-E errors may be detected. The description field will display
“Invalid Reference” if an incorrect reference is selected.
In this example, the SDI signal contains
embedded audio with Dolby-E present on
one or more audio pairs. The Rx instrument
needs to lock its internal audio clock to
the SDI signal (Generator – Genlock –
Source=Input 1) and the Dolby Timing
source should be set to SDI.
In the example above, the AES signal contains a Dolby-E stream. The Rx instrument needs
to lock its internal audio clock to the external reference signal (Generator – Genlock –
Source=1Ref) and the Dolby Timing source should be set to Ext.Ref. The AES source MUST
be locked to the same reference as the Rx.
Source selection
The Dolby-E may be monitored from any of the SDI input embedded audio channel pairs or the
AES input.
Dolby Framing Values
It is important for the Dolby-E packet to be positioned well away from the video switching line
so that Dolby-E packets are not corrupted by downstream switchers. At all places in the signal
chain where audio can be delayed by a different value to the video, the Dolby-E packet needs
to be re-timed to make sure that this timing specification is met. The position of the Dolby-E
packet in the video frame is displayed in lines and micro-seconds (us).
2–38 PHRX2000-200 2Menu Reference 08/12

Timing source
Dolby-E timing may be measured relative to the SDI input or the External reference. If the
‘Ideal’ check box is checked, the Dolby-E Frame timing is relative to the normal position that it
should be, i.e. it should be as close to 0 as possible. Each video standard has a specified ‘Ideal’
line number that the Dolby-E packet should start on. If the Dolby-E timing line is outside the
valid range of lines it will be displayed in red. If it is outside the ideal range it will be displayed
in dark green – this is still a valid Dolby-E position but not recommended by Dolby. The timing
measurement is always displayed in terms of the SDI input lines and thus if an AES input is
used as the Dolby-E source, the line position will NOT be displayed.
If you do not have the same reference as the SDI source, you will have to set the Reference
Source and Dolby Timing Source to be the SDI input.
IMPORTANT: If Dolby-E is present on a fast frame rate signal (50p, 59p or 60p) then it should
always be referenced to a interlaced reference at the same field rate as the packet length is
longer than a single frame and must start at the beginning of an even numbered frame.
Programme configuration
This displays the Program
configuration (5.1+2 etc),
the number of program in
the meta-data, the frame
rates and bit depths and
time-code if any present.
Menu Reference
Errors: This displays the number of CRC errors detected in the Dolby-E meta-data.
Start Gain: These fields indicate the gain to be applied to the specified channel at the
beginning of the audio frame when decoding.
End Gain: These fields indicate the gain to be applied to the specified channel at the
end of the audio frame when decoding.
Program selection: Selects which set of program meta-data is shown. Up to 8 programs can be
encoded in the Dolby-E packet dependent on the Program Configuration.
Program description User defined description for the selected program.
PHABRIX Rx Operation Manual 2–39PHRX2000-200 2

Menu Reference
Programme Metadata
The “Audio” – “Dolby” menu allows the metadata for a Dolby E data stream to viewed. For any
programme this metadata would be created as part of Dolby E authoring process. The following
metadata can be viewed for Program 1:
Dialogue Norm is the normal audio level for dialogue. Ideally all transmitted programs
BsMod (Bitstream Mode) indicates the type of audio service that the bitstream
Ctr DnMix (centre down-mix) is a weighting value used in the encoding and decoding of
Sur DnMix (surround down-mix) is a weighting value used in the encoding and decoding
LRoCtrDnMix (left/right/stereo/centre down-mix) is a weighting value used in the encoding
LRoSurDnMix (left/right/stereo/surround down-mix) is a weighting value used in the
would have the same value.
contains. Complete Main (CM) is the normal mode of operation and contains
a complete audio program including dialog, music, and effects.
surround sound mixes for a Dolby 5.1 Independent Substream.
of surround sound mixes for a Dolby 5.1 Independent Substream.
and decoding of surround sound mixes for a Dolby 7.1 Dependent
Substream.
encoding and decoding of surround sound mixes for a Dolby 7.1 Dependent
Substream.
LR CtrDnMix (left/right/centre down-mix) is a weighting value used in the encoding and
decoding of surround sound mixes for a Dolby 5.1 Independent Substream.
LR SurDnMix (left/right/surround down-mix) is a weighting value used in the encoding and
decoding of surround sound mixes for a Dolby 5.1 Independent Substream.
Chan Mode defines the channel configuration for Program 1 (ie mono, stereo, 5.1
channels).
Line Mode this is an Operational Mode / Dynamic Compression Mode that is used
by consumer and professional decoder products that simplifies the
implementation of Dialogue Normalization, Dynamic Range Control, and
down mixing functions, all of which are necessary in Dolby Digital products.
RFMode this is an Operational Mode / Dynamic Compression Mode that is used
by consumer and professional decoder products that simplifies the
implementation of Dialogue Normalization, Dynamic Range Control, and
down mixing functions, all of which are necessary in Dolby Digital products.
Room Type this informational parameter indicates the type and calibration of the mixing
room used for the final audio mixing session.
MixLevel the Surround Down mix Level parameter indicates the nominal Lo/Ro down
mix level of the Surround channel(s) with respect to the Left and Right
channels
DolbySurnd the Dolby Surround Mode parameter indicates whether or not a two-
channel Dolby Digital bitstream is conveying a Dolby Surround encoded
program.
DownMixMod this controls the Down Mix Mode which is used by the content creator to
optimise Center and Surround channel levels for use in stereo down mix
mode for any two-channel programmes.
D Sur Ex this controls the Dolby Surround Ex channel that provides an extra audio
channel for Dolby 5.1. The extra surround channel of the Dolby Surround Ex
system is matrix-encoded onto the discrete left-surround and right-surround
channels of the 5.1 mix.
2–40 PHRX2000-200 2Menu Reference 08/12

The following control bits can also be viewed:
LFE the LFE Channel parameter enables or disables the Low-Frequency Effects
(LFE) channel.
HPF this parameter can be used to activate the DC High pass filter for all input
channels.
LPF the LFE Low pass Filter parameter can be used to activate a 120 Hz low-
pass filter applied to the LFE input channel.
Sur 3dB Alt the Surround Channel 3 dB Attenuation function is use to apply a 3 dB
attenuation to the Surround channels of a multichannel soundtrack created
in a room with film style calibration, when encoding it for consumer home
theatre playback.
Sur Ph+Filter the Surround Channel 90-Degree Phase-Shift feature is used for generating
multichannel Dolby Digital bitstreams that can be down-mixed in an
external two channel decoder to create a true Dolby Surround compatible
output.
Org Stream the Original Bitstream informational parameter sets the value of a single bit
within the Dolby Digital bitstream. This bit has a value of 1 (box checked)
if the bitstream is an original. If it is a copy of an original bitstream, it has a
value of 0.
Copyright the Copyright Bit informational parameter sets the value of a single bit
within the Dolby Digital bitstream. If this bit has a value of 1 (box checked),
the information in the bitstream is indicated as protected by copyright. If it
has a value of 0, it is not copyright protected.
Menu Reference
RF 0v Prot the RF Over-modulation Protection parameter determines whether or not
an RF pre-emphasis filter is used in the overload protection algorithm to
prevent RF over-modulation in set-top box decoders.
Peak Metering
The peak audio levels are included in the Dolby-E meta-data packet and may be displayed on
the Analyzer-Audio-Meters page. Select the appropriate set of meters to display Dolby levels
and then they will follow the selected Dolby-E source.
Note that audio cannot be decoded by the Rx range of products and so you will
NOT be able to listen to the Dolby-E signal. Note also that the LFE channel audio
levels do not seem to be metered by current Dolby encoding modules.
See the logging section for details on which changes of Dolby-E status may be logged.
PHABRIX Rx Operation Manual 2–41PHRX2000-200 2

Menu Reference
2–42 PHRX2000-200 2Menu Reference 08/12

System Menu
Memories
The Memories menu
displays the current
settings in the Rx
instrument may be saved
for future recall.
The check boxes on the
right-hand side determine
what is saved in the
memory. Non overlapping
memories may then be
combined together.
Note that if log-in has been enabled for an Rx instrument, memories may only be
added, edited, renamed or cleared and archives backed up by a user with “Modify
Memories” permissions.
Menu Reference
Saving Memories
Select the memory to save settings to by moving the cursor to the ‘Select Memory’ list and
pressing ‘OK’. Use the up/down cursor keys to select the memory and then press ‘OK’. The
name edit field next to the memory list will be updated with the name of the selected memory.
Specify which aspects of the Rx instrument are to be saved in the memory using the check
boxes on the right hand side. If you want to change the name of the memory see the section
‘Renaming Memories’ below before saving.
Move the cursor to the ‘Save’ button and press ‘OK’. The text field under the Memory list will
change to show the last Saved or Recalled memory.
Recalling Memories
Select the memory to be recalled by moving the cursor to the ‘Select Memory’ list and pressing
‘OK’. Use the up/down cursor keys to select the memory and then press ‘OK’. The name edit
field next to the memory list will be updated with the name of the selected memory.
Move the cursor to the ‘Recall’ button and press ‘OK’. The text field under the Memory list will
change to show the last Saved or Recalled memory.
Renaming Memories
Select the memory to be renamed by moving the cursor to the ‘Select Memory’ list and
pressing ‘OK’. Use the up/down cursor keys to select the memory and then press ‘OK’. The
name edit field next to the memory list will be updated with the name of the selected memory.
Move the cursor to the edit field and press ‘OK’. The menu keys at the bottom of the screen
will change to show text keys similar to a mobile phone. Pressing a key repeatedly will cycle
through the characters for that key. Pressing a different key will move the cursor to the next
position and insert the first key value for that key. The cursor left and right keys can be used
to move the position of the text cursor which is where the next character will be inserted. The
‘Back Space’ key will delete the key to the left of the cursor. The ‘Cancel’ key will cancel edit
mode and restore the original text. Once you have finished editing the name, press ‘OK’ to
rename the memory.
PHABRIX Rx Operation Manual 2–43PHRX2000-200 2

Menu Reference
Adding Additional Memories
To add a new memory, press the ADD button. This will use the current memory name and
settings.
Clearing Memories
Select the memory to be cleared by moving the cursor to the ‘Select Memory’ list and pressing
‘OK’. Use the up/down cursor keys to select the memory and then press ‘OK’. The name edit
field next to the memory list will be updated with the name of the selected memory.
Move the cursor to the ‘Clear’ button and press ‘OK’. The memory list will show the default
name for that memory. A cleared memory cannot be recalled.
Exporting Memories
Memories can be exported to a single file for backup purposes and re-imported into the
internal format. This allows different sets of memories to be used for different tasks, such as
command scripts. Exported memories are in a text format and so may be edited on a PC and
downloaded to/from the backups directory on the Rx instrument via FTP or USB.
To export memories, select the Backup...
button which will open a window to select
the file to create. Existing files are shown
and a new filename may be selected
using the File Name edit box. Select the
Save button to create the backup file. The
filename created will have a .mem file
extension.
To import memories, select the Restore... button which will open a window to select the file to
import. Existing files are shown and one should be selected before the Load button is pressed.
Select the Load button to import the backup file.
Note that when importing a backup file, all existing memories are deleted before
the backup file is loaded so make sure that they are backed up first.
Disk Space
The disk space section shows total size of the internal flash disk and how much is used as a
percentage and how much is free.
2–44 PHRX2000-200 2Menu Reference 08/12
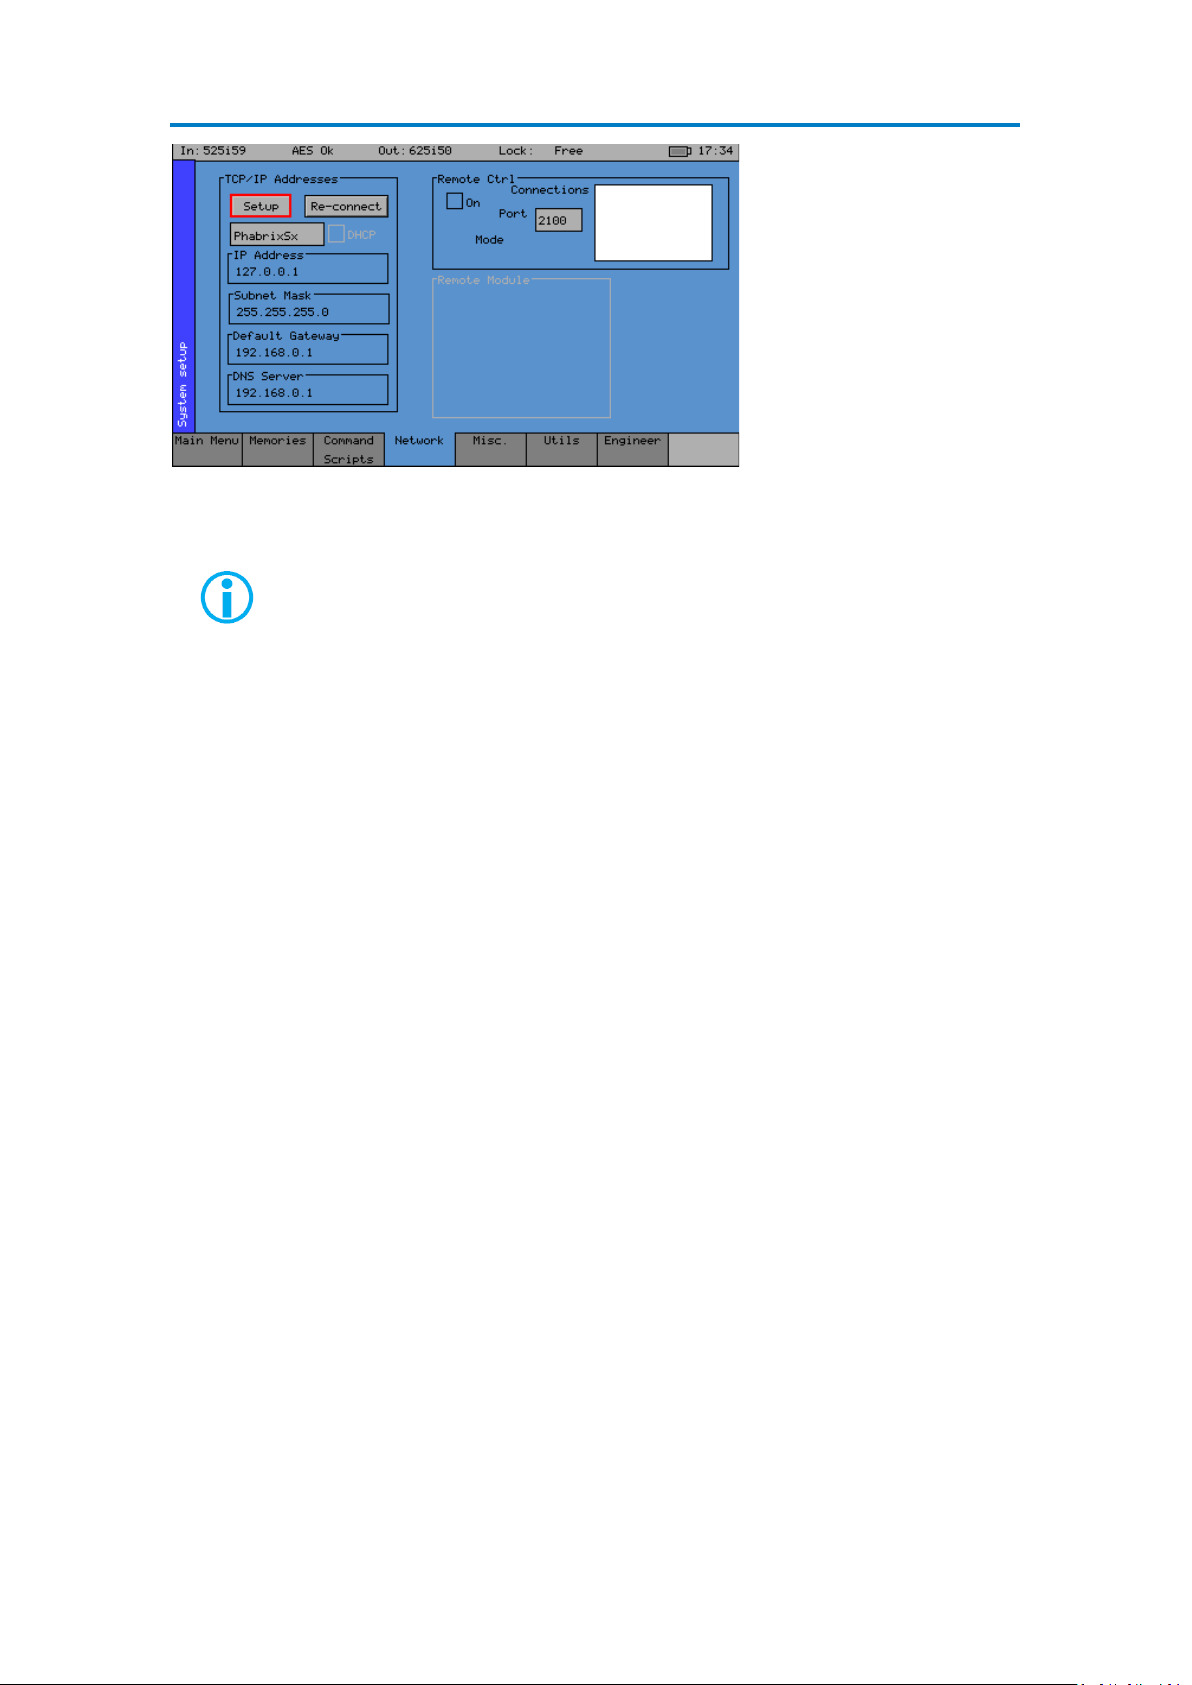
Network
PHABRIX Rx is fully
network compatible and
has a complete network
interface to allow control
of any Rx instrument from
any other unit.
The Network menu allows
the Rx instrument to be
configured as part of a
network.
On all Rx instruments the network addressing can be setup using the HDMI monitor output.
On the Rx2000 instrument the IP Address can be setup using the Front Panel menus.
Note that if the Rx instrument is turned on without the network connected, you
will have to select the “Re-connect” button to set networking up correctly. This is
because the Ethernet connection auto senses whether it has to swap the cable
over which means that you can use any Ethernet cable with the Rx instrument but
it also requires the Ethernet connection to be present when starting up.
Menu Reference
The IP Address for the Rx instrument can be setup using the “Network Setup” window on the
HDMI monitor output. A new “Network Setup” window can be created by right-clicking with a
mouse in the display area and selecting the “Network Setup” option.
If the DHCP check box is enabled, then the Rx instrument will attempt to automatically request
an IP Address from any network it is connected to. This will only work if there is a DHCP server
on network.
If your network has ‘static’ (non changing) addresses, you will need to see your network
administrator to get an address assigned to your instrument and to get the Subnet mask and
default gateway address. These details can then be entered in the corresponding boxes in the
menu. Select each numeric box in turn and use the up and down cursors to pick the required
value.
When the IP Address, Subnet Mask, Defualt Gateway and DNS Server values have been setup,
use the Apply button to attach the Rx instrument to the network.
On the Rx2000 instrument, select the “System” - “Network” menu to access the IP Address,
Subnet Mask, Default Gateway and DNS Server values. Select the “Setup” button and edit the
settings. Note that if the DHCP check box is enabled, these values will not be editable. Once
the network addressing has been setup, select the “Apply” button to attach the Rx instrument
to the network.
PHABRIX Rx Operation Manual 2–45PHRX2000-200 2
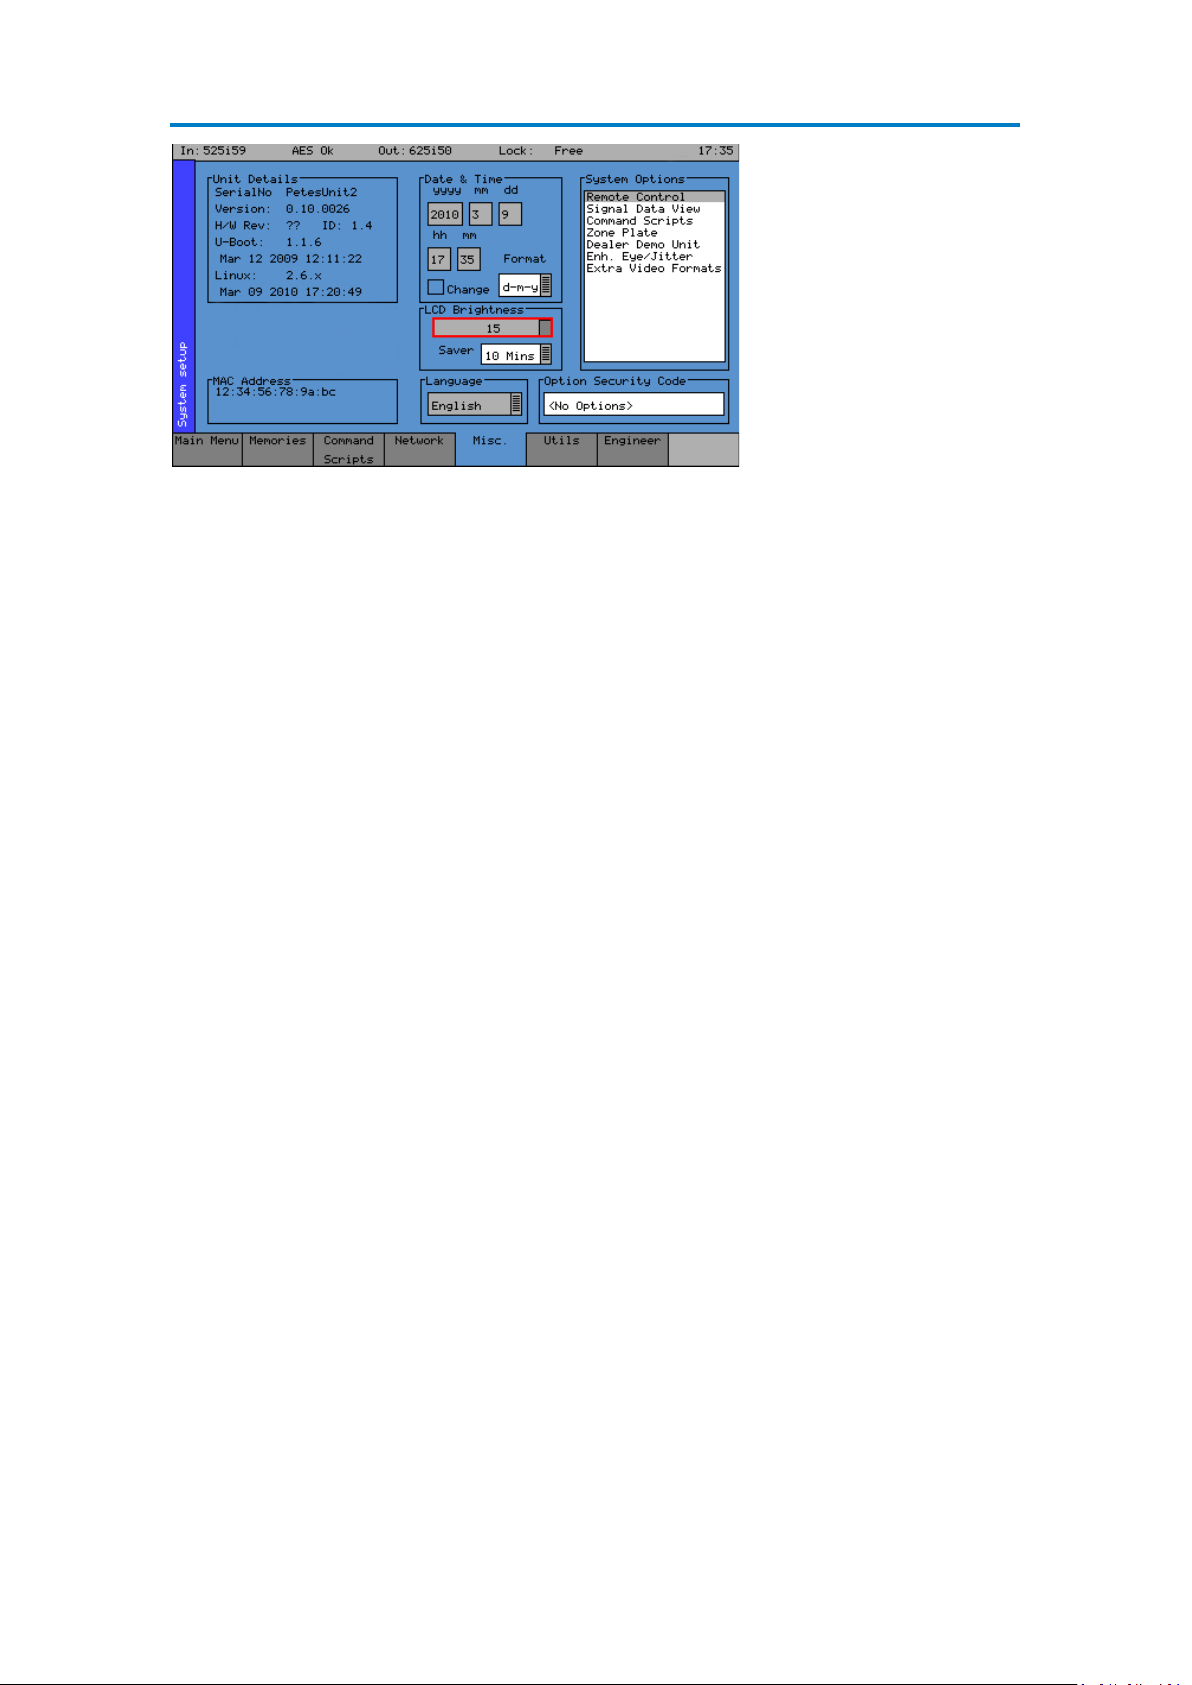
Menu Reference
Misc
Changing The Date/Time
Check the ‘Enable Change’ check box under the date and time fields and then use the cursor
to move around the date and time. Press ‘OK’ to edit a field and again to complete the change.
When all fields have been edited, uncheck the ‘Enable Change’ check box and the new date
and time will be set.
Note that the date may not be changed while a 30 day trial option is active.
The Misc menu shows
serial numbers, Rx
instrument MAC address,
version information and
battery state. It also allows
the date and time to be set
and factory default settings
to be recalled. The options
security code is entered
on this page if options are
purchased.
Changing the Date Format:
The date format used on logging screens etc may be set using the Format selection control.
Three formats are available: Date-Month-Year, Month-Date-Year and Year-Month-Date.
Setting LCD Brightness
Use the LCD brightness slider to set the LCD brightness, using a lower brightness will reduce
the current drawn from the battery and thus lengthen battery life.
Setting User Language
The language used to display the menus in may be changed to one of the supported languages.
(Currently only English is supported)
Changing Options Security Code
When new options are purchased for the Rx instrument a new Security Code will be supplied.
This is specific to this instrument and cannot be used on other units. The security code is
entered using the Edit field below the System Option list and is edited by pressing OK and
using the menu function keys. If an incorrect Security code is entered a dialogue will be
displayed. The new Security code will only be saved if it is valid, the old code will be used until
a valid code is entered. Once a valid new code has been entered, the list of options provided
by that code will be displayed. The options code is stored independently to memories and
system settings.
2–46 PHRX2000-200 2Menu Reference 08/12

Utils
The Utils menu displays
details of the Rx
instrument’s module
(board) operating status
and details the system
temperature and individual
board voltages. This menu
also allows you to disable
selected options.
Dealer Features
This section of the menu details the features that can be used by suppliers of the Rx
instrument.
Show Options this check box, if selected, will enable the features throughout the menu
system.
Menu Reference
Enable this check box, if selected, allows options to be cleared from the Rx
instrument.
Clear Option this function, when pressed, will remove the selected options from the Rx
instrument.
Board (Module)
This section of the menu details the Modules that are currently installed in the Rx chassis.
Front if this is selected will display the hardware details of the front panel board.
CPU if this is selected will display the hardware details of the CPU Board.
Board 1 if this is selected will display the hardware details of the Module fitted in
chassis slot 1.
Board 2 if this is selected will display the hardware details of the Module fitted in
chassis slot 2.
Board 3 if this is selected will display the hardware details of the Module fitted in
chassis slot 3.
Board 4 if this is selected will display the hardware details of the Module fitted in
chassis slot 4.
Hardware Status
This section of the menu shows any hardware errors that have been recorded by the Rx
instrument. If the error count is greater than 0, contact you local dealer for advice.
System Temperature
This section of the menu displays the current Rx instrument temperature. This information is
provided for diagnostics purposes only.
PHABRIX Rx Operation Manual 2–47PHRX2000-200 2

Menu Reference
Voltages
This section of the menu displays the current voltages for the currently selected board in the
“Board” section of the menu. This information is provided for diagnostics purposes only.
SFP
This section of the menu displays the type of SFP (Small Form Factor Package) module is
installed in the board currently selected board in the “Board” section of the menu. This
information is provided for diagnostics purposes only.
2–48 PHRX2000-200 2Menu Reference 08/12

Engineer
The Engineer menu is
used to manage the Rx
instrument and allows user
access to be setup and the
installation of new versions
of software.
Clear Memories
This section of the menu allows the defined users who can access the Rx instrument to be
cleared. To use this function, select the ‘Enable’ check box and press the ‘Clear ALL’ button.
This will clear all of the user memories will be deleted.
Default Settings
Menu Reference
This section of the menu allows you to reset the Rx instrument back to its default settings.
To do this, select the ‘Enable’ check box and press the ‘Set Defaults’ button and the factory
defaults will be recalled. This will not affect the system Security Code or Free Run frequency.
Set User Login
User access can be setup for the Rx instrument by adding users to the system. With User log-in
enabled, a log-in screen will be displayed when the Rx instrument is turned ON. This will then
require a valid user and password to be entered. Each user has an encrypted password and
permissions which may be set.
Using the User Login feature allows the
Rx to be protected from un-authorised
operation of the Front Panel controls. The
prompt feature can allow a message to be
displayed so that if the Rx instrument gets
lost or stolen, someone finding it knows
where to return it.
Adding/Deleting Users
Add a user by editing a new name in the User Edit box next to the “Add User” button and then
editing a new password. Once the password is 6 characters or longer, the “Add User” button
will become enabled and may be pressed. Make sure that your password is memorable. If
all passwords to an Rx instrument are forgotten, you can contact Phabrix for an over-ride
password. Users with administrator permission may add/delete users.
PHABRIX Rx Operation Manual 2–49PHRX2000-200 2

Menu Reference
The permissions are:
Administrator: This user may add/delete users and may also edit the Log-in prompt text.
Modify Memories: This user may create, save and delete memories and Archives.
Modify Scripts: This user may create, save and delete script files (if the command scripting
Each user may modify their own password by entering a new password (6 or more characters)
and pressing Change Password.
Once user log-in has been
set up on your Rx a “Log
out” button is added to the
main menu which causes
the log-in screen to be
displayed. This may be
used to protect a systems
settings from being
modified by other users.
The system is still fully
running while the log-in
screen is visible.
option has been purchased)
If all users are deleted, the Rx instrument reverts to starting up without a login screen.
Editing The Prompt Text
The simplest way to edit the prompt text is to FTP a prompt text file onto the Rx instrument.
This file should be called “loginprompt.txt” (it MUST be all lower case). The instrument should
then be re-started for the new file to be used.
Users with administrator permissions may also edit the prompt text by selecting a line in the
prompt text list and editing it by pressing the OK button when in the line edit field using the
text keyboard.
Add a new blank line after the selected line by pressing the “Add Line” button.
Insert a new blank line before the selected line by pressing the “Insert Line” button.
Software Upgrade
This section of the menu allows new software versions to be installed. The Rx instrument may
download and install new versions of software when available. This process is a two stage
process: Download the software and then install it.
1. To download the latest software version, make sure that the network settings are
correct and that the Rx instrument is connected to the internet via the Ethernet
connection.
Pressing the Download button will cause the current release of software to be
downloaded from the Phabrix Web Site. This will take a short time dependent on the
connection to the Internet. Once the download has completed, the software will be
checked for errors before being stored on the Rx instrument for future installation. If the
latest software is already present on the Rx instrument, no software will be downloaded
and a message will be shown.
Note that multiple releases of software may be stored on the Rx instrument so a
previous release can be re-installed if required.
2–50 PHRX2000-200 2Menu Reference 08/12

2. To install the downloaded software on the Rx instrument, select the release using
the field with releases listed. The largest number is the latest release. Select the ‘Install’
button and a confirmation dialogue will be shown. Press “Yes” and the installation will
start. This process takes several minutes to decompress the software, extract the files
and then reprogram the hardware. If an error is given during the installation, retry the
installation and or download. Do NOT turn the Rx instrument off until an installation has
completed correctly.
Once the installation has competed, if “Reboot after Install” is checked the Rx instrument
will re-start with the new software installed. If not checked then the instrument should be
turned off and on again manually.
Note that as part of the installation procedure, all memories are archived to a
backup file and then deleted. They can be restored from the System-Memories
page using the Restore button and selecting the ‘_Before_Upgrade’ archive.
The software release notes can be viewed by selecting the Changes button.
Menu Reference
PHABRIX Rx Operation Manual 2–51PHRX2000-200 2

Menu Reference
HDMI/SDI Output
The Monitor output display can display the pre-sets selected by the “Pre-set Buttons” and can
be controlled by a USB mouse and keyboard connected to the Rx instrument
The HDMI/SDI Outputs
menu controls the use of
the HDMI monitor output
and the SDI output on the
CPU module.
The Rx range of products
provide a Monitor output
in the form of an HDMI
output that can display up
to 16 instrument windows
at 1920 x 1080 resolution.
.
Note that on the Rx 500 and Rx 1000 instruments, the Monitor Output is always
enabled. But on the Rx 2000 instrument, however, the Monitor output can
be enable/disabled in the “HDMI/SDI Output” menu that is available from the
Instrument Display on the front of the instrument.
The built-in video signal Generator on the CPU board (standard on all Rx instruments) provides
an SDI test output. This is tied to the HDMI Monitor output and can only produce test signals
in a range of video formats matching those of the HDMI output. If an unrestricted range of test
signal video formats is needed, then either the HDMI out needs to be disabled or an additional
Generator module is required.
With the HDMI output enabled (always enabled on the Rx 500 and Rx 1000 instruments and
configurable on the Rx 2000 instrument) then the frame rate of the SDI output is limited to be
match to the HDMI output. The HDMI standard and frame rate combo-boxes will be limited to
1080p 50/59/60. If the HDMI output is disabled (Rx 2000 only), the SDI output may be any
frame rate.
If the Enable check box is selected, in tbe CPU SDI Output section of the HDMI/SDI Output
menu, the SDI output from the CPU board can be used for the Monitor output or as a test
signal generator. Select the 3G-A format (which uses 1080p as default) and then select HDMI
output, 100% Bars, 75% Bars or Check Field patterns as required.
2–52 PHRX2000-200 2Menu Reference 08/12

Logging Menu
Overview
Logging allows events to be detected and recorded for future examination. The events to be
logged can be specified so that unwanted events do not appear in the event log. If a system
has a problem with intermittent signals, the Rx instrument can be connected to that source and
can be left for several days to log any errors. At the end of that period the log can be examined
and the time and date of each error noted.
Event Log
The Event Log menu
displays a list of events
with a time stamp showing
when they occurred.
Menu Reference
Pressing the OK button on the front panel when the highlight is on the event log page allows
the event log to be scrolled through to view all events in the list. The currently selected event
is shown on the event log header. The date format may be changed using the Date ‘Format’
control on the “System” - “Misc” page. The event log may be cleared by pressing ‘Clear Log’
button; a dialogue will be shown asking the user to confirm the action. A date stamped
‘mark’ may be inserted into the event log to allow users to see when a test started or when a
significant event happened using the ‘Add Mark in log’ button.
Note that the event log only shows changes in status, so if the input is always
in error and never good, an event will not be shown. To get the full state of the
instrument will require looking at the current status as well as the event log.
PHABRIX Rx Operation Manual 2–53PHRX2000-200 2

Menu Reference
Log Setup
Audio Thresholds
This section allows the thresholds for audio events to be set. If the audio level for a channel is
higher than that specified for the Clip or High fields for the number seconds specified then an
event will be added to the event log. If the audio level for a channel is lower than that specified
for the Quiet or Muted fields, then and event will be added to the event log. Logging may be
limited to specified audio pairs.
The Log Setup menu
allows specific events
to be tracked by the Rx
instrument.
The events to be logged
are set up on this page by
checking the appropriate
‘Log’ check boxes.
Video Status
This section allows specific video status events to be logged:
Output Standard A log event will be added whenever the generator video standard changes.
Reference Status A log event will be added whenever the external reference standard changes
or the external reference input is lost or re-appears.
Input Status A log event will be added whenever the input video standard changes or if
the input is lost or re-appears.
EDH/CRC A log event will be added whenever a EDH/CRC error state changes. If the
EDH/CRC state is correct, the event will show OK, else it will show FAIL.
Separate Luma and Chroma CRC events may be shown. Note that EDH/CRC
events may occur when an SDI signal is connected or removed.
TRS Errors If the number of lines changes or line length changes during a frame, the
input video will be detected as the TRS changing and an event logged. If
the signal stays changing only a single event will be logged. If the SDI signal
has a static line count and line length for 5 seconds, a TRS OK event will
be added to the log. This reduces the number of log events for a bad SDI
signal.
Picture CRC This should only be used for static single frame test patterns (do not use
for Zone Plate, dynamic broadcast signals or CheckField/Pathalogical
test patterns which are two frames long at HD). This can be used to log
changes in the CRC for the active picture (a value which is unique for each
test pattern). If the CRC changes and was previously OK an error is added
to the event log. If the CRC is the same as the last frame for 5 seconds an
OK event will be added to the event log. Thus, if the active picture CRC
is continuously changing there will only be one event in the log until the
picture remains static when an OK event will be added.
2–54 PHRX2000-200 2Menu Reference 08/12
 Loading...