

Page 1
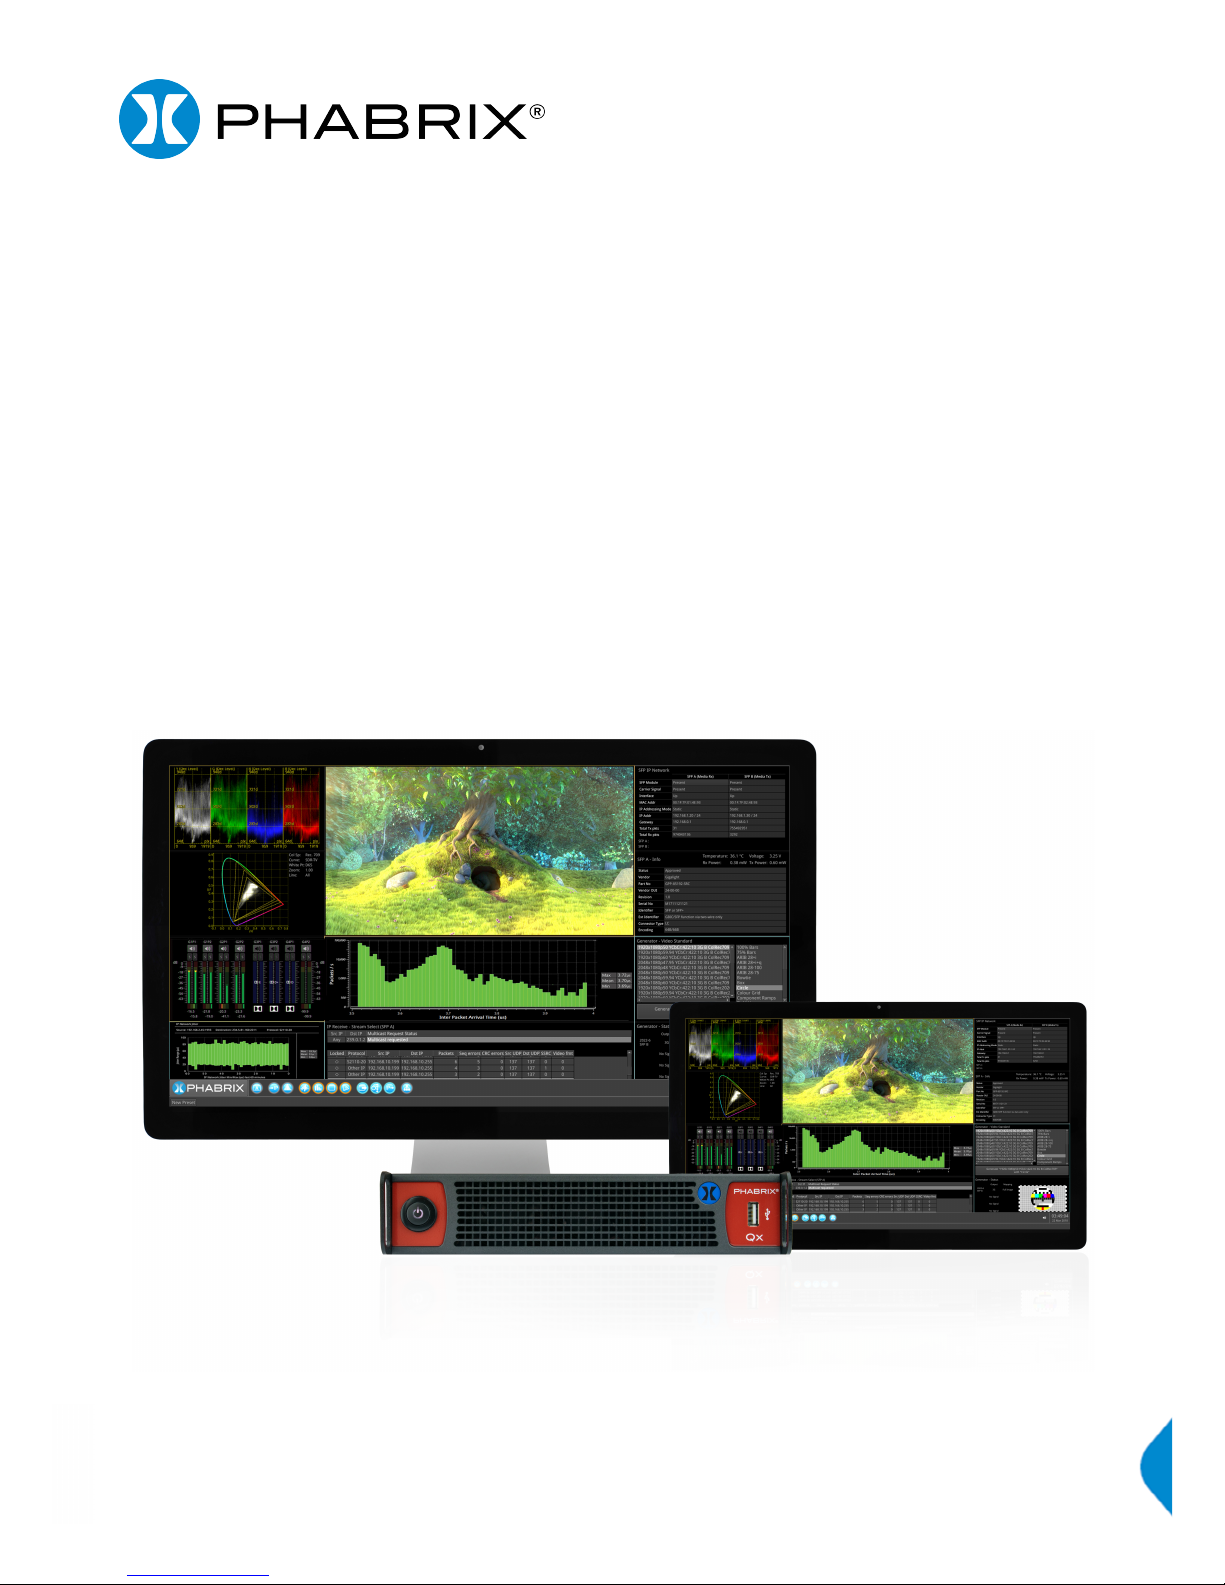
Qx IP I Qx 12G
USER MANUAL
Software Release 2.5
Manual Revision 10
Page 2

Page II PHABRIX Qx User Manual
Page 3

About this Manual
Notice
The information in this document has been produced by PHABRIX Ltd with care and is believed to be
accurate. PHABRIX Ltd does not assume responsibility for loss or damage resulting from errors, omissions or
inaccuracies herein. This document is subject to change, and revisions may be made and issued to include
such changes.
No part of this document may be reproduced, stored in a retrieval system, or transmitted in any form or by
any means, electronic, mechanical, recorded or otherwise without the prior written consent of PHABRIX Ltd.
Copyright © PHABRIX Ltd. All rights reserved. Software products licensed are owned by PHABRIX Ltd and
are protected by international treaty provisions and national copyright laws.
HDMI ® is the registered trademark of HDMI Licensing and is used within the document for identification
purposes only.
PHABRIX Qx User Manual Page III
Page 4

Revision
This manual is a revision controlled document. Any changes to any page content will be reflected in the
overall revision status of the whole manual.
Release Date Software Version Updates including:
1 23 Jan 2017 1.0.0.196 First release of manual
2 21 Mar 2017 1.0.1.227
Addition of Waveform, Vectorscope, HDMI audio and
new video standards.
3 20 Jun 2017 1.0.2
Reference locking support with Output offset
adjustment. Input timing against reference with Input
Measurement Offset.
4 21 Aug 2017 1.0.3
HDR Heat-map, CIE 1931 x y Chart, HDR/WCG
additions for Waveform and Vectorscope, and new
PQ video standards. REST API for remote control
and automation. CRC Analysis frame change
detection added.
5 7 Sep 2017 1.0.3 Driver Calibration description
6a 6 Nov 2017 2.0
New 2022-6 IP instrument suite. Support for 1.5 & 3G
standards over IP. Support for IP Transmit reference
locking. IP Decapsulated SDI timing against
reference with Input Measurement Offset. SDI/IP
mode firmware switching. CIE Chart pan and zoom.
7 21 Dec 2017 2.0.1 32 channel Audio Generation. Extended REST
API support for audio generation, and CRC error
reporting. Cursors linking Picture, Dataview, and
Waveform. Qx factory default setting.
8 4 May 2018 2.2
Screen capture, moving test patterns, layout Presets,
VNC, SFTP, web browser. New HLG video standards,
new Rec. 2020 support, PsF video standards. Audio
monitoring on SDI Instrument Output. Diffuse White
Marker in Waveform for HDR standards. Extended
REST API support for 2022-6 IP instrument suite.
9d 10 Sep 2018 2.4
Advanced SDI Stress Toolset: Advanced SDI
Generation control & analysis, Jitter Insertion, PRBS
Mode, Pathological Detect with GPI triggering. Sync
Bit Removal, SDI output copy, Image parameter
overrides moved to 'Analyzer - Video Standard', input
cable length measurement, extended CRC Analysis
features. New Rec. 2020 SDR video standards, new
S-Log3 video standards, new ITU-R test patterns for
HDR. Nits graticule for SDR (Gamma), HLG, PQ, SRLive, S-Log3 added to Waveform, Rec.2020 targets in
Vectorscope. User markers added to Vectorscope
and Waveform; centre on Vectorscope markers.
Vectorscope Cb Cr markers displayed in Waveform.
10 7 Feb 2019 2.5 Generator Configuration (New UI with Video and Audio
tabs), enhanced support for user test image files, 12GSDI SFP Support for dual Rx, dual Tx and transceivers.
Loop SDI In-to-Out (BNC). ANC Inspector, enhanced
ANC Status, AES IO Config, Audio Channel Status,
Generator Status (audio status added), OP47 Closed
Captions display in Picture. Customizable positioning
of Nits V Scale in Waveform.
Page IV PHABRIX Qx User Manual
Page 5

PHABRIX® Limited
Omega House
Enterprise Way,
Thatcham, Berkshire
RG19 4AE
United Kingdom
phone + 44 (0)1635 873030
email: support@phabrix.com www.phabrix.com
PHABRIX Qx User Manual Page V
Page 6
General
Package Contents
The shipping box should contain the following:
PHABRIX Qx 12G unit: PHQX01 or PHQX01E (with Physical Layer Analysis) or
PHABRIX Qx IP unit: PHQX01-IP or PHQX01E-IP (with Physical Layer Analysis);
Power Supply Unit;
Mains lead;
PHABRIX USB Key
General Safety
Avoiding Personal Injury
This instrument is designed for use by qualified personnel only.
No user serviceable parts are provided. Units should be returned to your local PHABRIX agent
for servicing.
The Operator should NOT remove the case from the unit.
Do not spill any liquid onto the unit or its power adaptor.
Power Supply
Make sure that the unit is connected to the correct power supply voltage. A power supply adaptor is
supplied with the unit which may be connected to any AC power supply between 100 and 240VAC at 5060Hz. Only the supplied power adaptor should be used with the unit. Do not use a damaged AC cable
with the unit as it may cause a shock or fire hazard. Replacement AC cables are available from your local
PHABRIX agent.
How to Upgrade Software
New software releases will be made available regularly as the product is developed.
Software downloads are approximately 100 MB and can be found in the Support area of the PHABRIX
website currently located at www.phabrix.com/support.asp
Download the .ZIP file.
Extract and copy the ‘phab_qx_upgrade.bin’ file to the root directory of a FAT32 formatted USB stick.
Make sure the unit is turned OFF before upgrading.
Insert the USB into the front panel USB port.
Press the power button TWICE in succession. The power button will glow pink when the upgrade procedure
begins. If the button does not glow pink then repeat the procedure.
The power button will flash several colors and the fans will be on full throughout the upgrade process.
Please wait approximately 4 minutes as the unit upgrades. It will automatically show the menu screen when
complete.
Page VI PHABRIX Qx User Manual
Page 7

Installation Environment
Operating Temperature
The unit should only be operated between 0 and 40 °Celsius non-condensing. If the
temperature is changed rapidly from a cold environment to a hot environment, moisture can be
created internally which can cause malfunction or damage the unit. Allow the unit to sit for 30
minutes without power applied to reduce any possibility of condensation. If the internal
component temperature rises above 85°Celsius the unit will turn OFF automatically.
Input/Output Terminals
Do not connect the input or output BNC connectors to external power as this can damage the internal
circuitry and cause the unit to work incorrectly.
The BNC connectors fitted on this unit are 75Ω type which are not compatible with 50Ω plugs.
The use of 50Ω plugs will permanently damage the connectors on the unit. The use of 50Ω
plugs is considered to be misuse of the equipment and will therefore invalidate the unit’s
warranty.
When Not In Use
Disconnect the unit from the power supply and AC power source when not in use.
Maintenance
Wipe the case gently with a soft cloth, lightly dampened with a neutral cleaning agent.
Remove the power supply from the unit and turn OFF before cleaning. Do not allow any water
or other liquid to enter the unit while cleaning.
RoHS Compliance
PHABRIX products are designed and manufactured using only RoHS compliant components and materials.
Therefore based on information provided by our suppliers, PHABRIX certifies that ALL products that it
manufactures are “RoHS-5” compliant and that they do not exceed the designated levels of lead, cadmium,
mercury, hexavalent chromium, polybrominated biphenyl (PBB) and polybrominated diphenyl ether flame
retardants (PBDE) legislated under the provisions of the “European Parliament and Council Directive” on the
“Restriction of the Use of Certain Hazardous Substances in Electrical and Electronic Equipment (2011/65/EC)”
and associated regulations collective known as the “RoHS Regulations”.
Disposal of Equipment
This product is subject to the European WEEE (Waste Electrical and
Electronic Equipment) directive and should be disposed of according to the
regulations of each country.
PHABRIX Qx User Manual Page VII
Page 8

Contents
About this Manual III
Notice III
Revision IV
General VI
Package Contents VI
General Safety VI
Avoiding Personal Injury VI
Power Supply VI
How to Upgrade Software VI
Installation Environment VII
Operating Temperature VII
Input/Output Terminals VII
When Not In Use VII
Maintenance VII
RoHS Compliance VII
Disposal of Equipment VII
Icon Display and Meaning XII
Getting Started 1
General Connections 1
Installation 1
SDI Connections 1
SDI Connection Configuration [SDI Modes] 1
SDI Input and Output Diagrams 3
SDI Inputs (BNC) 4
SDI Outputs (BNC) 4
SDI SFP Connections Overview 4
SDI Inputs (SFP) 5
SDI Outputs (SFP) 6
IP Connections 6
ST 2022-6 Input Optical SFP connection [Analyser - IP Mode] 6
Page VIII PHABRIX Qx User Manual
Page 9

ST 2022-6 Output Optical SFP connection [Generator - IP Mode] 6
Start up 7
Powering up the Qx 7
Menu selection 7
Instrument Launch Menu 7
Instrument Bar 9
Instrument Tabs 10
Instrument Navigation 10
About 11
Apply default settings 11
Switching Mode 12
Powering down the Qx 12
Instrument Description 13
Generate - Video 14
Test Patterns 15
User Test Patterns and Images 16
Pathological signal insertion 16
Output offset adjustment [SDI Modes] 16
Generate - Audio 17
Advanced Generation Tools [SDI Stress Mode] 18
SDI Scrambler 18
Sync Bit Insertion (12G / 6G) 18
PRBS Mode 18
Jitter Insertion 19
Driver & Output Control 19
Generator - Status 20
SFP IP Network [IP Mode] 21
IP Transmit (SFP B) [IP Mode] 22
Network Settings 22
SFP (A, B) - Info 23
System IO 24
PHABRIX Qx User Manual Page IX
Page 10

SDI Modes 24
IP Mode 26
AES IO Config 27
Analyzer - Video Standard 28
Ignore Payload Identifier Packets (ST 352) 28
Transfer Curve and Colorimetry Overrides 29
Sub Image Pixel Mapping Format Override 29
Stats - SDI In A, B, C, D [SDI Modes] 30
IP Receive - Stream Select (SFP A) [IP Mode] 31
Multicast Setup 31
IP Receive Interpacket Timing (SFP A) [IP Mode] 32
Stats - IP Receive (SFP A) [IP Mode] 32
Analyzer - Picture 33
Blanking Area 33
Closed Captions 34
Picture Cursor 34
HDR Heat-map (False Color Overlay) [PHQXO-HDR] 34
Analyzer - CIE Chart 36
Analyzer - Waveform 37
Analyzer - Vectorscope 38
Eye - SDI in A [SDI Modes] 39
Jitter - SDI in A [SDI Modes] 41
PRBS Analysis [SDI Stress Mode] 42
Analyzer - Dataview 44
Video Timing & System Reference 45
System Reference Lock 45
SDI A vs System Reference / Decapsulated vs System Reference 46
Input Measurement Offset 46
SDI Co-Timing [SDI Mode] 46
Analyzer - Ancillary Status 47
Analyzer - Ancillary Inspector 49
Analyzer - Audio Channel Status 51
Analyzer - Audio Meters 52
Page X PHABRIX Qx User Manual
Page 11

Analyzer - CRC Analysis 53
SFP (A, B) - Network Stats [IP Mode] 54
Event Logging 55
SDI Modes 55
IP Mode 55
Qx Network & Automation 56
REST API Requests 57
Time and NTP 58
Driver Calibration 59
SDI Output Calibration Steps 59
Remote Connection 60
Available Functionality 60
VNC 60
REST API 60
SFTP 61
Web Browser 61
Specifications 63
On-going Development 66
Supported SFP list 67
Supported SDI standards 68
PHABRIX Qx User Manual Page XI
Page 12

Icon Display and Meaning
AES IO Config Analyzer - CIE Chart
System IO Analyzer - CRC Analysis
SFP A - Info Analyzer - Data View
SFP B - Info Analyzer - Picture
Eye - SDI in A Analyzer - Vectorscope
Jitter SDI in A Analyzer - Waveform
PRBS Analysis Generator - Configuration
Stats - SDI in A Generator - Status
Stats - SDI in B Event Logging
Stats - SDI in C Qx Network & Automation
Stats - SDI in D SFP A - Network Stats
Video Timing & System Reference SFP B - Network Stats
Analyzer - Video Standard IP Receive - Stream Select (SFP A)
Analyzer - Ancillary Inspector IP Receive - Interpacket Timing (SFP A)
Analyzer - Ancillary Status Stats - IP Receive (SFP A)
Analyzer - Audio Channel Status IP Transmit (SFP B)
Analyzer - Audio Meters SFP IP Network
Page XII PHABRIX Qx User Manual
Page 13

Getting Started
General Connections
Installation
The rear of the unit shown above, describes the connections and interfaces of the Qx. Before turning on the
Qx, make sure the following connections are in place:
The XLR power cable is inserted.
For instrument display, connect a suitable 1920 x 1080 capable monitor to either the HDMI instrument output
or the SDI instrument output. Both display outputs carry the selected audio monitoring channel/pair. The
monitor output can be configured for 1080p60, 1080p59.94 or 1080p50 frame rates using the ‘Display
Options’ submenu of the ‘Instrument Launch Menu’. For mouse and keyboard control, the two USB ports at
the rear of the unit should be used.
Note: The following interface is unavailable in this release of software:
l LTC In
SDI Connections
Introduced in this software release, a choice of two SDI connector types – BNC and SFP – is available for the
flow of SDI signals in and out of the Qx unit.
SDI Connection Configuration [SDI Modes]
Select the SDI connector configuration you require in the ‘System IO’ instrument submenu (‘SDI Input Source’
and ‘SDI Out’). A choice of two SDI connector types – BNC and SFP – is available.
The following combinations are available:
l BNC in / BNC out
l SFP in / SFP out
l BNC in / SFP out
l SFP in / BNC out
Note: The Qx default SDI connector state is BNC in / BNC out.
PHABRIX Qx User Manual Page 1
Page 14

Note: Use SDI SFP's approved by PHABRIX. An error message window will appear on the Qx screen if an
incompatible SFP is inserted.
Page 2 PHABRIX Qx User Manual
Page 15

SDI Input and Output Diagrams
INPUTS
BNC's: Lead with Input A
SFP's: Use any input
Note: It will take marginally longer for the Qx to lock to SDI Input signals received via SFP than those received
via BNC.
OUTPUTS
BNC's: ‘Output Copy’ optional
SFP's: Output copy functionality always on
Note: The Qx 'Loop' feature is available with SDI connector configuration BNC in / BNC out only.
PHABRIX Qx User Manual Page 3
Page 16

SDI Inputs (BNC)
The Physical Layer input connection for eye and jitter is the rightmost BNC (when viewed from the rear) with a
red nut. This provides the multirate eye and jitter connection from 1.5G HD-SDI to 12G-SDI. There are four 12GSDI capable input BNCs for the analyzer: SDI IN A, B, C, D.
Up to four SDI inputs may be connected at any one time, however the system will automatically determine
the signal set to analyze - be it single link, dual link, or quad link - based on the SMPTE ST 352 packets
present. The algorithm looks to ‘SDI IN A’ first and then determines the overall standard.
If the SMPTE ST 352 packets are known to be incorrect then the user has the option to select ‘Ignore
payload identifier packets (ST 352)’ in the ‘Analyzer - Video Standard’ window.
This software release introduces SDIBNC In -to- SDI BNCOut signal passthrough via the 'Loop' feature in
'System IO', making the input SDIsignal(s) available on the SDI BNCoutput connection.
SDI Outputs (BNC)
The generator provides up to four SDI output signals which must form part of the same video signal set.
When 'SDI BNC Out - Generator Output Copy' mode' is enabled it will provide either:
l x4 single link
l x2 dual link
l x1 quad link
‘SDI OUT A’ is always present and carries the first signal in the group. ‘SDI OUT B’ is active for dual link
standards, and ‘SDI OUT C’ and ‘SDI OUT D’ are active for quad link standards.
If ‘Output Copy’ mode is not enabled, a single instance of a link standard will be generated:
l x1 single link
l x1 dual link
l x1 quad link
When the ‘Loop’ feature is enabled, the Qx generator wil be disabled, and instead, the SDI BNC Outputs will
be provided as output signals the SDI BNC Input signals the Qx is receiving. The 'SDI BNC Out - Loop SDI BNC
In' internal passthrough signal routing works as follows:
l ‘SDI BNC In A’ -> ‘SDI BNC Out A’
l ‘SDI BNC In B’ -> ‘SDI BNC Out B’
l ‘SDI BNC In C’ -> ‘SDI BNC Out C’
l ‘SDI BNC In D’ -> ‘SDI BNC Out D’
Note: The 'Output Copy' feature cannot be used at the same time as the 'Loop' feature. Enabling the 'Loop'
feature disables the generator activity on the SDI BNC outputs, and overrides 'Output Copy'.
Note: The 'Loop' feature is available when both the 'SDIInput Source' and 'SDI Out' are set to 'BNC' only.
('System IO' SDI connector configuration: BNC in / BNC out.)
SDI SFP Connections Overview
The Qx has two available SFP slots that can be used for SDI SFPs. These slot are labelled SFP+A and SFP+B.
Each slot can house an SFP that itself has one or two signal lanes.
The signal lane can either be an Rx (receiver/input) or Tx (transmitter/output).
Page 4 PHABRIX Qx User Manual
Page 17
With two SDI SFPs inserted, between 2 to 4 SDI IOs via SFP are available. The number of these that are
inputs or outputs will depend on the SFP types that have been inserted. The Qx can take the following SFP
types in both SFP+A and B slots:
l RxRx (Dual Receiver – x2 Inputs)
l TxTx (Dual Transmitter – x2 Outputs)
l RxTx (Transceiver – x1 Input, x1 Output)
l Rx (Single Receiver - x1 Input)
l Tx (Single Transmitter - x1 Output)
An RxRx RxRx combination would provide x 4 inputs, TxTx TxTx provides x 4 outputs, Tx RxTx provides x 2
outputs and x 1 input, …and so on.
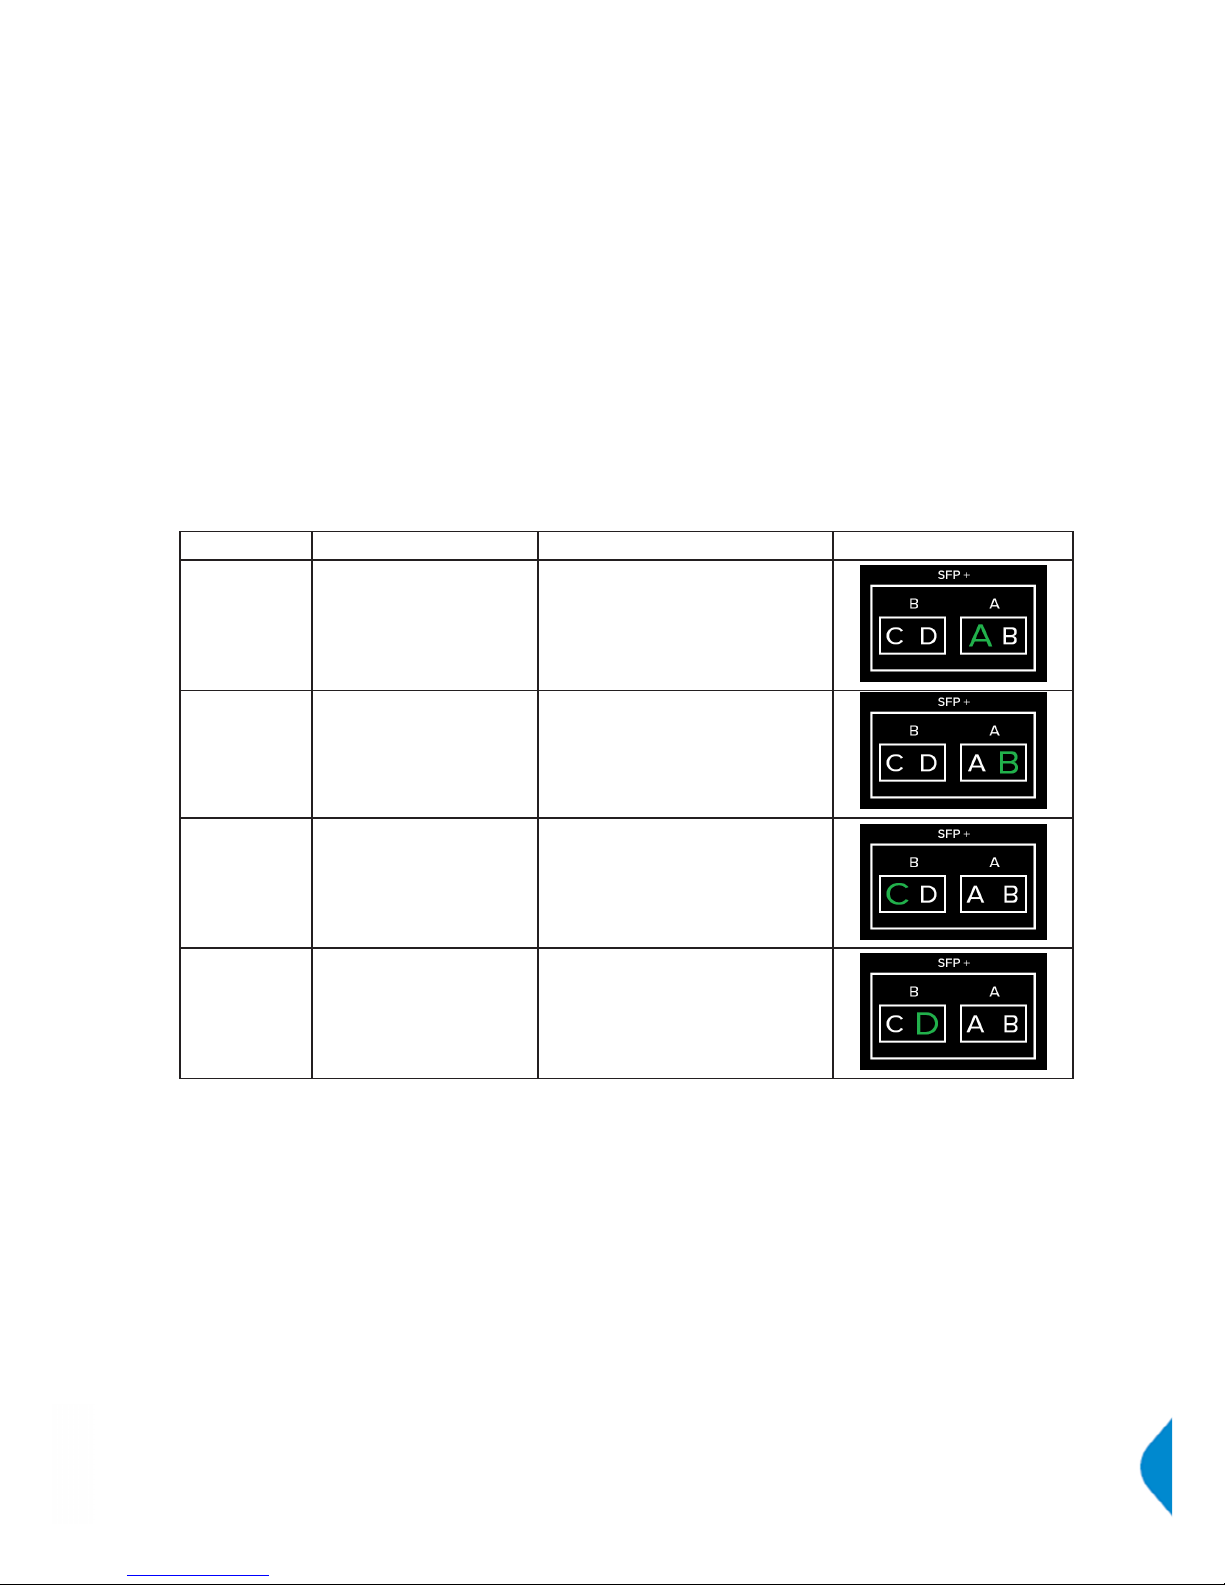
Installed SDI SFP signal lane positions are mapped to Qx system internal SDI paths as outlined below.
Whether a lane is an input or output is dependent on the SFP type installed:
SFP+ Slot Lane Position Qx Mapping 'System IO' Rear Image
SFP+A Left SDI IO A
(Input or Output depends on SFP
type. E.g. For an RxTx SFP in slot
SFP+A, this would be SDI In A.)
SFP+A Right SDI IO B
SFP+B Left SDI IO C
SFP+B Right SDI IO D
Note: Use SDI SFP's approved by PHABRIX. An error message window will appear on screen if an
incompatible SFP is inserted.
Note: See ‘Supported SFP List’ section of this manual for list of SFP’s approved by PHABRIX.
SDI Inputs (SFP)
Both SFP+A and SFP+B can be used as receive connections for SDI. Dependent on the SDI SFP types used,
up to x4 SDI input connections from 1.5G HD-SDI to 12G-SDI are available. The analyzer provides up to four
12G-SDI capable input: SDI IN A, B, C, D.
Up to four SDI inputs may be connected at any one time, however the system will automatically determine
the signal set to analyze - be it single link, dual link, or quad link - based on the SMPTE ST 352 packets
present. The algorithm looks to the first available ‘SDI IN’ (in alphabetical order) and then determines the
overall standard.
If the SMPTE ST 352 packets are known to be incorrect then the user has the option to select ‘Ignore
payload identifier packets (ST 352)’ in the ‘Analyzer - Video Standard’ window.
PHABRIX Qx User Manual Page 5
Page 18

Note:Use of SDISFP's for Eye and Jitter analysis and the 'Loop' signal passthrough feature is not supported.
SDI Outputs (SFP)
Both SFP+A and SFP+B can be used as transmit connections for SDI. Dependent on the SDI SFP types used,
up to x4 SDI output connections from 1.5G HD-SDI to 12G-SDI are available.
By default, internally, within the Qx, the generator provides four SDI output signals which must form part of the
same video signal set. Even when a single link standard is generated by a user, 'Generator Output Copy'
behaviour is implemented for SDISFP's automatically. The generator will provide either:
l x4 single link
l x2 dual link
l x1 quad link
On the internal SDI output signal paths of the Qx:
l a single link standard will always be carried on ‘SDI OUT A’, and then repeated on ‘SDI OUT B’, ‘SDI
OUT C’, and ‘SDI OUT D'
l a dual link standard... on ‘SDI OUT A’ and ‘SDI OUT B’, and then repeated on ‘SDI OUT C' and ‘SDI
OUT D'
l and a quad link standard will be delivered using all four outputs: ‘SDI OUT A’, ‘SDI OUT B’, ‘SDI OUT
C', and ‘SDI OUT D'
Which of these internal SDI output signal paths are utilized as externally available SDI outputs will depend on
the SFP types installed. See ‘SDI SFP Connections Overview' section of this manual for more details.
IP Connections
ST 2022-6 Input Optical SFP connection [Analyser - IP Mode]
The receive connection for IP video is SFP+A. This is the right hand most SFP when viewed from the rear.
This provides the multirate 2022-6 IP video analyzer connection from 1.5G HD-SDI to 3G-SDI over IP.
If the SMPTE ST 352 packets are known to be incorrect then the user has the option to select ‘Ignore
payload identifier packets (ST 352)’ in the ‘Analyzer - Video Standard’ window.
ST 2022-6 Output Optical SFP connection [Generator - IP Mode]
The transmit connection for IP video is SFP+B. This is the left hand most SFP when viewed from the rear.This
provides the multirate 2022-6 IP video packet generation from 1.5G HD-SDI to 3G-SDI over IP.
Note: For both SFP+A and SFP+B, use optical SFP's approved by PHABRIX. Use of incompatible SFP's will
lead to an error message window appearing on the Qx screen when powered up.
LC to LC optical multi-mode duplex fiber cables should be used. Cables of the following specifications are
approved by PHABRIX: OM1 (62.5/125), OM2 (50/125), OM3 (50/125), and OM4 (50/125).
Page 6 PHABRIX Qx User Manual
Page 19

Start up
Powering up the Qx
When the ‘Power Button’ on the Qx is first pressed, the unit fans will cycle for 20-30 seconds at high speed
as the system boots, then settle to their normal operating speed.
Menu selection
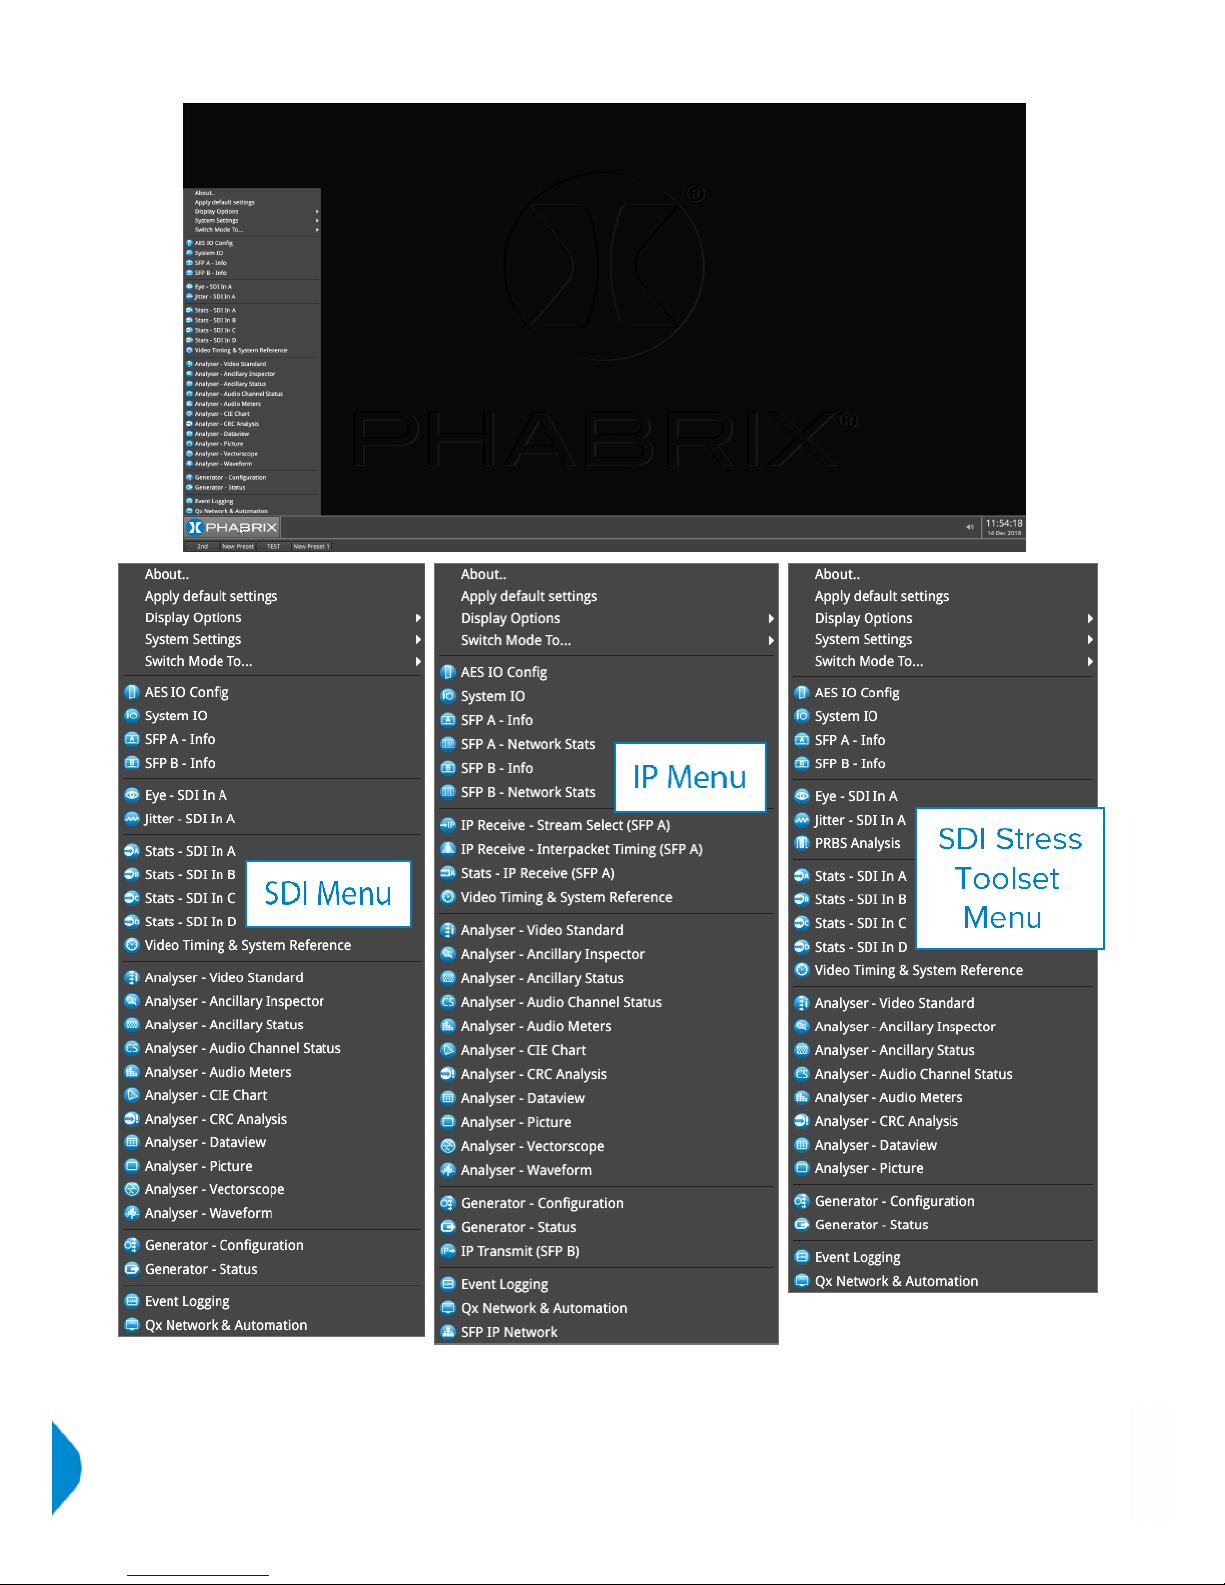
The following menu screen will be displayed after power up:
To activate the ‘Instrument Launch Menu’, click the PHABRIX symbol in the left hand corner of the Instrument
taskbar.
To hide the ‘Instrument Bar’, left-click within its blank area. Bringing the cursor to the bottom of screen reenables the ‘Instrument Bar’. A ‘Preset Bar’ can be created below the ‘Instrument Bar’.
Instrument Launch Menu
The unit has three possible boot modes: IP, SDI, and SDI Stress. On start up, you will see one of the following
menus, depending on the boot mode, and licenses applied to the unit:
PHABRIX Qx User Manual Page 7
Page 20
As each instrument is selected, an icon will be placed on the ‘Instrument Bar’.Each instrument window frame
and icon will be assigned a color.Each icon and instrument border will glow in the assigned color to indicate
that it is part of a ‘group’ of instruments related to Analyzer, Generator, or System. This color coding provides
easy identification of instrument type. This color ‘Window Frames’ option can be disabled via ‘Display
Options’ in the ‘Instrument Launch Menu’.
Page 8 PHABRIX Qx User Manual
Page 21
System instrument borders and icons glow white. With the ‘Window Frames’ option in ‘Display Options’
enabled, the colors of the Analyzer group and Generator group of tools can be set:
l Analyzer tools color select > [color]
l Generator tools color select > [color]
Color selection is via the HSV (Hue, Saturation, Value) tool shown above using two cursors. The left-hand
color rectangle allows selection of hue (horizontal) and saturation (vertical). The right-hand vertical bar selects
the color lightness.
Instrument borders automatically merge by group color. If one instrument is placed next to another in the
same group, then the border will outline all instruments of a common group in contact with each other to aid
group recognition.
Within instrument windows, signal connectors when active will glow in the Analyzer color to indicate an input
or the Generator color to indicate an output.
Instrument Bar
All instrument windows can be closed simultaneously by right-clicking the ‘Instrument Bar’ to reveal its
submenu, and then selecting ‘Close All Windows’.
In the right-hand corner of the Instrument Bar is the audio monitoring Source icon, and the Time & Date
display.
The audio monitoring icon controls the audio monitoring output of the unit, whether monitoring via HDMI, SDI
instrument monitor output, or 26-way D-type. Click once to mute/unmute. Hovering over the icon reveals the
current audio Source channel/pair selected, and right-clicking the icon additionally reveals an adjustable
sliding volume bar. The audio monitoring source can be selected via the ‘Analyzer - Audio Meters’
instrument.
Right-click the time and date display to reveal submenu for settings modification.
PHABRIX Qx User Manual Page 9
Page 22
For ease of use and convenience, multiple display layouts can be saved as presets, allowing users to save
bespoke layouts for different operational tasks – accessible from the ‘Preset Bar’ in one click. Once a user
has organized the screen with the instruments they require, a preset can be saved by right-clicking the
‘Instrument Bar’ and selecting ’Save System State As Preset’ from the submenu.
The ‘Preset Bar’ will appear below the ‘Instrument Bar’, with the current screen layout saved as a preset of
default name ‘New Preset’. To rename the preset as desired, right-click the preset button and select
‘Rename Preset’. A prompt window will appear allowing the renaming of the preset by USB keyboard, as
required.
Note: An on-screen keyboard is not provided in this software version.
To save further layout presets, organize the screen as required, and repeat as above.
Selection buttons for all saved presets are available in the ‘Preset Bar’.
To delete a preset, right-click its preset button, and select‘ Delete Preset’. A confirmation dialog box will
appear. To confirm deletion, select ‘Delete’. If you no longer wish to delete the preset, select ‘Cancel’.
To automatically hide the Preset bar from view, right-click the ‘Instrument Bar’ or 'Preset Bar' and check the
‘Auto-hide Presets’ checkbox. To display the ‘Preset Bar’, uncheck the ‘Auto-hide Presets’ checkbox.
Instrument Tabs
This software revision introduces user interface design enhancements. This redesign simplifies and speeds
up the user experience.
As an improvement to the classical Qx instrument user interface, configuration instruments now feature tabs,
providing intuitive grouping and easy access to fundamental settings. Tabs allow for multiple, easy to reach
windows in the same instrument. Submenus are reserved for related auxiliary settings.
As seen in ‘Generator - Configuration’ below, there is now one tab for video generation, and a separate tab
for audio generation.
Tabs are now also employed to provide alternative displays of analysed data, as seen in the Grid View and
List View option in the ‘Analyzer - Ancillary Status’ instrument.
Instrument Navigation
Each instrument also has a submenu. The submenu is activated by right-clicking the mouse in the window,
enabling a drop-down configuration menu. Click and drag on the gray bar at the top of the submenu to move
it. In addition to window-specific commands, the option to ‘Close’ the instrument is provided in its submenu;
as is the option to ‘Dismiss’ the submenu.
Example of drop-down submenu on right mouse click:
Page 10 PHABRIX Qx User Manual
Page 23
right-click mouse for additional drop- down menus
There is also the option to take a screenshot of the entire display by selecting ‘Take Screenshot’ in the
submenus of any instrument and of many dialog windows belonging to instruments. Alternatively, via a
keyboard, press ‘SHIFT+PrtScn’. Screenshots, in PNG format, can be retrieved from the Qx via a web browser
or SFTP interface.
Note: To successfully take a screenshot, VNC must first be disabled in the ‘Qx Network & Automation‘
instrument submenu.
Certain 'Dialog' windows (About, False colour ranges, Driver Calibration, etc.) also have right-click menus with
options to take a screenshot, dismiss the menu, and close the dialog window.
Double-clicking within a window will cycle through a set of standard instrument sizes. In many cases, the size
of a window can be further adjusted to suit requirements. Click and drag on an instrument’s surface to
reposition the instrument. For instruments with scrolling columns and rows, navigation is further aided by a
scroll control menu - revealed by right-clicking on the scroll bar.
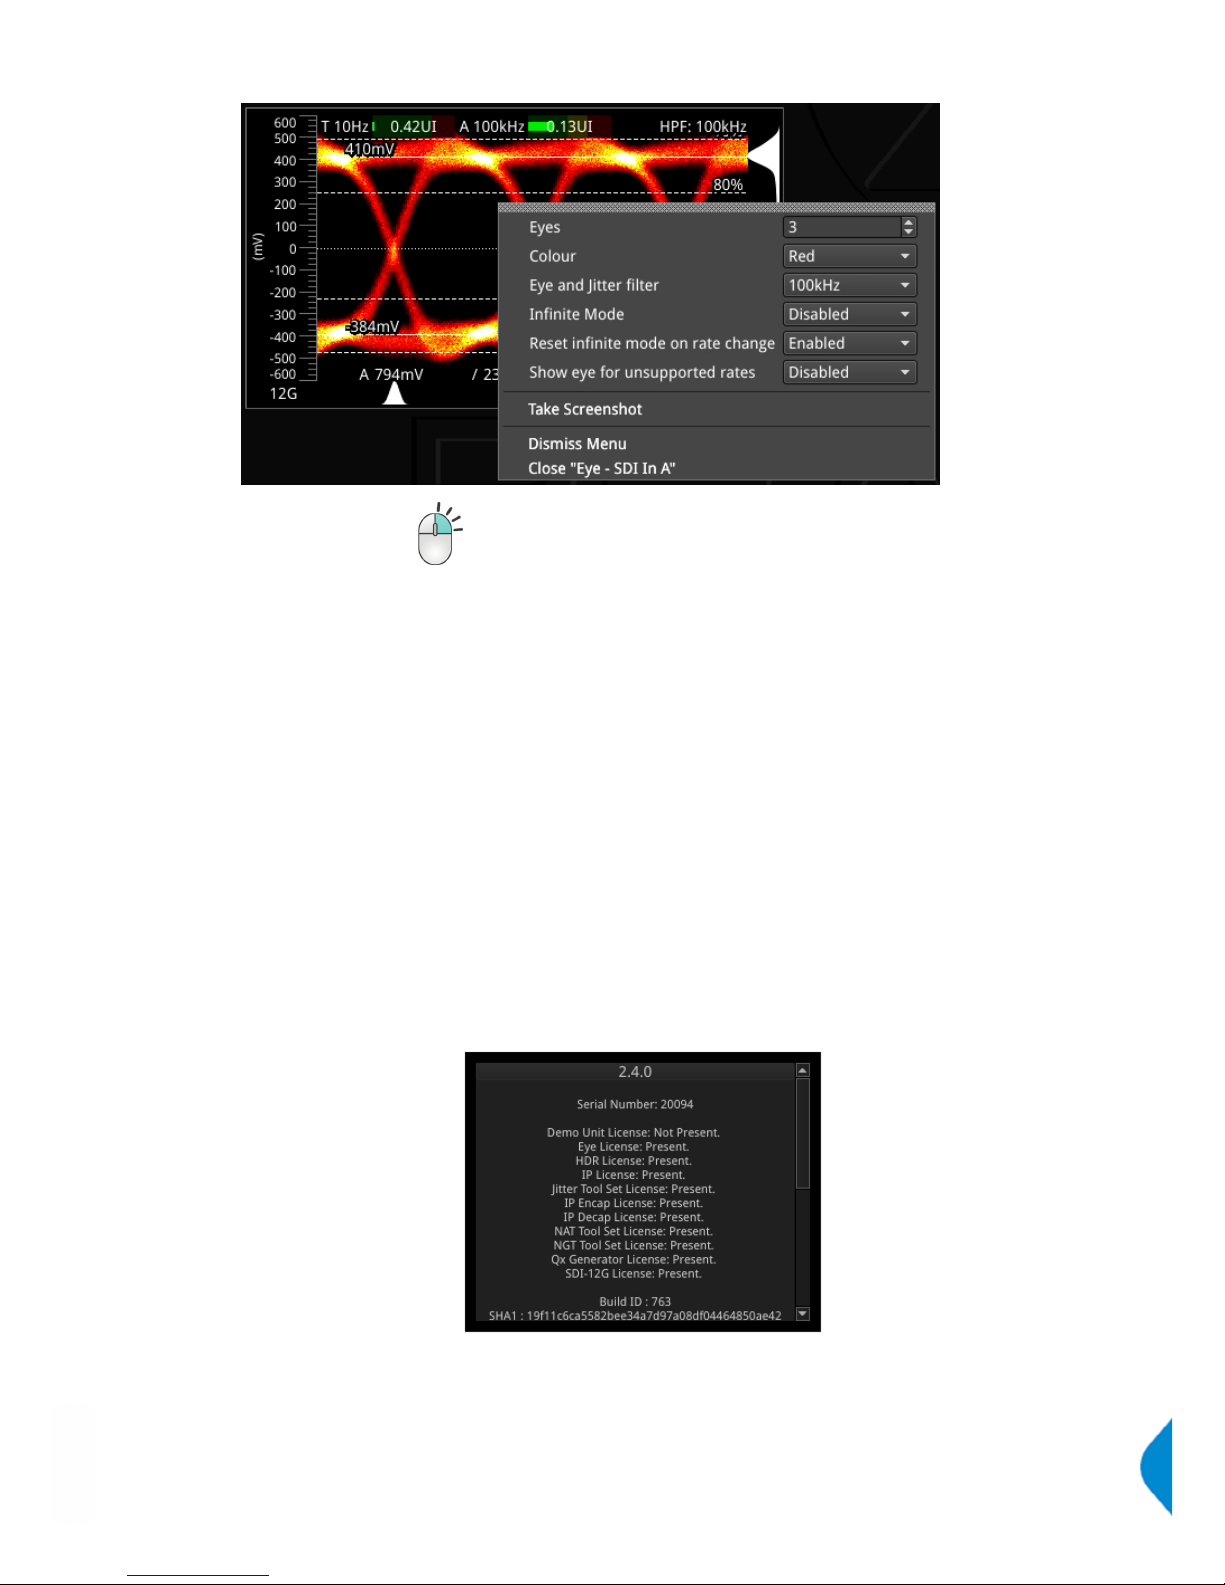
About
Selecting ‘About..’ in the Qx ‘Instrument Launch Menu, reveals a window containing information including: Qx
software version and build, Serial Number; and license, FPGA, and calibration details.
Apply default settings
Applying default settings in the Qx ‘Instrument Launch Menu’ will return the unit’s configuration to its factory
settings. A user will be asked to confirm this choice via an “Are you sure...” prompt box, before factory
defaults are restored.
PHABRIX Qx User Manual Page 11
Page 24
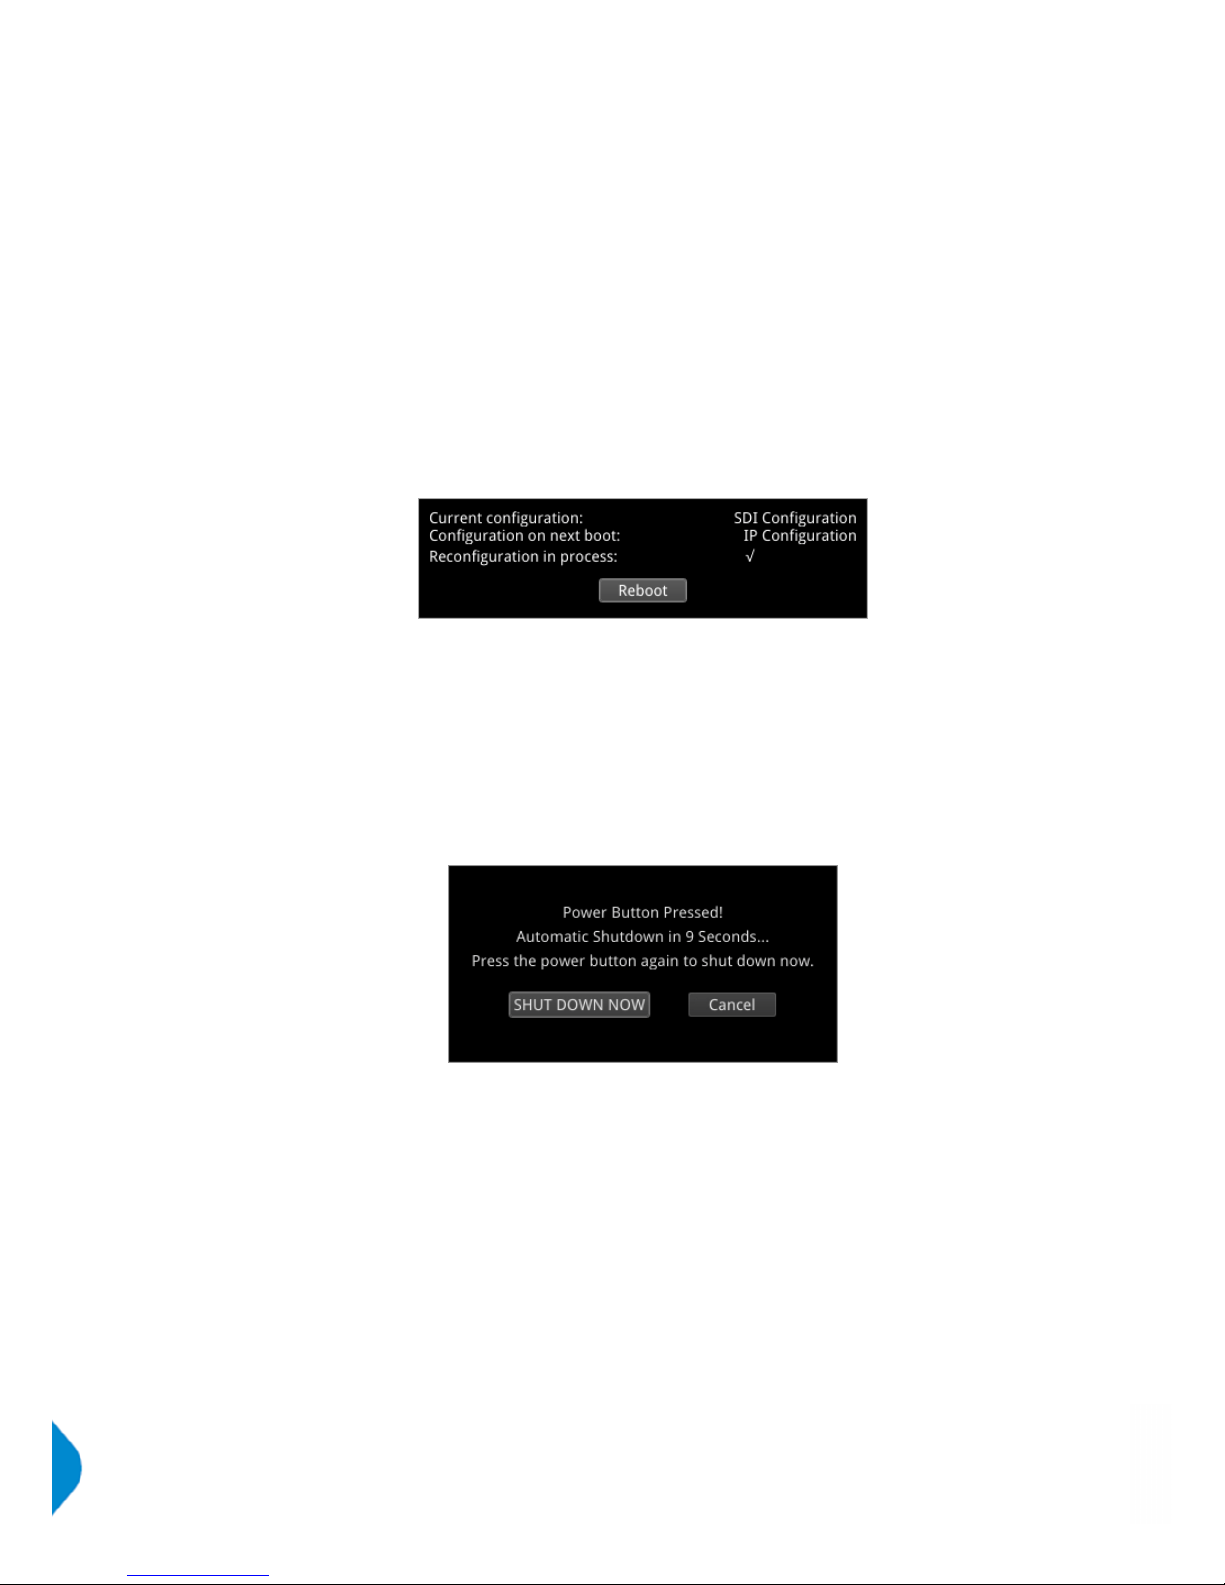
Switching Mode
A Qx IP or Qx 12G, dependent on license, can be run in three different firmware boot up modes: SDI, IP, and
SDI Stress Toolset. The Qx operation mode is switched via the 'Switch Mode To...' option in the ‘Instrument
Launch Menu’. Depending on the current mode of operation and licenses installed, the options will be the
following:
l Switch Mode To... IP
l Switch Mode To... SDI
l Switch Mode To... SDI Stress Toolset
Selecting one of these options will open a 'Switch Firmware' confirmation dialog box. To go ahead with the
switch request, select the 'Switch' button. To cancel the switch, select 'Cancel'.
The switch reconfiguration request will take approximately 1 minute and 45 seconds to complete, during
which time the ‘Power Button’ light at the front of the Qx chassis will flash yellow.
The ‘Power Button’ light will become a fixed yellow color (instead of white) once a ‘Configuration on next
boot’ reconfiguration request is complete; indicating that a mode switch request has been successful.
Selecting the ‘Reboot’ button will restart the Qx unit in the requested mode.
Powering down the Qx
When the ‘Power Button’ on the Qx is pressed, the unit will shutdown after 10 seconds. To shutdown
immediately, press the power button again or click the ‘SHUT DOWN NOW’ button that will appear in
the centre screen shutdown window. To stop shutdown, click the ‘Cancel’ button in the same window.
Page 12 PHABRIX Qx User Manual
Page 25
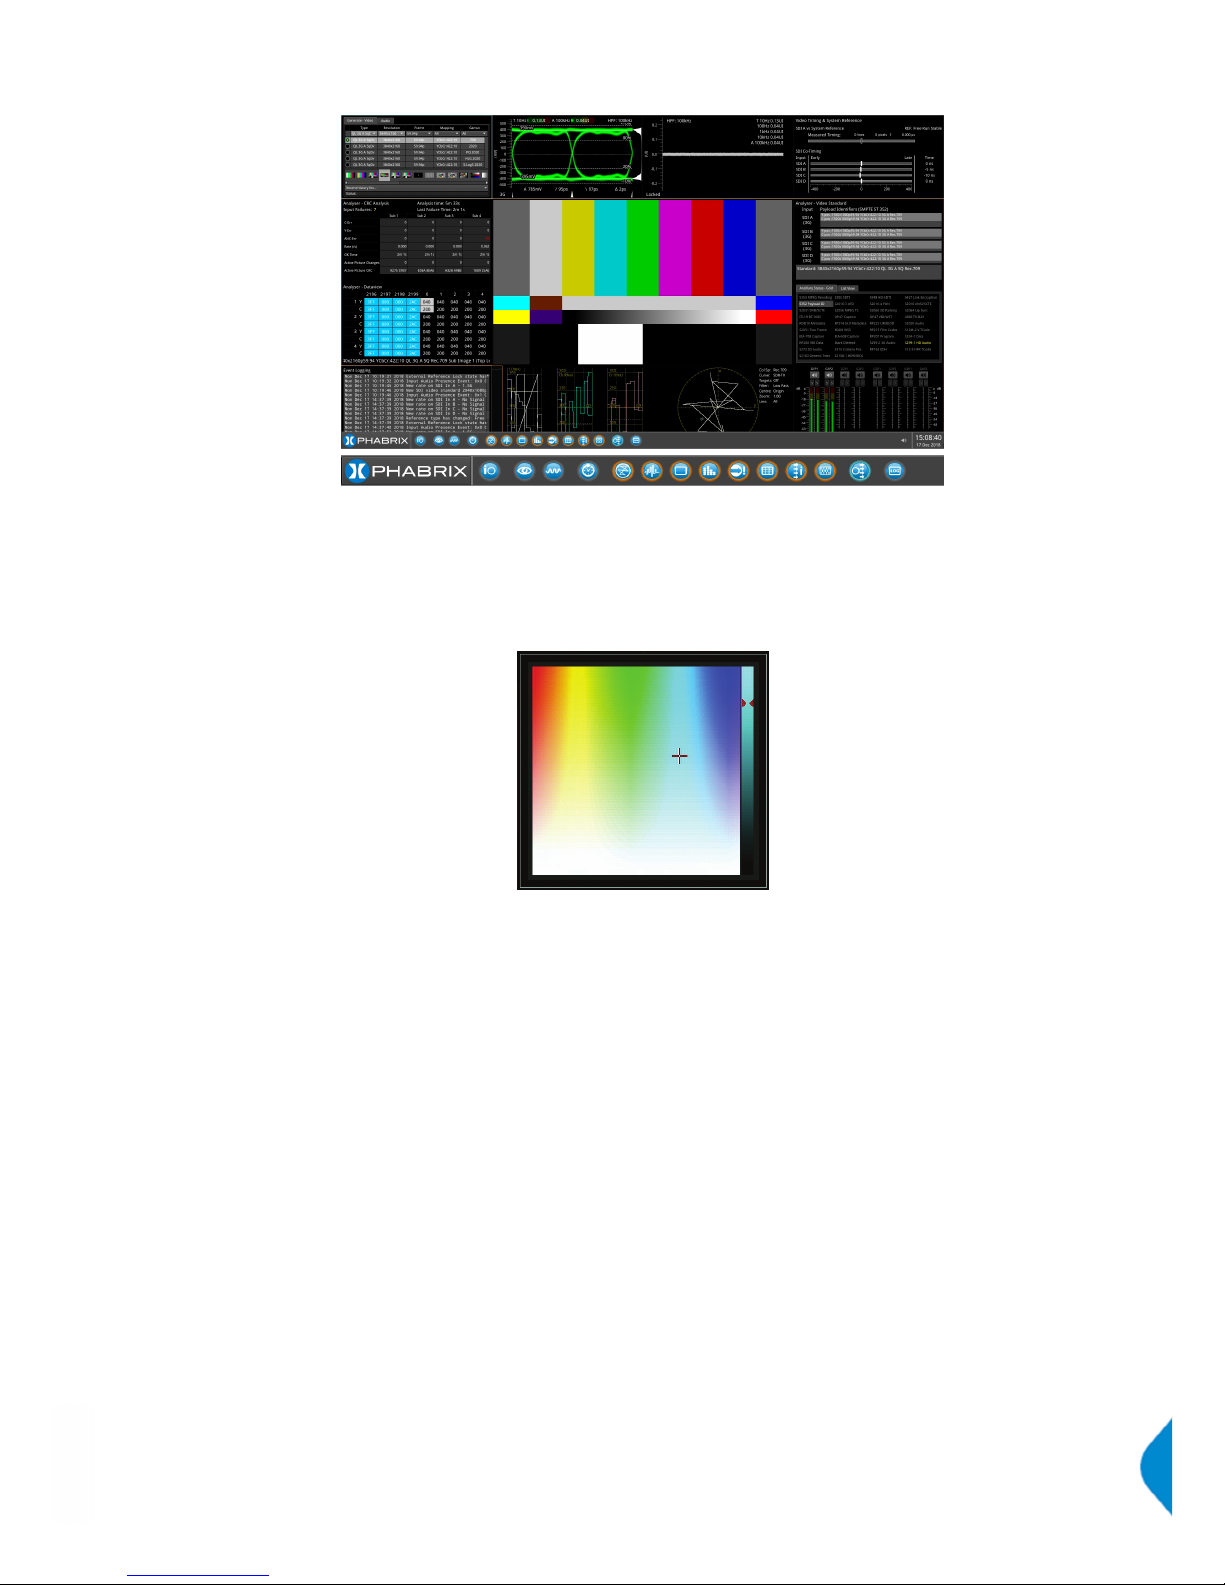
Instrument Description
The guide that follows is intended as an introduction to the menu selection and the toolset. The Qx has the
advantage of being a generator and an analyzer, so this tour of the product will be using both toolsets
simultaneously.
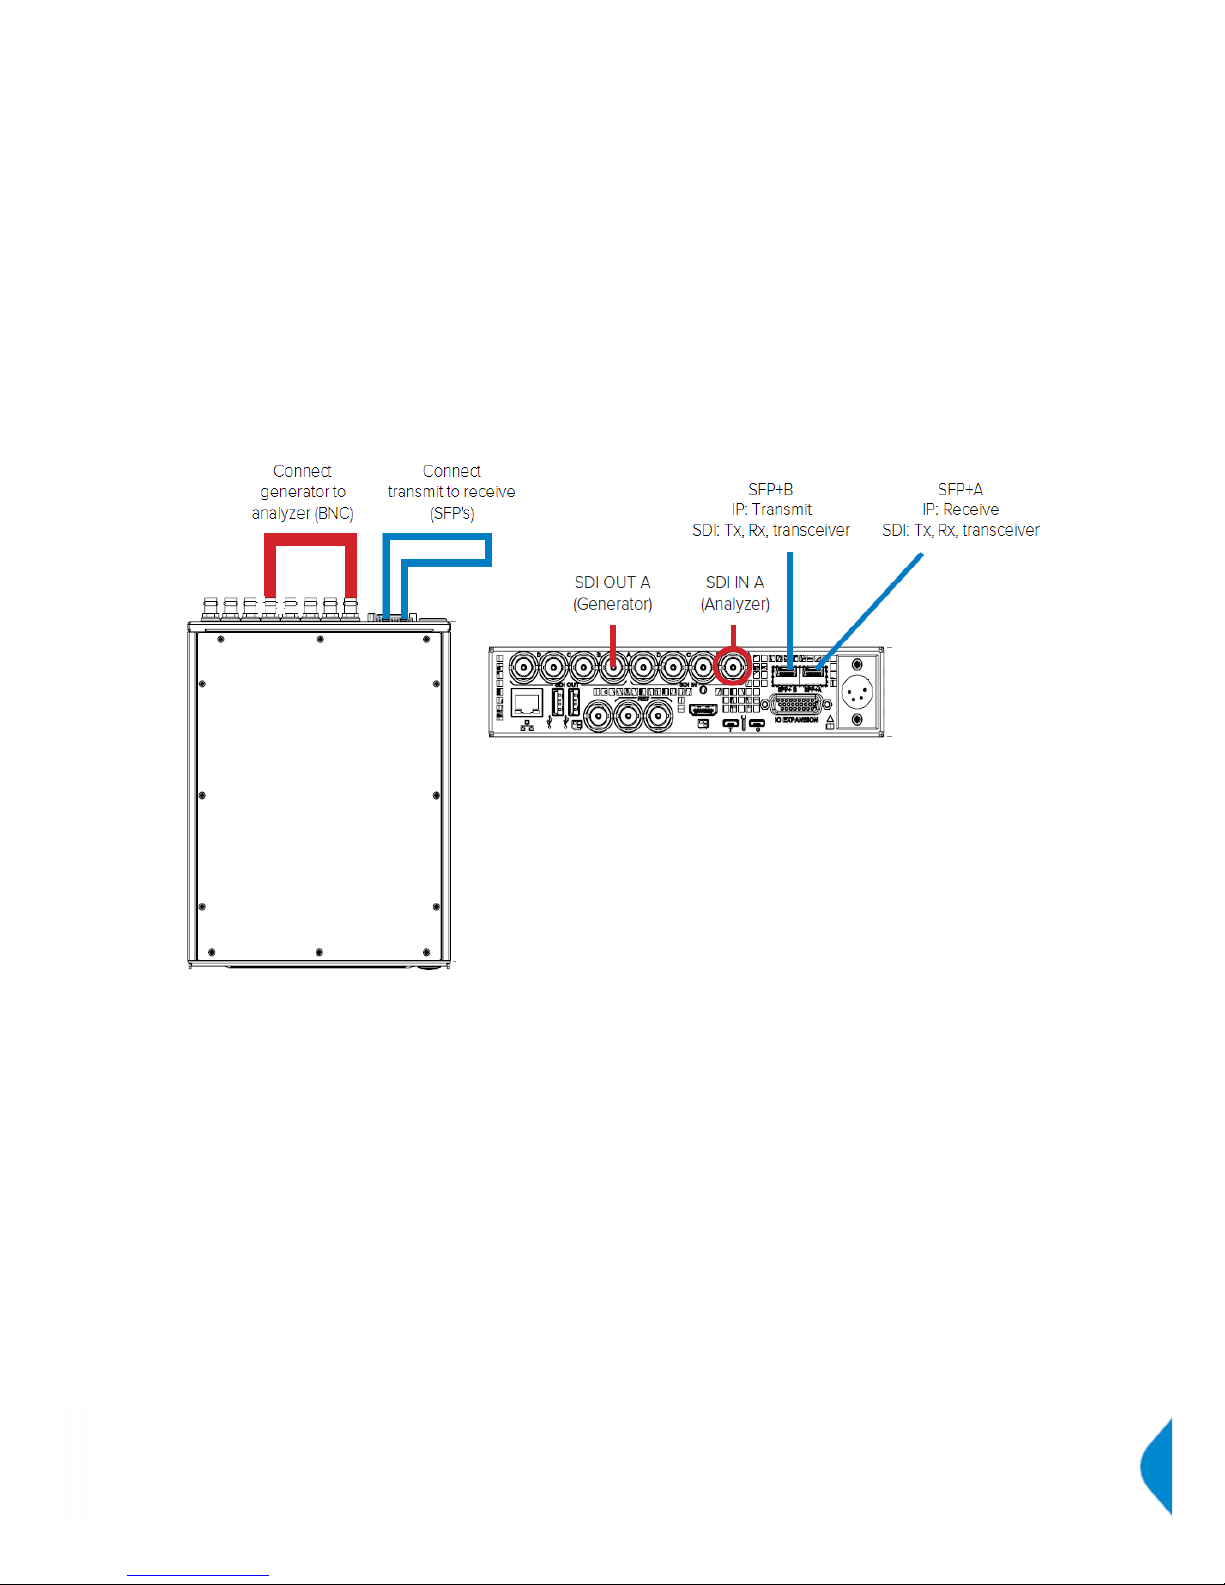
For this guide we will assume that you have connected the unit to itself as shown in the following diagram
for SDI (BNC or SFP) or IP optical SFP use. For dual link SDI standards also connect 'SDI OUT B' to 'SDI IN B',
and for quad link SDI standards, connect all four outputs SDI OUT A, B, C, D to SDI IN A, B, C, D respectively.
PHABRIX Qx User Manual Page 13
Page 26

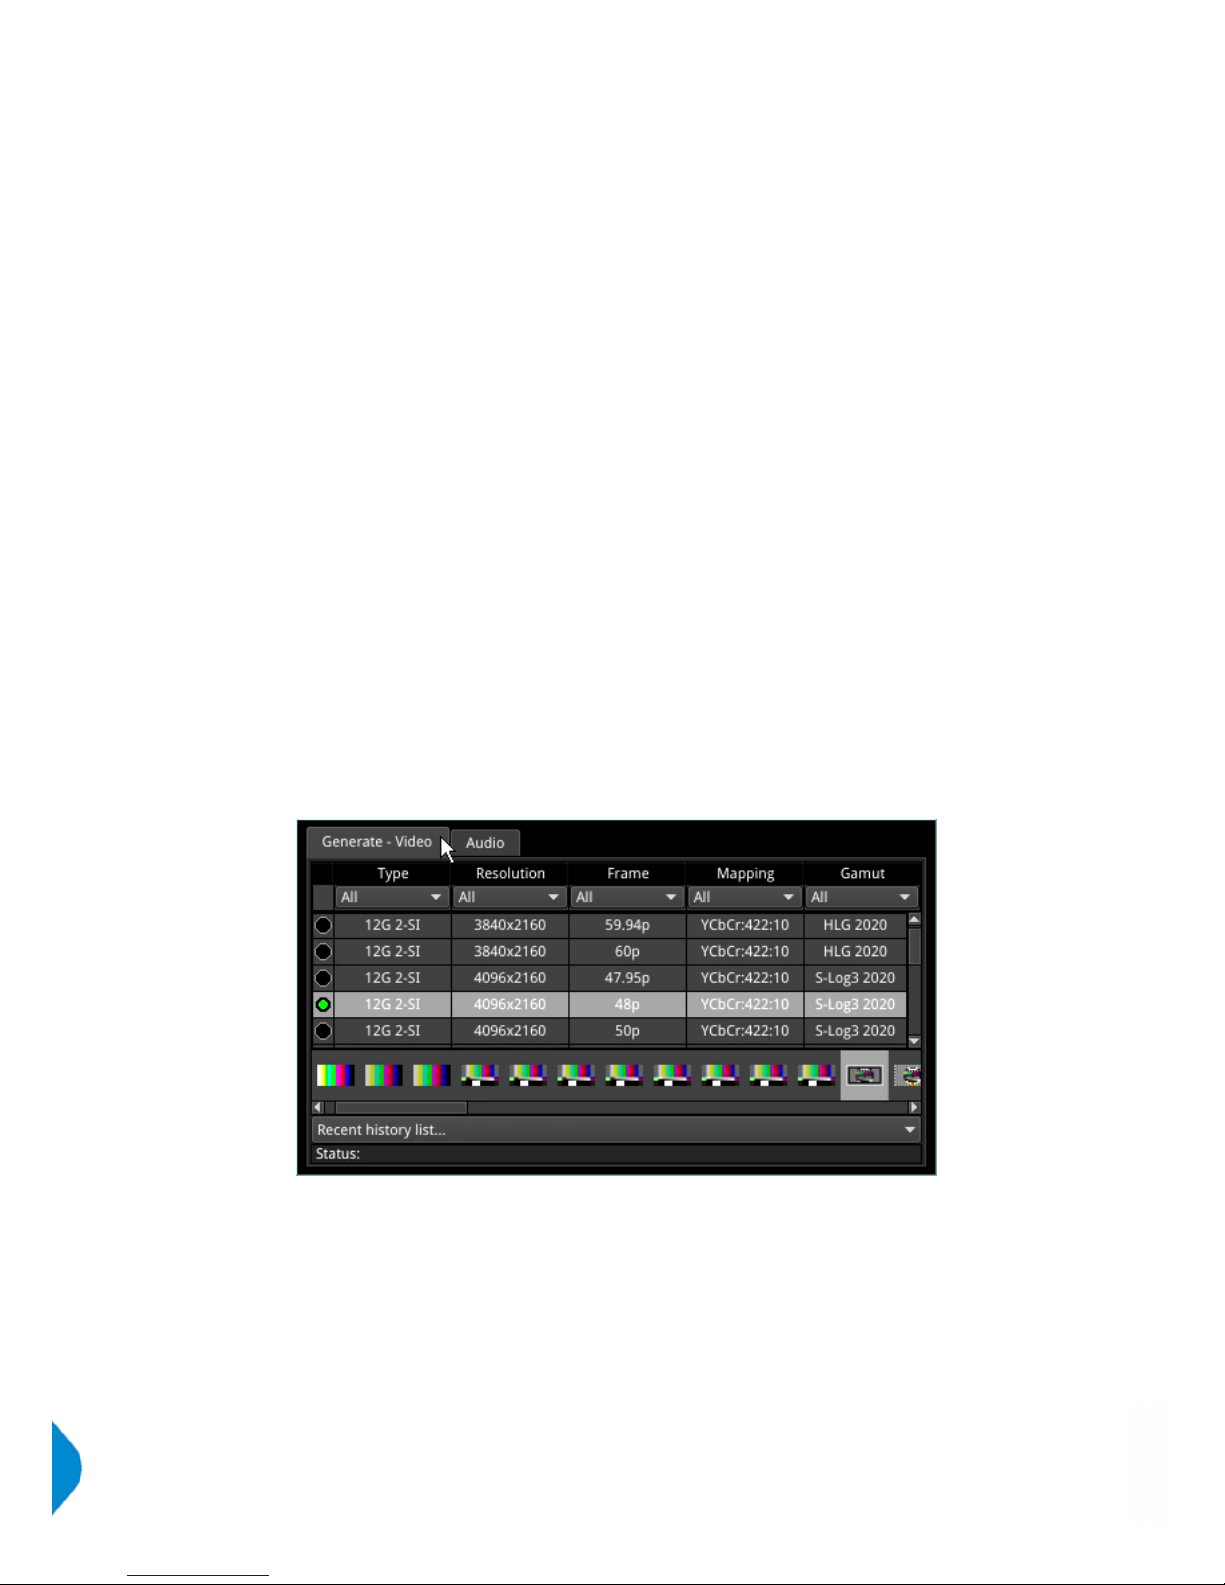
Generator - Configuration
The revamped 'Generator - Configuration' instrument has two tabs: one to select the generator video
standard and test pattern, and one for audio generation. in SDI Stress Toolset Mode, the ' Generate - Video'
submenu includes advanced generation tools which form part of the Advanced SDI Stress Toolset [PHQXOSDI-STRESS].
Generate - Video
[Qx 12G / PHQXO-GEN (QxIP)+PHQXO-UHD
(for 12G/6G-SDI on Qx IP)]
With a test pattern selected, click on your chosen video standard to generate it. A traffic light indicator will
turn yellow to show that generation is in progress. The light will turn green once the video standard has been
successfully generated.
Note: In this software revision the pattern may take up to 8 seconds to be generated.
The Qx provides video standard generation for a wide range of SDI rates, resolutions, frame rates, image
mappings, color gamuts, and transfer curves.
To simplify selection, the generator standards list may be filtered via drop down menus using the following
parameters:
l Type > [All, 12G 2-SI, QL 3G A 2-SI, QL 3G A SqDv, QL 3G B 2-SI, QL 3G B SqDv, DL 6G 2-SI, 6G 2-SI,
3G A, 3G B, 1.5G]
l Resolution > [All, 1280x720, 1920x1080, 2048x1080, 3840x2160, 4096x2160]
l Frame > [All, 23.98p, 24p, 25p, 29.97p, 30p, 47.95p, 48p, 50i, 50p, 59.94i, 59.94p, 60i, 60p]
l Mapping > > [All, YCbCr:422:10, YCbCr:422:12, YCbCrA:4224:12, YCbCr:444:10, YCbCr:444:12,
YCbCrA:4444:10, RGB:444:10, RGB:444:12, RGBA:4444:10]
l Gamut > [All, 709, 2020, HLG 2020, PQ 2020, S-Log3 2020]
‘Recent history list…’ provides a list of the most recently generated video standard and test pattern
combinations. These can be quickly selected and regenerated from this drop down menu.
The ‘Status’ bar provides information on video generation progress.
Right-clicking anywhere within the 'Generate - Video' window brings up a configuration submenu.
To clear recent history select:
l Clear recent history list
Page 14 PHABRIX Qx User Manual
Page 27

Test Patterns
The list of available test patterns for a selected video standard is displayed at the bottom or in the right hand
column of the ‘Generate - Video’ window. These patterns include:
100% Bars 75% Bars
Bowtie Box – 2 variants
Circle – 2 variants Color Grid
Component Ramps Field Lineup
Grey 10H Step Grey 10V Step
Grey 5H Step Grey 5V Step
Grey Steps – 2 variants Legal Ramp
Luma Ramp – 4 variants MultiBurst
PLUGE – 2 variants SMPTE 219-2 – 2 variants
SMPTE 219 sub super Tartan Bars
Valid Ramps UHD quad Align
ARIB-28 Bars – 4 variants ITU-R BT.2111-0 HDR Color Bars
ITU-R BT.814-4 PLUGE
Both S-Log3 and SR Live [S-Log3(HDR Live)] test pattern variants are available.
For moving test pattern provision, a bouncing box can be overlaid on top of any Generator test pattern.
l Bouncing box > [Enabled, Disabled]
PHABRIX Qx User Manual Page 15
Page 28

User Test Patterns and Images
Users can add test images to the Qx. These user test files must be in the Tagged Image File Format (TIFF)
and of the exact pixel resolution of the video standard of intended use. The specifications for Qx user test
files are detailed below:
Format Type Extension Pixel Resolutions Bit Depth Pixel Order
TIFF Native
(Files converted to TIFF from
other formats are not supported)
.tif 1280x720,
1920x1080,
2048x1080,
3840x2160,
4096x2160
16 Interleaved
User test files can be added to the Qx via SFTP. See ‘Remote Connection’ section of this manual for details
on how to connect via SFTP to the Qx.
Via SFTP, user test files should added to the 'transfer/userTestPatterns' directory of the Qx. After adding
these files, restart the Qx. User test images will then be available in the 'Generate - Video' tab of 'Generator Configuration' alongside all other test patterns.
Pathological signal insertion
Pathological Signal Insertion is a powerful feature.
In addition to selecting a background test pattern, a pathological pattern may be added as an overlay.
l Pathological insertion > Insertion > [Enabled, Disabled]
Three types of pattern are supported:
l Pathological insertion > Pattern to overlay > [Eq, PLL, CheckField]
The amount of pathological pattern may be configured to enable the user to verify how sensitive the SDI link
is to pathological conditions on the interface:
l Pathological insertion > Pairs to insert > [0 to 16384]
This control limits at the selected format’s line length.
Note: Pathological signals are approved by SMPTE for use with HD and 3G Level A standards only. For
3G Level B, 6G and 12G-SDI interface formats, pathological signals can still be used, but are not approved
by SMPTE (as of February 2017). It is believed that inserting a full line of pathological signal in these nonapproved standards is too stressful a test for the SDI interface. No physical damage will occur, but the
interface may exhibit reduced operating performance in the form of bit errors.
Output offset adjustment [SDI Modes]
A signal can be generated with a fixed offset, relative to the system reference.
Offsets can be entered in temporal or spatial terms:
l Output offset adjustment > Offset Type > [Time, Lines And Pixels
Selecting ‘Time’ reveals a drop-down field where the timing offset can be set in microseconds:
l Output offset adjustment > Offset Type > Time > Output Time Offset > [0.00, +/- 0.01, etc...]
Selecting ‘Lines And Pixels’ reveals drop-down fields where the offset can be set in coordinate terms:
l Output offset adjustment > Offset Type > Lines And Pixels > Output Line Offset > [0 to +/- (Total no.
of Lines for current standard -1)]
l Output offset adjustment > Offset Type > Lines And Pixels > Pixel Offset > [0 to +/- (Total no. of Pixels
per Line for current standard -1)]
Page 16 PHABRIX Qx User Manual
Page 29

Generator offset is removed by selecting in menu:
l Output offset adjustment > Clear offsets
Generate - Audio
[Qx 12G / PHQXO-GEN (Qx IP)]
32 channel audio generation is available in the 'Audio' tab of ‘Generator - Configuration’. In the instrument
submenu Audio Macros are provided for quick configuration, along with the ability to enable and disable
audio in individual sub images.
Depending on the generated video standard, up to 8 audio groups (32 channels) are available.
In the ‘Audio’ tab, audio Groups can be switched on and off as required, via checkboxes. Selecting the
arrow to the left hand side of a group reveals all the channels in that group. Clicking on the arrow again hides
these audio pairs.
Each channel can be configured by frequency and amplitude. Frequency can be set by music pitch or exact
tone frequency (Hz):
l Type > [Tone, Music Pitch]
l Type > Tone > [0Hz to 10000Hz]
l Type > Music Pitch > [C 3, C♯/D♭ 3, D 3, D♯/E♭ 3, E 3, F 3, F♯/G♭ 3, G 3, G♯/A♭ 3, A 3, A♯/B♭ 3, B
3, C 4, C♯/D♭ 4, D 4, D♯/E♭ 4, E 4, F 4, F♯/G♭ 4, G 4, G♯/A♭ 4, A 4, A♯/B♭ 4, B 4, C 5, C♯/D♭ 5, D
5, D♯/E♭ 5, E 5, F 5, F♯/G♭ 5, G 5, G♯/A♭ 5, A 5, A♯/B♭ 5, B 5, C 6, C♯/D♭ 6, D 6, D♯/E♭ 6, E 6,
F 6, F♯/G♭ 6, G 6, G♯/A♭ 6, A 6, A♯/B♭ 6, B 6, C 7]
Amplitude levels can be adjusted in decibels relative to full scale (dBFS):
l Amplitude > [-144 dBFS to 0 dBFS]
For fast configuration, the submenu provides ‘Audio Macros’. The ‘Macro list’ contains pre-configured audio
channel setups which can be used or adapted for use:
l Audio Macros > Macro list > [Select…, Fixed Tone Ramp Levels, Fixed Tone fixed Level, Musical
Pitch Ramp Levels, Musical Pitch Fixed Levels]
When tone is fixed (i.e. ‘Fixed Tone Ramp Level’, ‘Fixed Tone Fixed Level’), or when ‘Select…’ is chosen,
to adjust frequency select:
l Audio Macros > Fixed frequency > [C 3, C♯/D♭ 3, D 3, D♯/E♭ 3, E 3, F 3, F♯/G♭ 3, G 3,
G♯/A♭ 3, A 3, A♯/B♭ 3, B 3, C 4, C♯/D♭ 4, D 4, D♯/E♭ 4, E 4, F 4, F♯/G♭ 4, G 4,
PHABRIX Qx User Manual Page 17
Page 30

G♯/A♭ 4, A 4, A♯/B♭ 4, B 4, C 5, C♯/D♭ 5, D 5, D♯/E♭ 5, E 5, F 5, F♯/G♭ 5, G 5,
G♯/A♭ 5, A 5, A♯/B♭ 5, B 5, C 6, C♯/D♭ 6, D 6, D♯/E♭ 6, E 6, F 6, F♯/G♭ 6, G 6,
G♯/A♭ 6, A 6, A♯/B♭ 6, B 6, C 7]
When levels are fixed (i.e. ‘Fixed Tone Fixed Level’, Musical Pitch Fixed Levels), to adjust amplitude
select:
l Audio Macros > Fixed Amplitude > [-144 dBFS to 0 dBFS]
The Macros are applied across all audio groups.
Audio can be enabled or disable by Sub image:
l Sub Image Enable > Sub image 1/2/3/4 > [Enabled, Disabled]
Advanced Generation Tools [SDI Stress Mode]
[SDI Stress Toolset Mode; PHQXO-SDI-STRESS+PHQX01E /
PHQX01E-IP / PHQXM-01E + PHQXO-GEN (Qx IP)]
As part of the Advanced SDI Stress Toolset [PHQXO-SDI-STRESS], advanced generation tools are now
available via the instrument submenu, in SDI Stress Toolset Mode. The toolset provides: control over SDI
scrambler switch-off, sync bit insertion, a PRBS (pseudo-random binary sequence) mode for end-to-end
bit error rate testing (BERT), advanced jitter generation controls –facilitating the generation and bespoke
adjustment of jitter measurement parameters, SDI output amplitude control, SDI output muting, and driver
pre-emphasis. These tools support a wide range of advanced testing and troubleshooting.
SDI Scrambler
The selected video standard data stream can be made to bypass the SMPTE scrambler, just prior to the
output stage. To bypass the scrambler, disabled it:
l Advanced Generation Tools (BNC) > SDI Scrambler > [Enabled, Disabled]
Note: For the generation of conventional video, the default state for the SDI Scrambler is ‘Enabled’.
Sync Bit Insertion (12G / 6G)
Sync bit insertion prevents the occurrence of a pathological condition that results in the removal of sync bits,
otherwise known as 'potholing'. Before the output, a sync bit is applied to the Timing Reference Signal (TRS)
and Ancillary Data Flag (ADF) words of the generated video standard. Sync Bit Insertion can be enabled and
disabled in the submenu:
l Advanced Generation Tools (BNC) > Sync Bit Insertion > [Enabled, Disabled]
Note: This feature applies only to 6G-SDI and 12G-SDI video standards.
Note: The insertion of the sync bit is observable in the video signal TRS and ADF words seen in AnalyserDataview when ‘Sync Bit Removal’ is disabled.
PRBS Mode
In addition to SDI test signal generation, for the stress testing of SDI infrastructure the Qx offers end-to-end
BERT capability, with the addition of PRBS generation and analysis tools.
A variety of PRBS signals can be generated:
l Advanced Generation Tools (BNC) > PRBS Mode > [Disabled, PRBS-7, PRBS-9, PRBS-15, PRBS-23,
PRBS-31]
Once selected, a PRBS signal can be inverted. Errors can also be inserted into the stream:
l Advanced Generation Tools (BNC) > PRBS Mode > PRBS Signal Inversion > [Enabled, Disabled]
l Advanced Generation Tools (BNC) > PRBS Mode > PRBS Error Insertion > [Enabled, Disabled]
Page 18 PHABRIX Qx User Manual
Page 31

Note: Both the 'Generator - Video Standard' pane and the ‘Generator – Status’ instrument indicate
when a PRBS signal is being generated.
Note: PRBS signal analysis is available in the ‘PRBS – Analysis’ instrument window.
Jitter Insertion
Jitter can be inserted into any generated SDI signal in order to stress the interface and ensure that
receivers are compliant to SMPTE recommended practice. Sinusoidal jitter can be inserted with a
frequency ranging from 10Hz to 10MHz. Peak-to-peak jitter amplitude can be adjusted.
Enable jitter insertion:
l Advanced Generation Tools (BNC) > Jitter Insertion Mode > [Disabled, Sine]
Enabling jitter insertion reveals a setting for specifying the frequency of the jitter wave:
l Advanced Generation Tools (BNC) > Jitter Insertion Mode > Frequency > [1.0Hz to 10.0MHz]
Note: For precision setting adjustment and frequencies below 10Hz use the up/down arrow buttons or input
values via a USB keyboard.
Peak-to-peak jitter amplitude can be adjusted, with jitter amplitude measured in terms of signal Eye
Unit interval (UI):
l Advanced Generation Tools (BNC) > Jitter Insertion Mode > Amplitude P-P > [slider, 0.01 to 110.00 UI,
dependent on frequency]
WARNING: In this software release, SDI outputs B, C and D may be corrupted when jitter is inserted.
Note: Jitter can be observed in the ‘Eye – SDI In A’ and ‘Jitter – SDI In A’ instrument windows. For analysis,
apply filters and other settings in the Eye and Jitter instruments as required. (See ‘Eye – SDI In A’ and ‘Jitter –
SDI In A’ sections of this manual for information on analysis.)
Driver & Output Control
The signal amplitude of ‘SDI Out A’ can be increased or decreased by up to 10%:
l Advanced Generation Tools (BNC) > Driver A Amplitude Offset > [+/- 0, 2, 4, 6, 8, 10%]
Note: Qx units released prior to software release 2.3 will first require Driver A calibration. For instructions on
driver calibration, see 'Driver Calibration' section of this manual.
The ability to mute any of the SDI outputs is also provided:
l Advanced Generation Tools (BNC) > Mute SDI Output A > [Enabled, Disabled]
l Advanced Generation Tools (BNC) > Mute SDI Output B > [Enabled, Disabled]
l Advanced Generation Tools (BNC) > Mute SDI Output C > [Enabled, Disabled]
l Advanced Generation Tools (BNC) > Mute SDI Output D > [Enabled, Disabled]
For SDI Out A, driver pre-emphasis can be adjusted to boost the signal at the beginning of the rising edge of
the eye pattern to optimize signal integrity. (See 'Eye - SDI In A' instrument for eye pattern display.)
l Advanced Generation Tools (BNC) > Driver Pre-Emphasis > [Disabled, 0.5 dB, 1.0 dB, 1.5 dB]
With Driver Pre-Emphasis enabled, the pre-emphasis time constant can be left as default, or changed divided by 2, 4, or 8 - to adjust how long the signal is boosted for:
l Advanced Generation Tools (BNC) > Driver Pre-Emphasis > Time-Constant > [Default, Div 2, Div 4, Div
8]
PHABRIX Qx User Manual Page 19
Page 32
Generation
Generator - Status
[Qx 12G / PHQXO-GEN (Qx IP)]
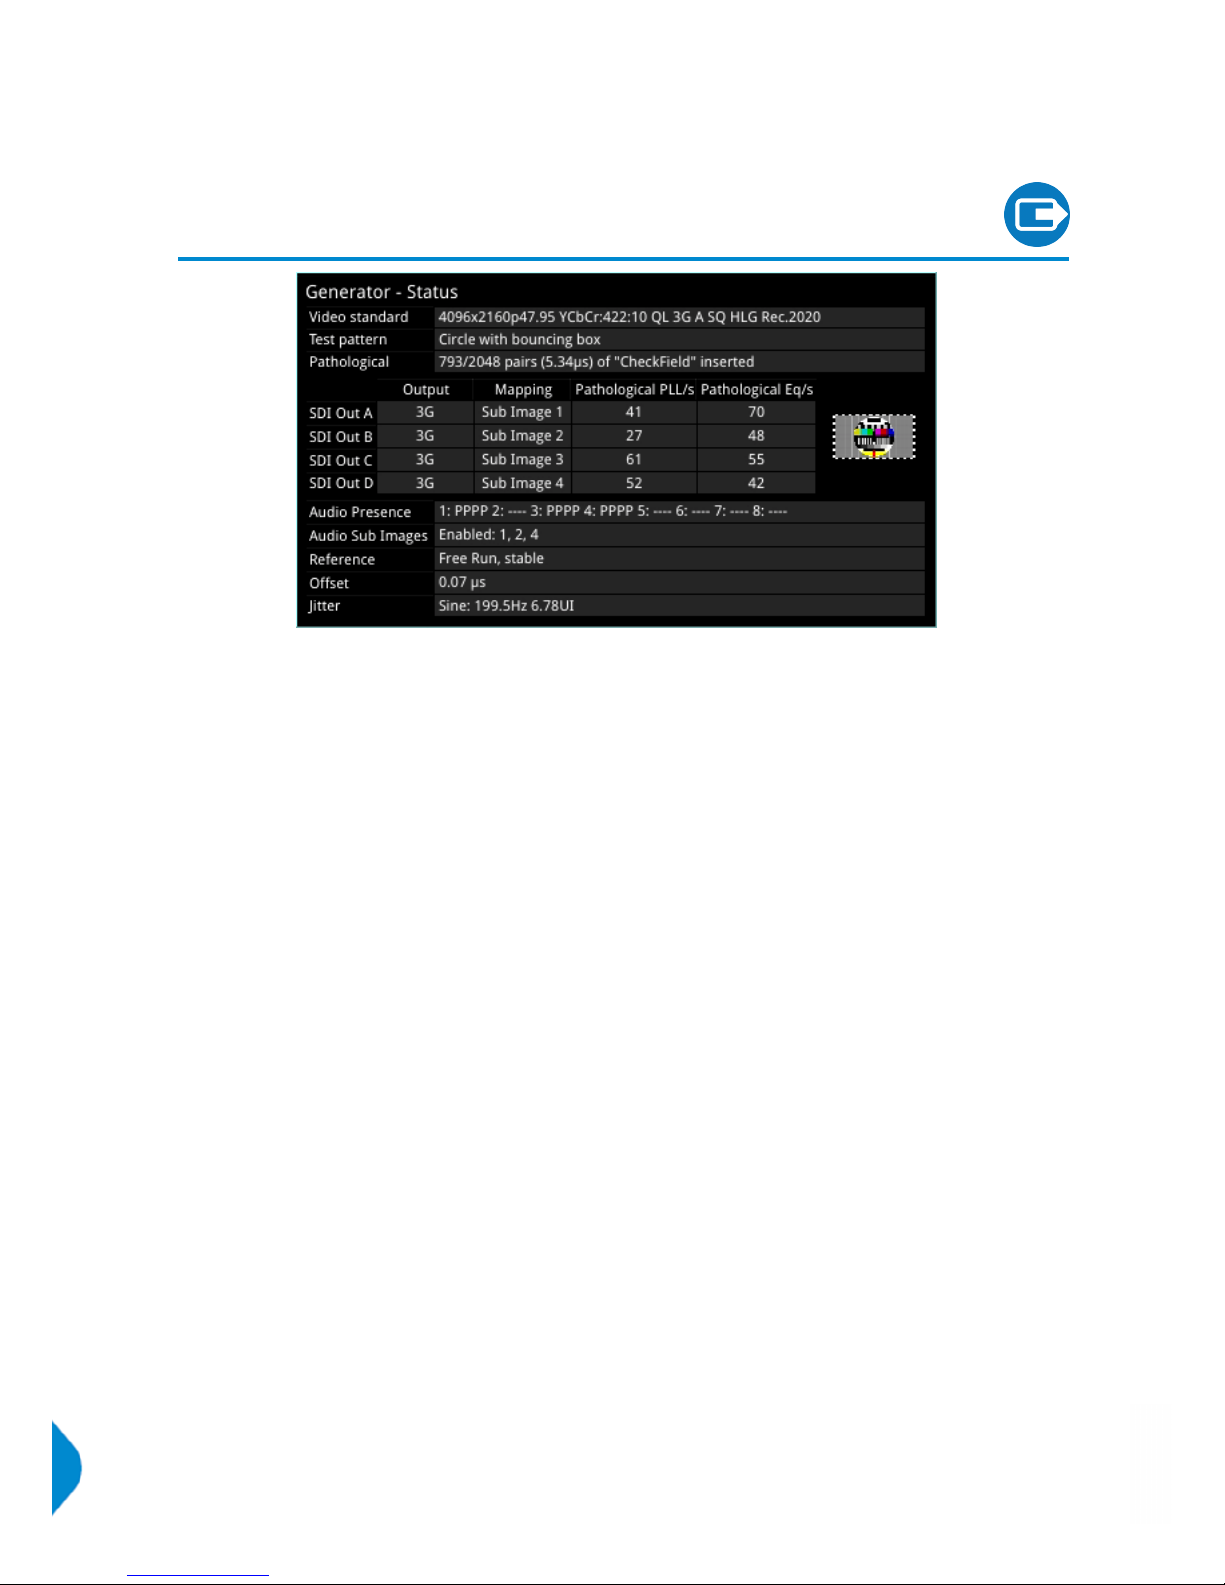
The ‘Generator - Status’ window confirms the generated Video Standard and Test Pattern details. The
window shows the generator pattern selected, or PRBS signal selected (available in SDI Stress Toolset
Mode), and confirms the BNC output (SDIModes only) or SFP output presence, and Sub Image/Full Image
mapping information. Audio Presence & Sub Image information is also displayed, along with Video
Reference, Output offset adjustment, and Jitter insertion (SDI Stress Toolset Mode) details. This window
provides status information only; there are no user settings to configure.
When pathological overlay is generated in ‘Generator – Configuration’, the Qx detects this for all SDI
outputs, and ‘Pathological PLL/s’ and ‘Pathological Eq/s’ will display the number of pathological events that
have been generated per second. As one pathological event is created per line this also indicates the
number of lines per second on which pathological conditions occur on the interface. The detection of a
pathological condition is available as a GPI output of the Qx, for use in triggering an external analyzer device.
Note: Pathological Rate/s counters are not displayed in PRBS Mode.
Page 20 PHABRIX Qx User Manual
Page 33
System
SFP IP Network [IP Mode]
[IP Mode]
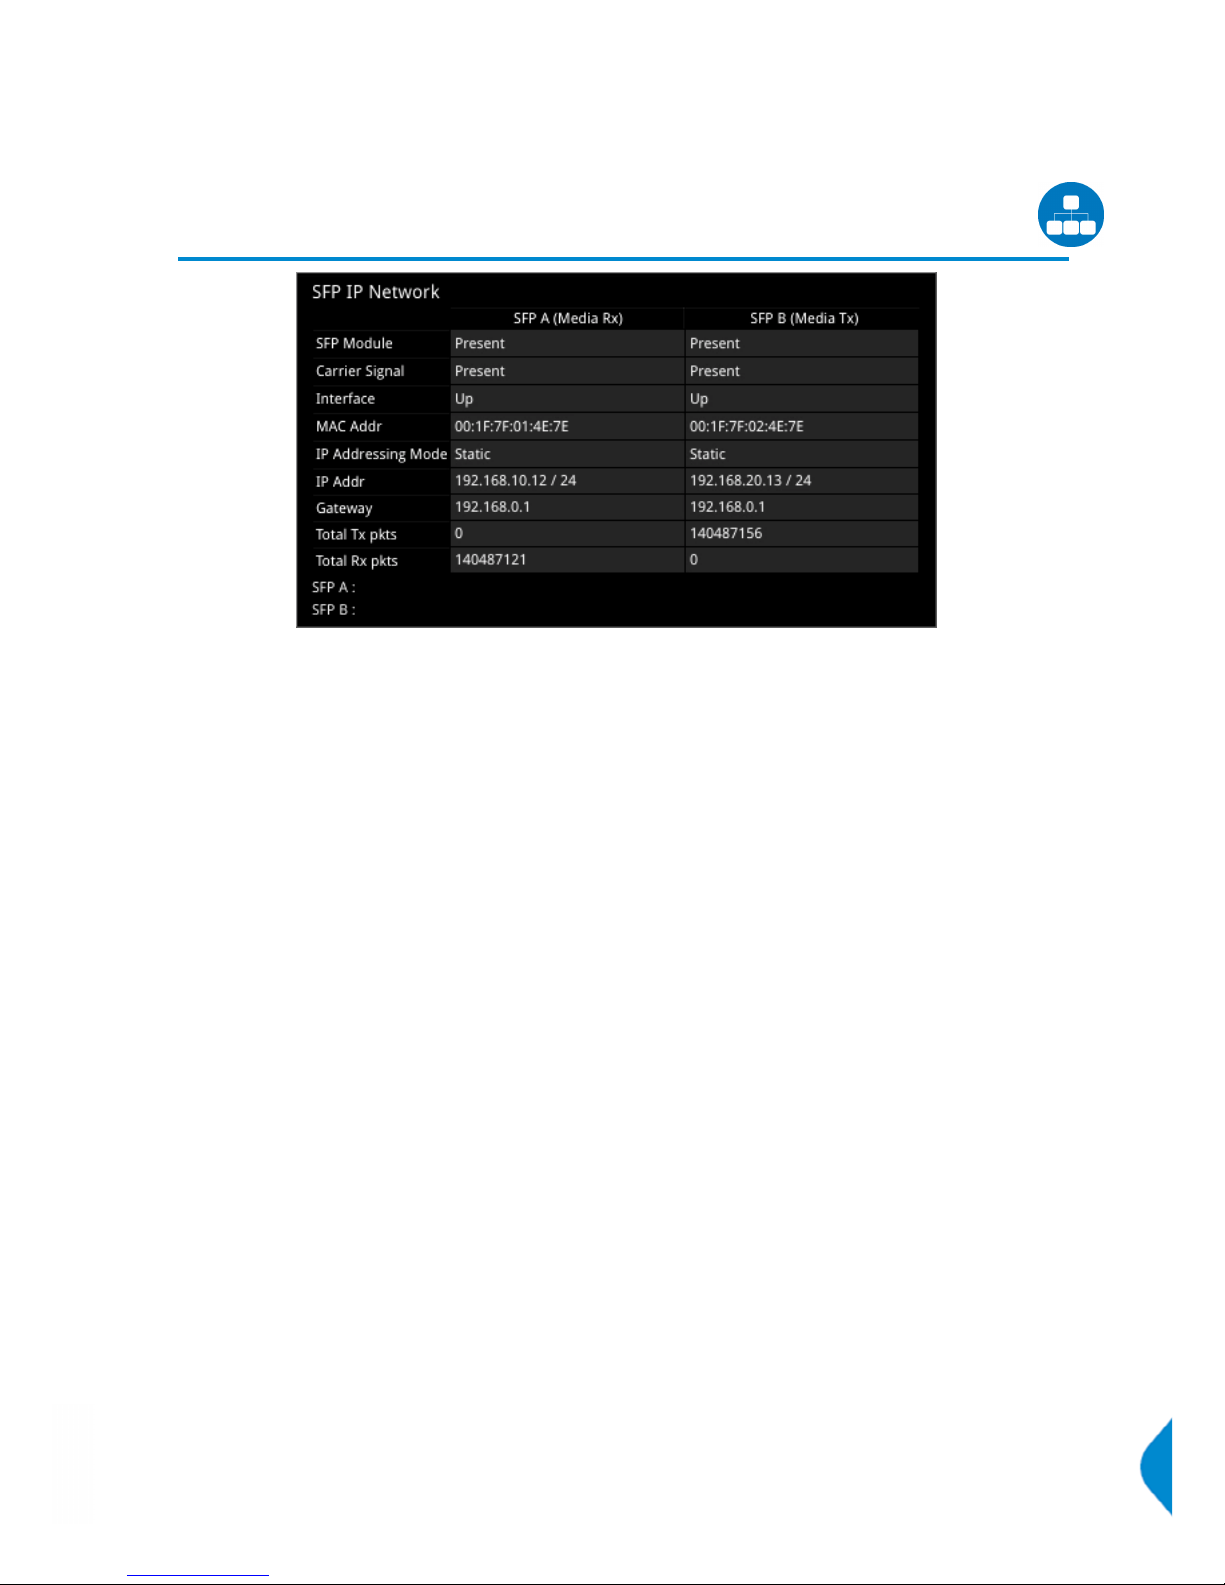
The ‘SFP IP Network’ window provides an overview of the status of the Qx SFP interfaces used for 2022-6
IP packet transmission and reception. IP receive (A) and transmit (B) SFP presence, carrier signal presence,
interface status, SFP MAC and IP addresses, and packet information are displayed here. Error status
information is displayed at the bottom of the window.
Right-clicking in the window reveals a submenu, from where the static IP address, and network/subnet mask
of each SFP can be set, by keyboard or on-screen Keypad.
Static IP address of SFP:
l SFP...IP addr and mask > [set IP address of SFP as required]
Mask selection is via a drop-down menu. Classless Inter-Domain Routing (CIDR) notation is used; with a
default value of /24 (i.e. 255.255.255.0):
l SFP...IP addr and mask > [set mask in drop-down, 30 to 8]
Default Gateway:
l SFP...Gateway IP Addr > [set Gateway IP address as required]
IP settings are saved by selecting:
l Apply SFP...Static IP Parameters
PHABRIX Qx User Manual Page 21
Page 34
Generation
IP Transmit (SFP B) [IP Mode]
[PHQXO-IP-NGT+PHQXO-IP-ENC+PHQXO-GEN (Qx IP)]
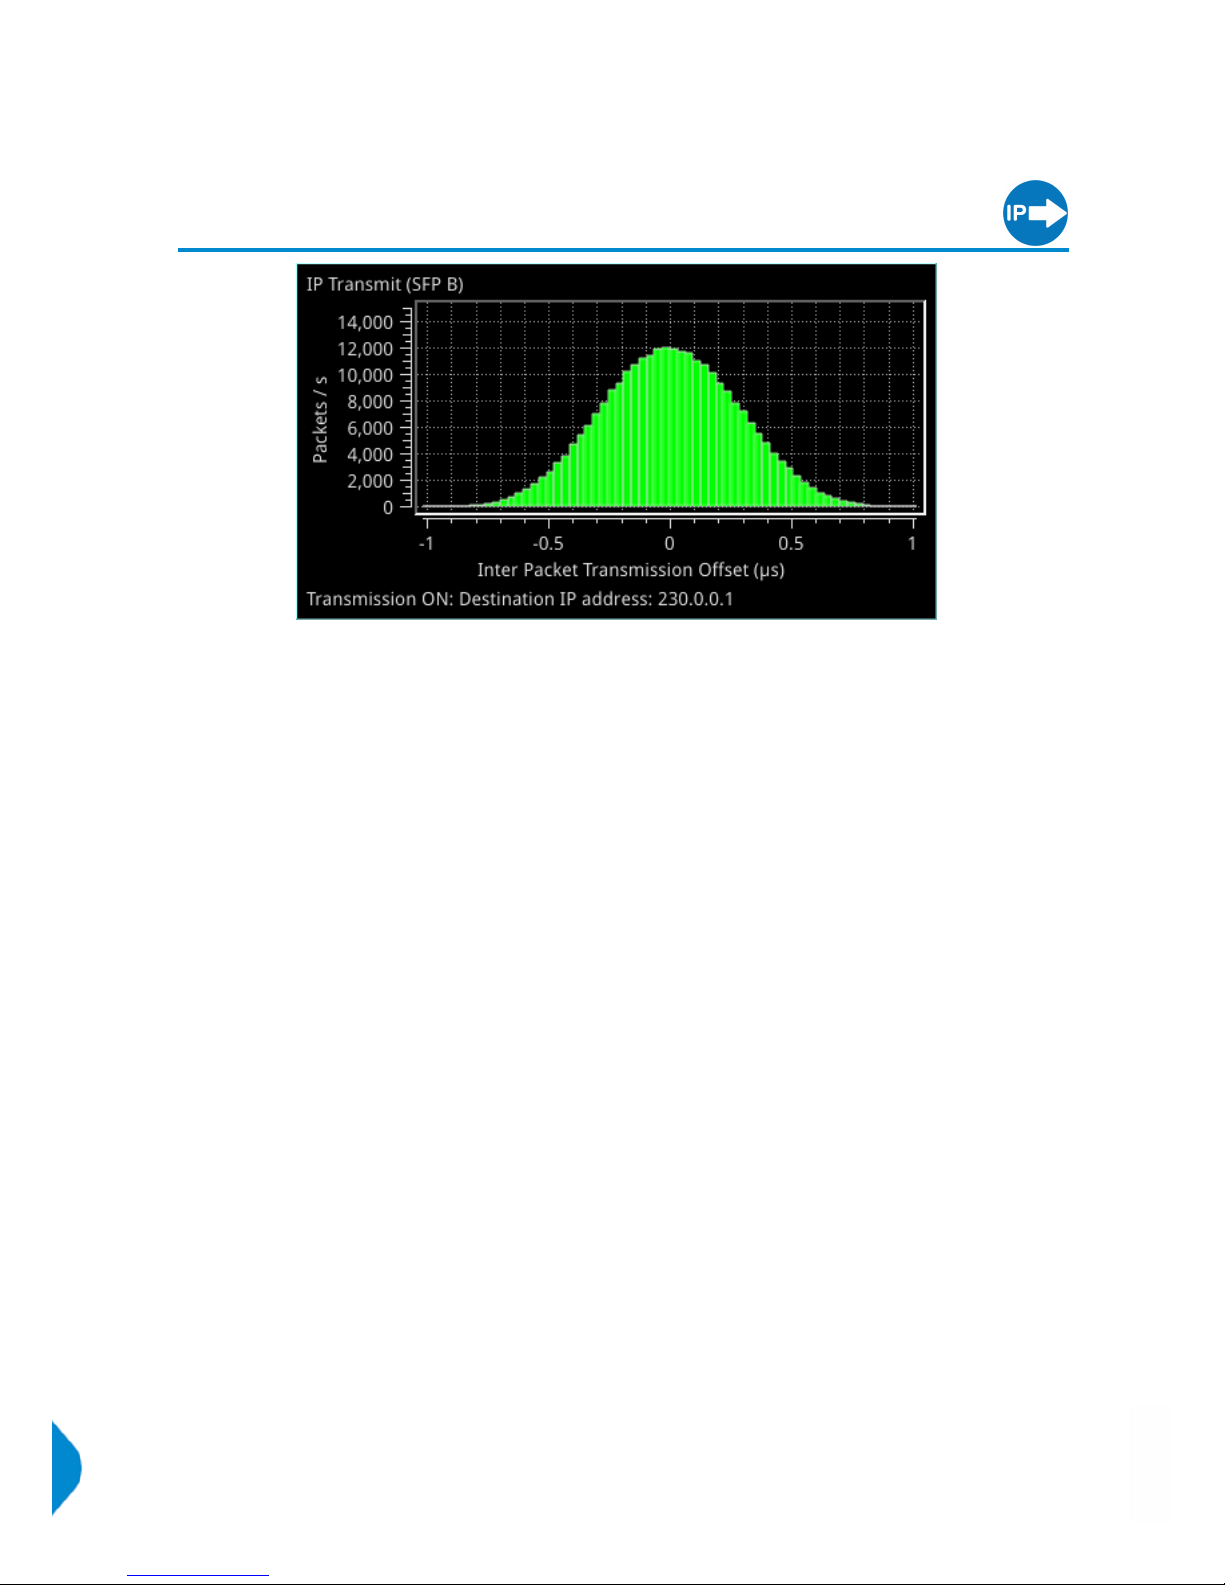
The ‘IP Transmit (SFP B)’ window is used to transmit the currently generated video standard signal as IP
video packets.
The tool can be used to simulate IP video network packet jitter introduced under a variety of network
conditions by providing the ability to adjust the transmission distribution profile.
The histogram shows the interval timing distribution of the packets being generated (each second) - that is:
the number of packets being generated each second, against the deviation of each packet interval from
the expected interval time. Transmission status information and prompts are also displayed at the bottom
of the window, and hovering over this status information reveals a tooltip detailing the ‘Current Transmit
Parameters’. (See Network Settings below for more information.)
Right-clicking in the window reveals a submenu.
Packet transmission can be switched on and off:
l Transmit > [On, Off]
The type of distribution profile can be selected, and the range of transmission packet intervals can be
adjusted. The adjustments are displayed in real-time, in the transmission histogram.
l Distribution Range > [slider +/- 0...492 clks]
l Distribution > [Uniform, Gaussian]
The submenu also provides the option to plot the number of transmitted packets on the vertical axis, in
either linear or logarithmic scale:
l Y-Axis Scale > [Linear, Log10]
Network Settings
IP, UDP, MAC, and SSRC network settings for packet transmission are set in the submenu, and can be
entered by keyboard or via the on-screen keypad when ‘Transmit’ is ‘Off’.
Transmission can be either multicast or unicast. The multicast group destination IP address, or the IP address
of the receive device (in the case of unicast) should be set as the destination IP address; as required:
l Dst IP Addr > [set IP address]
Page 22 PHABRIX Qx User Manual
Page 35
The destination MAC address should be set as required, to ‘Automatic’ for multicast, or ‘SFP A’ for unicast
transmission to the same Qx unit. For unicast transmission to another device, set to ‘Manual’, and then enter
below, the MAC address of the receive device (in the case of a direct connection) or the first switching
device in the path of the transmitting Qx (in the case of an indirect connection to the receive device).
l Dst MAC Addr > [Automatic, Manual, SFP A]
UDP parameters:
l Src UDP Port > [set UDP port number as required]
l Dst UDP Port > [set UDP port number as required]
A Synchronization source identifier (SSRC) can be set for Real-time Transport Protocol (RTP) stream
subscription if required:
l SSRC > [set ID if required]
Once required network settings have been entered, switch ‘On’ ‘Transmit’ to commence transmission.
Note: Ensure also, that you are generating a test signal for transmission in ‘Generator - Video Standard’.
System
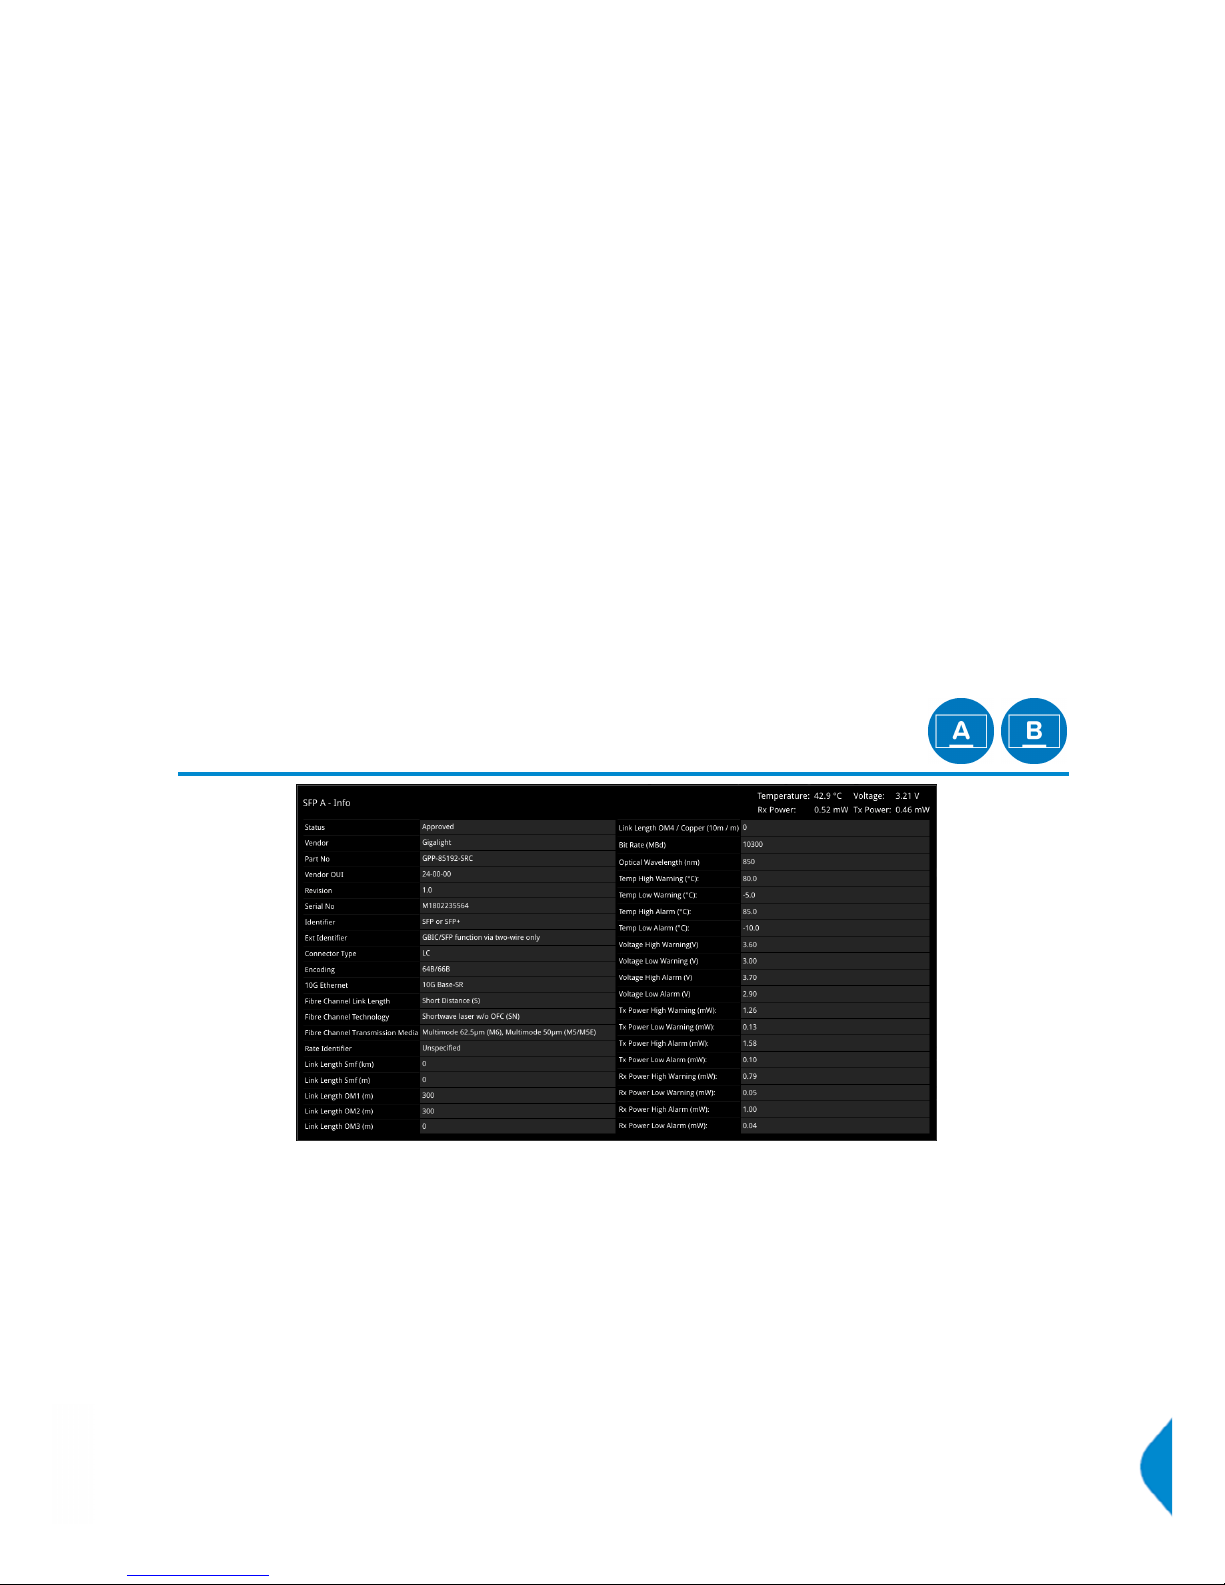
SFP (A, B) - Info
The ‘SFP - Info’ windows gives at-a-glance physical status information on each Qx SFP module, including
Identifier, Connector, line code (Encoding), Vendor details and approval status for use with the Qx. More
detailed status information for the SFP, such as temperature and voltage are also displayed.
Temperature and Power display units can be adjusted via the right-click submenu:
l Temperature Units > [°C, °F]
l Optical Power Units > [mW, dBm]
PHABRIX Qx User Manual Page 23
Page 36
System
System IO
Due to the complexity of the UHDTV standards, PHABRIX has introduced innovative ways of displaying
status. The ‘System IO’ window has been designed as a quick view of the signal inputs and outputs attached
to the Qx.
'System IO' shows the status of signal inputs and outputs, external reference, cable length, and connector
details. In SDImodes, this status and configuration window provides input and output mechanism selection be it BNC or SFP. Additionally for SDI BNC outputs, 'System IO' offers a 'Generator Output Copy' option
(output copy is automatically applied for SDI SFPs), and the ability via the 'Loop' feature to passthrough the
SDIBNC input signal(s) - making it available on the SDI BNC output connection.
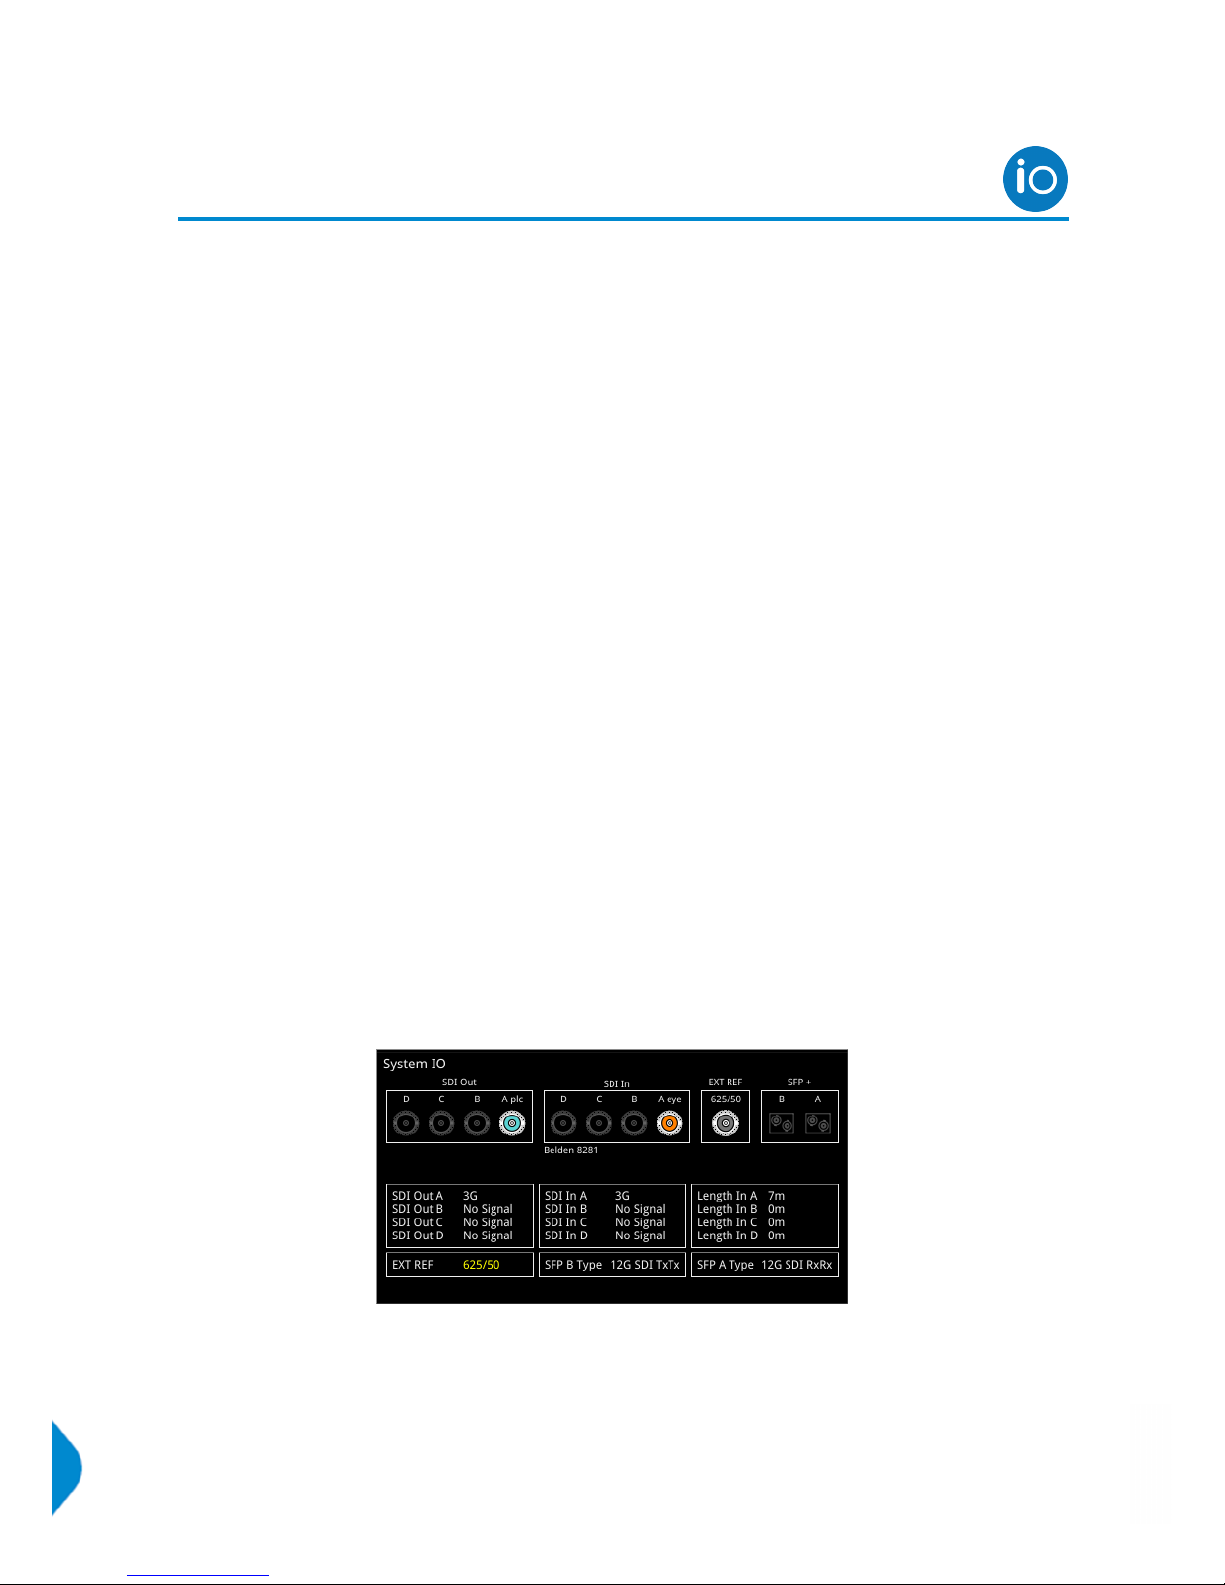
SDI Modes
In the top half of the instrument window is a graphical view of the Qx rear panel, displaying from left to right:
SDI BNC outputs, SDI BNC inputs, external reference, and SFP+B and SFP+A positions (and the I/O's of any
installed SFP's.)
All active SDI inputs and outputs are indicated by colored connectors; their colors dictated by the
Analyser/Generator color scheme set in 'Display Options'. (See 'Instrument Launch Menu' section of this
manual for more details.) An entirely grayed out connector indicates that a signal is not present, and the
previously colored ring will be black. The color of the connectors correspond to the color of their related
instrument borders and instrument icons, to aid recognition.
If an SDI SFP is unseated or not present, this is displayed graphically with a black void - indicating a missing
SFP. (IP SFP's will also be displayed if installed, but will only become active in IP boot up mode.)
The Qx SDIsignal input and output mechanism can be configured in the instrument submenu - with a choice
of two SDI connector types for both input and output.
Select the SDI connector configuration you require:
l SDI Input Source > [BNC, SFP]
l SDI Out > [BNC, SFP]
Note: The Qx default SDI connector state is BNC in / BNC out.
Example 1 shows a BNC output and BNC input in use
Page 24 PHABRIX Qx User Manual
Page 37
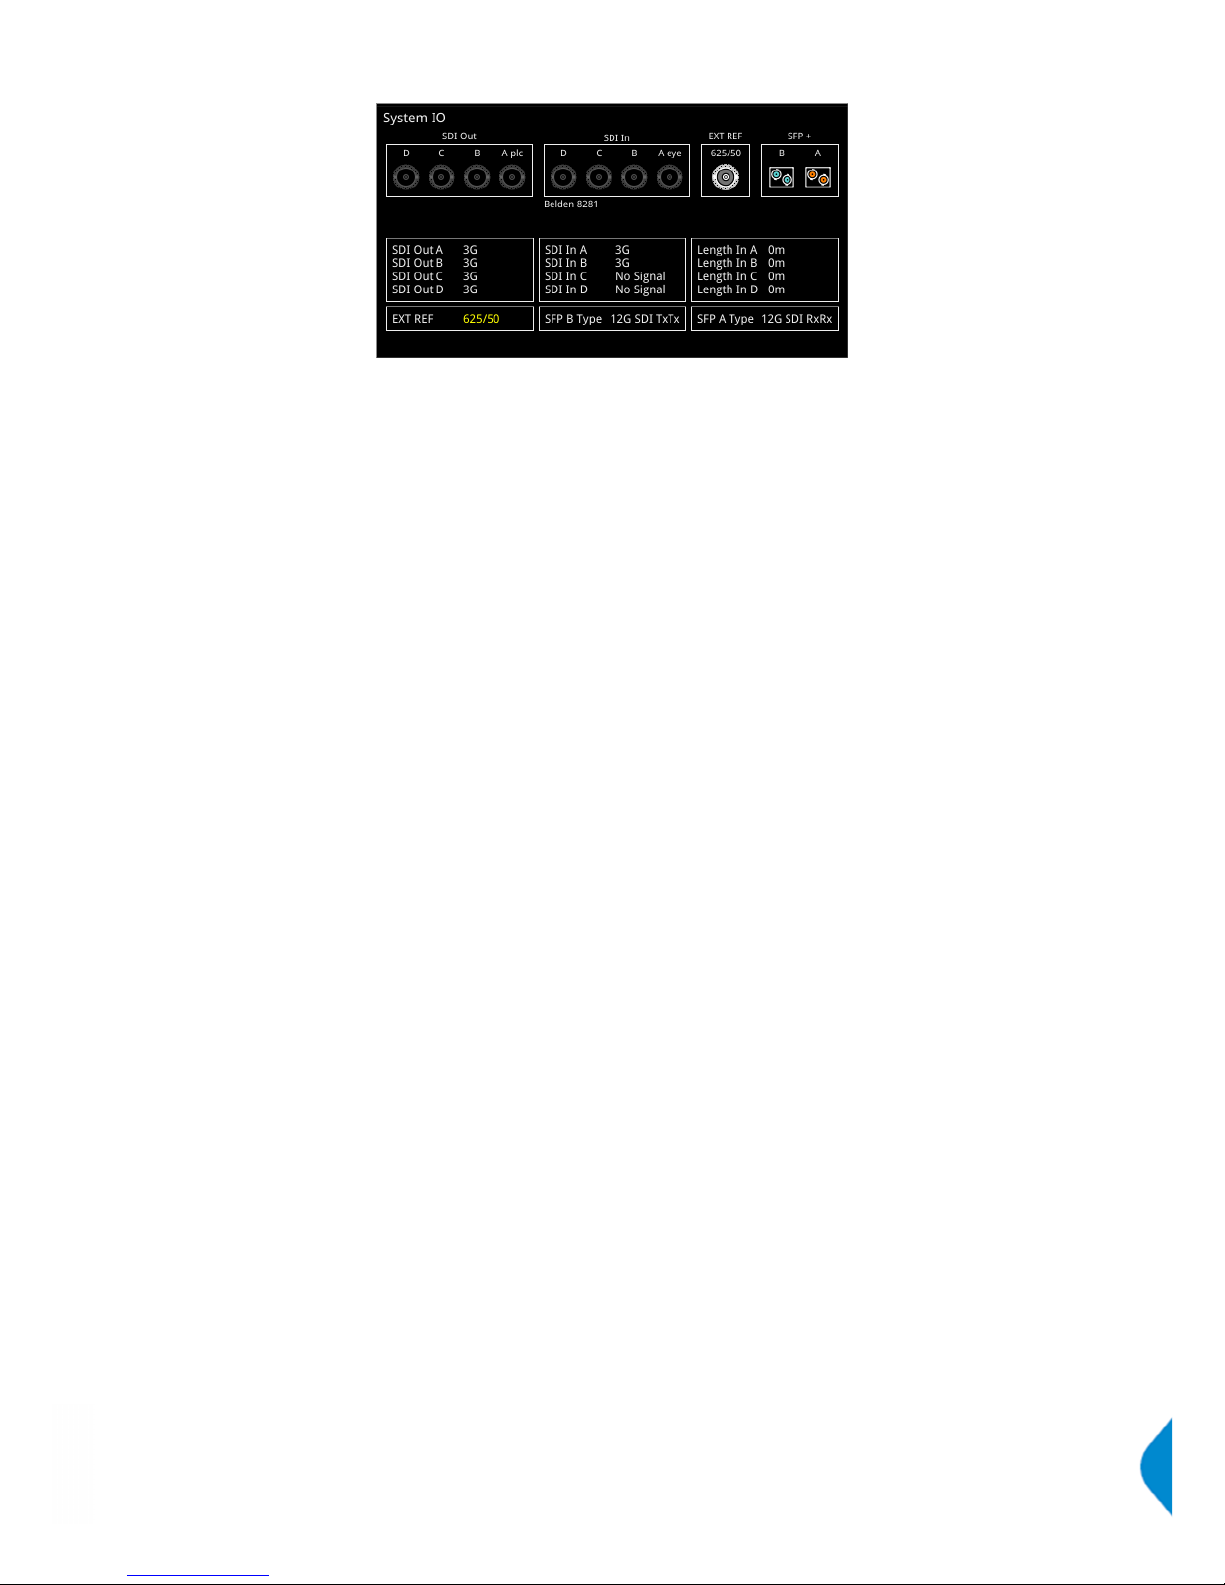
Example 2 shows SFP outputs and SFP inputs in use
Note: BNC in / SFP out and SFP in / BNCout combinations are also supported
Note: For further details on SDI SFP input and output positioning, see 'SDI SFP Connections Overview'
section of this manual.
Additional SDIBNC output control is provided in the instrument submenu.
To duplicate output of the generated single link or dual link video standard on all unused SDI Out BNCs,
enable 'Output Copy':
l SDI BNC Out - Generator Output Copy > [Enabled, Disabled]
Note: This feature is not applicable to quad link standards
Note: Output copy functionality is automatically applied when using SDI SFP outputs
Signals presented to the SDI BNC Inputs of the Qx can be repeated out on the SDI BNC outputs of the unit,
by enabling the 'Loop' feature:
l SDI BNC Out - Loop SDI BNC In > [Enabled, Disabled]
When this 'Loop' feature is activated, there is a one-to-one mapping between the A, B, C, and D, inputs and
outputs respectively.
When enabled, the 'Loop' feature disables the generator activity on the SDI BNC outputs, and overrides
'Output Copy'.
Note: the 'Loop' feature is available in a BNC in / BNC out configuration only
The presence of external reference and its standard, is also displayed graphically with a colored connector.
If the system is set to lock to the external reference, and a stable lock has been achieved, then the inner
ring of the ‘EXT REF’ BNC pictured, will be highlighted in gray. The following ‘EXT REF’ BNC colors relate to
various external reference status:
l Gray (reference connected)
l Red (error with reference)
l Black (no reference connected)
Note: The EXT REF BNC shows the status of external reference only; which is not necessarily the system
reference. Overall system reference is selectable in the ‘Timing and System Reference’ instrument window.
Below the graphical connector display, are tables showing input and output status, cable length, external
reference standard and status, and SFP type and presence information. Hovering over the external reference
and SFP status information reveals tooltips containing additional status details.
The external reference table displays the following states:
l EXT REF: [No Signal, Unstable, 525/59.94, 625/50, etc...]
PHABRIX Qx User Manual Page 25
Page 38
If external reference is not currently being used as system reference, its field text will display in yellow. When
external reference is the system reference, this table field text will be white.
Cable length measurements are displayed for each SDI BNC input. To measure the length of a connected
cable, be sure to first select the correct cable type from the instrument submenu:
l Cable Type > [Belden 8281, Belden 1505, Belden 1694A, Belden 1855A, Canare L5CFB, Image 1000]
The selected cable type is shown below the 'SDI In' BNC connector view.
Note: Cable measurements accurate to approximately +/- 10 meters.
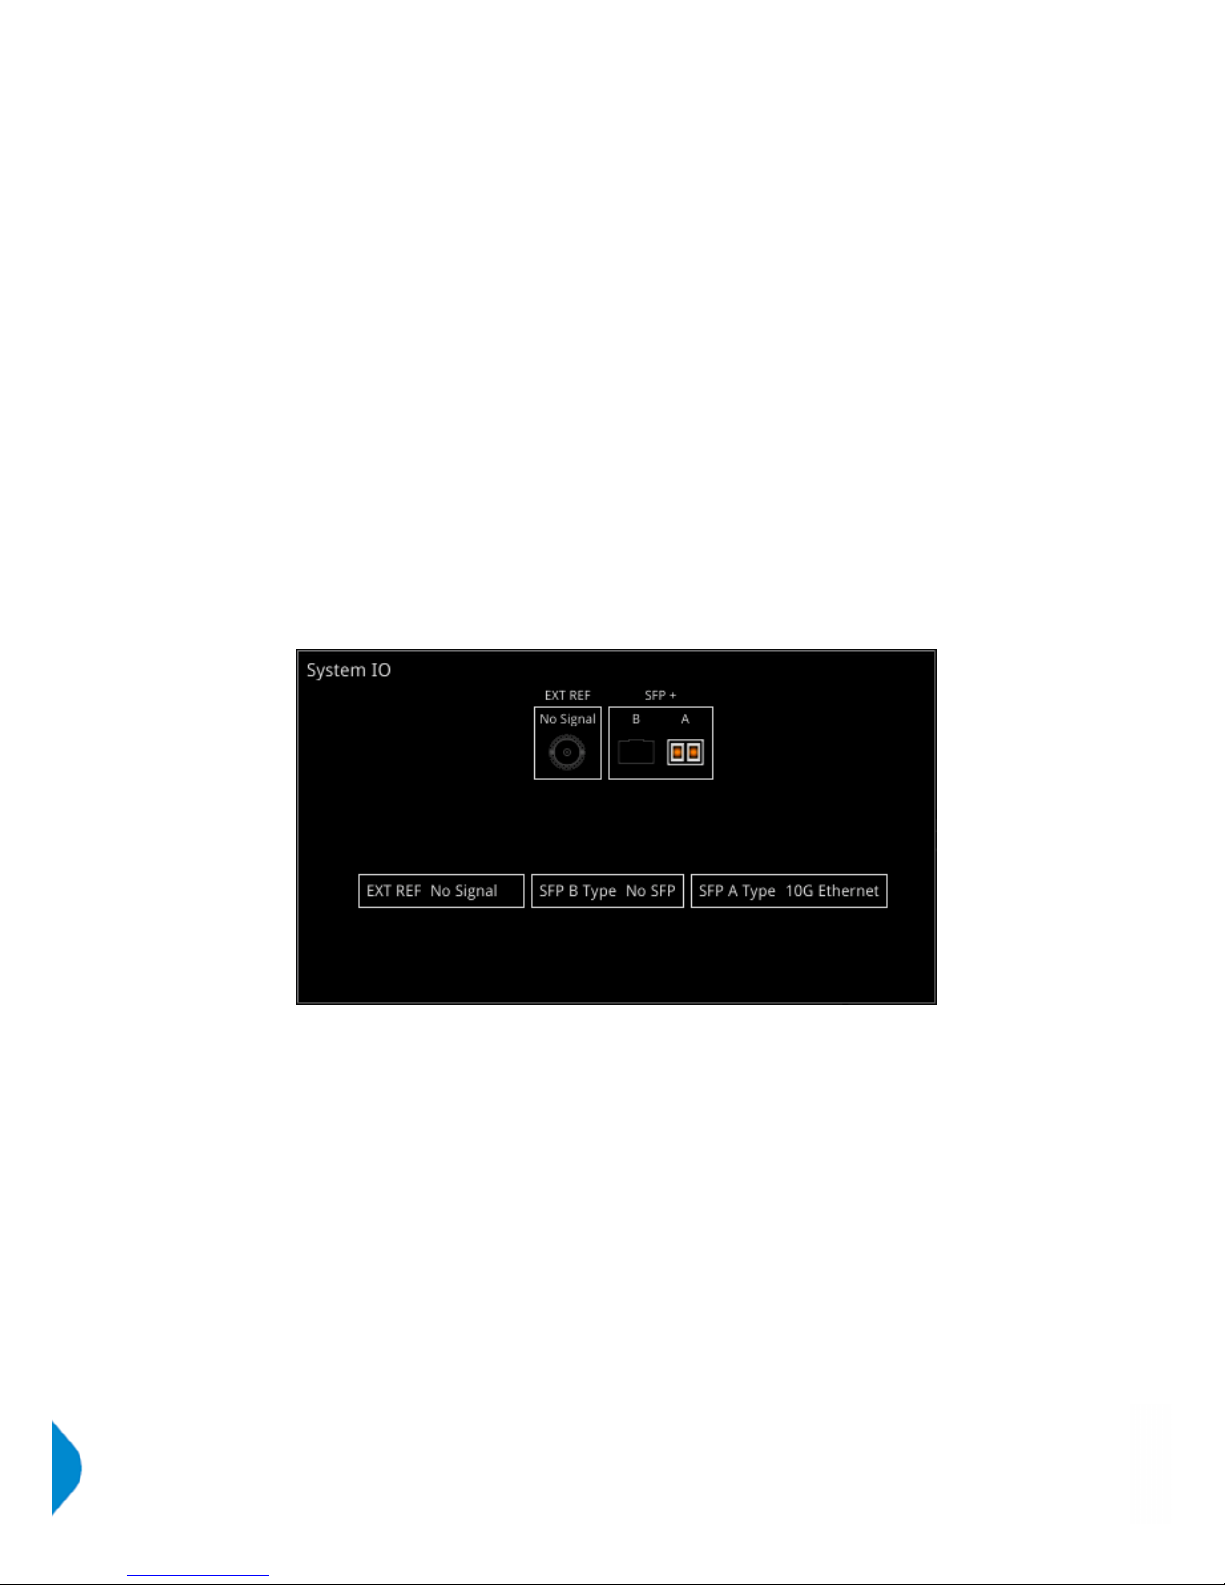
IP Mode
Active IP SFP receive inputs and transmit outputs are indicated by colored connectors. The color of the
connectors corresponds to the color of their related instrument borders and instrument icons, to aid
recognition.
An entirely grayed out connector indicates that a signal is not present. If an SFP is unseated or not present,
this is displayed graphically with a black void - indicating a missing SFP.
SFP type and presence information is shown in tables, as are external reference standard and status
details; as per the SDI version of this UI.
Page 26 PHABRIX Qx User Manual
Page 39
System
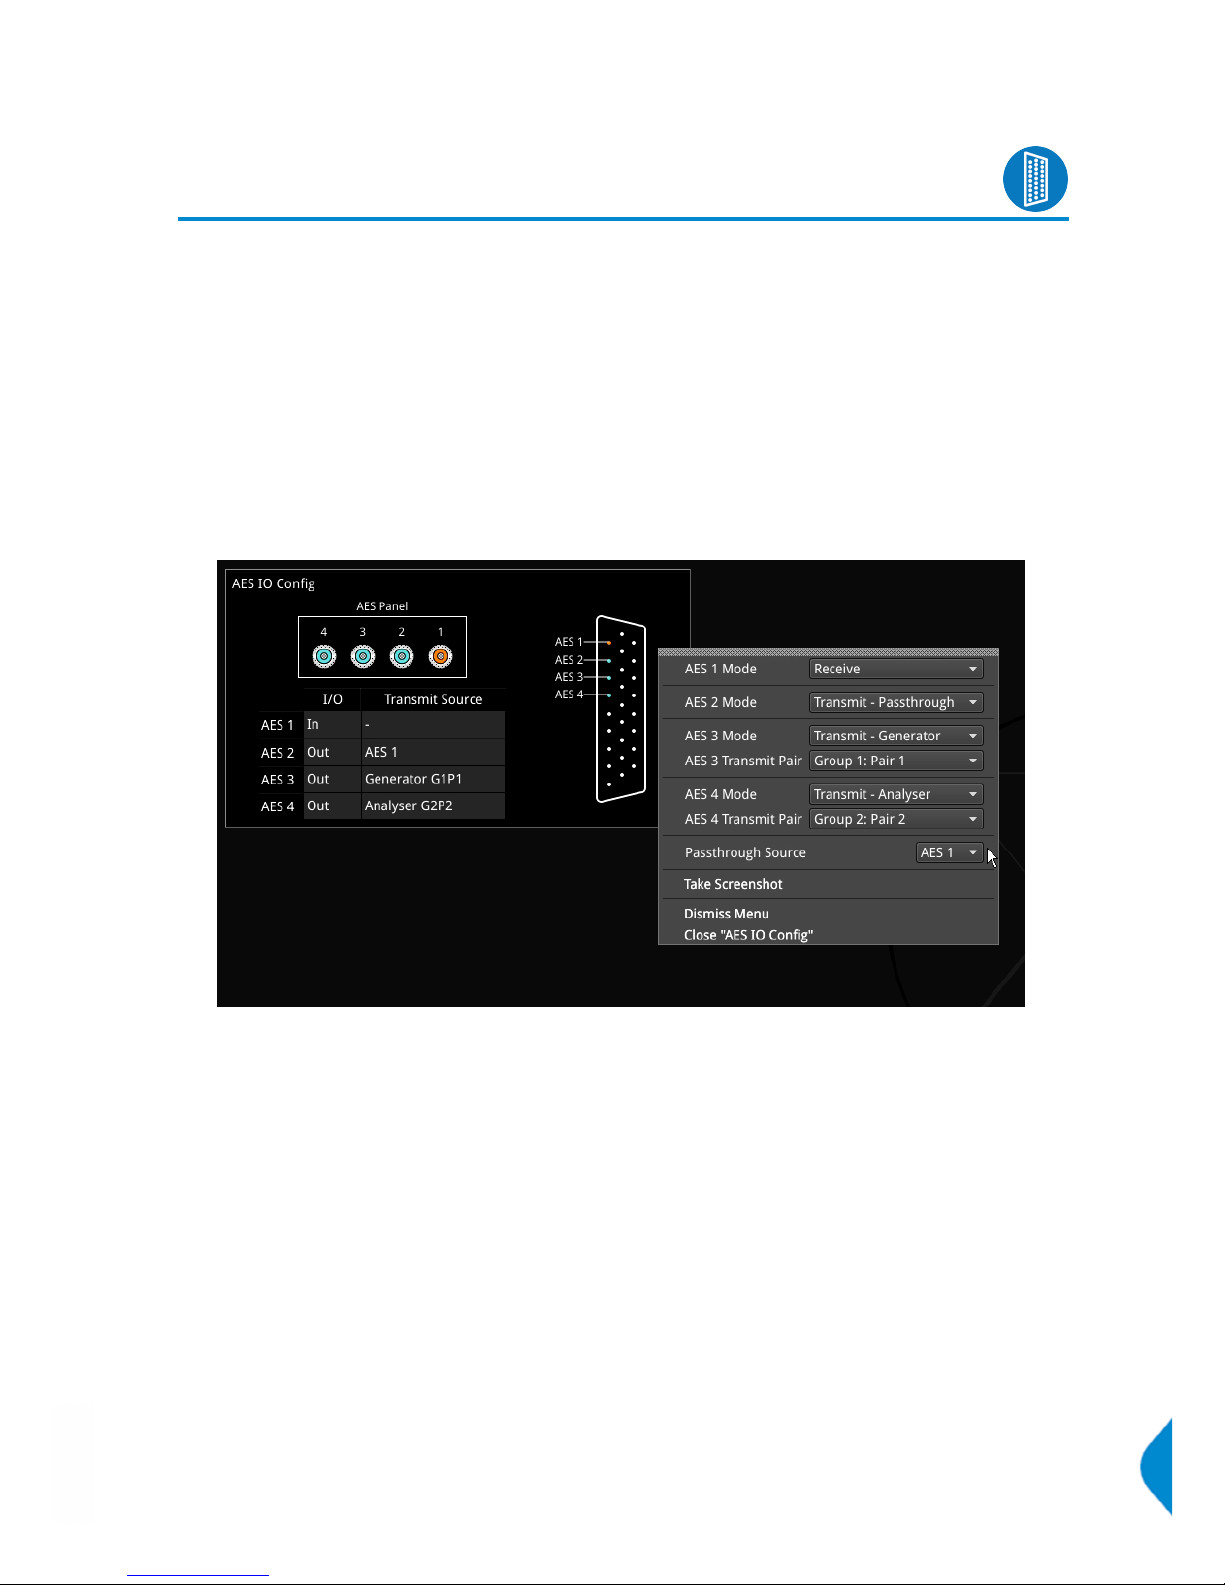
AES IO Config
The Qx provides powerful and highly flexible functionality in the treatment of AES input and output signals
when present on pins 1-4 of the rear panel 26-way D-type connector.
(See ‘Specifications’ section of this manual for more details. A D-type to BNC converter can be employed to
provide user access to the AES I/O's.)
The ‘AES IO Config’ window provides an interface where a user can configure the AES I/Os as required:
l Up to 4 AES signals (a combination of inputs and/or outputs) can be handled at the same time
l SDI Input to AES Output audio conversion is available for both PCM and Dolby encoded audio (using
‘Transmit - Analyzer’)
l AES Input signals can be routed to other AES outputs providing a single loop output or up to 3 copy
outputs (using ‘Transmit - Passthrough’)
The window provides a graphical display of the 26-way D-type rear panel connector of the Qx, and labels the
AES pins (pins 1-4). The 'AES Panel' graphic shows the AES I/O BNCs in any AES breakout board connected
to the Qx rear panel D-type connector.
In both graphics, when an AES I/O is active it will glow in the Analyzer color when it is an AES Input (in
'Receive' mode) or the Generator color when it is an AES Output (in 'Transmit' mode).
In the lower half of the window, a table shows the status of each AES I/O. For AES Outputs the table also
shows the transmit mode source. Audio transmit source issues are highlighted in the table text:
l Red (configuration error), Yellow (audio source not present)
Hovering over the text reveals a tooltip outlining how to fix the issue.
Configuration of the AES I/O's is carried out in the instrument submenu.
Each AES I/O can be set as an input (receive), or output (transmit):
l Off: AES I/O is switched off
l Receive: I/O is set to AES Input
l Transmit - Generator: I/O is set to AES Output
PHABRIX Qx User Manual Page 27
Page 40
The output audio signal source is the Qx audio generator (See ‘Audio’ tab of ‘Generator –
Configuration’ instrument.)
l Transmit - Analyzer: I/O is set to AES Output
The output audio signal comes from Image/Sub-image 1 of the Qx analyzer input (SDIor IP
2022-6)
l Transmit - Passthrough: I/O is set to AES Output
The output audio signal is routed from the chosen AES input ‘Passthrough Source’
Configure the AES I/O's via the instrument submenu:
l AES 1/2/3/4 Mode > [Off, Receive, Transmit - Analyzer, Transmit - Generator, Transmit - Passthrough]
l AES 1/2/3/4 Mode > Transmit - Analyzer/Generator > AES 1/2/3/4 Transmit Pair > [Group 1: Pair 1, Group
1: Pair 2, Group 2: Pair 1, Group 2: Pair 2, Group 3: Pair 1, Group 3: Pair 2, Group 4: Pair 1, Group 4: Pair 2,
Group 5: Pair 1, Group 5: Pair 2, Group 6: Pair 1, Group 6: Pair 2, Group 7: Pair 1, Group 7: Pair 2, Group
8: Pair 1, Group 8: Pair 2]
l Passthrough Source > [AES 1, AES 2, AES 3, AES 4]
Analysis
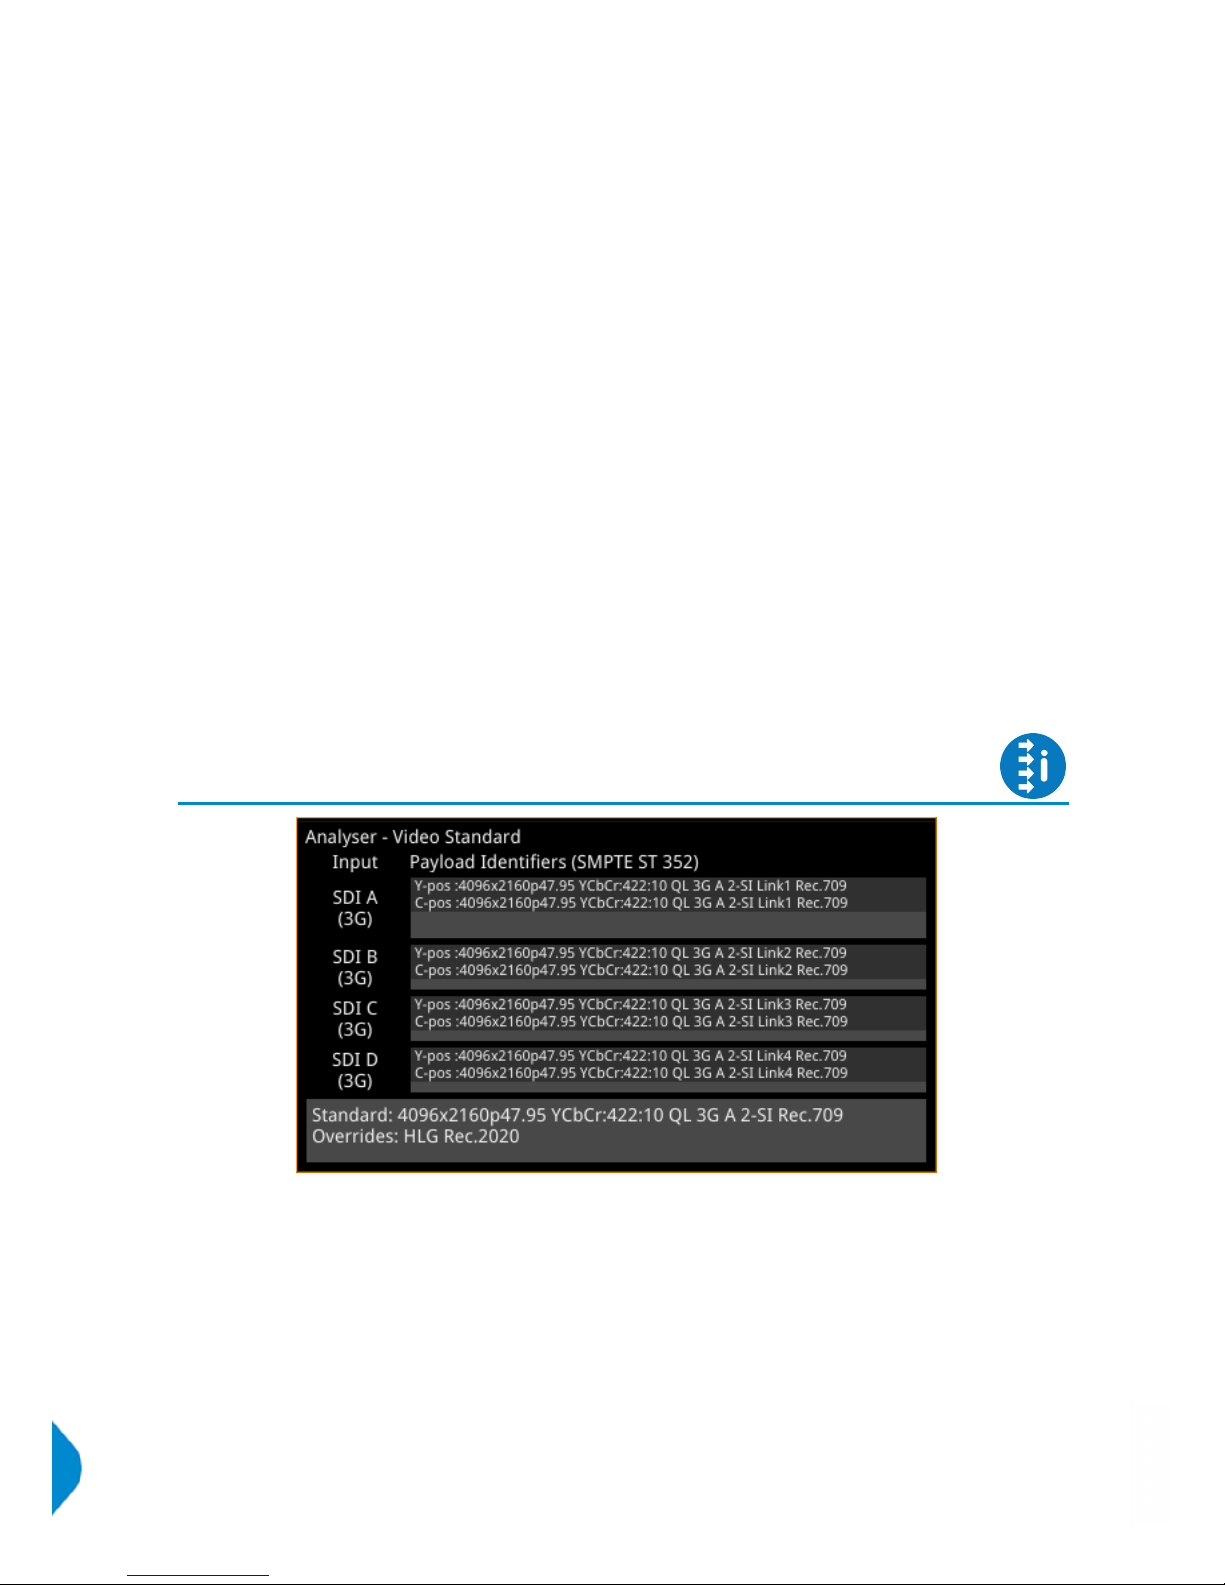
Analyzer - Video Standard
The ‘Analyzer - Video Standard’ window displays the payloads of the video standard being analyzed. It
lists the payloads on SDI (SDI Modes) / 2022-6 SFP (IP Mode) input signals. The lower pane provides a
summary of the standard and of any analyzer overrides set.
The Payloads are identified primarily by ST-352 packets - if these are missing the signal stats will be
analyzed and a best guess payload identifier will be listed.
Unstable payloads, or those with damaged or missing ST 352 packets are indicated within the ‘Analyzer Video Standard’ window. Payload identifier errors are shown in red, warnings are indicated in yellow.
Ignore Payload Identifier Packets (ST 352)
ST-352 packets can be ignored such that a best guess payload identifier is used.
Page 28 PHABRIX Qx User Manual
Page 41

In situations where the accuracy of incoming ST-352 packets cannot be relied upon, the instrument can
be forced to ignore the ST-352 packets, and image parameter overrides can be set by the user. To
ignore incoming ST-352 packets enable ‘Ignore Payload Identifier Packets (ST-352)’ in the submenu.
l Ignore Payload Identifier Packets (ST 352) > [Enabled, Disabled]
Payloads with ignored ST 352 packets are indicated within the ‘Analyzer - Video Standard’ window.
Transfer Curve and Colorimetry Overrides
HDR content may still contain the SMPTE payload ID for SDR and Rec.709 color space (as ‘standard’).
Therefore, when analyzing HDR and WCG (Wide Color Gamut) content, overrides can be enabled for the
appropriate HDR transfer curve and color space:
l Enable Transfer Curve Override > [Enabled, Disabled]
l Transfer Curve Override > [SDR-TV, HLG, PQ, S-Log3]
l Enable Colorimetry Override > [Enabled, Disabled]
l Colorimetry Override > [Rec.709, Rec.2020]
Sub Image Pixel Mapping Format Override
Where sub image format signals are delivered without ST-352 packet payload IDs or with mislabeled sub
image mapping information, e.g. if 2 sample interleave (2-SI) signal content is delivered incorrectly as square
division (SQ), it is necessary to be able to override the erroneous mapping in order to display the content
correctly.
l Enable Sub Image Pixel Mapping Format Override > [Enabled, Disabled]
l Sub Image Pixel Mapping Format Override > [2 Sampl...erleave, Square Division]
Note: The resulting effects of enabled overrides will be reflected in other image analyzer instruments within
the Qx Analyzer instrument toolset.
PHABRIX Qx User Manual Page 29
Page 42

Analysis
Stats - SDI In A, B, C, D [SDI Modes]
[SDI Modes]
‘Stats - SDI In A’, B, C and D provide information to verify the format of the signals being analyzed, and input
cable length information. A video signal may be comprised of up to four separate SDI signals each providing
a sub image.
Example 1 shows the display of data from a single 12G input on input A
Example 2 shows the display of data from a quad 3G input - hence 4 separate video status windows
Note: Cable measurements accurate to approximately +/- 10 meters.
Page 30 PHABRIX Qx User Manual
Page 43

System
IP Receive - Stream Select (SFP A) [IP Mode]
[Qx IP / PHQXO-IP-DEC (Qx 12G)]
The ‘IP Receive - Stream Select (SFP A)’ window is where a stream can be selected for reception. An IP
video source can be switched here easily. Multicast status is displayed at the top of the instrument window,
and multicast requests can be setup and canceled via the submenu.
The instrument provides a list of all available streams - both multicast and unicast. For each stream, details
including: IP video protocol, IP address, UDP port and SSRC information are all displayed; and video format
information for the selected stream, stored at the IP level, is summarized in the ‘Receive Src IP’ pane.
Once selected, a new stream is received by pressing the ‘Receive Src IP’ pane.
The instrument window will indicate which stream the analyzer is currently locked to.
The submenu, accessed by right-clicking within the ‘IP Receive - Stream Select (SFP A)’ window calls up
multicast setup, SSRC receive conditions, and list clearing controls.
The displayed list of available streams can be cleared by selecting:
l Clear input list
Where an SSRC ID is included in an available stream, the tool can be set to only receive a stream with an
‘Exact’ ID match, or one with ‘Any’ value.
l SSRC match > [Exact, Any]
Multicast Setup
Streams can be accessed via an IGMPv2 or v3 multicast request. The details of the multicast to be joined
must be entered first. The destination IP address of the multicast can entered into the destination IP address
fields by keyboard or via the on-screen keypad:
l Multicast req: Dst IP addr > [224.0.0.1...239.255.255.255]
Streams transmitting on this multicast will be listed in the instrument window.
To join a multicast:
l Request Multicast
To exit a multicast:
l Leave Multicast
PHABRIX Qx User Manual Page 31
Page 44

System
IP Receive Interpacket Timing (SFP A) [IP Mode]
[PHQXO-IP-NAT+PHQXO-IP-DEC (Qx 12G)]
The instrument provides analysis of IP media packet reception, and gives a real-time indication as to the
health of the received signal.
The histogram displays the distribution of all packet arrival intervals within a given second - the mean,
minimum, and maximum packet intervals for this period are also displayed. Outlier times significantly longer
than the expected mean, indicate significant delays in packet propagation. A high occurrence of such long
intervals characterizes high jitter in a network.
Right-clicking reveals a submenu with the option to plot the number of received packets on the vertical axis,
in either a linear or logarithmic scale:
l Y-Axis Scale > [Linear, Log10]
System
Stats - IP Receive (SFP A) [IP Mode]
[PHQXO-IP-NAT+PHQXO-IP-DEC (Qx 12G)]
‘Stats - IP Receive (SFP A)’ provides information to verify the format of the signal being analyzed.
Page 32 PHABRIX Qx User Manual
Page 45

Analysis
Analyzer - Picture
The picture view shows the generator pattern currently being analyzed by the Qx. Double-click within
the window to resize it between 1/16 of a screen, 1/4 screen, and full screen.
Blanking Area
In the right-click submenu, the user can enable ‘Show Blanking’. This will offset the picture to the right,
revealing the blanking area.
l Show Blanking > [Enabled, Disabled]
Note: ‘Show Blanking’ is not available for multiple sub-image video standards as the active picture is
separated from the blanking regions during active picture reconstruction.
PHABRIX Qx User Manual Page 33
Page 46

Closed Captions
Closed captions carried in the ancillary data of a signal are detected by the Qx. To display OP47 closed
captions in the picture view, enable the 'Closed Captions' submenu option and select the OP47 page
containing the relevant closed captions:
l Closed Captions > [Disabled, OP47]
l Closed Captions > OP47 > OP47 Page > [slider, 100...8ff]
Picture Cursor
With Picture Cursor enabled, a specific line and pixel position can be selected in the picture. This feature is
dynamically linked to both the Waveform and Dataview instruments; so measurements from the selected
picture position can be taken from these tools at the same time.
l Picture Cursor > [Enabled, Disabled]
l Picture Cursor > Enabled > Line > [1 to Total no. of Active Lines for current standard]
l Picture Cursor > Enabled > Pixel > [0 to (Total no. of Active Pixels for current standard -1)]
Note: Keep in mind when using Dataview in conjunction with the Picture and Waveform instruments that the
Dataview includes horizontal blanking, and so uses transport line numbers, not active picture line numbers.
Note: ‘Picture Cursor’ is unavailable when ‘Show Blanking’ is enabled.
HDR Heat-map (False Color Overlay) [PHQXO-HDR]
A false color overlay can be applied to the picture view, to highlight luminance ranges of the image that are
of particular interest be they High Dynamic Range (HDR) or otherwise.
The picture can be displayed in gray scale. If enabled at the same time as ‘False Color Highlighting’, all
image elements outside of the enabled false color overlay luminance range(s) will be displayed in gray
scale mode; leaving the false color highlight elements to stand out move:
l Greyscale mode > [Enabled, Disabled]
Different types of false color overlay may be applied to clearly visualize different image details, and a custom
mode is provided to allow the creation of a modified or bespoke overlay:
l False color ranges > False Color Highlighting > [Disabled, PQ HDR, SDR All Bands, SDR Shadow, SDR
Skin Tones, SDR Highlights, Out of Range, S-Log3 Out of Range, Custom]
The range(s) and colors of a selected false color overlay can be modified by adjusting the 7 overlay bands. Up to
7 distinct ranges can be simultaneously enabled in a single overlay. If adjusted, the new or modified overlay will
be designated as the ‘Custom’ overlay type.
Page 34 PHABRIX Qx User Manual
Page 47

When False Color Highlighting is enabled, a scale with numeric and graphic display of the luminance
range(s) of the overlay in use, is available:
l False Color Overlay Scale > [Enabled, Disabled]
The required luminance units for the scale can be selected:
l Luminance Measurement > [Decimal Level, PQ Nits]
PHABRIX Qx User Manual Page 35
Page 48
Analysis
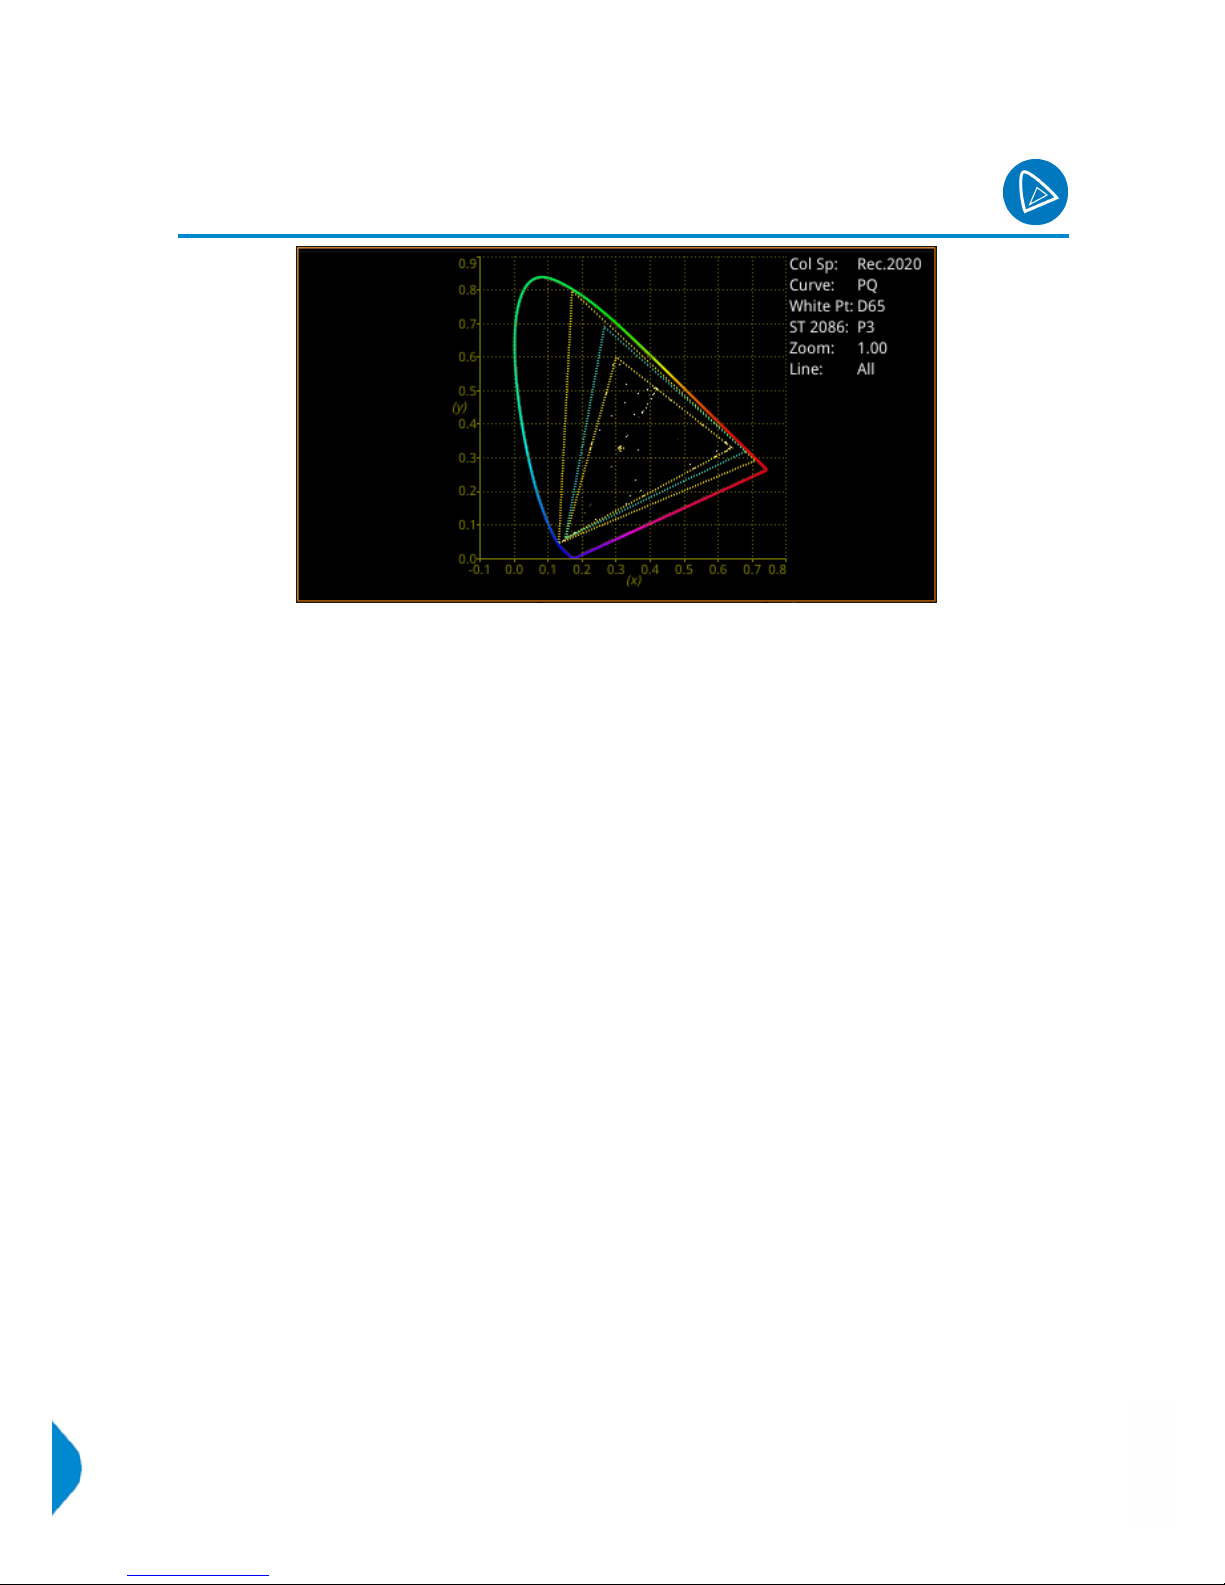
Analyzer - CIE Chart
[PHQXO-HDR]
The CIE 1931 x y chart provides a display of signal chromaticity - complete with Rec. 709, Rec. 2020, ST
2086 gamut overlays and the Illuminant D65 white point reference.
CIE Chart setup is accessed by right-clicking within the chart area:
l Rec.709 Triangle > [Enabled, Disabled]
l Rec.2020 Triangle > [Enabled, Disabled]
l ST 2086 Triangle > [P3, Disabled]
l D65 White Point > [Enabled, Disabled]
l Single Line Mode > [Enabled, Disabled]
l Single Line Mode > Enabled > Line Number > [1 to Total no. of Active Lines for current standard]
l Zoom > [slider 1.00...4.00]
l Zoom > x Position > [slider, left to right]
l Zoom > y Position > [slider, bottom to top]
l Brightness > [slider 1..31]
l Gamma > [slider 1..255]
l Persistence [slider 1..255]
l S-Log3 Mode [S-Log3, SR Live]
Zoom can also be performed by hovering the mouse crosshairs over the chart and scrolling the mouse wheel.
Panning, in the x and y axes can also be performed by hovering the mouse crosshairs over the axis in question
and scrolling the mouse wheel.
Page 36 PHABRIX Qx User Manual
Page 49
Analysis
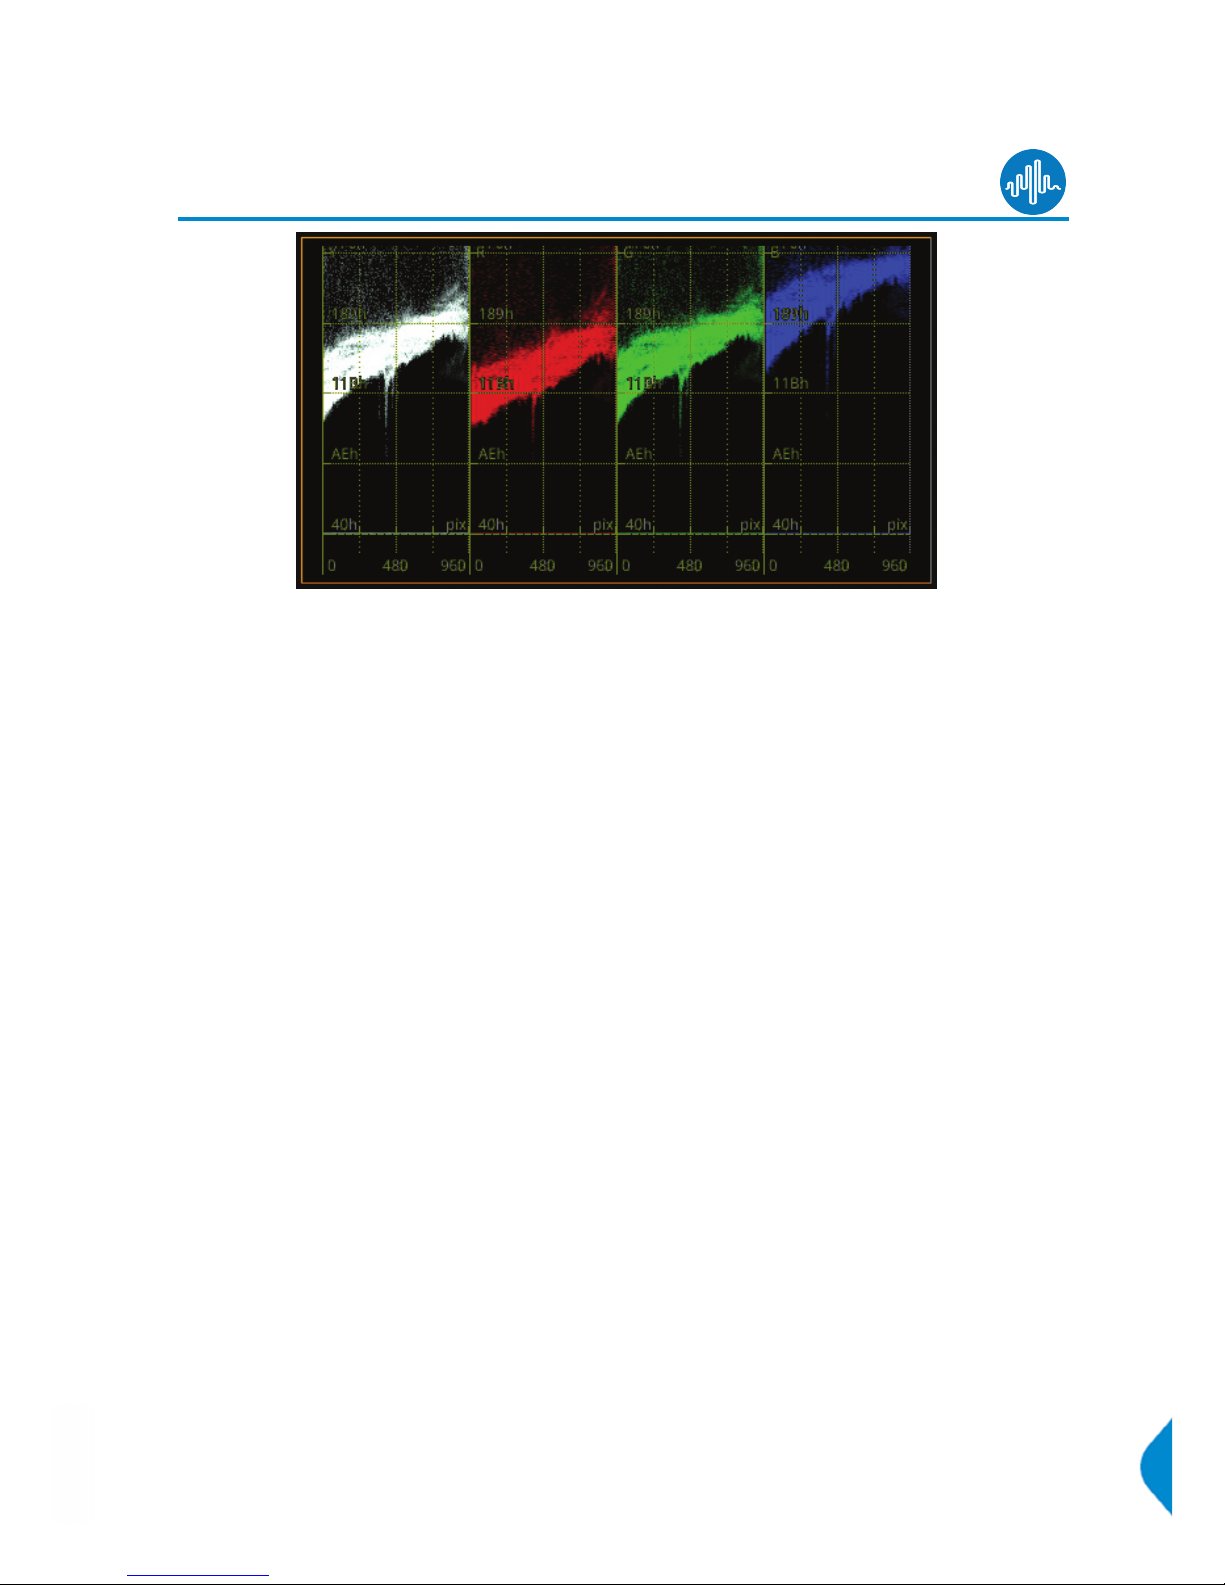
Analyzer - Waveform
The Waveform instrument provides various analysis settings including Single Line Mode and Picture Cursor
control.
When Picture Cursor is enabled, the cursor is dynamically linked to the cursor in the Picture instrument, and
to Dataview navigation. Clicking the cursor in a new position in the Waveform window updates the pixel and
active picture line position selected in the Picture instrument, and the pixel and transport line position
selected in Dataview.
Markers are observable in the Cb Cr waveforms when enabled in the Vectorscope instrument. The position
of the markers tracks the positioning of the user markers in the Vectorscope.
Waveform setup is accessed by right clicking within the waveform area:
l Parade Mode > [YCbCr, Y, Cb, Cr, RGB, GBR, YRGB, YGBR, Red, Green, Blue]
l V Scale > [Percent, Hex Value, Decimal Value, Millivolts]
l V Scale Nits > [Hidden, Right Side, Left Side]
l H Scale > [Pixels, % Line]
l Filter > [Flat, Low Pass, Raw]
l Single Line Mode > [Enabled, Disabled]
l Single Line Mode > Enabled > Line Number > [1 to Total no. of Lines for current standard]
l Picture Cursor > [Enabled, Disabled]
l Picture Cursor > Enabled > Pixel Number > [0 to (Total no. of Pixels for current standard -1)]
l Diffuse White Marker > [Enabled, Disabled]
l User Markers (%/Dec/mV) > [Enabled, Disabled]
l User Markers > Enabled > Marker 1 > [slider, bottom to top]
l User Markers > Enabled > Marker 2 > [slider, bottom to top]
l H Magnification > [slider 1.00...10.00]
l H Magnification >H Position > [slider, left to right]
l V Magnification > [slider 1.00...4.00]
l V Magnification > V Position > [slider, bottom to top]
PHABRIX Qx User Manual Page 37
Page 50
l Brightness > [slider 1..31]
l Gamma > [slider 1..255]
l Persistence [slider 1..255]
l Monochrome Mode [Enabled, Disabled]
l S-Log3 Mode [S-Log3, SR Live]
Analysis
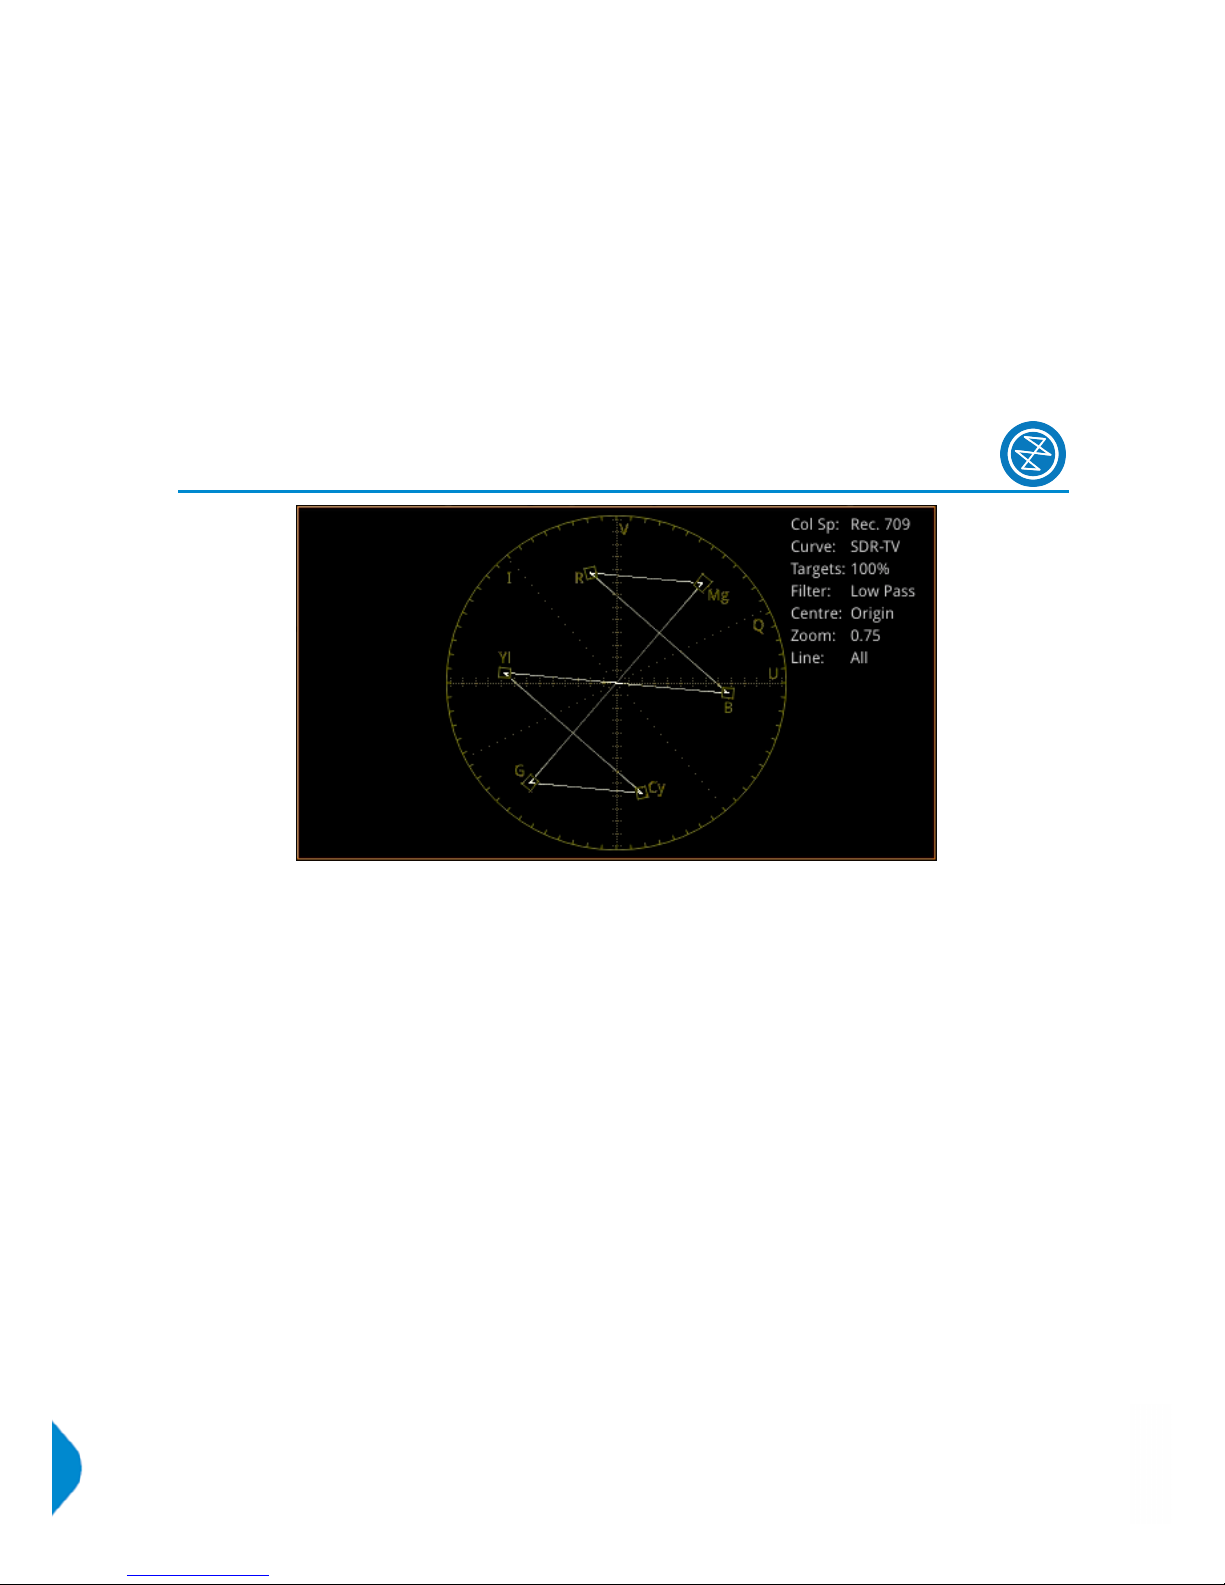
Analyzer - Vectorscope
Vectorscope setup is accessed by right clicking within the vectorscope area:
l Targets > [Off, 75%, 100%]
l User Markers > [Enabled, Disabled]
l User Markers > Enabled > Marker Selected > [Marker 1, Marker 2] > Marker Angle > [slider
0.00...359.99]
l User Markers > Enabled > Marker Selected > [Marker 1, Marker 2] > Marker Gain > [slider
0.00...100.00]
l I/Q Axes > [Off, I Only, Q Only, Both]
l Filter > [Flat, Low Pass, Raw]
l Centre > [Origin, Red, Green, Blue, Magenta, Cyan, Yellow, Marker 1, Marker 2]
l Single Line Mode > [Enabled, Disabled]
l Single Line Mode > Enabled > Line Number > [1 to Total no. of Lines for current standard]
l Zoom > [slider 0.50...4.00]
l Brightness > [slider 1..31]
l Gamma > [slider 1..255]
l Persistence [slider 1..255]
Page 38 PHABRIX Qx User Manual
Page 51

Analysis
Eye - SDI in A [SDI Modes]
PHQX01E / PHQX01E-IP / PHQXM-01E]
One of the unique features of the Qx is the PHYSICAL layer analysis toolset. The Qx contains fundamental
technology developed and patented by PHABRIX which makes it unique where physical layer compliance
measurements are required up to 12 Gbps.
The Qx employs an analog front end providing in excess of 30 GHz bandwidth (5th harmonic of the 6GHz
fundamental for 12G-SDI). Featuring PHABRIX RealTime Eye RTE™, the Qx provides broadcast engineers
with a reliable, instantaneous physical layer display with automatic measurements to SMPTE standards.
The Qx enables measurement of both overshoot and undershoot along with amplitude, rise time, fall time
and delta - compulsory when testing against SMPTE standards. Accurate measurements are obtained within
seconds of connecting an SDI signal, making for a very fast system testing solution. Out of specification
measurements are indicated in red.
Example 1: 12G-SDI Eye pattern display with 100 kHz jitter filter
Example 2: 3G-SDI Eye pattern display with 100 kHz jitter filter
Note: ‘SDI In A’ has a red nut to indicate it is the SDI BNC that has the eye and jitter circuitry behind it
Note: The use of SFPinputs with the ‘Eye - SDI In A’ toolset is not supported
PHABRIX Qx User Manual Page 39
Page 52
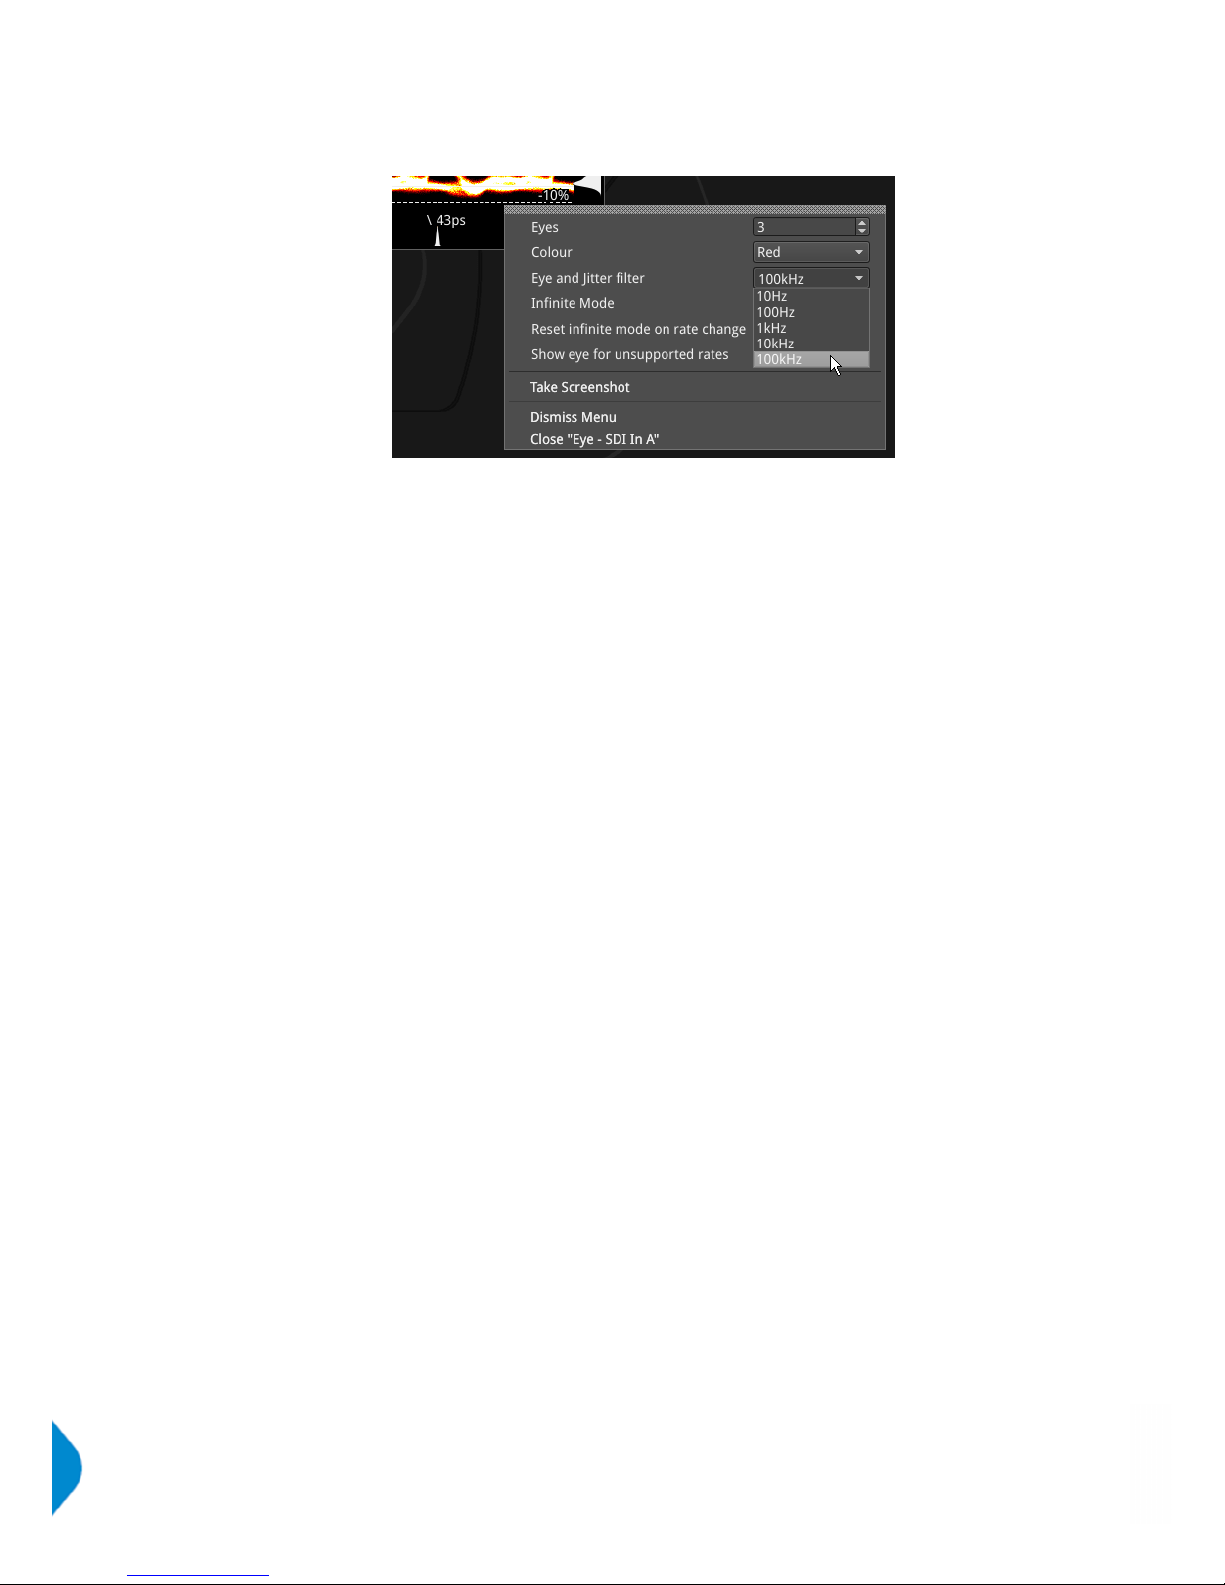
The Physical Layer toolset provides several settings in the right-click submenu.
(A table showing the SMPTE tolerances for each standard is available at the end of this manual.)
Selections include:
l Eyes > [1, 2, 3...20]
l Color > [Green, Heat, Red, Ferrara, Green-red, Blacklight]
l Eye and jitter filter > [10Hz, 100Hz, 1kHz, 10kHz, 100kHz]
l Infinite mode > [Enabled, Disabled]
l Reset infinite mode on rate change > [Enabled, Disabled]
l Show eye for unsupported rates > [Enabled, Disabled]
The display also provides:
l Timing jitter thermometer color coded according to analyzed SDI standard
l Alignment jitter thermometer color coded according to analyzed SDI standard
l On screen indication of 20% and 80% levels for rise and fall time measurement
l On screen indication of +10% and -10% levels for overshoot and undershoot analysis
l Positive and negative amplitude values providing DC offset information
l Horizontal histogram of eye crossing point (0mV threshold)
l Vertical histogram providing indication of energy distribution over all samples
Page 40 PHABRIX Qx User Manual
Page 53

Analysis
Jitter - SDI in A [SDI Modes]
[PHQX01E / PHQX01E-IP / PHQXM-01E]
The jitter toolset is available on the ‘SDI In A’ BNC (the one with the red nut).
The jitter instrument shows automated measurements to SMPTE standards.
Readings for each of the filters are displayed as an overlay on the right hand side of the instrument.
Any red text displayed indicates an out of specification reading.
As with the Eye instrument, a submenu is available using the right-click on the mouse control:
l Scale > [sliding scale: Y graticule adjustment from +/- 0.2 UI to +/-8UI]
l Trigger > [None, Single Line, Two Lines, Single Field, Frame]
l Eye and jitter filter > [10Hz, 100Hz, 1kHz, 10kHz, 100kHz]
l Infinite Mode > [Enabled, Disabled]
l Jitter Color > Waveform color selection
Color selection is via a HSV tool providing two cursors. The left hand color rectangle allows
selection of hue (horizontal) and saturation (vertical). The right hand vertical bar selects color
lightness.
l Show jitter for unsupported rates > [Enabled, Disabled]
Trigger modes are useful for correlating jitter content to line and frame rate frequencies.
PHABRIX Qx User Manual Page 41
Page 54
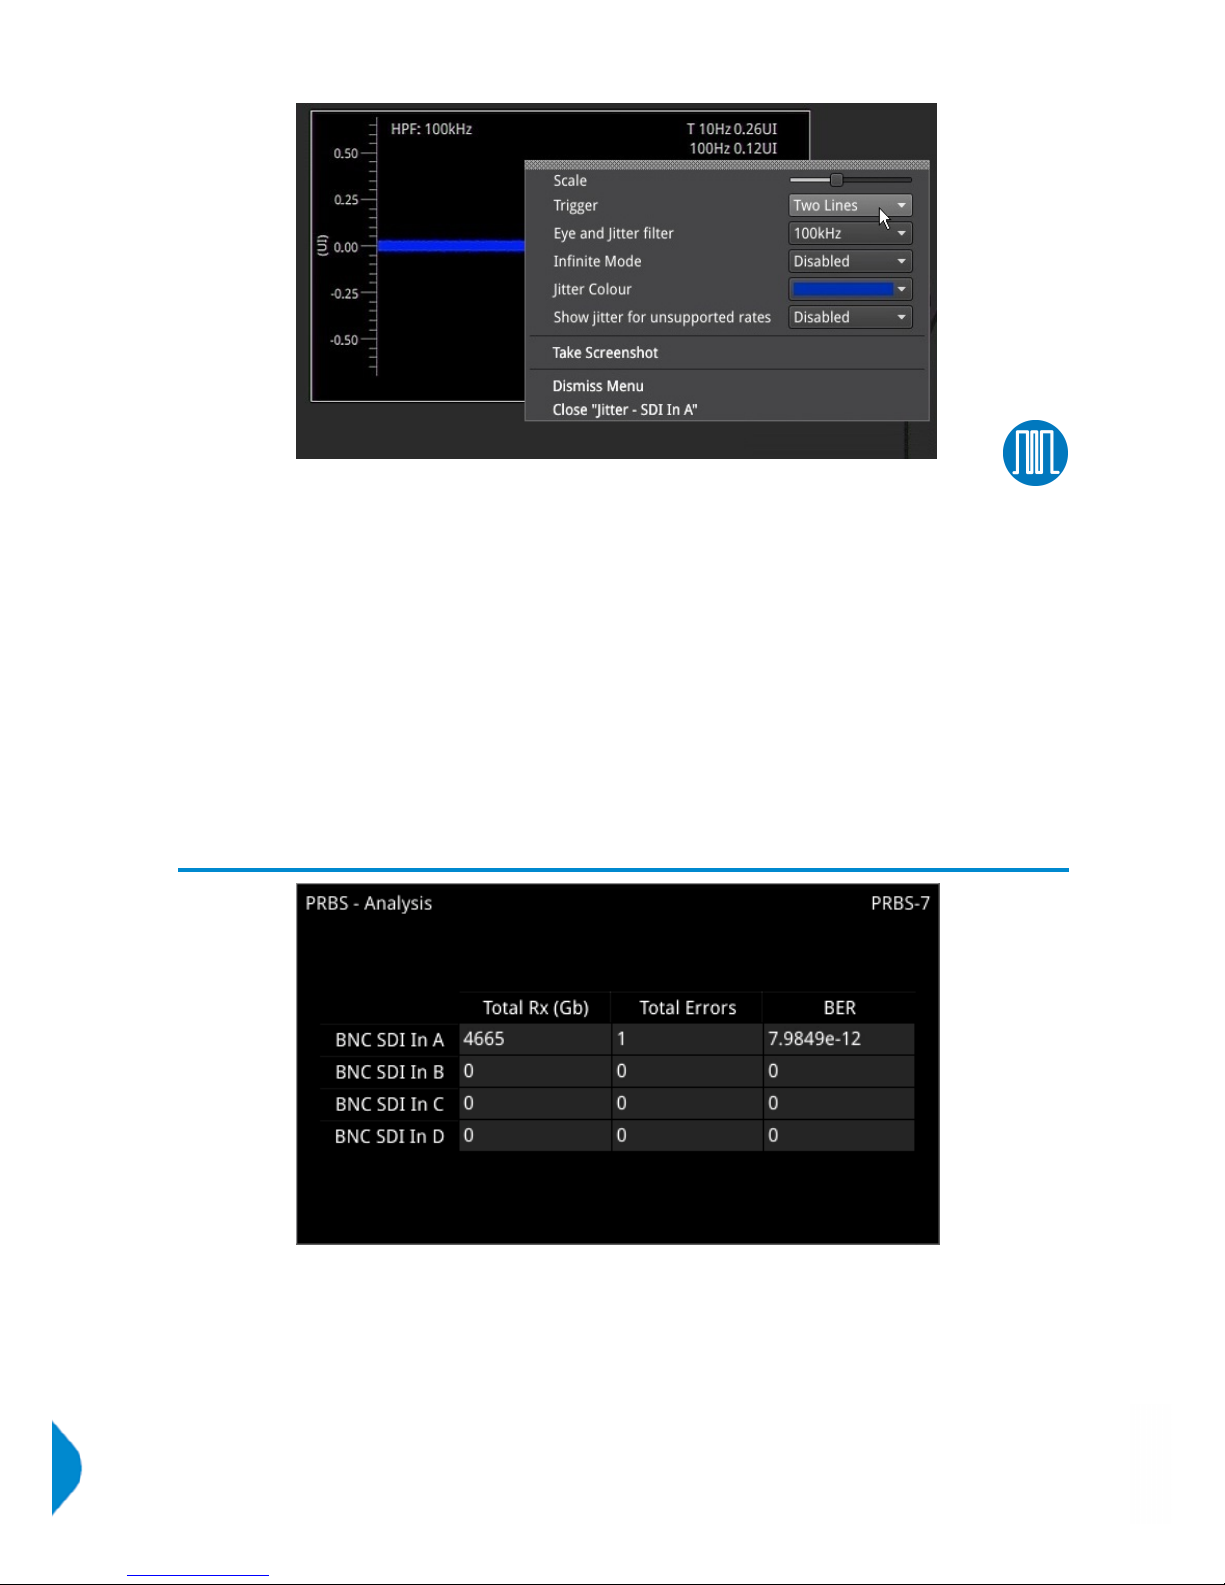
The Jitter and Eye analysis instruments, used in conjunction with the ‘Jitter Insertion Mode’ feature of
‘Generator – Video Standard’ - available in ‘SDI Stress Toolset’ Mode [PHQXO-SDI-STRESS], provide an endto-end jitter generation and analysis toolset.
Note: The use of SFPinputs with the ‘Jitter - SDI In A’ toolset is not supported.
Analysis
PRBS Analysis [SDI Stress Mode]
[SDI Stress Toolset Mode; PHQXO-SDI-STRESS+PHQX01E /
PHQX01E-IP / PHQXM-01E + PHQXO-GEN (Qx IP)]
The ‘PRBS - Analysis’ instrument displays the total amount of received PRBS data, total number of errors,
and the bit error rate (BER), for each SDI input link on the Qx.
PRBS analysis is activated in the instrument submenu, from where the incoming PRBS signal type must be
selected:
l PRBS Analysis Mode > [Disabled, PRBS-7, PRBS-9, PRBS-15, PRBS-23, PRBS-31]
To reset the ‘PRBS – Analysis’ table, select:
l Reset
Page 42 PHABRIX Qx User Manual
Page 55

Note: PRBS signal generation is available in the 'Generator - Video Standard' instrument submenu, as part of
'Advanced Generation Tools', in SDI Stress Toolset Mode [PHQXO-SDI-STRESS].
Note: Upon power up of the Qx unit, immediate use of PRBS generation with 'PRBS - Analysis' will not work,
as the 'PRBS - Analysis' tool cannot determine the received data rate. The initial generation of an SDIsignal
must be made to set up the clock rates. Once this is done, 'PRBS Mode' can then be enabled in 'Advanced
Generation Tools', and 'PRBS - Analysis' will work after that.
PHABRIX Qx User Manual Page 43
Page 56
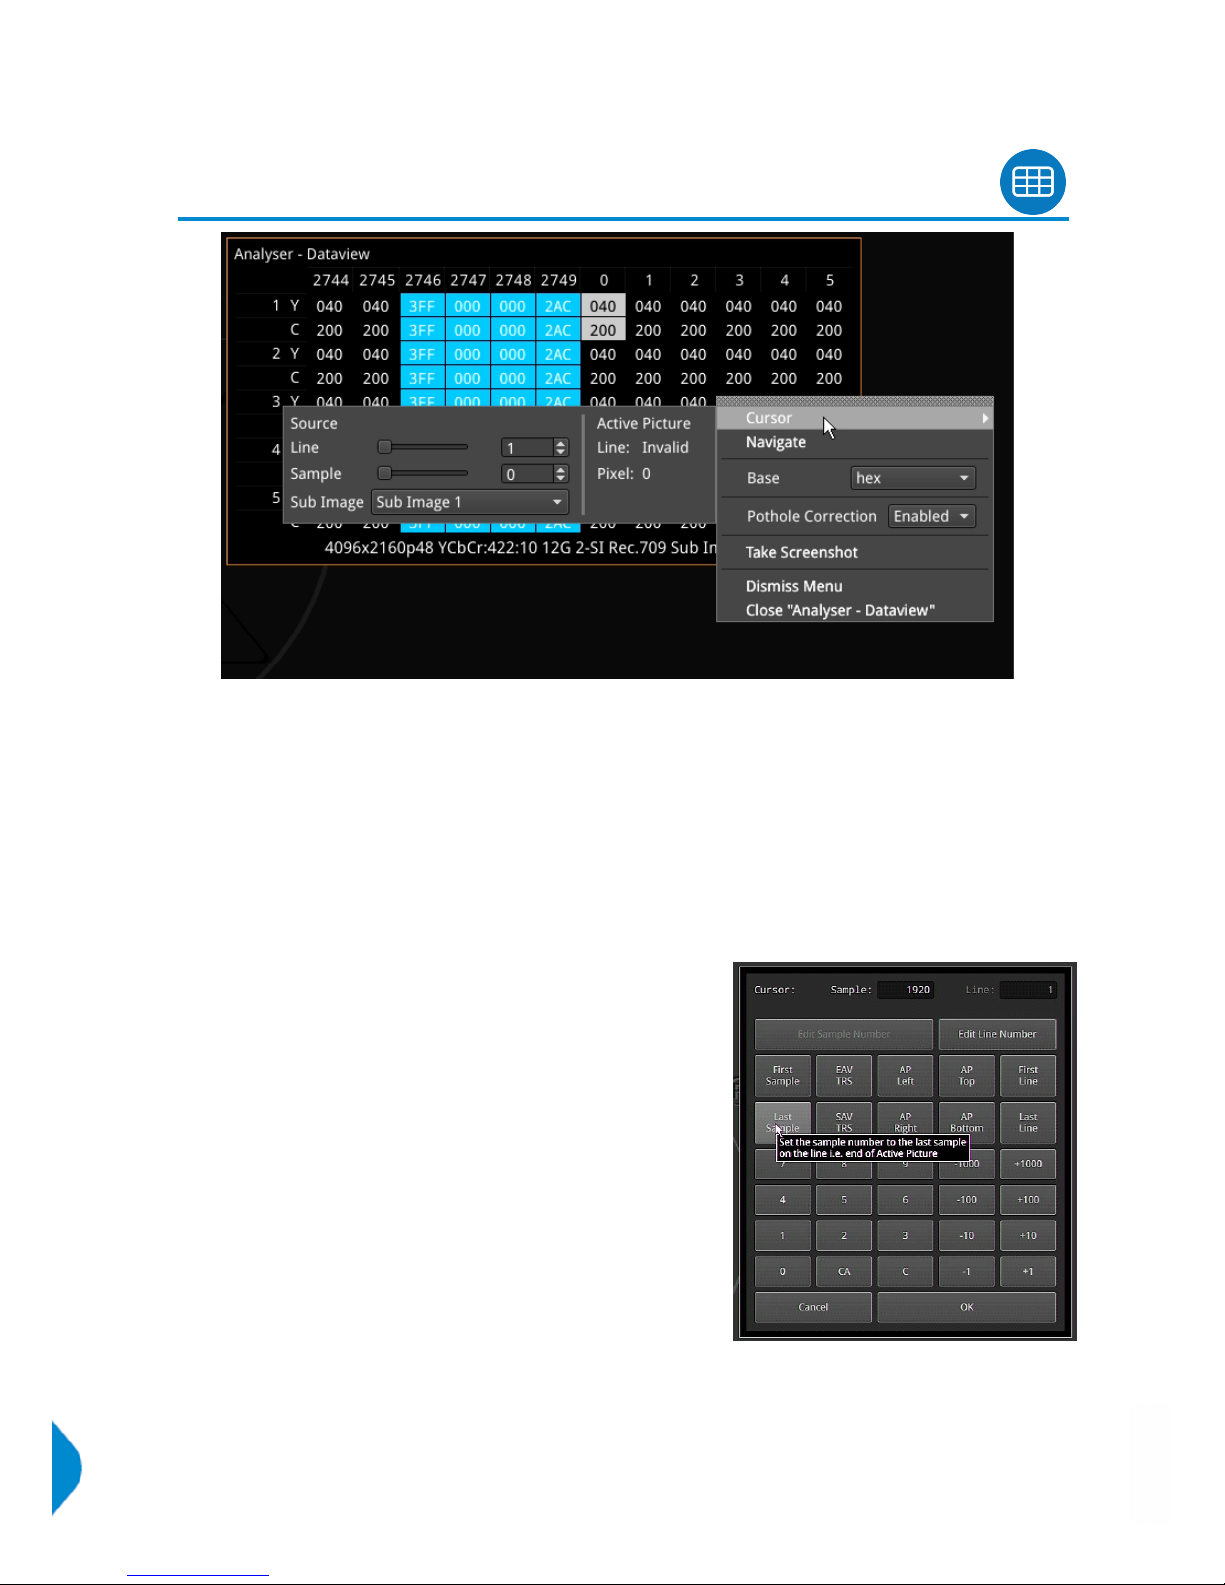
Analysis
Analyzer - Dataview
This instrument displays the raw data present in the signal, be it - 1.5G HD-SDI, 3G-SDI, 6G-SDI, 12G-SDI or
2022-6. The data can be observed in hexadecimal, decimal, or binary formats, and each data word has a
sample & line co-ordinate. The instrument displays the entire video frame complete with active video, TRS
words, and blanking information. Changing the window size changes the amount of data displayed. For
6G-SDI and 12G-SDI video standards, pre-imposed sync bit correction is provided.
Data is presented with a color coding for both text and background:
l Foreground color indicates video sample type: Y (white), Cb (blue), Cr (red)
l Background color indicates data type: TRS words (blue), Blanking (black), Active picture (green)
The user can quickly navigate the dataview window using
sample and line selection in the 'Cursor' tool or using the
'Navigate' keypad.
Both tools are dynamically linked to an enabled 'Picture Cursor'
in the Waveform and Picture instruments.
The Cursor tool provides transport line and sample sliders to
move around the dataview, at the same time as giving the
corresponding Active Picture line and pixel values.
The 'Navigate' keypad (shown, right) allows the user to enter
the co-ordinates they want, and has buttons for quick
navigation to key locations: first and last samples or lines, end
of active video (EAV) and start of active video (SAV) TRS
words, active picture (AP) furthest - left, right, top, and bottom
positions.
The following right-click submenu options are presented:
l Cursor > Source > Line > [1 to Total no. of Lines for current standard]
l Cursor > Source > Sample > [1 to Total no. of Lines for current standard]
Page 44 PHABRIX Qx User Manual
Page 57

l Cursor > Source > Sub Image > [Sub Image 1, Sub Image 2, Sub Image 3, Sub Image 4] (standard
dependant)
l Navigate > [calls up navigation keypad]
l Base > [hex, decimal, binary]
For 6G-SDI and 12G-SDI video standards the option is provided, to view the data stream before sync bit
removal or after sync bit removal.
l Sync Bit Removal > [Enabled, Disabled]
Enabling ‘Sync Bit Removal’ reverts affected bits to the original value they held prior to sync bit insertion.
This reversion is observable in the TRS and ADF words.
Note: This feature applies only to 6G-SDI and 12G-SDI video standards, where the inclusion of a sync bit is
defined in the SMPTE standards. Signals not containing sync bits are unaffected.
Analysis
Video Timing & System Reference
The upper part of the instrument view is devoted to ‘SDI A vs System Reference’ timing comparison
(‘Decapsulated vs Reference’ in IP Mode); and system reference is set in the instrument submenu.
The lower part displays 'SDI Co-Timing' information for elements of a quad or dual link signal.
System Reference Lock
The submenu accessed by right clicking within the ‘Video Timing and System Reference’ window calls up
system reference locking controls; defining the reference that the Qx system and any signal it generates will
be locked to:
l System Reference > [Free Run, External Reference, SDI (SDI Modes only)]
l Default To Freerun > [Enabled, Disabled]
System reference status information is displayed in the upper right hand corner of the instrument, and any
reference health state error will be displayed in red.
PHABRIX Qx User Manual Page 45
Page 58

SDI A vs System Reference / Decapsulated vs System Reference
This section of the instrument displays the timing difference between the SDI A input signal (or Decapsulated
input - IP Mode) and the system reference the Qx is locked to. Both graphic and numeric (spatial and
temporal) values are presented by the instrument for this measurement. A relative timing bar tool dynamically
measures the timing of the input (white triangle) against the system reference (centrally fixed black vertical
crosshair).
The tool can be adjusted to display readings at frame scale, or zoom in all the way to a fraction of a line:
l Reference Timing Meter Range > [+/- 0.1 line, +/- 0.5 line, +/- 0.5 frame]
Input Measurement Offset
In addition to measurement of the input against absolute system reference, a system reference offset can
also be applied in the tool to measure against. The offset position is indicated on the relative timing bar tool
with a black triangle.
Offsets can be entered in temporal or spatial terms:
l Input Measurement Offset Type > [Time, Lines And Pixels]
Selecting ‘Time’ reveals a drop-down field where the timing offset can be set in microseconds:
l Input Measurement Offset Type > Time > Input Measurement Time Offset > [0.00, +/- 0.01, etc...]
Selecting ‘Lines And Pixels’ reveals drop-down fields where the offset can be set in these terms:
l Input Measurement Offset Type > Lines And Pixels > Input Measurement Line Offset > [0 to +/- (Total
no. of Lines for current standard -1)]
l Input Measurement Offset Type > Lines And Pixels >Input Measurement Pixel Offset > [0 to +/- (Total
no. of Pixels per Line for current standard -1)]
The input measurement offset can be set to the same position as the current ‘SDI In A’ (or ‘Decapsulated’ - IP
Mode) signal:
l Set Input Measurement Offset to current
The input measurement offset is removed by selecting in menu:
l Clear Input Measurement Offset
SDI Co-Timing [SDI Mode]
Many of the standards associated with UHDTV are a combination of signals to form the image plane.
Relative timing tools indicate that the quad or dual elements creating the single picture are correctly aligned
and compared with reference. Both graphic and numeric values are presented by the instrument for this
critical measurement. Any red text displayed indicates an out of specification measurement.
Note: The Timing instrument in this software release is locked to Input A.
Page 46 PHABRIX Qx User Manual
Page 59

Analysis
Analyzer - Ancillary Status
The Qx has a sophisticated real-time display to analyze ancillary data in the signal. UHDTV has a new set of
rules for carrying this data. The clear graphical representation of this is required to establish compliance.
Color coded signal conditions - present, lost, and error are all available. Additional data is displayed as the
instrument is resized.
In addition to the option of a combined view, this software revision introduces tabs for separate 'Grid' and
'List' views of the ancillary data.
One view, Grid, gives a high level overview of packets present.
In the other 'List View' tab headings can be expanded, allowing for a granular drill down of discovered
ancillary packets – providing info on presence, checksum, Parity, and DBN. Packets can also be selected
here for ‘Analyzer – Ancillary Inspector’ analysis.
Colour coding provides further health info at a glance:
l White - Indicates ANC packets present and correct
l Red - Indicates ANC packets present but in error
l Yellow - indicates ANC packets present and correct but there has been a previous error
From the submenu – accessible in all views - ancillary status analysis can be reset:
l Reset
Display style can be selected:
l View > [Tab View, Combined]
The combined view provides both the high level overview grid at the top and the expandable list view
underneath, all in a single window, as shown below:
PHABRIX Qx User Manual Page 47
Page 60

The Filter submenu drop down contains all packet types currently present (or a type that you have selected
in ‘Grid View’). Here, a single ancillary packet type can be selected to filter the Ancillary Status List to show
only information for the selected packet type:
l Filter > [None, ...(various ancillary packet types)]
A user can also change the ancillary packet type being filtered by simply selecting another packet type
from the Grid.
From the List, packets can be selected, and then ancillary inspection intiated by selecting the ‘Inspect…’
submenu option.
(See 'Analyzer - Ancillary Inspector' section of this manual for information on ANCinspection.)
l Inspect...
Note: If no packet type has been selected in 'List view', ‘Inspect..’ will be unavailable.
Selecting 'Inspect...' will send the inspection request over to the 'Analyzer - Ancillary Inspector' instrument. (If
'Analyzer - Ancillary Inspector' is not currently open, the request will open this instrument too.) The inspection
request will be loaded into the 'Identifier' field of the Inspector instrument. If the trigger in 'Analyzer Ancillary Inspector' is set to:
l None - the request will be loaded, but not acted upon
l Single Shot -ANC Inspector will search for packet type and display result once packet is detected.
(The trigger will be set to ‘None’.)
l Contininous - ANC Inspector will continually search for packet type and refresh its displayed results
each time a packet is detected
See 'Analyzer - Ancillary Inspector' section of this manual for more details.
Page 48 PHABRIX Qx User Manual
Page 61

Analysis
Analyzer - Ancillary Inspector
ANC Inspector monitors the analysed signal and displays the contents of selected Ancillary packets within
the SDI data.
The window displays the location of a found packet and the time it was found.
The lower area shows the packet in the hexadecimal form including individual: header words (gray), data
words (black), and checksum (blue). Hovering over each header word reveals more detail.
The main parameter of the ANC Inspector search (Identifier) can be set in the submenu to the ancillary
packet type you are trying to find.
l Identifier > [Any, Custom, S353 MPEG Recoding VANC Space, S353 MPEG Recoding HANC Space,
S305 SDTI, S348 HD-SDTI, S427 Link Encryption Message 1, S427 Link Encryption Message 2, S427
Link Encryption Metadata, S352 Payload ID, S2016-3 AFD, S2016-4 PAN, S2010 ANSI/SCTE, S2031
DVB/SCTE, S2056 MPEG TS, S2068 3D Packing, S2064 Lip Sync, S2108-1 HDR/WCG, ITU-R BT.1685,
OP47 Caption, OP47 VBI/WST, ARIB-TR-B29, RDD18 Metadata, RP214 KLV Metadata VANC Space,
RP214 KLV Metadata HANC Space, RP223 UMID/ID, S2020 Audio Channel Pair 1/2, S2020 Audio
Channel Pair 3/4, S2020 Audio Channel Pair 5/6, S2020 Audio Channel Pair 7/8, S2020 Audio Channel Pair 9/10, S2020 Audio Channel Pair 11/12, S2020 Audio Channel Pair 13/14, S2020 Audio Channel
Pair 15/16, S2051 Two Frame, RDD8 WSS, S12M-2 V-TCode, S2103 Generic Time, EIA-708 Caption,
EIA-608 Caption, S12-3 HFR TCode, RP207 Program, S334-1 Data, RP208 VBI Data, Mark Deleted,
S299-2 3G Audio Control Group 8, S299-2 3G Audio Control Group 7, S299-2 3G Audio Control
Group 6, S299-2 3G Audio Control Group 5, S299-2 3G Audio Audio Group 8, S299-2 3G Audio
Audio Group 7, S299-2 3G Audio Audio Group 6, S299-2 3G Audio Audio Group 5, S299-1 HD Audio
Control Group 4, S299-1 HD Audio Control Group 3, S299-1 HD Audio Control Group 2, S299-1 HD
Audio Control Group 1, S299-1 HD Audio Audio Group 4, S299-1 HD Audio Audio Group 3, S299-1 HD
Audio Audio Group 2, S299-1 HD Audio Audio Group 1, S272 SD Audio Control Group 4, S272 SD
Audio Control Group 3, S272 SD Audio Control Group 2, S272 SD Audio Control Group 1, S315 Camera Pos, RP165 EDH, S272 SD Audio Group 4 Ext, S272 SD Audio Audio Group 4, S272 SD Audio
Group 3 Ext, S272 SD Audio Audio Group 3, S272 SD Audio Group 2 Ext, S272 SD Audio Audio
Group 2, S272 SD Audio Group 1 Ext, S272 SD Audio Audio Group 1]
Triggers can be set in the instrument submenu, and when ancillary data exactly matching the search
parameter(s) is detected, ANC Inspector will be triggered and display the inspection result in the lower part
of the window.
l Trigger > [None, Single Shot, Continuous]
PHABRIX Qx User Manual Page 49
Page 62

.After a detection, where the ‘Trigger’ had been set to ‘Single Shot’, the inspection result will remain in the
results display area, and the trigger state will lapse to ‘None’.
If the trigger had been set to ‘Continuous’, it will remain in this state after successful detection, and will
continuously cause the display to refresh with the results of the next successful detection.
In addition to the ‘Identifier’, other inspection parameters pertaining to data search location can be set
including: Sub Image, Lines, HANC/VANC, and luma or chroma stream (Y-Pos/C-Pos):
l Sub Image > [Any, Sub Image 1, Sub Image 2, Sub Image 3, Sub Image 4, Sub Ima… Link B, Sub Ima…
Link B, Sub Ima… Link B, Sub Ima… Link B]
l Lines > [Any, Inside Range, Outside Range]
l HANC/VANC > [Both, HANC, VANC]
l Y-Pos/C-Pos > [Both, Y-Pos, C-Pos]
Additional parameters can be set to trigger only if errors are present, and the specific error types for the
trigger can be set to include: Checksum, DBN, Parity, and ANC Gap errors:
l Triggers only on Errors > [Enabled, Disabled]
l Triggers only on Errors > Enabled > Checksum Errors > [Enabled, Disabled]
l Triggers only on Errors > Enabled > DBN Errors > [Enabled, Disabled]
l Triggers only on Errors > Enabled > Parity Errors > [Enabled, Disabled]
l Triggers only on Errors > Enabled > Anc Gap Errors > [Enabled, Disabled]
When setting any parameters in ANC Inspector, AND logic applies; so note that ALL active search
parameters will have to be met before ANC Inspector can successfully display results of that search. If
Ancillary packet data in the analysed SDI data does not meet even one of the search conditions set, it will
not be displayed.
In searching for specific data events it is advisable to keep the search parameters as wide as possible to
first establish that you are actually seeing data for the selected ANC packet. Only when the ANC Inspector is
displaying streaming data, should you introduce more specific search parameters.
ANC Inspector can also be used to search more generally for errors with ‘Trigger only on Errors’ enabled
(and ‘Identifier’ set to ‘Any’). Where an error is present in a packet, individual data word text will become red
in the display indicating the exact position of an error within a packet.
Page 50 PHABRIX Qx User Manual
Page 63

Analysis
Analyzer - Audio Channel Status
Audio channel status information is detailed in this window.
The audio source is displayed in the top right hand corner of the window and can be selected via the
instrument submenu:
l Input Select > [Sub Image 1, Sub Image 2, Sub Image 3, Sub Image 4, AES IO]
Audio presence is outlined in the upper part of the display. For each channel, one of the following channel
status indicators will be shown:
l -: No audio
l P: PCM audio is present
l D: Dolby Digital packets are present
l +: Dolby Digital Plus packets are present
l E: Dolby E packets are present
l 4: Dolby AC-4 is present
l ?: Unspecified data is present
In the main table channel status, use, data type, emphasis, source lock, frequency, channel mode, word
length, align level, origin, destination, sample address, time, and reliability information is displayed.
Use the horizontal and vertical scroll bars to view all channel columns and all audio status parameters.
Click on a channel column to reveal the raw data for that channel at the bottom of the window.
PHABRIX Qx User Manual Page 51
Page 64
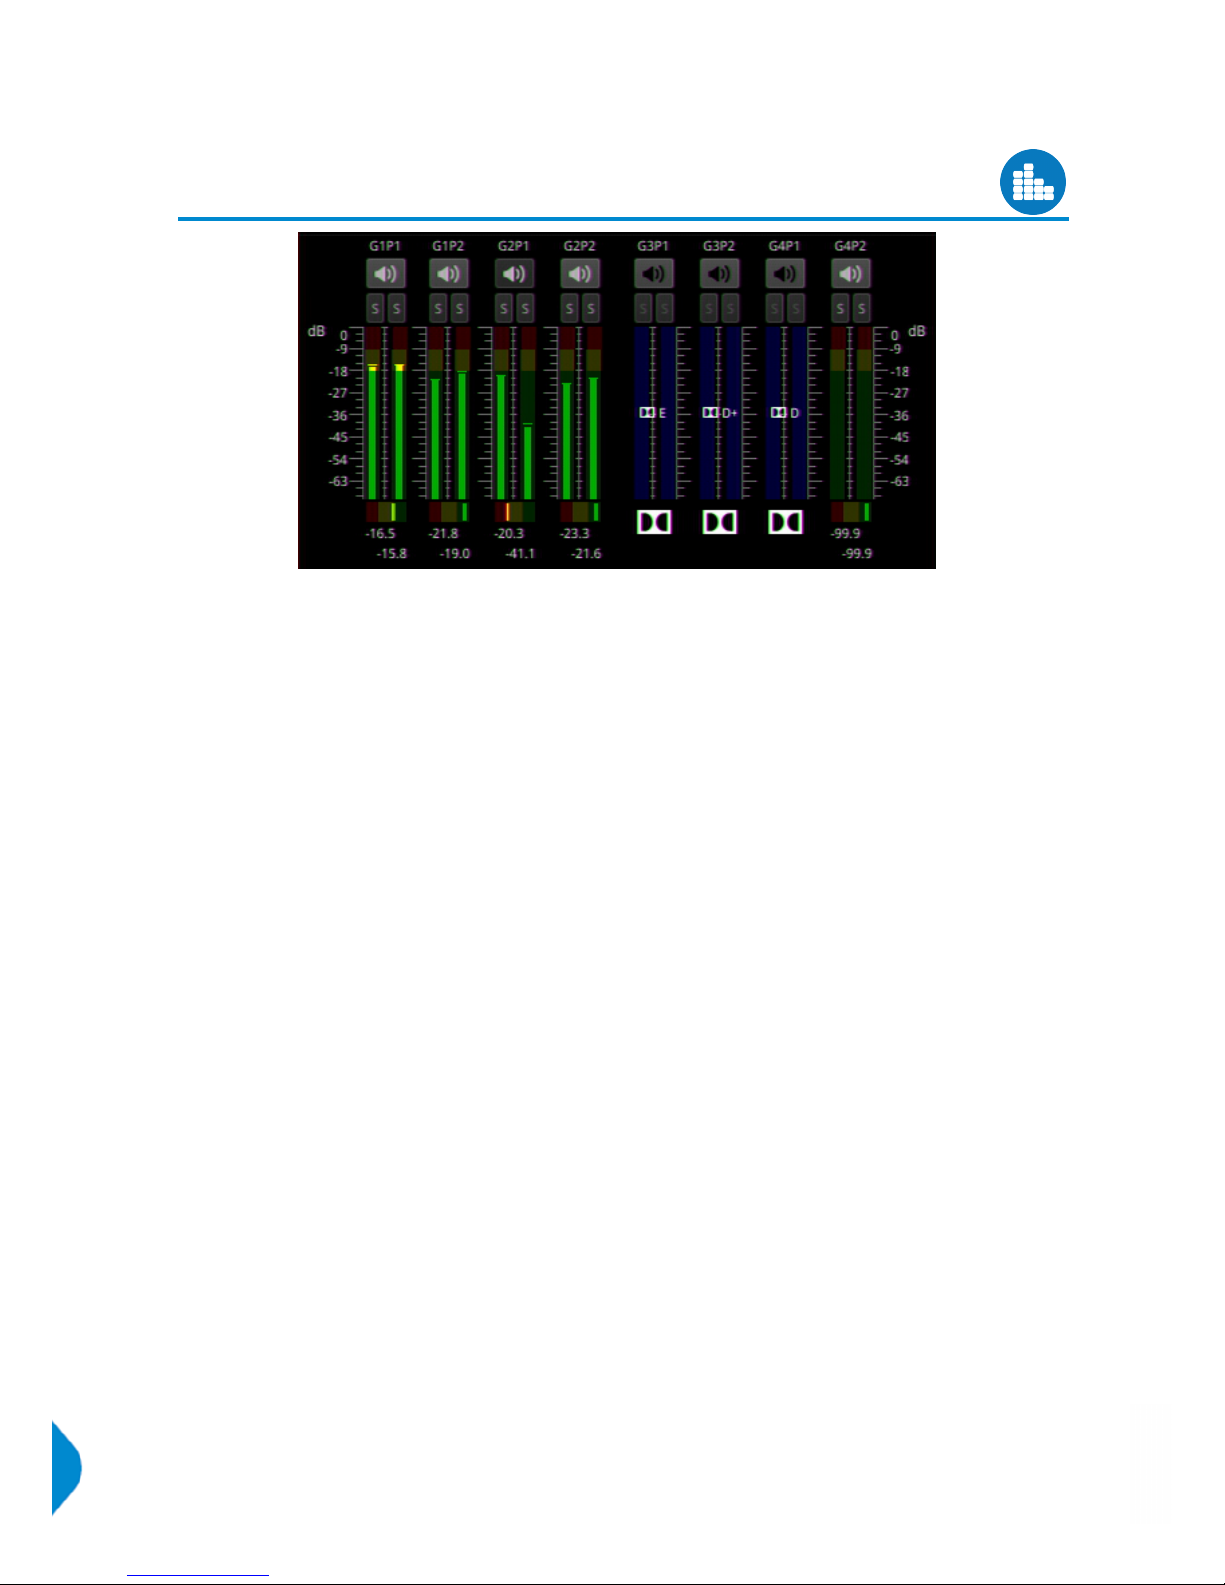
Analysis
Analyzer - Audio Meters
The ‘Analyzer - Audio Meters’ instrument displays 16 x audio meters along with peak level indication and
audio pair phase indication. In addition dBFS values are indicated at the base of each meter.
Dolby E, D and D+ streams are detected by the system with Dolby stream indication in blue.
The HDMI instrument output carries a stereo pair of audio, as does the SDI instrument output. The same
signal is made available on pins 7 and 8 of the 26-way D-type at the rear of the Qx chassis.
Stereo pair monitoring selection is provided by selecting the speaker icon above each set of audio
meters. Mono channel selection is provided by selecting the appropriate solo bus located between the
audio meters and the speaker icons.
Menu options provided:
l Input Select > [Image/Sub-Image 1 Group 1-4, Image/Sub Image 1 Group 5-8, Sub-Image 2 Group 1-4,
Sub-Image 2 Group 5-8, Sub-Image 3 Group 1-4, Sub-Image 3 Group 5-8, Sub-Image 4 Group 1-4,
Sub-Image 4 Group 5-8, AES IO]
l Ballistics > [PPM Type I, PPM Type II, Vu, VuFr]
l PPM Scale Type > [dBFS, dBu -18dBFS, dBu-20dBFS, BBC, DIN45406, NordicN9]
l Hat Hold Time > [0.00...10.00, infinite]
l Monitor Buttons > [Enabled, Disabled]
l Solo Buttons > [Enabled, Disabled]
Up to two audio meter instrument windows can be enabled providing 32 simultaneous channels of audio
metering. Each window is assignable to monitor groups 1 to 4 (defined in SMPTE ST 299-1) or groups 5 to
8 (defined in SMPTE ST 299-2) in any of up to 4 potential sub-image ANC areas as defined in SMPTE ST
2082-10.
Each audio window is scalable from 1/32 to 1/4 of screen area.
Page 52 PHABRIX Qx User Manual
Page 65

Analysis
Analyzer - CRC Analysis
The ‘Analyzer - CRC Analysis’ window checks for CRC (Cyclic Redundancy Check) errors in the received
signal. The number of SDI input failures, the last failure time, total analysis time, and error rate are also
displayed. Dependant on the input required for the standard under test, i.e. quad, dual, or single input, the
Sub Image columns will show any errors occurring in each of the Sub images, and in the larger window size
the Link rows will show any errors occurring per Link.
‘OK Time’ shows the length of time an image/sub image has been received without error.
The instrument also detects active picture changes, and PHABRIX analyzers provide the active picture CRC,
allowing for any changes in the expected active picture CRC value to be observed.
CRC errors are ignored on the switching line if ‘Ignore CRC on switch lines’ is enabled in the submenu:
l Ignore CRC on switch lines > [Enabled, Disabled]
To reset instrument:
l Reset errors and running time
PHABRIX Qx User Manual Page 53
Page 66

System
SFP (A, B) - Network Stats [IP Mode]
[A: PHQXO-IP-NAT+PHQXO-IP-DEC (Qx 12G);
B: PHQXO-IP-NGT+PHQXO-IP-ENC+PHQXO-GEN (Qx IP)]
The Network Stats window displays transmission and reception traffic information, detailing the type and
number of packets sent and received by an SFP. CRC errors are identified and packet sequence errors
reported. Double-clicking the window expands it, to reveal additional packet information.
Page 54 PHABRIX Qx User Manual
Page 67
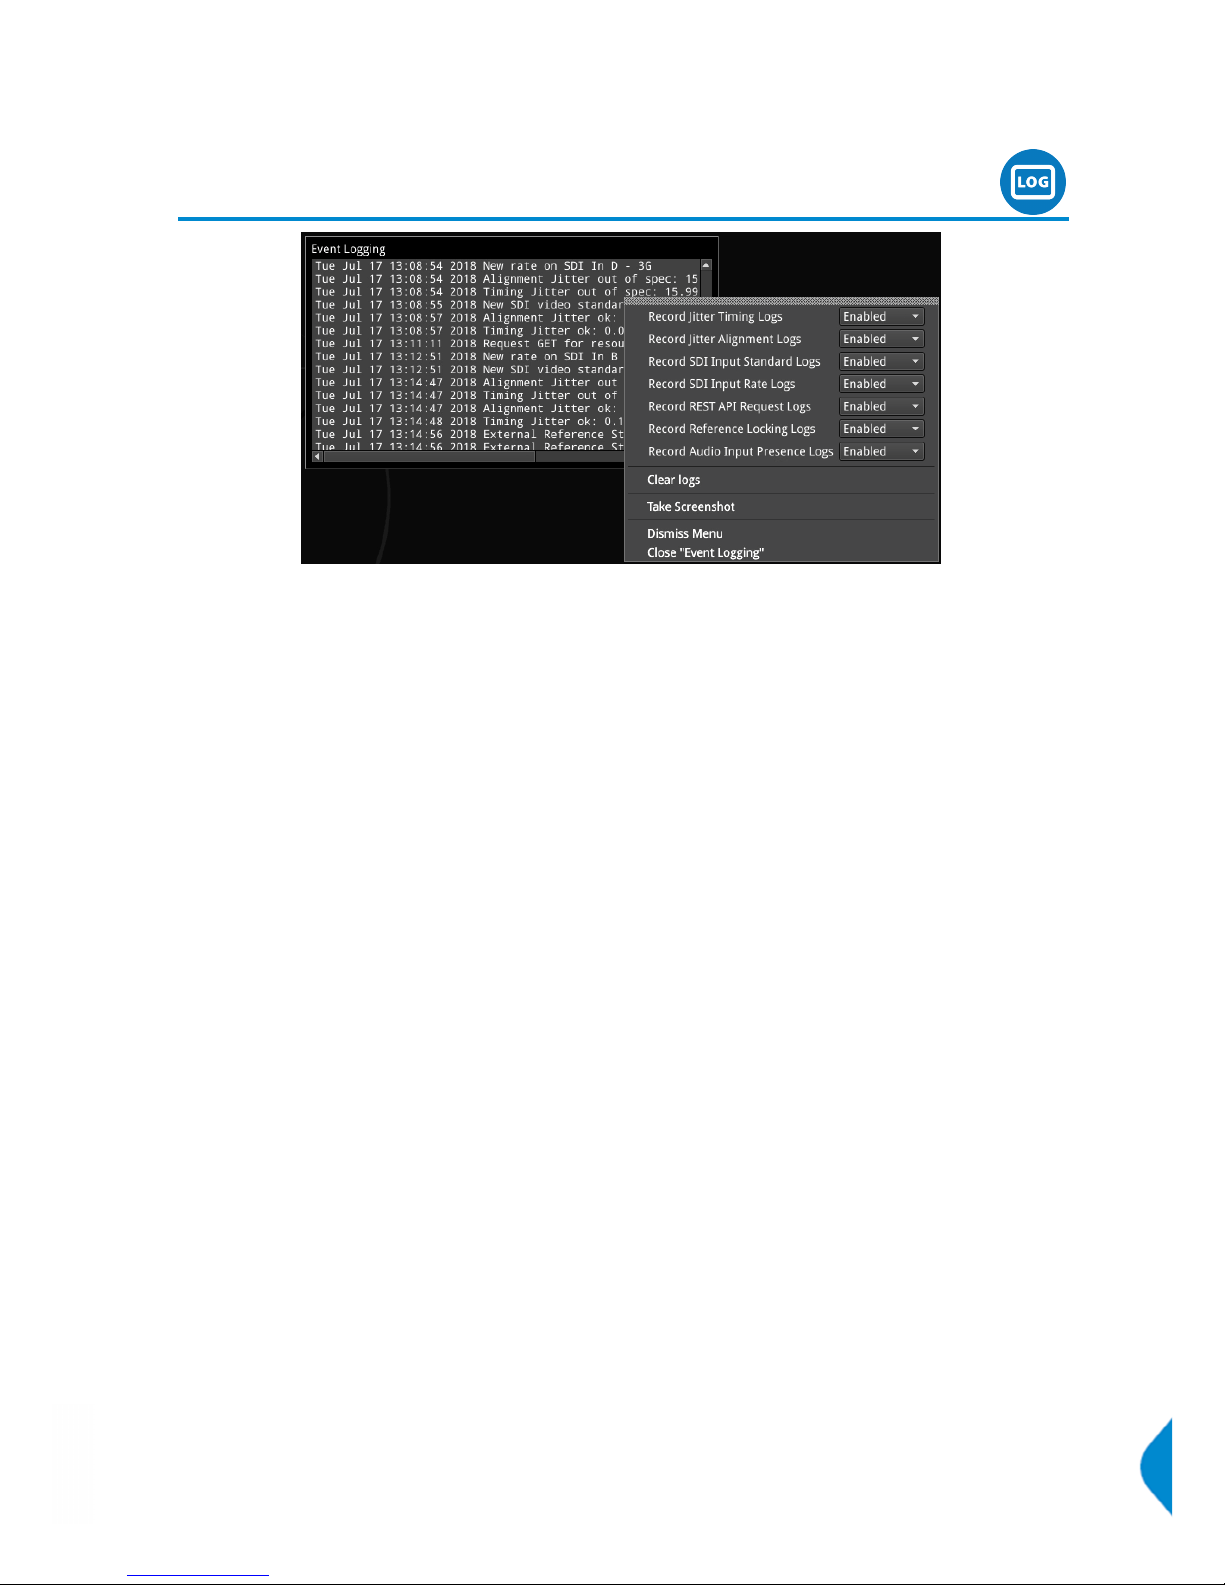
System
Event Logging
Logging is provided on the Qx, and logs can be viewed in ‘Event Logging’. The Qx allocates 500 lines for
logging detail before overwriting this data. It will also recall the log data last captured if the unit is started
from cold. The setting for logging data will need to be re-entered from a cold start using the right click
selection. Logs can also be accessed and saved via the REST API.
SDI Modes
By right clicking the mouse on this instrument the following drop-down menus are presented:
l Record Jitter Timing Logs > [Enabled, Disabled]
l Record Jitter Alignment Logs > [Enabled, Disabled]
l Record SDI Input Standard Logs > [Enabled, Disabled]
l Record SDI Input Rate Logs > [Enabled, Disabled]
l Record REST API Request Logs > [Enabled, Disabled]
l Record Reference Locking Logs > [Enabled, Disabled]
l Record SFP Logs > [Enabled, Disabled]
l Record Audio Input Presence Logs > [Enabled, Disabled]
l Clear logs
IP Mode
By right clicking the mouse on this instrument the following drop-down menus are presented:
l Record IP Tx Logs > [Enabled, Disabled]
l Record IP Rx Logs > [Enabled, Disabled]
l Record IP Interfaces Logs > [Enabled, Disabled]
l Record REST API Request Logs > [Enabled, Disabled]
l Record Reference Locking Logs > [Enabled, Disabled]
l Record SFP Logs > [Enabled, Disabled]
l Record Audio Input Presence Logs > [Enabled, Disabled]
l Clear logs
PHABRIX Qx User Manual Page 55
Page 68
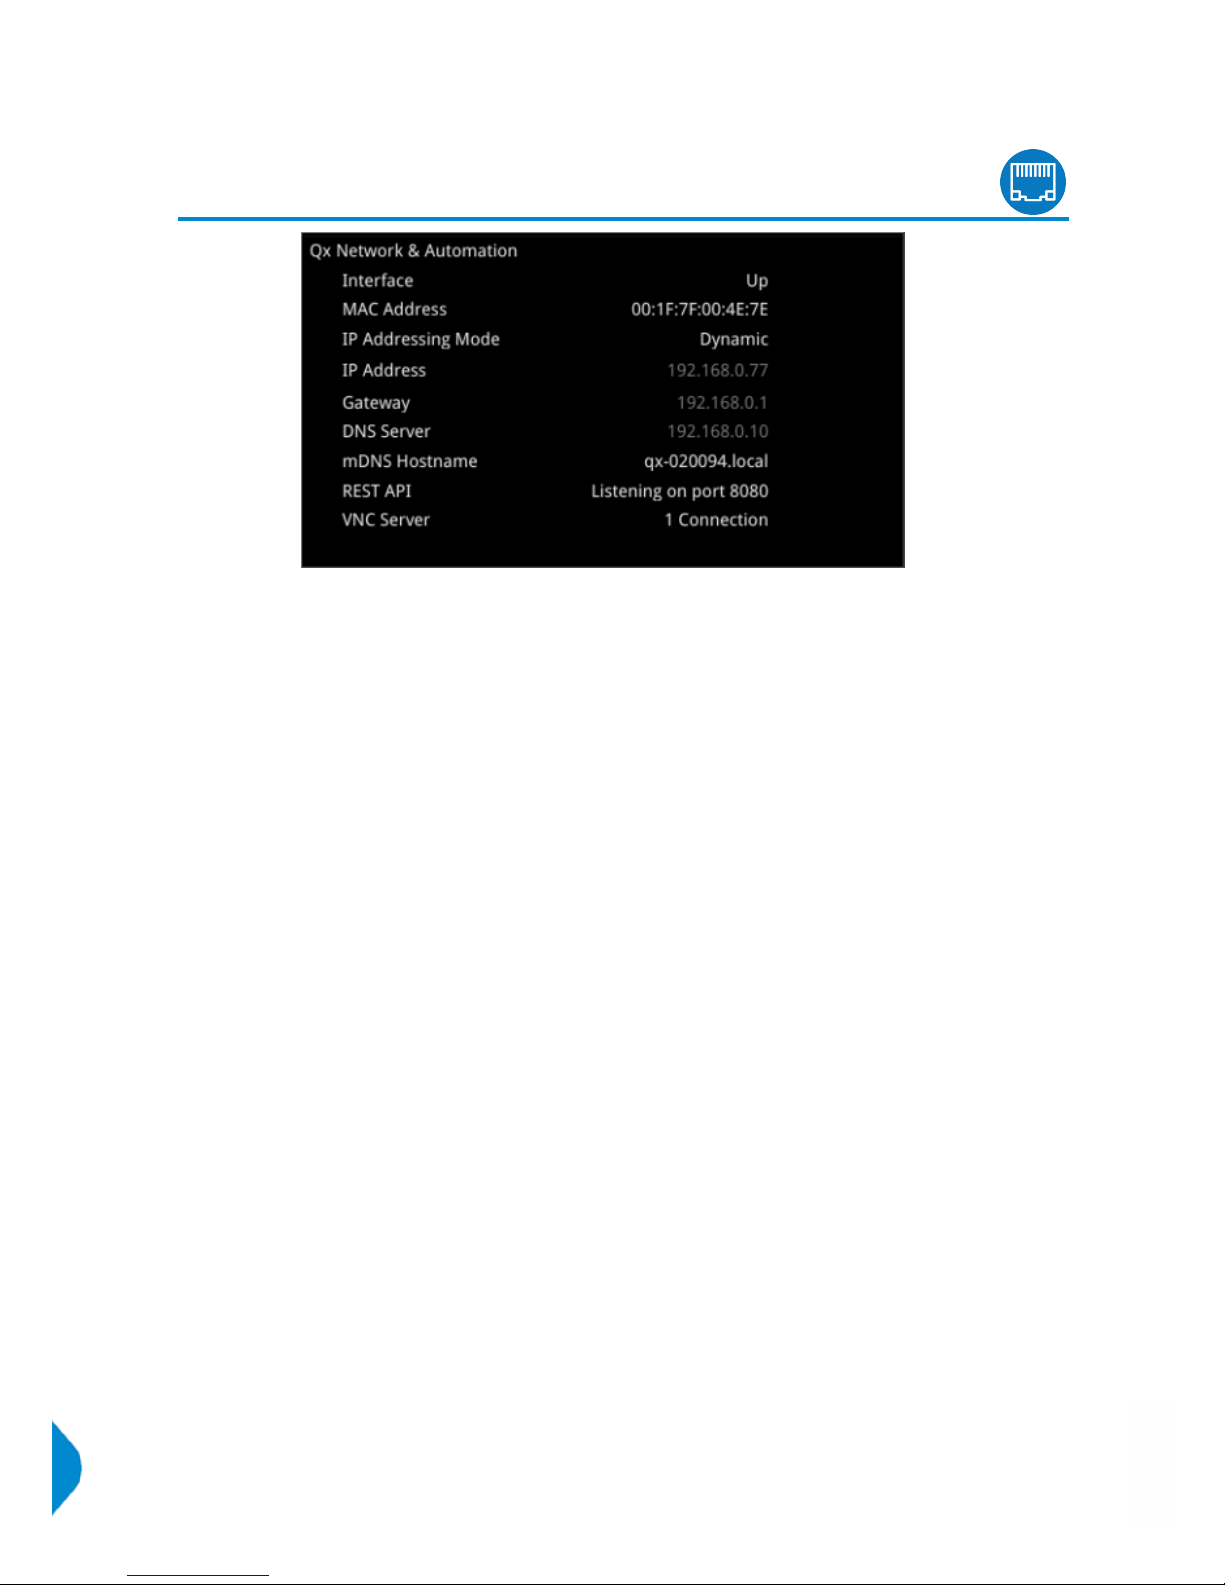
System
Qx Network & Automation
The Qx can be controlled remotely in a number of ways including via VNC, and via REST API which can be
used for automated testing. The IP address of the Qx can be dynamically assigned on a DHCP enabled
network, or a static IP address can be set.
Right-clicking in the window reveals a submenu, from where the IP addressing mode, network/subnet mask
of the Qx, and DNS Server details can be set, by keyboard or on-screen Keypad.
l IP addressing mode > [Dynamic, Static]
For Static IP addressing:
l Ethernet IP addr and mask > [set IP address of Qx as required]
Mask selection is via a drop-down menu. CIDR notation is used; with a default value of /24:
l Ethernet IP addr and mask > [set mask in drop-down, 30 to 8]
Setting Gateway:
l Gateway IP Addr > [set IP address of Gateway as required]
For a DNS Server:
l DNS Server IP Addr > [set DNS Server IP address as required]
Static IP addressing mode settings are saved by selecting:
l Apply Static IP Parameters
From the ‘Qx Network & Automation’ submenu, VNC can also be enabled:
l VNC Server > [Disabled, Enabled]
The VNC Server setting will shows the number of current VNC connections to the Qx. Once a connection is
made, this number will be updated. For more details on VNC setup, see ‘Remote Connection’ section of this
manual.
A REST API remote connection can be established by enabling ‘REST API’ in the submenu:
l REST API > [Disabled, Enabled]
Page 56 PHABRIX Qx User Manual
Page 69

The ‘Qx Network & Automation’ window contains all the information on the Qx that is needed in order to
send it a REST request. ‘IP Address’ (or ‘mDNS Hostname’ if your client’s host supports it) should be used as
the recipient of the request, and ‘REST API Port’ is the port that requests will need to be directed towards.
Note: The mDNS Hostname is composed of qx-<serial number>.local e.g. qx-123456.local and is case
insensitive.
The REST API supports four HTTP methods: GET, PUT, DELETE, and POST.
GET requests can be used to retrieve Qx information and navigate the submenus. PUT requests can be
used to modify and control Qx behavior and actions.
A web browser can be used to retrieve Information from the Qx with GET requests.
Any HTTP/1.1 compliant application can be used to control the Qx with both GET and PUT requests.
PUT, GET, DELETE, and POST requests can be scripted for automated testing.
REST API Requests
For the following REST API request examples, an example IP address (192.168.0.142) and default REST API
Port (8080) are used. The base resource to aim requests at is "/api". The base URL for requests (GET) will be
in the format: http://192.168.0.142:8080/api or http://qx-020094.local:8080/api
REST API requests can be used to:
l Report the current analyzed standard (GET): http://192.168.0.142:8080/api/v1/analyser/status
l Report the currently generated standard (GET): http://192.168.0.142:8080/api/v1/generator/status
l Navigate through list of available generator standards (GET): http://192.168.0.142:8080/api/v1/
generator/standards. Select required URL from tree and GET again to drill down to appropriate
color format, bit depth, level, SDR or HDR format, and test pattern.
l Generate a standard (PUT): http://192.168.0.142:8080/api/v1/generator/ standards/
1920x1080p60/YCbCr%3A422%3A10/3G_A_Rec.709/100%25%20Bars
A pathological overlay, its type and number of pairs can be added by including a raw payload of, for
example, {"action":"start","pathological":{"type":"CheckField","pairs":100}}
l Report the currently generated audio standard (GET): http://192.168.0.142:8080/api/v1/generator/
audio
l Audio generation (PUT): http://192.168.0.39:8080/api/v1/generator/audio. Including a raw payload for
Quick config, of the structure, for example, {"mode":"Fixed Tone","quickConfig":{"gainType":"Fixed Levels",
"gain":-10,"pitch":"E 3"}}. For Custom config raw payload structure, refer to the GET request output structure.
l View instantaneous Eye readings (GET): http://192.168.0.142:8080/api/v1/eye/status
l View instantaneous Jitter readings (GET): http://192.168.0.142:8080/api/v1/jitter/status
l Retrieve the event logs (GET): http://192.168.0.142:8080/api/v1/eventlog/logs
l Report current CRC analysis status (GET): http://192.168.0.142:8080/api/v1/analyser/crcSummary
l Manage the event logs (PUT): http://192.168.0.142:8080/api/v1/eventlog/config/restApi with a raw pay-
load of {"action":"enable"} in this example, to enable REST API event logging.
Specifically in IP Mode, REST API requests can be used to:
l Report the currently active multicast request (GET): http://192.168.0.142:8080/api/v1/ipReceive/
multicastRequests
l Request a new multicast (PUT): http://192.168.0.142:8080/api/v1/ipReceive/multicastRequests with a
raw payload of the form {"action":"request","destinationIpAddress":"230.0.0.15"} in this example, to
join a multicast group of destination IP address 230.0.0.15
PHABRIX Qx User Manual Page 57
Page 70
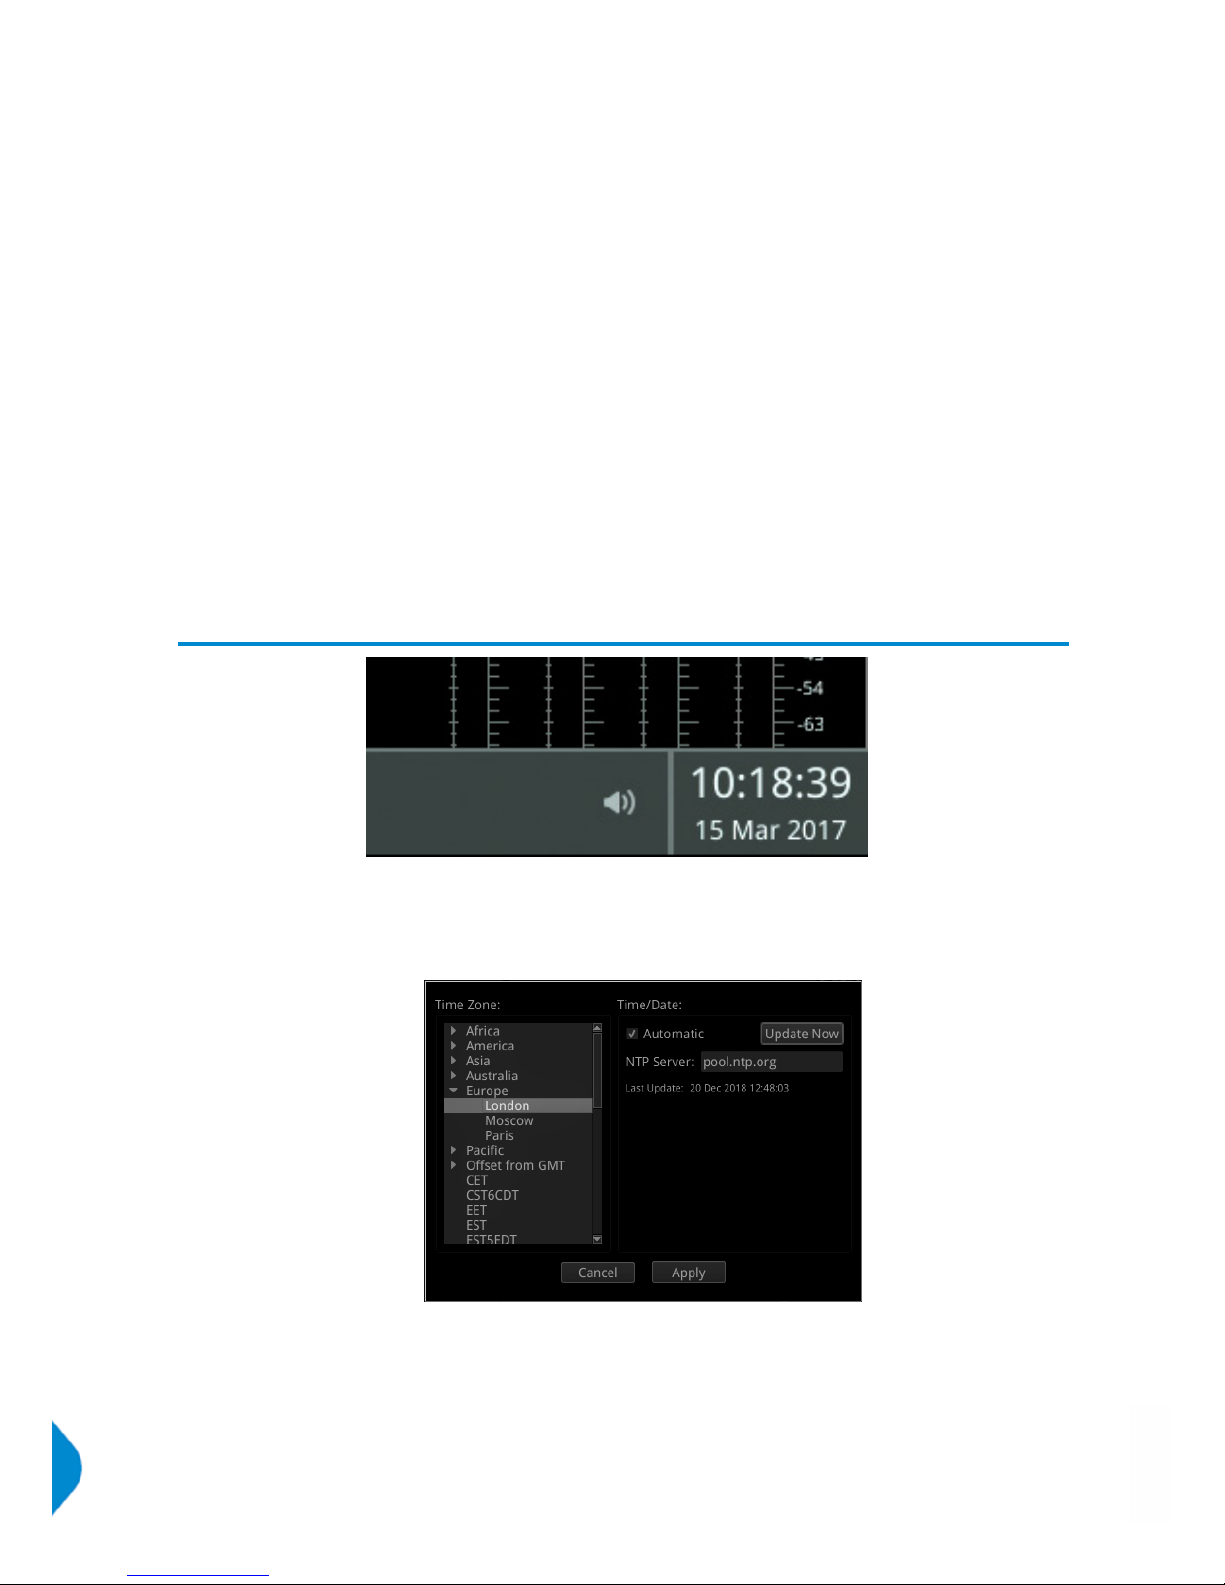
l Report list of currently available IP media streams (GET): http://192.168.0.142:8080/api/v1/ipReceive/
mediaStreams
l Select IP media stream for analysis (PUT): http://192.168.0.142:8080/api/v1/ipReceive/mediaStreams
with a raw payload of the form {"action":"analyseStream","destinationIpAddress":
"230.0.0.15","destinationUdpPort":16,"matchSsrc":true,"sourceIpAddress":
"192.168.10.30","sourceUdpPort":16,"ssrc":123456}
l Report the IP media stream currently being analyzed (GET): http://192.168.0.142:8080/api/v1/
ipReceive/requestedMediaStreams
l Clear list of IP media streams (PUT): http://192.168.0.142:8080/api/v1/ipReceive/mediaStreams
with a raw payload of {"action":"clearList"}
Contact PHABRIX for full details of all available Qx REST API requests.
System
Time and NTP
Right-clicking the time displayed to the right hand side of the Instrument bar, reveals a 'Set Time & Date'
submenu. Selecting this submenu opens a window, where the date, time and timezone can be adjusted. The
time and date can automatically be set through connection to an NTP server, or can be set manually. For
manual setting, unchecking the 'Automatic' checkbox.
l Set Time & Date > Time/Date > Automatic > [Checked (NTP time), unchecked (manual time)]
l Set Time & Date > Time/Date > NTP Server > [e.g. pool.ntp.org]
l Set Time & Date > Time/Date > Update Now (Update Qx time to NTP time)
l Set Time & Date > Time/Date > manual (Automatic unchecked) > Date [set date]
l Set Time & Date > Time/Date > manual (Automatic unchecked) > Time [set date]
Page 58 PHABRIX Qx User Manual
Page 71
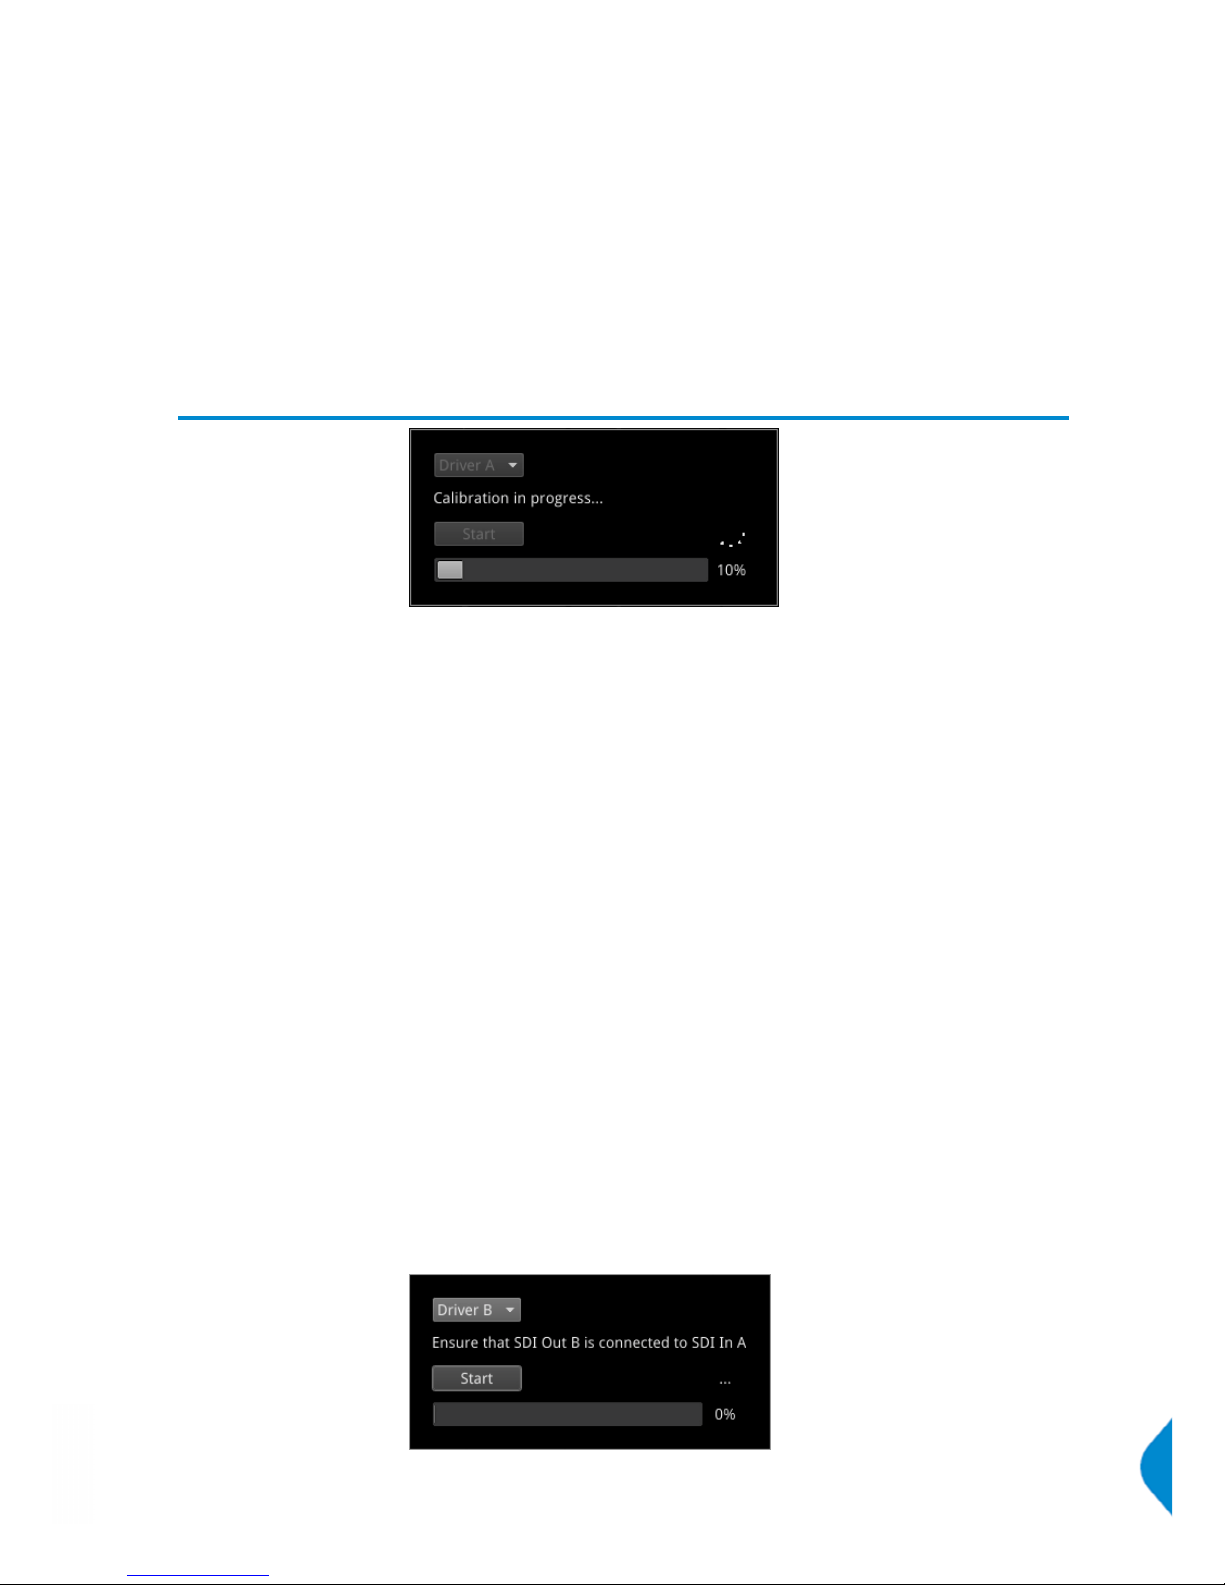
l Set Time & Date > Time Zone > [select zone]
l Set Time & Date > Cancel
l Set Time & Date > Apply
System
Driver Calibration
[PHQX01E / PHQX01E-IP / PHQXM-01E]
Note: All PHABRIX units are calibrated and verified prior to dispatch. Over time however, the SDI generator
outputs of the Qx may require recalibration.
On units with PHABRIX RTE™ (RealTime Eye) capability, the SDI generator outputs of the Qx can each be
calibrated using the SDI A Input of the Qx.
Note: Recalibration relies upon the calibration status of the Eye/Jitter analyzer. If in doubt consider returning
the unit to PHABRIX for calibration.
Warning: Before attempting Qx calibration, be sure to that you are using a 12G cable of the specification
described below. If in doubt, do not attempt to perform calibration on your unit.
SDI Output Calibration Steps
Calibration can be performed by first, connecting a 1 meter long cable between SDI A Input and the SDI
Output to be calibrated. A 12G-SDI grade or compatible cable with 12G-SDI BNCs must be used. Suitable
cable types include: Canare L-5.5CUHD, and Belden 1694A.
Note: If the Qx is in ‘SDI Stress Toolset’ mode, first disable ‘Jitter Insertion Mode’ before beginning driver
calibration. See ‘Advanced Generation Tools’ section of this manual for further details.
Next, from the ‘Instrument Launch Menu’, selecting ‘System Settings > Driver Calibration > Driver Calibration’
opens a calibration window.
A drop-down menu allows the selection of the output to be calibrated. For SDI Output A, select Driver A, etc.
Select ‘Start’ to begin calibration. The calibration of an output should take 2-5 minutes.
Once SDI Output A is calibrated, connect the output side of the cable to SDI Output B and repeat the process
outlined above, until all Qx SDI Outputs have been calibrated.
It may take approximately 20 minutes to calibrate all four outputs.
PHABRIX Qx User Manual Page 59
Page 72

Remote Connection
There are various methods of remote connection to the Qx, that can be used depending on a user’s
requirements. Users can connect remotely to the unit via VNC, REST API, SFTP, and web browser.
Available Functionality
Operational control
VNC Remotely view the screen and control the Qx interface
REST API Remotely send Qx operational control commands and retrieve data and status
information
File management
SFTP Retrieve Log, Preset, and Screenshot files. Delete these files. Add saved presets
from another Qx. Add, retrieve, and delete user-created test pattern files.
Web Browser View and retrieve, Log, Preset, Screenshot, and User Test Pattern files
Note: In the setup directions that follow, ‘192.168.0.70’ and ‘qx-020094.local’ have been used for example
purposes only. Be sure to use the IP Address or mDNS Hostname specific to your Qx unit.
VNC
Direct screen control of the Qx can be provided via VNC.
The Qx acts as the VNC Server, and a user can have remote access the unit using a VNC viewer
software client application on their local computer.
Qx Setup
From the ‘Qx Network & Automation’ window, enable ‘VNC Server’ in the submenu.
The VNC Server setting will shows the number of current VNC connections. Once a connection is made, this
number will be updated.
Connecting to the Qx VNC Server
Install your chosen VNC viewer software on the computer you will use to connect to the Qx.
Launch the VNC viewer application.
To make a new connection to the Qx:
l Enter the IP Address of the Qx unit (found in ‘Qx Network & Automation’ window) or its mDNS Host-
name (if mDNS is enabled on your computer)
l Enter the password: phabrixqx
A view of the Qx desktop will open on your computer screen. You will be able to control the Qx with your
local mouse and keyboard.
Note: No remote monitoring of the Qx unit audio output is available via VNC.
REST API
A REST API client can be used to remotely interrogate the Qx for data and status information, and to also
send it operational control commands.
Page 60 PHABRIX Qx User Manual
Page 73

Qx Setup
From the ‘Qx Network & Automation’ window, enable ‘REST API’ in the submenu.
When enabled, the REST API setting will show the port number (8080) the Qx is listening on.
Connecting to the Qx via REST API
Run your chosen REST API client application on the computer you will use to connect to the Qx.
A connection to the Qx can be made using the IP Address or mDNS Hostname (if mDNS is enabled on your
computer) of the Qx unit, together with the port number.
For connection to the Qx:
As a GET request; in the URL field of the REST API client, enter the Qx address using the specific IP Address
or mDNS Hostname of your unit, in one of the following formats:
l http://192.168.0.70:8080/api
l http://qx-020094.local:8080/api
See ‘Qx Network & Automation’ section of this manual, for an overview of Qx GET and PUT requests for
REST API.
Contact PHABRIX for full details of all available Qx REST API requests.
PUT, GET, DELETE, and POST requests can be scripted for automated testing use.
SFTP
Retrieval of Event Log, Preset, Screenshot, and User Test Pattern files, deletion of these files, plus the
addition of saved presets from another unit and user test patterns can be carried out using Secure File
Transfer Protocol (SFTP).
Connecting to the Qx via SFTP
Run your chosen SFTP client application on the computer from which you will connect to the Qx (your SFTP
server).
Enter the Qx host address using the specific IP Address of your Qx or its mDNS Hostname (if mDNS is
enabled on your computer), in one of the following formats:
l sftp://192.168.0.70
l sftp://qx-020094.local
Additionally, provide the following:
Username: qxuser; Password: phabrixqx; Port: 22
Once connected, open the ‘transfer’ directory to access the ‘log’ (for the Event Log), ‘presets’, ‘screenshots’,
and 'userTestPatterns' folders. Files can be downloaded, deleted and added (in the case of ‘presets’ and
'userTestPatterns') to these folders as required.
Web Browser
A web browser can be used to view Event Log, Screenshot, Preset, and User Test Patterns files, and
retrieve them.
Connecting to the Qx via web browser
In the web browser of your choice on your computer, enter the IP address of your Qx, in the following format:
l http://192.168.0.70
Once connected, access the ‘logs’, ‘presets’, ‘screenshots’, and 'userTestPatterns' folders as required. View
and save files to your computer as required.
PHABRIX Qx User Manual Page 61
Page 74

Note: Files cannot be deleted via the web browser
Page 62 PHABRIX Qx User Manual
Page 75

Specifications
Power
Connector 4-pin XLR, Male
Voltage 10-18V, 12V DC nominal
DC Power adapter provided
Overvoltage, undervoltage and reverse voltage protection
External Locking Reference
Label REF
Input Signal Tri-level or Bi-Level (black burst) syncs 50/59.94/60Hz
Connector 2x BNC
Input Impedance > 10kΩ
Input Return Loss >40dB to 6MHz (typical)
Maximum Input voltage +/- 2V
Specification Tri-level syncs (SMPTE 274M and SMPTE 296M) 600 mV pk-pk
PAL Black Burst (ITU 624-4/SMPTE 318) 1V pk-pk,
Composite NTSC (SMPTE 170M) 1V pk-pk
SDI Instrument Output
Label SDI OUT
Connector BNC
Output Impedance 75Ω
Output Level 800mv p-p +/-10%
Purpose 3Gbps SDI instrument output
HDMI Instrument Output
Label HDMI
Connector Type A
Video Format 1920 x 1080 RGB 4:4:4
Audio Format 4 x PCM stereo audio at 48 KHz
Purpose Monitor output that allows up to 16 individual instrument panels (or windows)
to be displayed.
USB
USB USB 2
USB Connector Type A
Quantity 3 (1 x front mounted, 2 x rear mounted)
Purpose Keyboard and mouse control of the HDMI® monitor output of instrument and
software installation.
PHABRIX Qx User Manual Page 63
Page 76

Networking
Ethernet IEEE 802.3 10/100/1000Mb/s (10/100/1000 base-T)
Ethernet Connector RJ-45
Rear panel D26
Label I/O Expansion
Connector 26-way D-type
Purpose 8x GPI I/O, 4x AES I/O, LTC input, stereo analog audio out
Pin out
Pin Number Pin Name Description
1 AES_IO1 Bidirectional AES I/O - 75Ohm unbalanced
2 AES_IO2 Bidirectional AES I/O - 75Ohm unbalanced
3 AES_IO3 Bidirectional AES I/O - 75Ohm unbalanced
4 AES_IO4 Bidirectional AES I/O - 75Ohm unbalanced
5 LTC_RX_P LTC Receive (RX) P (RS-422 compatible)
6 LTC_RX_N LTC Receive (RX) N (RS-422 compatible)
7 AUDIO_R Audio Line Out - right
8 AUDIO_L Audio Line Out - left
9 5V0_GPIO 5V current limited GPIO supply (500mA)
10, 11, 12, 13, 14, 15, 16, 17, 18 GND 0V
19 GPIO-0 Open drain,10k pull-up to +5V
20 GPIO-1 Open drain,10k pull-up to +5V
21 GPIO-2 Open drain,10k pull-up to +5V
22 GPIO-3 Open drain,10k pull-up to +5V
23 GPIO-4 Open drain,10k pull-up to +5V
24 GPIO-5 Open drain,10k pull-up to +5V
25 GPIO-6 Open drain,10k pull-up to +5V
26 GPIO-7 Open drain,10k pull-up to +5V
Page 64 PHABRIX Qx User Manual
Page 77

AES I/O
Connector 26-way D-type
Pins 1 (AES I/O 1), 2 (AES I/O 2), 3 (AES I/O 3), 4 (AES I/O 4)
Input Impedance 75 Ω terminated
Maximum Input voltage +/- 2V
Input Sample Rate 48kHz synchronous audio
Input Bit Depth 20bit or 24bit
Output Sample Rate 48kHz synchronous to system reference
Output Bit Depth 24bit
Specification Conforming to AES3-2003 and SMPTE-276M
Purpose 4x AES I/O audio
Longitudinal Timecode (LTC)
Connector 26-way D-type
Pins 5 (RX - P), 6 (RX-N)
Format RS-422 Compatible
Purpose Not currently supported in software
Analog Audio Output
Connector 26-way D-type
Pins 7 (Audio Line Out - Right), 8 (Audio Line Out - Left)
Type Stereo Pair
Level (1V peak-to-peak analog audio, full scale 0dBFS)
Purpose Audio Monitoring output
GPIO
Connector 26-way D-type
Pins 19 (GPIO - 0), 20 (GPIO - 1), 21 (GPIO - 2), 22 (GPIO - 3),
23 (GPIO - 4), 24 (GPIO - 5), 25 (GPIO - 6), 26 (GPIO - 7)
Format open drain with 10kΩ pull-up to +5 Volts
Power 5 Volt (pin 9), current-limted GPIO supply for ‘open drain’ input/outputs. 0 Volt/
signal ground (pins 10 to 18)
Purpose Generator Pathological Rate detection
PHABRIX Qx User Manual Page 65
Page 78

On-going Development
PHABRIX is committed to developing the toolsets on the Qx. There will be upgrades which will include
improvements to existing instruments and the addition of new ones.
Please do not hesitate to contact PHABRIX at any time to discuss your requirements for the product or to
discuss the current product time-line.
SMPTE UHDTV: SDI PHYSICAL LAYER
Data Rate 1.485 Gbps 2.97 Gbps 5.94 Gbps 11.88 Gbps
Stand ard SMPTE ST292-1:2012 SMPTE ST424:2012 SMPTE ST2081-1, 10 SMPTE ST2082-1, 10
Coding Scram bled NRZI Scram bled NRZI Scram bled NRZI Scram bled NRZI
Amplitude 800mV +/- 10% 800m V +/- 10% 800m V +/- 10% 800mV +/-10%
DC Offset 0.0 V +/- 0.5 V 0.0V +/- 0.5 V 0.0 V +/- 0.5 V 0.0 V +/- 0.5 V
Rise/Fall time: < 270ps < 135 ps < 80 ps <45ps
Rise/Fall time difference: < 100 ps < 50 p s < 35 ps < 18ps
Over/Under-shoot: <10% of the amplitude <10% of the amplitude <10% of the amplitude <10% of the amplitude
Timing Jitter < 1 UI
(10Hz to 148.5 MHz)
< 2 UI
(10Hz to 297 MHz)
< 4 UI
(10Hz to 594 MHz)
< 8UI
(10Hz to 1188 MHz)
Alignment Jitter < 0.2 UI
(100 kHz to 148.5MHz)
< 0.3 UI
(100 kHz to 297 MHz)
< 0.3 UI
(100 kHz to 594 MHz)
< 0.3 UI
(100 kHz to 1188MHz)
Qx 75Oh m Coaxial cable length
(Belden 1694A)
200m 200m 100m 70 m
Qx 75Oh m Coaxial cable length
(Canare L-5.5CUHD)
100m (colour bars)
Automatic measurement p rovided by Qx
The complexity of both analyzing and generating signals for UHDTV is exemplified above. The data
bandwidth testing from HD through to UHDTV at 12Gbps, standard on the Qx, is immense and the
parameters set by SMPTE require that the instruments measure these critical values for compliance.
Page 66 PHABRIX Qx User Manual
Page 79

Supported SFP list
This version of software supports use of the following SFP's :
This list can also be found at: www.phabrix.com/support/supported-sfps
Manufacturer Part No. Revision Type / OUI Qx Firmware
Embrionix EB12HD2R-MNR 101A 12G Micro BNC Dual Receiver SDI Modes
Embrionix EB12HD2T-MNR A204 12G Micro BNC Dual Transmitter SDI Modes
Embrionix EB30HDRT-MN 417 3G Micro BNC Transceiver SDI Modes
Embrionix EB59LCRT-MM-P13F A105 6G LC Transceiver SDI Modes
Embrionix EB12LC2R-MNR-P 115 12G LC Dual Receiver SDI Modes
Embrionix EB12HD2R-MNR 105 12G Micro BNC Dual Receiver SDI Modes
Embrionix EB12HD2T-MNR 206 12G Micro BNC Dual Transmitter SDI Modes
Embrionix EB60LC2T-MN2-13F 304A 3G LC Dual Transmitter SDI Modes
Embrionix EB12LC2R-MNR A101 12G LC Dual Receiver SDI Modes
AJA 103163-00 2.0 3G LC Dual Transmitter SDI Modes
GENNUM GO2929-31CM - 3G LC Transceiver SDI Modes
Fiberstore SFP-12G31-20 - 12G LC Transceiver SDI Modes
Gigalight GPP-85192-SRC 1.0 00-00-00 IP Mode
Gigalight GPP-85192-SRC 1.0 24-00-00 IP Mode
CISCO-SFP SFP-10G-LR+-SO A1 00-00-00 IP Mode
Axcen
Photonics
AXXE-5886-05BA V1.0 00-17-2D IP Mode
PHABRIX Qx User Manual Page 67
Page 80
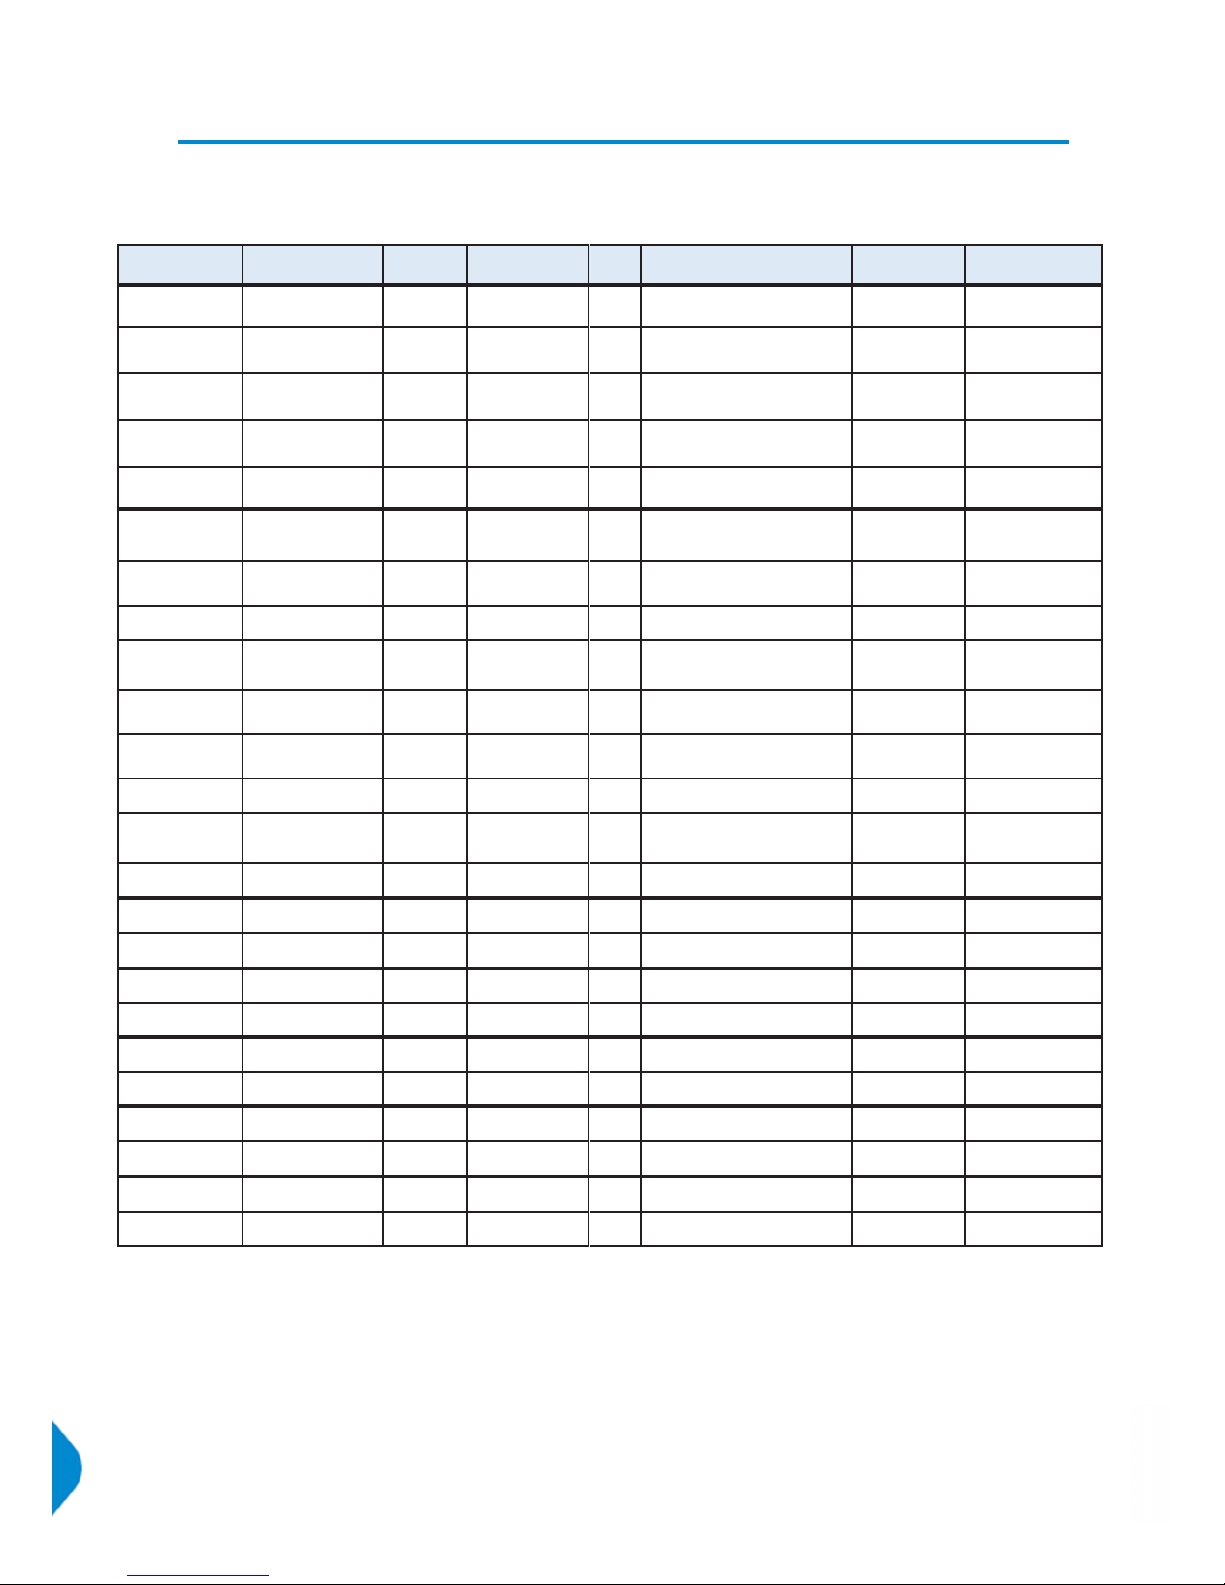
Supported SDI standards
This version of software supports the following standards:
Please contact PHABRIX if you required support for any standards not listed here.
SMPTE S tandards
Link (Content)
Interface Resolution
Sampling
Structure
Pixel
Depth
Fram e/Field Rat e
SDR?
(Colour Space)
HDR? – PQ / HLG / S-Log3
(Colour Space)
ST 292 (ST 296) HD 1280 x 720 4:2:2 (YCbCr) 10 60p, 59.94p, 50p, 30p, 29.97p, 25p Yes
(Rec.709)
Yes
(Rec.2020)
ST 292 (ST 274) HD 1920 x 1080 4:2:2 (YCbCr) 10 60i, 59.94i, 50i Yes
(Rec.709, Rec. 2020)
Yes
(Rec.2020)
ST 292 (ST 274) HD 1920 x 1080 4:2:2 (YCbCr) 10 30p, 29.97p, 25p, 24p, 23.98p Yes
(Rec.709, Rec. 2020)
Yes
(Rec.2020)
ST 292 (ST 274) HD 1920 x 1080 4:2:2 (YCbCr) 10 30psf, 29.97psf, 25psf, 24psf, 23.98psf Yes
(Rec.709, Rec. 2020)
Yes
(Rec.2020)
ST 292 (ST 2048-2) H D 2048 x 1080 4:2:2 (YCbCr) 10 30p, 29.97p, 25p, 24p, 23.98p
30psf, 29.97psf, 25psf, 24psf, 23.98psf
Yes
(Rec.709, Rec. 2020)
Yes
(Rec.2020)
ST 425-1 (ST 274) 3G Level A ,B (1) 1920 x 1080 4:2:2 (YCbCr) 10 60p, 59.94p, 50p Yes
(Rec.709, Rec. 2020)
Yes
(Rec.2020)
ST 425-1 (ST 2048-2) 3G Level A ,B (1) 2048 x 1080 4:2:2 (YCbCr) 10 60p, 59.94p, 50p, 48p, 47.95p Yes
(Rec.709, Rec. 2020)
Yes
(Rec.2020)
ST 425-1 (ST 296) 3G Level A (2) 1280 x 720 4:4:4 (YCbCr/RGB)
4:4:4:4 (YCbCrA/RGBA)
10 60p, 59.94p, 50p, 30p, 29.97p Yes
(Rec.709, Rec. 2020)
_
ST 425-1 (ST 274) 3G Level A (2) 1920 x 1080 4:4:4 (YCbCr/RGB)
4:4:4:4 (YCbCrA/RGBA)
10 60i, 59.94i, 50i
30p, 29.97p, 25p, 24p, 23.98p
30psf, 29.97psf, 25psf, 24psf, 23.98psf
Yes
(Rec.709, Rec. 2020)
_
ST 425-1 (ST 2048-2) 3G Level A (2) 2048 x 1080 4:4:4 (YCbCr/RGB)
4:4:4:4 (YCbCrA/RGBA)
10
30p, 29.97p, 25p, 24p, 23.98p
30psf, 29.97psf, 25psf, 24psf, 23.98psf
Yes
(Rec.709, Rec. 2020)
_
ST 425-1 (ST 274) 3G Level A (3) 1920 x 1080 4:4:4 (YCbCr/RGB)
12
60i, 59.94i, 50i
30p, 29.97p, 25p, 24p, 23.98p
Yes
(Rec.709, Rec. 2020)
_
ST 425-1 (ST 2048-2) 3G Level A (3) 2048 x 1080 4:4:4 (YCbCr/RGB) 12 30p, 29.97p, 25p, 24p, 23.98p
30psf, 29.97psf, 25psf, 24psf, 23.98psf
Yes
(Rec.709, Rec. 2020)
_
ST 425-1 (ST 274) 3G Level A (4) 1920 x 1080 4:2:2 (YCbCr) 12 60i, 59.94i, 50i
30p, 29.97p, 25p, 24p, 23.98p
30psf, 29.97psf, 25psf, 24psf, 23.98psf
Yes
(Rec.709, Rec. 2020)
_
ST 425-1 (ST 2048-2) 3G Level A (4) 2048 x 1080 4:2:2 (YCbCr)
4:2:2:4 (YCbCrA)
12 30p, 29.97p, 25p, 24p, 23.98p
30psf, 29.97psf, 25psf, 24psf, 23.98psf
Yes
(Rec.709, Rec. 2020)
_
ST 2081-10 M1,
(ST 2036-1)
6G-2SI* 3840 x 2160 4:2:2 (YCbCr) 10 30p, 29.97p, 25p, 24p, 23.98p Yes
(Rec.709, Rec. 2020)
Yes
(Rec. 2020)
ST 2081-10 M1,
(ST 2048-1)
6G-2SI* 4096 x 2160 4:2:2 (YCbCr) 10 30p, 29.97p, 25p, 24p, 23.98p Yes
(Rec.709, Rec. 2020)
Yes
(Rec. 2020)
ST 425-5 (ST 2036-1) Quad-link 3G-A (1)2S I,SQ* 3840 x 2160 4:2:2 (YCbCr) 10 60p, 59.94p, 50p Y es
(Rec.709, Rec. 2020)
Yes
(Rec. 2020)
ST 425-5 (ST 2048-1) Quad-link 3G-A (1)2S I,SQ* 4096 x 2160 4:2:2 (YCbCr) 10 60p, 59.94p, 50p, 48p, 47.95p Yes
(Rec.709, Rec. 2020)
Yes
(Rec. 2020)
ST 425-5 (ST 2036-1) Quad-link 3G-B (1) 2SI,SQ* 3840 x 2160 4:2:2 (YCbCr) 10 60p, 59.94p, 50p Y es
(Rec.709, Rec. 2020)
Yes
(Rec. 2020)
ST 425-5 (ST 2048-1) Quad-link 3G-B (1) 2SI,SQ* 4096 x 2160 4:2:2 (YCbCr) 10 60p, 59.94p, 50p, 48p, 47.95p Yes
(Rec.709, Rec. 2020)
Yes
(Rec. 2020)
ST 2081-11 M1,
ST 425-5 (ST 2036-1)
Dual-link 6G-2SI (I)* 3840 x 2160 4:2:2 (YCbCr) 10 60p, 59.94p, 50p Yes
(Rec.709, Rec. 2020)
Yes
(Rec. 2020)
ST 2081-11 M1,
ST 425-5 (ST 2048-1)
Dual-link 6G-2SI (I)* 4096 x 2160 4:2:2 (YCbCr) 10 60p, 59.94p, 50p, 48p, 47.95p Yes
(Rec.709, Rec. 2020)
Yes
(Rec. 2020)
ST 2082-10 M1,
ST 425-5 (ST 2036-1)
12G-2SI (I)* 3840 x 2160 4:2:2 (YCbCr) 10 60p, 59.94p, 50p Yes
(Rec.709, Rec. 2020)
Yes
(Rec. 2020)
ST 2082-10 M1,
ST 425-5 (ST 2048-1)
12G-2SI (I)* 4096 x 2160 4:2:2 (YCbCr) 10 60p, 59.94p, 50p, 48p, 47.95p Yes
(Rec.709, Rec. 2020)
Yes
(Rec. 2020)
* Not applicable for IP 2022-6
Page 68 PHABRIX Qx User Manual
Page 81
www.phabrix.com
PHABRIXprodu ctsarecon tinuouslyb eingu pdated.
Pleasevisitww w.phabrix.comfor latest product information
 Loading...