

Page 1
UC***-18GS series
Configuring
Ultrasonic Sensors
with IO-Link Interface
Manual
Page 2

With regard to the supply of products, the current issue of the following document is applicable: The
General Terms of Delivery for Products and Services of the Electrical Industry, published by the Central
Association of the Electrical Industry (Zentralverband Elektrotechnik und Elektroindustrie (ZVEI) e.V.)
in its most recent version as well as the supplementar y clause: "Expanded reservation of proprietorship"
Worldwide
Pepperl+Fuchs Group
Lilienthalstr. 200
68307 Mannheim
Germany
Phone: +49 621 776 - 0
E-mail: info@de.pepperl-fuchs.com
North American Headquarters
Pepperl+Fuchs Inc.
1600 Enterprise Parkway
Twinsburg, Ohio 44087
USA
Phone: +1 330 425-3555
E-mail: sales@us.pepperl-fuchs.com
Asia Headquarters
Pepperl+Fuchs Pte. Ltd.
P+F Building
18 Ayer Rajah Crescent
Singapore 139942
Phone: +65 6779-9091
E-mail: sales@sg.pepperl-fuchs.com
https://www.pepperl-fuchs.com
Page 3

UC***-18GS series
Contents
1 Introduction................................................................................................................ 6
1.1 Content of this Document ............................................................................. 6
1.2 Target Group, Personnel ............................................................................... 6
1.3 Symbols Used ................................................................................................ 6
1.4 Intended Use .................................................................................................. 7
1.5 General Safety Notes..................................................................................... 7
1.6 Declaration of Conformity............................................................................. 8
2 Product Description .................................................................................................. 9
2.1 Use and Application ...................................................................................... 9
2.2 Indicators and Operating Elements ........................................................... 11
2.3 Accessories.................................................................................................. 12
2.3.1 Accessories for Mounting and Connection ...................................... 12
2.3.2 Parameterization Aids...................................................................... 12
3 Installation................................................................................................................ 14
3.1 Safety Information ....................................................................................... 14
3.2 Preparation ................................................................................................... 14
3.3 Mounting....................................................................................................... 14
3.4 Connection ................................................................................................... 15
4 Commissioning without IO-Link............................................................................. 16
5 Sensor Programming via the Programming Button.............................................17
5.1 Programming Switch Points / Limits.......................................................... 17
5.2 Programming Sensor Operating Modes for Switching Output ............... 19
5.3 Programming the Sensor Operating Modes for Analog Output.............. 20
6 Commissioning Using PACTware and DTM........................................................... 22
6.1 Commissioning via IO-Link......................................................................... 22
6.2 Commissioning Using IrDa Infrared Interface .......................................... 24
7 Configuration and Analysis with DTM via IO-Link................................................ 27
7.1 Overview ....................................................................................................... 27
7.2 Sensor Information Menu Option...............................................................27
7.3 Output Configuration Menu Option ........................................................... 28
7.4 Sensor Configuration Menu Option ........................................................... 29
2020-11
3
Page 4

UC***-18GS series
Contents
7.5 Analysis & Echo Suppression Menu Option .............................................31
7.6 Observation Menu Option........................................................................... 38
7.7 Service Menu Option ................................................................................... 42
7.8 Information Menu Option ............................................................................43
8 Description of Sensor Parameters.........................................................................44
8.1 Sensor Information ...................................................................................... 44
8.2 Output – Switching Output..........................................................................44
8.2.1 Output Mode .................................................................................... 44
8.2.2 Output Logic.....................................................................................47
8.2.3 Switch Point 1...................................................................................47
8.2.4 Switch Point 2...................................................................................47
8.2.5 Retroreflective Mode Offset..............................................................48
8.2.6 Switching Hysteresis........................................................................48
8.2.7 Switch-On Delay ..............................................................................49
8.2.8 Switch-Off Delay ..............................................................................49
8.3 Output Configuration – Analog Output......................................................50
8.3.1 Output Mode .................................................................................... 50
8.3.2 Output Type...................................................................................... 50
8.3.3 Near Limit.........................................................................................50
8.3.4 Far Limit ........................................................................................... 51
8.3.5 Lower Output Value ..........................................................................51
8.3.6 Upper Output Value.......................................................................... 51
8.4 Sensor Configuration – Evaluation ............................................................52
8.4.1 Sound Beam Width .......................................................................... 52
8.4.2 Echo Evaluation ...............................................................................53
8.4.3 Evaluation Method............................................................................ 53
8.4.4 Averages & Skip Count..................................................................... 54
8.4.5 Weighting of Former Measurement .................................................. 54
8.4.6 Allowed Deviation to the Former Measurement ................................55
8.4.7 Skip Time ......................................................................................... 55
8.4.8 Temperature Compensation ............................................................. 55
8.4.9 Operating Temperature.....................................................................56
8.4.10 Foreground Suppression.................................................................. 57
8.4.11 Background Suppression................................................................. 57
8.4.12 Sensor Cycle Time ........................................................................... 57
8.4.13 Ultrasonic Pulse Length ................................................................... 58
2020-11
4
Page 5

UC***-18GS series
Contents
8.5 Sensor Configuration – Synchronization .................................................. 58
8.6 Sensor Configuration – Echo Loss and Error Handling ..........................59
8.6.1 No Echo........................................................................................... 59
8.6.2 Output Behavior if an Error Occurs .................................................. 60
8.6.3 Error Replacement Value – Current/Voltage..................................... 60
8.7 Sensor Configuration – Local Controls ..................................................... 61
8.7.1 Local Controls.................................................................................. 61
8.7.2 Local Controls Status....................................................................... 61
8.8 Service .......................................................................................................... 61
8.8.1 Locator Indication ............................................................................ 61
8.8.2 "Reset to Factory Defaults" Button................................................... 62
9 Synchronizing Multiple Sensors ............................................................................ 63
10 Maintenance and Repair ......................................................................................... 64
10.1 Maintenance Work ....................................................................................... 64
10.2 Cleaning........................................................................................................ 64
10.3 Resetting to the Factory Default................................................................. 64
11 Troubleshooting....................................................................................................... 65
11.1 What to Do in Case of an Error................................................................... 65
2020-11
5
Page 6

UC***-18GS series
Introduction
1 Introduction
1.1 Content of this Document
This document contains information required to use the product in the relevant phases of the
product life cycle. This may include information on the following:
• Product identification
• Delivery, transport, and storage
• Mounting and installation
• Commissioning and operation
• Maintenance and repair
• Troubleshooting
• Dism ounting
• Disposal
Note
For full information on the product, refer to the further documentation on the Internet at
www.pepperl-fuchs.com.
The documentation comprises the following parts:
• This document
• Datasheet
In addition, the documentation may comprise the following parts, if applicable:
• EU-type examination certificate
• EU declaration of conformity
• Attestation of conformity
• Certificates
• Control drawings
• Instruction manual
• Other documents
1.2 Target Group, Personnel
Responsibility for planning, assembly, commissioning, operation, maintenance, and dismounting lies with the plant operator.
Only appropriately trained and qualified personnel may carry out mounting, installation, commissioning, operation, maintenance, and dismounting of the product. The personnel must have
read and understood the instruction manual and the further documentation.
Prior to using the product make yourself familiar with it. Read the document carefully.
2020-11
6
Page 7
UC***-18GS series
Introduction
1.3 Symbols Used
This document contains symbols for the identification of warning messages and of informative
messages.
Warning Messages
You will find warning messages, whenever dangers may arise from your actions. It is mandatory
that you observe these warning messages for your personal safety and in order to avoid property damage.
Depending on the risk level, the warning messages are displayed in descending order as follows:
Danger!
This symbol indicates an imminent danger.
Non-observance will result in personal injury or death.
Warning!
This symbol indicates a possible fault or danger.
Non-observance may cause personal injury or serious property damage.
Caution!
This symbol indicates a possible fault.
Non-observance could interrupt the device and any connected systems and plants, or result in
their complete failure.
Informative Symbols
Note
This symbol brings important information to your attention.
Action
This symbol indicates a paragraph with instructions. You are prompted to perform an action or
a sequence of actions.
1.4 Intended Use
The UC***-18GS series ultrasonic sensors use ultrasonic pulses to detect objects. The sensor
emits ultrasound, which is reflected by the object and received again by the sensor. The measured sound propagation time is used to determine the distance to the object (pulse-echo principle). Objects in the following forms can be detected: solid, granular, powder, or liquid. The
color and surface structure of the objects are irrelevant. Gases cannot be detected.
Note
UC***-18GS series ultrasonic sensors are not safety components within the meaning of the EC
Machinery Directive 2006/42/EC. They must not be used for the purposes of avoiding risk to
individuals or parts of the body.
Always operate the device as described in these instructions to ensure that the device and connected systems function correctly. The protection of operating personnel and the plant is guaranteed only if the device is operated in accordance with its intended use.
The operator is responsible for complying with all local safety regulations.
Only use recommended original accessories.
2020-11
7
Page 8

UC***-18GS series
ISO9001
Introduction
1.5 General Safety Notes
Responsibility for planning, assembly, commissioning, operation, maintenance, and dismounting lies with the plant operator.
Installation and commissioning of all devices may be performed only by trained and qualified
personnel.
The device is only approved for appropriate and intended use. Ignoring these instructions will
void any warranty and absolve the manufacturer from any liability.
If serious faults occur, stop using the device. Secure the device against inadvertent operation.
In the event of repairs, return the device to your local Pepperl+Fuchs representative or sales
office.
Note
Disposal
Electronic waste is hazardous. When disposing of the equipment, observe the current statutory
requirements in the respective country of use, as well as local regulations.
1.6 Declaration of Conformity
This product was developed and manufactured in line with the applicable European sta ndards
and directives.
Note
A declaration of conformity can be requested from the manufacturer.
The product manufacturer, Pepperl+Fuchs Group, 68307 Mannheim, Germany, has a certified
quality assurance system that conforms to ISO 9001.
2020-11
8
Page 9

UC***-18GS series
Product Description
2 Product Description
2.1 Use and Application
The UC***-18GS series ultrasonic sensors use ultrasonic pulses to detect objects. The sensor
emits ultrasound, which is reflected by the object and received again by the sensor. The measured sound propagation time is used to determine the distance to the object (pulse-echo principle). Objects in the following forms can be detected: solid, granular, powder, or liquid. The
color and surface structure of the objects are irrelevant. Gases cannot be detected.
Typically, ultrasonic sensors are used in a wide range of applications including:
• Sag control on packaging and metal processing machines
• To measure diameter of roll material (e.g., film, paper, metal sheet)
• To detect fill levels in tanks and silos
• To avoid collisions with self-propelled or controlled machines
• Height control of booms for sprayers
• To detect containers on refuse collection vehicles
• To detect objects or to measure fill levels on conveyor belts
• To detect pallets on forklifts
• To monitor range on barrier systems
• To detect PCBs when feeding them to SMD placement machines
The standard cylindrical 18GS housing design can be program med and adapted to various
applications. You can program boundaries, output modes, output types, and sound beam width
via the programming buttons on the sensor or via the convenient IO-Link or IrDa interfaces.
Convenient programming via the IO-Link or IrDa interfaces makes setting many other parameters such as filter options, echo suppression, synchronization settings, etc. possible. You therefore have various channels and adjustment options available for programming that can be used
individually depending on your application.
Programming of the ultrasonic sensors via IO-Link is possible offline using IODD or DTM and
an FTD frame program. You can program it online via a PLC via IO-Link master and IODD. Programming via the IrDA interface is possible using a DTM and an FTD frame program.
The IO-Link versions with switching output enable IO-Link communication in accordance with
the IO-Link standard. The 18GS versions with analog output can be parameterized via their IOLink interface.
The advantages of the UC***-18GS ultrasonic sensors are:
• Proven cylindrical housing design
• Advanced setting options via programming button on the device
• IO-Link 1.1 interface for service and process data, and for parameterization
• Excellent immunity to background noise such as compressed air
• Can be self-synchronized to avoid mutual interference of several adjacently mounted
ultrasonic sensors
• Programmable echo suppression
What Is IO-Link?
IO-Link enables seamless communication and digital data transfer from the control panel level
down to the sensor level. The intelligent sensors can be used to their full potential with IO-Link,
paving the way for Industry 4.0 in automation technology. The internationally standardized
interface provides value at all stages, from plant design and installation through to operation
and servicing. This value is achieved by sustained cost reductions and efficiency improvements.
2020-11
9
Page 10

UC***-18GS series
Product Description
Standardized device description files ("IODDs") and parameterization via software tools ensure
convenient configuration and integration of IO-Link sensors. Intelligent and transparent parameter management increases application flexibility and keeps downtimes to a minimum.
Parameters can be customized quickly and easily, even for complex production and batch
changes. Transparency right through to the sensor gives users access to a comprehensive
range of parameterization options and device diagnostics functions, allowing them to perform
predictive serv icing.
The technology offers particular benefits
• In service (troubleshooting, ser vicing, and device exchange)
• During commissioning (cloning, identification, configuration, and localization)
• And during operation (job changeover, continuous parameter monitoring, and online diag-
Device Description File (IODD)
The sensor parameters are different for each device. A standardized description of these
param eters can be found in the IO Device Description (IODD). The IODD can be imported into
various engineering tools from different system providers, providing they suppor t IODD. The
sensor can be configured or diagnosed using the appropriate tool.
IODDs can be integrated in a control environment to allow IO-Link devices to be used for IOLink operation. Both programming and exchanging process data can be performed with a PLC.
The IODD can be imported into a range of engineering tools from various system providers for
programming and diagnostics, provided these tools support IODD
DTM (Device Type Manager)
If a sensor is not used long-term in an IO-Link environment, but nevertheless needs to be configured, this can be done easily via a PC with installed FDT frame application (e.g., PACTware)
and with the DTM (Device Type Manager, a kind of "device driver") available for the sensor.
Unlike configuration via the IODD, this method provides extended functions and ensures
improved graphic visualization and convenient operation. Functions such as UC*** -18GS
series "echo suppression" can only be configured via the relevant DTM.
Offline Parameterization
For offline parameterization, IO-Link devices are already configured before mounting. To do
this, use the Pepperl+Fuchs IO-Link USB master.
We recommend using the "PACTware" software as an FDT frame application and user interface. So that it can be used in PACTware, the IODD mu st first be translated via the "IODD interpreter DTM" software. "IODD Interpreter DTM" is used to transform the IODD into a tabular user
inter face for parameterization.
The software components required in each case are summarized in the most current version of
the "IO-Link Offline Parameterization Tool" software package. The software package and the
documentation on its installation and use can be found online at www.pepperl-fuchs.com.
If you use the "IO-Link Offline Parameterization Tool" software package, have active internet
access, and have connected your device via the Pepperl+Fuchs IO-Link USB master, the
PACTware will automatically find the right IODD online.
The device description file (IODD) required for integration in an IO-Link system and for parameterization and diagnosis is available online. Visit www.pepperl-fuchs.com and navigate to the
relevant product page for the UC***-18GS sensor.
Online Parameterization
When commissioning machines and plants, you must integrate master and IO-Link devices into
the appropriate control environment. Depending on the components used, different software is
required.
You can configure and parameterize the devices using an IO-Link configuration tool. During
operation, you can check the parameters for the IO-Link devices, read, and monitor the status
and diagnostic data. IO-Link data is integrated into an application program using function
blocks.
nostics)
2020-11
10
Page 11
UC***-18GS series
1
2
3
4
Product Description
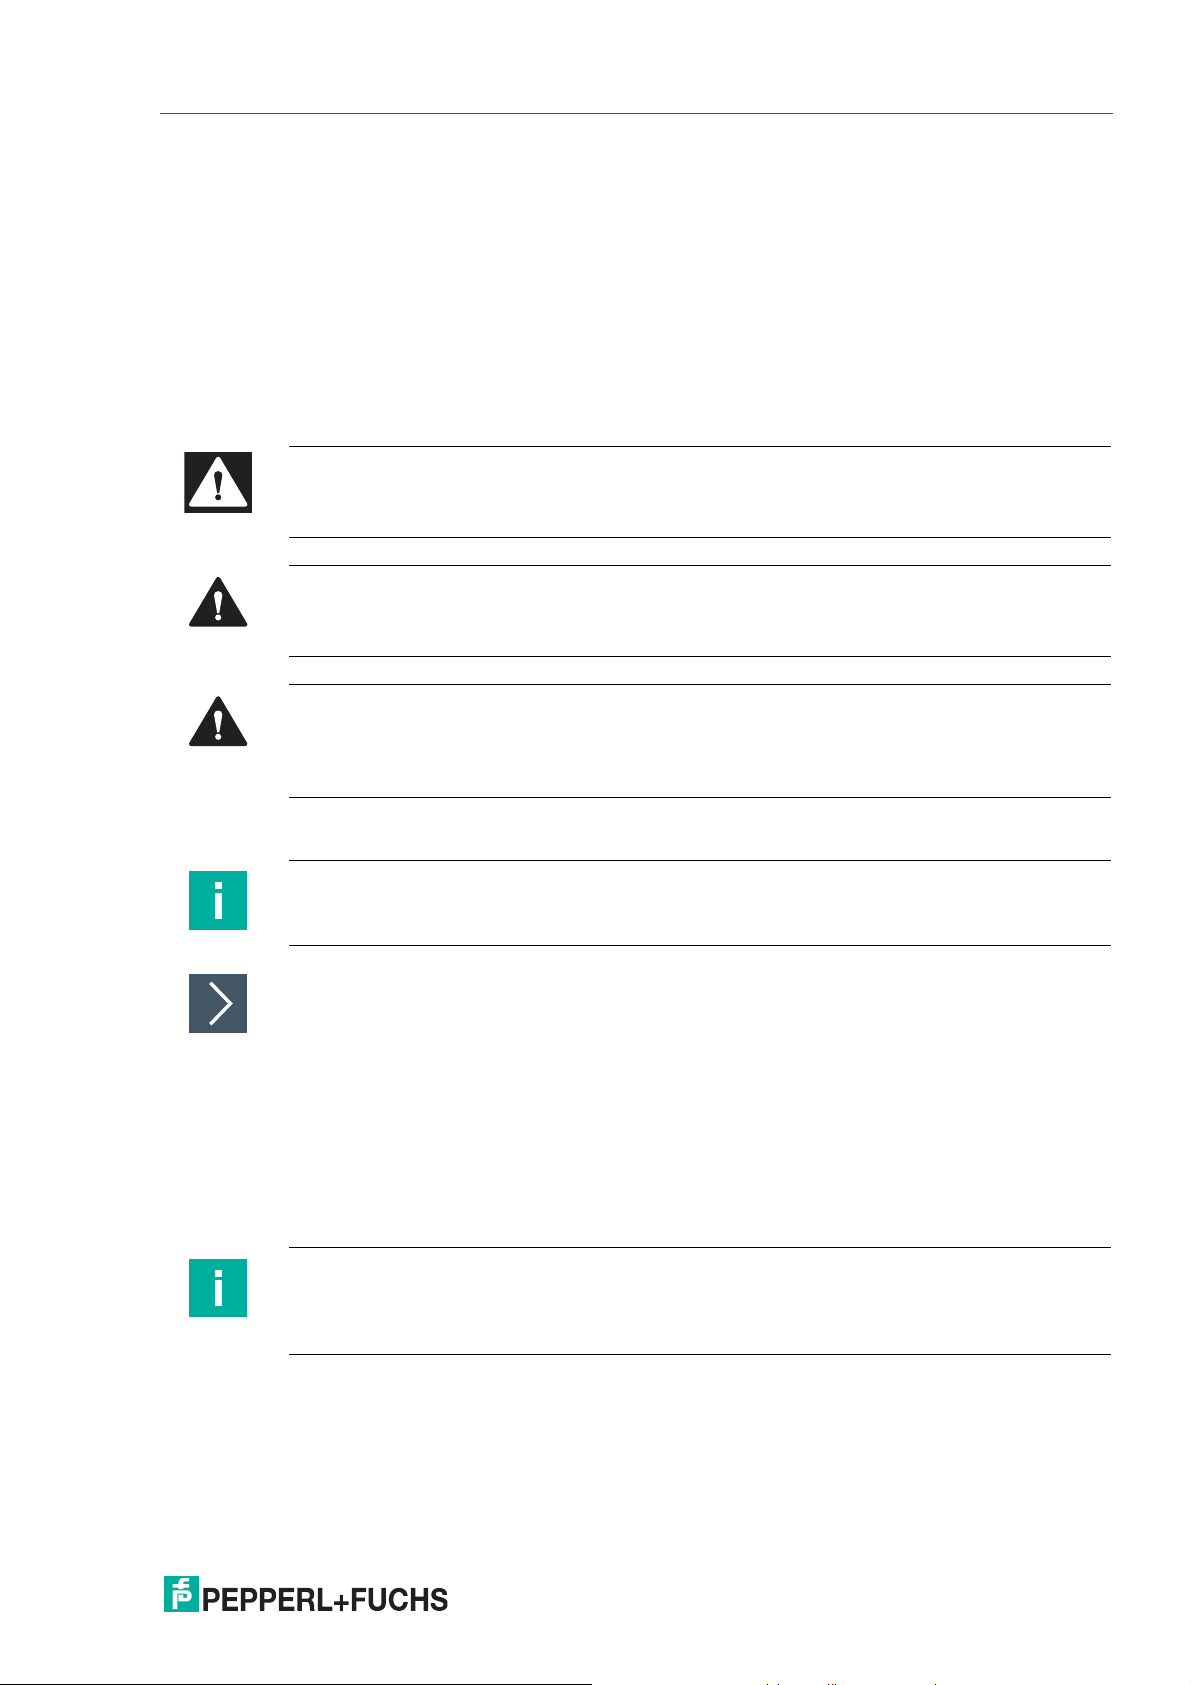
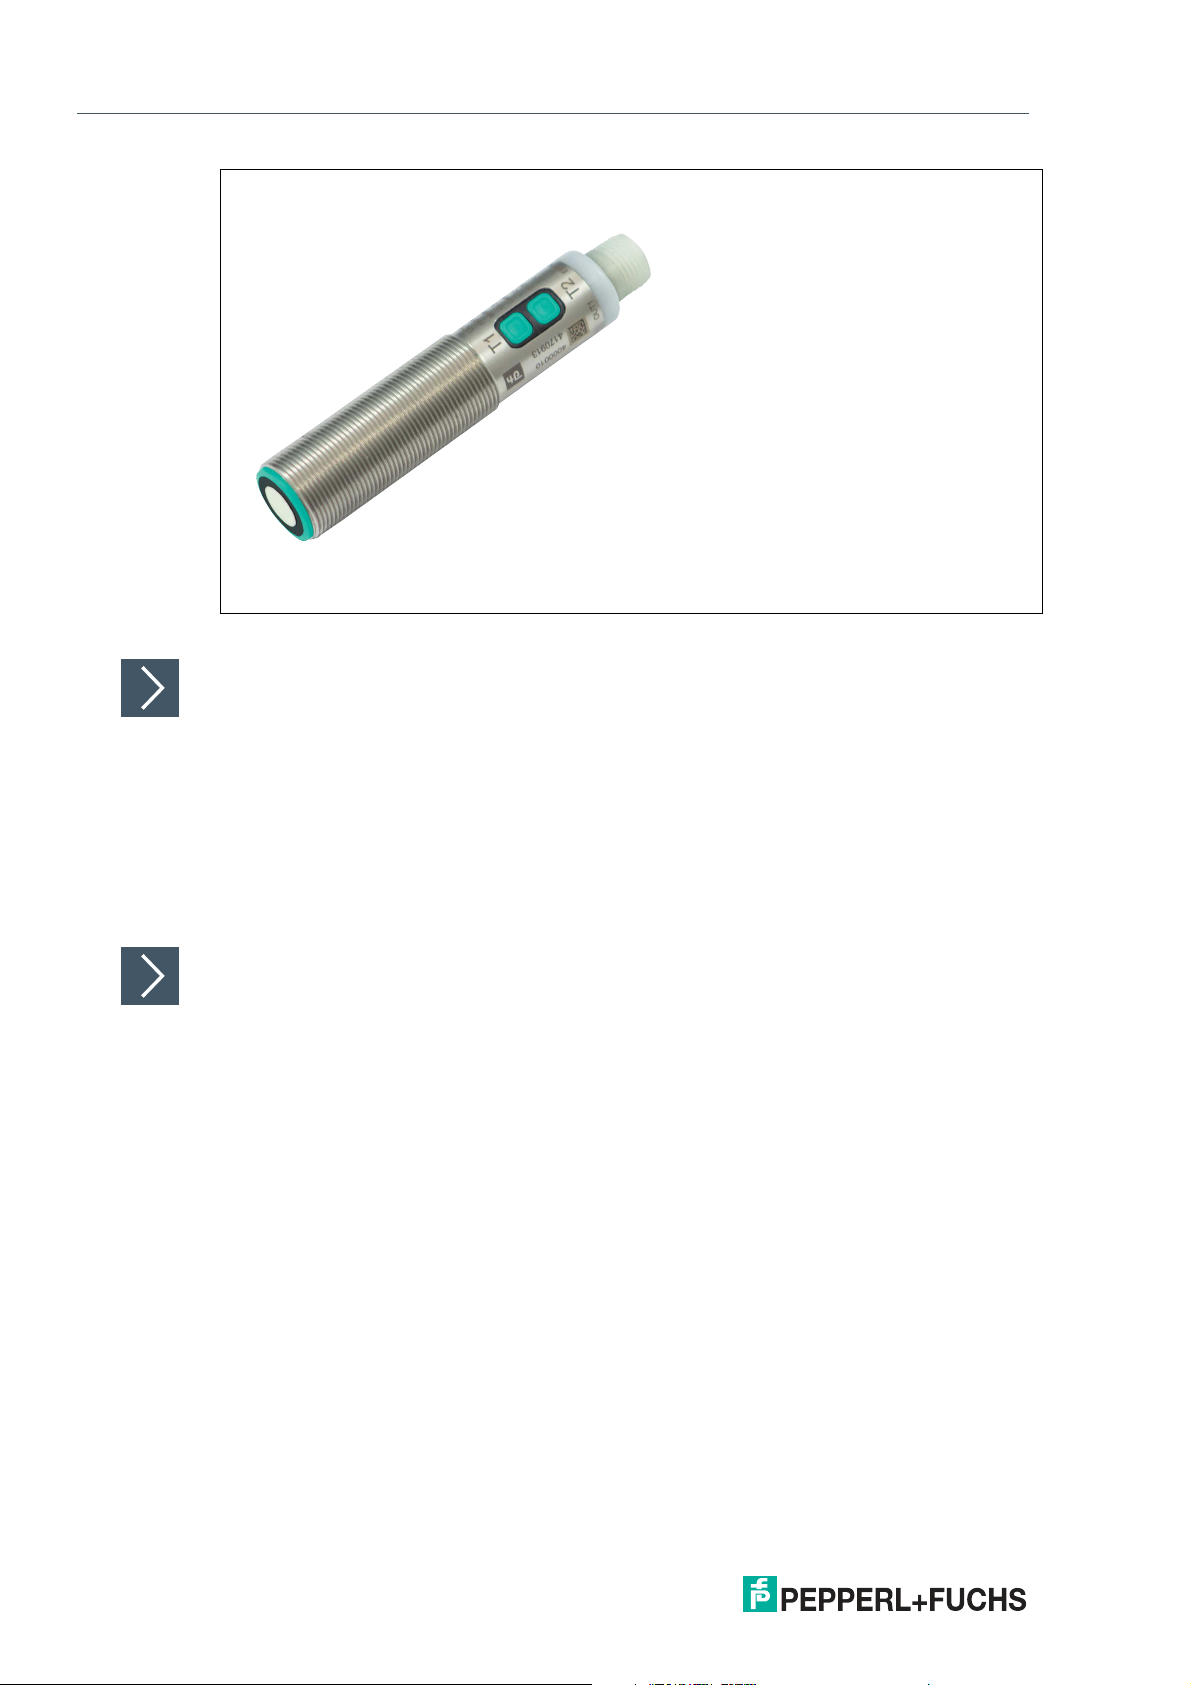
2.2 Indicators and Operating Elements
Figure 2.1
1. Yellow/green/red LED
2. Programming button T1
3. Programming button T2
4. Sonically-active area
LED display for sensors with switching output
Green LED Yellow LED Red LED
In normal operation
Error-free operation On Switch state Off
Fault (e.g., compressed air) Off Retains previous state (factory
default setting, can be
changed via IO-Link)
Standby (high level for > 1 s at
Flashing Retains previous state Off
synchronization input)
When programming the switch points
Object detected Off Flashing slowly Off
No object detected Off Flashing quickly Off
Unreliable object detection Off Off Flashing
Confirmation of successful pro-
Flashes 3x Off Off
gramming
Warning in the event of invalid
Off Off Flashes 3x
program ming
When programming operating modes
Programming the Output Mode Flashing Off Off
Programming the Output Logic Off Flashing Off
Programming the Sound Beam
Off Off Flashing
Width
Table 2.1
On
2020-11
11
Page 12

UC***-18GS series
Product Description
LED display for sensors with analog output
In normal operation
Error-free operation On Output state Off
Fault (e.g., compressed air) Off Retains previous state (factory
Standby (high level for > 1 s at
synchronization input)
When program ming the limits
Object detected Off Flashing slowly Off
No object detected Off Flashing quickly Off
Unreliable object detection Off Off Flashing
Confirmation of successful programming
Warning in the event of invalid
programming
When program ming operating modes
Programming the ou tput mode Flashing Off Off
Programming the ou tput type Off Flashing Off
Programming the sound beam
width
Table 2.2
Green LED Yellow LED Red LED
On
default setting, can be
changed via IO-Link)
Flashing Retains previous state Off
Flashes 3x Off Off
Off Off Flashes 3x
Off Off Flashing
12
2020-11
Page 13

UC***-18GS series
Product Description
2.3 Accessories
Various accessories are available.
2.3.1 Accessories for Mounting and Connection
Several components are available for mounting and connecting UC***-18GS series sensors.
You will find details online at www.pepperl-fuchs.com on the product page for the relevant
sensor or on the relevant datasheet.
The following types of accessories are available for order:
• Mounting aid AB-18
• Connection cable and cordset
Note
For mounting, connection, and commissioning, the following product information is available
online at www.pepperl-fuchs.com on the product page for the relevant sensor: datasheet,
commissioning instructions, m anual. The relevant DTM also contains comprehensive contextrelated help texts.
2.3.2 Parameterization Aids
The following parameterization aids are available:
Designation Description
PACTware FDT frame application for operating IODDs and DTMs
Pepperl + Fuchs PACTware
Connection Wizard
IODD for UC***-18GS* IODD (IO Device Description) – device description for operating
DTM for UC***-18GS* DTM (Device Type Manager) – device description and graphic
IO-Link Offline Parameterization Tool
IO-Link-Master02-USB
UC-PROG-IR-USB Interface cable to parameterize sensors with IrDA interface
V1-G-2M-PVC-V1-G 4-pin cordset, M12 to M12, to connect a UC***-18GS series sen-
IO-Link-Master-USB DTM Device type manager – software for operating the IO-Link-Mas-
Table 2.3
Wizard for simple project and connection set-up of the ultrasonic
sensor in PACTware.
Visit www.pepperl-fuchs.com and access the product page for
the relevant UC***-18GS series sensor.
the sensor, integration in the system environment
Visit www.pepperl-fuchs.com and access the product page for
the relevant UC***-18GS series sensor
user interface for operating the sensor, integration into the system
environment
Visit www.pepperl-fuchs.com and access the product page for
the relevant UC***-18GS series sensor
FDT frame application for operating IODDs and DTMs. This tool
contains PACTware, IODD Interpreter DTM, and IO-Link USB
Master DTM.
Visit www.pepperl-fuchs.com and access the product page for
the relevant UC***-18GS series sensor.
IO-Link USB adapter box to communicate with the IO-Link device
via a PC, M12 connection for sensor
sor to the IO-Link-Master02 USB
ter02 USB via FDT.
2020-11
13
Page 14
UC***-18GS series
LED
4
24
48
80
90
M12 x 1
18 x 1
Installation
3 Installation
3.1 Safety Information
Caution!
Risk of short circuit
Carrying out work while the system is energized m ay result in damage to the device.
• Always disconnect the supply voltage before carrying out work on the device.
• Only connect the device to the su pply voltage once all work has been completed.
3.2 Preparation
Unpacking the Device
1.
Check the packaging and contents for damage.
In the event of damage, inform the shipping company and notify the supplier.
2.
Check the package contents against your order and the shipping documents to ensure that all
items are present and correct.
Should you have any questions, direct them to Pepperl+Fuchs.
3.
Retain the original packaging in case the device is to be stored or shipped again at a later date.
3.3 Mounting
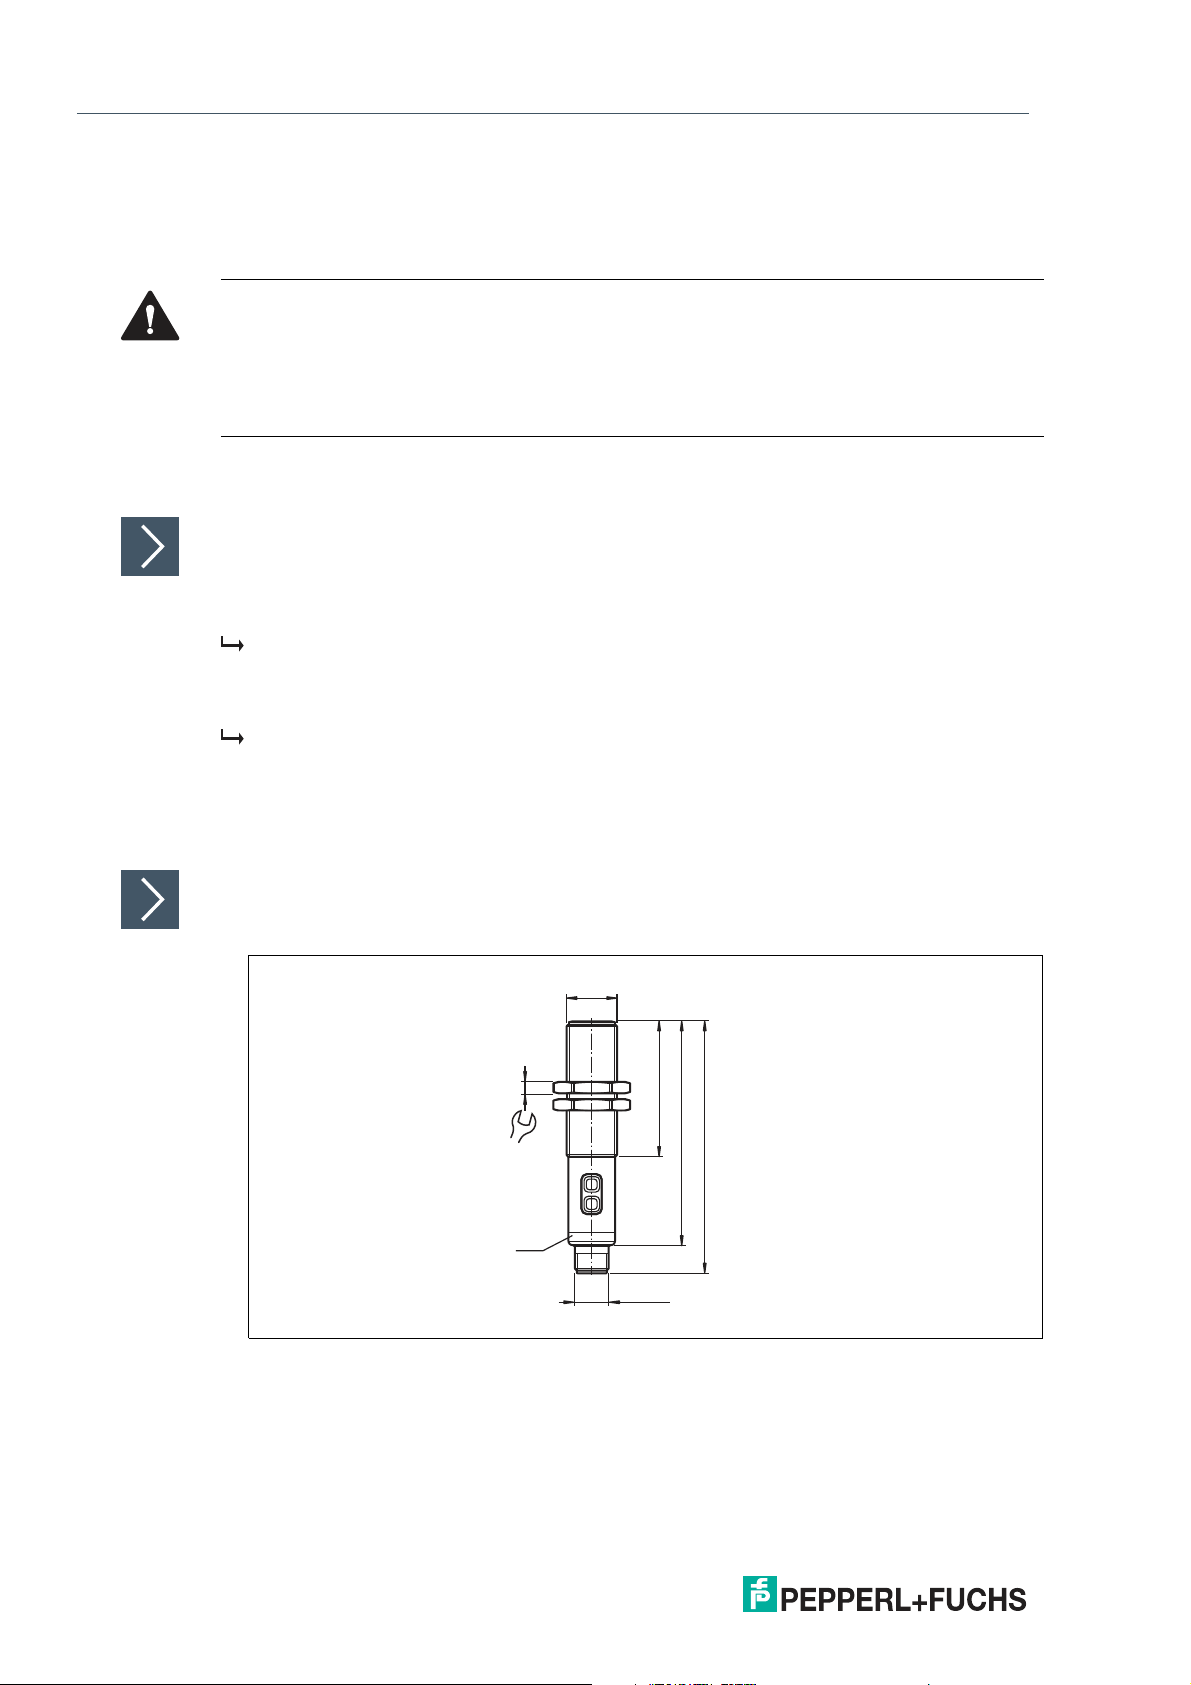
Mounting UC***-18GS Sensors
Use M18 nuts (included as standard) to secure the sensor and tighten to a maximum torque of
30 Nm.
14
Figure 3.1
2020-11
Page 15

UC***-18GS series
1
5
2
3
4
L+
L-
Q2
SYNC
C/Q
1
5
2
3
4
L+
I/U
SYNC
C/Q
L-
Installation
3.4 Connection
Note
A three-pin adapter or triple-strand connection cable must be used when connecting the
sensor to an IO-Link Class B master port.
If the synchronization option is unused, connect the synchronization input to ground (0 V)
during operation without IO-Link.
Connection Images
Figure 3.2 UC****-18GS-2EP-IO-V15
Figure 3.3 UC****-18GS-IUEP-IO-V15
Applying Supply Voltage for a Sensor with Connector Plug
To supply voltage to the sensor, proceed as follows:
1.
Insert the prepared connection cable into the connector plug provided for this purpose on the
underside of the housing.
2.
Screw the u nion nut onto the connector plug as far as it will go. This ensures that the power
cable cannot be pulled out inadvertently.
3.
Connect the supply voltage to the cables provided for this purpose and switch it on.
The sensor is ready for operation.
Control via IO-Link
To prepare the sensor for control via IO-Link, proceed as follows:
Connect the sensor to an IO-Link master. For a sensor with connector plug, screw the union nut
onto the connector plug as far as it will go. Use a four-strand sensor cable for the connection.
The sensor is now prepared for IO-Link communication.
2020-11
15
Page 16

UC***-18GS series
Commissioning without IO-Link
4 Commissioning without IO-Link
Switch on the supply voltage. The operating indicator on the sensor lights up green.
The sensor will now function using the preset parameters.
Note
It is only possible to change configuration by programming with the programming button or by
configuring via IO-Link!
16
2020-11
Page 17

UC***-18GS series
Sensor Programming via the Programming Button
5 Sensor Programming via the Programming Button
Basic information about programming
In terms of factor y settings, the sensor can only be programmed during the first 5 minutes after
switching on. This time is extended during the actual programming process. The option of programming the sensor is revoked if no programming activities take place for 5 minutes. After this,
programming is no longer possible until the sensor is switched off and on again.
When configuring sensors via the IO-Link, you can use the DTM to adjust the programming
button’s locking logic. This is done in the "Sensor configuration" menu option, "Local controls"
tab.
When actively communicating via the IO-Link interface of the sensor, it is not possible to use
the program ming button to program.
The programming activities can be canceled at any time without changing the sensor settings.
To do so, press and hold the programming button for 10 seconds.
Programming via the programming button can take place in the stand-alone mode of a sensor
or also in the synchronized sensor group of several sensors (only for automatic common mode
and multiplex mode). When program ming in the synchronized sensor group, there may be a
delay to starting the programming routine, depending on when the sensor in question is next in
line. For the duration of the programming process, the other sensors in the sensor group go into
standby mode (green LED is flashing). Then synchronization mode continues to operate as
normal.
5.1 Programming Switch Points / Limits
Note
Depending on the sensor type, you can program the switch points (SP1, SP2) for sensors with
switching output and program the limits (SP1, SP2) for sensors with analog output using
programming buttons T1 and T2.
Depending on the output, the following programming buttons are used for programming:
• Switching output 1 via programming button T1
• Switching output 2 via programming button T2 (only with UC*-18GS-2EP* sensors)
• Analog output via programming button T2 (only with UC*-18GS-IUEP* sensors)
The programming sequence for SP1 and SP2 are identical in both cases and are therefore
described consecutively below. You must carry out the two programming steps separately for
each switching output / analog output. To ease understanding, the programming button is only
called T below.
2020-11
17
Page 18
UC***-18GS series
Sensor Programming via the Programming Button
Figure 5.1
Programming Switch Point 1 / Near Limit (SP1)
If the object is detected correctly during the programming process, the yellow LED flashes
slowly. If no object is detected, the yellow LED flashes at a higher frequency. A flashing red LED
during or when com pleting the programming process indicates unreliable object detection. In
this case, correct the alignment of the object during the program ming process until the yellow
LED flashes. Only then will the settings be transferred to the sensor memory.
1.
Position the object at the site of the required switch point / the required near limit.
2.
Press and hold the T programming button for two seconds (yellow LED flashes)
3.
Briefly press the T programming button (green LED flashes 3 times as confirmation). The
sensor returns to normal operation.
Programming Switch Point 2 / Far Limit (SP2)
1.
Position the object at the site of the required switch point / required far limit.
2.
Press and hold the T programming button for two seconds (yellow LED flashes)
3.
Press and hold the T programming button for two seconds (green LED flashes 3 times as
confirmation). The sensor returns to normal operation.
18
2020-11
Page 19
UC***-18GS series
T
5s
1x
2x
3x
4x
T
T
2s
1x
2x
T
T
2s
1x
2x
3x
T
2s
T
Ausgangsmodus
LED grün
Ausgangsverhalten
LED gelb
Schallkeulenbreite
LED rot
Normalbetrieb
kurz kurz kurz
Sensor Programming via the Programming Button
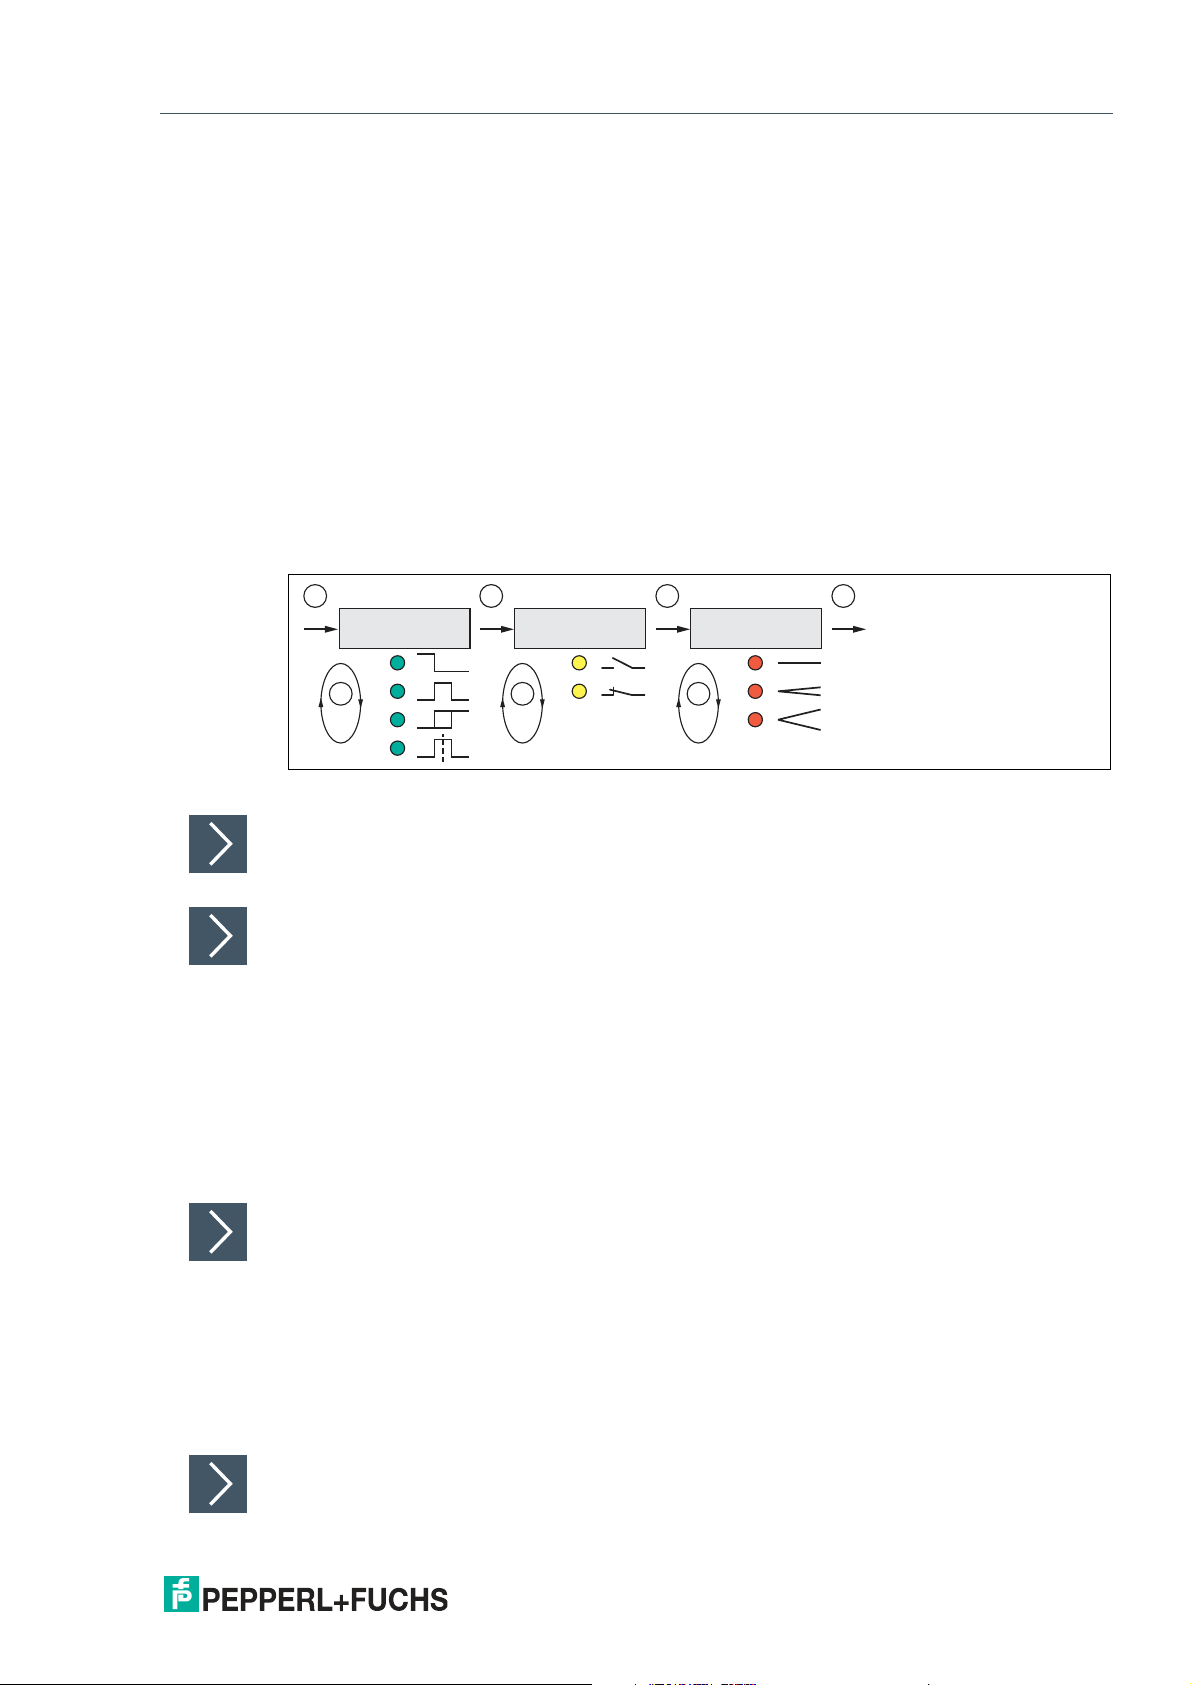
5.2 Programming Sensor Operating Modes for Switching Output
The sensor features a 3-stage process for programming the sensor operating modes. In this
programming routine you can program as follows:
• A) Output mode
• B) Output logic
• C) Sound beam width
The programming sequence for switching output 1 and switching output 2 are identical and are
therefore described consecutively below. You must perform the programming steps separately
for each switching output. However, the width of the sound beam is generally set only once for
the sensor. You can set the sound beam width while programming switching output 1. To ease
understanding, the programming button is only called T below.
These stages of the process are programmed in succession. To switch from one programming
step to the next, press and hold the programm ing button for two seconds.
The following graphic illustrates the programming routine:
Figure 5.2
Activating the Programming Routine
To activate the program ming routine, press the programming button for five seconds until the
green LED begins to flash.
Programming the Output Mode
The green LED is now flashing. The number of flashing pulses indicates the currently programmed output mode:
1x: switch point mode
2x: window mode
3x: hysteresis mode
4x: retroreflective mode
1.
Briefly press the programming button to navigate through the output modes in succession.
Select the required output mode.
2.
Press the programming button for two seconds to switch to the next output logic programming
step.
Programming the Output Logic
The yellow LED is now flashing. The number of flashing pulses indicates the currently programmed output logic:
1x: normally-open
2x: normally-closed
1.
Briefly press the programming button to navigate through the output logic in succession. Use
this m ethod to choose the output logic.
2.
Press the programming button for two seconds to switch to the next programming step, the
programming of the sound beam width.
Programming the Sound Beam Width
2020-11
19
Page 20

UC***-18GS series
T
5s
1x
2x
T
T
2s
1x
2x
T
T
2s
1x
2x
3x
T
2s
T
Output mode
LED green
Output type
LED yellow
Beam width
LED red
Normal
operation
short short short
Current
Voltage
Sensor Programming via the Programming Button
The red LED is now flashing. The number of flashing pulses indicates the currently programmed sound beam width:
1x: narrow
2x: medium
3x: wide
The sound beam width is generally set only once for the sensor.
1.
Briefly press the programming button to navigate through the sound beam widths in
succession. Use this method to choose the required sound beam width.
2.
Press and hold the programming button for two seconds to save all per formed settings and to
return to normal operation.
5.3 Programming the Sensor Operating Modes for Analog Output
The sensor features a 3-stage process for programming the sensor operating modes. In this
programming routine you can program as follows:
• A) Output mode
• B) O utput type
• C) Sound beam width
These stages of the process are programmed in succession. To switch from one programm ing
step to the next, press and hold the T2 programming button for two seconds.
To ease understanding, the programming button is only called T below.
The following graphic illustrates the programming routine:
Figure 5.3
Note
To exit the IO-Link parameter mode in normal operation (analog signal at the output), briefly
disconnect the sensor from the voltage supply.
Activating the Programming Routine
To activate the programming routine, press the programming button for five seconds until the
green LED begins to flash.
Programming the Output Mode
The green LED is now flashing. The number of flashing pulses indicates the currently programmed output mode:
1x: rising ramp
2x: falling ramp
1.
Briefly press the programming button to navigate through the output modes in succession.
Select the required output mode.
2.
Press the programming button for two seconds to change to the next programming step, the
selection of the output type.
Programming the Output Logic
20
2020-11
Page 21

UC***-18GS series
Sensor Programming via the Programming Button
The yellow LED is now flashing. The number of flashing pulses indicates the currently programmed output type:
1x: current output
2x: voltage output
1.
Briefly press the programming button to navigate through the output types in succession.
Select the required output type.
2.
Press the programming button for two seconds to switch to the next programming step, the
programming of the sound beam width.
Programming the Sound Beam Width
The red LED is now flashing. The number of flashing pulses indicates the currently programmed sound beam width:
1x: small
2x: medium
3x: wide
1.
Briefly press the programming button to navigate through the sound beam widths in
succession. Use this method to choose the required sound beam width.
2.
Press and hold the programming button for two seconds to save all performed settings and to
return to normal operation.
2020-11
21
Page 22

UC***-18GS series
Commissioning Using PACTware and DTM
6 Commissioning Using PACTware and DTM
There is a DTM available to download to help you fully configure the sensor easily via IO-Link.
Visit www.pepperl-fuchs.com and access the product page for the relevant UC***-18GS
series sensor. Configuration via IO-Link and via the IrDa infrared interface is possible with this
DTM.
This manual sets out how to configure using the "PACTware" FDT frame application in which
the DTM (Device Type Manager) is loaded. In principle you can use other appropriate FDT
frame applications. It is also possible to use the appropriate IODD for configuration instead of
using the DTM.
6.1 Commissioning via IO-Link
Note
An M12 cordset is necessary to connect the sensor to the IO-Link master. You can find suitable
cordsets by visiting www.pepperl-fuchs.com and clicking on the product page for the relevant
sensor.
Prerequisites for Commissioning
Proceed as follows to communicate with the sensor via IO-Link using the "PACTware DC" software and the associated DTM (Device Type Manager):
1.
Make sure that PACTware DC and the necessary DTMs (Device Type Managers), and the
IODD device description for the sensor, IO-Link master, and any required communication
DTMs for upstream components (e.g., IO-Link master) are installed.
2.
Connect the sensor via an M12 cordset to an IO-Link USB master.
3.
Connect the IO-Link USB master to a USB connection on your PC via a USB cable.
Setting Up Sensor Communication Using PACTware DC
1.
Launch PACTware DC by double-clicking the PACTware DC icon.
22
Figure 6.1
2020-11
Page 23

UC***-18GS series
Commissioning Using PACTware and DTM
2.
Click Search new device.
The IO-Link USB master will be identified by the PACTware DC if it is connected to the PC.
Figure 6.2
3.
In the Project, click IO-Link USB Master...
The PACTware DC automatically establishes the connection to the sensor if the ultrasonic
sensor is connected to the IO-Link USB m aster.
Figure 6.3
4.
Select Read data from device.
The PACTware DC starts continuous data retrieval from the sensor.
2020-11
23
Page 24

UC***-18GS series
12
Commissioning Using PACTware and DTM
Setting Up Sensor Communication Using PACTware via the
"Pepperl+Fuchs PACTware Connection Wizard"
You need to install "Pepperl + Fuchs PACTware Connection Wizard" on your PC and connect
the sensor to the PC via the IO-Link USB master.
As an alternative to establishing a connection via PACTware DC, you can simply start and
establish a connection with the sensor using the "Pepperl + Fuchs PACTware Connection Wizard." This wizard assumes all necessary steps in opening a PACTware project.
Double-click the "Pepperl+Fuchs PACTware Connection Wizard" icon.
Loads PACTware and the associated DTM and the connection to the sensor is automatically
established.
6.2 Commissioning Using IrDa Infrared Interface
Note
To connect the sensor via the IrDa infrared interface, the UC-PROG-IR-USB interface cable is
required. You can find this interface cable at ww w.pepperl-fuchs.com and by navigating to the
product page for the relevant sensor.
Refer to the datasheet for the UC-PROG-IR-USB interface cable and read the description
regarding correct orientation of the sensor to the interface cable.
The "Pepperl+Fuchs PACTware Connection Wizard" is available to help you launch and connect the sensor easily. The wizard takes you through all the necessary steps for opening a
PACTware project. Alternatively, you can launch PACTware directly and add or launch devices
such as the UC-PROG-IR-USB interface cable, the sensor, the DTM, and connection set-up on
a step-by-step basis.
Prerequisites for Commissioning
Proceed as follows to communicate with the sensor via the infrared interface IrDA using
"PACTware DC" software and the associated DTM (Device Type Manager):
1.
Make sure that PACTware DC and the necessary DTMs (Device Type Managers), and/or the
IODD device description for the sensor, the IO-Link master, and any required communication
DTMs for upstream components (e.g., the UC-PROB-IR-USB interface cable) are installed.
Figure 6.4
2.
Attach the UC-PROG-IR-USB interface cable (1) to the back of the sensor such that the
marking arrow (1) points to the mark on the sensor infrared interface (2).
24
3.
Connect the sensor to a voltage supply via an M12 cordset.
4.
Connect the UC-PROG-IR-USB interface cable to a USB connection on your PC.
2020-11
Page 25

UC***-18GS series
Commissioning Using PACTware and DTM
Setting Up Sensor Communication Using PACTware DC
1.
Launch PACTware DC by double-clicking the PACTware DC icon.
Figure 6.5
2.
Click Search new device.
If the UC-PROG-IR-USB interface cable is connected to the PC, it will be detected by the
PACTware DC.
3.
In the Project, click IO-Link USB Master...
When the ultrasonic sensor has established the connection with the infrared interface of the
UC-PROG-IR-USB interface cable, the PACTware DC automatically establishes the connection to the sensor.
Figure 6.6
2020-11
25
Page 26

UC***-18GS series
Commissioning Using PACTware and DTM
Figure 6.7
4.
Select Read data from device.
The PACTware DC starts continuous data retrieval from the sensor.
Setting Up Sensor Communication Using PACTware via the
"Pepperl+Fuchs PACTware Connection Wizard"
You need to install "Pepperl + Fuchs PACTware Connection Wizard" on your PC and connect
the sensor to the PC via the UC-PROG-IR-USB interface cable.
As an alternative to establishing a connection via PACTWare DC, you can simply start and
establish a connection with the sensor using the "Pepperl + Fuchs PACTware Connection Wizard." This wizard assumes all necessary steps in opening a PACTware project.
Double-click the "Pepperl+Fuchs PACTware Connection Wizard" icon.
Loads PACTware and the associated DTM and the connection to the sensor is automatically
established.
26
2020-11
Page 27

UC***-18GS series
Configuration and Analysis with DTM via IO-Link
7 Configuration and Analysis with DTM via IO-Link
7.1 Overview
The sensor parameters are different for each device. These parameters are clearly set out in
the DTM (Device Type Manager), with guidance being provided in the form of graphics for
some of the parameters. The DTM can be imported into various engineering tools from different system providers, providing they support DTM. The sensor can then be configured or diagnosed using the appropriate tool (e.g., PACTware). The DTM menus are outlined below on the
basis of the "PACTware" FDT fram e application being used.
The DTM (Device Type Manager) set out below provides you with various ways of easily and
fully configuring the sensor via IO-Link and analyzing sensor logic.
In addition to configuring the sensor, you can use the Analysis & Echo suppression and
Observation menus to display and record sensor logic in operation to adapt it in the best way
possible to your application.
Note
The following DTM screenshots in the PACTware framework program apply to all versions of
UC***-18GS-...-IO-.. product versions and are described using examples. Individual sensors of
the product family vary in terms of the number of switching outputs or in terms of whether they
are fitted with or without analog output, for example. Consequently the DTMs of the respective
product versions may differ from the following screenshots.
Context-Related Help Texts via F1
Figure 7.1
In the DTM, you can access context-related help texts by clicking on the "?" icon in the displayed menu or by clicking on the required parameter and then pressing the F1 button. A display will then open showing information about the setting options of the relevant menu and its
parameters.
2020-11
27
Page 28

UC***-18GS series
Configuration and Analysis with DTM via IO-Link
7.2 Sensor Information Menu Option
Preprogram med manufacturer and device information is displayed in the Sensor inform ation
Figure 7.2
• menu option, and the number of operating hours. These are read-only fields.
• You can input application-specific tags to identify and mark your sensor in the system
environment. Text inform ation (string) can be input in the "User tag" and "Application-specific tag" fields.
7.3 Output Configuration Menu Option
Figure 7.3
In the Output configuration menu option, it is possible to set the sensor's output logic and
switching characteristics.
28
2020-11
Page 29

UC***-18GS series
Configuration and Analysis with DTM via IO-Link
7.4 Sensor Configuration Menu Option
Overview of the Sensor Configuration Menu Option
Figure 7.4
The Sensor configuration menu option consists of 4 tabs
• Evaluation (with reduced and advanced view)
• Synchronization
• Echo loss + Error handling
• Local controls
Evaluation Tab (Advanced View)
Figure 7.5
In the Evaluation tab, you can set the functions which impact evaluation logic with sensor measurement. You can choose between a reduced view for basic settings and an advanced view
for evaluation expert settings.
2020-11
29
Page 30

UC***-18GS series
Configuration and Analysis with DTM via IO-Link
Synchronization Tab
Figure 7.6
In the Synchronization tab, you can set the required synchronization mode if you want to suppress cross-talk when operating several UC***-F77-...-IO-.. sensors. Details of the individual
synchronization modes can be found in the chapter "Synchronizing Multiple Sensors."
Echo Loss + Error Handling Tab
Figure 7.7
In the Echo loss + Error handling tab, you can adjust the evaluation of a loss of echo and the
error output behavior of the sensor output.
Local Controls Tab
30
Figure 7.8
In the Local controls tab, you can lock or activate the programming button, or use a time lock
and display the status of the programming button (pressed / not pressed).
2020-11
Page 31

UC***-18GS series
Configuration and Analysis with DTM via IO-Link
7.5 Analysis & Echo Suppression Menu Option
Figure 7.9
In some applications, machine parts or support bars within a tank obstruct the sensing area,
preventing proper distance or level measurement. Using the Analysis & Echo Suppression
menu option, you can visualize and analyze all echoes received by the ultrasonic sensor from
one or a series of measurements, as well as suppress the disruptive objects in the sensing
area.
The general procedure is as follows:
1.
You must first establish a connection to a sensor built into the application environment.
2.
Ideally carry out multiple echo samples.
The corresponding data will then be shown in the display together with the switching thresh-
old of the sensor (blue line).
3.
Start automatic echo suppression. If necessary, you can correct the suppression areas.
Alternatively, you can also manually set the suppression areas.
4.
Finally, verify the detected settings by taking fresh echo samples.
The detected settings can be stored to/loaded from a file.
2020-11
31
Page 32

UC***-18GS series
1 2
3
6
4
8
13
7
9
11
5
10
12
Configuration and Analysis with DTM via IO-Link
Menu Description
Figure 7.10
No. Name Description
1 Echo sampling In the "Echo sampling" area, you can choose whether to record a
2 Display in graphic You can u se the "Display in graphic" area to set whether all of the
3 Start The "Start" button is used to start and stop echo sampling. After
4 Display area The sampled echoes are displayed in the form of thin columns
5 Save to file You can save the echo sample, including set suppression areas,
single value, 50 values or continuous data.
Using the continuous display also provides you with an alignment
aid. You can use the displayed amplitude of the evaluated echo to
check whether the sensor is optimally aligned to the object. You
will know this has worked when slightly varying the alignment no
longer increases the displayed echo amplitude.
gathered recorded echoes are shown or only the last recorded
echo image. The former is recom mended if you want to set suppression areas in an application; the latter in order to verify
detected suppression areas.
echo sampling has started, the button changes to "Stop."
• In the case of "individual" echo sampling, echo sampling stops
after one measurem ent.
• In the case of "50 values" echo sampling, echo sampling auto-
matically stops after 50 measurements. You can stop it at any
time by pressing the button.
• In the case of "continuous" echo sampling, echoes will con-
tinue to be sampled until you press the button again.
during and after completion of echo sampling.
The counter in the upper left corner indicates the number of echo
samples the current graphic is based on.
as a .CSV file, .XML file or .TXT file by pressing the "Save to file"
button. In addition to this data, sensor settings (parameter values)
will also be saved. This means it is possible to evaluate recorded
data later "offline."
32
2020-11
Page 33

UC***-18GS series
Configuration and Analysis with DTM via IO-Link
No. Name Description
6 Load file You can load previously-saved echo samples to the DTM by
pressing the "Load file" button, allowing you to assess or evaluate
the samples.
Note: You can only load a saved file if disconnected from the sensor.
7 Sensor switching
threshold (blue line)
8 Details of the
selected echo
9 Clear echo sample You can use the "Clear echo sam ple" button to clear the display
10 Rescale diagram You can use the "Rescale diagram" (magnifying glass) button to
11 Manually adjusting
the suppression
areas
12 Start automatic echo
suppression
13 Echo suppression
activated/not activated
Table 7.1
In addition to the recorded echoes, the switching threshold of the
sensor will also be displayed as a "blue line." Echoes for which
amplitude exceeds this threshold can be evaluated by the sensor.
Echoes below the switching threshold are in effect suppressed
and are discounted by the sensor during evaluation.
Clicking on one of the echo columns shown in the graphic displays detailed information about the selected echo below the
graphic.
Note: More information on this can be found in the following section "Details about sampled echoes."
area and restore to the original state.
enlarge the view along the x-axis 5-fold in 100 % increments.
If magnification is set to more than 100 %, the displayed area of
the x-axis can be shifted (by scrolling) to be able to obtain a magnified view of sections of the entire sam ple area.
To do so, right-click on the x-axis, keep it pressed and move left or
right with the mouse.
The area allows you to manually set individual suppression areas.
10 areas can be individually customized as well as deleted individually or all at once. Each suppression area is determined by
three parameters: "Start point," "Amplitude," and "Length."
• The mm value entered for "Start point" specifies where the
• The % value for "Amplitude" specifies the height of the sup-
• The mm value entered for "Length" specifies the length of the
Individual areas can be cleared by either pressing the relevant
button with the red "X" or by going directly to the graphic and clicking on the framed area and pressing the "Del" button on the keyboard. It is necessary to clear a single area, for exam ple, if the
echo from the target object is also contained in the echo sample
and was also suppressed by automatically setting the suppression areas.
All areas can be cleared by pressing the "Clear all areas" button.
Automatic echo suppression is a quick and simple, one-click
option to suppress all previously sampled echoes.
You must first take a sample of the echoes in the sensor’s installed
state and then press the "Start automatic echo suppression" button. The recorded echoes are then suppressed by setting the individual suppression areas based on algorithms.
The "Echo suppression activated/not activated" param eter
switches echo suppression in the sensor on or off and shows or
hides the echo suppression display in the m enu.
suppression area starts on the X-axis of the graph.
pression area in keeping with the scale of the Y-axis.
suppression area measured from the respective start point.
2020-11
33
Page 34

UC***-18GS series
2 3
5
1
6
4
Configuration and Analysis with DTM via IO-Link
Details about sampled echoes
Using an echo sample with manual echo suppression as an example, the following sets out the
graphic elements of information in the display area.
Figure 7.11
No. Name Description
1 Suppression area A rectangle indicates the specified suppression area.
2 Black part of the col-
umn
3 Gray part of the col-
umn
If multiple echo samples are shown in the graphic, the black part
of each column shows the amplitude which each of the recorded
echoes reached from this distance.
The gray part of the column, above the black part, shows the variance in the strength of amplitude of all echoes from this distance.
34
2020-11
Page 35

UC***-18GS series
Configuration and Analysis with DTM via IO-Link
No. Name Description
4 Details of the
selected echo
5 Red column The evaluated echo of the last recorded echo samples is dis-
6 Sensor switching
threshold (blue line)
Table 7.2
Clicking on a colum n from the echo sample displays the following
detailed information in the "Details of the selected echo" area:
• Echo number: The echo number is a consecutive number
• Frequency of occurrence: The value of the frequency of occur-
• Amplitude: The strength of the amplitudes of the selected
• Distance: The distance indicates the distance corresponding
• Suppressed: When indicating suppression (yes/no), the dis-
• Reserve to threshold: The threshold reserve value indicates
played in the graphic as a red column.
This specific representation makes it possible to subsequently
verify the effectiveness of set suppression areas because the
evaluated echo can be easily distinguished from the rest.
In the graphic, a "blue line" indicates the switching threshold of the
sensor alongside the recorded echoes. Echoes for which amplitude exceeds this threshold can be evaluated by the sensor.
Echoes below the switching threshold are in effect suppressed
and will be discounted.
which numbers the echoes shown in the graphic from left to
right.
rence indicates how often the selected echo occurs in the currently displayed number of echo samples.
echo is displayed as a % value
to the displayed echo value, measured from the sensor surface in mm.
Note: The displayed distance value always refers to the runtime measured by the sensor after the relevant echo was
taken. This does not m ean that an object has to be physically
present in each of these distances. For example, if an object is
located close to the sensor, so-called multiple echoes may
occur. This involves reflecting the sound pulse of a measurement back and forth several times between the sensor and the
object. The sensor sees each fresh echo reflected from the
object as its own echo and provides it accordingly. These multiple echoes can be identified in the graphic as echoes in the
x-times actual object distance.
plays shows whether the selected echo exceeds or falls below
the switching threshold. If the echo amplitude exceeds the
switching threshold, the echo is "not suppressed," but can be
evaluated by the sensor. If the echo amplitude is lower than
the switching threshold, the echo is "suppressed."
how reliably an echo is detected or suppressed. This va lue is
shaded by traffic light colors so that evaluation can be carried
out easily.
2020-11
35
Page 36

UC***-18GS series
Configuration and Analysis with DTM via IO-Link
Application Information for Echo Suppression
In order to be able to suppress echoes, you first have to set the "Echo suppression" parameter
to "enabled," provided that the parameter is not already set accordingly in the connected sensor. The "Start automatic echo suppression" button as well as the parameter values of the available suppression areas 1–10 are then displayed in the DTM.
Ideally, echo suppression areas should be based on a variety of echo samples (at least 50)
because the echo amplitude can vary from measurement to m easurement depending on the
ambient conditions.
Obtaining sampled echoes from the original sensor mounting location in the plant is mandator y
before starting targeted echo suppression.
Automatic Echo Suppression
If the echo from the target object is also contained in the echo samples, this will be suppressed
through automatic echo suppression. This m ay occur, for example, when echo samples are
taken in a partially-filled tank because then the echo from the surface of the liquid is also
included in the echo sam ples.
The same applies in the case where samples are carried out in an empty tank because the
echo from the base of the tank in most cases should still be identified as "Tank empty," even
after echo suppression.
In these cases, a manual correction must be carried out to the corresponding suppression area
to eliminate the relevant echo from the suppression (see section on "Manual echo suppression").
A lot of "Echo blocks" in the echo samples may lead to the 10 available suppression areas not
being sufficient for algorithm-based automatic suppression to really suppress all recorded
echoes. In this case, it is necessary to carry out m anual adjustments to the individual suppression areas (see section on "Manual echo suppression").
Manual Echo Suppression
Each of the 10 suppression areas is specified via the "Start point," "Amplitude," and "Length"
param eters (see section on "Menu description"). Each area can be modified or deleted individually or all at once.
To reliably suppress echoes under varying ambient conditions (for example fluctuations of air
temperature or air humidity), we recommend selecting a suppression area which is larger than
the echo or echo block to be suppressed. Specifically, this means that the amplitude value of
the suppression area should be set at least 10 % higher than the largest echo amplitude to be
suppressed. However, the amplitude value should not be set so high that the echo to detect
(e.g., a fill level) is no longer recognized. For indoor applications, the lateral boundaries of the
suppression area should be set to +/- 5 % and for outdoor applications to +/- 10% of the relevant echo distances, which should be suppressed with the area.
36
2020-11
Page 37

UC***-18GS series
Configuration and Analysis with DTM via IO-Link
Example
In terms of the following echo sample, the echo labeled with the red arrow should be suppressed. The echo labeled with the green arrow echo comes from the object that is to be
detected (e.g., the level surface).
Figure 7.12
The echo to be suppressed has an amplitude of 59 % at a distance of 84 mm. To suppress the
echo correctly and with reserve, for an indoor application the parameters for the suppression
area should be set as follows (in brackets are the corresponding values for an outdoor environment):
• Start point: 80 m m (75 mm)
• Amplitude: 69 % (69 %)
• Length: 8 mm (18 mm)
2020-11
37
Page 38

UC***-18GS series
Configuration and Analysis with DTM via IO-Link
The graphic with set suppression area for an interior application is as follows:
Figure 7.13
Note
The boundaries of suppression areas can also be adjusted directly within the graphic by leftclicking and dragging with the mouse.
Note
The amplitude difference between unwanted echoes and echoes from the desired target is
critical to proper echo suppression performance.
With echoes from target objects which reflect well, unwanted echoes in the peripheral areas
can be suppressed very successfully without impairing function because the echo amplitudes
of the unwanted echoes are not too high in this case.
On the other hand, unwanted echoes in the center of the sound beam usually create an echo
which is situated in approximately the same amplitude range as the echo of the object to be
detected. For this reason it is not usually possible to suppress unwanted echoes with normal
reflective properties in the center of the sound beam.
38
2020-11
Page 39

UC***-18GS series
1
2
Configuration and Analysis with DTM via IO-Link
7.6 Observation Menu Option
Figure 7.14
You can use the Observation menu option to track and record data from the ultrasonic sensor
over time, and the corresponding behavior of the switching and analog outputs. You can
choose from the "Visual observation" (1) or "Event-driven data logging" (2) application focuses.
Visual Observation
The visual observation functions (1) allow you during commissioning for example to observe
whether data and switching characteristics of the sensor behave as intended.
When you first access the Observation menu option in the DTM, automatic recording of data
will start in the graphic. From this point in time, recording will run continuously in the background. The data display works according to the "follow-mode-principle." It will always track
the current measured value in accordance with the rescale settings in the x-axis and make sure
it is visible in the display. You can save the data displayed in this trend graphic in a file in various
file formats for evaluation at a later stage.
Placing the check mark in front of the available measured variables or output statuses selects
which data will appear in the graphic.
Event-Driven Data Logging
Event-driven data logging functions (2) allow you, for cause analysis for example, to monitor
sensor logic in such a way that an event occurring sporadically is recorded in a file. You can
specify the recording conditions from predefined trigger criteria such as changing the status of
the switching output or a change to the value of the distance measurement. The DTM function
then observes the sensor and writes the measured variables and output statuses to a file if an
event occurs.
Note
If the DTM is closed w hilst data is being recorded, recording automatically stops. Values
recorded up to this point in time are and will remain in the corresponding file.
2020-11
39
Page 40

UC***-18GS series
1
8
7
5
2
6
3 4
9
10
11
12
Configuration and Analysis with DTM via IO-Link
Menu Description
Figure 7.15
No. Name Description
1 Follow m ode on / off If follow m ode is "On," data is displayed in accordance with the
current rescale setting of the x-axis. The measured value is visible
in the display. If follow mode is "Off," the data stops being continuously displayed. When follow mode is re-started, data recorded in
the background is added in the meantime.
2 Save trend data Only for visual observation
You can save data recorded via follow mode in one of three available file form ats (.csv, .xm l. or .txt) by pressing the "Save trend
3 Load data You can load the saved trend data (visual observation) or logging
4 Delete Pressing the "Delete" button allows you to delete all data in the
5 Distance By clicking on the check box, you can enable or disable display of
data" button. In addition to this data, sensor settings (parameter
values) will also be saved. This means it is possible to evaluate
recorded data later "offline."
data (event-driven data logging) to the DTM again by pressing the
"Load data" button to assess or evaluate the data.
Files with recorded data combined with the parameter settings
can be very useful for discussing issues with our experts.
Note: You can only load a saved file if disconnected from the sensor.
display area (10).
All data recorded up to this point is discarded and the display is
cleared. Recording au tom atically restarts from scratch.
the distance values in the display area in the form of a blue line.
40
2020-11
Page 41

UC***-18GS series
Configuration and Analysis with DTM via IO-Link
No. Name Description
6 Output By clicking on the check box, you can enable or disable display of
the output status (0/1) in the display area in the form of a green
line.
The analog output value is displayed in the diagram for an analog
output.
7 Interval You can use the "Interval" selection function to specify the time
interval at which data is recorded in the graphic. There are several
fixed inter vals available between 100 ms and 1 hour.
8 Start logging Only for event-driven data logging
You can use the "Start recording" button to start and end eventdriven recording of data in a file (data logging).
9 Settings for data log-
ging
10 Display area In the display area, the "Distance" and "Output" check boxes can
11 Output logic (green
line)
12 Distance value line
(blue line)
Table 7.3
Only for event-driven data logging
You can use the "Settings for data logging" button to specify
events for data recording and the name of the log file via a menu.
be used to display selected measured variables and output statuses in the form of line diagrams.
The green line indicates the logical status of the output (right yaxis) for the switch point set in the Output configuration menu
option.
The analog output value is displayed (likewise right y-axis) for a
sensor with analog output.
The blue line shows the distance value measured from the sensor
(left y-axis).
Scaling the X-Axis and Navigating to Significant Data
Use the left mouse button and Shift key to zoom the display area in the x direction; doing so
zooms in on selected data.
While holding down the Shift key, move the mouse cursor into the display area until the mouse
cursor changes to a magnifying glass icon (+). Hold down the left mouse button and define the
required magnification area with the selection window. You can repeat this process multiple
times.
The x-axis is then displayed in the corresponding zoom ratio. A scroll bar appears for the xaxis and y-axis, allowing you to scroll through the adjacent areas.
You can undo the zoom by holding down the Alt key and clicking the left mouse button in the
display area.
To zoom in / out:
• Zoom in >> press left mouse button and Shift key
• Zoom out >> press left mouse button and Alt key
2020-11
41
Page 42

UC***-18GS series
Configuration and Analysis with DTM via IO-Link
Data Logging Setting
Pressing the "Settings for data logging" button opens the menu displayed below.
Figure 7.16
You can use the "Name of log file" field to set the file path and file names for logging data.
You can select "Data logging mode" to set the events that trigger automatic data logging. You
need to press the OK button at the end to save the setting.
Measured data can be recorded either on a continuous or event-driven basis. For event-driven
recording, the number of measured values to be recorded before and after the event is independently defined via two parameters.
The following recording modes are ava ilable:
• Continuous
Data is continuously recorded and saved in the file. Data is sequentially recorded, but is
not necessarily consistent. Individual data may not be recorded depending on the sensor's repeat measurement rate, data transmission rate, computer's capacity, and operating system tasks.
• Fixed time interval
Data is recorded at fixed time intervals. The time interval can be selected in fixed increments between 500 ms and 2 hours.
• Change of switching output state
Data is recorded in the event of a change of status of a sensor switching output. A further
parameter is used to define with what type of status change data should be recorded. You
can choose status changes to "Closed," "Open," or "In both directions." If the sensor has
more than one switching output, but only one should be used as a trigger for recording
data, the other parameters need to be set to "Ignore."
42
• Value changes exceed defined tolerances
Data recording is triggered by changes to data which exceed the specified tolerance limits. The reference value is the distance value determined during the previous m easurement. The permissible tolerances can be specified either as an absolute value, i.e., in
mm, or as a percentage, relative to the previous measurement. If this tolerance limit is
exceeded from one measurement to the next, data recording is triggered.
2020-11
Page 43

UC***-18GS series
Configuration and Analysis with DTM via IO-Link
• Value outside the set limits
Data is recorded if specified, absolute limit values are exceeded. The distance value in
mm and the value at the sensor analog output (if physically present on the sensor) are
available as reference values. In addition, the "Trigger" parameter can be used to determine whether data recording should take place once per limit being exceeded or for the
full duration.
1.
Use the "Name of log file" field to set the file path and file name for logging data. To do so, click
on the "..." button.
2.
Use the "Data logging mode" option to set the events which should trigger automatic recording
of data. You need to press the "OK" button at the end to save the setting.
2020-11
43
Page 44

UC***-18GS series
Configuration and Analysis with DTM via IO-Link
7.7 Service Menu Option
Figure 7.17
You can use the Service menu option to set the following service functions.
• Reset to factory defaults: activating the switch resets the sensor to settings as deliv-
ered. All previous parameter changes are lost as a result of this.
• Locator indication: setting the "localization display" to "enabled" makes the LEDs flash
simultaneously. This function can be used to locate a sensor in a plant or machine more
easily. This function is disabled by default, which means that the LEDs indicate status and
diagnostic information.
7.8 Information Menu Option
Figure 7.18
The Inform ation menu option consists of 3 tabs
• Sensor details: information about hardware and software version
• IO-Link details: information about the device ID, vendor ID and information about the IO-
Link communication parameters
• DTM details: Information about the DTM version
2020-11
44
Page 45

UC***-18GS series
Description of Sensor Parameters
8 Description of Sensor Parameters
8.1 Sensor Information
Application-specific tag
Parameter name Access Value range
Application-specific tag Read/write 32 alphanumeric characters
Table 8.1
The user can use this parameter to tag the sensor, e.g., "Tank 2 fill level" or to tag the sensor in
the plant design.
User tag
Parameter name Access Value range
User tag Read/write 32 alphanum eric characters
Table 8.2
The user can use this parameter to tag the sensor, e.g., nam e of the customer’s company, in
whose plant the sensor is installed.
Operating hours
The parameter indicates the number of hours that the sensor has already been in operation for,
i.e., has been supplied with voltage.
8.2 Output – Switching Output
8.2.1 Output Mode
Overview of Output Mode
Parameter name Access Value range
Output mode Read/write • Switch point mode
Depending on the purpose of the sensor and its associated task, you can use this parameter to
individually adjust the mode for each switching output.
There are four options to choose from:
• Switch point mode
• Window mode
• Window mode
• Hysteresis m ode
• Retroreflective mode
• Deactivated
44
• Hysteresis mode
• Retroreflective mode
• Deactivated
2020-11
Page 46

UC***-18GS series
Description of Sensor Parameters
Switch point mode
If the mode is set to "Switch point mode," the output status changes at the set switch point 1.
The direction of motion or fill level of the object, to or from the sensor, and any configured
switch point 2 are not relevant.
Switch Point Mode in Practice
In practice, this mode is used to monitor a tank fill level at a minimum or maximum level. If the
media drops below or exceeds this level, the status of the switching output changes and indicates as such.
This setting is also suitable for preventing driverless transport systems from colliding with
objects in the path of travel. In this application, the output changes value if an object is detected
within a minimum distance. This causes the engine to stop or activates the vehicle's brakes.
Figure 8.1 Example of behavi or of a "normally-open" pu sh-pull / PNP switchin g ou tput in switch point
mode
Window Mode
When set to window mode, the status of the switching output changes if an object is detected
within the area between switch points 1 and 2. The direction of motion of the object to and from
the sensor is not relevant.
Window Mode in Practice
An ultrasonic sensor is m ounted laterally on a conveyor belt and counts the conveyed goods.
When window mode is set, its output only switches if objects are detected on the conveyor belt.
Individuals who pass the sensor behind the conveyor belt do not cause the output to switch.
This setting can indicate whether a tank fill level is within a desired range and is neither too full
or too empty.
Figure 8.2 Example of behavi or of a "normally-open" pu sh-pull / PNP switchin g ou tput in window
mode
2020-11
45
Page 47

UC***-18GS series
Description of Sensor Parameters
Hysteresis Mode
In "Hysteresis mode" output mode, the status of the switching output changes if an object is
approaching switch point 1. The status will change back to the previous value when the object
passes switch point 2.
Hysteresis Mode in Practice
A so-called two-point control can typically be implemented in practice. For example, to directly
control a pump which should always be filling a tank up to a specific level (>> switch point 1).
Only when a minimum fill level (>> switch point 2) is not reached is filling restarted.
This function also allows the sensor to directly reverse the situation. This means that in this
case, the pump empties the liquid in a tank to a specified minimum level when it has reached
maximum fill level. The emptying process should only be restarted if the maximum level is
reached again.
Figure 8.3 Example of behav ior of a "normally-open" p ush-pull / PNP switchi ng ou tput in hysteresis
mode
Retroreflective Mode
In retroreflective m ode, the ultrasonic sensor works in a similar way to an optical retroreflective
sensor. An ultrasonic sensor is programm ed to recognize a reference object, e.g., the floor, a
conveyor belt or a side panel on a conveyor belt.
The switching output status changes if an object is detected in a shorter distance to the sensor
than the reference range set around the reflector.
When detecting an object at a greater distance than the reference range set around the reflector, the switching output changes status, like when an echo does not come back to the sensor.
This can happen in practice if an object placed in front of the reflector reflects the sound away
or absorbs the ultrasound due to its material composition.
Only switch point 1 is relevant in this output mode; any configured switch point 2 has no effect.
Retroreflective Mode in Practice
An example of how this output mode is applied in practice is to detect vehicles in parking
spaces. This involves ultrasonic sensors being mounted on the ceiling above the parking
space, using the parking lot floor as a reference reflector. This m eans vehicles in a parking
space can be reliably detected, even if its windshield is located below the sensor via which
sound is reflected away.
Retroreflective mode can also be used to detect objects on a conveyor belt. This involves the
sensor being mounted either alongside or above the conveyor belt, using the opposite side
panel or the conveyor belt itself as a reference reflector. The sensor reliably detects any objects
which pass it on the conveyor belt. This also happens even if the objects reflect sound away
due to an inclined surface or absorb the sound as a result of material composition (e.g., foam
components).
46
2020-11
Page 48

UC***-18GS series
Description of Sensor Parameters
Figure 8.4 Example of behavi or of a "normally-open" pu sh-pull / PNP switchin g ou tput in
retroreflective mode
Deactivated
The switching output will stop changing if it is deactivated. It will remain in the most recent state
before deactivation.
The switch state can be changed manually using the "Output logic" parameter. This function is
useful when you want to manually trigger a switching signal with a longer pause, to test that the
sensor or the machine is working correctly.
Warning!
Risk of sensor damage in the event of improper use!
This function is not intended for recurring deactivation of the sensor in continuous operation;
doing so m ay damage the electronics.
This function is intended for testing purposes only.
8.2.2 Output Logic
Parameter name Access Value range
Output logic Read/write • Normally-open
Table 8.3
You can use this parameter to set the logic of the switching output.
• Normally-closed
8.2.3 Switch Point 1
Parameter name Access Value range
Switch point 1 Read/write <Beginning of adjustment
Table 8.4
You can use this parameter to adjust the switch point 1 in "mm", measured from the ultrasonic
transducer surface of the sensor.
If switch point 1 is set to a farther distance than switch point 2, the two switch points are virtually
inverted within the sensor. This is done to ensure that the set output mode is working as
intended.
Note
The DTM also accepts values between <Beginning of sensing range> and <Beginning of
adjustment range> as well as values above <End of adjustment ra nge> up to a certain limit.
Values in these ranges are outside of the adjustment range specified by Pepperl+Fuchs; use
them at your own risk.
2020-11
range> ... <End of adjustment
range< [mm]
(See technical data in the sensor datasheet)
47
Page 49

UC***-18GS series
Description of Sensor Parameters
8.2.4 Switch Point 2
Note
Switch point 2 is not relevant for "Switch point mode" and "Retroreflective mode" output modes
and is therefore hidden in the DTM.
Parameter name Access Value range
Switch point 2 Read/write <Beginning of adjustment
Table 8.5
You can use this parameter to adjust the switch point 2 in "mm", measured from the ultrasonic
transducer surface of the sensor.
If switch point 1 is set to a farther distance than switch point 2, the two switch points are virtually
inverted within the sensor. This is done to ensure that the set output mode is working as
intended.
range> ... <End of adjustment
range< [mm]
(See technical data in the sensor datasheet)
Note
The DTM also accepts values between <Beginning of sensing range> and <Beginning of
adjustment range> as well as values above <End of adjustment range> up to a certain limit.
Values in these ranges are outside of the adjustment range specified by Pepperl+Fuchs; use
them at your own risk.
8.2.5 Retroreflective Mode Offset
Note
The "Retroreflective mode offset" parameter is only relevant and visible in the DTM if the output
mode is set to "Retroreflective mode."
Parameter name Access Value range
Retroreflective offset Read/write 1 ... (0.5 x <end of adjustment
Table 8.6
You can use the "Retroreflective mode offset” param eter to change the size of the switching
window in order to adjust the reflector distance defined by switch point 1. The specified offset
works equally in both directions around the reflector distance, i.e., both in the direction of the
sensor as well as away from the sensor. The offset is necessary to avoid output fluctuations
due to changing environmental conditions.
range>) [mm]
(See technical data in the sensor datasheet)
48
Figure 8.5 For example, re troreflective mode for push-pull/PNP switching output set to normally-
closed
2020-11
Page 50

UC***-18GS series
Description of Sensor Parameters
Note
An offset value of at least 10 % of the reflector distance is typically recommended to prevent
impact of temperature fluctuations, in outdoor applications too.
8.2.6 Switching Hysteresis
Note
The "Switching hysteresis" parameter is not relevant if output mode is set to "Hysteresis mode"
and is hidden in the DTM.
Parameter name Access Value range
Switching hysteresis Read/write • Low
Table 8.7
You can use this parameter to set the hysteresis for switch points 1 and 2. You can choose
between three settings (low, medium, high). "Low" corresponds to a hysteresis of 1 % of the
measured distance value, "medium" to 2 % and "high" to 5 %. In any case, the hysteresis is
always at least 1 mm in size.
• Medium
• High
8.2.7 Switch-On Delay
Note
This param eter influences the response time of the sensor.
Parameter name Access Value range
Switch-on delay Read/write 0 ... 60000 [ms]
Table 8.8
You can use the "Switch-on delay" parameter to delay the switching output being switched on
in order to stabilize the output signal and suppress short switching pulses resulting from potential interference.
The "output logic" parameter determines which signal change is considered as a "switch-on
process."
If the output logic is set to "normally-open," the switch-on delay effects the change of output
state from "Open" to "Closed."
If the output logic is set to "normally-closed," the switch-on delay effects the change of output
state from "Closed" to "Open."
2020-11
49
Page 51

UC***-18GS series
Description of Sensor Parameters
8.2.8 Switch-Off Delay
Note
This param eter influences the response time of the sensor.
Parameter name Access Value range
Switch-off delay Read/write 0 ... 60000 [ms]
Table 8.9
You can use the "Switch-off delay" parameter to delay the switching output being switched off.
This delay can be helpful if very fast events need to be reliably reported by programmable logic
controllers with slower cycle time. A switch-off delay can also be useful when needing to
ensure a certain over-travel time for components in applications.
The "output logic" parameter determines which signal change is considered as a "switch-off
process."
If the output logic is set to "normally-open," the switch-off delay effects the change of output
state from "Closed" to "Open."
If the output logic is set to "normally-closed," the switch-off delay effects the change of output
state from "Open" to "Closed."
8.3 Output Configuration – Analog Output
8.3.1 Output Mode
Parameter name Access Value range
Analog output – Output mode Read/write • Rising ramp
Table 8.10
Depending on the intended purpose of the sensor and its associated task, you can use this
param eter to adapt the mode to the analog output. With "Rising ramp," the analog output value
increases with an increasing object distance; with "Falling ramp," the analog output value
reduces with an increasing object distance.
In practice, the "Falling ramp" output mode is usually used to display fill levels in a tank because
a large analog value also corresponds to a large quantity of liquid in the tank.
For other applications in which the distance to the sensor is relevant, the "Rising ramp" output
mode is usually used because a larger analog value also corresponds to a greater distance
from the sensor.
8.3.2 Output Type
Parameter name Access Value range
Analog output – Output type Read/write • Current
Table 8.11
• Falling ramp
• Voltage
50
You can physically operate the analog output of the sensor either as current or voltage output
and select this via this parameter.
2020-11
Page 52

UC***-18GS series
Description of Sensor Parameters
8.3.3 Near Limit
Parameter name Access Value range
Analog output – Near limit Read/write <Beginning of adjustment
Table 8.12
You can use this parameter to adjust the near limit of the analog range in mm, measured from
the ultrasonic transducer surface of the sensor.
Note
The DTM also accepts values between <Beginning of sensing range> and <Beginning of
adjustment range> as well as values above <End of adjustment ra nge> up to a certain limit.
Values in these ranges are outside of the adjustment range specified by Pepperl+Fuchs; use
them at your own risk.
range> ... <End of adjustment
range< [mm]
(See technical data in the sensor datasheet)
8.3.4 Far Limit
Parameter name Access Value range
Analog output – Far limit Read/write <Beginning of adjustment
Table 8.13
You can use this parameter to adjust the far limit of the analog range in mm, measured from the
ultrasonic transducer surface of the sensor.
Note
The DTM also accepts values between <Beginning of sensing range> and <Beginning of
adjustment range> as well as values above <End of adjustment ra nge> up to a certain limit.
Values in these ranges are outside of the adjustment range specified by Pepperl+Fuchs; use
them at your own risk.
8.3.5 Lower Output Value
Note
The DTM will display just the appropriate lower output value depending on the set output type
for the analog output (current or voltage).
range> ... <End of adjustment
range< [mm]
(See technical data in the sensor datasheet)
Parameter name Access Value range
Lower output value – Current Read/write 0 ... 20 [mA]
Lower output value – Voltage 0 ... 10 [V]
Table 8.14
You can use this parameter to set the lower physical output value of the analog output, e.g., 4
mA with a 4..20 mA current output.
2020-11
51
Page 53

UC***-18GS series
Description of Sensor Parameters
8.3.6 Upper Output Value
Note
The DTM will display just the appropriate upper output value depending on the set output type
for the analog output (current or voltage).
Parameter name Access Value range
Upper output value – Current Read/write 0 ... 20 [m A]
Upper output value – Voltage 0 ... 10 [V]
Table 8.15
You can use this parameter to set the upper physical output value of the analog output, e.g., 20
mA with a 4..20 mA current output.
8.4 Sensor Configuration – Evaluation
8.4.1 Sound Beam Width
Note
The selected sound beam width is a sensor adjustment and acts on all outputs alike. It is not
possible to assign an individual sound beam width to the individual outputs.
Overview of Sound Beam Width
Parameter name Access Value range
Beam width Read/write • Wide
• Medium
• Small
Table 8.16
You can use the "Beam width" parameter to select one of the 3 predefined sound beam widths.
It is sometimes necessary to adapt the sound beam width, for example if in the application
objects can be detected in the boundary area of the sound beam, which can lead to incorrect
data.
Note
The 3 available sound beam widths are the sa me 3 which can also be selected via the
programming button on the sensor.
The following detailed settings for the selected sound beam widths are only an option in the
DTM advanced view.
52
Small beam width
Parameter name Access Value range
Small beam width Read/write 10 ... 100 [% in increments of
10 %]
Table 8.17
This enables you to further adjust the width of this sound beam in a range of 10 ... 100 %
according to the previous selection of the small beam width (via parameter or programming
button).
2020-11
Page 54

UC***-18GS series
Description of Sensor Parameters
Medium beam width
Parameter name Access Value range
Medium beam width Read/write 10 ... 100 [% in increments of
Table 8.18
This enables you to further adjust the width of this sound beam in a range of 10 ... 100 %
according to the previous selection of the medium beam width (via parameter or programming
button).
Wide beam width
Parameter name Access Value range
Wide beam width Read/write 10 ... 100 [% in increments of
Table 8.19
This enables you to further adjust the width of this sound beam in a range of 10 ... 100 %
according to the previous selection of the wide beam width (via parameter or programming button).
10 %]
10%]
8.4.2 Echo Evaluation
Note
This param eter is only visible in the DTM advanced view.
Parameter name Access Value range
Echo evaluation Read/write • First echo
Table 8.20
This param eter allows you to specify whether the sensor uses the first or strongest echo for
evaluation purposes.
The preferred setting in most applications is to evaluate the "first echo." This is because the first
echo corresponds to the closest object to the sensor which is relevant to the response of the
sensor.
More rarely, it can be advantageous to set echo evaluation to "strongest echo" if smaller interfering objects (e.g., welding seams) near to the sensor prevent the correct tank fill level from
being captured. By setting echo evaluation to "strongest echo," the echo with the highest amplitude is used for evaluation purposes.
• Strongest echo
2020-11
53
Page 55

UC***-18GS series
Description of Sensor Parameters
8.4.3 Evaluation Method
Note
This param eter is visible in the DTM advanced view.
Parameter name Access Value range
Evaluation m ethod Read/write • Average value
Table 8.21
The "Evaluation method" parameter allows you to specify the extent to which values of previous
measurem ents are included in the evaluation of the current measurement. The objective is to
ensure a robust measurement even when confronted with short-term disturbances such as
rain, compressed air, agitators, or wave formation on liquid surfaces.
Evaluation Methods in Practice
In most applications the "Average value" setting is proven to be effective. This involves calculating a floating arithmetic average value over the latest data in accordance with the setting of
the "Averages & skip count" parameter.
When detecting a tank fill level where the liquid surface is heavily agitated, the "Low pass"
setting can be of benefit. With this evaluation method, previous data is included w hen determining the current distance value according to the "Weighting of former measurement",
"Allowed deviation to former measurement" and "Skip time" param eters. The evaluation produces a typical low pass behavior, i.e., the distance value output by the sensor follows the
actual measured value and the sensor response time is delayed accordingly. In addition, large
changes to the measured value are only taken into account if they occur repeatedly and/or after
a certain period of time.
With the "None" setting each individual measured value is output directly at the output. This
setting is not recommended for most applications as faulty measurements resulting from external influences immediately have an effect on the output. When using the evaluation method, filtering and/or validation of the data by downstream logic controllers (like a programmable logic
controller (PLC)) is recommended.
• Low pass
• None
54
2020-11
Page 56

UC***-18GS series
Description of Sensor Parameters
8.4.4 Averages & Skip Count
Note
This param eter is only relevant and visible in the DTM if the "Evaluation method" is set to
"Average value."
Parameter name Access Value range
Averages & skip count Read/write • M=2, N=0
Table 8.22
• M=3, N=0
• M=3, N=1
• M=4, N=0
• M=4, N=1
• M=5, N=0
• M=5, N=1
• M=5, N=2
• M=6, N=0
• M=6, N=1
• M=6, N=2
• M=7, N=0
• M=7, N=1
• M=7, N=2
• M=7, N=3
• M=8, N=0
• M=8, N=1
• M=8, N=2
• M=8, N=3
You can use this parameter to control the depths of the average determination. M defines the
total number of measurements which are used to generate average determination. N defines
the number of measurements from the number of M which are not taken into account for average determination. These are the value/values with the greatest deviation from the measurement result most recently determined. The current measurement result is calculated
arithmetically from the remaining data.
8.4.5 Weighting of Former Measurement
Note
This param eter is only relevant and visible in the DTM if the "Evaluation method" parameter is
set to "Low pass."
Parameter name Access Value range
Weighting of former measurement
Table 8.23
This parameter determines how much weighting in percentage terms the result of the previous
measurement result is given in the current evaluation.
The following formula applies:
ResN = (Res
Res = result
W = "weighting of previous measurement" factor
2020-11
Meas = current measured value
x W + Meas x (100 - W)) / 100
N-1
Read/write 1 ... 99 [%]
55
Page 57

UC***-18GS series
Description of Sensor Parameters
This means that the less the "Weighting of former measurement" value, the closer the sensor's
output follows the real distance.
8.4.6 Allowed Deviation to the Former Measurement
Note
This param eter is only relevant and visible in the DTM if the "Evaluation method" parameter is
set to "Low pass."
Parameter name Access Value range
Allowed deviation to the former measurement
Table 8.24
Together with the "Skip time" parameter, you can use this parameter to define an acceptance
filter to filter short disturbances, so that the measured result is not changed.
The "Allowed deviation to the former measurement" parameter defines the value by which the
new measured value may deviate at most from the previous measurement result. Only measured values with allowed deviation will be included in the calculation of the new measurement
results. If the deviation is exceeded, the measured values are ignored until the set skip time is
reached (see "Skip time" parameter).
Read/write 10 ... 50 [%]
8.4.7 Skip Time
Note
This param eter is only relevant and visible in the DTM if the "Evaluation method" parameter is
set to "Low pass."
Parameter name Access Value range
Skip time Read/write 0 ... 60000 [ms]
Table 8.25
Together with the "Allowed deviation to former measurement," this param eter lets you define an
acceptance filter to filter short disturbances, so that the measured result is not changed.
The "Allowed deviation to former measurement" parameter defines the value by which the new
measured value may deviate at most from the previous measurement result. Only measured
values with allowed deviation will be included in the calculation of the new measurement
results. If the deviation is exceeded, the measured values are ignored until the set skip time is
reached.
56
2020-11
Page 58

UC***-18GS series
Description of Sensor Parameters
8.4.8 Temperature Compensation
Note
This param eter is visible in the DTM advanced view.
Parameter name Access Value range
Temperature compensation Read/write • Inactive
Table 8.26
The speed of sound and subsequently an ultrasonic sensor's accuracy is affected by changes
in ambient temperature. By using the "Temperature com pensation" parameter, you can switch
the sensor's integral automatic temperature compensation off and on.
When this parameter is enabled, the distance value is calculated taking into account the ambient temperature continuously measured by the sensor. This method automatically corrects
measuring errors resulting from a changing ambient temperature and thus greatly improves the
measurement accuracy of the sensor.
If disabled, the distance value is calculated on the basis of the temperature value provided by
the "operating temperature" parameter.
• Active (factory setting)
• Active with power-on-drift
compensation
Note
The power-on-drift compensation can further improve the accuracy of data in those initial
minutes after switching on the sensor. A correction factor is calculated based on the selfheating of the sensor measured after switch-on. This factor results in stable measurement
results as early as two minutes post-commissioning. For temperature compensation without
power-on-drift compensation, this stability is typically only the case after ten minutes.
Temperature Compensation in Practice
With active temperature compensation, ambient temperatu re is measured within the sensor
housing. The accuracy of this temperature m easurement can be falsely influenced by external
influences which heat or cool the sensor housing. Such influences can be, for example:
• Solar radiation
• High load on the sensor output resulting in a great deal of heat within the sensor housing
• Cleaning the sensor with cold water
In applications with significant fluctuations in ambient temperature, e.g., as a result of heat produced by machines and/or processing, or outside, we generally recommend enabling temperature compensation
In applications with an almost constant temperature, e.g., in large tanks, it may be useful to disable automatic temperature compensation. This is useful because then other influences (see
note) will not impact measurement accuracy.
Note
Internal temperature compensation can be disabled if the ambient temperature of the ultrasonic
sensor is measured on the process side. The measured value of the ultrasonic sensor can then
be corrected in the downstream logic unit taking into account the measured ambient
temperature.
2020-11
57
Page 59

UC***-18GS series
Description of Sensor Parameters
8.4.9 Operating Temperature
Note
This param eter is visible in the DTM advanced view.
Parameter name Access Value range
Operating temperature Read/write -40 ... 100 [°C]
Table 8.27
With disabled temperature compensation (see "Temperature compensation" parameter), the
operating temperature specified here is used to calcu late the object distance from the measured sound propagation time. You can specify a value within the allowable value range.
8.4.10 Foreground Suppression
Note
This param eter is visible in the DTM advanced view.
Parameter name Access Value range
Foreground suppression Read/write <End of dead band> ... <End
Table 8.28
You can use the "Foreground su ppression" parameter to define an area in front of the sensor
where all received echoes are ignored. The range extends from the transducer surface of the
sensor up to the distance value specified by this parameter.
By default, the value is set to <End of dead band>.
8.4.11 Background Suppression
Note
This param eter is only visible in the DTM advanced view.
Parameter name Access Value range
Background suppression Read/write <Beginning of sensing range>
Table 8.29
You can use the "Background suppression" parameter to specify a range in which incoming
echoes are discounted. When doing so, the input value represents the start of this range and
therefore represents the distance from which all incoming echoes are discounted.
of adjustment range> [mm]
... <End of sensing range>
[mm]
58
2020-11
Page 60

UC***-18GS series
Description of Sensor Parameters
8.4.12 Sensor Cycle Time
Note
This param eter is only visible in the DTM advanced view.
Parameter name Access Value range
Sensor cycle time Read/write <min. cycle time> ... 60000
Table 8.30
You can use the "Sensor cycle time" parameter to specify the length of a measuring cycle. The
minimum allowable cycle time depends on the range of the respective sensor and is set at the
factory. If a value exceeding the minimum cycle time is entered, the sensor pauses after its
measurement for the rest of that time period before the next measurement starts.
Note
The minimum cycle time is dependent on the detection range of the respective sensor. If values
that are too small are entered in the DTM, a corresponding messa ge will appear stating the
minimum allowable value for the selected sensor.
[ms]
8.4.13 Ultrasonic Pulse Length
Note
This param eter is only visible in the DTM advanced view.
We recommend only changing this parameter after consulting our application specialists.
Parameter name Access Value range
Ultrasonic pulse length Read/write • Automatic
Table 8.31
You can use the "Ultrasonic pulse length" parameter to select the length of the transmission
pulse. The factory default ultrasonic pulse length is set to automatic, which is also the correct
setting for the large majority of the applications. In this case, the sensor itself automatically
chooses the correct pulse length between the short and long pulse depending on the detected
object distance.
Setting in exceptional cases
We recommend adjusting the short pulse only in exceptional cases, such as applications in
which only laterally-moving objects need to be detected very quickly very close to the sensor.
This achieves only a fraction of the nominal range because the short pulse does not provide for
a large detection range.
It is helpful to adjust to the long pulse in applications in which only laterally-moving objects
need to be detected very quickly at a medium to large distance to the sensor. The long pulse
setting increases the dead band in comparison to the specified datasheet value.
Then the sensors will only use the selected pulse length for your measurements.
• Short pulse
• Long pulse
2020-11
59
Page 61

UC***-18GS series
Description of Sensor Parameters
8.5 Sensor Configuration – Synchronization
Note
In addition to setting the "Synchronization mode" parameter, further measures are necessary
for synchronization to be successful. This could include connecting the devices to each other
accordingly. The commissioning instructions for the respective sensor provide details on this.
Synchronization Mode
Parameter name Access Value range
Synchronization mode Read/write • Automatic multiplex mode
Table 8.32
In applications where multiple ultrasonic sensors are operated in close proximity to each other,
we must prevent these sensors from mutually influencing each other. Otherwise it can result in
individual devices providing incorrect measurements. The easiest way to solve this problem is
by synchronizing the devices.
You can set the type of synchronization by using the "Synchronization mode" parameter. The
following are the various synchronization modes in detail.
• Automatic common mode
• Externally controlled
Automatic Multiplex Mode
This type of synchronization is essential for all applications in which each sensor has to individually determine its distance from the object.
The synchronized sensors self-synchronize in succession, i.e., there is always just one sensor
transmitting at any one time. The measuring cycles of the individual sensors run in succession
in a chronological sequence.
Advantage: mutual interference is completely avoided.
Disadvantage: delayed response time of the sensors by factor n. (n = number of the synchro-
nized sensors)
Automatic Common Mode
We recommend synchronizing in automatic common mode for all applications where there is
range monitoring, which is carried out using several sensors mounted in parallel. For example,
this could be a automatically-guided transport system which is implemented with several sensors mounted in parallel. With these applications, it just has to be ensured that the automatically-guided transport system does not collide with any obstacle. For the individual sensor, it is
irrelevant which sensor the sound of the received echo has been sent from.
The synchronized sensors work in a self-synchronized way at the same time, i.e., all sensors
always send their ultrasound pulse at the same time.
Advantage: response time of the individual sensors is as short as in stand-alone m ode.
Disadvantage: mutual interference cannot be completely ruled out.
External Synchronization
60
External synchronization is only necessary if the number of sensors to be sy nchronized
exceeds the maximum specified in the datasheet. Or if the sensors need to be triggered in a
unique, application-specific sequence.
The synchronized sensors are triggered in parallel by an external square-wave signal (e.g., a
PLC output) and all sensors always send their ultrasound pulse at the same time.
2020-11
Page 62

UC***-18GS series
Description of Sensor Parameters
8.6 Sensor Configuration – Echo Loss and Error Handling
8.6.1 No Echo
Parameter name Access Value range
No echo Read/write • No error
• Error
Table 8.33
You can use this parameter to confirm whether "Sensor receives no echo" should be classified
as an error or not.
With the default "No error" setting, the sensor not receiving an echo will not be interpreted as
an error. In this instance, the sensor is behaving in terms of its outputs as if an object is at a
maximum distance.
In some applications, normal operation may mean that a sensor should never lose its echo.
However by setting the parameter as "Error," sensor output can be rendered safe should an
error occur. Output behavior in the event of an error is determined via the "Output behavior if an
error occurs" parameter.
8.6.2 Output behavior if an error occurs
Parameter name Access Value range
Output behavior if an error
occurs – Switching output
Output behavior if an error
occurs – Analog output
Table 8.34
You can use this parameter to adjust the behavior of the output in the event of an error.
Possible error cases are:
• Extremely loud ambient noise in the ultrasonic frequency range of the sensor
• Hardware error in the sensor electronics
• Sensor receives no echo (only an error case if "No echo" parameter is set as "Error")
The meaning of the individual parameter values is explained in the following table.
Parameter value Meaning
Freeze The output retains its last status or value until a new valid measured
value can be determined by the sensor.
Max. distance In the event of an error, the output behaves as it would when an object
is at a maximum distance from the sensor.
Closed This setting is only available for switching outputs. It sets the output
status to "Closed" in the event of an error.
Read/write • Freeze
Read/write • Freeze
• Max. distance
• Closed
• Open
• Max. distance
• Replacement value
2020-11
61
Page 63

UC***-18GS series
Description of Sensor Parameters
Parameter value Meaning
Open This setting is only available for switching outputs. It sets the output
status to "Open" in the event of an error.
Replacement value This setting is only available for analog outputs. It specifies that in the
event of an error, a certain output value should be output at the analog
output. In the event of an error, this output value is determined via the
"Error replacement value – current" or "Error replacement value – voltage" parameter.
8.6.3 Error Replacement Value – Current/Voltage
Note
To be able to adjust the replacement value, the "Replacement value" setting must be set to
"Output behavior if an error occurs" for the analog output in the DTM. Only the error
replacement value parameter appropriate to the analog output and the selected output type is
displayed ("Error replacement value – current" or "Error replacement value – voltage").
Parameter name Access Value range
Error replacement value – current
Error replacement value –
voltage
Table 8.35
Read/write 0 ... 200 [x 0.1 m A]
Read/write 0 ... 200 [x 0.1 V]
You can use this parameter to adjust which value the analog output should adopt in the event of
an error. Adjustment is possible in increments of 0.1 mA or 0.1 V.
The final value actually output at the analog output in the event of an error (current/voltage
value) depends on the setting of the "Output type" parameter for the analog output.
8.7 Sensor configuration – Local controls
8.7.1 Local controls
Parameter name Access Value range
Programming button Read/write • Locked
Table 8.36
You can use this parameter to set whether and in what period of time during operation of the
sensor local controls can be used to carry out changes.
By default, local controls are locked 5 minutes after switching on the power supply or after the
last access to the local controls (>> time locked (5 min)).
If the parameter is set to "Locked," the local controls are locked permanently.
By selecting "Unlocked," the local controls can be accessed at any time. You can always
change the sensor settings via the local controls.
• Time locked (5 min)
• Unlocked
62
2020-11
Page 64

UC***-18GS series
Description of Sensor Parameters
8.7.2 Local Controls Status
Parameter name Access Value range
Local controls status Read only • Button not pressed
Table 8.37
You can use this parameter to check that the programming button on the sensor is working
properly.
If the programming button on the sensor is working properly, the parameter value changes
when the programming button is pressed or released. If the parameter value does not change,
there may be a fault with the programming button.
8.8 Service
8.8.1 Locator Indication
Parameter name Access Value range
Locator indication Read/write • Disabled
Table 8.38
• Button pressed
• Enabled
You can use this parameter to switch the locator indication on and off. When locator indication
is activated, the yellow and green LEDs on the sensor flash at the sam e time with a specific
flashing sequence. This function can be used to localize the sensor in a plant or machine m ore
easily.
8.8.2 "Reset to Factory Defaults" Button
By pressing this button, you can restore the sensor to its factory settings. When doing so, a
security prompt will initially appear.
2020-11
63
Page 65

UC***-18GS series
Synchronizing Multiple Sensors
9 Synchronizing Multiple Sensors
The sensor is fitted with a synchronization connector that suppresses mutual interference from
external ultrasonic signals. The following 3 types of synchronization can be set:
• Automatic multiplex mode
• Automatic common mode
• External synchronization
Note
If the synchronization option is not used, the synchronization connection must be connected to
ground (0 V).
In the event that a sensor operated in a synchronized group is programmed using the
programming button, the start of the programming process may be delayed. The remaining
sensors in the synchronized group go into standby mode for the duration of the programming
process and do not carry out any measurements.
Programming of a single sensor m ust not be carried out using the programming button in an
externally synchronized sensor group. The remaining sensors in the group carry out further
measurements using the external trigger. This influences the measurement of the sensor to be
programmed
Automatic Multiplex Mode
Several sensors (see datasheet for the maximum number) can be synchronized by simply connecting the synchronization connectors on the sensors. In this case, the sensors self-synchronize in succession in multiplex mode.
Only one sensor sends signals at any one time. The measuring cycles of the individual sensors
run in succession in a chronological sequence. This also increases the response time of the
sensors in proportion to the number of sensors in the synchronization group.
Automatic Common Mode
Multiple sensors (see datasheet for the maximum number) can be synchronized by simply connecting the synchronization connectors on the sensors and setting the synchronization mode
to "Automatic common m ode" via the IO-Link interface. In this case, the sensors self-synchronize at the same time, i.e., all sensors always send their ultrasound pulse at the same time.
External Synchronization
Multiple sensors can be jointly controlled by an external square-wave signal, e.g., a PLC output. The maximum number depends on the driver capabilities of the external device to be used
for synchronization. In this case, the sensors are triggered in parallel and operate synchronously, i.e., at the same time. All sensors must be configured via the IO-Link interface in the
"External synchronization" synchronization mode.
The necessary minimum pulse duration must be observed (see datasheet). If a high level is
present on the synchronization connection for longer than 1 second, the sensor goes into
standby mode (green LED is flashing).
As long as a low level is present on the synchronization input, the sensor carries out measurements in accordance with the sensor cycle time. If a high level is present on the synchronization
input for longer than 1 second, the sensor goes on standby (green LED is flashing). As long as
the sensor is in standby mode, the last received output conditions are retained.
The synchronization connection of the sensors supplies an output current in the case of a low
signal, and generates an input impedance in the case of a high signal. Please note that the
device used for external synchronization must have the following driver capability:
• Driver current acc +UB > n x (high level/input impedance)
• Driver current acc 0V > n x output current
2020-11
(n = number of sensors to be synchronized)
63
Page 66

UC***-18GS series
T T
Power ON
. . .
. . .
5s
T
Normal operation
Normal operation
Exit
without
saving
Reset
hold button T
in total >10s
LED
red
yellow
LED
green
yellow
LED green
press and hold button T
Maintenance and Repair
10 Maintenance and Repair
10.1 Maintenance Work
The sensor itself is maintenance-free. For this reason, it is not necessary to carry out regular
adjustments or maintenance work on the sensor itself.
However, check that the sensor and connector are tight within the scope of routine maintenance intervals. You may also want to check that the connection cable is installed and intact.
10.2 Cleaning
Cleaning is only necessary in applications in which the transducer surface is exposed to dirt or
build-up.
In general, the following applies as far as cleaning is concerned:
• Only with water without chemicals
• Without pressure/high pressure
• Only by using a soft cloth
• No abrasive cleaning, scratching, or scrubbing
10.3 Resetting to the Factory Default
You can reset the sensor to the factory default setting in the following ways:
• Using the programming button
• Via the DTM in the Service menu
• Via IO-Link
Resetting with the programming button
1.
Disconnect the sensor from the power supply.
2.
Press and hold the T programming button.
3.
Switch on the supply voltage. The yellow and red LEDs flash simultaneously for 5 seconds.
Then the yellow and green LEDs flash simultaneously for a further 5 seconds.
4.
Release the T programming button while the yellow and green LEDs flash simultaneously.
The sensor will now function with the original factory settings. If the T programming button
continues to be pressed down beyond this flash sequence, the sensor changes back to normal operation (green LED lights up). In this case, all settings remain unchanged in the sensor.
The following graphic illustrates the sequence for the reset to factory settings:
Figure 10.1
64
2020-11
Page 67

UC***-18GS series
Troubleshooting
11 Troubleshooting
11.1 What to Do in Case of an Error
In case of an error, check whether a fault with the sensor can be remedied according to the following checklist.
If none of the information specified in the checklist solves the problem, in the event of queries
contact Pepperl+Fuchs via your sales office. Have details of the model number and firmware
version of the sensor ready if possible.
Checklist
Error Cause Remedy
Green LED not lit up The power supply is switched
off.
Green LED not lit up The plug is not connected to
the connector on the sensor.
Green LED not lit up Wiring error in the splitter or
Green LED not lit up Supply cable to the sensor is
No IO-Link connection to
the device
No IO-Link connection to
the device
The target object is not
detected, even though
the sensor is OK
switch cabinet.
damaged.
The communication port on
the sensor is not connected to
the IO-Link master.
No power supply Check whether there is a reason
Perhaps there is an obstruction in the vicinity of the sensor
Check whether there is a reason
why the power supply is switched
off (installation or maintenance
work, etc.). Switch on the power
supply if appropriate.
Connect the plug to the sensor and
tighten the cap nut by hand.
Check the wiring carefully and
repair any faults with the wiring.
Replace the damaged cable.
Make sure that the communication
port on the sensor is connected to
the IO-Link master.
for the absence of the power supply (installation or maintenance
work, etc.). Switch on the power
supply.
Check that the sensor is correctly
aligned. Check sensor configuration and if necessary, change the
sound beam width.
2020-11
65
Page 68

Pepperl+Fuchs Quality
Download our latest policy here:
www.pepperl-fu chs.com /quality
© Pepperl+Fuchs · Subject to modifications
www.pepperl-fuchs.com
Printed in Germany / DOCT-6942
 Loading...