

Page 1

PeakTech
®
4130-1
PeakTech
®
4135-1
PeakTech
®
4140-1
Operation manual
Digital Spectrum Analyzer
Page 2

Content
1. Safety introduction
1
1.1. Safety terms and symbols
2
1.2. Safety Symbols on the product
2
1.3. Maintenance and cleaning
3
2. Einführung Digitale Spektrum Analysatoren
4
Chapter 1 Getting started
5
Chapter 2 Basic operation
11
3. Basic Settings
12
4. SPAN
15
5. Sweep and Function settings
21
6. Sweep
24
7. Trigger
27
8. Trace
28
9. Marker Measurement
30
10. Peak Search
35
11. Marker->
37
12. AUTO Tune
39
13. Display
39
14. Preset
40
15.System Setup
40
16. Source
41
17. Measure
41
Chapter 3 Remote control
43
18. Specifications
44
Chapter 4: Appendix
48
Page 3

Overview
Chapter 1: Getting started
This chapter introduces the front and rear panels, user interface and notes for first operation of the
Spectrum Analyer.
Chapter 2: Front and Rear panel operation
This chapter describes the functions of the keys on the front panel, and introduces menu functions of
each key in detail.
Chapter 3: Remote Control
This chapter introduces remote control methods of the Spectrum Analyzer.
Chapter 4: Appendix
This chapter provides the accessories list and service and support information of the Spectrum
Analyzer.
Page 4

1. Safety introduction
This product complies with the requirements of the following European Community Directives:
2004/108/EC (Electromagnetic Compatibility) and 2006/95/EC (Low Voltage) as amended by
2004/22/EC (CE-Marking).
To ensure safe operation of the equipment and eliminate the danger of serious injury due to shortcircuits (arcing), the following safety precautions must be observed.
Damages resulting from failure to observe these safety precautions are exempt from
any legal claims whatever.
Before operating this instrument, read the following safety precautions to avoid injury and prevent
damage to this product or any products connected to it. For safe operation, be sure to operate this
instrument in accordance with the provisions.
Use proper power cord
Only power cord that is recognized by the country where this instrument is located is allowed.
Reliable grounding
This product is grounded through the grounding wire of the power cord. To avoid electrical
shock, before connecting any input or output terminal of the product, make sure reliable
connection between the grounding terminal of the power cord of this product and protective
earth terminal.
Check all terminal ratings
Check all ratings and markings on the product to avoid the impact of fire and excessive current,
please consult the manual for further ratings information before any connections.
Overvoltage protection
Ensure that no excessive voltage (such as voltage caused by lightning or other large voltage)
reach the product. Otherwise the operator may have a risk of electric shock.
Do not operate without cover
Do not operate the Spectrum Analyzer with covers or panels removed.
Use proper fuse
Only fuse specified by the Spectrum Analyzer is allowed.
Do not expose circuit
Do not touch exposed connectors and components when the unit is powered.
Do not operate with suspected failures
If you suspect a failure of this product, please contact PEAKTECH authorized maintenance
personnel to detect. Any maintenance, adjustment or parts replacement must be performed by
PeakTech® authorized maintenance personnel.
Keep proper ventilation
Try to ensure good ventilation, bad ventilation will cause temperature increase of the instrument,
thereby causing damage to it. Keep good ventilation when operating, check the vents and fan
regularly.
-1-
Page 5

Operation environment
To avoid internal short circuit or electric shock, do not operate the instrument in a damp
environment.
Do not operate in an explosive atmosphere. To avoid equipment damage or personal injury, do
not operate the instrument in an explosive atmosphere.
Clean and dry
Keep product surface’s clean and dry to avoid dust or air moisture affecting the performance of
the instrument.
Electrostatic protection
It may cause damage to the instrument if interface is with static electricity, so operate at antistatic area as much as possible to avoide static electricity when handling and operating.
Ground the inner and outer conductors of interface briefly to discharge static electricity before
connecting cable to the instrument.
Handling
To avoid instrument sliping down during handling which may damage the keys, knob or
interfaces and other parts on the panel, please pay attention to handling safty
1.1. Safety terms and symbols
Terms in this guide. The following terms may appear in the guide:
Caution
Caution statement indicate the conditions and behaviors that may cause product damage or loss of
data.
Warning!
Warning statement indicate the conditions and behaviors that may endanger the lives and safety of
the operating personnel.
1.2. Safety Symbols on the product
The following terminologies may appear on this product:
Danger!
Indicates an immediate injury once you carry out this operation.
Warning!
Indicates a probable damage to this product or other devices that is connected with it once
you carry out this operation.
Caution!
Indicates a protential hazard once you carry out this operation.
The following symbols may appear on the product:
-2-
Page 6

1.3. Maintenance and cleaning
Maintenance:
Do not place the instrument in the sunlight for a long time.
Clean:
Clean the instrument regularly according to using status.
Method is as follows:
1. To avoid electric shock, disconnect power before cleaning work.
2. Wipe the loose dust on the outside of the instrument with soft moist but not dripping cloth (use
mild detergent or water, but not dissolved thinner, otherwise it will damage the designation strip
or plastic parts). Be careful not to scratch the LCD protector when cleaning instruments with
LCD screen.
Caution: Do not let any corrosive liquid stain the instrument to avoid damage.
Warning: Before re-energizing, make sure the instrument is completely dry
to avoid short circuit even personal injury caused by moisture.
-3-
Page 7

2. Brief introduction of Digital Spectrum Analyzer
The PeakTech® 4130-1 / 4135-1 / 4140-1 is a Spectrum Analyzer with compact design, easy
handling, high cost – performance ratio and various functions. It has a keyboard layout which is easy
to operate, high-definition color LCD screen and various remote communication interfaces. It can be
widely used in many fields including education science, enterprise R & D and industrial production
etc.
Main Features:
Frequency range: 9 kHz to 3.0 GHz (P4140-1)
2.2 GHz (P4135-1)
1.5 GHz (P4130-1)
Display Average Noise Level (DANL)-135 dBm (Typical value)
Phase noise: -80 dBc/Hz (offset 10 kHz)
Full-amplitude precision: ±1.0 dB
Resolution Bandwidth (RBW): 10 Hz
Various measurement function and auto-setting function
Multi-window display, accurate measurement
Equipped with preamplifier and AM / FM demodulation function
High stablility oscillator
7 inch high-definition screen (800×480 pixels), the image interface is simple and clear which
makes operation easy
Equipped with various interfaces, such as LAN, USB Host, USB Device, RS232
Compact design, weights only 6.0kg
Format specification:
1. Keys:
This guide usually uses “text box+text (bold)” to indicate a key on front panel, such as FREQ
indicates FREQ key.
2. Menu:
This guide usually uses “character shading+text (bold)” to indicate a menu, such as “center
frequency” indicates the center frequency menu option under FREQ key.
3. Connectors:
This guide usually uses "brackets + text (bold)," to indicate a connector on the front or rear panel.
For example: [GEN OUTPUT 50Ω].
4. Operating steps:
This guide usually uses an arrow “” to indicate the next step. For example: FREQ center
frequency indictes pressing FREQ function key on the front panel then pressing “center
frequency” menu softkey.
-4-
Page 8

Chapter 1 Getting started
This chapter introduces the front and rear panels, user interface and notes for first operation of
the Spectrum Analyer.
The contents of this chapter are as follows:
Initial inspect
Outlook and dimensions
Front panel
Rear panel
Parameter setting
-5-
Page 9

Data
Spectrum Analyzer 9kHz-3.0GHz
RF INPUT 50Ω
MAX +30dBm/50V DCMAX 50V DC
GEN OUTPUT 50Ω
0
.
μ
Hz
V
kHz
1 2 3
mV
-dBm
MHz
4 5 6
98
7
+dBm
GHz
Search
Peak
Auto
Tune
Single
Display
Trigger
BW
Sweep
Marker
Source
CAL
Setup
System
Recall
Preset
Save
Meas
r
ee
D
t Trace
cto
Demod
Count
Freq
Marker
AMPT
SPAN
FREQ
us
ms
sec
dB
Control
Marker
Utility
Setting
Initial inspect
1. Inspect the transport package
Check the transport package and verify its contents is complete, keep the package and fill
material before testing the analyzer.
2. Inspect the unit
Please inspect the unit carefully, if its content is not complete, or the analyzer does not
pass the performance test, please contact your dealer or the manufacturer.
3. Check the accessories
Check the accessories according to the packing list, if damaged or missing, please contact
your PeakTech distributor.
Outlook and dimension:
Unit:mm
-6-
Front view
Page 10

Search
Peak
Auto
Tune
Single
Display
Trigger
BW
Sweep
Marker
Source
CAL
Setup
System
Recall
Preset
Save
Meas
r
ee
D
t
Trace
cto
Demod
Count
Freq
Marker
AMPT
SPAN
FREQ
Control
Marker
Utility
Setting
Prepare for use
Adjust the legs of the instrument
Open the legs of the Analyzer as bracket of the instrument to make it tilted upward before
operation, which makes the following operation and observation more convenient. When the
instrument is not in use, the user can close the support legs to facilitate placement or removal.
Switching the power on
Connect the Spectrum Analyzer to AC power with the power cord from the accessories, please
refer to the introduction about the requirement of voltage and frequency of AC power in the
“Rear panel” section.
Boot examination
Connect power cord properly, then press the power switch on the front panel to turn on the
Spectrum Analyzer. The boot screen displays the boot initialization process information, then
displays sweep curve at the end.
Perform self-calibration
Please perform self-calibration after boot. Press CAL Calibration Immediate calibration to
process self-calibration for the system with the internal calibration source of the system.
Front panel
① LCD display screen ② Adjusting knob ③Function key area ④ Digit keys
⑤ RF input ⑥Direction keys ⑦ Menu software/ menu control key ⑧USB Host ⑨ Power
Function keys on front panel:
-7-
Page 11

Function key
Function description
FREQ
Set informations like center frequency, start frequency and end frequency
etc.
SPAN
Set the frequency range of sweep.
AMPT
Set parameters like reference level, RF attenuator, scale, Y-axis units etc.
Set level offset, the largest mixer and input impedance. Used to perform
automatic calibration, automatic range and turn on the preamplifier.
BW
Set resolution bandwidth (RBW) and vedio bandwidth (VBW) and V/R
ratio.
Sweep
Set parameters like sweep time, mode etc.
Trigger
Set informations about trigger
Single
Set “single” trigger of the instrument
Display
Set informations about screen display
Auto Tune
Auto tune of full frequency range
Marker
Read amplide, frequency or sweep time etc. of each point on trace
through the marker
Marker—>
Set other system paraters of the instrument with current marker value
Freq Count
Set parameters like frequency count, resolution etc.
Peak Search
Unfold setting menu of peak search, and execute peak search function
simultaneously
Demod
Config demodulation function **
Meas
Select and control measurement function **.
CAL
Set information about the auto calibration of the instrument .
Trace
Set parameters of trace.
Detector
Set detection mode of detector.
System Setup
Set parmaters of system.
Triger
Set information about trigger.
Save
File save and read function.
Recall
Recall saved data and information.
Preset
Reset system to factory default state or user-defined state.
Table 1-2 Description of function keys on front panel
Note:
*The function is only applicable for the unit selected with according options.
-8-
Page 12

Rear panel
1. VGA port
This port provides VGA vedio signal output, connect this interface with VGA cable
2. RS-232 port
This port provides serial data output, connect this interface with RS-232 cable
3. TRIGGER IN
When the Spectrum Analyzer is under external trigger mode, this connector receives an external
trigger signal. The external trigger signal is input to the Spectrum Analyzer through BNC cable
4.10MHz IN/OUT
Realize reference clock input/ output through BNC cable
5. AC Power Connector
The AC power specifications that this instrument supports is: 100 V - 240 V, 45 Hz - 440 Hz
6.USB Device
The Spectrum Analyzer could connect with external USB device as “slave device”
7.LAN
This interface is used to connect the spectrum analyzer to the LAN to realize remote control.
-9-
Page 13

Parameter setting
Realize parameter input with numeric keys, adjusting knob or direction keys. This section
introducs thress parameter setting methods with an example (set center frequency to 1500
MHz).
1. Use numeric keys
1) Press FREQ Center frequency;
2) Use numeric keys to input value “750”;
3) Select desired unit “MHz” from the unit menu that pops up.
2. Use adjusting knob
In the parameters editable state, turn the knob to increase (clockwise) or decrease (counter-
clockwise) parameters at specified steps.
1) Press FREQ Center frequency;
2) Turn the knob to get desired parameter value (750 MHz).
3. Use direction keys
In the parameter editable state, the direction keys can be used for the progressive increment or
decrement of the parameter value according to a certain step.
1) Press FREQ Center frequency;
2) Press the up / down direction key to get desired parameter value (750 MHz).
-10-
Page 14

Chapter 2: Basic operation
The contents of this chapter are as follows:
Basic Settings
Sweep and Functions Settings
Measurement Settings
The using and function settings of Marker
Shortcut
System Settings
-11-
Page 15

Parameter
Description
Default
0.75GHz (P4130-1)
1.1GHz (P4135-1)
1.5GHz (P4140-1)
Range
0Hz ~ 1.5GHz (P4130-1)
0Hz ~ 2.2GHz (P4135-1)
0Hz ~ 3.0GHz (P4140-1)
Unit
GHz, MHz, kHz, Hz
Knob Step
Span>0, step=span/200
Span=0, step=RBW/100, Min=1 Hz
Arrow Keys Step
CF step
Basic Settings
3.1. FREQ
Set the frequency parameter of analyzer. The analyzer sweeps within a specified range, and the
sweep will start once you change this parameter.
The frequency range of current channel can be expressed by either of two groups of
paramenters: Start Frequency/Stop Frequency ( f
( f
center/fspan
) . If any one of them is adjusted, other three parameters will be changed
start/fstop
accordingly to ensure their coupling relationship.
f
center
f
span
=(f
= f
start-fstop
stop
- f
)/2
start
3.2. Center Frequency
Enable the center frequency function, to allow a frequency displays in center be selected. When
pressed, the frequency mode is switched to Center Frequency/Span for input. In this mode,
parameters you specified are always shown at the lower right and left side of the display grid.
Key points:
The start and stop frequencies vary with the center frequency when span is constant.
Changing the center frequency horizontally shifts the current sweep channel and the
adjustment is limited by the specified range in datasheet.
In the Zero Span mode, start frequency, stop frequency and center frequency are always
equal.
User can modify this parameter by numeric keys, knob and arrow keys.
Table 2-1 Center Frequency
) , or center Frequency/Span
-12-
Page 16

Parameter
Description
Default
0 GHz
Range
0 Hz ~ 1.5GHz (P4130-1)
0 Hz ~ 2.2GHz (P4135-1)
0 Hz ~ 3.0GHz (P4140-1)
Unit
GHz, MHz, kHz, Hz
Knob Step
Span>0, step=span/200
Span=0, step=RBW/100, Min=1 Hz
Arrow Keys Step
CF step
Parameter
Description
Default
1.5 GHz (P4130-1)
2.2 GHz (P4135-1)
3.0 GHz (P4140-1)
Range*
0Hz ~ 1.5GHz (P4130-1)
0Hz ~ 2.2GHz (P4135-1)
0Hz ~ 3.0GHz (P4140-1)
Unit
GHz, MHz, kHz, Hz
Knob Step
Span>0, step=span/200
Span=0, step=RBW/100, Min=1 Hz
Arrow Keys Step
CF step
3.3. Start Freq
Set the start frequency of current channel, displays at the left scale. When pressed, the
frequency mode is switched to Start Frequency/Stop Frequency for input. In this mode,
parameters you specified are always shown at the lower left and right side of the grid.
Key points:
The span and center frequency are changed automatically according to the start frequency.
The change of the span would have influence on other system parameters. For more
details, please refer to “Span”.
In Zero Span mode, the start frequency, stop frequency and center frequency are always
equal.
You can modify this parameter using the numeric keys, knob, or arrow keys.
Table 2-2 Start Frequency
3.4. Stop Freq
Set the stop frequency of current channel, displays at the right scale. When pressed, the frequency
mode is switched to Start Frequency/Stop Frequency for input. In this mode, parameters you
specified are always shown at the lower left and right side of the grid.
Key points:
The span and center frequency are changed automatically according to the stop frequency. The
change of the span would have influence on other system parameters. For more details, please
refer to “Span”.
You can modify this parameter using the numeric keys, knob, or direction keys.
Table 2-3 Stop Frequency
*Note:The range is from 100 Hz to 3.0GHz in non-zero span.
-13-
Page 17

Parameter
Description
Default
150MHz (P4130-1)
220MHz (P4135-1)
300MHz (P4140-1)
Range
1 Hz ~ 1.5GHz (P4130-1)
1 Hz ~ 2.2GHz (P4135-1)
1 Hz ~ 3.0GHz (P4140-1)
Unit
GHz, MHz, kHz, Hz
Knob Step
Span>0, step=span/200
Span=0, step=VBW/100, Min=1 Hz
Arrow Keys Step
In 1-2-5 sequency
3.5. CF Step
Set the CF step. User can modify the center frequency by fixed step continuously switches the
channel to be measured.
Key points:
Setting for CF step could be “Manual” or “Auto”. In “Auto” mode, CF step is 1/10 of span for non-
zero span, and equals the RBW for zero span. In “Manual” mode, user can input data by
numeric keys.
After setting of appropriate CF step and center frequency, user can switch the measured
channel with specified step by Up/Down keys in order to sweep the adjacent channels manually.
You can modify this parameters by numeric keys, knob, or arrow keys.
Table 2-4 CF Step
3.6. Signal Track
Enable or disable the function of signal track. Tracks signals with unstable frequency and less than
3dB transient variation in amplitude by placing Marker 1(refer to “Marker Measurement”) onto the
measured signal to track the variation continuously.
Progress of signal track as figure 2-1:
Figure 2-1
-14-
Page 18

Parameter
Description
Default
1.5 GHz (P4130-1)
2.2 GHz (P4135-1)
3.0 GHz (P4140-1)
Range*
0Hz ~ 1.5GHz (P4130-1)
0Hz ~ 2.2GHz (P4135-1)
0Hz ~ 3.0GHz (P4140-1)
Unit
GHz, MHz, kHz, Hz
Knob Step
span/200, Min=1 Hz
Arrow Keys Step
In 1-2-5 sequence
Key points:
When Signal Track is on, the ST icon is shown at the left of screen.
If an active marker exsits, when Signal Track is on, the analyzer will search and mark the point
(with no more than 3dB variation in amplitude) near the marker, set the frequency of this point
as center frequency and hold the signal at the center of screen.
If no marker is active, when Signal Track is on, Marker 1 is enalbled and executes a peak
searching, set the current peak frequency as center frequency and hold the signal at the center
of the screen.
In continouse sweep, the system tracks continuously. In single sweep, only track one signal. In
zero span, Signal Track is invalid.
4. SPAN
Set the span of analyzer. The frequency parameter varies with the span. Once change the span,
sweep will be restarted.
4.1. Span
Set the frequency range of current channel. When pressed, the frequency mode is switched to
Center Freq/Span for input, and the Center Freq and Span are shown at the lower left and right of
the display grid.
Key points:
The Start/Stop Frequency varies with the changing of Span automatically.
In manual span mode, the minimum can be set as 100Hz (the only way to zero span is to press
the Zero Span menu option), the maximum is described in “Specification”, analyzer enter into
full span mode when select maximum setting.
In non-zero span mode, CF step and RBW changes with the span when they are Auto mode,
and changing of RBW will influence VBW (in Auto mode).
Any changes among Span, RBW and VBW will influence Sweep Time.
In non-zero span mode, some functions are invalid, like “Video” trigger, “1/△time” readout.
You can modify this parameter by numeric keys, knob and arrow keys.
Table 2-5 Span
* Note: 0 Hz is only available in zero span.
-15-
Page 19

4.2. Full Span
Set the span of analyzer to be maximum.
4.3. Zero Span
Set the span of analyzer to be 0Hz. In this case, stop frequency and start frequency are both equal
to center frequency, the horizontal axis denotes time. The analyzer here is measuring the time
domain characteristics of amplitude where frequency point is.
Key points:
In zero span mode, the analyzer displays the time domain characteristic of fixed frequency
component, which has many difference with non-zero mode, and the following functions are
valid in zero span mode:
FREQ : Signal Track
Marker-> : “Mkr->CF”, “Mkr->Step”, “Mkr ->Start”, “Mkr ->Stop”, “Mkr△->CF” and “Mkr△-
>Span”.
Marker : Readout of “Frequency”, “Period” and “1/△time” (valid in Delta marker type).
4.4. Last Span
Set the span of analyzer to be previous setting.
4.5. AMPT
Enable the reference level and enter into the amplitude menu. Through these parameters, tested
signal can be displayed at an optimal view with least error.
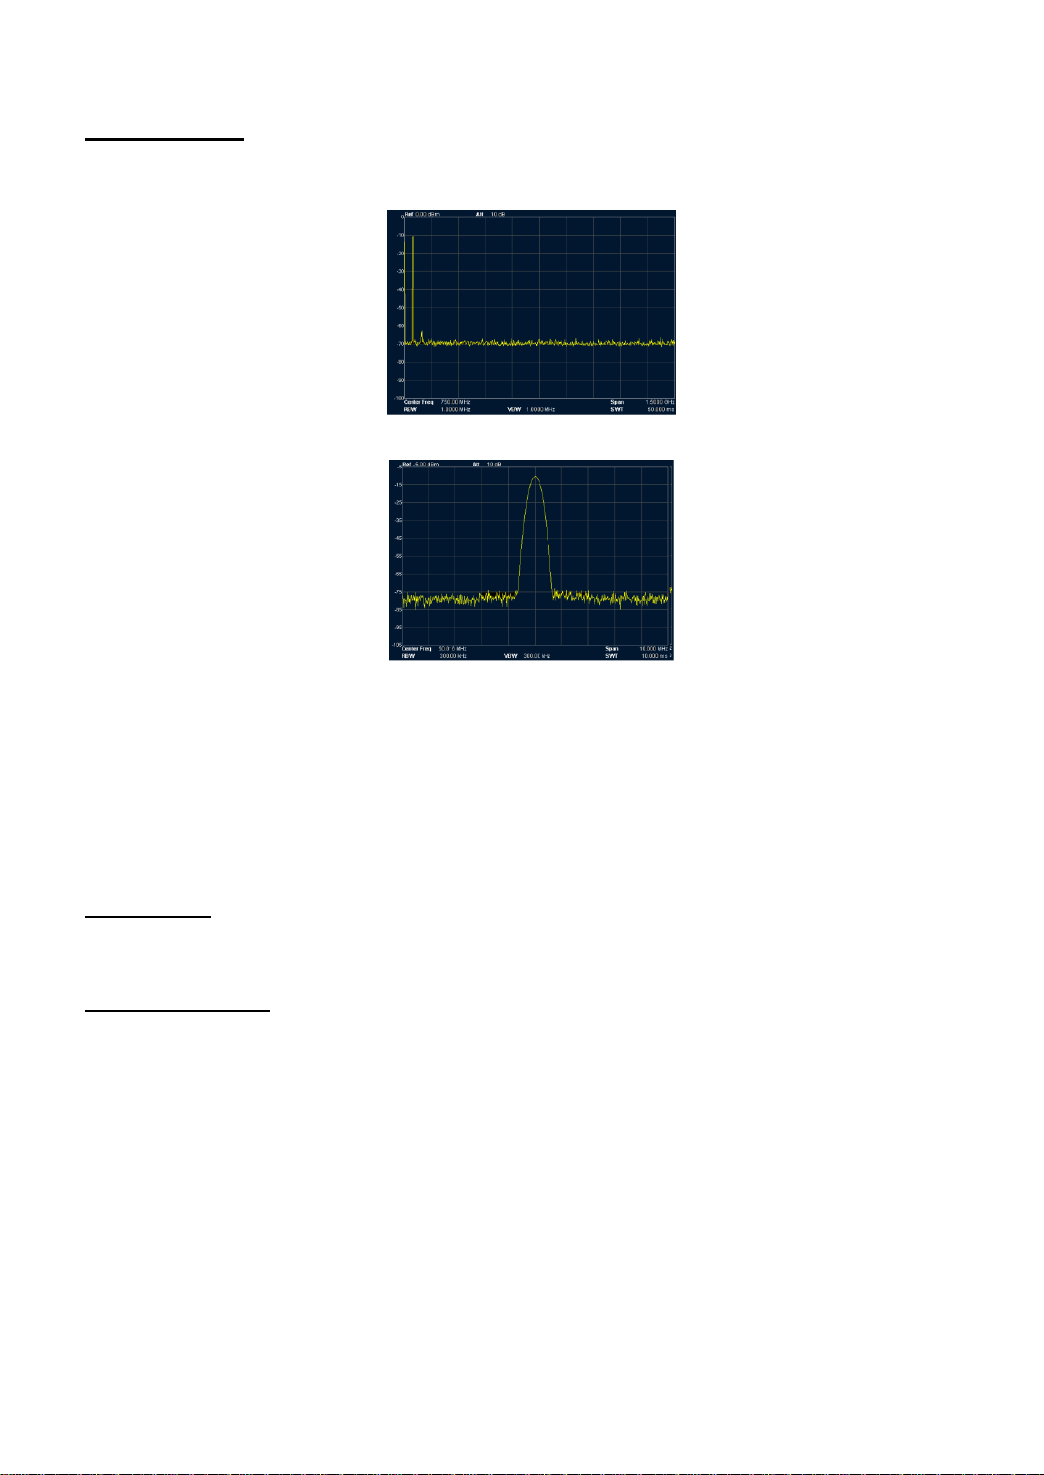
4.6. Auto Scale
To set the highest resolution for Y axis of current screen on condition that the signal is full displayed.
A reference level is set automatically and ensures the peak of signal always on the topmost of grid
for best view of tracing line.
Figure 2-2 Before Auto Scale
Figure 2-3 After Auto Scale
-16-
Page 20

Parameter
Description
Default
0dBm
Range
-100 dBm ~ 30 dBm
Unit
dBm, -dBm, mV, uV
Knob Step
in Log scale mode, step=scale/10
in Lin scale mode, step=0.1 dBm
Arrow Keys Step
in Log scale mode, step=scale
in Lin scale mode, step=1 dBm
Parameter
Description
Default
10dB
Range
0 dB ~ 50 dB
Unit
dB
Knob Step
5 dB
Arrow Keys Step
5 dB
4.7. Ref Level
Set the reference level, indicates at the top scale as amplitude power or voltage. When change the
reference level, the topmost scale of absolute amplitude level changes accordingly shown at the
upper left of the display grid.
Key points:
Maximum reference level is affected by combination of maximum mixing level, input attenuation
and preamplifier. When adjust it, the input attenuation is adjusted under a constant max mixing
level, meeting:
L
, a RF, a PA and L
Ref
denote reference level, input attenuation,
mix
preamplifier and maximum mixing level.
You can modify this parameter by numeric keys, knob and arrow keys. For more details, please
refer to “Paramter Input”.
Table 2-6 Reference Level
4.8. Input Atten
Set the front attenuation of the RF input in order to permit big signals (or small signals) to pass from
the mixer with low distortion (or low noise).
Key points:
When preamplify is on, up limit for input attenuation can set to be 30dB. You can adjust
reference level to ensure above formula 2-3.
You can modify this parameter by numeric keys, knob and arrow keys. For more details, please
refer to “Parameter Input”.
Table 2-7 Input Attenuration
-17-
Page 21

Parameter
Description
Default
10dB
Range
0.1 dB ~ 20 dB
Unit
dB
Knob Step
Scale≥1, step=1 dB
Scale<1, step=0.1 dB
Arrow Keys Step
In 1-2-5 sequence
4.9. Scale/Div
Only in Log scale mode, set the logarithmic units and scale value per vertical grid division on the
display.
Key points:
Trough changing the scale, the displayed amplitude range is adjusted.
Amplitude range can be displayed:
Min:Reference level – 10 × scale ;
Max:Reference level
You can modify this parameter by numeric keys, knob and arrow keys. For more details, please
refer to “Parameter Input”.
Table 2-8 Scale
4.10. Scale Type
Set the scale type of Y-axis to Lin or Log, the default is Log.
Key points:
In Log scale type, Y-axis denotes the logarithmic coordinate, top grid shows reference level, and
the grid size is equal to the scale value. The unit of Y-axis will be switched to be dBm as default
when the scale type is changed from Lin to Log.
In Lin scale type, Y-axis denotes linear coordinate, top grid shows reference level and bottom
grid is 0V, the grid size is10% of the reference level and scale setting is invalid. The unit of Yaxis will be switched to be Volts as default when the scale type is changed from Log to Lin.
Scale type will not affect the unit of Y-axis.
-18-
Page 22

Parameter
Description
Default
0dB
Range
-300 dB ~ 300 dB
Unit
dB
Knob Step
No
Arrow Keys Step
No
4.11. Y-axis Units
Set the unit of Y-axis to dBm, dBmV, dBuV, Volts or Watts.
dBm, dBmV, dBuV are uint for Log scaling, but Volts and Watts are unit for Lin scaling. Defualt
uinit is dBm.
4.12. Ref Offset
Assign an offset to the reference level to compensate for gains or losses generated between the
measured device and the analyzer. Then the level of external amplitude tansformer input can be
taken as reference for measured signal level.
Key points:
The change of this parameter will not change the position of curve on screen, but change the
read out of the reference level and marker amplitude.
You can modify this parameter by numeric keys. For more details, please refer to “ Parameter
Input”.
Table 2-9 Reference level offset
-19-
Page 23

4.13. Auto Range
Auto change the amplitude parameters whitin current span for easy view of the signal display in main
screen.
Figure 2-4 Before Auto range
Figure 2-5 After Auto range
Key points:
The difference between Auto Range and Auto Scale is that Auto Range can solve the
overrange problem caused by parameter setting and adjust the max. mix level to accords with
signal.
The difference between Auto Range and Auto is that: Auto Range adjusts the main channel
signal but not change the frequency settings. Auto searches signal in full span and locate the
signal at the center frequency.
4.14. Int Preamp
Turn on or off the preamplifier located at front of RF. When the function enabled, the
preamplifier will reduce the display average noise level in order to distinguish the small signal
among noises.
Key points:
The icon will be displayed on the left screen when the preamplifier is on.
-20-
Page 24

Parameter
Description
Default
-10dBm
Range
-50 dBm ~ 0 dBm
Unit
dBm, -dBm, mV, uV
Knob Step
1 dBm
Arrow Keys Step
10 dBm
Parameter
Description
Default
1 MHz
Range
10 Hz ~ 1 MHz
Unit
GHz, MHz, kHz, Hz
Knob Step
In 1-3-10 sequence
Arrow Keys Step
In 1-3-10 sequence
4.15. Max Mix Level
Set max input level of mixer according to the manaitude of signal.
Key points:
For bigger input signal, select small max mixing level in order to increase input attenuation and
reduce distortion. For smaller input signal, select big max mixing level in order to reduce input
attenuation and distortion.
Paramter in formula 2-3, are always changing on the basis of max mixing level.
You can modify this parameter by numeric keys, knob and arrow keys. For more details, please
refer to “Parameter Input”.
Table 2-11 Max mix level
5. Sweep and Function Settings
Set the parameters of RBW (Resolution Bandwidth), VBW (Video Bandwidth) and Dectector.
5.1. RBW
Set the RBW (Resolution Bandwidth) in order to distinguish two close signals.
Key points:
Reducing the RBW to get higher frequency resolution, but will cause the longer sweep (In Auto
Sweep mode, sweep time will be affected both by RBW and VBW).
In Auto RBW mode, RBW decreases with the span (non-zero span).
You can modify this parameter by numeric keys, knob and arrow keys. For more details, please
refer to “Parameter Input”.
Table 2-12 RBW (gaussian filter selected)
-21-
Page 25

Parameter
Description
Default
1 MHz
Range
1 Hz ~ 1 MHz
Unit
GHz, MHz, kHz, Hz
Knob Step
In 1-3-10 sequence
Arrow Keys Step
In 1-3-10 sequence
Parameter
Description
Default
1
Range
0.000001 ~ 100000
Unit
No
Knob Step
In 1-3-10 sequence
Arrow Keys Step
In 1-3-10 sequence
5.2. VBW
Set the VBW (Video Bandwidth) in order to remove the band noise.
Key points:
Reducing the VBW to smooth spectrum line and differentiate small signal from the noise, but
also will cause the longer sweep (In Auto Sweep mode, sweep time will be affected both by
RBW and VBW).
In Auto mode, VBW will change with RBW, but not affected by RBW in Manual mode.
You can modify this parameter by numeric keys, knob and arrow keys. For more details, please
refer to “Parameter Input”.
Table 2-13 VBW
5.3. V/R Ratio
Set the ratio of VBW to RBW. If the response of signal is very close to noise level, to avoid the signal
to be covered by noise, you need to set the ratio less than 1 to reduce noise.
Key points:
Select right V/R Ratio while measuring different kinds of signal:
Sine signal: Select 1 to 3 (for faster sweeps).
Pulse Signal: Select 10 (reduce the influence on amplitude of transient signals)
You can modify this parameter by numeric keys, knob and arrow keys. For more details, please
refer to “Parameter Input”.
Table 2-14 V/R Ratio
-22-
Page 26

5.4. Detector
Set the detector type of analyzer for different signal measurement.
5.4.1. Detector Type
While displaying a wider span, analyzer always capture the whole data for each pixel whthin a
specified time. Then, the data will be processed (Peak Value, Average Value) by current selected
detector and shown on screen after finishing the processing.
Key points:
Select appropriate dectector type according to the application to ensure the accuracy of the
measurement.
Optional detector types are: Pos Peak, Neg Peak, Sample, Normal, RMS Avg and Voltage Avg,
the default is Pos Peak.
Each selected type is shown with a parameter icon on the left status bar of screen as Figure 2-6
below:
Figure 2-6
1. Pos Peak
Search the maximum from the samling data segment and display it. In this type, the signal will not be
missed even with very small resolution, which is very helpful for EMC test.
2. Neg Peak
Search the minimum from the sampling data segment and display it at the corresponding pixel.
3. Sample
Sample type shows the transient level of the center time in corresponding interval for each pixel of
curve. If the span is far bigger than RBW, the detector will not be such reliable. So sample type is
only applicable for Noise signal or similar ones.
4. Normal
Normal also can be named as Pos Normal or Rosenfell, that is searching both the minimum and
maximum from the sampling data segment and displays maximum at each odd pixel, minimum at
each even pixel. In this type, user can intuitively view the change range of amplitude.
5. RMS Avg
Caculate the data from the smapling data segment with mean square root operation and display the
result. This type can reject noise and easy for user to view the weak signal.
Where, VRMS denotes the mean square root value of voltage, unit is V. N denotes the number of
smples assigned for each pixel. vi denotes the envelop of the samples, unit is V.
Reference Resistance R can be used for Power calculation:
-23-
Page 27

Parameter
Description
Default
50 ms
Range*
20 us ~ 1500s (P4130-1)
20 us ~ 2200s (P4135-1)
20 us ~ 3000 s (P4140-1)
Unit
Ks, s, ms, us
Knob Step
Sweep time/100, Min = 1ms
Arrow Keys Step
In 1-1.5-2-3-5-7.5 sequence
6. Voltage Avg
Average the data from sampling assigned to pixel and displays the result.
Where, V denotes the average of voltage with unit V, N denotes the number of smaples assigned to
each pixel. v I denotes the envelope of smaples with unit V。
6. Sweep
Set the parameters about sweep and trigger, such as Time, Mode, SWT Count and Trig Type.
6.1. Time
Set the time for the analyzer to complete a sweep within span. Either Auto or Maual can be used, the
default is Auto.
Key points:
In non-zero span mode, once you select Auto, the analyzer will choose the shortest sweep time
according to current parameter setting, such as RBW, VBW and so on.
Decreasing sweep time will speed the measurement. But if your specified time is less than the
shortest sweep time in Auto coupling, it will lead to error in measurement, and “UNCAL” will be
shown at the status bar of the screen.
You can modify this parameter by numeric keys, knob and arrow keys.
Table 2-15 Sweep time
* Note: in non-zero mode, minimum is 10 ms.
6.2. Mode
Set the sweep mode to Single or Continue, the default is Continue. The icon for selected mode will
be shown at the left status bar of screen.
-24-
Page 28

1. Single
Set the sweep mode to Single and the number 10 in parameter icon shows the current sweep
number.
2. Continue
Set the sweep mode to Continue. The “Cont” in parameter icon denotes the analyzer is sweeping
continuously.
Key points:
In single mode, when pressed, the system enter into continue sweep mode and will sweep
when trigger condition allows.
In continue mode, the system send initialization signal automatically and enter into the judement
program directly when each sweep finishes.
6.3. Single
In single sweep mode, the menu is used for the initialization of trigger. After executing, the system
will sweep (or measure) as specificed numbers when trigger condition allows.
Key points:
In continue mode, when select Single menu, the system enter into signle sweep mode and will
sweep with specified numbers when trigger condition allows.
If the sytem has been already in signle mode, selecting this menu will make anlalyzer sweep (or
measure) as specified number when trigger condition allows.
In single sweep mode, the system needs to execute the trigger initialization first and then judge
the trigger condition.
-25-
Page 29

Parameter
Description
Default
601
Range
101 ~ 3001
Unit
No
Knob Step
1
Arrow Keys Step
100
Hint
Along with the increasing of the sweep points (more than 601), the resolution
of marker point will be increased too, but the sweep speed will be decreased.
Except of Sweep Points, other parameters also influence the speed of sweep,
Like Span, RBW, VBW, Detector Type and Center Frequency.
Parameter
Description
Default
1
Range
1 ~ 9999
Unit
No
Knob Step
1
Arrow Keys Step
1
6.4. Points
Set the desired points for each sweep. That is the points of current trace.
Key points:
When sweep time is limited by smapling rate of ADC (Analog to Digital Converter), modifying
the sweep numbers will affect sweep time. That is, the more pionts, the longer sweep time wil
be.
Modifying the numbers also influences other system parameters, so sytme will restart sweep
and measure.
You can modify this parameter by numeric keys, knob and arrow keys. For more details, please
refer to “Parameter Input”.
Table 2-16 Sweep pionts
6.5. SWT Count
Set the number of time for a single sweep. The system will execute specified numbers of sweep and
the number in icon shown at the left status bar of screen changes along with the process of sweep.
Table 2-17 Sweep Count
-26-
Page 30

Parameter
Description
Default
0 dBm
Range
-300 dBm ~ 50 dBm
Unit*
dBm
Knob Step
1 dBm
Arrow Keys Step
10 dBm
7. Trigger
Set the parameters of trigger function.
7.1. Trig Type
The trigger type includes Free Run, Video and External. Each icon of selected type will be shown at
the left of screen.
1. Free Run
Whenever the trigger ocnidtion is satisfied, the analyzer will generate trigger signal continuously.
2. Video
When detected voltage of a video signal exceed the video trigger level you specified, the analyzer
will generate the trigger signal. This mode is invalid for non-zero span, RMS Avg of zero span and
Voltage Avg of detector.
3. External
Input an external signal (TTL signal) through [TRIGGER IN] connector on rear panel. When the
trigger condition is satisfied, the analyzer will generate trigger signals.
7.2. Trig Setup
1. Trig Level
When you select trigger level in Video Mode, the trigger level line and value will be shown in the
screen.
You can modify this parameter by numeric keys, knob and arrow keys. For more details, please refer
to “Parameter Input”.
Table 2-18 Trigger level
*Note: This is in conncetion wit unit of current selected Y-axis.
2. Trig Edge
Set the trigger edge in External mode to Pos or Neg of Pulse.
-27-
Page 31

8. Trace
Sweep signal is shown as trace on screen.
8.1. Select Trace
Analyzer can show 3 traces at most with different trace color (Trace 1-yellow, Trace 2- light blue,
Trace 3-red). Trace 1, 2, 3 can be set by users and trace 4 is formed by math operation on base of
other 3 traces. Select trace and set related parameters of them. The default is Trace 1 and trace
type is Clear Write.
Note:
The current trace shown on the screen could be saved in analyzer or external memory and recall
when needed. User can press “Save” key to store the data, detail method is descriped in “Save”.
8.2. Trace Type
Set the type of the current trace or disable it. The system calculates the sample data with a specific
operation according to the slected trace type and finally displays the result. Trace type includes Clear
Write, Max Hold, Min Hold, Video Avg, Power Avg and Freeze. Each icon of selected type will be
shown at the left of screen. Take Trace 1 for example as below:
Figure 2-7
1. Clear
Clear all the data saved for previous trace and continuously displays the signals that are the data of
points during the sweep.
2. Max Hold
Maintains the maximum for each point of the trace, and updates each trace point if a new maximum
is generated in successive sweeps.
3. Min Hold
Maintains the minimum for each point of the trace, and updates each trace point if a new minimum is
generated in successive sweeps.
4. Video Avg
Display the trace after a logarithmic mean is calculated for each point of the trace in successive
sweeps. Traces in this type are smoother.
5. Power Avg
Display the trace after an average for each point of the trace in successive sweeps. Traces in this
type are smoother.
6. View
Hold and display the amplitude data of selected trace. Register stop updating trace data in order to
view and read the data. This type is generally used by traces from the storage devices or remote
interface download to system, the default type is View.
7. Blank
Disable the trace display and all measurement based on trace.
-28-
Page 32

Parameter
Description
Default
100
Range
1 ~ 1000
Unit
No
Knob Step
No
Arrow Keys Step
No
Parameter
Description
Default
0 dB
Range
-300 dB ~ 300 dB
Unit
dB
8.3. Average Times
Set the average times of trace.
Key points:
More averaging will reduce the noise and influence of other random signals, also better display the
stable signal characteristics. The more averaging takes, the smoother the trace will be.
You can modify this parameter by numeric keys. For more details, please refer to “Parameter Input”.
Table 2-19 Average Times
8.4. Math
1. Function
Set the computational method of the math trace.
A-B: subtract Trace B from Trace A.
A+Constant: add a constant to Trace A.
A-Constant: subtract a constant from Trace A.
2. A
Assign a value to A from Trace 1, Trace2 or Trace 3. The default is Trace 1 (“T1”).
3. B
Assign a value to B from Trace 1, Trace2 or Trace 3. The default is Trace 1 (“T2”).
4. Constant
Set the value of constant for math trace.
You can modify this parameter by numeric keys. For more details, please refer to “Parameter Input”.
Table 2-20 Constant in math operation
5. Operate
Enable or disable the display of math trace, the default is off.
8.5. All Clear
Clear all trace on screen. Advanced measurement stop when as there is no available data source.
-29-
Page 33

Parameter
Description
Default
Center frequency
Range
0 ~1.5GHz (P4130-1)
0 ~2.2GHz (P4135-1)
0 ~3.0GHz (P4140-1)
Unit
Readout=Frequency(or Period), unit is GHz, MHz, kHz,
Hz (or ks, s, ms, us, ns, ps)
Readout=Time (or 1/△ time), unit is ks, s, ms, us, ns, ps
(or GHz, MHz, kHz, Hz)
Knob Step
Readout=Frequency(or Period), step=span/(sweep points-
1)
Readout=Time (or 1/△ time), step=sweep time/(sweep
points-1)
Arrow Keys Step
Readout=Frequency(or Period), step=span/10
Readout=Time (or 1/△ time), step=sweep time/10
9. Marker Measurement
9.1. Marker
The marker shows as a rhombic sign for marking the trace point. Easy for user to readout the
amplitude, frequency and sweep time of each point through marker.
Key points:
Screen can show 4 pairs of marker at most, but only one pair or one single marker is active every
time.
In marker menu, you can input frequency and time by numeric keys, knob and arrow keys, also view
the readout of point on trace.
9.2. Marker Select
Select one marker from four, the default is Marker 1. Then select other parameters such as marker
type, marker trace and readout type for this marker. The enabled marker will appear on the selected
trace through the Marker Trace option. And the readout of active marker located on marker place will
be displayed in active function area and upper right of screen.
Table 2-21 Marker parameters
9.3. Normal
Normal is one of marker type, used to measure X (frequency or time) and Y (amplitude) of one point
on trace. When selected, a marker with current number will appear on trace.
Key points:
If there is no active marker, pressing this key will enable a marker at the palce of center
frequency for current trace. If there is active marker, it will be enalbled after pressing this key.
You can shift the marker by numeric keys, knob and arrow keys and the readout of current
marker will be shown at the upper right of screen.
The resolution of X-axis (frequency or time) readouts corresponds to the span, you can lower
span to get higher resolution for readout.
-30-
Page 34

The application of Delta Marker: to measure the signal-noise ratio of single
spectrum signal. For example, place the Reference Marker at the position of
signal and Delta Marker at the position of Noise, the measuring amplitude is the
signal-noise ratio.
9.4. Delta
Delta is one of marker type, used to measure the difference between “reference marker” and “certain
point on trace”: X value (frequency or time) and Y value (amplitude). When this type selected, a pair
of markers will appear on trace, Reference Marker (indicated with number and letter “R”, like “1R”)
and Delta Marker (indicated with number, like “1”).
Key points:
If there is active marker, pressing this key will enalble a reference marker at the place of current
marker. Or else both the reference marker and Delta Marker will be activated together at the
position of center frequency.
The position of Reference Marker is always fixed (X and Y), but the Delta Marker can be shifted
by numeric keys, knob and arrow keys if it is active.
The differences of frequency (or time) and amplitude between two markers are shown at the
upper right of screen.
The methods of making one point as reference:
a) Open a Normal Marker and place it on one point. Then switch the marker type to Delta and
this point becomes reference by changing the position.
b) Open a Delta Marker and place it on one point. Then select Delta menu again, so that
Reference Marker is located on this point and be available to measure the delta by changing
the position.
Enable “Noise Marker” function under Marker Fctn menu, then the result of noise measurement
will be more accurate by auto correction and be normalized to 1Hz.
9.5. Delta Pair
Delta Pair is one of marker types. When selected, a pair of markers will appear on trace, which are
Reference Marker (indicated with number and letter “R”, like “1R”) and Delta Marker (indicated with
number and letter “D”, like “1D”).
Key points:
You can adjust the position of reference marker (select “reference”) and Delta Marker by
numeric keys, knob and arrow keys.
The difference between Delta Pair and Dalta: you just can modify the delta point in Delta type,
but you can modifiy both delta point (select Delta option) and reference point (select
“Reference” option) in Delta Pair type. Additioally, X and Y keeps unchanged during sweep in
Delta type, but the Y-axis change along with sweep while X-axis keeps unchanged in Delta Pair
type.
-31-
Page 35

9.6. Span Pair
One of the marker types. When selected, a pair of markers will appear on trace, which are
Referenece Marker (indicated with number and letter “R”, like “1R”) and Delta Marker (indicated with
number and letter “D”, like “1D”).
Key points:
You can adjust the position of reference marker (select “reference”) and Delta Marker by
numeric keys, knob and arrow keys at the same time.
When select “Range”, adjusting “Span Pair” will keep the center position of two markers and just
move them to sides ( value increasing) or center (value decreasing).
When select “Center”, adjusting “Span Pair” will keep the relative distance and just move the
center to left (value increasing) or right (value decreasing).
The difference between Span Pair and Dalta: you just can modify the delta point in Delta type,
but you can modifiy both delta point (select Delta option) and reference point (select
“Reference” option) in Span Pair type at the same time.
9.7. Off
Turn off the current selected marker. All the information and related functions will also be turned off.
9.8. Marker Trace
Select one trace for current marker from 1, 2, 3 Math and Auto (default). When select Auto, the
system will search desired trace in the order of “Clear Write”, “Max Hold”, “Min Hold”, “Video Avg”,
“Power Avg” and “Freeze”. If search more than two traces as result, it will be selected in sequence of
trace number 1, 2, 3 accordingly.
9.9. Readout
Set the readout type for X-axis. You can set different type for each marker, which just change the
reading mode, not actural value. This setting will influence the marker readout shown in active area
and upper right of screen.
1. Frequency
In this type, Normal marker shows the absolute frequency, and the other types (Delta, Delta Pair
and Span Pair) show the frequency difference between the Delta Marker and Reference Marker.
In non-zero span mode, default readout type is Frequency.
2. Period
In this type, Normal marker shows the reciprocal value of frequency, and the other types (Delta,
Delta Pair and Span Pair) show the reciprocal value of frequency difference between the Delta
Marker and Reference Marker. When the frequency difference is zero, the displayed value is
inifite and shown as 10Ts. This readout type is invalid in Zero span mode.
3. △Time
In this type, Normal marker shows the time difference between the marker and sweep start, and
the other types (Delta, Delta Pair and Span Pair) show the sweep time difference between the
Delta Marker and Reference Marker. In Zero span mode, the default readout type is Time.
4. 1/△time
In this type, the analyzer shows the reciprocal value of time difference between the Delta Marker
and Reference Marker. When the sweep time difference is zero, the displayed value is inifite
and shown as 100THz. This readout type is only available when Delta Marker selected under
Zero span mode, applicable for measuring of the frequency of video signal.
9.10. Marker Fctn
Set special measuring functions of marker such as Noise Marker, N dB BW and Frequency Count.
-32-
Page 36

Parameter
Description
Default
-3 dB
Range
-100 dB ~ 100 dB
Unit
dB
Knob Step
0.1 dB
Arrow Keys Step
1 dB
9.11. Select Marker
Select marker to be used for the specific measuring, the default is Marker 1.
9.12. Noise Marker
Execute the Noise function for the selected marker and reads the Power Spetral Density.
Key points:
If current marker under Marker menu is off, pressing this key will enable it to Normal type, and
then measure the average noise level at the marked point and nomarlize the value to 1Hz
bandwidth. During this process, the system compensates according to different detector modes
and trace types. With the mode of “RMS Avg” and “Sample”, the measurement will be more
accurate.
If the Delta Function of marker is on, the noise marker will be enabled and moved to the floor
noise to be measured, in this case, the readouts shows the Sig./Noise ratio.
9.13. N dB BW
Enable the function of N dB bandwidth measurement or se the value of N dB. The N dB denotes the
frequency difference points that are located on both sides of the current marker while the amplitude
falls off (N<0) or rises (N>0) N dB sperately, see below figure 2-8:
Figure 2-8
Key points:
After measurement starts, the analyzer first search the two points locate at boths sides of
current marker with amplitude difference N dB. If the points are searched, the frequency
difference between them will be shown in active area. Or else the sign “---” shows that the
search failed.
You can modify N value by numeric keys, knob and arrow keys. For more details, please refer
to “Parameter Input”.
Table 2-22 N dB BW parameter settings
Function Off
Disable the function of Noise Marker and N dB BW, but not the markers.
-33-
Page 37

9.14. Marker Table
Open or close the marker table. When the table opened, all opened markers are listed on table and
shown on the lower window of screen, including Marker number, Marker trace number, readout type,
X-axis reading and amplitude. User can watch several measurements of points and up to 8 markers
at the same time.
Note:
The opened table can be saved in the external memory and recalled when needed. User can press
Save key to store the data, detail method is descriped in “Save”.
Figure 2-9
9.15. All Off
Turn off all the markers and related functions.
9.16. Freq Count
Frequency counter reading
Figure 2-10
1. On/Off
Turn on or off the frequency counter.
Key points:
If no active marker selected, turing on the frequency counter will open a Normal marker
automatically.
When frequency counter opened, the frequency readouts will be more accurate.
In Zero span mode, the frequency counter is enabled to measure the frequency of center
frequency nearby.
-34-
Page 38

Parameter
Description
Default
1 kHz
Range
1 Hz ~ 100 kHz
Unit
GHz, MHz, kHz, Hz
Knob Step
10 times
Arrow Keys Step
10 times
2. Resolution
You can set the resolution of frequency counter by Manual of Auto. The available resolutions are 1
Hz, 10 Hz, 100 Hz, 1 kHz, 10 kHz and 100 kHz.
Table 2-23 The resolution of frequency counter
10. Peak Search
Open the Peak searching menu and execute the searching function.
Key points:
If select Max in option of Peak Search, it will search the maximum on trace and mark it.
If select Param in option of Peak Search, it will search and mark the peak that meets the
condition of the parameter.
Next Peak, Peak Right, Peak Left or Peaks in the peak table must meet the specified parameter
condition.
The spurious signal at the zero frequency caused by LO feed will note be taken as Peak.
If there is no peak meets the specified condtions, the system will prompt message “No peak
found”.
10.1. Next Peak
Search and mark the peak whose amplitude is the closest to the current peak’s and meets the
searching condition. If there is no next peak, marker will not move.
10.2. Peak Right
Search and mark the nearest peak on the right of current peak and meets the searching condition. If
there is no peak on the right, marker will not move.
10.3. Peak Left
Search the nearest peak on the left of current peak and meets the searching condition. If there is no
peak on the left, marker will not move.
10.4. Peak Min
Search and mark the minimum amplitude on trace.
10.5. Peak P-P
Search the Peak and Minimum at the same time, and then mark them by Delta Pair. Peak is marked
by Delta and Minimum is marked by Reference.
-35-
Page 39

The difference between Cont Peak and Signal Track: Cont Peak always search
the maximum in current channel, but Signal Track only track the signal with
same amplitude of marker before enabling this function, and set the frequency of
this signal as center frequency.
Parameter
Description
Default
10 dB
Range
0 dB ~ 200 dB
Unit
dB
Knob Step
1 dB
Arrow Keys Step
1 dB
Parameter
Description
Default
-90 dBm
Range
-200 dBm ~ 0 dBm
Unit
dBm, -dBm, mV, uV
Knob Step
1 dBm
Arrow Keys Step
1 dBm
10.6. Cont Peak
Turn on or off the Continue Search, the default is off. When this type is selected, once sweep
finishes, the analyzer will search a peak automatically to trace the measured signal.
10.7. Peak Para
Definite the conditions of peak search for various peak searching. Only for the both satisfaction with
“PkExcursion” and “Peak Threshold”, the value can be confirmed as Peak.
1. PK Excursion
Set the delta between the peak and minimum amplitude on both sides of it. Only peak whose delta
are beyond the specified delata are treated as desired peak.
Table 2-24 Peak Excursion
2. Peak Threshold
Specify the minimum amplitude of peak, only peaks whose amplitude beyong the limit can be treated
as desired peak.
Table 2-25 Peak Threshold
3. Peak Search
Set the peak search condition to Maximum or Parameters.
If Max is selected, the system searches the maximum on the trace.
If Para is selected, the system searches the peak meet with specified parameter condition.
This setting is just available when executing the peak search under Peak menu, while other
searches such as Next Peak, Peak Right, Peak Left and Min Search are all based on the Para
you specified.
-36-
Page 40

10.8. Peak Table
Open the Peak Table, you will see the peak list that meets the parameter on the lower portion of
screen (with frequency and amplitude displayed). The table allows 10 peaks to be shown at most.
The opened peak table can be saved in the external memory, also can be recalled when needed.
User can press “Save” key to store the data, detail method is descriped in “Save”.
1. On/Off
Turn on or off the Peak Table, the default is Off.
2. Peak Sort
Set Frequency or Amplitude for peak displayed order, the default is Freq.
3. Peak Readout
Set the display condition to Normal, >DL or <DL.
Normal
Display the first ten peak value meets with the search parameter in table.
>DL
Display the first ten peak values meet with the search condition and amplitude beyond display
level.
<DL
Display the first ten peak values meet with the search condition and amplitude lower than
display level.
11. Marker->
Set the other system parameters (such as frequency, Reference level) using the current marker
reading. Press Marker -> to enable a marker if none of them are active at present.
11.1. Mkr->CF
Set the center frequency of analyzer to be the frequency of current marker.
If Normal is selected, the center frequency will be set to the frequency of current marker.
If Delta, Delta Pair, or Span Pair is selected, the center frequency will be set to the frequency
where Delta Marker is.
In Zero span mode, this function is invalid.
11.2. Mkr->Step
Set the CF step of analyzer to be the frequency of current valid marker.
If Normal is selected, the CF step will be set to the frequency of current marker.
If Delta, Delta Pair, or Span Pair is selected, the CF step will be set to the frequency where
Delta Marker is.
In Zero span mode, this function is invalid.
-37-
Page 41

11.3. Mkr->Start
Set the start frequency of analyzer to be the frequency of current valid marker.
If Normal is selected, the start frequency will be set to the frequency of current marker.
If Delta, Delta Pair, or Span Pair is selected, the start frequency will be set to the frequency
where Delta Marker is.
In Zero span mode, this function is invalid.
11.4. Mkr->Stop
Set the stop frequency of analyzer to be the frequency of current valid marker.
If Normal is selected, the stop frequency will be set to the frequency of current marker.
If Delta, Delta Pair, or Span Pair is selected, the stop frequency will be set to the frequency
where Delta Marker is.
In Zero span mode, this function is invalid.
11.5. Marker Δ->Span
Set the span of analyzer to be the difference between the two markers in type of of Delta, Delta Pair
or Span Pair. In Zero span mode, this function is invalid.
11.6. Mkr->Ref
Set the reference level of analyzer to be the amplitude of current valid marker.
If Normal is selected, the reference level will be set to the amplitude of current marker.
If Delta, Delta Pair, or Span Pair is selected, the reference level will be set to the amplitude
where Delta Marker is.
-38-
Page 42
12. Auto Tune
Search for signals antomatically throughout the whole range and adjust the frequency and amplitude
to their best status and realize one-key signal search and auto setting of parameters.
Figure 2-11 Befor the Auto Tune
Figure 2-12 After the Auto Tune
Key Points:
When executing this function, the backlight of Auto is on and “Auto Tune” is shown on the status
of screen. Once finish the searching, the backlight will turn off and the icon “Auto Tune” will
disappear on status bar.
In the process, once you press the Auto key, the analyzer will stop the search.
The parameters such as Reference level, scale, input attenuation and max mixing level will be
changed during the searching progress.
13. Display
Control the screen display of the analyzer, such as the display line, full screen, active area and Scr
State.
13.1. Display Line
Turn on or off the display line or changes its location, which can be used for reference of readouts or
threshold value for the peaks displayed in the peak value.
Key points:
Display line is a horizontal reference that ampliuted is equal to specified value, the amplitude
unit of which is same as the one of Y-axis.
You can adjust the display line by numeric keys, knob and arrow keys.
-39-
Page 43

13.2. Full Screen
Switch to full screen state, the menus on right of screen and the parameters on the left of screen will
both disappear.
Pressing this key again will exit the full screen state and easy for user to watch the detail trace
information.
13.3. Active Fctn
Select the position in which the active function is displayed for convenient view of the trace.
Optional is Top, Center, Bottom, the default is Top.
13.4. Screen Off
Turn on or off the display, the default is On.
14. Preset
When this key pressed, the system will return to Factory settings or user defined state.
15. System Setup
Set the parameters on system.
15.1. Language
Select Chines or English for display language.
15.2. Reset
The function includes: select the instrument setting (Last or Preset) to be recalled after the analyzer
is powered on. Set the type for Preset (“Factory Setting” or User Defined). Save the system setting.
1. Power On
Set the power on setting to Last or Preset
If Last is selected, settings before ths last power-off will be recalled when power on.
If Preset is selected, settings defined in the Preset Type will be recalled when power on.
2. Preset Type
Select the preset type to “Factory Setting” (default) or “User-defined”.
If select the power on for preset, the analyzer will recall the preset when power on.
After power on, you can press Preset key to recall the specified Preset Type under any
operation menu.
3. Save Preset
Save the current instrument settings.
-40-
Page 44

15.3. I/O Settings
The analyzer supports communication trough the LAN, USB and RS232 interface.
1. I/O interface
Enalbe the LAN, USB and RS232, or disable the all.
2. LAN
Set the information for LAN.
3. USB
Set the information for USB.
4. RS232
Set the information for RS232
15.4. Ref Source
Select the internal or external reference source, the default is internal.
16. Measure
The analyzer provides advanced measurement function including Channel Power, Adjacent Channel
Power and Occupied Bandwidth.
16.1. Channel Power
Measures the total power of signal within the specified channel bandwidth, which includes the
Channel Power and Power Density.
Channel power: the power within the integral bandwidth
Power Density: the power normalized to 1Hz within the integral bandwidth.
Select Channel Power measurement under Meas function and press Meas Setup to set
corresponding parameters.
16.2. Integ BW
Specify the range of integration used in calculating the power in the channel
-41-
Page 45

Offset
selects one to six adjacent channels.
Offs Freq
sets the frequency of offset carrier
Ref BW
sets the bandwidth for adjacent channels
Neg Limits
sets the threshold parameters for left adjacent channels
Pos Limits
sets the threshold parameters for right adjacent channels
En:
opens or closes the adjacent channels from one to six channels
16.3. Limit
Set the level for Channel Power and Power Density measurements.
Press Limit key to display the status of Level, including the Total Level, Channel Power Level and
Power Density Level. Default is Off. Only enable the Total Level, the Channel Power Level and
Power Density Level will be displayed.
If you want to set the Level Parameters for Channel Power measurements, first make the Channel
Power Level to be On, there will be two options Power Max and Power Min.
CP Max :set the maximum of level
CP Min : set the minimum of level
For example, to measure a transmitter module with the power channel ranges from - 10dBm to
0dBm, you can set the max. power to be 0dBm and min. power to be -10dBm.
The setting for Power Density Level parameters is same.
16.4. Adjacent Channel Power (ACP)
Measures the powers of the main channel and adjacent channels as well as the power difference
between the main and each of the adjacent channels. The adjacent channels have same channel
bandwidth with the main channel, or set user’s demand.
Select ACP measurement under Meas function and press Meas Setup to set corresponding
parameters, which includes Integ BW, Offset/Limits, Meas Type, Total Pwr Ref and Limits.
16.5. Integ BW
Sets the bandwidth for main channel
16.6. Offset/Limits
Includes Offset, Offs Freq, Ref BW, Neg Limits, Pos Limits, En.
16.7. Meas Type
Selects measurements type as Total Pwr Ref or PSD Ref. Default is Total Pwr Ref.
16.8. Total Pwr Ref
Sets total power reference to be Manual or Auto
Auto the total power reference is set automatically
Manual the total power reference is set manually
16.9. Occupied Bandwidth (OBW)
Calculates the power within the whole bandwidth by integral operation and computes the occupied
bandwidth by this value based on the specified power ratio. Default occupied bandwidth percentage
is 99%.
Select OBW measurement under Meas function and press Meas Setup to set corresponding
parameters, which includes Max Hold, % Pwr, OBW Span, n dB and Limits.
-42-
Page 46

16.10. Max Hold:
Enables or disables the Max Hold, default is Off. When enabled, the function of which is same as the
one of Trace.
16.11. % Pwr :
Sets the occupied bandwidth percentage, that is the percentage of signal power occupied within
integral bandwidth power.
OBW Span:
Sets the integral frequency range in main channel, span will be set as the integral bandwidth
16.13. n dB:
Sets the n dB value for calculates the transmitting bandwidth
16.14. Limits:
The menu includes OBW, CW Offs and ACP
16.15. OBW:
Sets the limitation to Occupied Bandwidth
16.16. CW Offs:
Sets the limitation to frequency offset
16.17. Chain Pwr:
Sets the limitation to channel power
Chapter 3 Remote control
Users can control this series of digital Spectrum Analyzers through USB, LAN and RS-232 remote
interface. This chapter introduces the basic information and method of remote control of the
instrument.
The contents of this chapter are as follows:
Remote control overview (refer to the Spectrum Analyzer software instructions)
Remote control method (refer to the Spectrum Analyzer software instructions)
-43-
Page 47

17. Specifications
Range
P 4130-1
9kHz to 1.5GHz
P 4135-1
9kHz to 2.2GHz
P 4140-1
9kHz to 3.0GHz
Resolution
1Hz
Reference frequency
10MHz
Aging rate
<5×10⁻⁶/year
Teperature stability
<5×10⁻⁶ (20 ℃ to 30 ℃)
Cursor frequency resolution
span/ (sweep points-1)
Cursor frequency uncertainty
± (cursor frequency reading×reference
frequency uncertainty+1%×span+10%×
resolution bandwidth+ cursor frequency
resolution)
Counter resolution
1Hz, 10Hz, 100Hz, 1kHz, 10kHz, 100kHz
Counter uncertainty
± (cursor frequency reading×reference
frequency uncertainty+counter resolution)
Range
P 4130-1
0Hz, 100Hz to 1.5GHz
P 4135-1
0Hz, 100Hz to 2.2GHz
P 4140-1
0Hz, 100Hz to 3.0GHz
Uncertainty
±span/ (sweep points-1)
Carrier offset
<-80dBc/Hz (@10 kHz, fc<1.0GHz)
Resolution bandwidth (-3dB)
10Hz to 1MHz, step is 1-3-10; 9kHz,
120kHz
RBW precision
<5%, nominal value
Resolution filter shape factor (60dB: 3dB)
<5, nominal value
Vedio bandwidth (-3dB)
1Hz to 1MHz, step is 1-3-10
17.1. Frequency
17.1.1. Frequency Range
17.1.2. Internal reference frequency
17.1.3. Frequency reading precision
17.1.4. Frequency counter
Note:
Frequency reference uncertainty= (aging rate×period since adjustment + temperature shift)
17.1.5. Frequency span
17.1.6. SSB Phase Noise
17.1.7. Bandwidth
-44-
Page 48

17.2. Amplitude
Range
P 4130-1
10MHz to 1.5GHz DANL to +30 dBm
P 4135-1
10MHz to 2.2GHz DANL to +30 dBm
P 4140-1
10MHz to 3.0GHz DANL to +30 dBm
DC voltage
50V
Continuous wave RF power
+30dBm (1.0 W)
Maximum damage level
+40dBm (10W)
0 dB attenuation, RBW=VBW=100 Hz, sample detector, trace average≥ 50
Display Average
Noise Level
(preamplifier off)
100kHz to 10MHz
-90dBm, typical value-110dBm
10MHz to 1.5GHz (P4130-1)
-120dBm+6 x (f/1GHz)dB,
typical value -125dBm
10MHz to 2.2GHz (P4135-1)
10MHz to 3.0GHz (P4140-1)
Display Average
Noise Level
(preamplifier on)
100 kHz to 30MHz
- 90dBm, typical value -110dBm
30MHz to 1.5GHz (P4130-1)
-135dBm+6 x (f/1GHz)dB,
typical value -140dBm
30MHz to 2.2GHz (P4135-1)
30MHz to 3.0GHz (P4140-1)
Logarithm scale
1dB to 200dB
Linear scale
0 to reference level
Number of display points
601
Numbers of traces
3+ arithmetical trace
Detection modes
positive peak, negative peak, sample detection,
standard detection, RMS, average voltage
Trace functions
Clear write, max hold, min hold, average, view,
close
Scale unit
dBm, dBmV, dBμV, V, W
10dB attenuation, relative to 50MHz, 20℃ to 30℃
Frequency response
(preamplifier off)
1.0MHz to 1.5GHz (P4130-1)
1.0MHz to 2.2GHz (P4135-1)
1.0MHz to 3.0GHz (P4140-1)
±1.0dB
Frequency response
(preamplifier on)
50MHz to 1.5GHz (P4130-1)
50MHz to 2.2GHz (P4135-1)
50MHz to 3.0GHz (P4140-1)
±1.0dB
Setting range
0 to 50dB, step is 1dB
Switch uncertainty
fc=50 MHz, relative to 10dB, 20℃ to 30℃ <0.5dB
17.2.1. Measurement range
17.2.2. Maximum input level
17.2.3. DANL
17.2.4 Display level
17.2.5. Frequency response
17.2.6. Input attenuation error
-45-
Page 49

17.2.7. Resolution bandwidth switch
Uncertainty
100Hz to 1MHz, relative to RBW 1kHz ±0.15dB
Range
-100dBm to +30dBm, step is 1dB
Resolution
logarithm scale 0.01dB
Linear scale
4 digits
Full-amplitude precision
95% confedence level,
S/N>20dB, RBW=VBW=1 kHz,
Pre-amplifier is closed, 10dB attenuation,
-10dBm<reference level<0, 10MHz<fc<3.0GHz,
within 20 ℃ to 30 ℃
±1.0dB, nominal value
Second Harmonic Intercept (SHI)
+40dBm
Third-order intermodulation (TOI)
fc>30MHz
+10dBm
Image frequency
<-60dBc
Intermediate frequency
<-60dBc
Residual response, intrinsic
<-80dBm, typical value
Residual response, other:
Local oscillators, A/D conversion,
subharmonic of first LO, harmonic
of first LO
<-60dBc
Input related spurious
Mixer level:-30dBm
<-60dBc, typical value
Sweep time range
P4130-1
100Hz ≤span≤ 1.5GHz ; Zero span 10ms to 1500s
P4135-1
100Hz ≤span≤ 2.2GHz ; Zero span 10ms to 2200s
P4140-1
100Hz ≤span≤ 3.0GHz ; Zero span 10ms to 3000s
Sweep time
precision
P4130-1
100Hz ≤span≤ 1.5GHz ; 5%, nominal value
P4135-1
100Hz ≤span≤ 2.2GHz ; 5%, nominal value
P4140-1
100Hz ≤span≤ 3.0GHz ; 5%, nominal value
Zero span
0.5%, nominal value
Sweep mode
Continuous, single
Trigger source
free, video, external
External trigger level
5V TTL level
17.2.8. Reference level
17.2.9. Full-amplitude precision
17.2.10. Intermodulation
17.2.11 Spurious responses
17.3. Sweep
17.3.1 Sweep
17.4. Trigger
17.4.1 Trigger
-46-
Page 50

Impedance
50Ω
Connector
N female
Impedance
50Ω
Connector
N female
Connector
BNC female
10MHz reference input amplitude
0dBm to +10dBm
10MHz reference output amplitude
-3dBm to +3dBm
Trigger voltage
5V TTL level
Display type:
TFT LCD
Display resolution:
800*480 Pixels
Screen:
7.0 inch
Standard interface:
LAN, USB Host, USB Device, RS232
Input voltage:
100V to 240V, nominal AC
Power consumption:
35W
AC range:
45Hz to 440Hz
Working temperature:
5℃ to 40℃
Storage temperature:
-20℃ to 70℃
Width x High x Length:
363mm×154mm×327mm
Weight (Device only)
6.0kg
17.5. Input/output
17.5.1. RF input
17.5.2. Tracking source output
17.5.3. 10MHz reference input/10MHz reference output/external trigger input
17.6. General characteristics
17.6.1 Display:
17.6.2. Remote interface:
17.6.3. Power:
17.6.4. Temperature
17.6.5 .Dimension
17.6.6. Weight:
-47-
Page 51

CD- ROM with User’s Guide and Programmers Guide
BNC-BNC cable
N-BNC adapter
N-SMA cable
N-SMA adapter
Power cord
Reference frequency
10MHz
Aging rate
<5×10⁻⁷/year
Teperature stability
<5×10⁻⁷ (20 ℃ to 30 ℃)
Chapter 4: Appendix
Standard accessories:
High stability oscillator
All rights, also for translation, reprinting and copy of this manual or parts are reserved.
Reproduction of all kinds (photocopy, microfilm or other) only by written permission of the publisher.
This manual considers the latest technical knowing. Technical changes which are in the interest of
progress reserved.
We herewith confirm, that the units are calibrated by the factory according to the specifications as
per the technical specifications.
We recommend to calibrate the unit again, after one year.
© PeakTech® 03/2017/MP
PeakTech Prüf- und Messtechnik GmbH – Gerstenstieg 4 - DE-22926 Ahrensburg / Germany
+49-(0) 4102-42343/44 +49-(0) 4102-434 16
info@peaktech.de www.peaktech.de
 Loading...