

Page 1

PeakTech
®
1190/1230
Operation manual
Digital Oscilloscope /
with 16-CH logic analyzer
Page 2

1. Safety Precautions
This product complies with the requirements of the following European Community Directives: 2004/108/EC
(Electromagnetic Compatibility) and 2006/95/EC (Low Voltage) as amended by 2004/22/EC (CE-Marking).
Overvoltage category II; pollution degree 2.
To ensure safe operation of the equipment and eliminate the danger of serious injury due to short-circuits
(arcing), the following safety precautions must be observed.
Damages resulting from failure to observe these safety precautions are exempt from any legal claims
whatever.
Do not use this instrument for high-energy industrial installation measurement.
Prior to connection of the equipment to the mains, check that the available mains voltage corresponds
to the voltage setting of the equipment.
Connect the mains plug of the equipment only to a mains outlet with earth connection.
Do not place the equipment on damp or wet surfaces.
Do not operate the equipment near strong magnetic fields (motors, transformers etc.).
Do not exceed the maximum permissible input ratings (danger of serious injury and/or destruction of
the equipment).
The meter is designed to withstand the stated max voltages. If it is not possible to exclude without that
impulses, transients, disturbance or for other reasons, these voltages are exceeded a suitable presale
(10:1) must be used.
Replace a defective fuse only with a fuse of the original rating. Never short-circuit fuse or fuse holding.
Disconnect test leads or probe from the measuring circuit before switching modes or functions.
Check test leads and probes for faulty insulation or bare wires before connection to the equipment.
Conduct measuring works only in dry clothing and rubber shoes, i. e. on isolating mats.
Never touch the tips of the test leads or probe.
Comply with the warning labels and other info on the equipment.
The measurement instrument is not to be to operated unattended.
Always start with the highest measuring range when measuring unknown values.
Do not subject the equipment to direct sunlight or extreme temperatures, humidity or dampness.
Do not subject the equipment to shocks or strong vibrations.
Keep hot soldering irons or guns away from the equipment.
Allow the equipment to stabilize at room temperature before taking up measurement (important for
exact measurements).
Do not input values over the maximum range of each measurement to avoid damages of the
instrument.
Use caution when working with voltages above 35V DC or 25V AC. These Voltages pose shock
hazard.
-118-
Page 3

Warning:
To avoid fire or electrical shock, when the oscilloscope input signal connected is more than 42V peak
(30Vrms) or on circuits of more than 4800VA, please take note of below items:
- Only use accessory insulated voltage probes and test lead.
- Check the accessories such as probe before use and replace it if there are any damages.
- Remove probes, test leads and other accessories immediately after use.
- Remove USB cable which connects oscilloscope and computer.
- Do not apply input voltages above the rating of the instrument because the probe tip voltage will
directly transmit to the oscilloscope. Use with caution when the probe is set as 1:1.
- Do not use exposed metal BNC or banana plug connectors.
- Do not insert metal objects into connectors.
Periodically wipe the cabinet with a damp cloth and mid detergent. Do not use abrasives or solvents.
The meter is suitable for indoor use only
Do not store the meter in a place of explosive, inflammable substances.
Opening the equipment and service – and repair work must only be performed by qualified service
personnel
Do not place the equipment face-down on any table or work bench to prevent damaging the controls
at the front.
Do not modify the equipment in any way.
Measuring instruments don’t belong to children hands.
Cleaning the cabinet
Prior to cleaning the cabinet, withdraw the mains plug from the power outlet.
Clean only with a damp, soft cloth and a commercially available mild household cleanser. Ensure that no water
gets inside the equipment to prevent possible shorts and damage to the equipment.
-119-
Page 4
2. Safety Terms and Symbols
The following terms may appear in this manual:
Warning.
A warning statement indicates the conditions and actions which may endanger the life safety.
Note.
A note statement indicates the conditions and actions which may cause damage to this product or
other property.
The following terms may appear on this product:
Danger:
It indicates that there may be an immediate injury to you when you encounter this mark.
Warning:
It indicates that there may not be an immediate injury to you when you encounter this mark.
Note:
It indicates that there may be damage to this product or other property.
Symbols on the product. The following symbol may appear on the products:
High Voltage
Please Consult the
Manual
Protective Ground
End
Earth End on the
Shell
Grounding End for
Measurement
To avoid body damage and prevent product and connected equipment dam. This product can only be used in
the specified applications. Carefully read the following safety information before using the test tool.
Warning:
The channels of the oscilloscope are non-isolated electrically. The channels should adopt common basis
during measuring. To prevent short circuits, the probe ground must not be connected to different non-isolated
DC level.
Warning:
The channels should adopt common basis during measuring. To prevent short circuits, the probe ground must
not be connected to different non-isolated DC level.
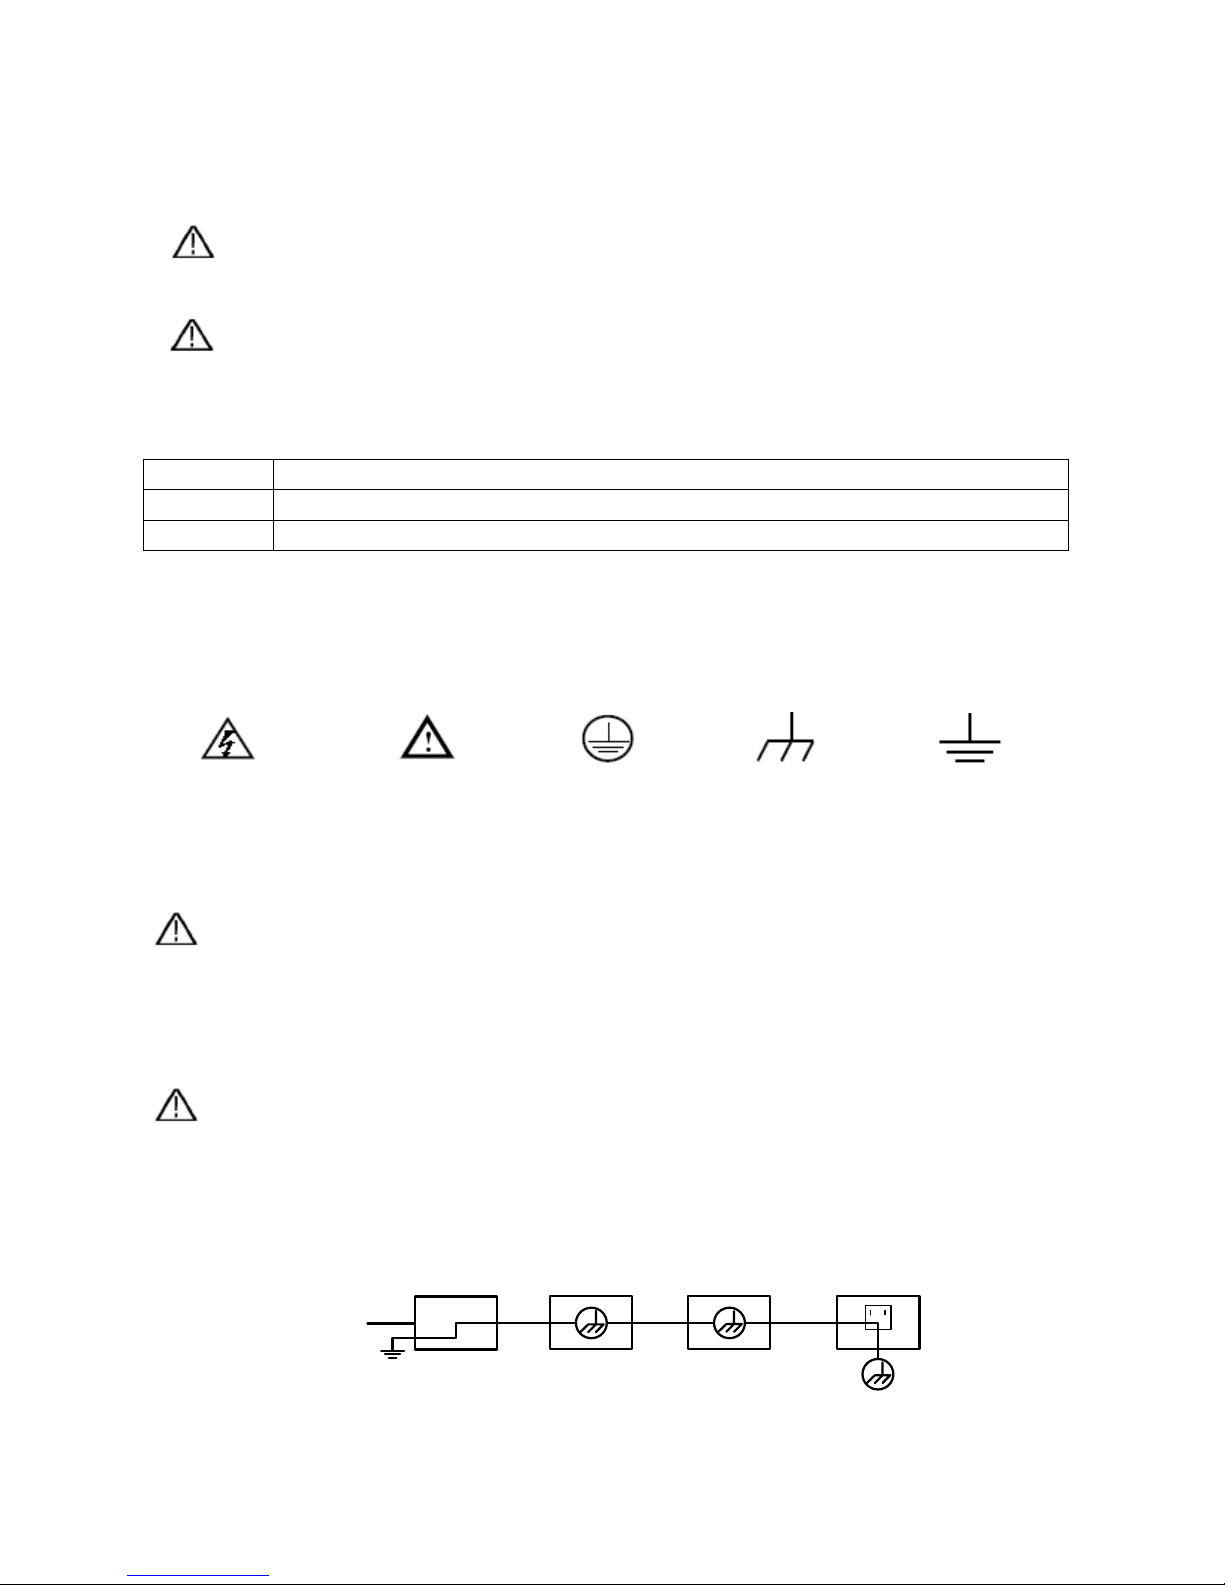
The diagram of the oscilloscope ground wire connection:
Ground Clip
Signal Input
Electrical Outlet
Probe
Oscilloscope AC Adapter
-120-
Page 5

3. General Characteristics of the PeakTech® 1190 / 1230 Oscilloscopes
3.1. Digital Storage Oscilloscope
* With the bandwidth of 100 MHz (P 1190) / 200 MHz (P 1230)
* Sample Rate 500 MSa/s (P 1190) / 1 GSa/s (P 1230)
* Record length for each channel of 2 Mpoints
* Reading-out with the cursor
* Twenty automatic measurement functions
* Autoscale function
* Color liquid crystal display of high resolution and high contrast with adjustable back light
* Storage and call-out of waveforms
* Automatic setting function provided capable of fast setting
* Multiple-waveform calculation function
* Built-in FFT function
* Implementation of detecting the average and peak values of the waveform
* Digital real-time oscilloscope
* Edge, video; pulse, slope and alternate triggering function
* USB communication ports
* Different continuous displaying time
* Multiple Language User Interface (English, German, Chinese)
3.2. Logic Analyzer
* With the bandwidth of 100MHz (P1190) or 200MHz (P1230)
* 16 input channel
* 20Sa/s up to 1GSa/s sampling rate for each channel
* 4 M max Storage for each channel
* Plenty of trigger Mode
* Convenient data measurement & data search
* Freely setting of all kinds of threshold level
-121-
Page 6

4. Introduction to the Front Panel and the User's Interface
When you get a new-type oscilloscope, you should get acquainted with its front panel at first and the
PeakTech® digital storage oscilloscope is no exception. This chapter makes a simple description of the
operation and function of the front panel of the PeakTech® oscilloscope, enabling you to be familiar with the
use of the PeakTech® oscilloscope in the shortest time. The PeakTech® oscilloscope offers a simple front
panel with distinct functions to users for their completing some basic operations, in which the knobs and
function pushbuttons are included. The knobs have the functions similar to other oscilloscopes. The 5 buttons
in the column on the right side of the display screen are menu selection buttons (defined as F1 to F5 from top
to bottom respectively), through which, you can set the different options for the current menu. The other
pushbuttons are function buttons, through which, you can enter different function menus or obtain a specific
function application directly.
4.1. Front panel
Fig. 1 Front panel overview
1. Power on/off
2. Display area
3. Control (key and knob) area
4. USB slot
5. Logic Analyzer signal input
6. Oscilloscope signal input
7. Measurement signal output
8. Power and charging indication: Green light indicates AC supply and battery full charged; yellow light
indicates under charging
-122-
1.
2.
3.
4.
5.
6.
7.
8.
8
4
5 7 1 2 3
Page 7

4.2. Control area (key and knob)
Fig. 2 Keys Overview
1. Menu option setting: F1~F5
2. Switch
Switch includes two keys and one knob. Press “OSC/LA” to switch between Oscilloscope and Logic
Analyzer.
For Oscilloscope “cursor” knob and “info” key are idle. But the “cursor” knob takes effect in magnifying or
minificating the waveform after FFT operation when the mode is FFT.
For Logic Analyzer, “cursor” knob to adjust current cursor position and “info” key to loading setting info for
acquired waveform and current waveform.
3. Function key area
For Oscilloscope 0~5 keys are idle and 6~F refer to different Oscilloscope function menu.
For LA, 3.4.5.6.7 refers to figure and other keys refer to digit or function menu.
4. Vertical control area
It’s including 3 keys and 4 knobs.
For Oscilloscope: “CH1 menu” and “CH2 menu” correspond to setting menu in CH1 and CH2, “Wave Math”
key refer to math menu, the math menu consists of six kinds of operations, including CH1-CH2, CH2-CH1,
CH1+CH2, CH1*CH2, CH1/CH2 and FFT .Two “Vertical position” knob control the vertical position of CH1.
CH2, and two “Volts/Div” knob control voltage scale of CH1, CH2.
For Logic Analyzer, “CH1 menu”, “CH2 menu”, “Wave math” keys and “CH2 Volts/Div” knob are idle. “CH1
Vertical”, “CH2 Vertical” to adjust the M1, M2 position in Cursor menu when cursor display is on “CH1
Volts/Div”.
-123-
Page 8

5. Horizontal control area with 2 knobs and 1 key.
For Oscilloscope, “Horizontal position” knob control trigger position, “Volts/Div” control time base,
“Horizontal
menu” key refer to horizontal system setting menu.
For Logic Analyzer, “Horizontal menu” key is idle. “Horizontal position” knob to adjust the position of value
displayed currently quickly. “Sec/Div” knob to adjust value resolution displayed currently.
6. Trigger control area with 4 keys and 1 knob.
For Oscilloscope, “Trig adjust” knob is to adjust trigger voltage. Other four keys refer to trigger system
setting.
For Logic Analyzer “Force trig” key is idle. “Trig menu” refer to trigger menu control. “Trig adjust” knob to
adjust trigger position in memory, “SET 50%” is to set trigger position as 50% and “SET Zero” set trigger
position as 0.
4.3. User interface introduction
Fig. 3 Illustrative Drawing of Display Interfaces
1. The Trigger State indicates the following information:
Auto: The oscilloscope is under the Automatic mode and is collecting the waveform under the
non-trigger state.
Trig' d: The oscilloscope has already detected a trigger signal and is collecting the after-triggering
information.
Ready: All pre-triggered data have been captured and the oscilloscope has been already ready for
accepting a trigger.
Scan: The oscilloscope captures and displays the waveform data continuously in the scan mode.
Stop: The oscilloscope has already stopped the waveform data acquisition.
-124-
Page 9

2. Waveform Viewing Area.
3. The purple pointer indicates the horizontal trigger position, which can be adjusted by the horizontal
position control knob.
4. The pointer indicates the trigger position in the internal memory.
5. This reading shows the time deviation between the horizontal trigger position and the window centre l
ine, which is regarded as 0 in the window center.
6. It indicates the current function menu.
7. It indicates the operation options for the current function menu, which changes with the function menus.
8. The purple pointer shows the trigger level position.
9. The reading shows the trigger level value.
10. The reading shows the trigger source.
11. It shows the selected trigger type:
Rising edge triggering
Falling edge triggering
Video line synchronous triggering
Video field synchronous triggering
12. The reading shows the window time base set value.
13. The reading shows the main time base set value.
14. The two yellow dotted lines indicate the size of the viewing expanded window.
15. The icon shows the coupling mode of the CH2 channel.
“—” indicates the direct current coupling
“ ~ ” indicates the AC coupling
“ Ground” indicates GND coupling.
16. The reading shows the vertical scale factor (the Voltage Division) of the CH2 channel.
17. The icon indicates the coupling mode of the CH1 channel:
The icon "–" indicates the direct current coupling
The icon " ~ " indicates the AC coupling
The icon "Ground” indicates GND coupling.
18. The reading indicates the vertical scale factor (the Voltage Division) of the CH1 channel.
19. The information shows the zero point positions of CH1 or CH2 channel.
20. The yellow pointer shows the grounding datum point (zero point position) of the waveform of the CH2
channel. If the pointer is not displayed, it shows that this channel is not opened.
21. The red pointer indicates the grounding datum point (zero point position) of the waveform of the CH1
channel. If the pointer is not displayed, it shows that the channel is not opened.
22. The positions of two purple dotted line cursors measurements.
23. The reading shows the frequence of the two channels. It is a 6 digits cymometer.Its measurement range
of frequency is 2Hz to full bandwidth. when the triggering mode is edge triggering,it is a one channel
cymometer and it can only measure the frequency of the tiggering channel. When the triggering mode is
alternating triggering,it is a two channel cymometer and it can measure the frequency of two channels.
-125-
Page 10
5. How to implement the Function Inspection
Make a fast function check to verify the normal operation of the instrument, according to the following steps:
1. Connect the Instrument to the Power and Push down the Power Switch Button.
The instrument carries out all self-check items and shows the prompt “Press any Key Enter system”.
Press the “8 (UTILITY)” button to get access to the “FUNCTION” menu and push down F2 the menu
selection button to call out the function “Recall Factory”. The default attenuation coefficient set value of
the probe in the menu is 10X,
2. Set the Switch in the Oscilloscope Probe as 10X and Connect the Oscilloscope with CH1 Channel.
Align the slot in the probe with the plug in the CH1 connector BNC, and then tighten the probe with
rotating it to the right side.
Connect the probe tip and the ground clamp to the connector of the probe compensator.
3. Press the “7(AUTOSET)” Button.
The square wave of 1 KHz frequency and 5Vpp value will be displayed in several seconds (see Fig.4).
Fig. 4 Auto set
Check CH2 by repeating Step 2 and Step 3.
-126-
Page 11

6. How to Implement the Probe Compensation
When connect the probe with any input channel for the first time, make this adjustment to match the probe with
the input channel. The probe which is not compensated or presents a compensation deviation will result in the
measuring error or mistake. For adjusting the probe compensation, please carry out the following steps:
1. Set the attenuation coefficient of the probe in the menu as 10X and that of the switch in the probe as 10X,
and connect the oscilloscope probe with the CH1 channel. If a probe hook tip is used, ensure that it keeps
in close touch with the probe. Connect the probe tip with the signal connector of the probe compensator
and connect the reference wire clamp with the ground wire connector of the probe connector, and then
press the button “7(AUTOSET)”.
2. Check the displayed wave forms and regulate the probe till a correct compensation is achieved (see Fig.5
and Fig. 5).
Fig. 5 Displayed Wave Forms of the Probe Compensation
3. Repeat the steps mentioned if necessary.
Fig. 6 Adjust Probe
-127-
Page 12
7. How to Set the Probe Attenuation Coefficient
The probe has several attenuation coefficients, which will influence the vertical scale factor of the oscilloscope.
If it is required to change (check) the set value of the probe attenuation coefficient, press the function menu
button of the channels used, then push down the selection button corresponding to the probe till the correct set
value is shown.
This setting will be valid all the time before it is changed again.
Note: The attenuation coefficient of the probe in the menu is preset to 10X when the oscilloscope
is delivered from the factory.
Make sure that the set value of the attenuation switch in the probe is the same as the menu selection of the
probe in the oscilloscope.
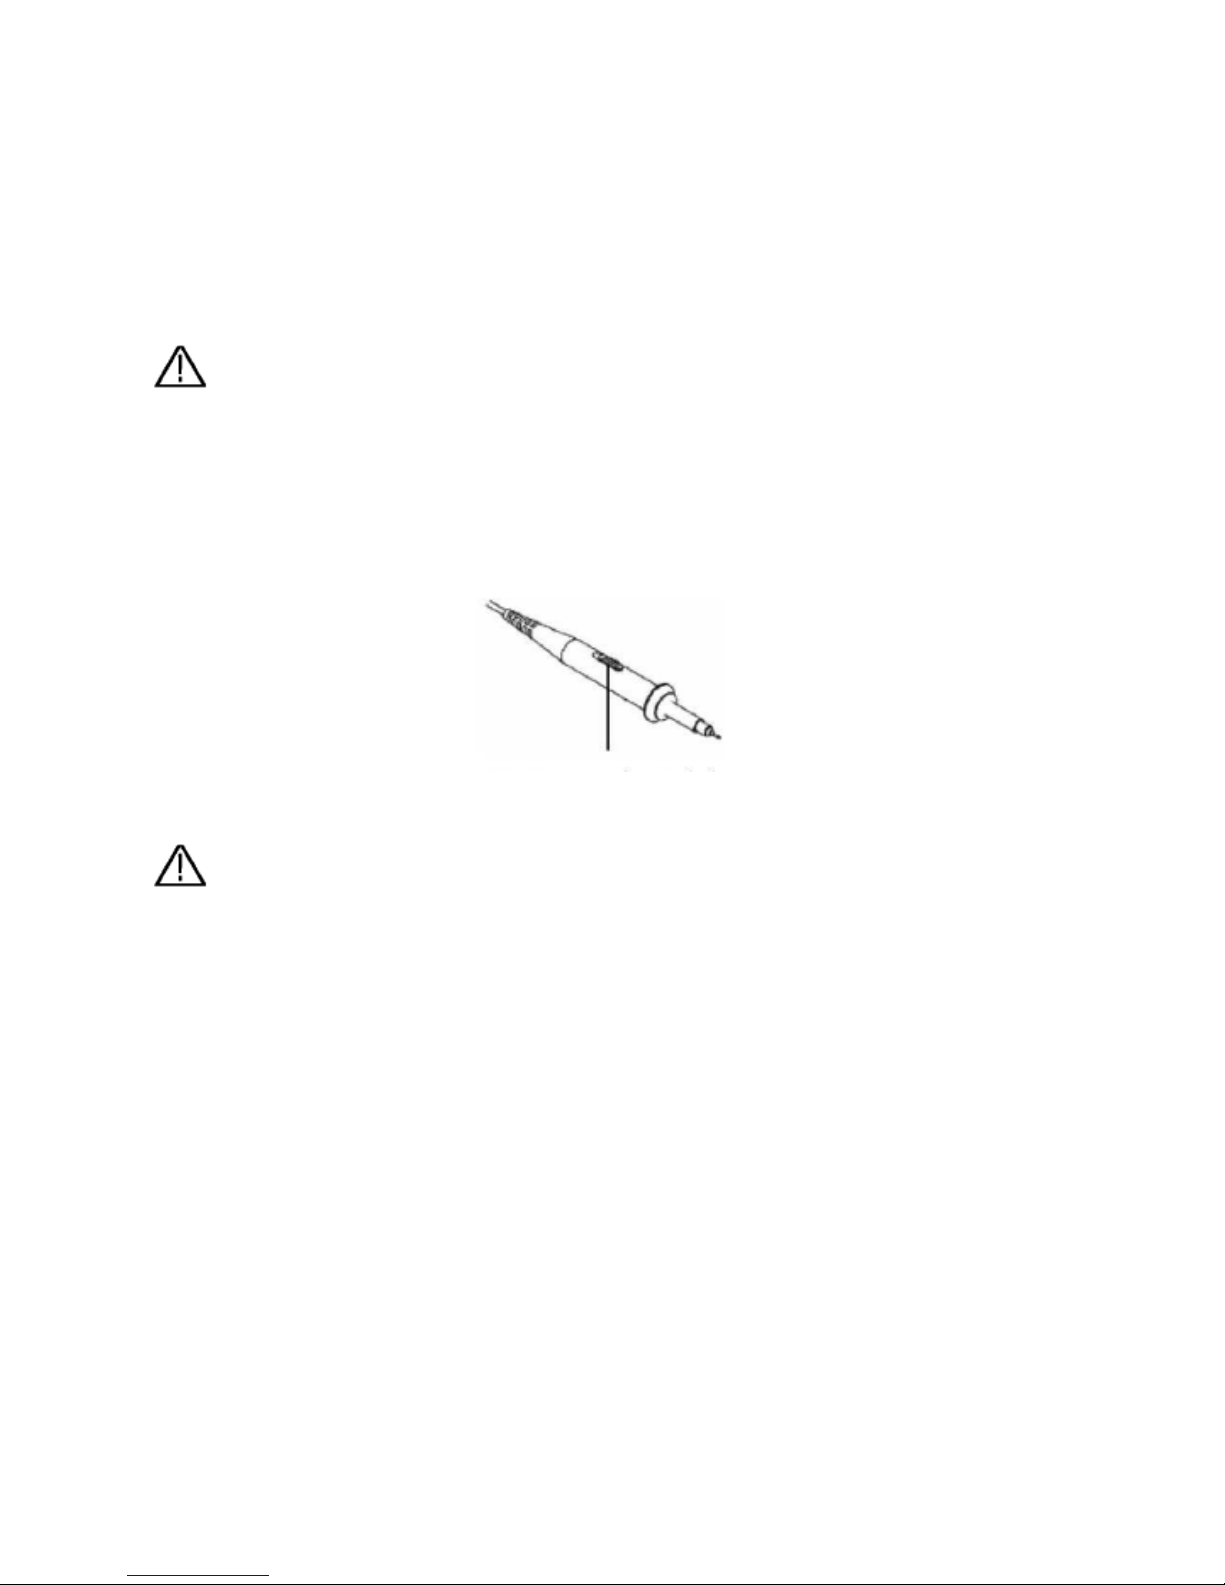
The set values of the probe switch are 1X and 10X (see Fig. 7).
Fig. 7 Attenuation Switch
Note: When the attenuation switch is set to 1X, the probe will limit the bandwidth of the
oscilloscope in 5MHz. If it is needed to use the whole bandwidth of the oscilloscope, the
switch must be set to 10X.
8. How to Implement Auto-calibration
The auto-calibration application can make the oscilloscope reach the optimum condition rapidly to obtain the
most accurate measurement value. You can carry out this application program at any time, but when the range
of variation of the ambient temperature is up to or over 5°C, this program must be executed.
For the performing of the self-calibration, all probes or wires should be disconnected with the input connector
first. Then, press the “8 (UTILITY)” button to call out the FUNCTION menu; push down the F3 menu selection
button to choose the option “Auto calibration”; finally, run the program after confirming that everything is ready
now.
-128-
Page 13
9. Introduction to the Vertical System
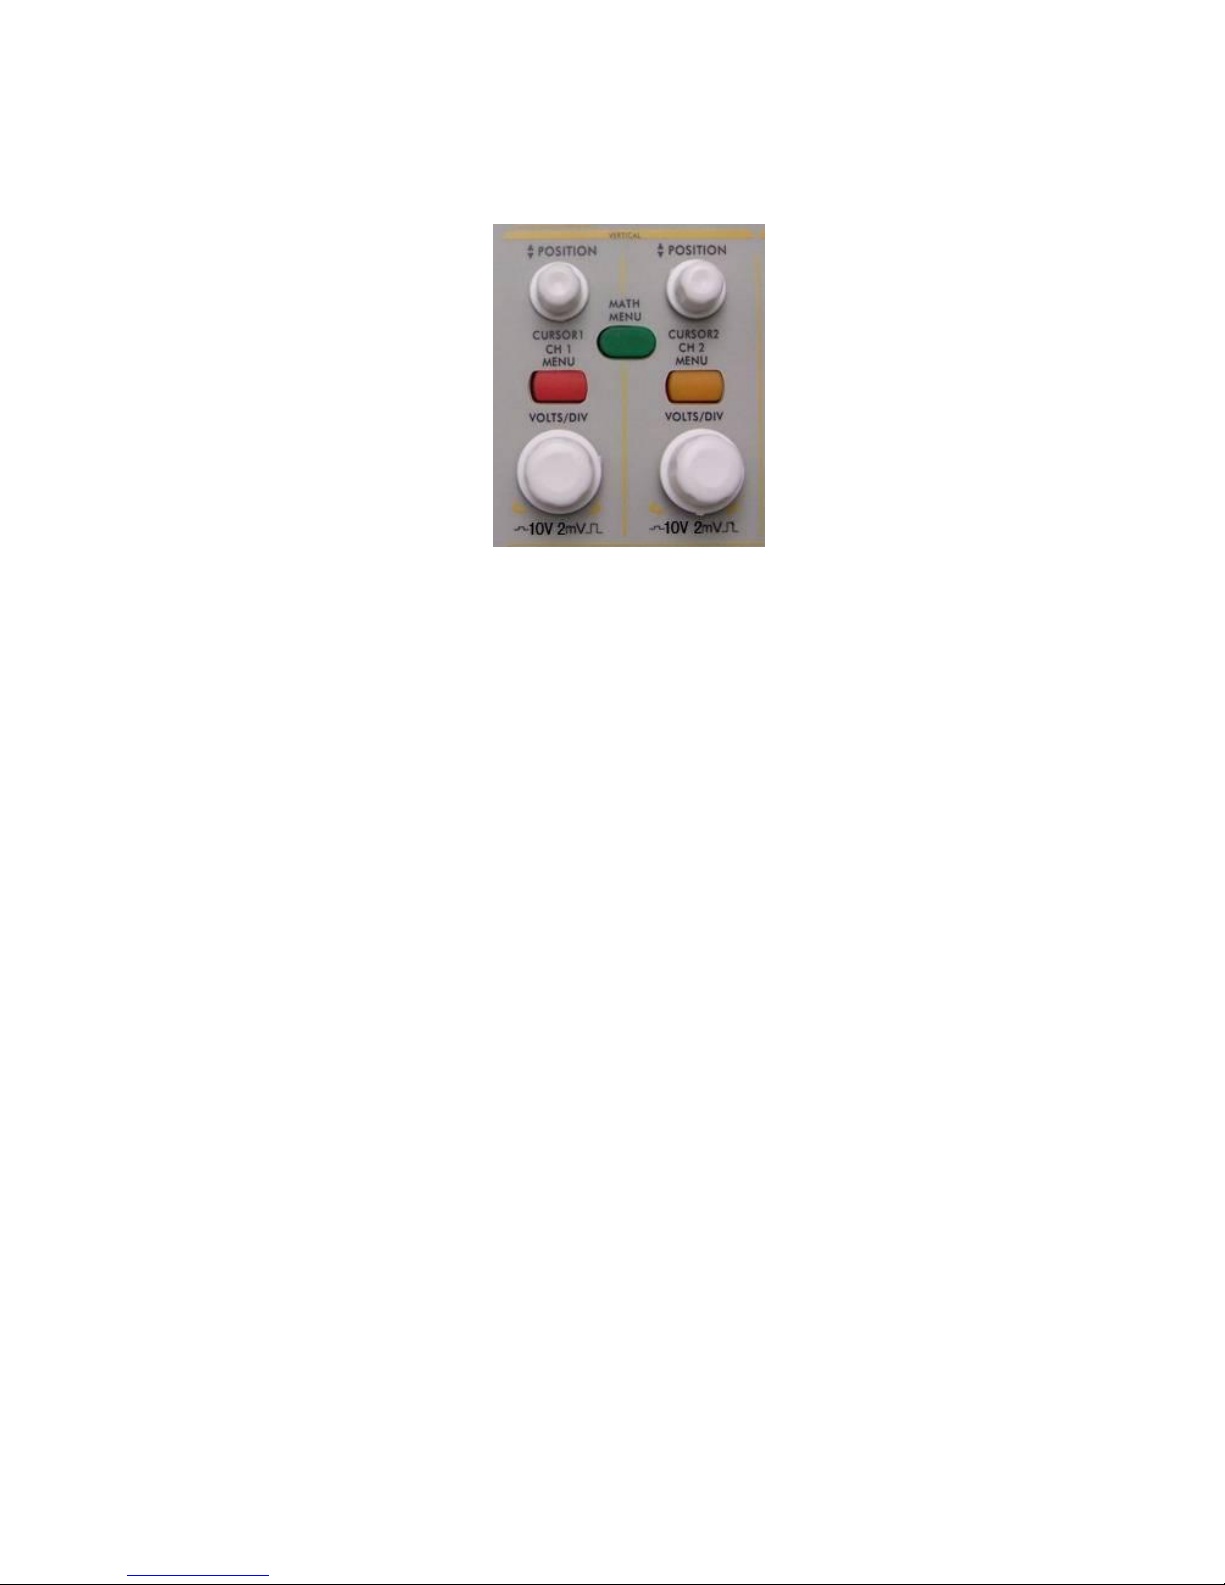
Shown as Fig. 8, there are a series of buttons and knobs in VERTICAL CONTROLS. The following practices
will gradually direct you to be familiar with the using of the vertical setting.
Fig. 8 Vertical Control Zone
1. Use the button “VERTICAL POSITION” knob to show the signal in the center of the waveform
window. The “VERTICAL POSITION” knob functions the regulating of the vertical display
position of the signal. Thus, when the “VERTICAL POSITION” knob is rotated, the pointer of the
earth datum point of the channel is directed to move up and down following the wave form.
Measuring Skill
If the channel is under the DC coupling mode, you can rapidly measure the DC component of the signal
through the observation of the difference between the wave form and the signal ground.
If the channel is under the AC mode, the DC component will be removed by filtration. This mode helps
you display the AC component of the signal with a higher sensitivity.
2. Change the Vertical Setting and Observe the Consequent State Information Change.
With the information displayed in the status bar at the bottom of the waveform window, you can determine
any changes in the channel vertical scale factor.
* Rotate the vertical “VOLTS/DIV” knob and change the “Vertical Scale Factor (Voltage Division)”, it can
be found that the scale factor of the channel corresponding to the status bar has been changed
accordingly.
* Press buttons of “CH1 MENU”, “CH2 MENU” and “MATH MENU”, the operation menu, symbols, wave
forms and scale factor status information of the corresponding channel will be displayed in the screen.
-129-
Page 14

10. Introduction to the Horizontal System
Shown as Fig. 9, there are a button and two knobs in the “HORIZONTAL CONTROLS”. The following
practices will gradually direct you to be familiar with the setting of horizontal time base.
Fig. 9 Horizontal Control Zone
1. Use the horizontal “SEC/DIV” knob to change the horizontal time base setting and observe the
consequent status information change. Rotate the horizontal “SEC/DIV” knob to change the horizontal
time base, and it can be found that the “Horizontal Time Base” display in the status bar changes
accordingly. The horizontal scanning speed steps from 2ns up to 100s in the sequence of 1-2-5.
2. Use the “HORIZONTAL POSITION” knob to adjust the horizontal position of the signal in the waveform
window. The “HORIZONTAL POSITION” knob is used to control the triggering displacement of the signal
or for other special applications. If it is applied to triggering the displacement, it can be observed that the
wave form moves horizontally with the knob when you rotate the “Horizontal Position” knob.
3. With the “HORIZ MENU” button pushed down, you can set and initiate the Window Expansion.
-130-
Page 15

11. Introduction to the Trigger System
Shown as Fig.10, there are a knob and four buttons in the “TRIGGER CONTROLS”. The following practices
will direct you to be familiar with the setting of the trigger system gradually.
Fig. 10 Trigger Control Zone
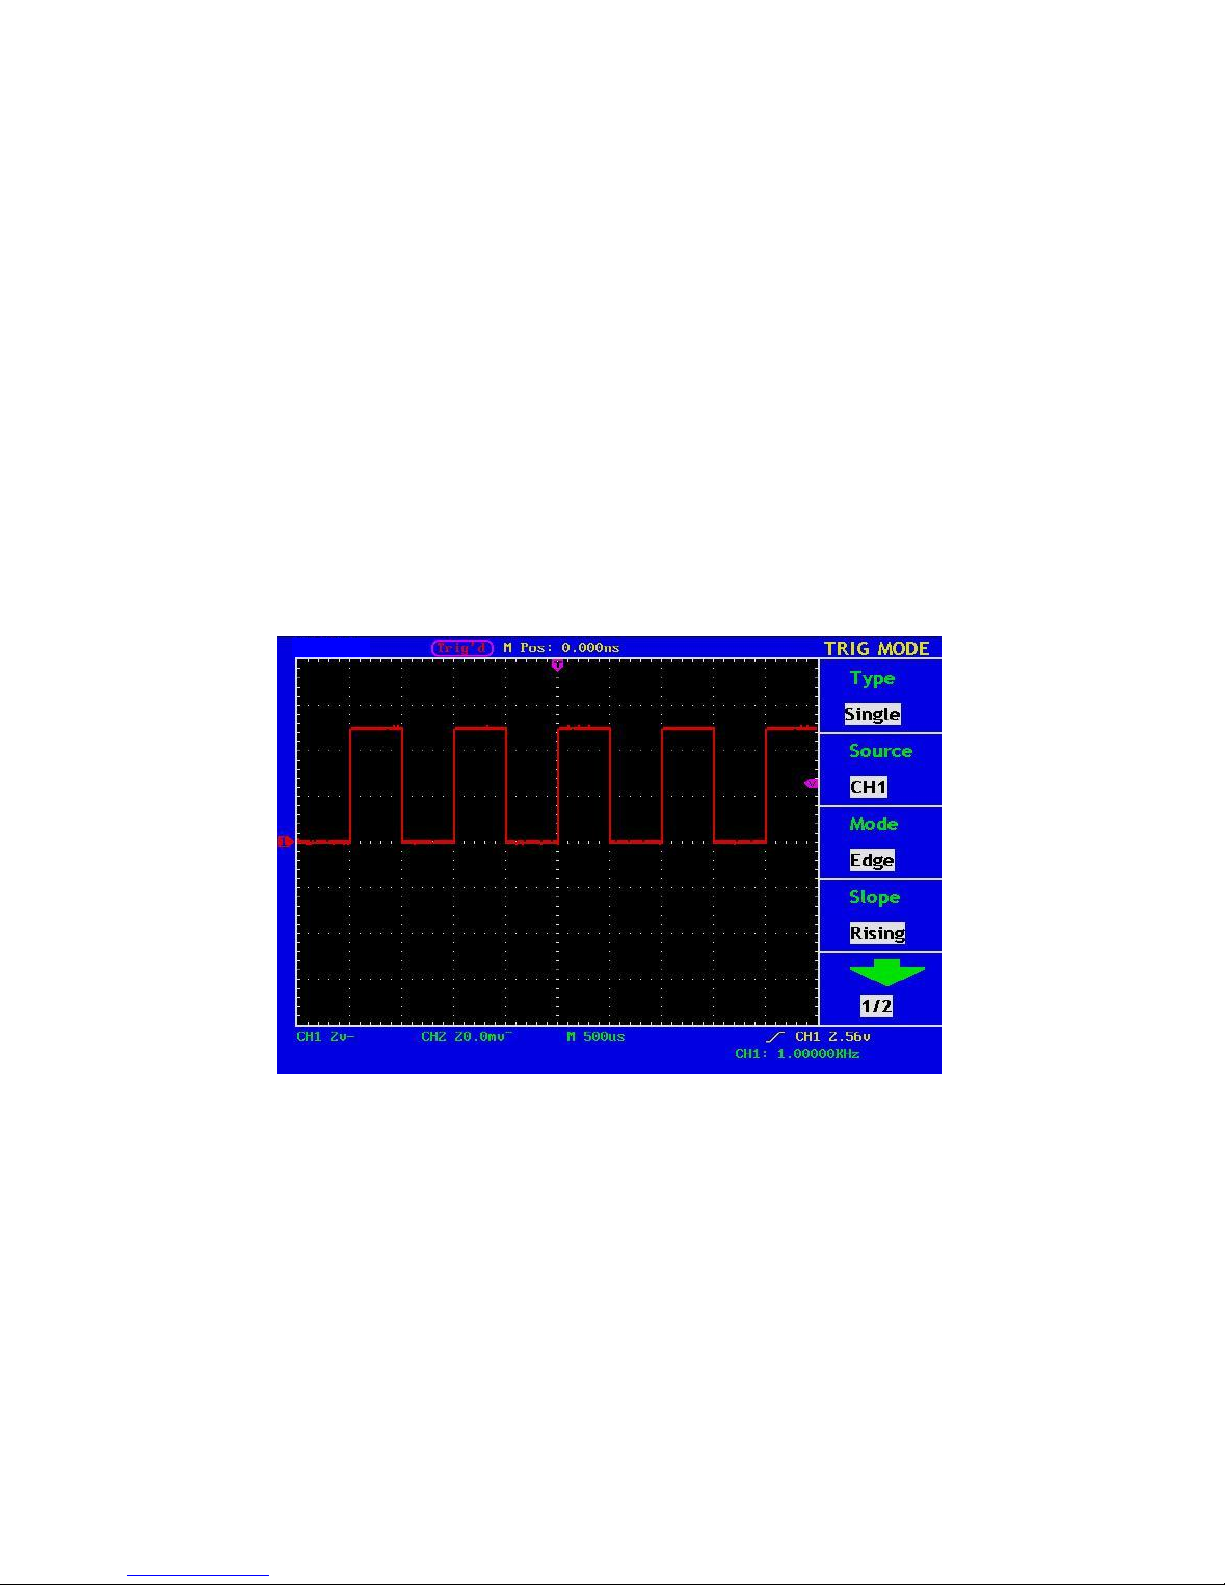
1. Press the “TRIG MENU” button and call out the trigger menu. With the operations of the 5 menu selection
buttons, the trigger setting can be changed.
2. Use the “LEVEL” knob to change the trigger level setting.
With the rotation of the “LEVEL” knob, it can found that the trigger indicator in the screen will move up
and down with the rotation of the knob. With the movement of the trigger indicator, it can be observed that
the trigger level value displayed in the screen changes.
3. Press the button “SET TO 50%” to set the trigger level as the vertical midpoint values of the amplitude of
the trigger signal.
4. Press the “FORCE TRIG” button to force a trigger signal, which is mainly applied to the “Normal" and
"Single” trigger modes.
5. The “SET TO ZERO” button is used to reset the trigger horizontal position.
-131-
Page 16

12. Logic Analyzer
Logic Analyzer input connection
Insert the plug of OL-16 Logic Analyzer module 50P into the Logic Analyzer signal input on front panel and fix
two screws. Then 16 channel clamp of OL-16 Logic Analyzer connect to target signal and ready for
measurement
13. User interface introduction of Logic-Analyzer
Fig.11 User interface of logic analyzer
1. Channel and Bus indicate: display current working channel and bus.
2. Channel binary value display: display binary system value for the channel position in current cursor.
3. Battery powers indicate: indicate battery power when battery inside.
4. Decimal system value indicates the position of current cursor in storage area.
5. Yellow dashed line indicates current cursor.
6. Blue dashed line indicates current trigger position.
7. Percentage value indicates current trigger position in storage area.
8. Sample data area indication: red for bus, blue and green for “0”, “1” in each channel data.
9. Decimal system value indicate the position of current cursor relate to current trigger.
10. Operation options indicate current function menu and different function menu have different display.
-132-
Page 17

11. Sample status indicate: “RUN” for sampling and wait for trigger, “TRIG” for trigger detected and wait
for sample finished. “STOP” for sampling finished.
12. Value indicate current time base.
13. Info windows: different operation display different info.
14. Value display current filter modulus setting.
15. Value display current sample rate setting.
16. Two purple lines for cursor 1 and cursor 2 in cursor measurement
17. Percentage value indicates trigger position for next sampling in storage area.
18. Red square indicates the current sampling data position in storage area.
19. Red scale line indicates the time base width in sampling data display area and totally 4.8 divisions. The
width between two long scale lines is 1 division and between short scale lines are 0.1 divisions.
14. How to acquire data
When you start to acquire LA begins sampling data from the probes. Then each time clock occurs the data will
be sampled.
Then sampled data is sent to trigger function block and store in main memory. The trigger program checks
specific events with the sampled data and take specific action. The trigger program can check events as rising
edge, data values, and data ranges etc. LA module enables a post trigger delay counter when trigger reach
specified value and to allow post trigger portion of the acquisition memory to fill before data acquisition stops.
Press “F” to get into data acquisition mode after finish setting for trigger and sampling. Then running status
display as “RUN” and running status display “TRIG” when detected trigger signal and display “STOP” when
data acquisition finished. Then you can start to analyze data. Data acquisition can be stopped by press “F”
again during the process.
Note:
When running status display as “RUN”, “TRIG” during data acquiring process, only "F" key
for operate and other keys or knobs are idle. Only till status display as "STOP" then others
operations are working.
-133-
Page 18

15. How to observe and analyze the data
Follow up below steps to observe and analyze the current data acquired:
1. Turn “Sec/Div” knob to adjust the time length for data display in each division (to adjust the data
resolution displayed).
2. Turn “Cursor” knob to observe more details for the data of current cursor position. The data of binary
value for current cursor position display in binary system area and power on measure menu then bus
value for current cursor position will display in measurement window.
3. Turn “horizontal position” knob can move the current displayed data to left/right position in storage area
quickly.
We will use a simple measurement example to explain the primary setting for LA measurement.
We need to measure a three lines SPI signal, three signals are enable, clock and data. Clock is in effect when
enable is low clock data, and clock frequency is 1M, data width is 32 digits, every clock corresponds to one
data. Signal voltage is 3.3V.
16. Display systems
We need only three channels as what we measure is 3 signals. And other channel and bus can be off. In this
way the display resolution in using channel will be increased.
Display system mainly to set on/off for measure channel. We use CH00, CH01, CH02 as measure channel
correspond to signal enable, clock, data accordingly. Other channel and bus is off.
1. Press “A(DISPLAY)” and display menu appears.
2. Press “F1” till signal sources display as “Channel”
3. Press “F2” or turn “CH1 Volts/Div” knob till channel No. display as “CH00”.
4. Press “F3” and set the signal sources as “ON”. Repeat operation of steps 3.4 and set CH01, CH02
as “ON” and CH03-CHOF as “OFF”. Refer to Fig. 13.
5. Press “F1” till sources display as “BUS”.
6. Press “F2” till Bus No. display as “BUS0”
7. Press “F3” and set signal sources as “OFF”. Repeat operation of steps 6.7 and set BUS1, BUS2, BUS3
all as “OFF”. Ref to Fig. 14.
Now display panel only show CH00, CH01, CH02 and others channel and bus are all off. Ref to Fig. 12
-134-
Page 19

Fig. 12
Fig. 13
-135-
Page 20

Fig. 14
17. Trigger system
Logic Analyzer is same as Oscilloscope and need to make trigger to synchronize data. The trigger system
mainly to set trigger sources, trigger mode and trigger position.
We make CH00 as trigger source and trigger mode as falling edge, trigger position in 50%. Trigger system
setting steps as below:
1. Press “Trig menu” and menu appears.
2. Press “F1” till trigger mode display as “Edge”.
3. Press “F2” or turn “CH1 Volts/Div” till trigger sources display as “CH00”.
4. Press “F3” till trigger type display as “Falling”.
5. Turn “Trigger adjust” knob or press “SET 50%”till “NEXT T POS” window display as “50%”.
Then trigger system setting finished (ref to Fig. 15).
Fig. 15
-136-
Page 21

18. Threshold voltage system
Threshold voltage system is to set high/low of the trigger voltage. The system already fixed the setting for
normal logic voltage as CMOS, LVMOS etc. And you can set any trigger voltage using custom setting.
The signal voltage is 3.3V and we set threshold voltage as “LVCMO3.3/1.7V” as below steps:
1. Press “1 (Threshold)” key and the menu appears.
2. Press “F1” key till Channel display as “CH00 ~ CH03”
3. Press “F2” key till threshold display as “LVCMOS3.3/1.7V”.
Then the threshold setting is finished (ref to Fig. 16).
Fig. 16
-137-
Page 22

19. Sampling system
The waveform accuracy reverts from sample data depend on sample rate for measured signals. The
waveform reverted in Logic Analyzer is referring to the sample signals storage in the memory. The recorded
data will display in error if the sample rate is too lower. Below figures explains how sample rate influence the
waveform recorded in Logic Analyzer.
Fig. 17
There is an importance compromise between recorded signal resolution and its continuance (relate to time).
The sample memory depth of the Logic Analyzer is fixed and once adding sample rate then resolution will get
better accordingly. But it will decrease the continuance for acquire signal. In a word, sample rate are quicker
than the continuance for recorded signal will get smaller but with better resolution.
Sampling system can set difference sample rate and storage depth.
We use 10 times sampling rate to measure the signal clock frequency of 1M. and storage depth set as
“Normal”. Sampling system setting steps as below:
1. Press “E(ACQUIRE)” and menu appears.
2. Press “F1” or turn “CH1 Volts/div” knob till sample rate setting display as“10M”.
3. Press “F2” till storage depth display as “General”.
Sampling system setting finished (ref to the fig. 18)
-138-
Page 23

Then press “F” and start to sampling data. Display show as fig. 18 when sampling finished.
Fig. 18
20. How to Set the Vertical System
The VERTICAL CONTROLS includes three menu buttons such as CH1 MENU, CH2 MENU and MATH
MENU, and four knobs such as VERTICAL POSITION, VOLTS/DIV (one group for each of the two channels).
Setting of CH1 and CH2
Every channel has an independent vertical menu and each item is set respectively based on the channel.
With the “CH1 MENU” or “CH2 MENU” menu button pushed down, the system shows the operation menu of
the corresponding channel (see Fig. 19).
Fig. 19 Channel Setting Menu
-139-
Page 24

The description of the Channel Menu is shown as the following list:
Function Menu
Setting
Description
Coupling
AC
DC
GROUND
Block the DC component in the input signal.
Unblock the AC and DC components in the input signal.
The Input signal is interrupted.
Band Limit
OFF 100 MHz
ON 20 MHz
Get full bandwidth.
Limits the channel bandwidth to 20MHz to reduce display noise.
Channel
OFF
ON
Close the measurement channel.
Open the measuring channel.
Probe
1X
10X
100X
1000X
Choose one according to the probe attenuation factor to make the
vertical scale reading accurate.
Inverted
OFF
ON
The wave form is displayed normally.
Initiate the wave form inverted function.
1. Setting Channel Coupling
Taking the Channel 1 for example, the measured signal is a square wave signal containing the direct
current bias. The operation steps are shown as below:
1. Press the CH1 MENU button and call out the CH1 SETUP menu.
2. Press the F1 menu selection button and select the Coupling item as “AC” to set the channel coupling
as ac mode, under which the direct current component in the signal will be blocked.
3. Then, press the F1 menu selection button again and select the Coupling item as “DC”, setting the
channel coupling as dc mode, under which both dc and ac components in the signal will be
unblocked.
The wave forms are shown as Fig. 20 and Fig. 21.
-130-
Fig. 20 AC Coupling Oscillogram
-140-
Page 25

Fig. 21 DC Coupling Oscillogram
2. Setting the“Band Limit”
Taking the Channel 1 for example, the operation steps are shown as below:
1. Press the CH1 MENU button and call out the CH1 SETUP menu.
2. Press the F2 menu selection button and select the Band Limit as OFF 200MHz, with Channel 1 Band
Limit switched off.
3. Press F2 menu selection button again, select the Band Limit as ON 20MHz, with Channel 1 Band
Limit is switched on.
3. Setting the Channel “ON/OFF”
Taking the Channel 1 for example, the operation steps are shown as below:
1. Press the CH1 MENU button and call out the CH1 SETUP menu.
2. Press the F3 menu selection button and select the Channel as OFF, with Channel 1 switched off.
3. Press F3 menu selection button again, select the channel as ON, with Channel 1 is switched on.
Note: In FFT mode, both CH1 and CH2 are not allowed to be ON when F3 is pressed. See Fig. 22.
Fig. 22 Channel CH1 is diable under FFT mode
-141-
Page 26

4. Regulate the Attenuation Ratio of the Probe
In order to match the attenuation coefficient of the probe, it is required to adjust the attenuation ration
coefficient of the probe through the operating menu of the Channel accordingly. If the attenuation
coefficient of the probe is 1:1, that of the oscilloscope input channel should also be set to 1X to avoid any
errors presented in the displayed scale factor information and the measured data.
Take the Channel 1 as an example, the attenuation coefficient of the probe is 10:1, the operation steps is
shown as follows:
1. Press the CH1 MENU button, access CH1 SETUP menu.
2. Press the F4 menu selection button and select 10X for the probe.
The Fig. 23 illustrates the setting and the vertical scale factor when the probe of the attenuation
coefficient of 10:1 is used.
Fig. 23 Regulation of the Attenuation Ratio of the Probe
List of the Attenuation Coefficient of Probes and the Corresponding Menu Settings.
Attenuation Coefficient of the Probe
Corresponding Menu Setting
1:1
1X
10:1
10X
100:1
100X
1000:1
1000X
-142-
Page 27

5. Setting of Wave Form Inverted
Wave form inverted: the displayed signal is turned 180 degrees against the phase of the earth potential.
Taking the Channel 1 for example, the operation steps are shown as follows:
1. Press the CH1 MENU button and get access to the CH1 SETUP menu.
2. Press the F5 menu selection button and select ON in the Inverted. The wave form inverted function
is initiated.
3. Press the F5 menu selection button again and select OFF for Inverted item. The function of wave
form inverted is closed off.
For the screen display, see Fig. 24 and Fig. 25.
Fig. 24 Wave Form not inverted
Fig. 25 Wave Form Inverted
-143-
Page 28
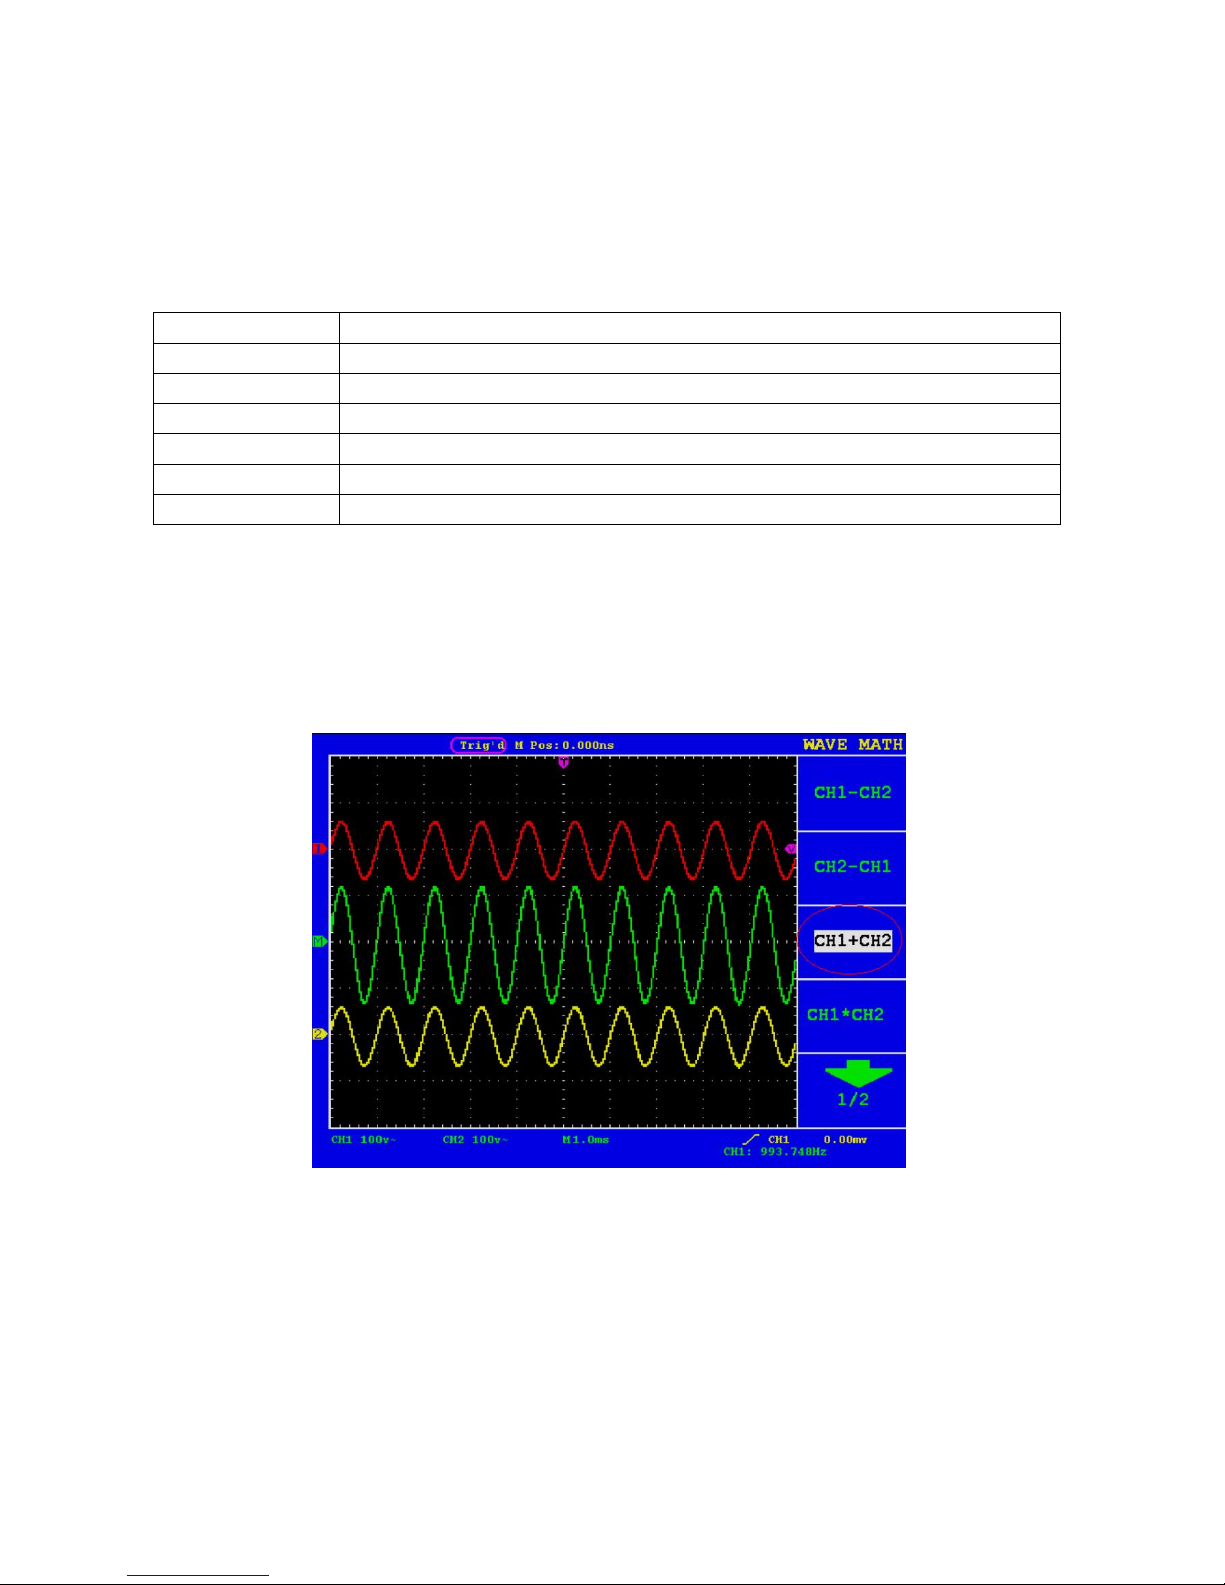
21. Implementation of Mathematical Manipulation Function
The Mathematical Manipulation function is used to show the results of the additive, multiplication, division,
subtraction and FFT operations between Channel 1 and Channel 2, and the FFT operation of CH1 or CH2.
The corresponding FCL (Functional Capabilities List) of the Wave Form Calculation
Setting
Description
CH1-CH2
Subtract the Channel 2 wave form from the Channel 1 wave form.
CH2-CH1
Subtract the Channel 1 wave form from the Channel 2 wave form.
CH1+CH2
Add the Channel 1 wave form to the Channel 2.
CH1*CH2
Multiply Channel 1 wave form by Channel 2 wave form.
CH1/CH2
Channel 1 wave form is divided by the Channel 2 wave form.
FFT
Waveform of Corresponding FFT operation.
Taking the additive operation between Channel 1 and Channels 2 for example, the operation steps are as
follows:
1. Press the MATH MENU button and call out the WAVE MATH menu.
2. Press the F3 menu selection button and choose CH1+CH2. The green calculated wave form M is
displayed in the screen; press the F3 menu selection button again, the wave form M is closed off
(see Fig.26).
Fig. 26 Wave Form resulted from CH1 +CH2 Mathematical Manipulation
-144-
Page 29

22. Using FFT function
An FFT breaks down signals into component frequencies, which the oscilloscope uses to display a graph of
the frequency domain of a signal, as opposed to the oscilloscope’s standard time domain graph. You can
match these frequencies with known system frequencies, such as system clocks, oscillators, or power
supplies.
FFT in this oscilloscope can transform 2048 points of the time-domain signal into its frequency components
and the final frequency contains 1024 points ranging from 0Hz to Nyquist frequency .
The following table describes the FFT menu:
Function Menu
Setting
Instruction
FFT
ON
OFF
Turn on FFT function.
Turn off FFT function.
Source
CH1
CH2
Select CH1 as FFT source.
Select CH2 as FFT source.
Window
Rectangle
Blackman
Hanning
Hamming
Select window for FFT.
Format
dB
Vrms
Select dB for Format.
Select Vrms for Format.
Zoom
*1
*2
*5
*10
Set multiple *1.
Set multiple *2.
Set multiple *5.
Set multiple *10.
Taking the FFT operation for example, the operation steps are as follows:
1. Press the MATH MENU button and call out the WAVE MATH menu.
2. Press F1 to turn on/off FFT after entering FFT menu, and please note that FFT is prohibited in Window
setting mode. The green waveform F is shown in the screen after calculation.
3. Press F2 selection button to switch over source channel CH1 and CH2.
4. Press F3 button to select WINDOW, including Rectangle, Hamming, Hanning and Blackman.
5. Press F4 to choose the Format as dB or Vrms.
6. Press F5 to zoom in or out the wave of the multiple including *1, *2, *5, *10.
7. Adjust the “Horizontal” knob in horizontal control zone to move the waveform and the shown frequency of
M Pos is the exact frequency of the cursor point in the middle of spectrum.
8. Turn off FFT and then press math menu button to go back to the second page of wave math.
-145-
Page 30

22.1. Selecting a FFT Window
The FFT feature provides four windows. Each one is a trade-off between frequency resolution and magnitude
accuracy. What you want to measure and your source signal characteristics help you to determine which
window to use. Use the following guidelines to select the best window.
Type
Description
Window
Rectangle
This is the best type of window for resolving frequencies that
are very close to the same value but worst for accurately
measuring the amplitude of those frequencies. It is the best
type for measuring the frequency spectrum of nonrespetitive
signals and measuring frequency components near DC.
Use rectangle for measuring transients or bursts where the
signal level before and after the event are nearly equal. Also,
use this window for equal-amplitude sine waves with
frequencies that are very close and for broadband random
noise with a relatively slow varying spectrum.
Hamming
This is a very good window for resolving frequencies that are
very close to the same value with somewhat improved
amplitude accuracy over the rectangle window. It has a slightly
better frequency resolution than the Hanning.
Use Hamming for measuring sine, periodic and narrow band
random noise. This window works on transients or bursts
where the signal levels before and after the event are
significantly different.
Hanning
This is a very good window for measuring amplitude accuracy
but less so for resolving frequencies.
Use Hanning for measuring sine, periodic, and narrow band
random noise. This window works on transients or bursts
where the signal levels before and after the event are
significantly different.
Blackman
This is the best window for measuring the amplitude of
frequencies but worst at resolving frequencies.
Use Blackman-Harris for measuring predominantly single
frequency waveforms to look for higher order harmonics.
-146-
Page 31

Fig.27, 28, 29, 30 show four kinds of window function referring to sine wave of 1KHz.
Fig. 27 Blackman window
Fig. 28 Hamming window
Fig. 29 Rectangle window
-147-
Page 32

Fig. 30 Hanning window
22.2. Quick Tips
* If desired, use the zoom feature to magnify the FFT waveform.
* Use the default dBV RMS scale to see a detailed view of multiple frequencies, even if they have very
different amplitudes. Use the linear RMS scale to see an overall view of how all frequencies compare to
each other.
* Signals that have a DC component or offset can cause incorrect FFT waveform component magnitude
values. To minimize the DC component, choose AC Coupling on the source signal.
* To reduce random noise and aliased components in repetitive or single-shot events, set the oscilloscope
acquisition mode to average.
22.3. Term interpretation
Nyquist frequency: The highest frequency that any Real Time Digital Oscilloscope can measure is exactly
half of the sampling rate under the condition of no mistakes, which is called Nyquist
frequency. If under-sampling occurs when the frequency sampled is higher than Nyquist
frequency, “False Wave” phenomenon will appear. So pay more attention to the relation
between the frequency being sampled and measured.
NOTE:
In FFT mode, the following settings are prohibited:
1. Window set;
2. change source channel (in CH1 Setup or CH2 Setup menu);
3. XY Format in DISPLAY SET;
4. “SET 50%” (the triggering level at the vertical point of signal amplitude) in Trigger setting;
5. Autoscale.
-148-
Page 33

23. Application of VERTICAL POSITION and VOLTS/DIV Knobs
1. The VERTIVAL POSITION knob is used to adjust the vertical positions of the wave forms of all Channels
(including those resulted from the mathematical operation).
The analytic resolution of this control knob changes with the vertical division.
2. The VOLTS/DIV knob is used to regulate the vertical resolution of the wave forms of all channels
(including those obtained from the mathematical manipulation), which can determine the sensitivity of the
vertical division with the sequence of 1-2-5. The vertical sensitivity goes up when the knob is rotated
clockwise and goes down when the knob is rotated anticlockwise.
3. When the vertical position of the channel wave form is adjusted, the screen shows the information
concerning the vertical position at the lower left corner (see Fig. 31).
Fig. 31 Information about Vertical Position
-149-
Page 34
24. How to Set the Horizontal system
The HORIZONTAL CONTROLS includes the HORIZONTAL MENU button and such knobs as HORIZONTAL
POSITION and SEC/DIV.
1. HORIZONTAL POSITION knob: this knob is used to adjust the horizontal positions of all channels
(include those obtained from the mathematical manipulation), the analytic resolution of which changes
with the time base.
2. SEC/DIV knob: it is used to set the horizontal scale factor for setting the main time base or the window.
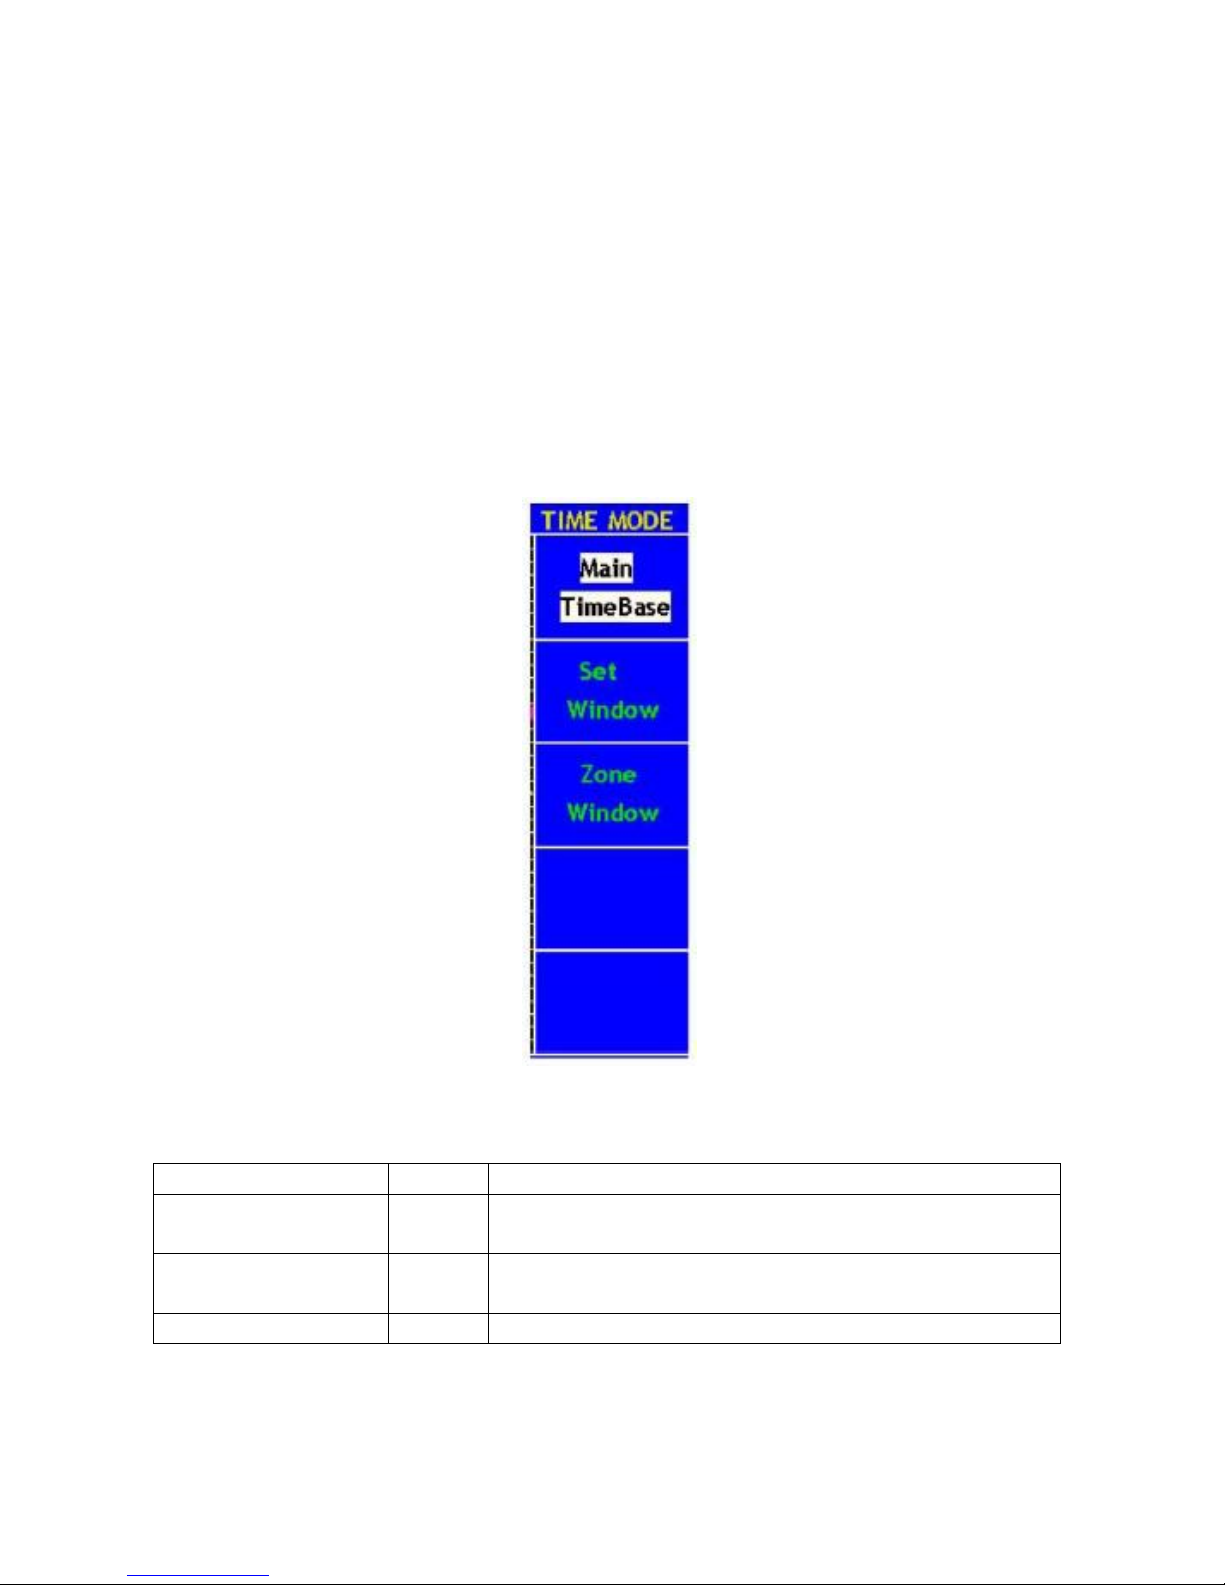
3. HORIZONTAL MENU button: with this button pushed down, the screen shows the operating menu
(see Fig. 32).
Fig. 32 Time Base Mode Menu
The description of the Horizontal Menu is as follows:
Function Menu
Setting
Description
Main Time Base
The setting of the horizontal main time base is used to display the
wave form.
Set Window
A window area is defined by two cursors. This function is forbidden
at the FFT mode disable
Zone Window
The defined window area for display is expanded to the full screen.
-150-
Page 35

25. Main Time Base
Press the F1 menu selection button and choose the Main Time Base. In this case, the HORIZONTAL
POSITION and SEC/DIV knobs are used to adjust the main window. The display in the screen is shown as
Fig.33.
Fig. 33 Main Time Base
26. Set Window
Press the F2 menu selection button and choose Set Window. The screen will show a window area defined by
two cursors. In this case, the HORIZONTAL POSITION and SEC/DIV knobs can be used to adjust the
horizontal position and size of this window area (see Fig. 30(a)). Press F2 menu button under the FFT mode, it
will notice ”FFT mode disable”. See Fig.34.
Fig. 34 Window Setting
-151-
Page 36

Fig.35 FFT mode disable
27. Window Expansion
Press the F3 menu selection button and choose Zone Window. As a result, the window area defined by two
cursors will be expanded to the full screen size (see Fig. 36).
Fig. 36 Zone Window
-152-
Page 37

28. Trigger Control
Trigger is to determine when Oscilloscope starts to acquire data and waveform display. Once trigger to be set
correctly then it will convert the unstable display to meaning waveform.
When Oscilloscope starts to acquire data it will acquire enough data to form waveform on left of trigger point.
Oscilloscope continues to acquire data when it waits for trigger condition happen. Once it detect out the trigger
it will acquire enough data continuously to form the waveform on right of trigger point.
Trigger control area include 1 knob and 4 menu keys.
Trigger level: trigger level knob to set signal voltage correspond to trigger point.
SET 50%: set trigger level in middle vertical point of trigger signal voltage range, this setting is disable at
the FFT mode.
Force trig: Force to a trigger signal and mainly to use in “Normal” and “Single” mode.
SET Zero: Trigger horizontal position set to Zero.
Trig menu: Press this key and panel display menu.
There are two trigger modes: single trigger and alternate trigger.
Single trigger: Use a trigger level to capture stable waveforms in two channels simultaneously
Alternate trigger: Trigger synchronous signals steadily. The two channels could acquire the
waveforms when the CH1 and CH2 are inputting two different frequency signals.
Single
Single trigger mode have edge trigger and video trigger, you can see different
trigger type for two vertical channels in this menu.
Edge
It happens when the trigger input passes through a given level along the set
direction.
Video
Carry out the field or line video trigger of the standard video signal.
Pulse
Use this trigger type to catch pulses with certain pulse width.
Slope
The oscilloscope begins to trigger according to the signal rising or falling speed.
-153-
Page 38

The four trigger modes in Single Trigger are described respectively as follows:
28.1. Edge Trigger
Under the Edge Trigger mode, a trigger happens in the trigger threshold value of the input signal edge. When
the Edge Trigger is selected, a trigger will occur in the rising or falling edge of the input signal.
The Edge Trigger Menu is shown as Fig.37.
Fig. 37 Edge trigger menu
Edge menu list:
MENU
SETTING
INSTRUCTION
Source
CH1
CH2
EXT
EXT/5
Select CH1 as the trigger source.
Select CH2 as the trigger source.
Ext-trigger
Ext-trigger divide to 5 and extend trigger level range.
Mode
Edge
Set vertical channel trigger type for edge trigger.
Slope
Rising
Falling
Trigger in signal rising edge
Trigger in signal falling edge
-154-
Page 39

Trigger
mode
Auto
Normal
Single
Acquire waveform whatever detect trigger condition or not
Only acquire waveform when match trigger condition
Only acquire waveform for single time when detect trigger condition then
stop
Coupling
AC
DC
HF
LF
Not allow DC portion to pass.
Allow all portion pass.
Not allow high frequency of signal pass and only low frequency portion
pass.
Not allow low frequency of signal pass and only high frequency portion
pass
Holdoff
100ns ~
10s
Turn “TRIG LEVEL” knob to set time slot before another trigger event.
Holdoff
Reset
Reset hold time to 100ns
Follow up below step to set CH1 as rising slope edge trigger and trigger mode is auto, coupling is DC.
1. Press “Trig menu”
2. Press “F1” to choose type as “Single”
3. Press “F2” to choose source as “CH1”
4. Press “F3” to choose mode as “Edge”
5. Press “F4” to choose slope as “Rising”. Display as Fig.38
6. Press “F5” to choose “Next menu”, then press “F2” to choose trigger mode as “Auto”.
7. Press “F3” to choose coupling as “DC”.
8. Press ”F4” menu button to select Holdoff, use trig level knob to adjust Holdoff. Display as Fig. 39
-155-
Page 40

Fig. 38 Edge trigger (Rising Wave, the first menu)
Fig. 39 Edge trigger (Rising Wave, the second menu)
-156-
Page 41

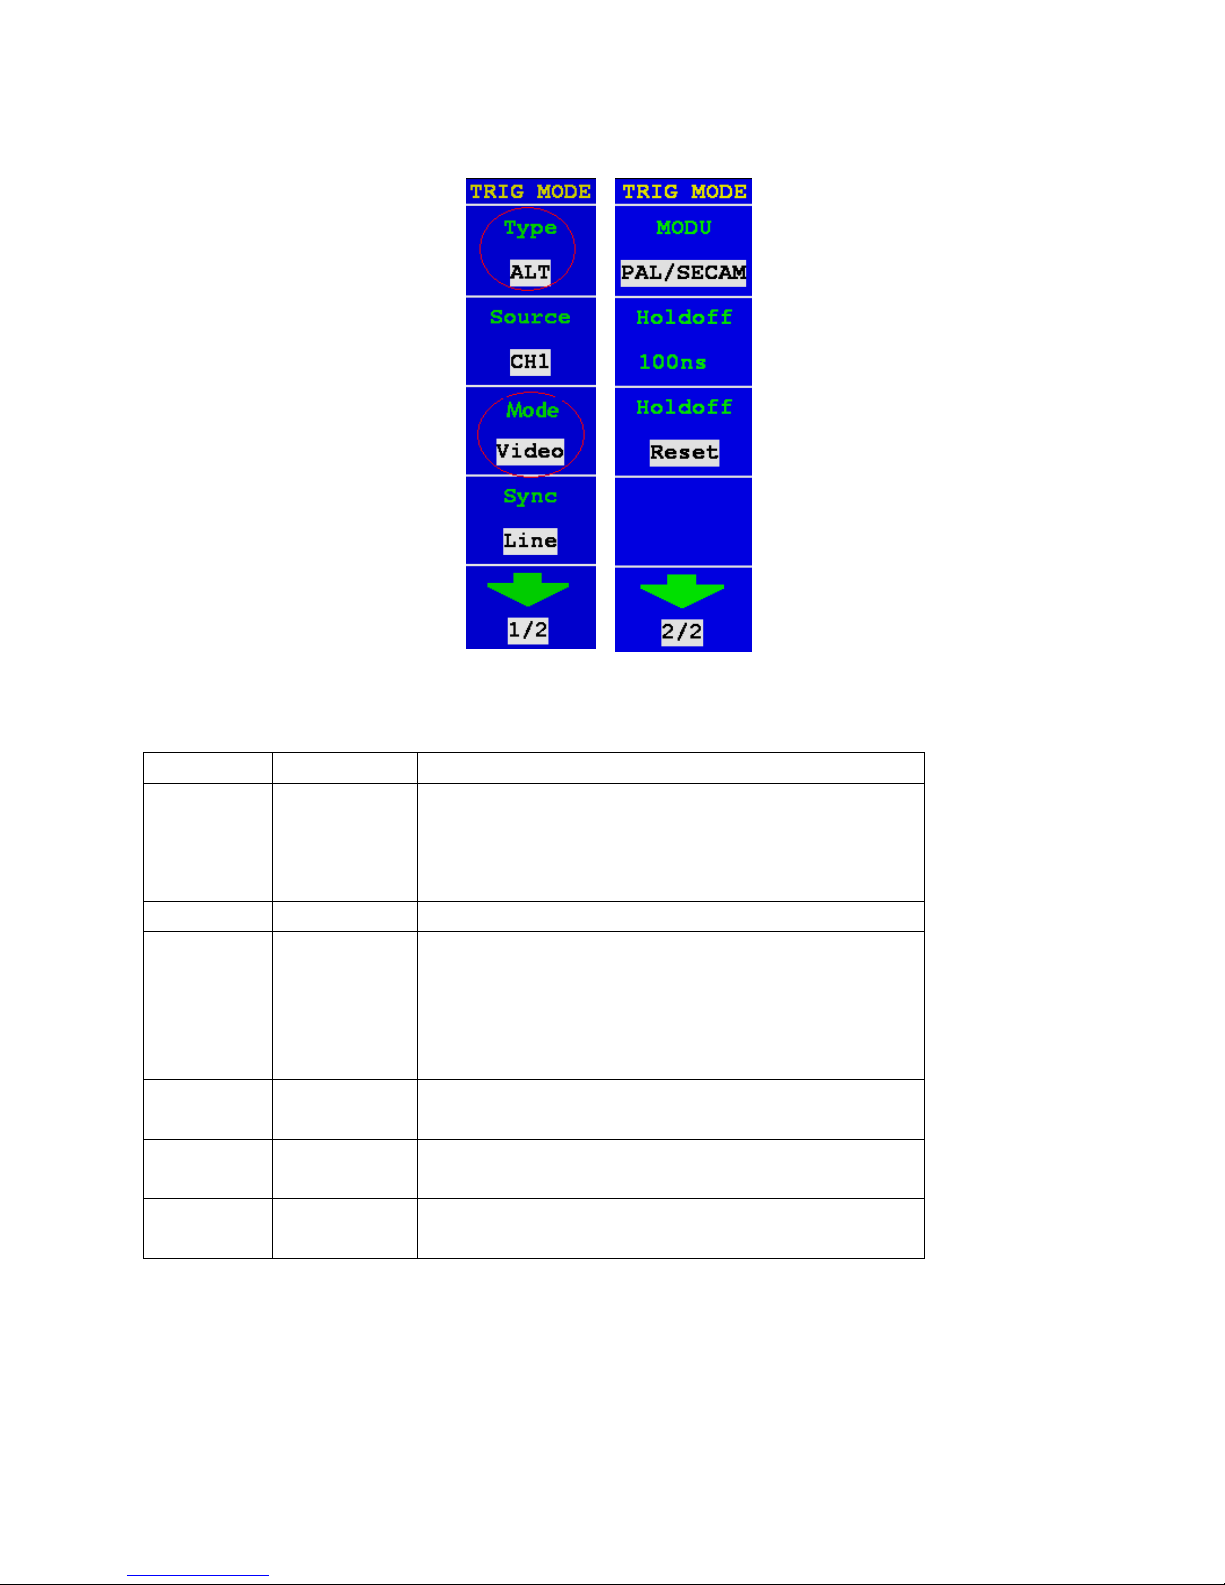
28.2. Video
Choose “Video” and trigger in field/line of NTSC, PAL or SECAM standard video signals. Trig menu refer to
Fig.40
Fig. 40 Video trigger menu
Video trigger menu
MENU
SETTING
INSTRUCTION
Quelle
CH1
CH2
EXT
EXT/5
Select CH1 as the trigger source.
Select CH2 as the trigger source.
Ext-trigger
Ext-trigger divide to 5 to extend trigger level range
Mode
Video
Sync
Line
Field
Odd Field
EvenField
Designed Line
Synchronic trigger in video line.
Synchronic trigger in video field.
Synchronic trigger in video odd filed
Synchronic trigger in video even field
Synchronic trigger in designed video line
to Next menu
Back to previous menu
MODU
NTSC
PAL/SECAM
Video modulation setting
Holdoff
100ns~10s
Turn “TRIG LEVEL” knob to set time slot before another trigger
event
Holdoff
Reset
Reset hold time to 100ns
-157-
Page 42
Follow up below steps to set CH1 as video trigger
1. Press “Trig menu”
2. Press F1 to choose type as “Single”
3. Press F2 to choose source as “CH1”.
4. Press F3 to choose mode as “Video”.
5. Press F4 to choose synchronization as “Line” (refer to Fig.41)
6. Press F5 to Next menu.
7. Press F2 to choose modulation as “NTSC”.
Fig. 41 Video field trigger Oscillogram
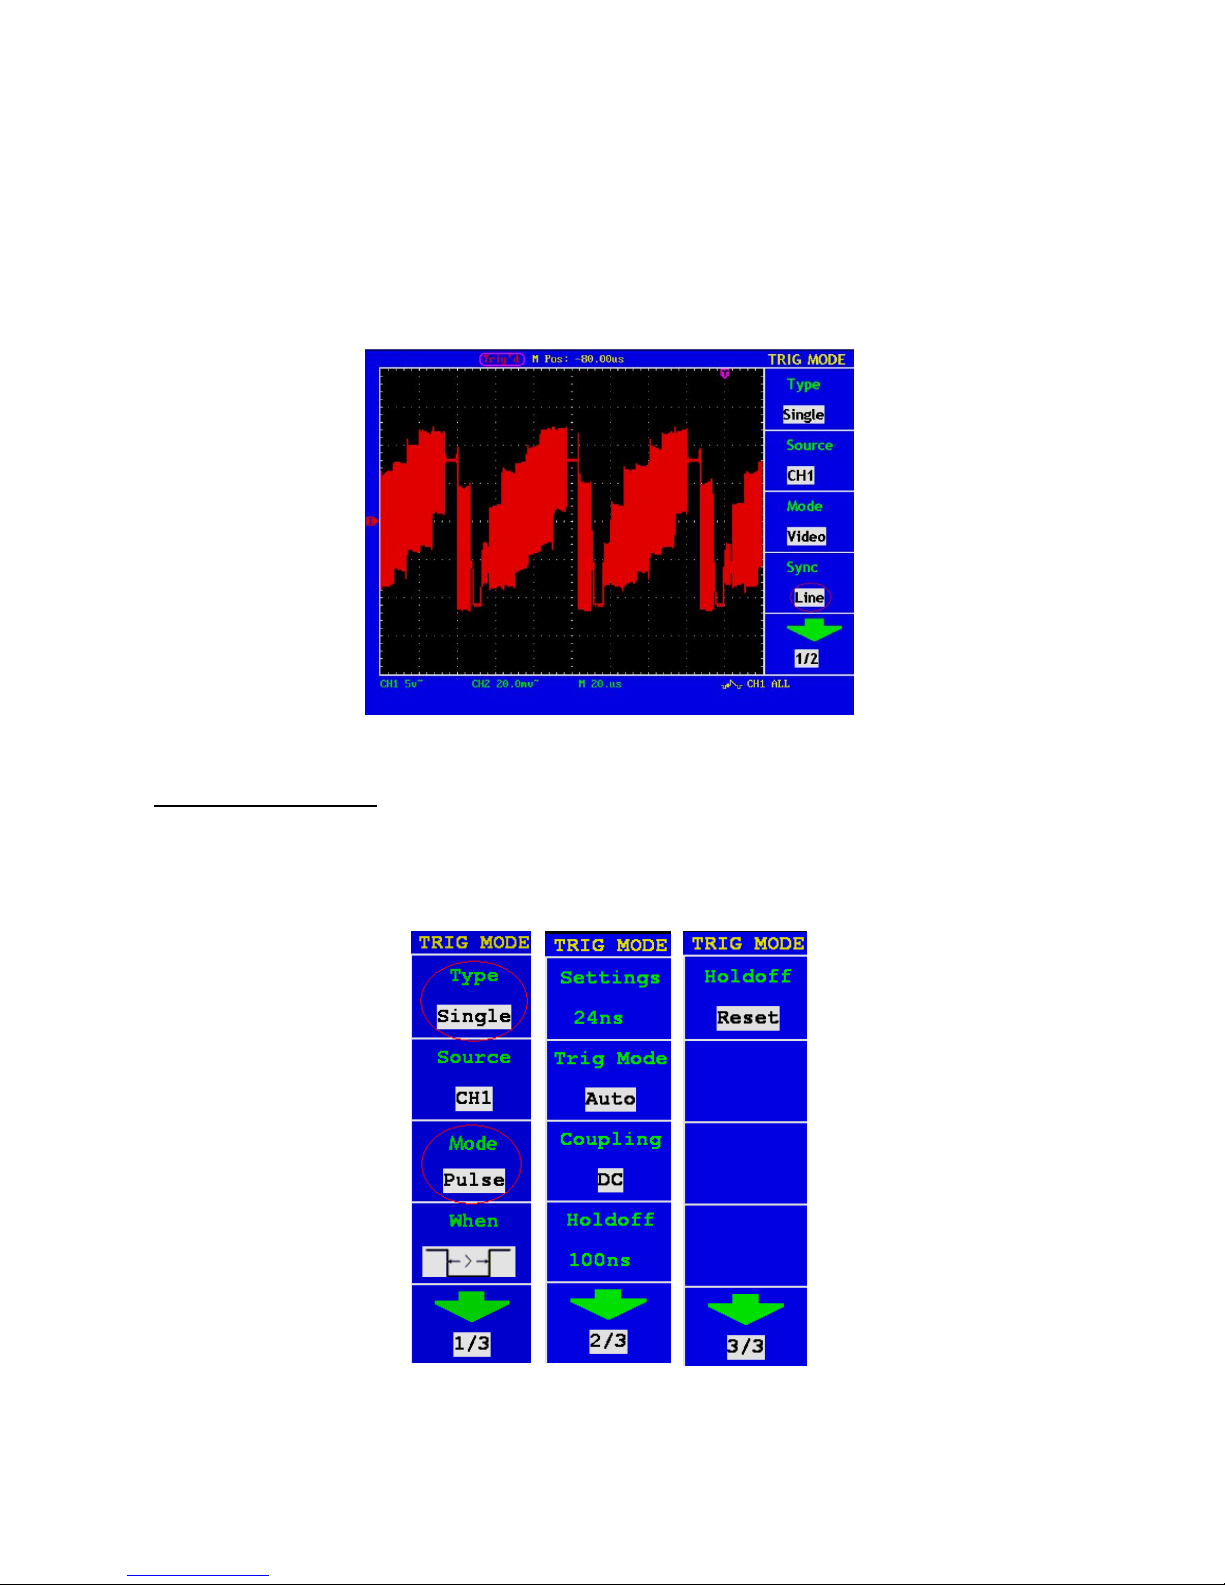
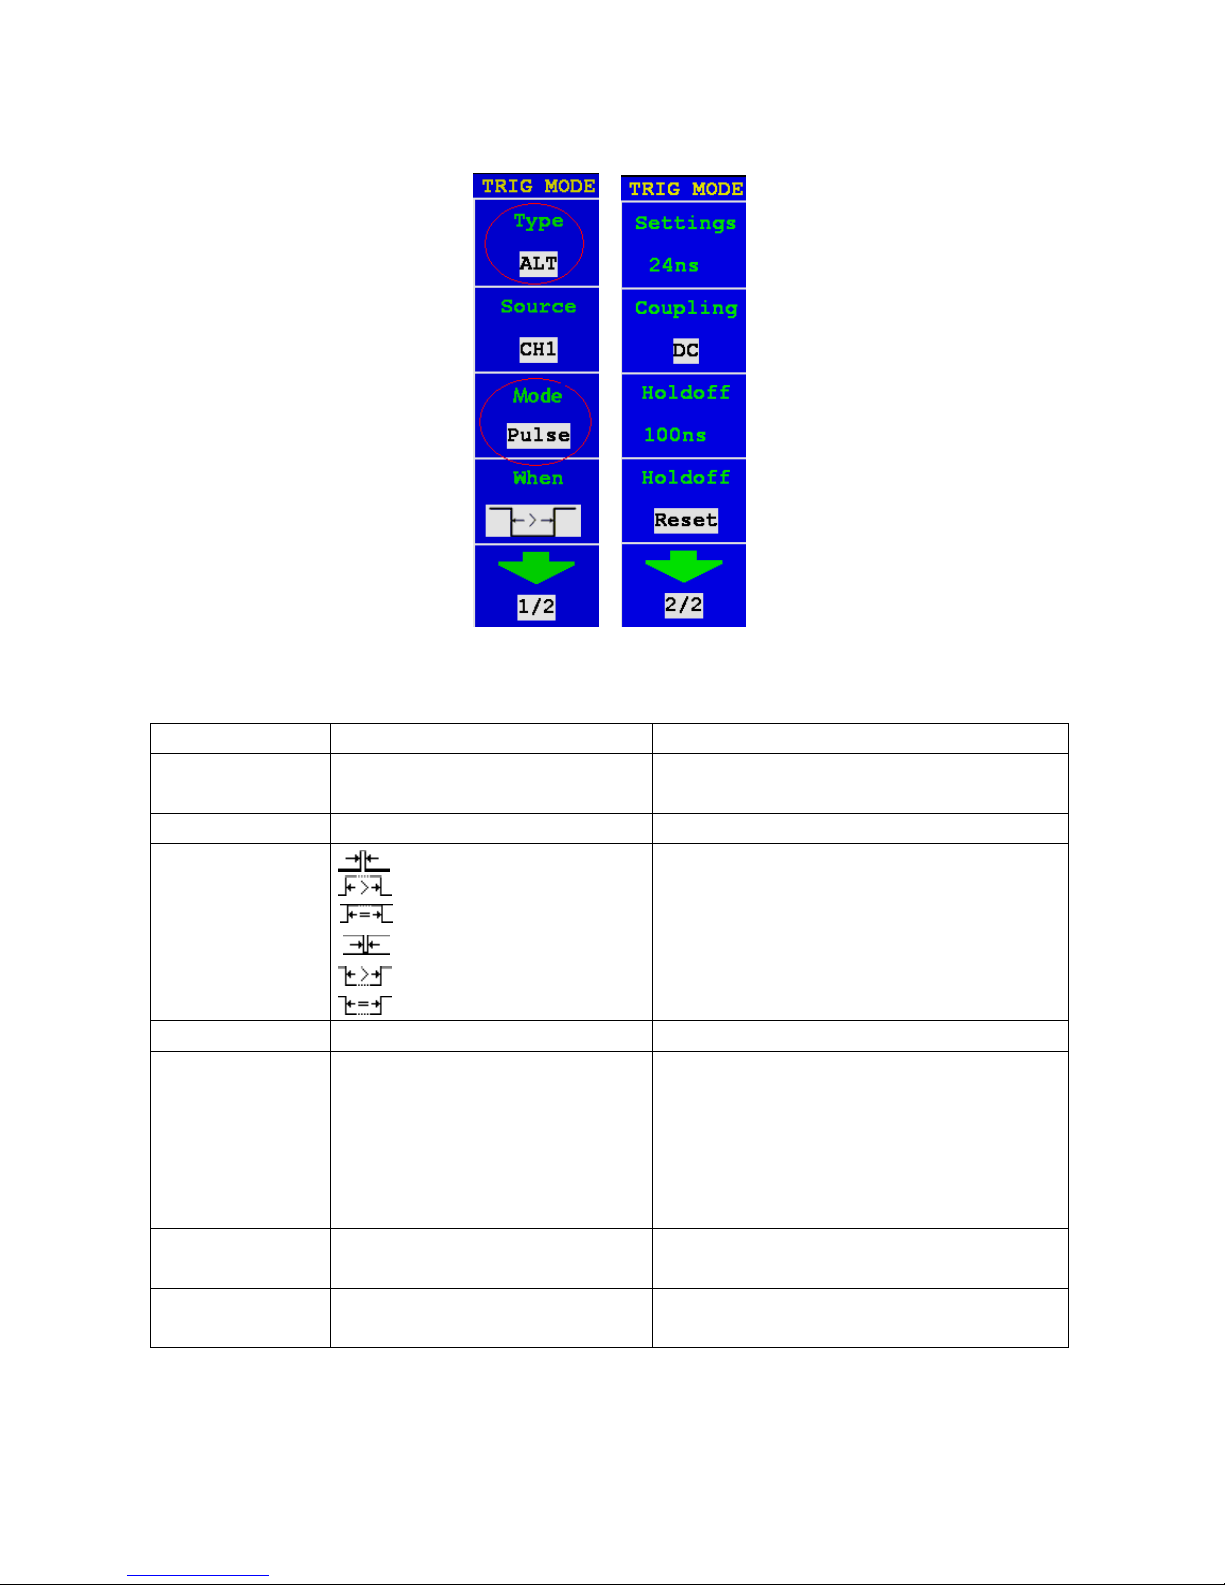
28.3. Pulse Width Trigger
Pulse trigger occurs according to the width of pulse. The abnormal signals can be detected through setting up
the pulse width condition.
The Pulse Width Trigger Menu is shown as Fig. 42.
Fig. 42 Pulse Width Trigger menu
-158-
Page 43

Pulse Width Trigger menu list
MENU
SETTING
INSTRUCTION
Source
CH1
CH2
Select CH1 as the trigger source.
Select CH2 as the trigger source.
Mode
Pulse
when
(+pulse width less than )
(+pulse width more than )
(+Pulse width equal to)
(-Pulse width less than)
(-Pulse width more than)
(-Pulse width equal to)
To select pulse width condition
Time setting
24ns~10s
Turn “TRIG LEVEL” knob to set time
Trigger mode
Auto
Normal
Single
Acquire waveform whatever detect trigger
condition or not
Only acquire waveform when match trigger
condition
Only acquire waveform for single time when detect
trigger condition then stop
Coupling
AC
DC
HF
LF
Not allow DC portion to pass.
Allow all portion pass.
Not allow high frequency of signal pass and only
low frequency portion pass.
Not allow low frequency of signal pass and only
high frequency portion pass
Holdoff
100 ns~10 s
Turn “TRIG LEVEL” knob to set time slot before
another trigger event
Holdoff
Reset
Reset hold time to 100ns
-159-
Page 44

28.4. Slope Trigger
Slope trigger sets the oscilloscope as the positive/negative slope trigger within the specified time.
The Slope Trigger Menu is shown as Fig. 43.
Fig. 43 Slope Trigger menu
Slope Trigger menu list
MENU
SETTING
INSTRUCTION
Source
CH1
CH2
Select CH1 as the trigger source.
Select CH2 as the trigger source.
Mode
Slope
When
Set slope condition
Settings
24ns~10s
Turn “TRIG LEVEL ”knob to set slope time
High level
Turn “TRIG LEVEL ”knob to set the High level
Low level
Turn “TRIG LEVEL ”knob to set Low level
Slew rate
Slew rate=( High level- Low level)/ Settings
Trigger
mode
Auto
Normal
Single
Acquire waveform whatever detect trigger condition or not
Only acquire waveform when match trigger condition
Only acquire waveform for single time when detect trigger condition then stop
Holdoff
100ns ~
10s
Turn “TRIG LEVEL” knob to set time slot before another trigger event
Holdoff
Reset
Reset hold time to 100ns
-160-
Page 45
28.5. Alternate trigger
Trigger signal comes from two vertical channels when alternate trigger is on. This mode is used to observe two
unrelated signals. You can choose different trigger modes for different channels. The options are as follows:
edge, video, pulse or slope.
Alternate trigger (Trigger mode: Edge)
Alternate trigger (Trigger Type: Edge) Menu is shown as Fig.44.
Fig. 44 Alternate trigger(Trigger Type: Edge) Menu
Alternate trigger(Trigger Type: Edge) Menu list:
MENU
SETTING
INSTRUCTION
Source
CH1
CH2
Select CH1 as the trigger source.
Select CH2 as the trigger source.
Mode
Edge
Set vertical channel trigger type for edge trigger.
Slope
Rising
Falling
Trigger in signal rising edge
Trigger in signal falling edge
Coupling
AC
DC
HF
LF
Not allow DC portion to pass.
Allow all portion pass.
Not allow high frequency of signal pass and only low frequency portion
pass.
Not allow low frequency of signal pass and only high frequency portion pass
Holdoff
100ns~10s
Turn “TRIG LEVEL” knob to set time slot before another trigger event.
Holdoff
Reset
Reset hold time to 100ns
-161-
Page 46
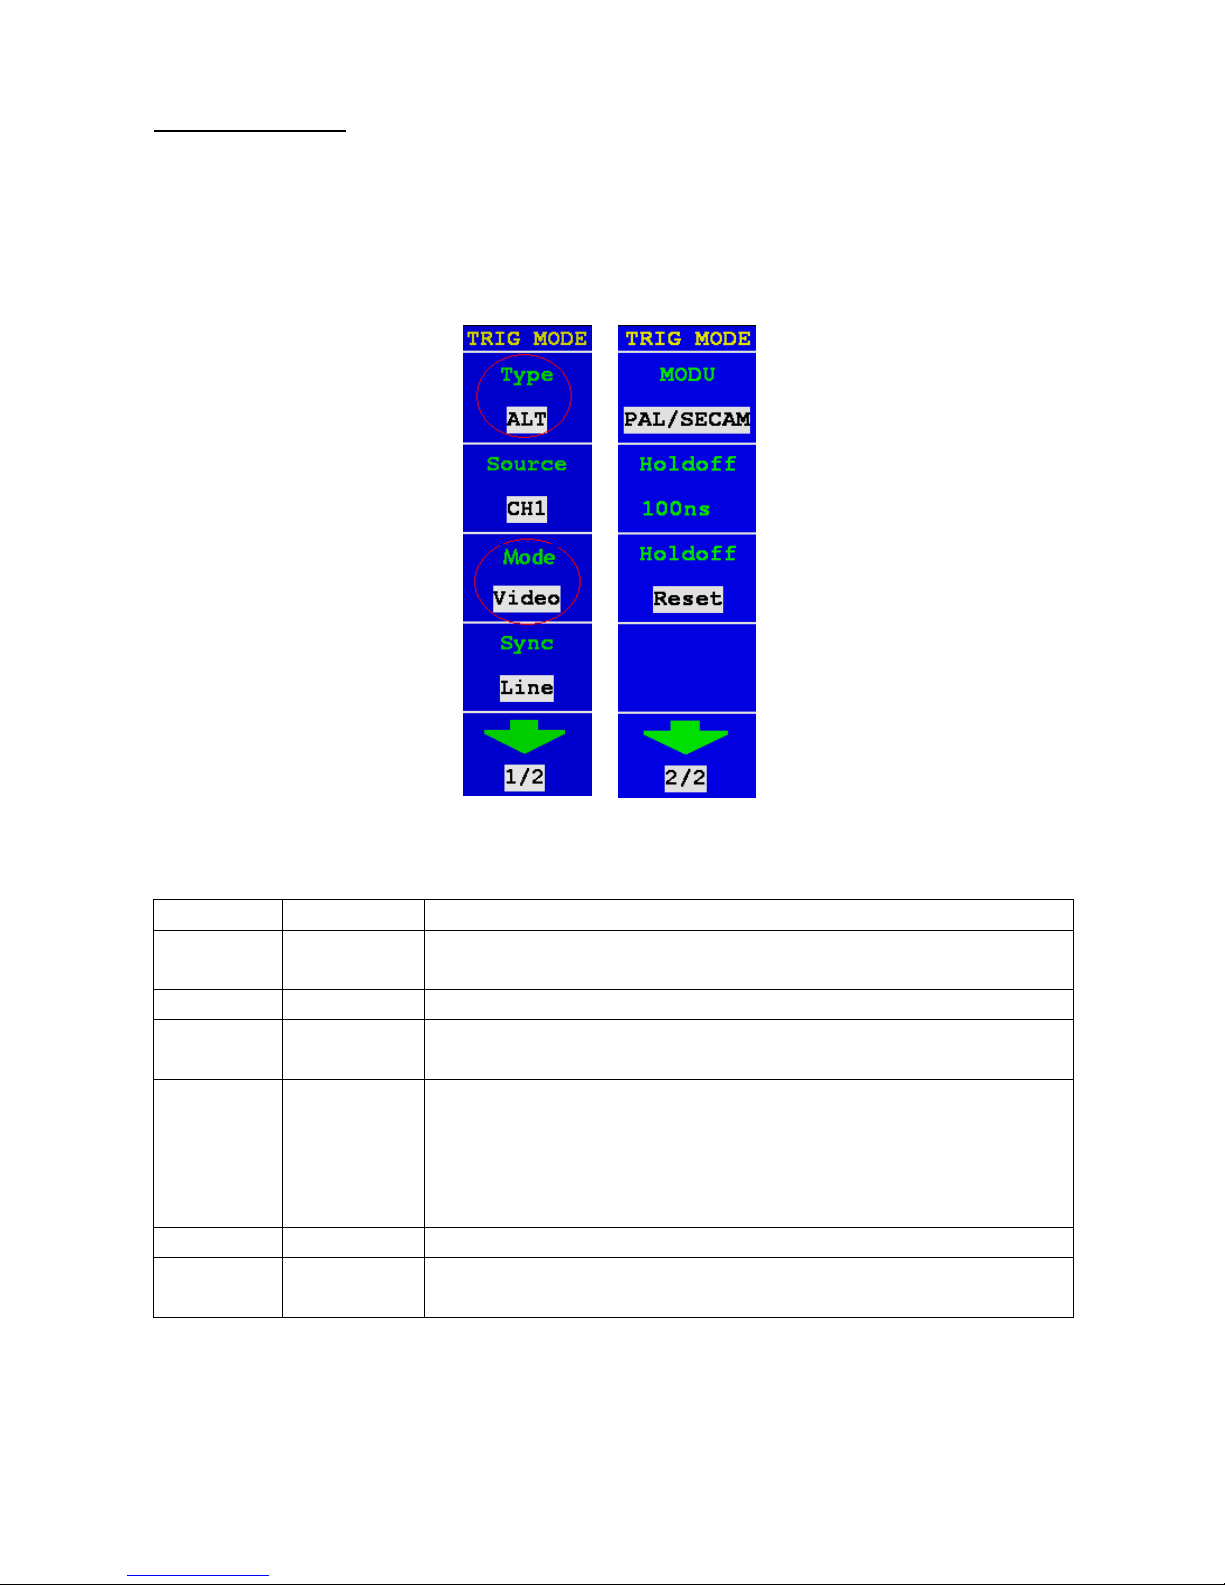
Alternate trigger (Trigger Mode:video)
Alternate trigger (Trigger Type:video) Menu is shown as Fig. 45.
Fig. 45 Alternate trigger (Trigger Type:video) Menu
Alternate trigger (Trigger Type: video) Menu list:
MENU
SETTING
INSTRUCTION
Source
CH1
CH2
EXT
EXT/5
Select CH1 as the trigger source.
Select CH2 as the trigger source.
Ext-trigger
Ext-trigger divide to 5 to extend trigger level range
Mode
Video
Sync
Line
Field
Odd Field
EvenField
Designed Line
Synchronic trigger in video line.
Synchronic trigger in video field.
Synchronic trigger in video odd filed
Synchronic trigger in video even field
Synchronic trigger in designed video line
Modulation
NTSC
PAL/SECAM
Video modulation setting
Holdoff
100ns~10s
Turn “TRIG LEVEL” knob to set time slot before another
trigger event
Holdoff
Reset
Reset hold time to 100ns
-163-
Page 47
Alternate trigger (Trigger Mode: Pulse)
Alternate trigger (Trigger Type: Pulse) Menu is shown as Fig. 46.
Fig. 46 Alternate trigger (Trigger Type: Pulse) Menu
Alternate trigger (Trigger Type: Pulse) menu list
MENU
SETTING
INSTRUCTION
Source
CH1
CH2
Select CH1 as the trigger source.
Select CH2 as the trigger source.
Mode
Pulse
when
(+pulse width less than )
(+pulse width more than )
(+Pulse width equal to)
(-Pulse width less than)
(-Pulse width more than)
(-Pulse width equal to)
To select pulse width condition
settings
24ns~10s
Turn “TRIG LEVEL” knob to set time
Coupling
AC
DC
HF
LF
Not allow DC portion to pass.
Allow all portion pass.
Not allow high frequency of signal pass and
only low frequency portion pass.
Not allow low frequency of signal pass and only
high frequency portion pass
Holdoff
100 ns ~ 10 s
Turn “TRIG LEVEL” knob to set time slot before
another trigger event
Holdoff
Reset
Reset hold time to 100ns
-163-
Page 48

Alternate trigger (Trigger Mode: Slope)
Alternate trigger(Trigger Type: Slope )Menu is shown as Fig. 47.
Fig. 47 Alternate trigger(Trigger Type: Slope )Menu
Alternate trigger(Trigger Type: Slope) menu list:
MENU
SETTING
INSTRUCTION
Source
CH1
CH2
Select CH1 as the trigger source.
Select CH2 as the trigger source.
Mode
Slope
Slope
Condition
Rising Edge and more than.
Rising Edge and less than.
Rising Edge and equal to .
Falling Edge and more than
Negative pulse and less than
Negative pulse and equal to
settings
24ns~10s
Turn “TRIG LEVEL”knob to set slope time
High level
Turn“TRIG LEVEL”knob to set the High level
Low level
Turn “TRIG LEVEL”knob to set Low level
Slew rate
Slew rate=( High level- Low level)/ Settings
Coupling
AC
DC
HF
LF
Not allow DC portion to pass.
Allow all portion pass.
Not allow high frequency of signal pass and only low frequency portion pass.
Not allow low frequency of signal pass and only high frequency portion pass
Holdoff
100ns~10s
Turn “TRIG LEVEL” knob to set time slot before another trigger event
Holdoff
Reset
Reset hold time to 100ns
-164-
Page 49
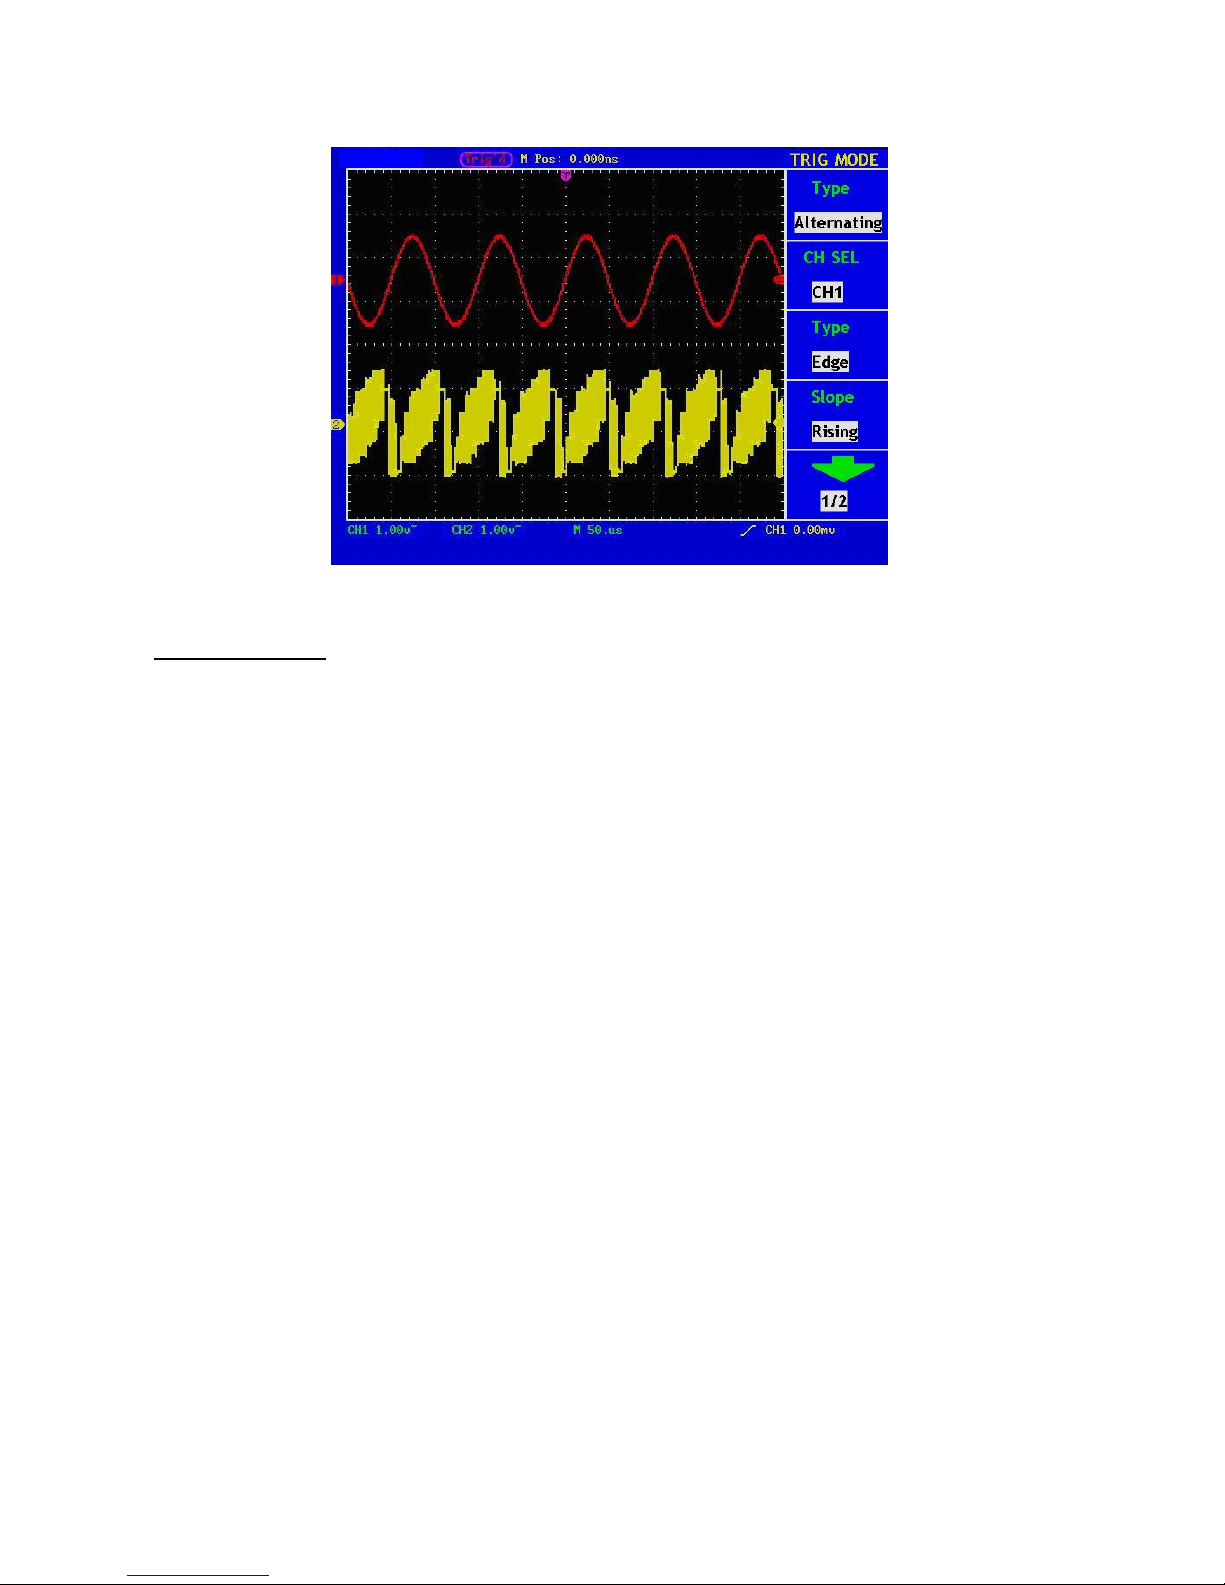
Fig. 48 gives the resulted signal.
Fig. 48 Wechseltriggersignal
Term interpretation
Trigger: With this oscilloscope there are three types of trigger modes: automatic,
normal and single.
Automatic trigger mode: The oscilloscope can detect in this mode the curve without a selected trigger
condition. During a particular waiting time a Force-Trigger is done when no
trigger condition occurs. If an invalid trigger condition is used, the
oscilloscope cannot keep the curve in phase.
Normal trigger mode: In this mode, the oscilloscope cannot detect the curve before it is triggered.
Without trigger the oscilloscope displays the original curve without new
curves are recorded.
Single mode: In this mode, the oscilloscope detects a trigger and captures the curve
whenever the operator presses the RUN / STOP (Run / Stop) button.
Sensitivity: Trigger circuit with delay line to avoid effects due to noise and to obtain a
stable trigger. The delay line is adjustable between 0.2div and 1.0div. This
means that when set to 1.0div the trigger circuit does not respond to a signal
with a peak-to-peak value ≤1.0div, eliminating the effects of interference.
-165-
Page 50

Term interpretation
1. Source:
Trigger can occur from several sources: Input channels (CH1, CH2), AC Line, Ext, Ext/5.
* Input: It is the most commonly used trigger source. The channel will work when selected as a
trigger source whatever displayed or not.
* Ext Trig: The instrument can trigger from a third source while acquiring data from CH1 and CH2. For
example, you might want to trigger from an external clock or with a signal from another part
of the test circuit. The Ext, Ext/ 5 trigger sources use the external trigger signal connected to
the EXT TRIG connector. Ext uses the signal directly; it has a trigger level range of +1.6 V to
-1.6 V. The EXT/ 5 trigger source attenuates the signal by 5X, which extends the trigger level
range to +8 V to -8 V. This allows the oscilloscope to trigger on a larger signal
* AC Line: AC power can be used to display signals related to the power line frequency, such as lighting
equipment and power supply devices. The oscilloscope gets triggered on its power cord, so
you do not have to input an AC trigger signal. When AC Line is selected as trigger source,
the oscilloscope automatically set coupling to DC, set trigger level to 0V.
2. Trigger Mode:
The trigger mode determines how the oscilloscope behaves in the absence of a trigger event. The
oscilloscope provides three trigger modes: Auto, Normal, and Single.
* Auto: This sweep mode allows the oscilloscope to acquire waveforms even when it does not
detect a trigger condition. If no trigger condition occurs while the oscilloscope is waiting for a
specific period (as determined by the time-base setting), it will force itself to trigger.
* Normal: The Normal mode allows the oscilloscope to acquire a waveform only when it is triggered. If
no trigger occurs, the oscilloscope keeps waiting, and the previous waveform, if any, will
remain on the display. Single: In Single mode, after pressing the RUN/STOP key, the
oscilloscope waits for trigger. While the trigger occurs, the oscilloscope acquires one
waveform then stop.
* Single: In Single mode, after pressing the RUN/STOP key, the oscilloscope waits for trigger. While
the trigger occurs, the oscilloscope acquires one waveform then stop.
3. Coupling:
Trigger coupling determines what part of the signal passes to the trigger circuit. Coupling types include AC,
DC, LF Reject and HF Reject.
* AC: AC coupling blocks DC components.
* DC: DC coupling passes both AC and DC components.
* LF Reject: LF Reject coupling blocks DC component, and attenuates all signal with a frequency lower
than 8 kHz.
* HF Reject: HF Reject coupling attenuates all signals with a frequency higher than 150 kHz.
4. Hold off:
A time interval before the oscilloscope responses to next trigger signal. During this Hold off period, the
trigger system becomes “blind” to trigger signals. This function helps to view complex signals such as an
AM waveform. Press Hold off button to activate “TRIG LEVEL” knob, then turn it to adjust Hold off time.
-166-
Page 51

29. How to Operate the Function Menu
The function menu control zone includes 7 function menu buttons and 3 immediate-execution buttons:
SAVE/RCL, MEASURE, ACQUIRE, UTILITY, CURSOR, DISPLAY, AUTOSCALE, AUTOSET, RUN/STOP
and U-DISK COPY.
30. How to Implement Sampling Setup
Press the ACQUIRE button and the menu is displayed in the screen, shown as Fig. 49.
Fig. 49 ACQU MODE Menu
The description of the Sampling Setup Menu is shown as follows:
Function Menu
Setting
Description
Sample
General sampling mode.
Peak Detect
It is used for the detection of the jamming burr and the
possibility of reducing the confusion.
Average
It is used to reduce the random and don’t-care noises, with
the optional number of averages.
Averages
4, 16, 64, 128
Choose the number of averages.
Change the ACQU Mode settings and observe the consequent variation of the wave form displayed.
-167-
Page 52

Fig. 50 Peak Detect mode, under which the burrs on the falling edge of the square wave, can be detected and
the noise is heavy.
Fig. 51 Common ACQU Mode display, in which no burr can be detected.
Fig. 52 The displayed wave form after the noise is removed under the Average Mode, in which the average
number of 16 is set.
-168-
Page 53
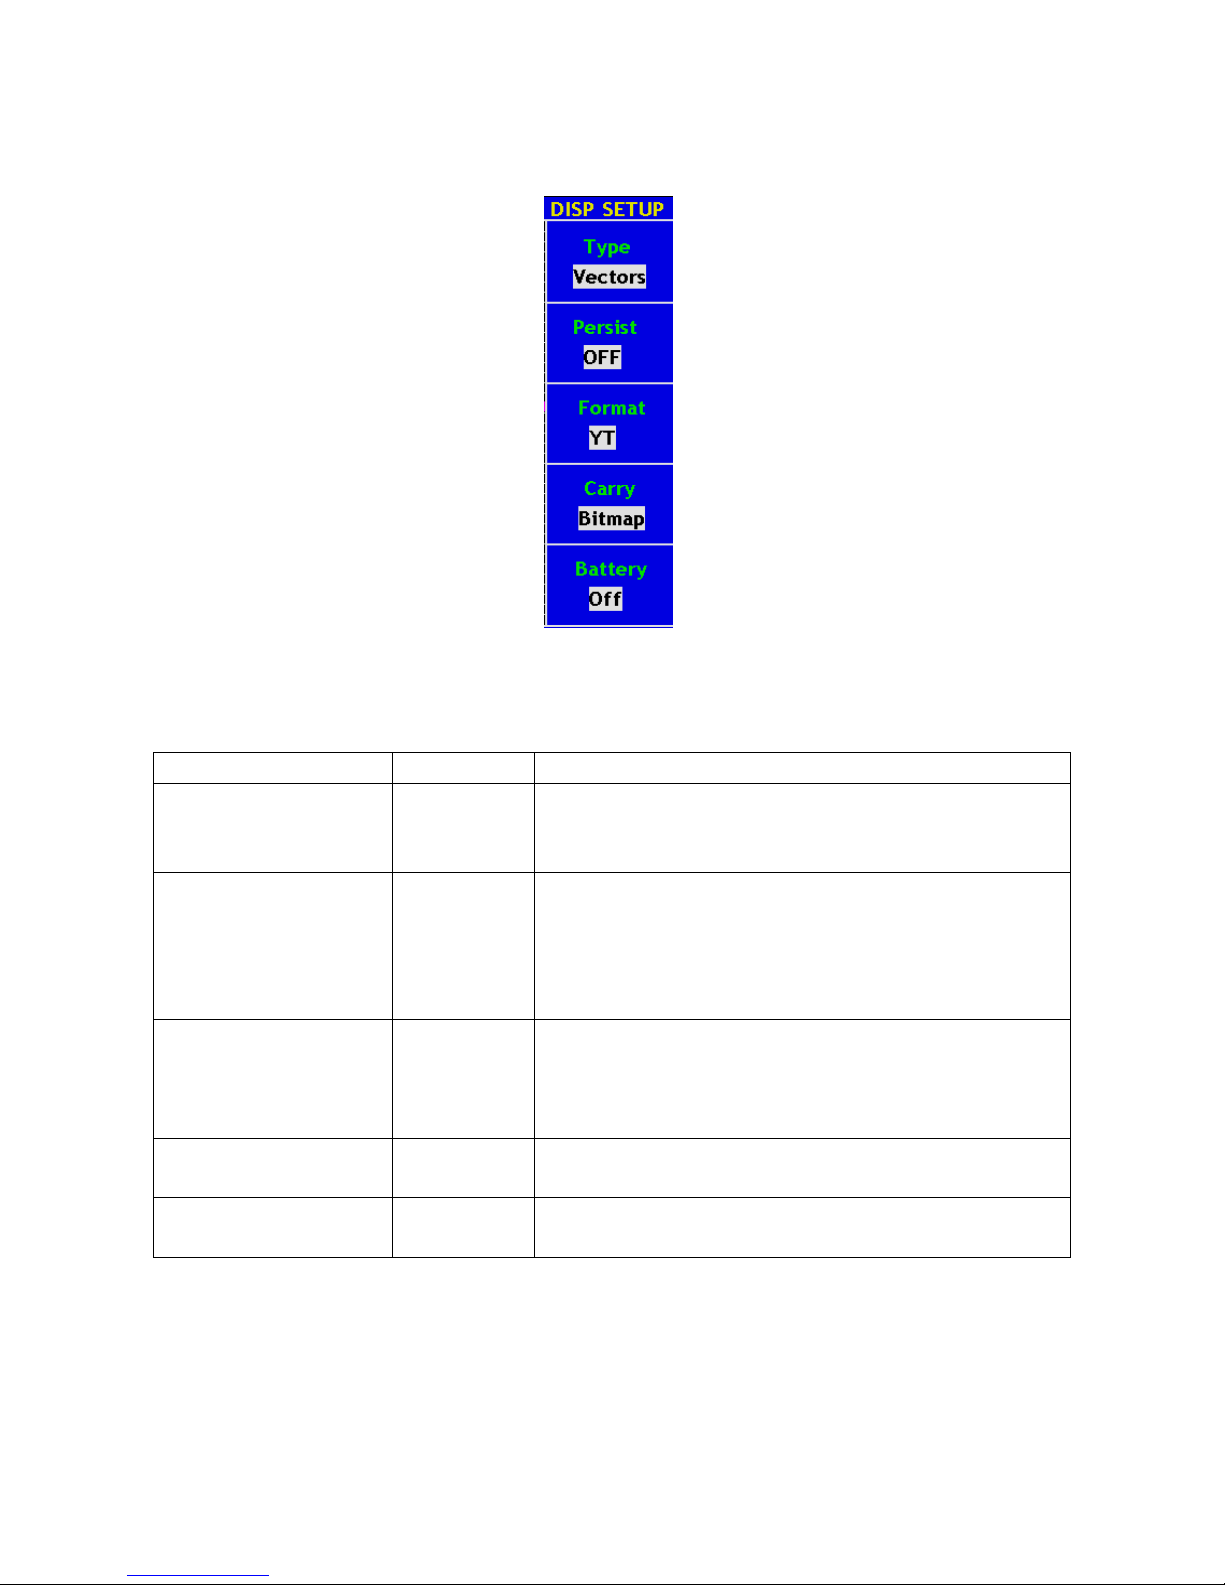
31. How to Set the Display System
Push down the DISPLAY button and the menu displayed in the screen is shown as Fig. 53.
Fig. 53 Display Set Menu
The description of the Display Set Menu is shown as follows:
Function Menu
Setting
Description
Type
Vectors
Dots
The space between the adjacent sampling points in the display
is filled with the vector form.
Only the sampling points are displayed.
Persist
OFF
1sec
2sec
5sec
Infinite
Set the persistence time for each sampling point.
Format
YT
XY
Show the relative relation between the vertical voltage and the
horizontal time.
Channel 1 is displayed on the horizontal axis and Channel 2
on the vertical axis. FFT mode disable.
Carry
Bitmap
Vectors
The data transmitted as screenshot is in bitmap (BMP) form.
The raw-data transmitted is in the vector form.
Battery
On
Off
Battery power content symbol on
Battery power content symbol off
-169-
Page 54

Display Type:
With the F1 menu selection button pushed down, you can shift between Vectors and Dots types. The
differences between the two display types can be observed through the comparison between Fig.54 and
Fig.55.
Fig. 54 Display in the Vector Form
Fig. 55 Display in Dots form
-170-
Page 55

32. Persist
When the Persist function is used, the persistence display effect of the picture tube oscilloscope can be
simulated: the reserved original data is displayed in fade color and the new data is in bright color. With the F2
menu selection button, different persistence time can be chosen: 1sec, 2sec, 5sec, Infinite and Closed.
When the “Infinite” option is set for Persist time, the measuring points will be stored till the controlling value is
changed (see Fig.56).
Fig. 56 Infinite Persistence Display
33. XY Format
This format is only applicable to Channel 1 and Channel 2. After the XY display format is selected, Channel 1
is displayed in the horizontal axis and Channel 2 in the vertical axis; the oscilloscope is set in the un-triggered
sample mode: the data are displayed as bright spots and the sampling rate is 1MS/s and cannot be changed.
The operations of all control knobs are as follows:
* The Vertical VOLTS/DIV and the Vertical POSITION knobs of Channel 1 are used to set the horizontal
scale and position.
* The Vertical VOLTS/DIV and the Vertical POSITION knobs of Channel 2 are used to set the vertical
scale and position continuously.
The following functions cannot work in the XY Format:
* Reference or digital wave form
* Cursor
* Auto Set
* Time base control
* Trigger control
-171-
Page 56

Operation steps:
1. Press the DISPLAY button and call out the Display Set Menu.
2. Press the F3 menu selection button and choose the form as XY. The display format is changed to be XY
mode (see Fig.57).
Fig. 57 XY Display Mode
At the mode of FFT, if switching YT to XY, “FFT MODE is unavailable” prompts as Fig.58
Fig. 58 FFT mode XY Format Disable
-172-
Page 57

34. How to Save and Recall a Wave Form
Press the SAVE/RCL button, you can save and call out the waveforms in the instrument. The menu displayed
in the screen is shown as Fig.59.
Fig. 59 Wave Form Save Menu
The description of the Wave Form Save Menu is shown as the following table:
Function Menu
Setting
Description
Source
CH1
CH2
MATH
Choose the wave form to be saved.
WAVE
A , B
C , D
Choose the address in or from which the waveform
is saved or can be get access to.
Save
Save the wave form of the source in the selected
address.
CH (X)
X=A,B,C oder D
OFF
ON
Switch on or off the display of the stored waveform.
The PeakTech® 1190 / 1230 oscilloscopes can store four waveforms, which can be displayed with the current
waveform at the same time. The stored waveform called out cannot be adjusted.
In order to save the waveform of the channel CH1 into the address A, the operation steps should be followed:
1. Press the F1 menu selection button and choose CH1 for Source.
2. Press the F2 menu selection button and choose A as save address.
3. Press the F3 menu selection button and save the waveform.
Press the F4 menu selection button and choose ON for CH A. The stored wave form A will be displayed in the
screen.
-173-
Page 58

The voltage level and time base level will also be shown at the upper left corner of the display area at the
same time (see Fig.60).
Fig. 60 Wave Saving
Fig. 61 FFT wave Saving
-174-
Page 59

35. How to Implement the Auxiliary System Function Setting
Press the UTILITY button and the menu is displayed in the screen as Fig. 62.
Fig. 62 Function Menu
The description of the Auxiliary Function Menu is shown as the following table.
Function Menu
Setting
Description
System Status
Display the system function menu.
Recall Factory
Call out the factory settings.
Do Self Cal
Carry out the self-calibration procedure.
Language
Chinese
English
German
Choose the display language of the operating system.
-175-
Page 60
36. Do Self Cal (Self-Calibration)
The self-calibration procedure can improve the accuracy of the oscilloscope under the ambient temperature to
the greatest extent. If the change of the ambient temperature is up to or exceeds 5°C, the self-calibration
procedure should be executed to obtain the highest level of accuracy.
Before executing the self-calibration procedure, disconnect the probe or wire and the input connector. Then,
press the F3 menu selection button and choose “Auto calibration”. After confirming it is all set, push down F3
button and choose “Do Self Cal”, entering the self-calibration procedure of the instrument.
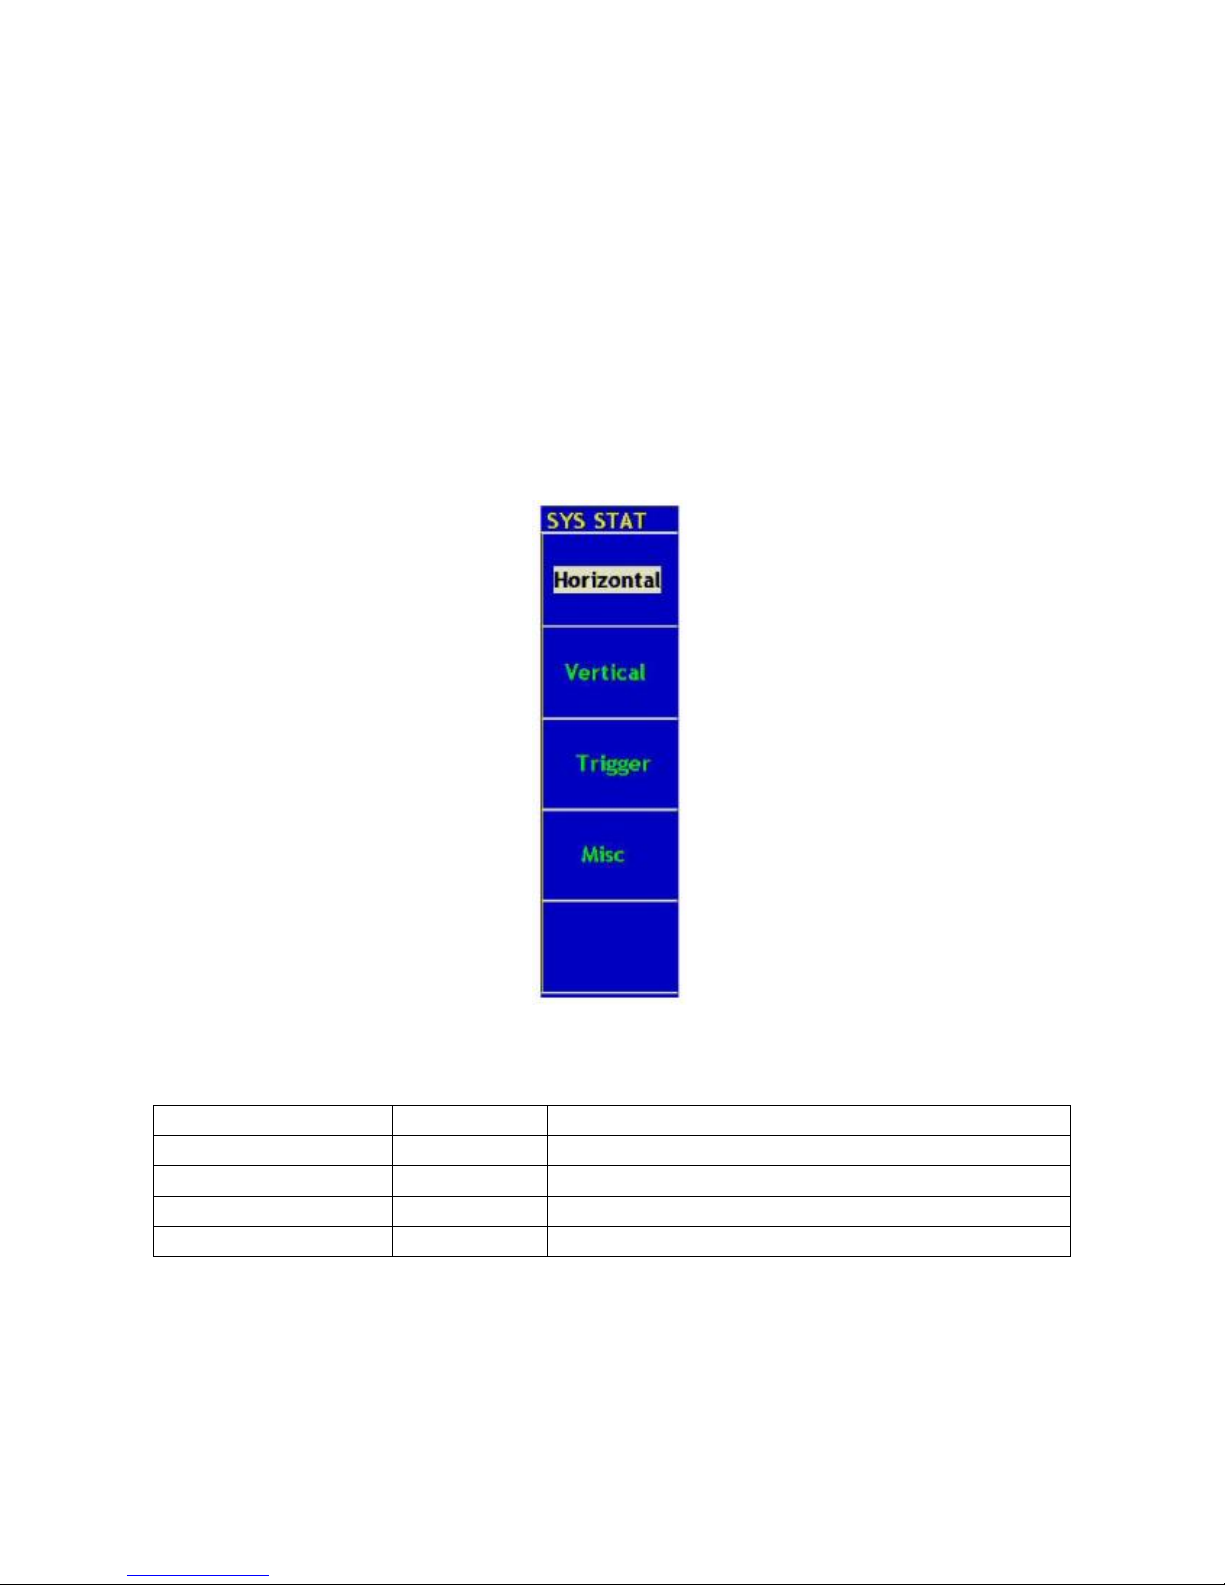
37. System Status (SYS STAT)
Press the F1 menu selection button and choose “System Status” item. The menu pops up in the screen as
Fig. 63.
Fig. 63 SYS STAT Menu
The “SYS STAT” menu is described as the following table:
Function Menu
Setting
Description
Horizontal
Show the horizontal parameter of the channel.
Vertical
Show the vertical parameter of the channel.
Trigger
Show the parameters of the trigger system.
Misc
Show the serial number and edition number.
-176-
Page 61
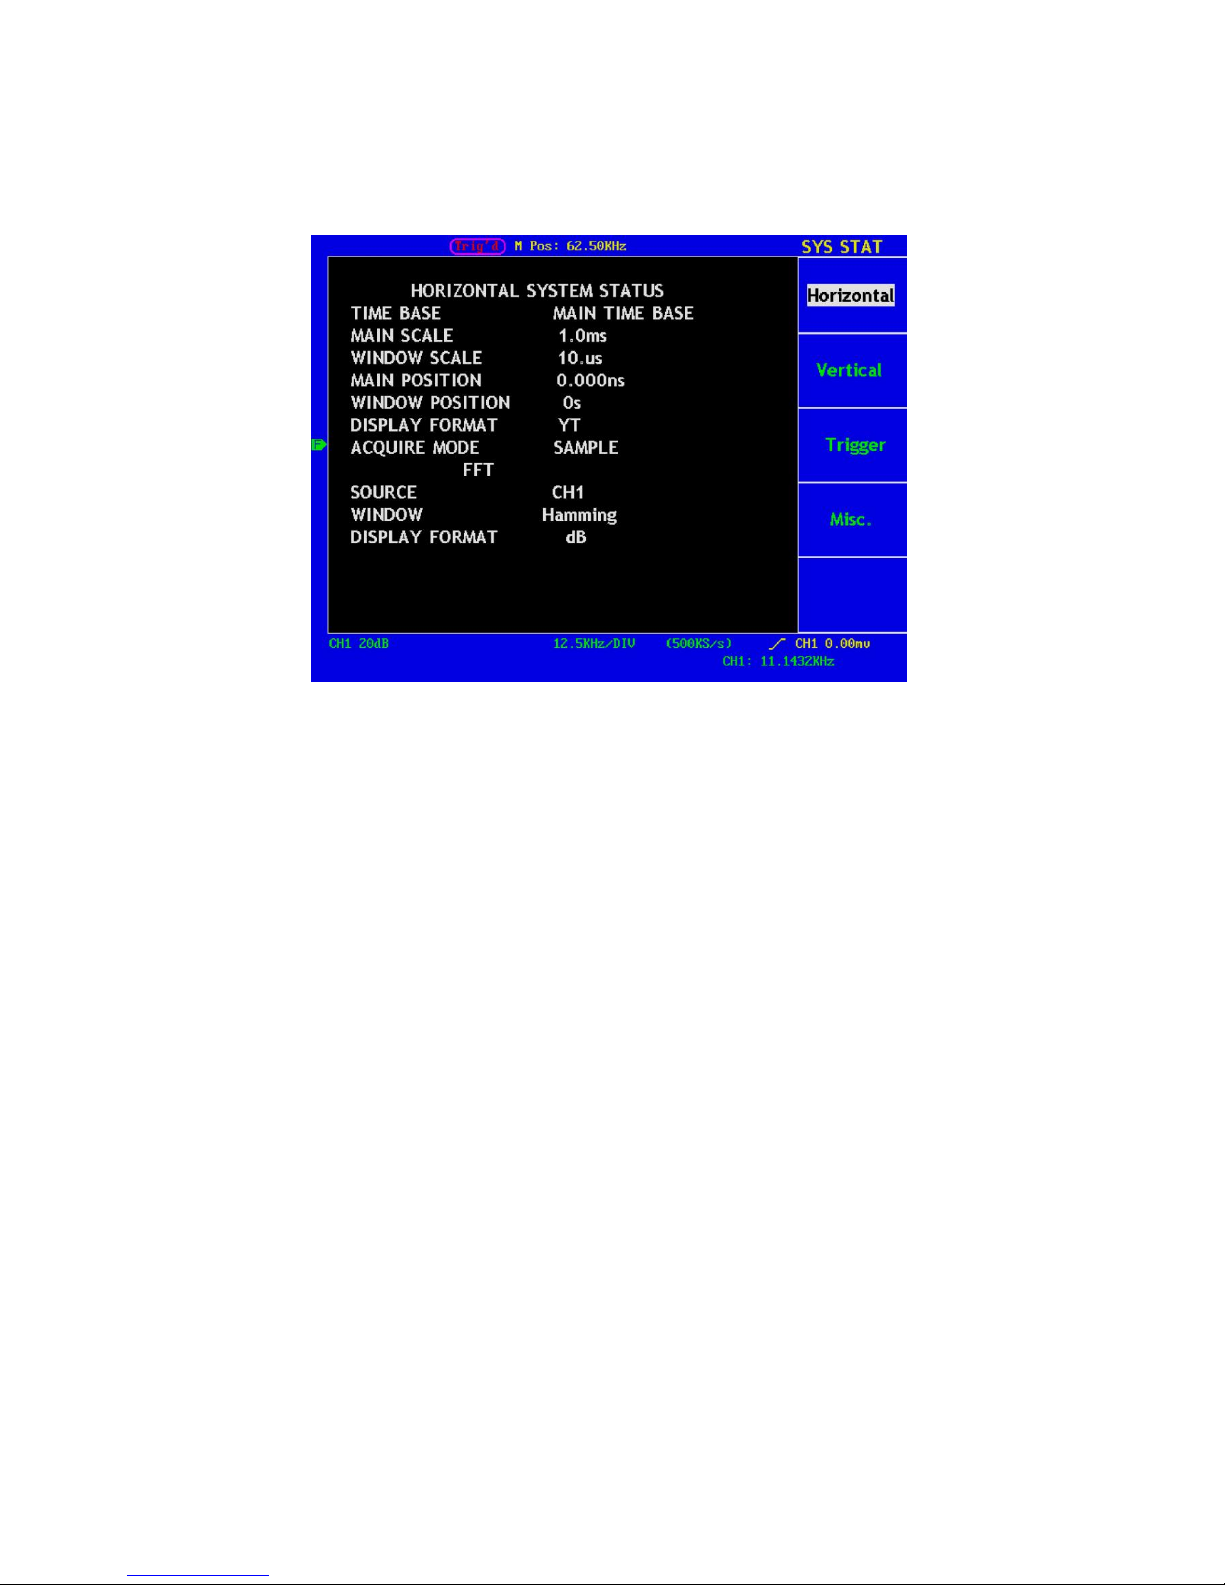
After entering into the SYS STAT menu, choose the corresponding function, with the corresponding
parameters shown in the screen. If press the F1 menu selection button and choose the function item
“Horizontal”, the Horizontal System State will be displayed in the screen. Press any other function button and
exit from the SYS STAT menu (see Fig. 64).
Fig. 64 Horizontal System State
-177-
Page 62

38. How to Implement the Automatic Measurement
With the Measure button pressed down, an automatic measurement can be implemented. There are 20 types
of measurements and 4 measurement results can be displayed simultaneously.
Press the F1 menu selection button to choose Source or Type menu. You can choose the channel to be
measured from the Source menu and choose the measurement Type (Freq, Period, Mean, PK–PK, and Cyc
RMS). The menu is displayed as Fig.65.
Fig. 65 Measure Menu
-178-
Quelle
Typ
Anzeige
Page 63

Term interpretation:
Vpp: Peak-to-Peak Voltage.
Vmax: The maximum amplitude. The most positive peak voltage measured over the entire waveform.
Vmin: The minimum amplitude. The most negative peak voltage measured over the entire waveform.
Vamp: Voltage between Vtop and Vbase of a waveform
Vtop: Voltage of the waveform’s flat top, useful for square/pulse waveforms.
Vbase: Voltage of the waveform’s flat base, useful for square/pulse waveforms.
Overshoot: Defined as (Vmax-Vtop)/Vamp, useful for square and pulse waveforms.
Preshoot: Defined as (Vmin-Vbase)/Vamp, useful for square and pulse waveforms.
Average: The arithmetic mean over the entire waveform.
Vrms: The true Root Mean Square voltage over the entire waveform.
Rise Time: Time that the leading edge of the first pulse in the waveform takes to rise from 10% to 90% of
its amplitude.
Fall Time: Time that the falling edge of the first pulse in the waveform takes to fall from 90% to 10% of its
amplitude.
+Width: The width of the first positive pulse in 50% amplitude points.
-Width: The width of the first negative pulse in the 50% amplitude points.
Delay 1→2 : The delay between the two channels at the rising edge.
Delay 1→2 : The delay between the two channels at the falling edge.
+Duty: +Duty Cycle, defined as +Width/Period.
-Duty: -Duty Cycle, defined as -Width/Period.
39. Measure
Four automatic measured values can be detected on each channel simultaneously. Only if the waveform
channel is in the ON state can the measurement be carried out. No automatic measurement can be made in
the following situation: 1) on the saved waveform. 2) on the mathematical waveform. 3) on the XY format. 4)
on the Scan format.
Measure the frequency, the peak-to-peak value of the Channel CH1 and the mean, the RMS of the Channel
CH2, following below steps:
1. Press the F1 menu selection button and choose Source.
2. Press the F2 menu selection button and choose CH1.
3. Press the F3 menu selection button and choose CH1.
4. Press the F4 menu selection button and choose CH2.
5. Press the F5 menu selection button and choose CH2.
6. Press the F1 menu selection button and choose Type.
7. Press the F2 menu selection button and choose Freq.
8. Press the F3 menu selection button and choose Pk-Pk.
9. Press the F4 menu selection button and choose Mean.
10. Press the F5 menu selection button and choose Cyc RMS.
-179-
Page 64

The measured value will be displayed in the reading window automatically (see Fig. 66).
Fig. 66 Automatic Measurement
40. How to Implement the Cursor Measurement
Press the CURSOR button to display the cursor measurement function menu (CURS MEAS) in the screen.
the Cursor Measurement for normal model:
The cursor measurement includes Voltage Measurement and Time Measurement at normal model,
shown as Fig. 67.
Fig. 67 CURS MEAS Menu
-180-
Page 65

The description of the cursor measurement menu is shown as the following table:
Function Menu
Setting
Description
Type
OFF
Voltage
Time
Switch off the cursor measurement.
Display the voltage measurement cursor and menu.
Display the time measurement cursor and menu.
Source
CH1
CH2
Display the channel generating the waveform to which the
cursor measurement will be applied.
Delta
Read the difference between cursors.
Cursor 1
Read the position of Cursor 1 (the Freq. is read with
reference to the horizontal trigger position and the Vamp is
to the ground point).
Cursor 2
Read the position of Cursor 2 (the Freq. is read with
reference to the horizontal trigger position and the Vamp is
to the ground point).
When carrying out the cursor measurement, the position of Cursor 1 can be adjusted with the CURSOR1
(VERTICAL POSITION) knob of Channel 1, and that of Cursor 2 can be adjusted with the CURSOR2
(VERTICAL POSITION) knob of Channel 2.
Perform the following operation steps for the voltage cursor measurement of the channel CH1:
1. Press CURSOR and recall the CURS MEAS menu.
2. Press the F1 menu selection button to choose Voltage for Type, with two purple dotted lines displayed
along the horizontal direction of the screen, which indicating CURSOR1 and CURSOR2.
3. Press the F2 menu selection button and choose CH1 for Source.
4. Adjust the positions of CURSOR1 and CURSOR2 according to the measured waveform, with the
absolute value of the voltage amplitude difference between Cursor 1 and Cursor 2 displayed in the
increment window. The current position of Cursor1 is displayed in the Cursor1 window and that of
Cursor2 is displayed in the Cursor2 window (see Fig.68).
Fig. 68 Waveform of Voltage Cursor Measurement
-181-
Page 66
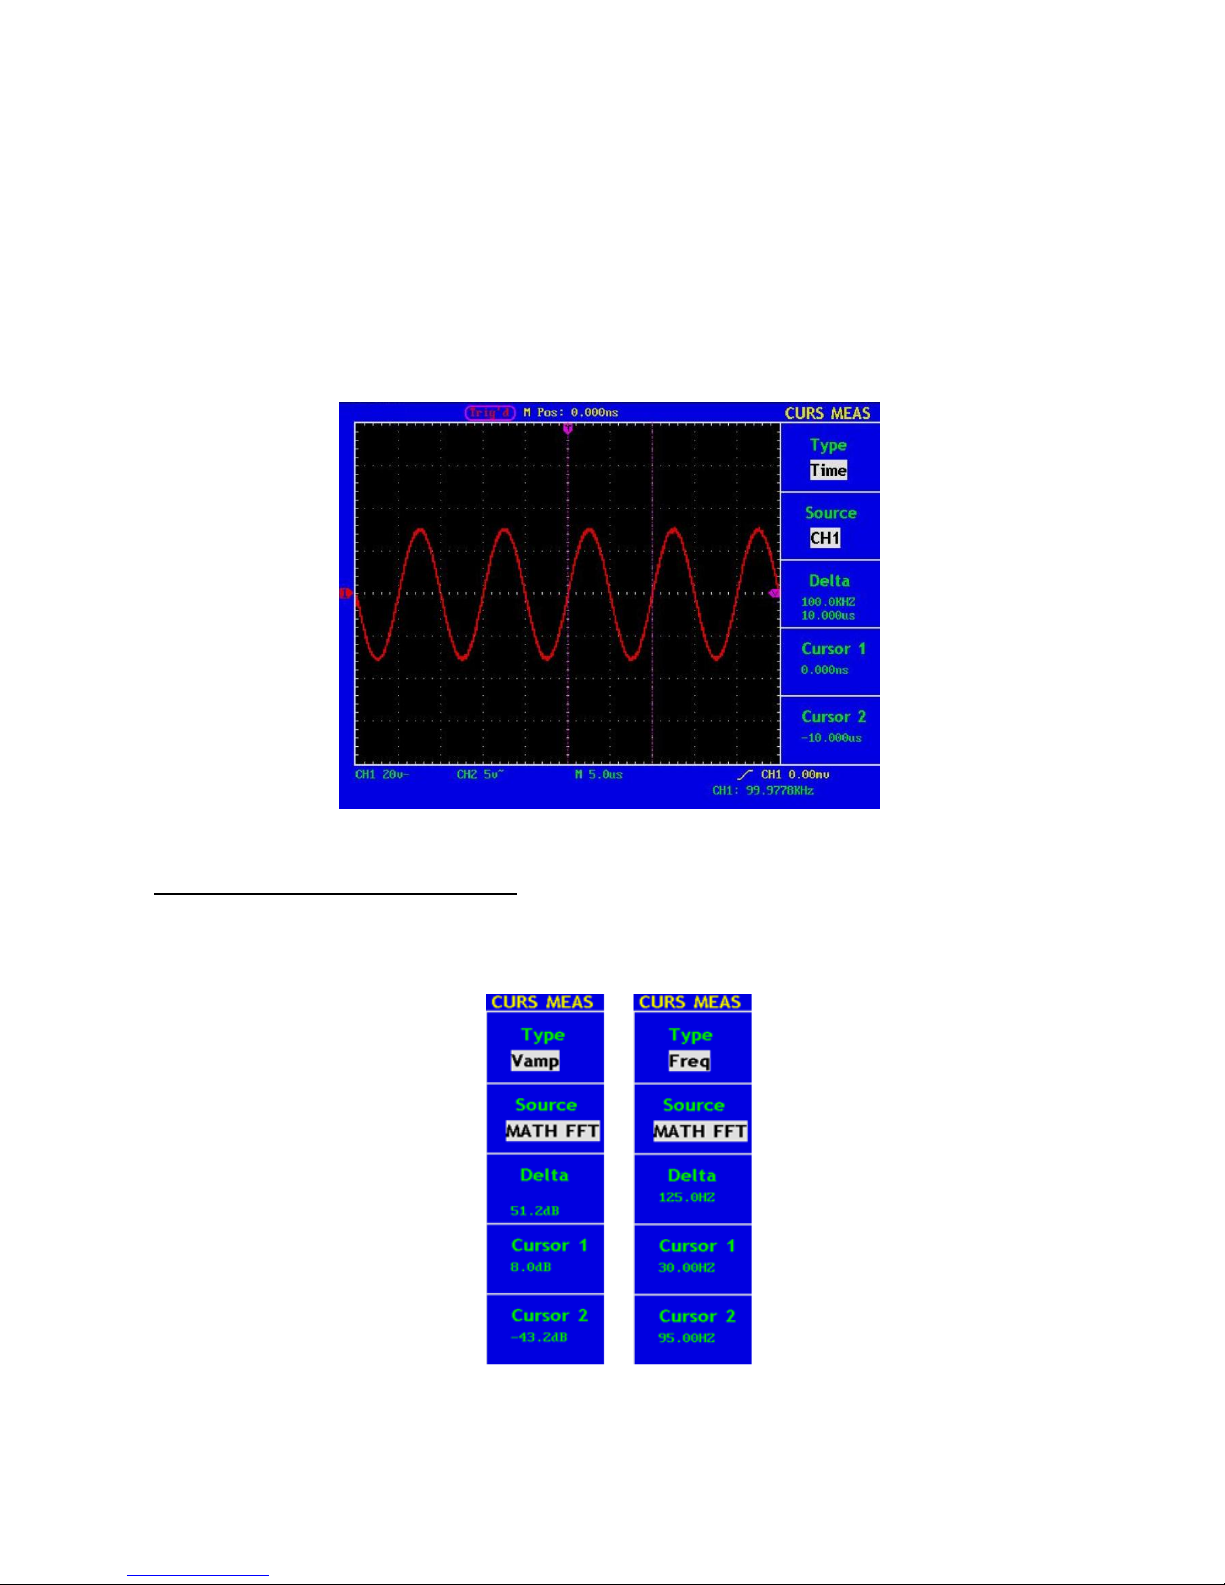
Carry out the following operation steps for the time cursor measurement of the channel CH1:
1. Press “CURSOR” and recall the CURS MEAS menu.
2. Press the F1 menu selection button and choose Time for Type, with two purple dotted lines displayed
along the vertical direction of the screen, which indicating Cursor 1 and Cursor 2.
3. Press the F2 menu selection button and choose CH1 for Source.
4. Adjust the positions of CURSOR1 and CURSOR2 according to the measured waveform, with the period
and frequency of Cursor1 and Cursor 2 displayed in the increment window. The current position of
Cursor1 is displayed in the Cursor1 window and that of Cursor2 is displayed in the Cursor2 window (see
Fig. 69).
Fig. 69 Wave Form of Cursor Measurement
The Cursor Measurement for FFT model:
Press the CURSOR button to display the cursor measurement function menu (CURS MEAS) in the screen,
which includes Vamp Measurement and Freq Measurement at the mode of FFT, shown as Fig. 70.
Fig. 70 CURS MEAS Menu
-182-
Page 67
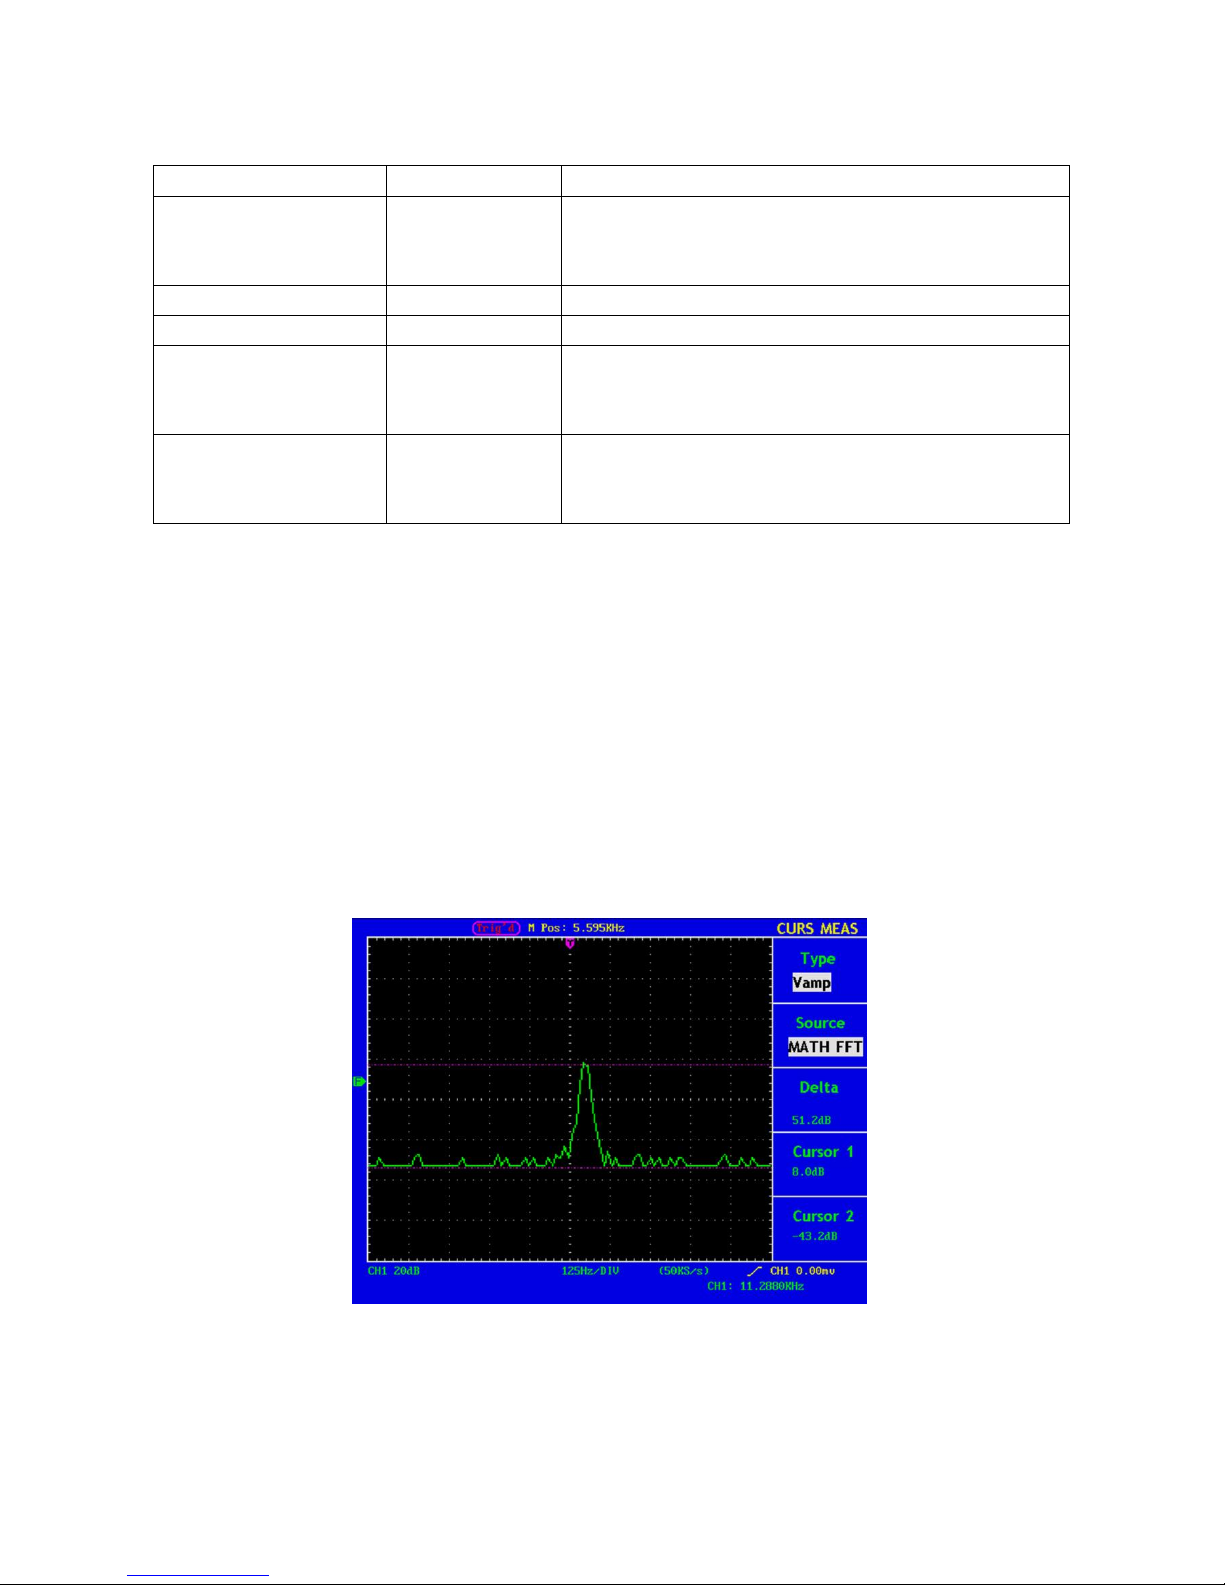
The description of the cursor measurement menu is shown as the following table:
Function Menu
Setting
Description
Type
OFF
Vamp
Freq
Switch off the cursor measurement.
Display the Vamp measurement cursor and menu.
Display the Freq measurement cursor and menu.
Source
MATH FFT
Display the channel for the cursor measure.
Delta
Read the difference between cursors.
Cursor 1
Read the position of Cursor 1 (the Freq is read with
reference to the start point of freq spectrum and the Vamp
is to the cursor F).
Cursor 2
Read the position of Cursor 2 (the Freq is read with
reference to the start point of freq spectrum and the Vamp
is to the cursor F).
When carrying out the cursor measurement, the position of Cursor 1 can be adjusted with the CURSOR1
(VERTICAL POSITION) knob of Channel 1, and that of Cursor 2 can be adjusted with the CURSOR2
(VERTICAL POSITION) knob of Channel 2.
Perform the following operation steps for the Vamp cursor measurement:
1. Press CURSOR and recall the CURS MEAS menu.
2. Press F1 and choose Vamp for Type, with two purple dotted lines displayed along the horizontal direction
of the screen indicating CURSOR1 and CURSOR2.
3. Adjust the positions of CURSOR1 and CURSOR2 according to the measured waveform, with the
absolute value of the Vamp amplitude difference between Cursor 1 and Cursor 2 displayed in the
increment window. The current position of Cursor1 is displayed in the Cursor1 window and that of
Cursor2 is displayed in the Cursor2 window (see Fig.71).
Fig. 71 wave of Vamp cursor measurement
-183-
Page 68

Carry out the following operation steps for the Freq cursor measurement:
1. Press CURSOR and recall the CURS MEAS menu.
2. Press F1 and choose Freq for Type, with two purple dotted lines displayed along the vertical direction of
the screen indicating the corresponding Cursor 1 and Cursor 2
3. Adjust the positions of CURSOR1 and CURSOR2 according to the measured waveform, with the period
and frequency of Cursor1 and Cursor 2 displayed in the increment window. The current position of
Cursor1 is displayed in the Cursor1 window and that of Cursor2 is displayed in the Cursor2 window (see
Fig.72).
Fig. 72 wave of Freq cursor measurement
41. How to use Autoscale
The function is applied to follow-up signals automatically even if the signals change at any time. Autoscale
enables the instrument to set up trigger mode, voltage division and time scale automatically according to the
type, amplitude and frequency of the signals.
The menu is as follows:
Function Menu
Setting
Instruction
Autoscale
OFF
ON
Turn off Autoscale.
Turn on Autoscale.
Mode
Vertical
Horizontal
HORI—VERT
Follow-up and adjust vertical scale without changing horizontal
setting.
Follow-up and adjust horizontal scale without changing vertical
setting.
Follow-up and adjust the vertical and horizontal settings.
Wave
Only show one or two periods.
Show Multi-period waveforms.
-184-
Page 69

If you want to measure the two-channel signal, you can do as the follows:
1. Press Autoscale, the function menu will appear on the right of the screen.
2. Press F1 and choose ON.
3. Press F2 and choose Horizontal- Vertical for Mode item.
4. Press F3 and choose for Wave item.
Then the wave is displayed in the screen, shown as Fig. 73.
Fig. 73 Autoscale Horizontal- Vertical multi-period waveforms
Fig. 74 Autoscale Horizontal- Vertical mono-period waveform
-185-
Page 70

Note:
1. Entering into Autoscale function and flicker will be on the top left corner. (flicker every 0.5 second)
2. At the mode of Autoscale, the oscilloscope can self-estimate “Trigger Type” (Edge, Video, and Alternate)
and “mode” (Edge, Video). If now, you press “Trigger mode” or “Type”, the forbidden information will
display on the screen.
3. At the mode of XY and STOP status, pressing AUTO SET to enter into Autoscale, DSO switches to YT
mode and AUTO status.
4. At the mode of Autoscale, DSO is always in the state of DC coupling and AUTO triggering. In this case,
the forbidden information will be showing when making Triggering or Coupling settings.
5. At the mode of Autoscale, if adjust the vertical position, voltage division, trigger level or time scale of CH1
or CH2, the oscilloscope will turn off Autoscale function and if press AUTOSET again, the oscilloscope will
enter into Autoscale.
6. Turn off the submenu at the Autoscale menu, the Autoscale is off and turn on the submenu still enters into
the function.
7. When video triggering, the horizontal time scale is 50us. If one channel is showing edge signal, the other
channel is showing video one, the time scale refers to 50us as video one as standard.
8. While the Autoscale is working, below settings will be made forcibly:
* The unit will switch from non-main time base to main time base status.
* The unit will switch to Peak detection menu while in the state of Average sampling mode.
-186-
Page 71

42. How to Use Executive Buttons
AUTOSET
This button is used for the automatic setting of all control values of the instrument to generate the waveform
suitable for observation. Press the AUTOSET button and the oscilloscope will perform the fast automatic
measurement of the signal.
The function items of AUTOSET are shown as the following table:
Function Items
Setting
Acquisition Mode
Current
Vertical Coupling
DC
Vertical Scale
Adjust to the proper division.
Bandwidth
Full
Horizontal Level
Middle
Horizontal Sale
Adjust to the proper division
Trigger Type
Current
Trigger Source
Show the minimum number of channels.
Trigger Coupling
Current
Trigger Slope
Current
Trigger Level
Mid-point Setting
Trigger Mode
Auto
Display Format
YT
RUN/STOP
Enable or disable the waveform sampling.
Note: Under the Stop state, the vertical division and the horizontal time base of the waveform can be
adjusted within a certain range, in other words, the signal can be expanded in the horizontal or
vertical direction.
When the horizontal time base equal to or is less than 50ms, the horizontal time base can be
expanded for 4 divisions downwards.
U-DISK COPY
Insert U disk into USB port, then press “COPY” key and you can save the waveform data into the U disk.
There are two formats available for choice: Vector format and Bitmap which the corresponding name will be
WAVE1.BIN, WAVE2.BIN, WAVE3.BIN……or WAVE1.BMP, WAVE2.BMP, WAVE3.BMP……. Then you can
open the files in computer by connecting USB disk to computer.
Note: You can choose to save a screenshot in BMP-format or a raw-data file in BIN-format in the UTILITY
menu. During the U disk saving procedure, some notes such as “Waveform saving”, “Waveform
saved”, “USB already connected”, “USB connection interrupt ” etc will be prompted.
-187-
Page 72

43. Logic analyzer
43.1. How to set sampling system
Sampling system is to set sample rate, storage depth and filter. Different sampling setting will result in different
measure results. In the same storage depth, the higher sample rate set, the shorter the continuance time for
signal will be. If the sample rate set too low, narrower pulse signal may get lost. So the sample rate and
storage depth should be set correctly according to the actual measuring signal. Press “E (ACQU)”and display
menu as the Fig. 75:
Fig. 75 Sampling menu
Function
Setting
Instruction
Sample rate
P 1190: 20 Sa/s – 500 MSa/s
P 1230: 20 Sa/s – 1 GSa/s
Storage depth
Low memory
General
Deep memory
Storage depth of 16K
Storage depth of 256K
Storage depth of 4M
Digital Filter
None
1
2
Filter closed
Filter one pulse of sample width
Filter two pulse of sample width
-188-
Page 73

Listing of corresponding continuance time to different sample rate and storage depth:
Sample rate
Storage depth
Continuance
Sample
Storage depth
Continuance
1 GHz
Low Memory
16 µs
100 kHz
Low Memory
General
High Memory
160 ms
2.56 s
40 s
500 MHz
Low Memory
32 us
50 kHz
Low Memory
General
High Memory
320 ms
5.12 s
80 s
250 MHz
Low Memory
64 µs
20 kHz
Low Memory
General
High Memory
800 ms
12.8 s
200 s
125 MHz
Low Memory
General
High Memory
128 µs
2.048 ms
32 ms
10 kHz
Low Memory
General
High Memory
1.6 s
25.6 s
400 s
62.5 MHz
Low Memory
General
High Memory
256 µs
4.096 ms
64 ms
5 kHz
Low Memory
General
High Memory
3.2 s
51.2 s
800 s
25 MHz
Low Memory
General
High Memory
640 µs
10.24 ms
160 ms
2 kHz
Low Memory
General
High Memory
8 s
128 s
2000 s
12.5 MHz
Low Memory
General
High Memory
1.28 ms
20.48 ms
320 ms
1 KHz
Low Memory
General
High Memory
16 s
256 s
4000 s
5 MHz
Low Memory
General
High Memory
3.2 ms
51.2 ms
800 ms
500 Hz
Low Memory
General
High Memory
32 s
512 s
8000 s
2.5 MHz
Low Memory
General
High Memory
6.4 ms
102.4 ms
1.6 s
200 Hz
Low Memory
General
High Memory
80 s
1280 s
20000 s
1 MHz
Low Memory
General
High Memory
16 ms
256 ms
4 s
100 Hz
Low Memory
General
High Memory
160 s
2560 s
40000 s
500 kHz
Low Memory
General
High Memory
32 ms
512 ms
8 s
50 Hz
Low Memory
General
High Memory
320 s
5120 s
80000 s
200 kHz
Low Memory
General
High Memory
80 ms
1.28 s
20 s
20 Hz
Low Memory
General
High Memory
800 s
12800 s
200000 s
Follow up steps to set the measurement for data bus of 33M clock:
Sample rate: 125M Storage depth: 4M
Filter: none
-189-
Page 74

Setting steps as below:
1. Press “E(ACQUIRE)” and sample menu appears.
2. Press “F1”repeatly or turn “CH1 Volts/div” knob till sample rate set as “125M”
3. Press “F2” till storage depth display as “Deep Memory”.
4. Press “F3” till digital filter display as “None”.
Then sample system setting finished (refer to Fig. 76).
Fig. 76 Sampling setting
43.2. How to set trigger system
Trigger system including “Trigger level” adjust knob, “Trigger menu”, “SET 50%”, “Set to Zero”. Trig level
adjust knob is to adjust trigger position. Since the digital storage depth is fixed so the proportion of storage
data between pre-trigger points and re-trigger ones depend on trigger position. Trigger mode including: Edge
trigger, bus trigger, pattern trigger, sequential queue trigger, distributed queue trigger.
-190-
Page 75

1. Edge trigger:
make a channel as trigger source and set rising edge, falling edge or either edge as trigger condition to
generate trigger. Edge trigger menu refer to Fig. 77.
Fig. 77 Edge trigger menu
Edge trigger function menu as below:
Function
Settings
Instructions
Source
CH00~CH0F
CH00-CH0F can be set as trigger resource
Slope
Rising
Falling
Either
Trigger on the rising edge.
Trigger on the falling edge.
Trigger either on rising edge or falling edge.
For example:
To measure a 3 lines SPI signal which includes enable, clock and data. The data get into effective when
enable is low voltage. We use CH00, CH01, CH02 to measure the data, CH00 to measure enable signal,
CH01 and CH02 to measure clock and data. Trigger setting steps as below:
1. Press “Trigger menu” and menu appears.
2. Press “F1” till trigger mode display as “Edge”.
3. Press “F2” till source display as “CH00”
4. Press “F3” till type display as “Falling”.
-191-
Page 76
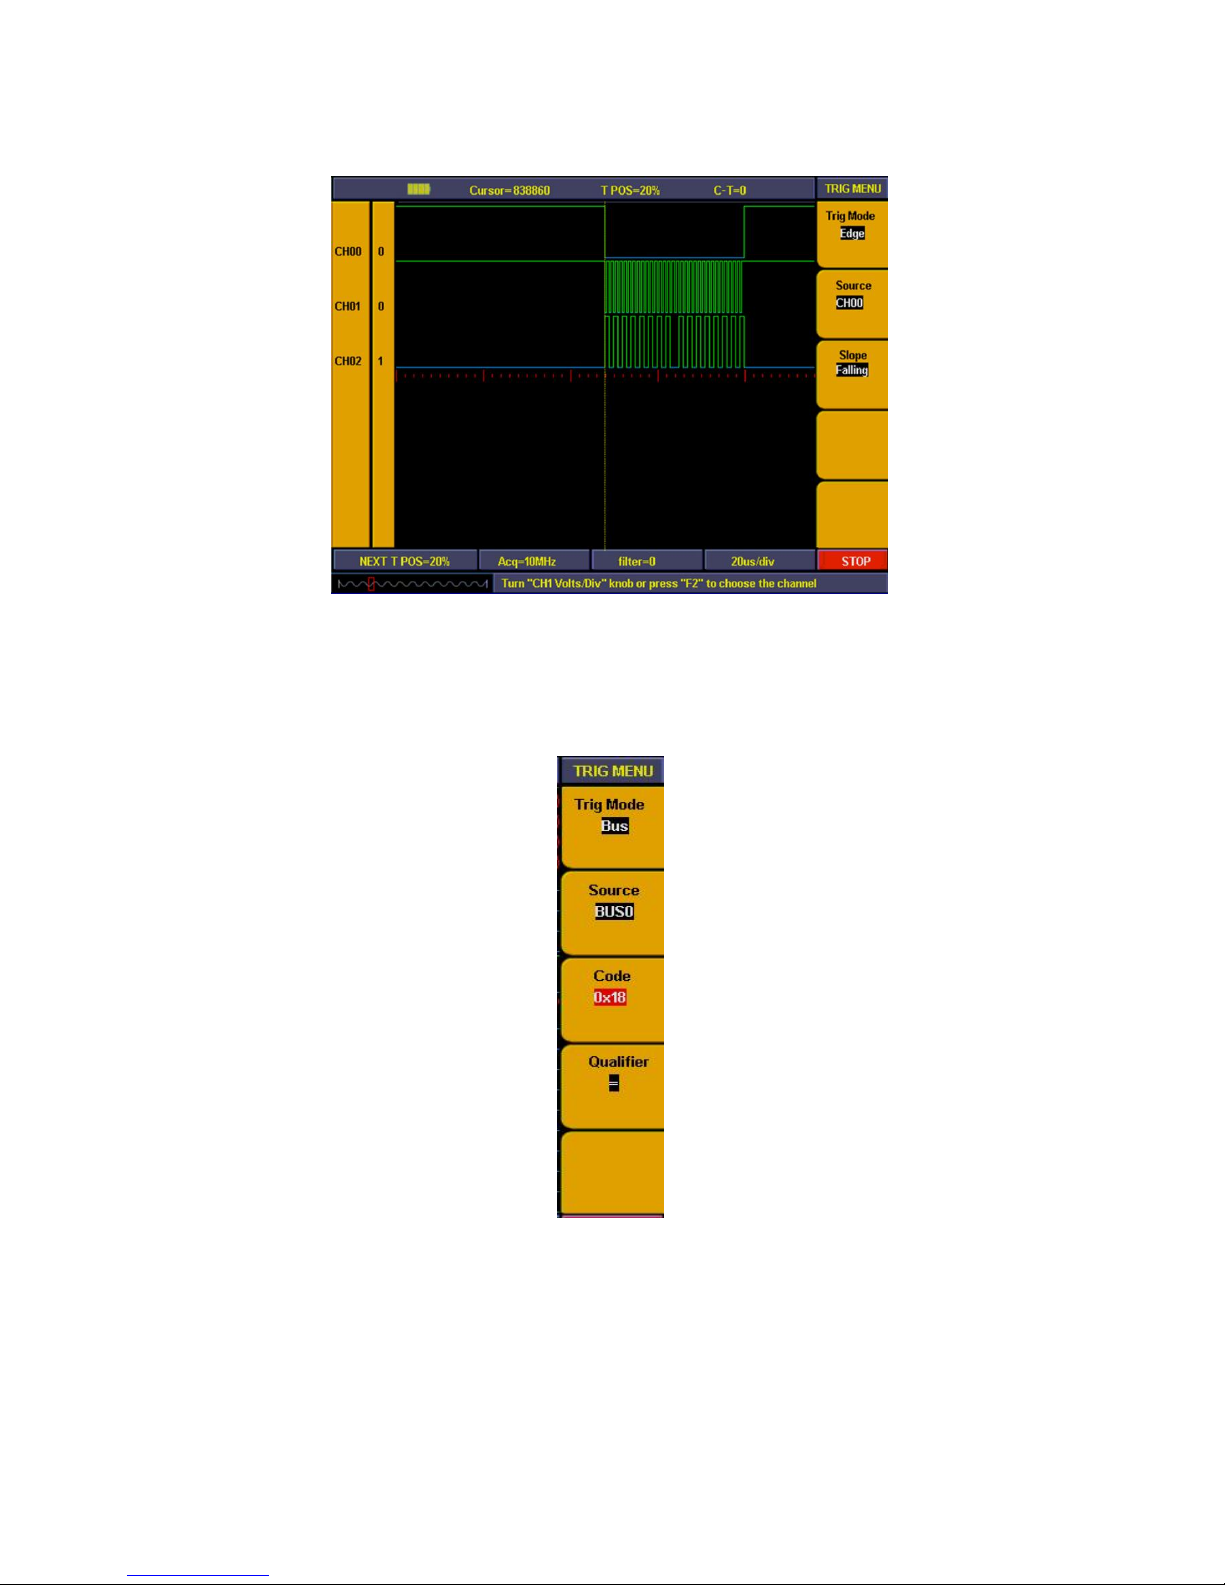
Then trigger setting is finished (refer to Fig. 78) and ready for data acquisition.
Fig. 78 Edge trigger setting
2. BUS trigger:
Set BUS as trigger source and make data on BUS as the trigger condition to make trigger. BUS trigger menu
refer to Fig. 79:
Fig. 79 Bus trigger menu
-192-
Page 77

Bus trigger menu as below:
Function
Setting
Instruction
Source
BUS0 ~ BUS3
BUS0 to BUS3 can be set as trigger source
Code
0x0000~0xffff
(HEX)
0~65535
(DEC)
Can be set discretionarily between 0x0000 and 0xffff (HEX) or
between 0 and 65535 (DEC) according to the bus and code
setting.
Qualifier
=
>=
<=
Trigger occur when the Bus value equal to the set code.
Trigger occur when the Bus value is more than or equal to the set
code
Trigger occur when the Bus value is less than or equal to the set
code
For example:
To measure an 8 bit data signal we need to observe when data value as 0X18 how the data changed before
and after. We set the BUS0 to include CH00~CH07 and use channel CH00~CH07 to measure the signal.
Trigger setting steps as below:
1. Press “Trigger menu” and menu appears.
2. Press “F1” till trigger mode display as “Bus”
3. Press “F2” till signal source display as “BUS0”
4. Press “F3” and data in code type as red background and green digital indicator on, then insert data value
“18” and set code as “0X18”. Press “F3” again and red background disappeared. Repeat operation of
step D if setting error or need to be modified,
5. Press “F4” till type display as “=”
6. Turn “Trigger level ” adjust knob or press “set 50%”till trigger position display as “NEXT T POS = 50%”.
BUS trigger setting is finished and ready for data acquisition (ref to Fig. 80).
Fig. 80 Bus trigger
-193-
Page 78

3. Pattern trigger:
Set channel as signal source and make high/low voltage for channel as trigger condition combination to get
trigger (refer to Fig. 81).
Fig. 81 Pattern trigger menu
Pattern trigger menu as below:
Function
Setting
Instruction
Channel choice
CH00~CH0F
x0100000
00000000
Select the channel to set signal pattern.
16 channel status indicator.
X: don’t care
0: low
1: high
CH00~CH0F
Don’t Care
Low
High
No trigger occur.
Trigger occur when signal on the low level
Trigger occur when signal on the high level.
-194-
Page 79

To observe the 16 channel data need to know how data changed before and after when "BIT0-BIT3" STATE is
“0111”.
1. Press “Trigger menu” and menu appears.
2. Press “F1” till trigger mode display as “Pattern”
3. Press “F2” or turn “CH1 Volts/div” knob till “CH SEL” display as “CH00”
4. Press “F3” till F3 window display as “CH00/High” and “CH00” in F2 window display as “1”.
5. Repeat operation of step D and set CH01, CH02 to “High” and CH03 as “Low”,CH04~CH0F set as
“Don’t care”.
Pattern trigger setting finished (refer to Fig. 82) and ready for data acquisition.
Fig. 82 Pattern trigger
-195-
Page 80

4. Sequential queue trigger:
Make BUS as trigger source and continuous setting data in BUS as trigger condition to generate trigger and
also can set 8 data at the same time.( See Fig. 83)
Fig. 83 Sequential queue trigger
Sequential queue trigger function as below:
Function
Setting
Instruction
Source
BUS0~BUS3
Select the trigger source from BUS0~BUS3
Code
0x0000~0xffff
(HEX)
0~65535
(DEC)
Can be set discretionarily between 0x0000 and 0xffff (HEX)
or between 0 and 65535 (DEC)according to the bus and code setting.
Add Add the code type to the queue
Delete
Delete the code type from the queue
-196-
Page 81

For example:
To set a 16 bit data Bus signal, there will have 4 value as 0X9999, 0X9998, 0X9997, 0X9996 in the bus. We
set BUS0 to include 16 measure channels and make above 4 values as trigger condition to observe the data
bus. Trigger setting follow up below steps:
1. Press “Trigger MENU” and menu appears.
2. Press “F1” till trigger mode display as “Sequential Queue”.
3. Press “F2” till signal source display as “BUS0”
4. Press “F3” and data in code type as red background and green digital indicator on, then insert data value
“0X9999” and set code as “0X9999”. Press “F3” again and red background disappeared. Repeat
operation of step D if setting error or need to be modified,
5. Press “F4” and add setting value into the trigger queue, then info window will display the value of
“0X9999”.
6. Repeat the operation of step D. E, and add “0X9998”, “0X9997”, “ 0X9996” to trigger queue. Then
info window will display value of “0X9999”, “0X9998”, “ 0X9997”, “ 0X9996”.
7. Press “F5” and delete the queue value if queue adding in error and add again.
8. Turn “Trigger level ” adjust knob or press “set 50%”till trigger position display as “NEXT T POS = 50%”.
Then sequential queue trigger setting finished (refer to Fig. 84) and data ready for acquisition.
Fig. 84 Sequential queue trigger
-197-
Page 82

5. Distributed queue trigger:
Make BUS as trigger source and discontinuous setting data in BUS as trigger condition to generate trigger and
also can set 8 data at the same time. Distributed queue trigger menu refer as Fig. 85.
Fig. 85 Distributed queue trigger menu
Distributed queue trigger function as below:
Function
Setting
Instruction
Source
BUS0~BUS3
Select the trigger source from BUS0~BUS3
Code
0x0000~0xffff (HEX)
0~65535(DEC)
Can be set discretionarily between 0x0000 and 0xffff (HEX) or
between 0 and 65535 (DEC) according to the bus and code
setting.
Add Add the code type to the queue
Delete
Delete the code type from the queue
Setting operation are same as sequential trigger setting.
Fig. 86 Distributed queue trigger
-198-
Page 83
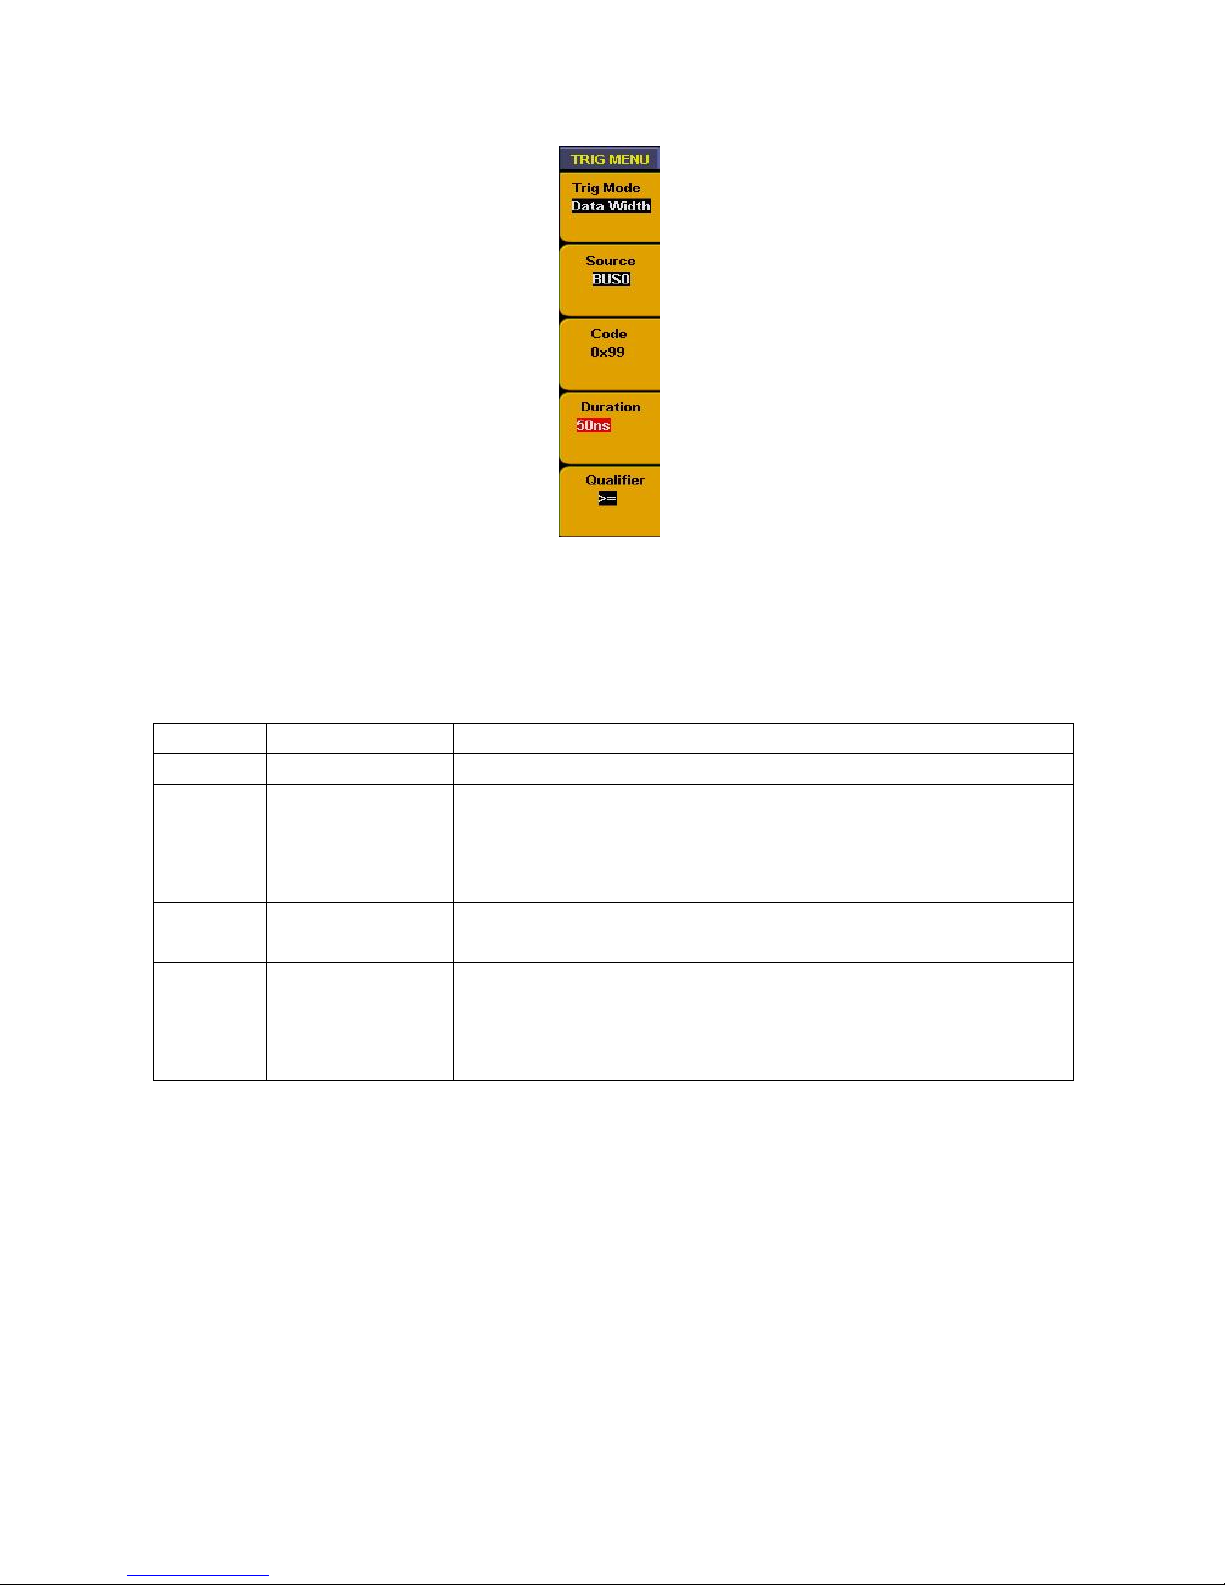
6. Data width queue trigger:
Fig. 87 Duration trigger menu
Make BUS as trigger source and continuous duration in BUS as trigger condition to generate trigger. Duration
trigger menu refer to Fig. 87.
Duration trigger function as below:
Function
Setting
Instruction
Source
BUS0~BUS3
Select the trigger source from BUS0~BUS3
Code
0x0000~0xffff
(HEX)
0~65535
(DEC)
Can be set discretionarily between 0x0000 and 0xffff (HEX) or between
0 and 65535 (DEC) according to the bus and code setting.
Duration
10 ns ~ 50 s
The duration width can be set from 10ns (1-2-5) to 10.00us (1-2-5)
according to the sampling rate from high to low.
Qualifier
>=
<=
Trigger occur on condition that the bus value is equal to the code type
and the duration is more than or equal to the duration width.
Trigger occur on condition that the bus value is equal to the code type
and the duration is less than or equal to the duration width.
-199-
Page 84
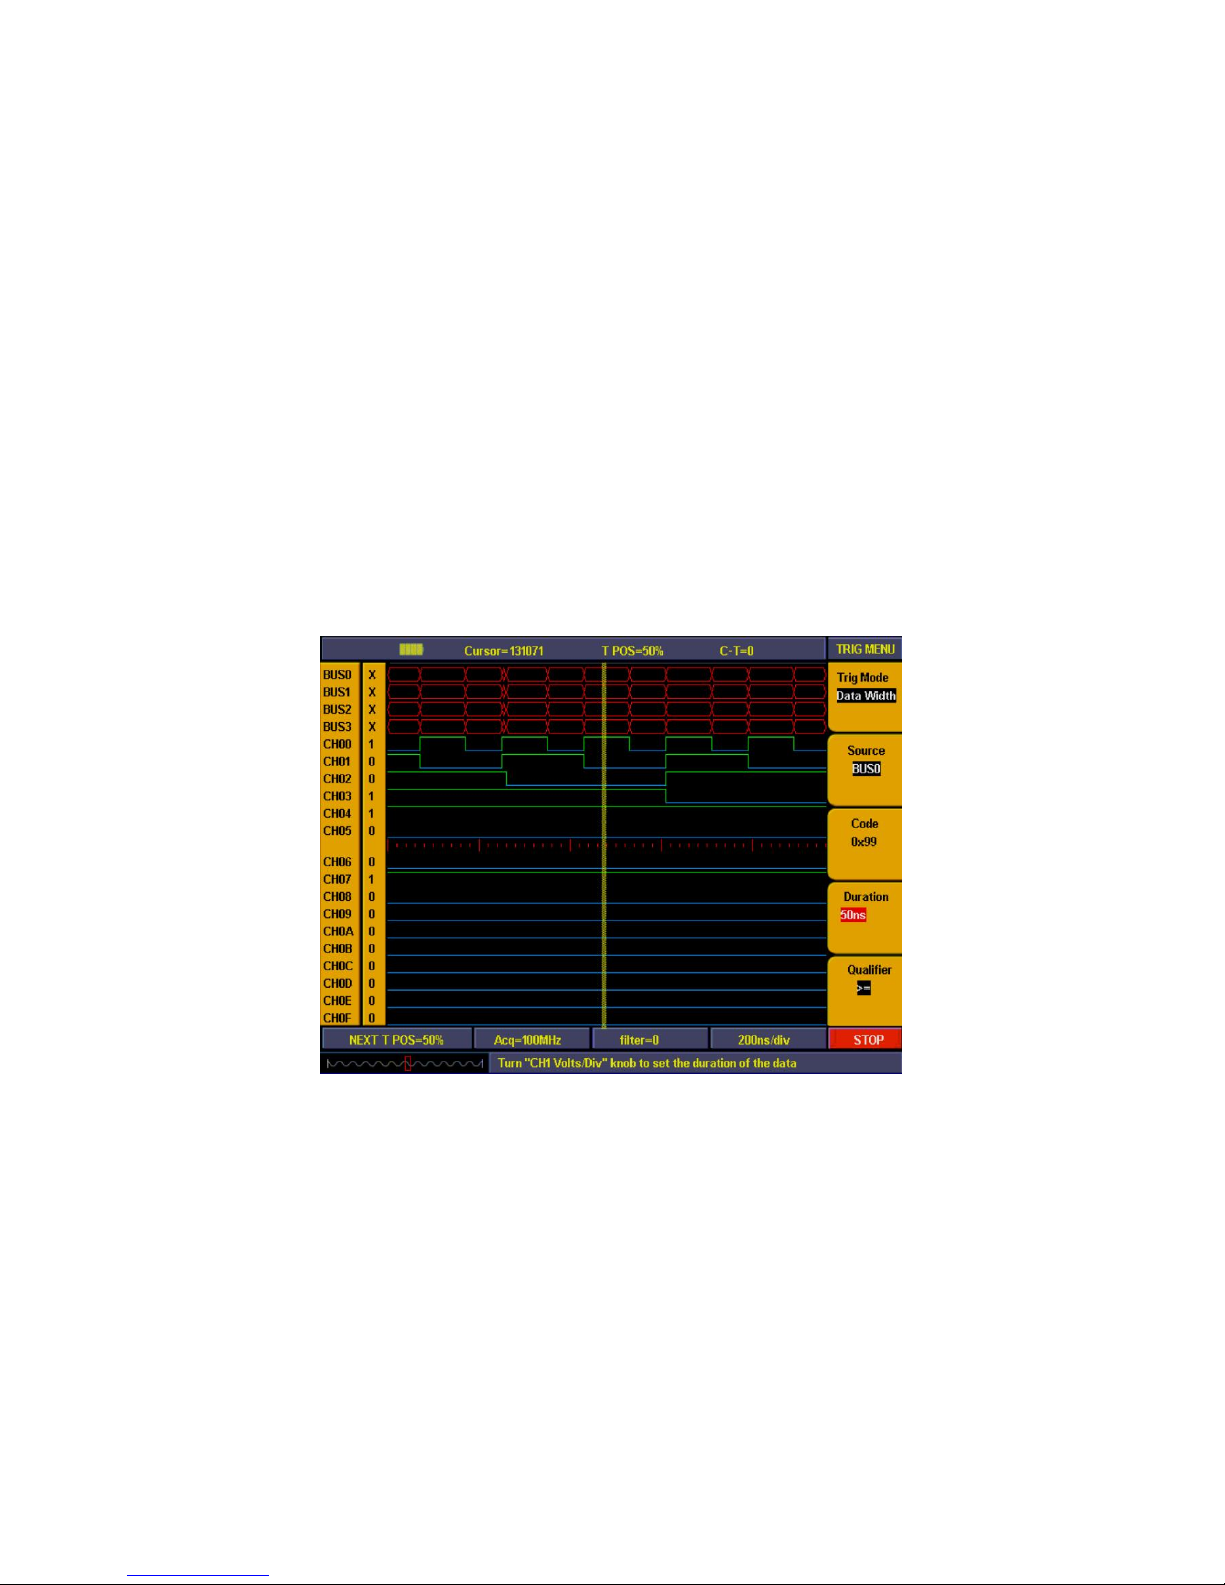
For example:
Measure a 16 bit data bus signal, bus will appear data of “0X99” and continuous time is 50ns. We set BUS0 to
include 16 measurement channels and sample rate as “100M”, trigger setting as duration trigger. Setting steps
as below:
1. Press “Trigger MENU” and menu appears.
2. Press “F1” till trigger mode display as “Data Width”
3. Press “F2” till signal resource display as “BUS0”
4. Press “F3” and data in code type as red background and green digital indicator on, then insert data value
“0X99”. Press “F3” again and red background disappeared. Repeat operation of step D if setting error or
need to be modified,
5. Press “F4” and duration in menu setting window correspond to F4 display red background. Turn “CH1
Volts/Div” knob and set duration as “50ns”.
6. Press “F5” till qualifier display as “>=”
7. Turn “Trigger level ” adjust knob or press “set 50%”till trigger position display as “NEXT T POS = 50%”.
Then duration trigger setting finished (refer to Fig. 88) and ready for data acquisition.
Fig. 88 Data width trigger
-200-
Page 85

43.3. How to set threshold
Threshold setting is quite important because wrong setting will result in wrong measurement. For example, if
measure signal is LVCMOS1.8V and set threshold as “CMOS/(2.5V) ” then all the measurement data will
become “0”. Threshold setting menu refer to Fig. 89.
Fig. 89 Threshold setting menu
Threshold menu function as below:
Function
Setting
Instruction
CH SEL
CH00~CH03
CH04~CH07
CH08~CH0B
CH0C~CH0F
16 channels can be divided into 4 groups to have individual setting
Threshold
voltage
CMOS/(2.5V)
LVCMOS3.3/(1.7V)
LVCMOS2.5/(1.3V)
LVCMOS1.8/(0.9V)
Custom
CMOS level and set threshold voltage as 2.5V
LVCMOS3.3V level and set threshold voltage as 1.7V
LVCMOS2.5V level and set threshold voltage as 1.3V
LVCMOS1.8V level and set threshold voltage as 0.9V
Level can be set discretionarily.
Voltage
-10 ~ +10V (forward
by 0.05V pace)
In custom, the voltage can be set from -10V to +10V with the pace of
0.05V.
-201-
Page 86

For example:
Measure a batch of CMOS voltage data signal in channel of CH00~CH03 and a batch of 1V voltage data in
CH04~CH07. Threshold voltage setting steps as below:
1. Press “1 (threshold) “and menu appears.
2. Press “F1” till channel source display as “CH00~CH03”
3. Press “F2” to choose threshold as “CMOS/(2.5V)”
4. Press “F1” till channel source display as “CH04~CH07”
5. Press “F2” to choose threshold as “custom”. Menu setting correspond to F3 display the setting voltage
value.
6. Turn “CH1 Volts/div” knob and set voltage value as “0.50V”
Threshold voltage setting finished (refer to Fig. 90).
Fig. 90 Threshold custom setting
-202-
Page 87

43.4. How to set display system
Display system is to set on/off for channel and BUS, also to adjust the contrast of panel display. Press
“A(DISPLAY)” and panel display as Fig. 91.
Fig. 91 Display menu
Display function menu as below;
Function
Setting
Instruction
Source
BUS
Channel
Choose resource as BUS
Choose resource as channel
BUS SEL.
CH SEL
BUS0~BUS3
CH00~CH0F
Among BUS0~BUS3
Among CH00~CH0F
display
ON
OFF
BUS or Channel on
Bus or Channel off
Contrast Increase
Contrast Decrease
Increases display contrast
Decreases display contrast
-203-
Page 88

For example:
Display channel as CH00~CH03 and BUS as BUS0, other channels and BUS all off. Follow up below steps:
1. Press “A(DISPLAY)” and display menu appears
2. Press “F1” till signal source display as “BUS”
3. Press “F2” till BUS No. display as “BUS0”
4. Press “F3” to choose signal display as “ON”.
5. Press “F2” till BUS No. display as “BUS1”.
6. Press “F3” to choose signal display as “OFF”. Repeat the operation of steps 5.6 and set BUS2, BUS3 as
“OFF”.
7. Press “F1” till signal source display as “Channel”
8. Press “F2” or turn “CH1 Volts/div” knob till channel display as “CH00”.
9. Press “F3” to choose signal source as “ON”.
10. Repeat operation of steps 8.9 and set CH01, CH02, CH03 as “ON”.
11. Press “F2” or turn “CH1 Volts/Div” knob till channel display as CH04.
12. Press “F3” to choose signal display as “OFF”.
13. Repeat operation of steps 8.9 and set CH05~CH0F all as “OFF”.
Channel display setting finished (refer to Fig. 92)
Fig. 92 Display setting
-204-
Page 89

43.5. How to set BUS
Logic-Analyzer includes four groups BUS (BUS0~BUS3). Every group can cover any channel even all
channels. BUS menu displayed as Fig. 93.
Fig. 93 Bus menu
BUS setting menu as below:
Function
Setting
Instruction
BUS
BUS0~BUS3
Choose BUS for operating
Channel
CH0F~CH00
1X111111
11111111
Choose any channel among CH00~CH0F
BUS channel complex indication: 1 for include; X for exclude
CH0F~CH00
Include
Exclude
The bus selected includes this channel
The bus selected excludes this channel.
Code
Type
HEX
DEC
All of the code type and measured value are HEX
All of the code type and measured value are DEC
-205-
Page 90

For example:
To set BUS0 as BUS to include CH00, CH01, CH02, CH03 and code as hex system. Follow up as below:
1. Press “0(BUS)” to and BUS menu appears
2. Press “F1” till BUS display as “BUS0”
3. Press “F2” or turn “CH1 Volts/div” knob till channel display as “CH00”
4. Press “F3” and set CH00 as “Include”. Then Channel CH00 refer to display of “1”
5. Repeat the operation of steps 2. 3 and set CH01, CH02, CH03 as “Include” and other channel as
“exclude”. Then “CH SEL” display as “XXXXXXXXXXXX1111”. BUS setting finished.
6. Press “F4” and set code type as “HEX”
BUS setting is finished (refer to Fig. 94).
Fig. 94 Bus setting
-206-
Page 91

43.6. How to measure
Measurement can take auto measure for values of 4 BUS synchronously. Press “measure” and BUS value for
current cursor position will display directly in measurement window.
BUS0 include CH00~CH03, BUS1 include CH00~CH07, BUS2 include CH00~CH0B, BUS3 include
CH00~CH0F.
4 BUS auto measurement display as Fig. 95:
Fig. 95 Bus measurement
-207-
Page 92
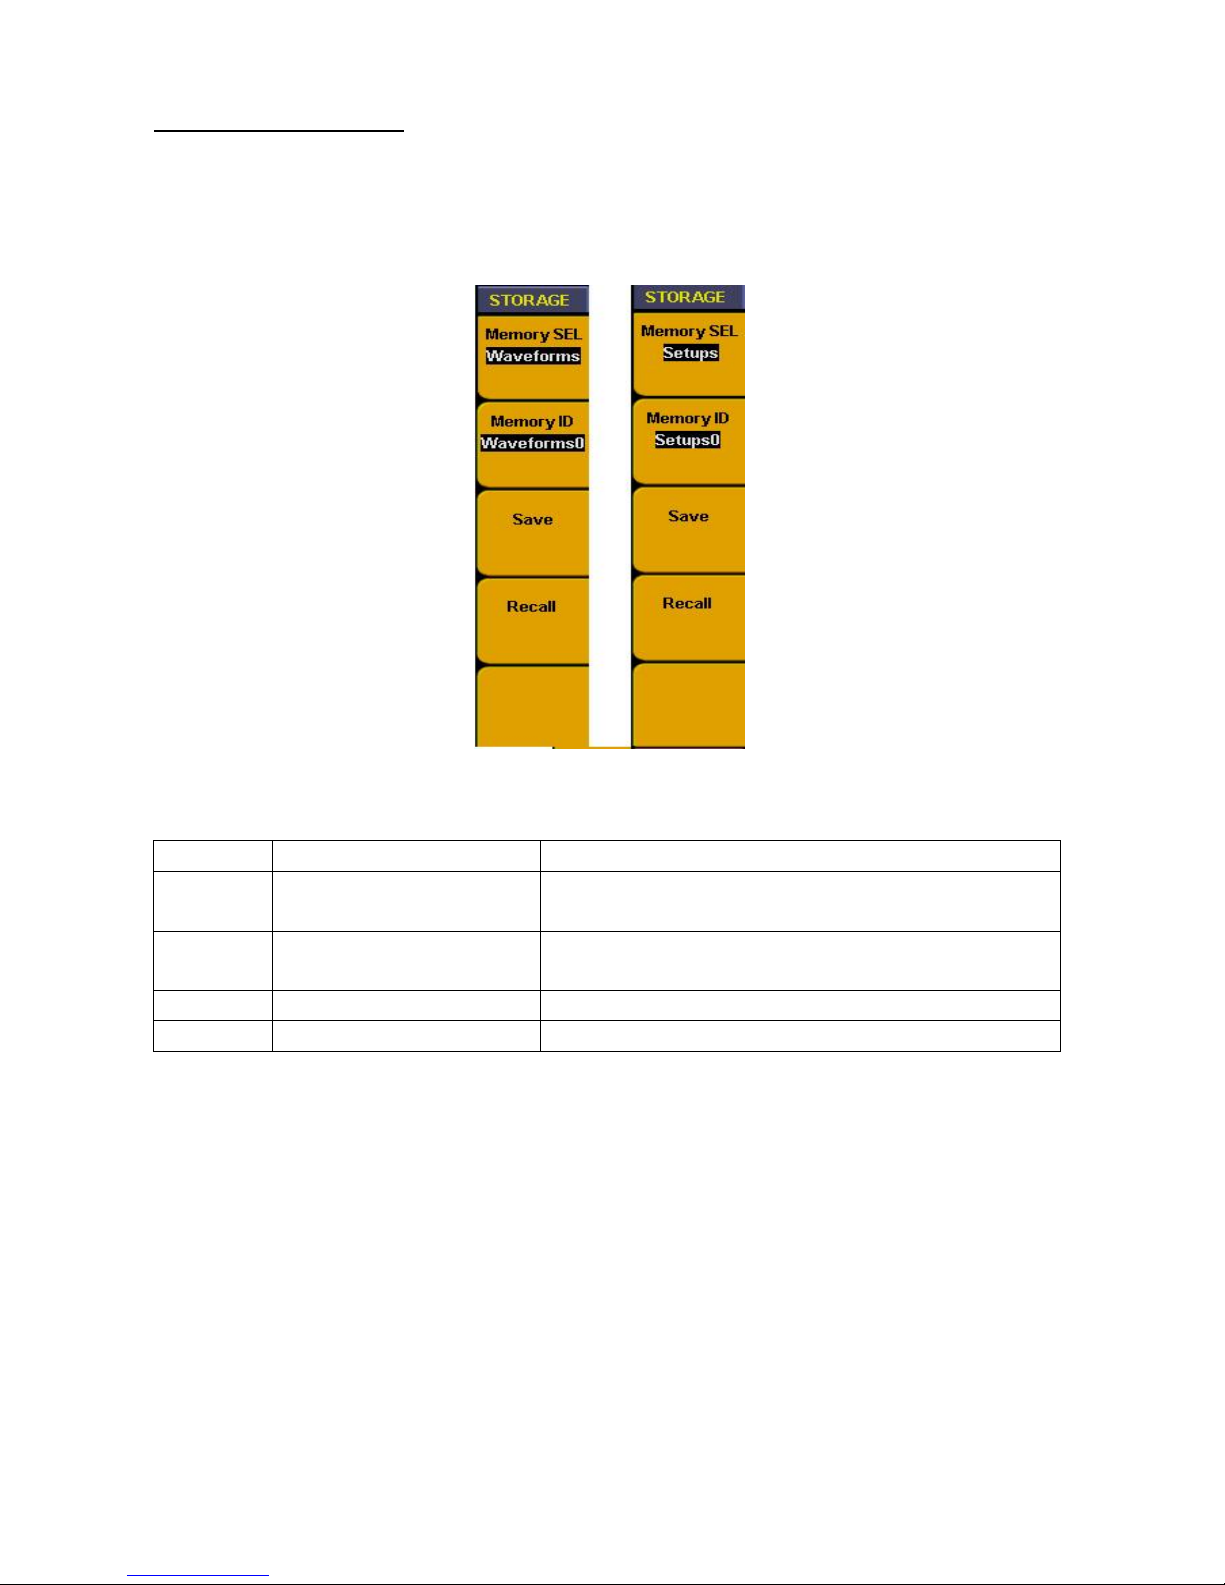
43.7. How to save and recall
Use the storage menu to save or recall waveforms and setting. The storage depth of waveform for sampling
storage is normal (256K) and low storage (16K). And it can be divided into 4 groups. Memory setting includes
current sampling setting, BUS setup, display setting, threshold setting and trigger setting. And it is possible to
save 10 groups of settings. Waveform storage and setting storage menu display as Fig. 96.
Fig. 96 Storage menu
Storage menu instruction as below:
Function
Setting
Instruction
Memory
SEL
Waveform
Setups
Waveform for storage or recall
Setups for storage or recall
Memory
ID
Wavefor~Waveform3
Setups 0~Setups 9
Storage 4 groups of waveform
Storage 10 groups of setups
Save
Save current waveform/setting in designated No.
Recall
Recall waveform/ setups in designated No.
-208-
Page 93

For example:
To set “WAVE 0” in memory ID to save current waveform and “setting 0” to save current setting.
Follow up below steps:
1. Press “C(SAVE/REL)” after data acquisition finished and storage menu appears
2. Press “F1” till storage display as “Waveform”
3. Press “F2” till memory ID. Display as “Waveform 0”
4. Press “F3” to save current display waveform. Info window will show “Waveform saving” then show as
“Waveform saved successfully” when storage finished.
5. Press “F1” till memory SEL as “Setups”
6. Press “F2” till memory ID. display as “Setups 0”
7. Press “F3” to save current various settings. Info window show “Setting saved successfully”.
8. Press “F4” to recall the memory waveform or settings (refer to Fig. 96)
Fig. 97 Waveform saving
-209-
Page 94

43.8. How to use USB flash disk to storage
Use USB flash disk is to storage acquired data. Insert U disk into USB port, then press “B” key and you can
save the waveform data into the U disk. There is two formats available for choice: Vector format and Bitmap
which the corresponding name will be WAVE1.BIN, WAVE2.BIN, WAVE3.BIN……or WAVE1.BMP,
WAVE2.BMP, WAVE3.BMP……. Then you can open the files in computer by connecting USB disk to
computer.
Note:
During the U disk saving procedure, some notes such as “Waveform saving, “Waveform saved”, “USB already
connected”, “USB connection interrupt” etc will be prompted.
43.9. How to search
Searches have different operation according to different targets. Search target including trigger position, BUS
value, and pattern.
1. Search triggers position as following steps:
* Press “2 (SEARCH)” and menu appears.
* Press “F1” till target display as “Trig position”
* Press “F2” to start searching and current cursor will stop in the trigger position
Fig. 98 Search trigger position
-210-
Page 95

2. Search specified value in BUS
Searching BUS menu as below:
Function
Setting
Instruction
BUS
BUS0~BUS3
Choose searching BUS
Code type
0x0000~0xffff
(HEX)
0~65535 (DEC)
Can be set discretionarily between 0x0000 and 0xffff (HEX) or
between 0 and 65535 (DEC)according to the bus and code setting.
Previous
Search the matched value prior to current cursor
Next
Search the matched value after current cursor.
For example, follow up below steps to search the data of 0x18 values in BUS0
1. Press “2(SEARCH)” and menu appears.
2. Press “F1” till target display as “BUS”.
3. Press “F2” till BUS SEL as “BUS0”.
4. Press “F3” and choose “Code Type ”, value under displayed with red background and green digital
indicator in the panel is on. Then insert the value of “18” by digital key in the panel to get start.
5. Press “F3” again and red background for value under code is disappeared and value setting finished.
Repeat operation of steps D. E if need to modify the value.
6. Press “F4” and choose “Previous” to searching the matched value prior to current cursor. Cursor will stop
in this value if it has and info window show “Got the target” and if it hasn’t it will show “Search failed”.
7. Press “F5” and choose “ Next” to searching the matched value after current cursor.
Fig. 99 Search Bus
-211-
Page 96

3. Searching target is pattern:
Pattern refers to the complex of different channel according to high/low voltage or irrelated condition.
Pattern type searching menu as below
Function
Setting
Instruction
CH SEL
CH0F~CH00
x0100000
00000000
Select the channel to set the signal pattern.
16 channel pattern indication.
X: Don’t care 0 : Low, 1 : High
CH00~CH0F
Don’t Care
Low
High
Don’t care the signal pattern in this channel.
The signal pattern in this channel is low.
The signal pattern in this channel is high.
Previous
Search the matched value prior to current cursor
Next
Search the matched value after the current cursor.
For example, follow up below steps to search signal complex of “00000000000010X1”
1. Press “2(SEARCH)” and menu appears.
2. Press “F1” till target display as “Pattern”
3. Press “F2” or turn “CH1 Volts/div” knob to choose channel as “CH00”
4. Press “F3” and set CH00 as “high”. Then CH00 in “CH Sel” refer to “1”
5. Repeat the operation of steps C. D and set other channels status corresponding to “00000000000010X1”
6. Press “F4” and choose “Previous” to search the matched value prior to current cursor. Cursor will stop in
this code if it has and info window show “Got the target” and if it hasn’t it will show “Search failed”.
7. Press “F5” and choose “Next” to search matched signal complex after current cursor.
Fig. 100 Search Code type
-212-
Page 97

43.10. How to review setting info
You can choose system information display to be “On” or “OFF” by press “INFO” key. System information
includes all settings for acquired waveform and next acquisition.
Fig. 101 System info
-213-
Page 98
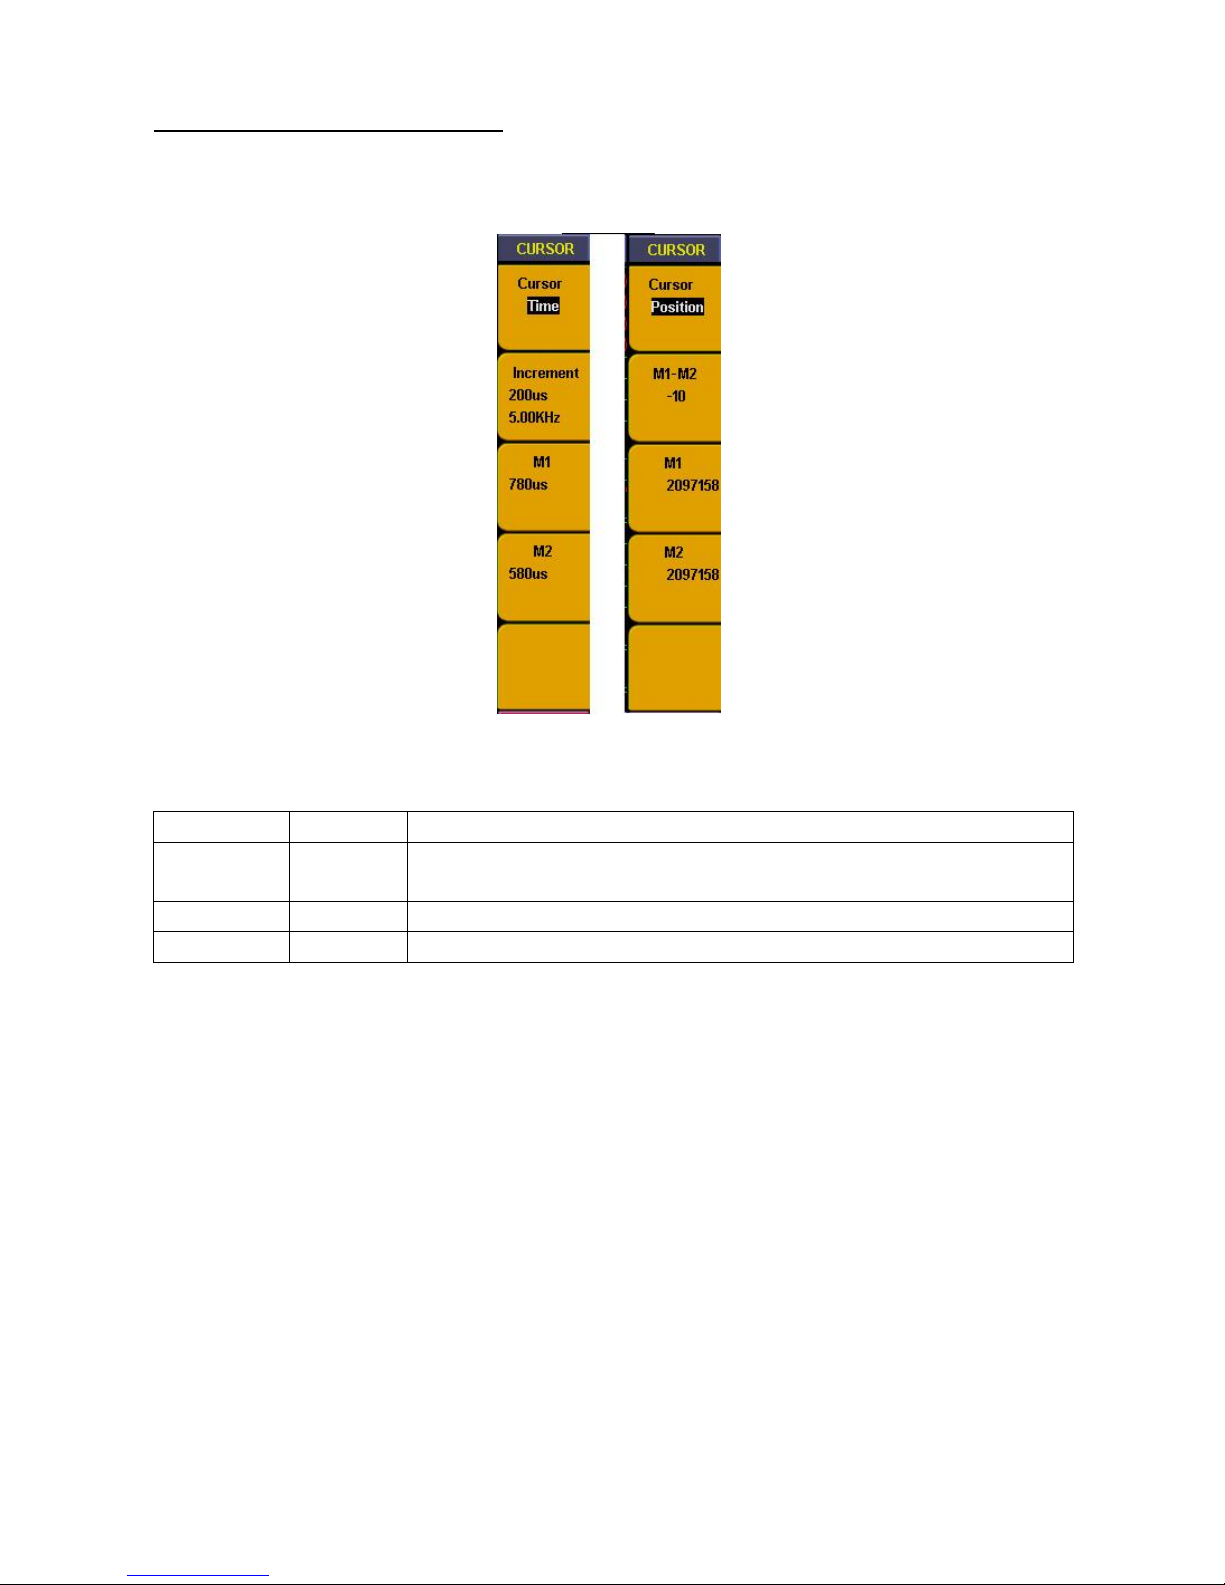
43.11. How to use cursor measurement
You can measure manually the time difference between two either data in display or position difference in
memory area by cursor measurement.
Fig. 102 Cursor measurement menu
Cursor measurement time menu as below:
Function
Setting
Instruction
Increment
Time
Frequency
The time difference between two cursors.
The frequency difference between two cursors.
Cursor 1
Time
The time display of cursor 1 corresponds to trigger position.
Cursor 2
Time
The time display of cursor 2 corresponds to trigger position.
Follow up below steps to measure data pulse frequency in CH00 with cursor measurement:
1. Press “9(CURSOR)” and cursor menu appears
2. Press “F1” till cursor display as “Time”. Two purples vertical lines display in panel and refer to Cursor 1
and Cursor 2 separately.
3. Turn “CH1 POSITION” knob and set Cursor 1 position in falling edge of CH00.
4. Turn “CH2 POSITION” knob and set Cursor 2 position in next falling edge of CH00
5. Now the time increment display between two cursors is “200us” and frequency is “5KHz”. The time
display of Cursor 1 correspond to trigger position is “780us” in “F3”. The time display of Cursor 2
correspond to trigger position is “580us” in “F4”.
-214-
Page 99

Fig. 103 Cursor time measurement
Cursor measure position menu as below:
Function
Display
Instruction
M1-M2
Position
The position difference between two cursors in memory area.
Cursor 1
Position
The position of cursor 1 corresponds to trigger in memory area.
Cursor 2
Position
The position of cursor 2 corresponds to trigger in memory area.
Follow up below steps to measure data width of pulse with cursor measurement
1. Press “9(CURSOR)” and Cursor menu appears.
2. Press “F1” till cursor display as “Position”. Two purples vertical lines display in panel and refer to Cursor
1 and Cursor 2 separately.
3. Turn “CH1 POSITION” knob and set Cursor 1 position in falling edge of CH00
4. Turn “CH2 POSITION” knob and set Cursor 2 position in next falling edge of CH00.
5. Now the position difference between two cursors display in “F2” is “-10” which means there is 10 acquired
data between two cursors. The position of Cursor 1 corresponds to trigger in memory position display in
“F3” as “2097158”. The position of Cursor 2 corresponds to trigger in memory position display in “F4” as
“2057168”.
Fig. 104 Cursor position measurement
-215-
Page 100

43.12. How to set Utility
Utility function includes:
- recall factory
- Language
- Carry
Utility menu as below
Function
Setting
Instruction
Recall
factory
Default setting for LA
Language
Chinese
English
Default to be Chinese
Default to be English
Carry
Vector
BMP
Set data format to be vector in “Bin” format for PC software
Set data format to be BMP and loading data as picture
-216-
 Loading...