

Page 1
INTRODUCTION QTRACE - USER MANUAL
Revision 1.01
August 2018
QTRACE - USER MANUAL
Page 2

Contents
1. INTRODUCTION ............................................................................................................................................ 5
1.1 TRACE OVERVIEW ............................................................................................................................................. 5
1.2 QTRACE SYSTEM CONNECTIONS .......................................................................................................................... 5
1.3 SUPPORTED IDES ............................................................................................................................................. 6
1.4 SUPPORTED TARGET DEVICES .............................................................................................................................. 6
1.5 SYSTEM REQUIREMENTS .................................................................................................................................... 7
1.6 QTRACE HARDWARE SPECIFICATION ..................................................................................................................... 7
1.7 TARGET CONNECTION........................................................................................................................................ 8
1.8 RECOMMENDATIONS FOR PCB LAYOUT OF TRACE SIGNALS ...................................................................................... 8
1.9 FRONT PANEL STATUS LED ................................................................................................................................. 9
1.10 PRECAUTIONS .................................................................................................................................................. 9
2. QTRACE ANALYSER OVERVIEW .................................................................................................................... 10
2.1 INSTALLATION ................................................................................................................................................ 10
2.2 QTRACE ANALYSER LAYOUT ............................................................................................................................. 10
2.2.1 Drop-down menu and toolbar .............................................................................................................. 11
2.2.2 Status bar .............................................................................................................................................. 12
2.2.2.1 Taskbar icon .................................................................................................................................................. 12
2.2.3 Trace views ........................................................................................................................................... 12
3. SOURCE VIEWER .......................................................................................................................................... 13
3.1 FUNCTION TREE-VIEW ..................................................................................................................................... 13
3.2 SOURCE FILE VIEW .......................................................................................................................................... 13
3.2.1 Code coverage....................................................................................................................................... 14
3.2.2 Code coverage pause and clear ............................................................................................................ 16
3.2.3 Single stepping and execution count latency ........................................................................................ 16
3.2.4 Loop timing ........................................................................................................................................... 16
3.2.5 Execution heat map .............................................................................................................................. 16
3.2.6 Navigating to function implementations .............................................................................................. 17
3.2.7 Find text ................................................................................................................................................ 17
3.2.8 Find function from clipboard ................................................................................................................. 18
3.2.9 Source view bookmarks ........................................................................................................................ 18
3.3 ITM DEBUGGING ........................................................................................................................................... 19
3.4 GENERAL SETTINGS ........................................................................................................................................ 21
4. TRACE CAPTURE .......................................................................................................................................... 22
4.1 TRACE CAPTURE TRIGGER ................................................................................................................................ 22
4.1.1 Trace Point ............................................................................................................................................ 23
4.2 TRACE CAPTURE VIEW ..................................................................................................................................... 23
4.2.1 CPU instruction list view ....................................................................................................................... 24
4.2.2 Simple source view ................................................................................................................................ 24
4.2.3 Function timeline .................................................................................................................................. 25
4.2.3.1 Timeline controls .......................................................................................................................................... 25
4.2.3.2 Function pinning ........................................................................................................................................... 26
4.2.3.3 Timeline function search ............................................................................................................................... 26
4.2.3.4 Measuring timeline intervals ........................................................................................................................ 26
4.2.4 Find trace record ................................................................................................................................... 27
4.2.5 Go to source .......................................................................................................................................... 28
4.2.6 Trace record bookmarks ....................................................................................................................... 28
4.2.7 Instruction list-view context menu ........................................................................................................ 28
4.3 EXCEPTION TRACE CAPTURE .............................................................................................................................. 29
4.3.1 Problems setting exception handler trigger .......................................................................................... 30
5. PROFILING ................................................................................................................................................... 31
5.1 CPU TIMING ................................................................................................................................................. 33
6. TRACE CONFIGURATION .............................................................................................................................. 34
Page 3

6.1 TRACE CONFIGURATION DIALOG ........................................................................................................................ 34
6.1.1 Manufacturer ........................................................................................................................................ 35
6.1.2 Part/Family ........................................................................................................................................... 35
6.1.3 ROM start address ................................................................................................................................ 35
6.1.4 ROM size ............................................................................................................................................... 36
6.1.5 Trace clock divider ................................................................................................................................ 36
6.1.6 C++ project ............................................................................................................................................ 36
6.1.7 Save paths relative to configuration file ............................................................................................... 36
6.1.8 Vector table address ............................................................................................................................. 36
6.1.9 ELF file ................................................................................................................................................... 36
6.1.10 Source paths ..................................................................................................................................... 37
6.1.11 Missing source files ........................................................................................................................... 37
6.1.12 Additional code ranges ..................................................................................................................... 39
6.1.13 Trace configuration source ............................................................................................................... 40
6.1.14 Initialisation RAM area ..................................................................................................................... 40
6.1.15 Debugger script ................................................................................................................................ 40
6.1.16 Trace port voltage ............................................................................................................................ 40
6.2 FINALISING TRACE CONFIGURATION.................................................................................................................... 40
7. TRACE START SEQUENCE ............................................................................................................................. 42
8. SELF TEST MODE .......................................................................................................................................... 44
9. RECOMMENDATIONS .................................................................................................................................. 45
9.1 GENERAL ...................................................................................................................................................... 45
9.2 PROGRAMMING TIPS ...................................................................................................................................... 45
10. PC SPECIFICATION ................................................................................................................................... 46
11. TROUBLESHOOTING ................................................................................................................................ 47
12. TRACING WITH COMMON IDES ............................................................................................................... 49
12.1 LOCATION OF DEBUGGER SCRIPTS ...................................................................................................................... 49
12.2 EXAMPLE PROJECTS ........................................................................................................................................ 49
12.3 SEGGER J-LINK INSTRUCTION SIMULATION........................................................................................................... 50
12.4 ATOLLIC TRUESTUDIO ................................................................................................................................... 51
12.5 IAR EMBEDDED WORKBENCH .......................................................................................................................... 56
12.6 KEIL MDK .................................................................................................................................................... 57
12.7 SEGGER EMBEDDED STUDIO / ROWLEY CROSSWORKS FOR ARM ............................................................................ 58
12.8 ST SYSTEM WORKBENCH ................................................................................................................................. 59
12.9 VISUALGDB .................................................................................................................................................. 61
APPENDIX A MANUAL DRIVER INSTALLATION .................................................................................................... 63
APPENDIX B STM32-EVAL DEMONSTRATOR ...................................................................................................... 65
APPENDIX C NOSLEEP UTILITY ............................................................................................................................ 66
Page 4

Document History
Revision
Date
Changes
1.00
12/07/18
First release
1.01
06/08/18
Finalising trace configuration section added
Page 5

Introduction QTRACE - USER MANUAL
© 2018 PDQLogic Ltd. QTrace User Manual Rev 1.01 Page 5
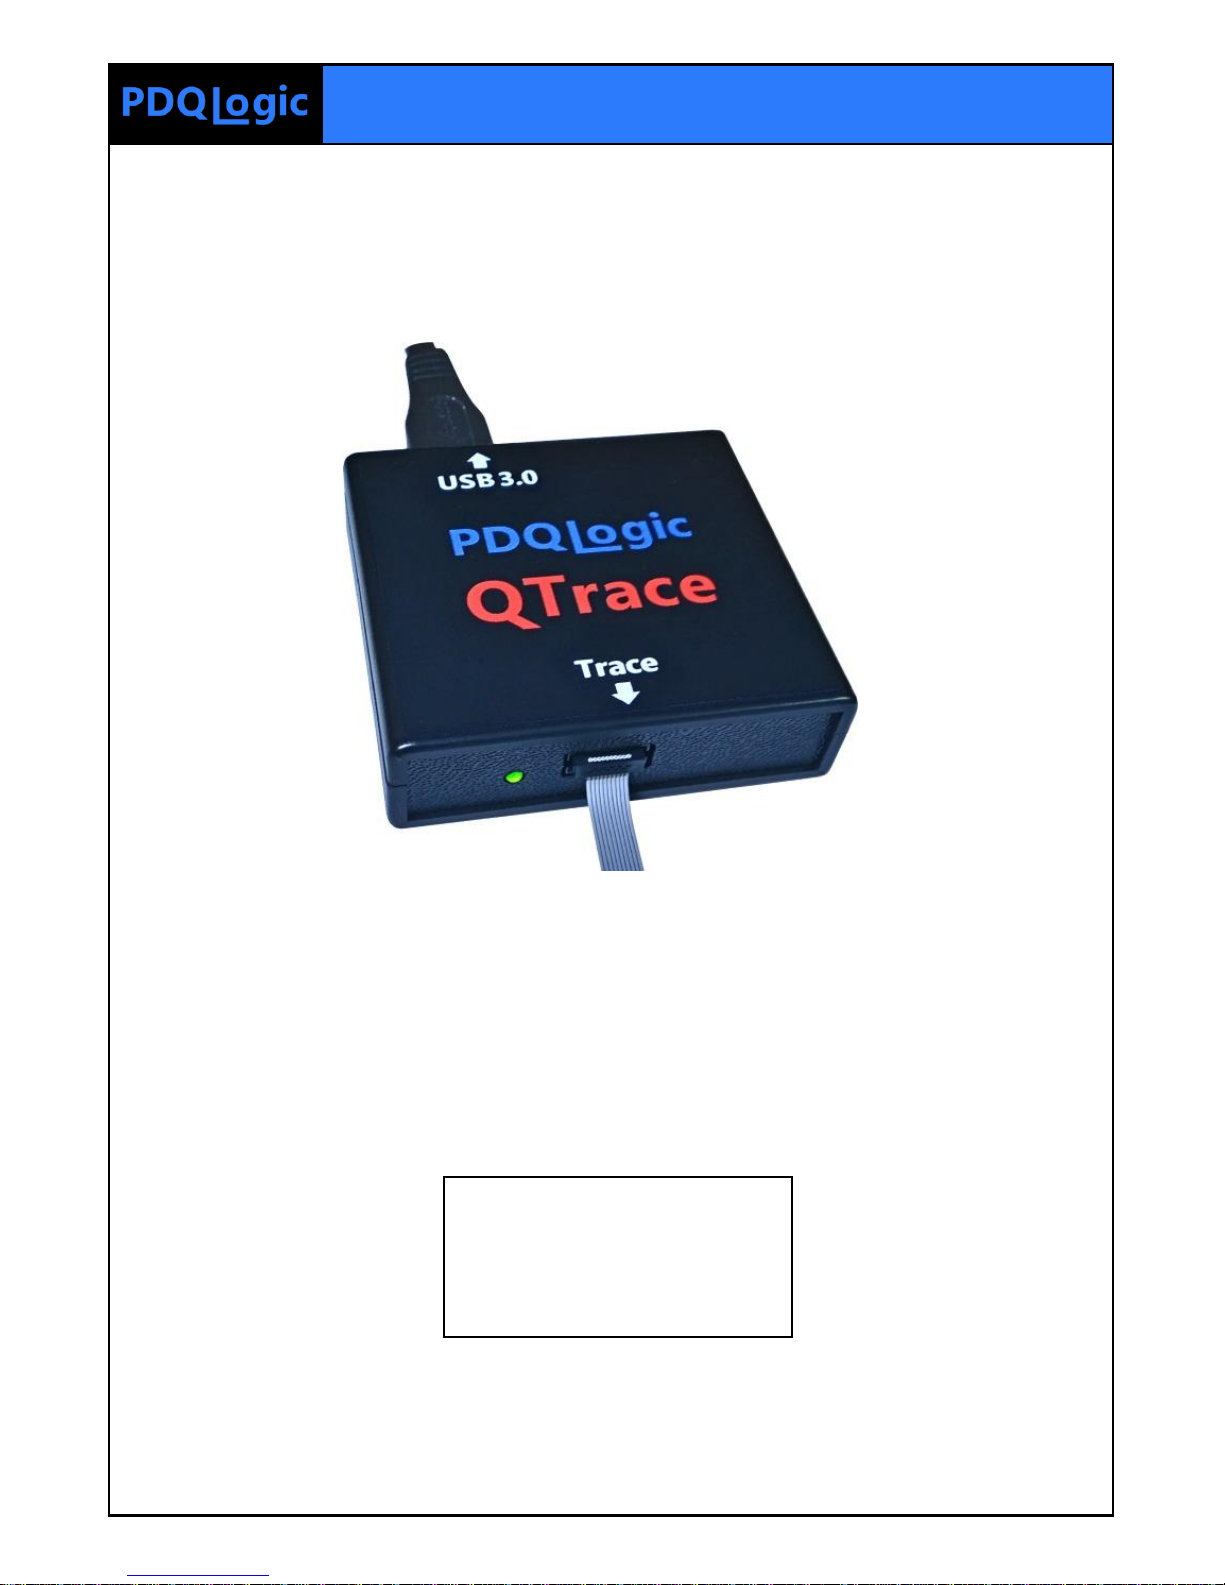
1. Introduction
QTrace is a low cost real-time instruction trace system for ARM Cortex M3/M4 processors. It gives
exceptional insight and detailed views of how a target application is running and aids locating hard-tofind bugs. The system consists of a hardware trace probe and a Windows based trace analyser. It allows
completely unobtrusive full speed tracing and does not require any instrumentation code to be added
to the target application.
With QTrace you don’t need to be a high‐end user with a big budget or wait until
you encounter a really nasty bug before deciding to purchase a trace system.
1.1 Trace overview
Historically, trace systems have been very expensive and have required large connectors to interface to
the users' target board. Trace hardware probes typically contained large amounts of RAM to capture
trace data when a user defined event was triggered. The resulting data was then uploaded to the host
PC for laborious offline analysis.
With the introduction of the ARM Cortex M3/M4 processor cores comes a small footprint trace
interface. Many microcontroller devices based on this core contain a hardware block called an
Embedded Trace Macrocell (ETM) which enables instruction tracing of an application in real-time. The
interface to the ETM block is typically a clock and 4 data lines which are usually presented as multipurpose microcontroller GPIO lines that can be programmed to operate as a trace port. These high
speed trace signals are combined with the standard JTAG or SWD debug signals and connect to a 20 way
0.05" pitch header, see Figure 3. An external trace probe is required to decode the trace data frames
streamed by the trace port and transmit their payload data to a host PC.
By implementing a high speed communication link between the trace hardware probe and PC, it is
possible to stream the trace data directly to the PC without the need to capture and then review offline.
This allows a continuous view of what the target application is doing and makes trace far more useful
and easier to visualise than a large collection of static trace records.
To handle high trace data rates resulting from this configuration, the specification of the host PC is
important. It needs to decode the trace data and present a summary of the target processor execution
in real-time with minimal latency and without losing data. PC specification is outlined in section 10 on
page 46.
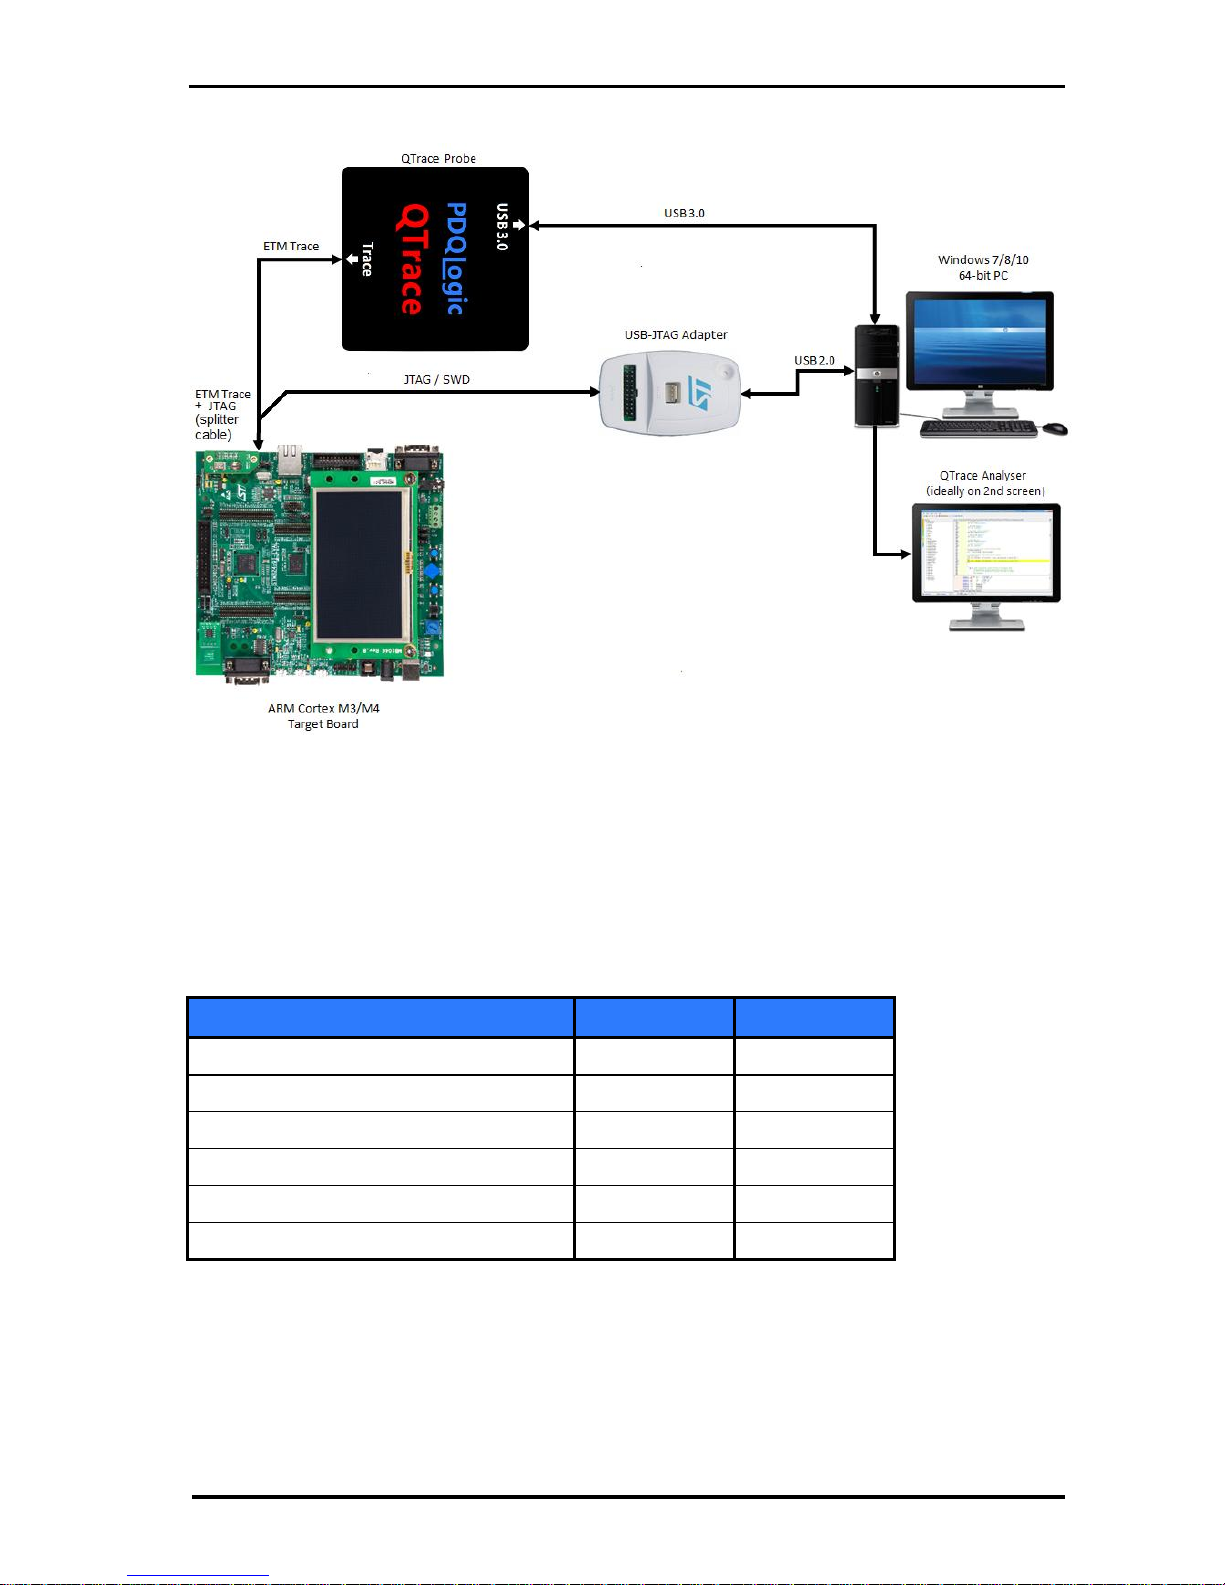
1.2 QTrace system connections
The block diagram in Figure 1 shows how QTrace connects to a development system and Figure 2 shows
a picture of an example hardware set-up. The QTrace probe is a little different to conventional trace
units in that it doesn't integrate a JTAG1 interface. Instead it uses a splitter cable to tap-off the trace
signals from the 20 way target trace connector. The target JTAG signals connect separately to the users'
JTAG adapter.
A USB 3.0 connection from on the development PC is used to power the QTrace probe and to stream
trace data from it. A standalone Windows application, the QTrace Analyser, configures the probe then
decodes and displays its streamed trace data.
Having a separate analyser application operating independently of the user supplied IDE2 means that
investment in existing development tools is not lost. Refer to section 2 for further details of the QTrace
Analyser.
1
References to JTAG also include SWD
2
IDE refers to an integrated development environment and its debugger
Page 6
Introduction QTRACE - USER MANUAL
© 2018 PDQLogic Ltd. QTrace User Manual Rev 1.01 Page 6
Figure 1 QTrace block diagram
The QTrace system does not control the target JTAG interface and so does not configure target trace
hardware directly. Instead, a debug script is run from the IDE to configure the target trace pins and
registers. This is done after the target FLASH has been programmed but before the application is run.
1.3 Supported IDEs
A number of debugger scripts are supplied with the QTrace Analyser to support most common IDEs, as
shown in Table 1 below.
IDE
Version Tested
See Section
Atollic TrueSTUDIO
V9.0.0
12.4
IAR Embedded Workbench
V8.20
12.5
Keil MDK
V5.20
12.6
Segger Embedded Studio
V3.34
12.7
ST System Workbench
V2.4
12.8
VisualGDB
V5.3r5
12.9
Table 1 Supported IDEs
1.4 Supported target devices
The QTrace probe will interface to any ARM Cortex-M3/M4 based processor with an ETM trace port.
Currently the QTrace Analyser supports STM32 F1/F2/F3/F4/L4 devices from ST Microelectronics that
have the ETM trace option. More manufacturers and devices will be added, see www.pdqlogic.com for
further details.
Page 7
Introduction QTRACE - USER MANUAL
© 2018 PDQLogic Ltd. QTrace User Manual Rev 1.01 Page 7
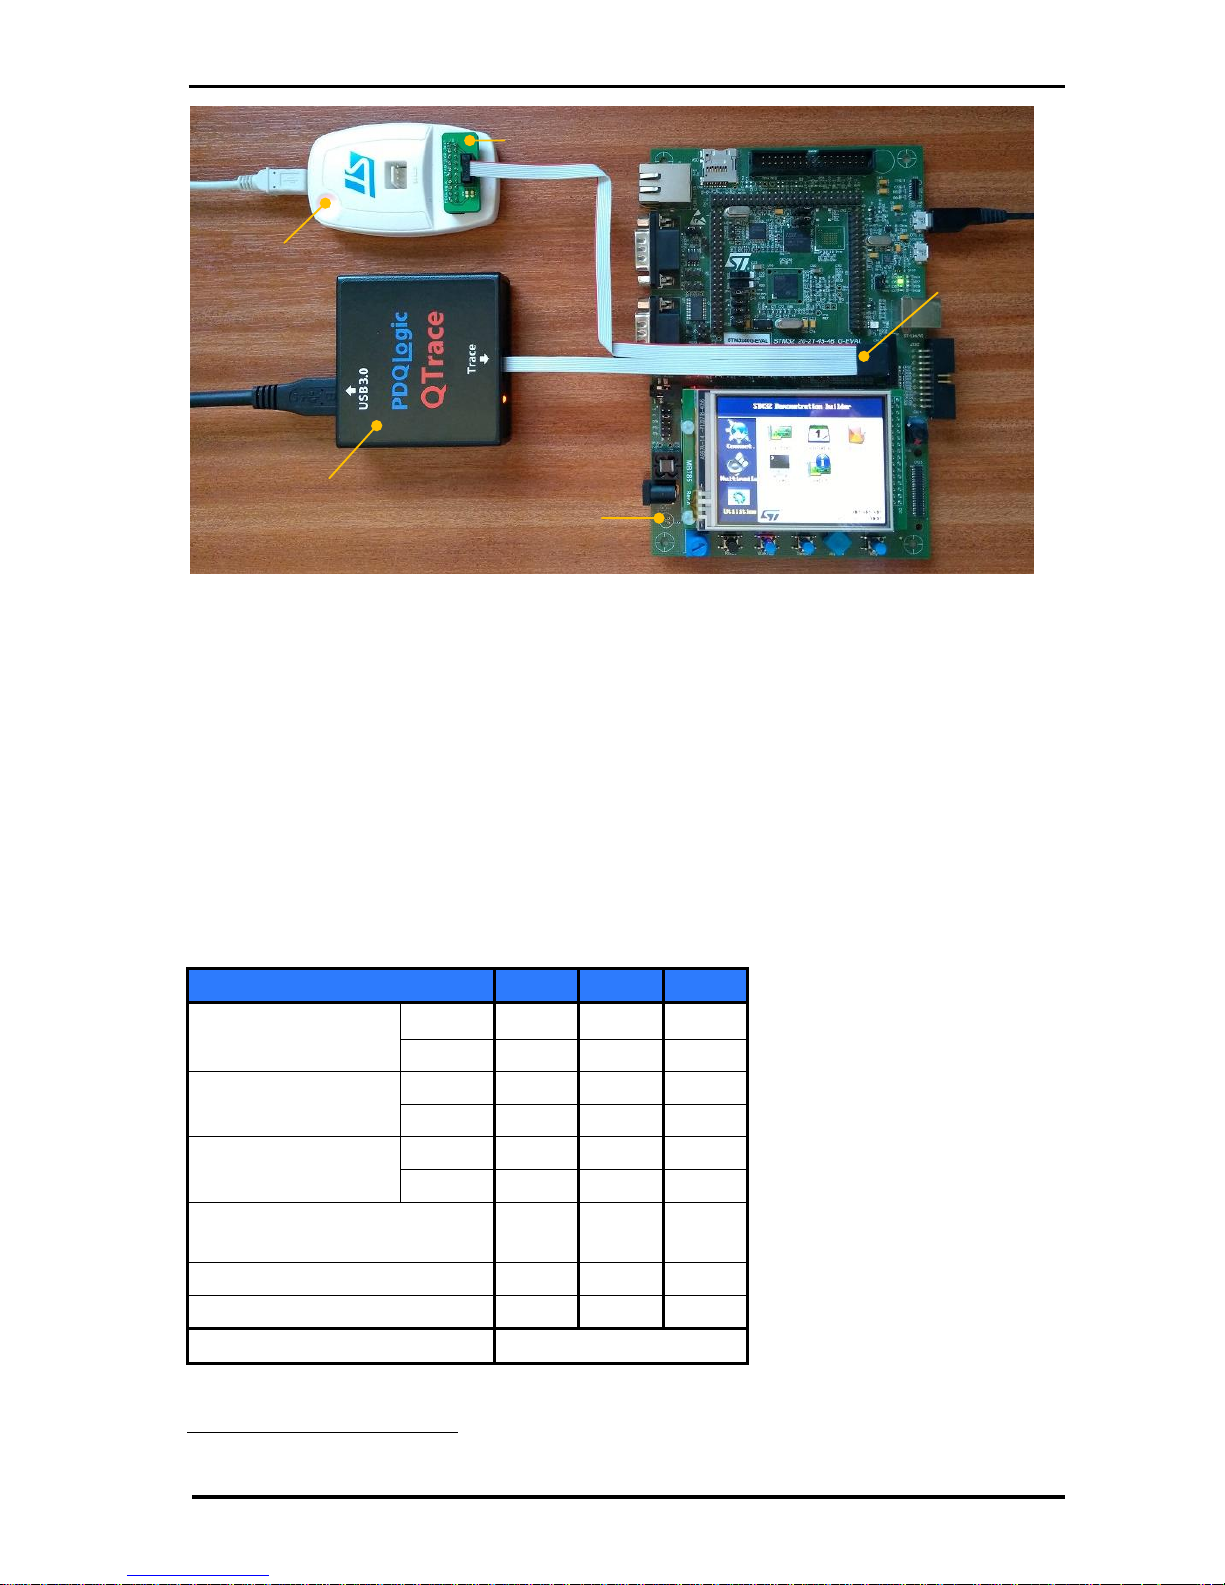
Figure 2 Example QTrace hardware connection
1.5 System requirements
A PC running 64-bit Windows 7, 8.1 or 10 with the preferred hardware specification:
Intel i5/i7 dual or quad core CPU running at 2GHz min.
8GB+ RAM
A spare USB 3.0 port
Screen resolution of 1366 x 768 or better (ideally a 2nd screen)
A user supplied IDE and JTAG adapter
Target hardware containing an ARM Cortex M3/M4 based processor and a 20 way ETM trace
connector with 4-bit data and clock (1.8V - 3.3V levels), see Figure 3.
1.6 QTrace hardware specification
The following gives an overview of the QTrace hardware specifications
Parameter
Min
Max
Units
Power supply
(USB 3.0 powered)
Voltage
4.0
6.0
Volts
Current
-
300
mA
Input voltage3 range 1
(1.8V nom)
Vin Low
-0.2
0.38
Volts
Vin High
0.8
3.6
Volts
Input voltage3 range 2
(3.3V nom)
Vin Low
-0.2
0.8
Volts
Vin High
2.0
3.6
Volts
Target clock frequency (F
Target
)
(Trace clock = F
Target
/2)
4
180
MHz
Trace data to clock set-up time
0.0 - ns
Trace data to clock hold-up time
0.2 - ns
EMC compliance
EN55024, EN55032
Table 2 QTrace hardware specification
3
Input voltage range is specified in the QTrace Analyser configuration dialog
10 to 20 way
converter PCB
Splitter
Ribbon
Cable
QTrace
Probe
JTAG Unit
(not supplied)
Development Board
(not supplied)
Page 8
Introduction QTRACE - USER MANUAL
© 2018 PDQLogic Ltd. QTrace User Manual Rev 1.01 Page 8
1.7 Target connection
Below are the pin assignments for the ARM Cortex-M 20 pin trace connector. It has a 0.05" pitch and
provides access to the 4-bit ETM interface and JTAG / SWD signals.
Figure 3 Pin assignments of the ARM Cortex-M 20 pin trace connector
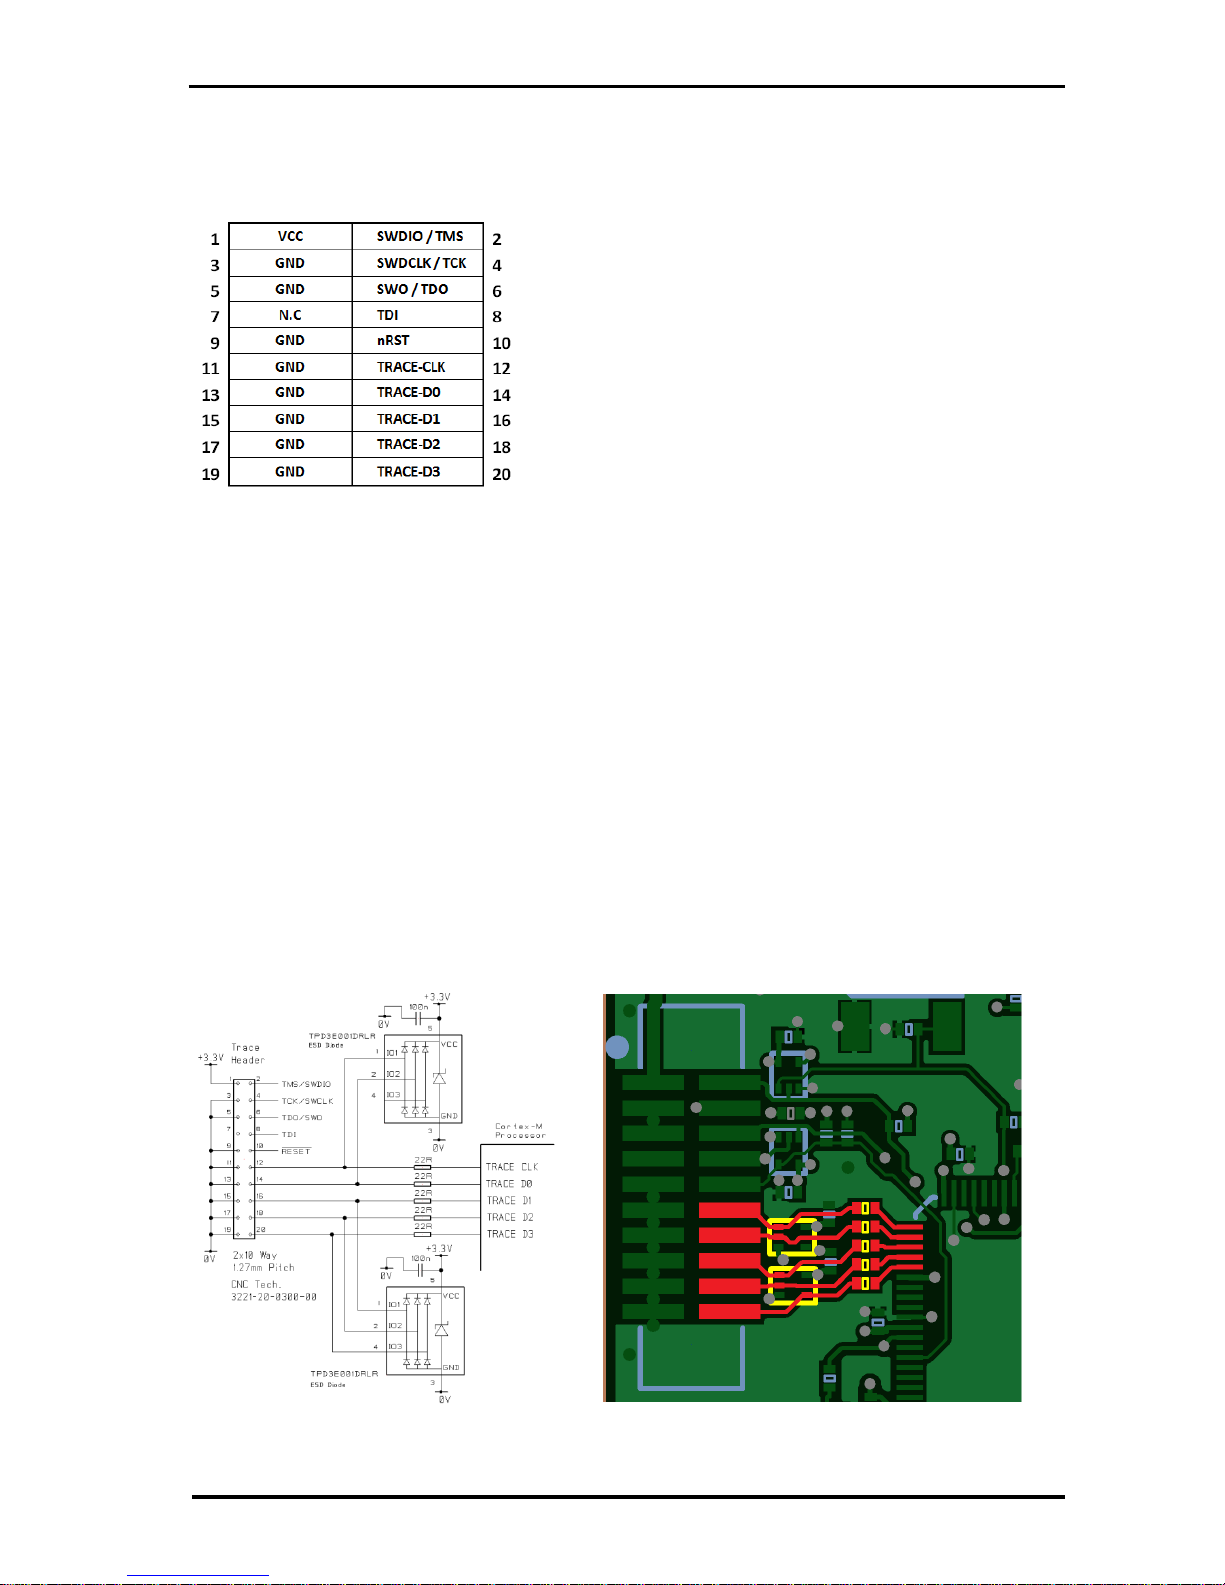
1.8 Recommendations for PCB layout of Trace Signals
A good PCB layout for the trace signals is crucial for reliable operation. Below are some
recommendations for PCB layout of the trace signals:
Place the trace connector close to the processor pins
Add 0402 series termination resistors e.g. 22R next to the processor trace pins
Use low capacitance ESD diodes on the trace signals and place them close to the trace
connector
Keep tracks the same length
Do not insert vias
Route all tracks over an unbroken ground plane which is on the first inner layer (the FR4
laminate thickness between the top and ground plane layers should typically be 5 mil)
Figure 4 shows an example of trace signal routing on the STM32-EVAL demonstrator PCB (see Appendix
B STM32-Eval Demonstrator. The trace signals are highlighted in red and the component outlines of
the 0402 series resistors and ESD diodes are highlighted in yellow.
Figure 4 Example trace schematic and PCB signal routing
Page 9
Introduction QTRACE - USER MANUAL
© 2018 PDQLogic Ltd. QTrace User Manual Rev 1.01 Page 9
1.9 Front panel status LED
The bi-colour front panel LED conveys the current status of the QTrace probe. Below is a summary of
the possible states:
Colour
QTrace State
Red
Trace decoder hardware is unconfigured
Red flashing
No trace clock detected or unable to synchronise with trace data
Green
Streaming trace data
Green flashing
Trace data has stalled e.g. break point hit
Table 3 Front panel LED states
1.10 Precautions
There are several issues to be aware of when using the QTrace probe:
1) Do not connect a powered target processor to an unpowered QTrace probe i.e. when it isn’t
connected to a PC via a USB 3.0 lead. Doing so will cause internal ESD diodes to continuously
conduct which may damage them. It may also damage the trace pins on the target processor.
2) The QTrace probe should not be connected to a USB 3.0 lead greater than 2 metres long. The
lead should have high frequency ferrites at both ends as per the supplied lead.
3) Do not force the USB lead connector into the QTrace probe. If it does not mate easily then the
USB lead connector may be damaged and the lead should be replaced.
Page 10
QTrace Analyser Overview QTRACE - USER MANUAL
© 2018 PDQLogic Ltd. QTrace User Manual Rev 1.01 Page 10
2. QTrace Analyser Overview
The QTrace Analyser is a standalone application that runs on 64-bit Microsoft Windows 7, 8.1 and 10. It
interfaces to the QTrace probe via a USB3 connection and configures it for the chosen target device. The
analyser then decodes and displays streamed trace data, independently of the IDE.
2.1 Installation
The QTrace Analyser application requires the Microsoft .NET framework v4.0 which should be installed
before running the installer (Windows Update routinely installs the latest .NET framework).
The QTrace Analyser should be installed before connecting the QTrace probe to the PC. To launch the
installer, run TraceAnalyserSetup_vx.x.x.x.exe. This will install the QTrace Analyser application, scripts,
documentation and a USB3 driver. Note that the installer will silently request Administrator privileges to
install the driver and the request may fail. If it does, the driver will not be installed and this will have to
be done manually, see Appendix A Manual Driver Installation.
The QTrace probe actually requires two drivers and Windows may try to find an updated driver for one
or both. If it does, click ‘Skip’:
When installation has successfully completed, the QTrace Analyser will run automatically by default. It
can also be run from the Windows Start menu (StartProgramsPDQLogicQTrace Analyser).
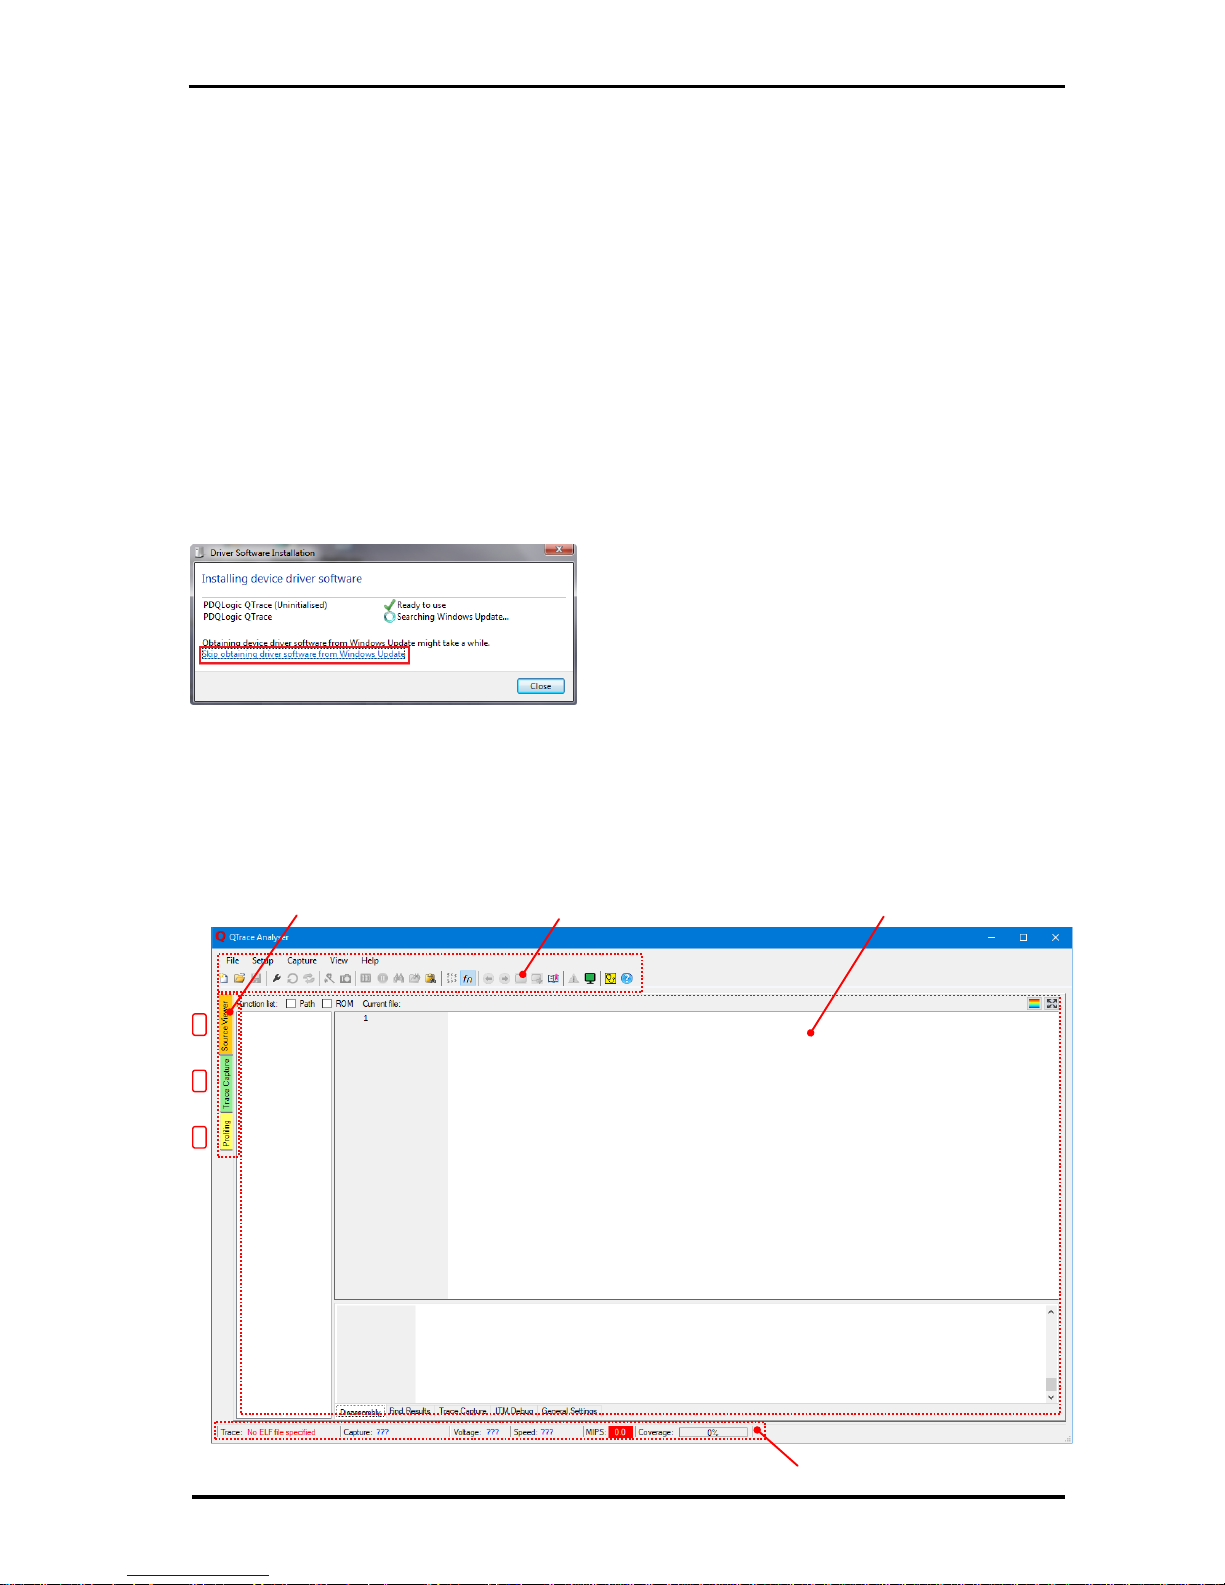
2.2 QTrace Analyser layout
The application consists of three main areas, a collection of drop-down menus with toolbar shortcuts, a
trace view area with selector tabs and a status bar.
Figure 5 QTrace Analyser layout
Drop-down menus & toolbar
Trace view select
Selected trace view
Status bar
1
2
3
Page 11

QTrace Analyser Overview QTRACE - USER MANUAL
© 2018 PDQLogic Ltd. QTrace User Manual Rev 1.01 Page 11
2.2.1 Drop-down menu and toolbar
The drop-down menu and toolbar are always visible except when in full screen mode. Below is a
summary of the menu options and their corresponding toolbar / key press shortcuts:
Menu
Option
Toolbar
Button
Key press
Shortcut
Description
File
New Configuration…
1
Ctrl+N
Create a new trace configuration
Open Configuration…
2
Ctrl+O
Browse for a trace configuration to open
Save Configuration
3
Ctrl+S
Save current trace configuration
Save Configuration As…
Save current trace configuration as a different name
Recent Configurations
Pick a recent trace configuration
Exit Alt+F4
Exit the QTrace Analyser
Setup
Edit Configuration…
4
Edit the current trace configuration
Reset Trace Probe
5
Reset the QTrace probe
Reload ELF File
6
Reload the ELF specified in the trace configuration
ITM Debug Settings
Show the ITM debug settings
General Settings
Show the general trace system settings
Capture
Enable
7
Globally enable trace capture
Take Snapshot
8
Take a snapshot of the last 8M trace records
Insert Trace Point
9
F9
Insert a trace point at the current source line
View
Clear Code Coverage
10
Globally clear all code coverage
Pause Code Coverage
11
Pause code coverage display update
Find in Current File…
12
Ctrl+F, F3
Find text in current file
Find in Files…
13
Ctrl+Shift+F
Find text in all source files specified by ELF file
Find Function From
Clipboard
14
Ctrl+V
Match the function name on the Clipboard and
display the source implementation if found
Show Indentation Guides
15
Show/hide indentation guide lines in the main
source view
Show Function List
16
Show/hide the file / function tree view
Navigate Backward
17
Alt+Left
Go to the previously displayed line in the source view
Navigate Forward
18
Alt+Right
Go to the next displayed line in the source view
Toggle Bookmark
19
Ctrl+F2
Insert/delete a bookmark at the current source line
Next Bookmark
20
F2
Go to the next bookmarked source line
Display Bookmarks…
21
Show the bookmark dialog
Target Exception Handlers
22
Show the target exception handler dialog
ITM Viewer…
23
Show/hide the ITM terminal viewer
Toggle Full Screen
Toggle between full screen and normal view
Help
User Manual
Open the user manual in the system PDF viewer
ITM Code Example
Show example C source for ITM printf-style output
Trace Diagnostics…
24
Show the trace trouble shooter dialog
Self Test
25
Enter self-test mode
Report a Problem
Send bug report to PDQLogic
About…
26
Display software versions and legal notices
Table 4 Menu options summary
1 2 3 4 5 6 7 8 9 10 11 12 13 14 15 16 17 18 19 20 21 22 23 24 25 26
Page 12
QTrace Analyser Overview QTRACE - USER MANUAL
© 2018 PDQLogic Ltd. QTrace User Manual Rev 1.01 Page 12
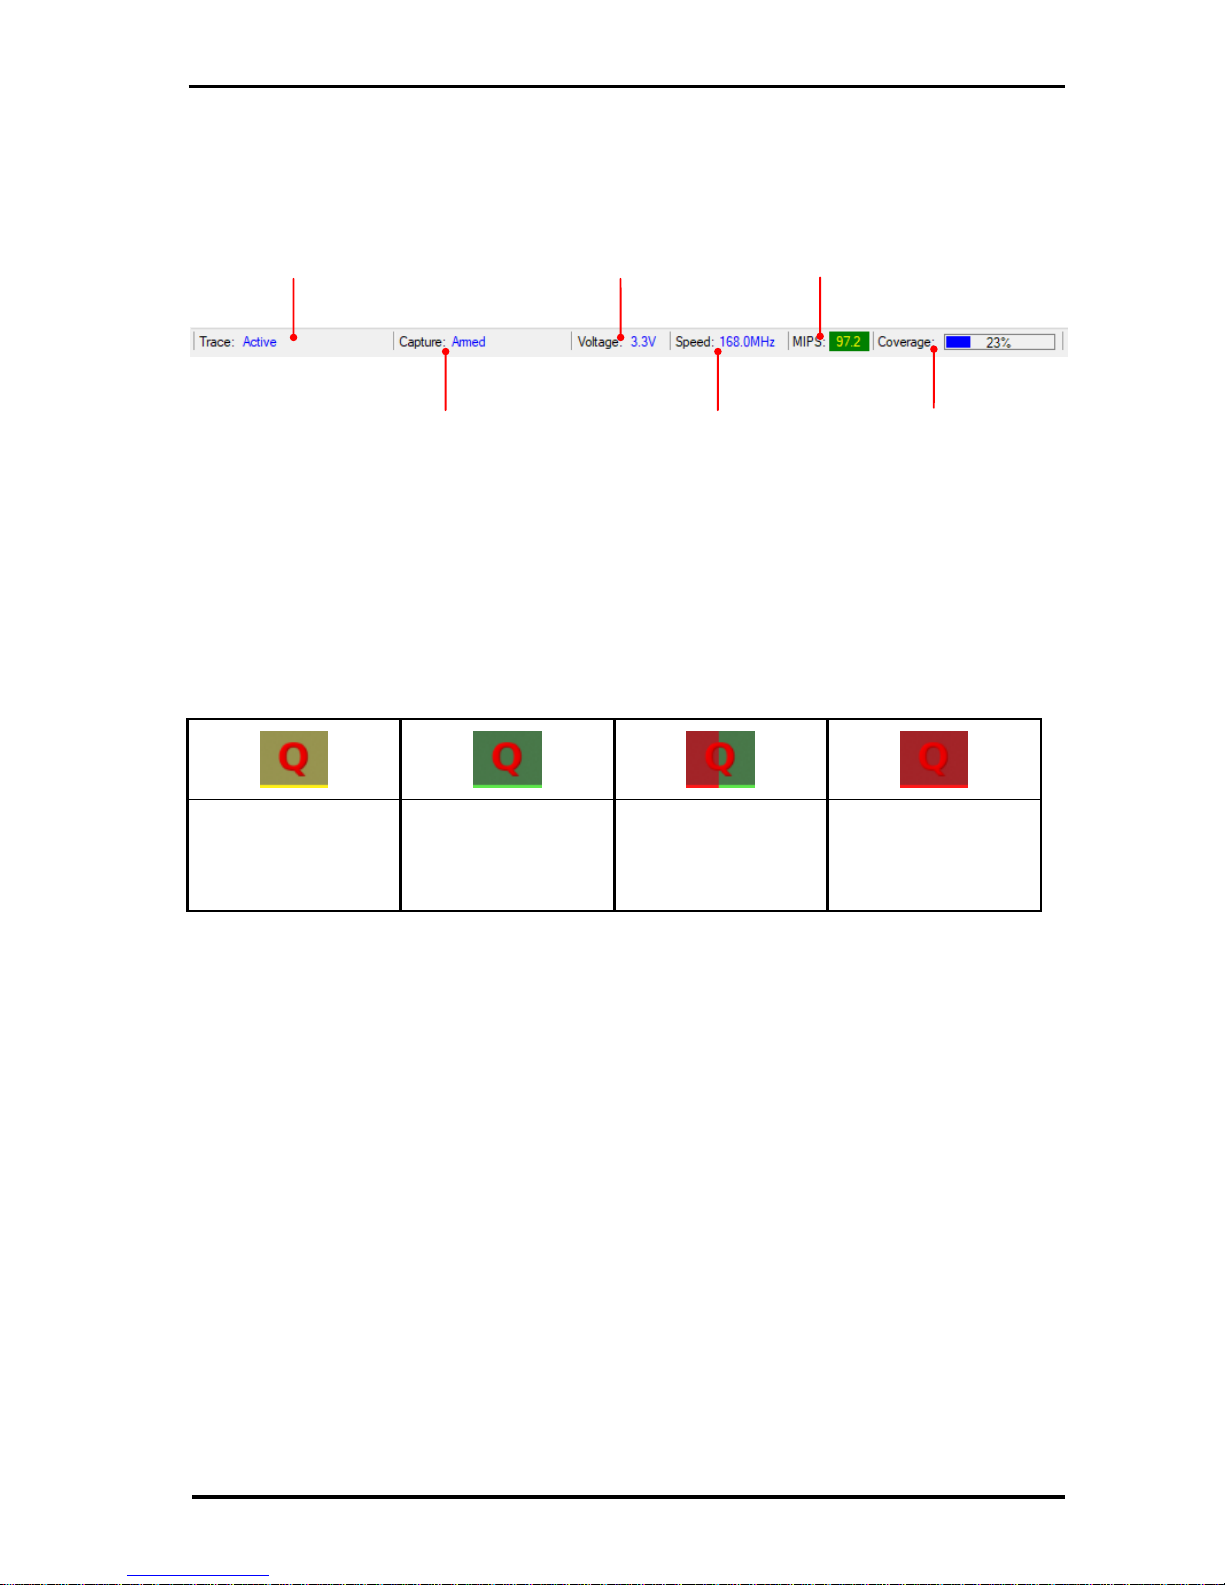
2.2.2 Status bar
The status bar gives a quick at-at-glance overview of system operation.
Table 5 Status bar feature summary
2.2.2.1 Taskbar icon
As well as the main status bar, the application icon in the Windows Taskbar is also used to convey
system status. This is useful when the QTrace Analyser is hidden by another application. The following
colours indicate key events:
Yellow
Target reset detected
Green
Tracing is in progress
Green / Red flashing
A trace capture event
occurred
Red
A target exception or a
trace error occurred
Table 6 Taskbar icon states
2.2.3 Trace views
There are three primary trace views which can be selected using the coloured tabs labelled Trace view
select in Figure 5 above. Each gives a different visualisation of target program execution:
1. Source Viewer
2. Trace Capture
3. Profiling
The operation of each trace view is detailed in the following sections.
Trace hardware
interface status
Trace capture
status e.g. disabled,
armed, triggered
Selected target
trace interface
voltage level
Detected CPU clock
speed (useful for PLL
verification)
Average
instruction
rate
Code coverage
overall value
Page 13
Source Viewer QTRACE - USER MANUAL
© 2018 PDQLogic Ltd. QTrace User Manual Rev 1.01 Page 13
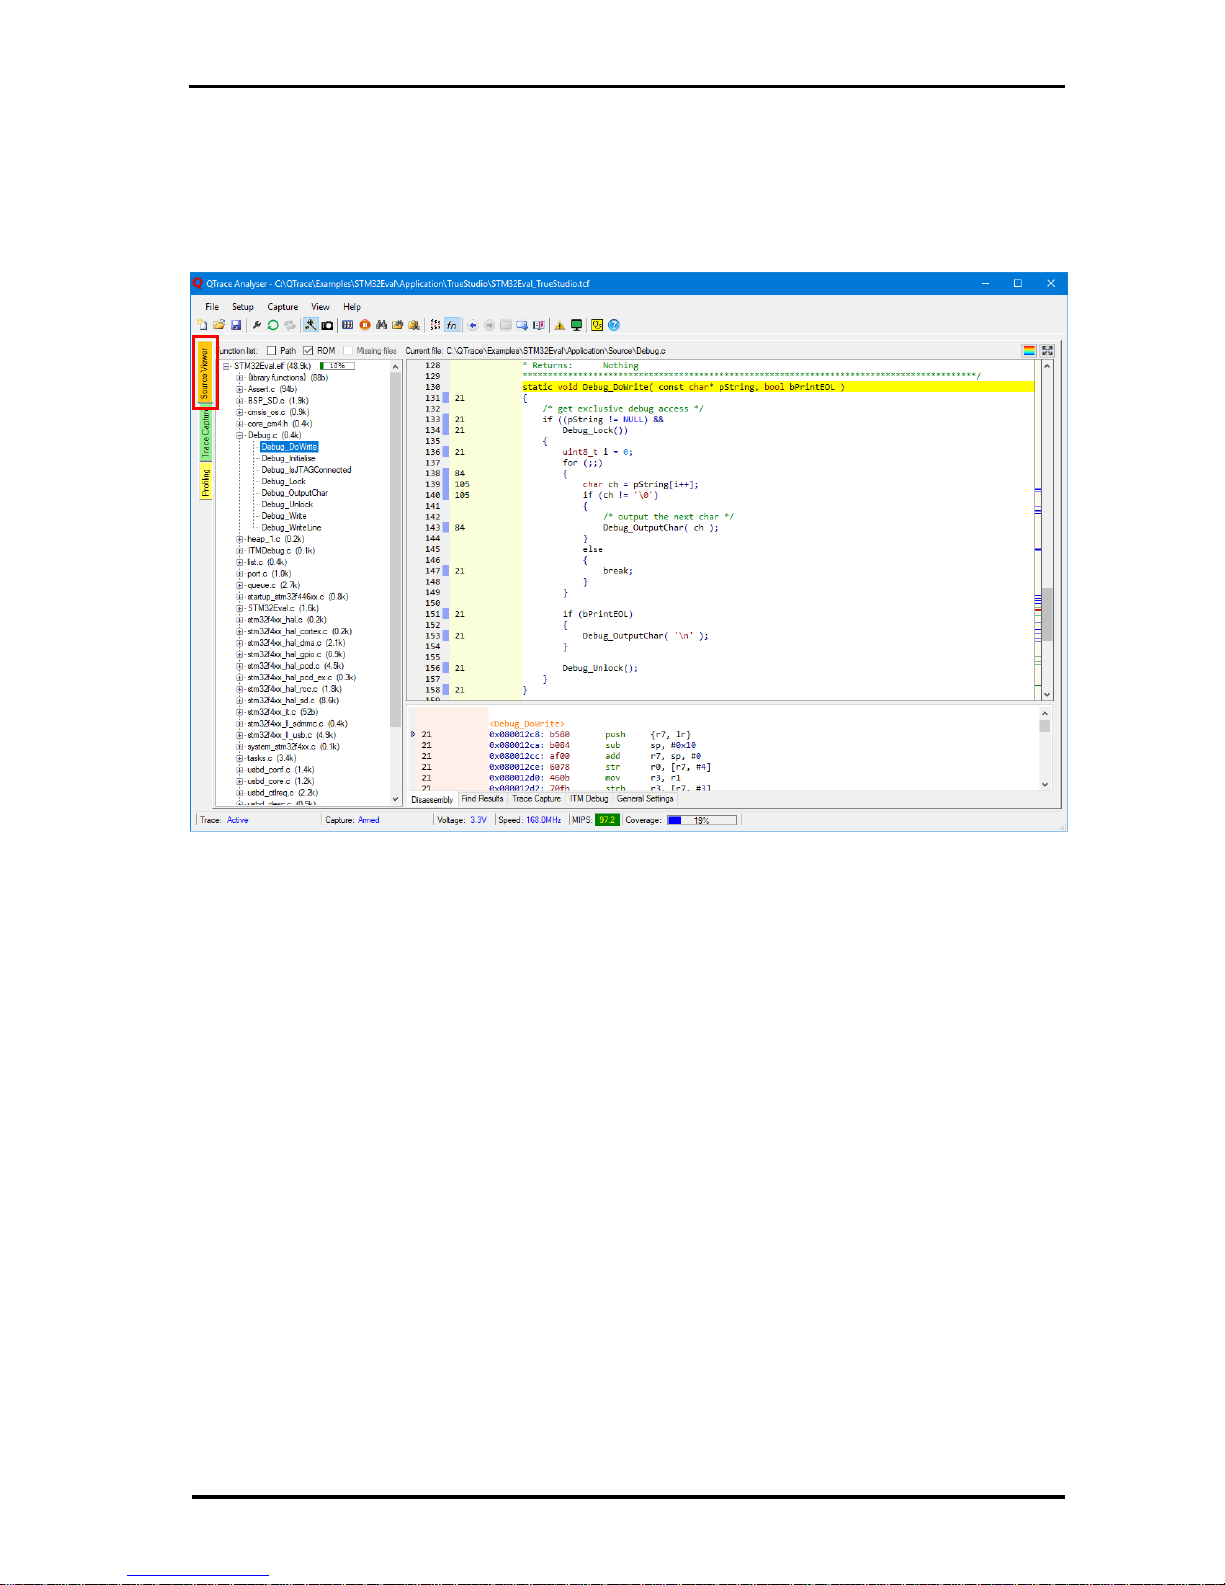
3. Source Viewer
The source viewer is the default view and is shown in Figure 6. It is split into 3 resizable areas:
1. Function tree-view
2. Source file view
3. A setup/status view with multiple pages selected with tabs at the bottom of the view
Figure 6 Source viewer
3.1 Function tree-view
The function tree-view is populated with source filenames and functions decoded from the ELF file. Each
file node can be expanded to show the functions it contains. The size of the code generated from each
source file can optionally be appended to the filename by ticking the ‘ROM’ check box at the top of the
view. The full path can also be displayed by ticking the ‘Path’ check box.
If any source files are missing, and there is debug information in the ELF file which specifies their original
source file names, then ticking the ‘Missing Files’ check box will show the files and their functions in
light grey. If the ‘Missing Files’ check box is disabled then all source files and functions specified in the
ELF file have been found and are displayed.
Functions that cannot be associated with a source file are grouped together in a pseudo file entry in the
tree-view called {library functions}.
Clicking on any function in the tree-view will display its implementation in the corresponding source file
in the source file view. If no source file can be found then the source view will be cleared and “<Source
not available>” displayed.
3.2 Source file view
The currently selected function in the tree-view is displayed in the source file view. Clicking on a line in
the source file view that contains code will show the underlying disassembly in the setup/status view
when the ‘Disassembly’ tab is active.
2 1 3
Page 14
Source Viewer QTRACE - USER MANUAL
© 2018 PDQLogic Ltd. QTrace User Manual Rev 1.01 Page 14
One of the most useful features in the source file view is the yellow vertical margin in the left hand side
of the view which displays execution counts for each source line. This is referred to as code coverage.
3.2.1 Code coverage
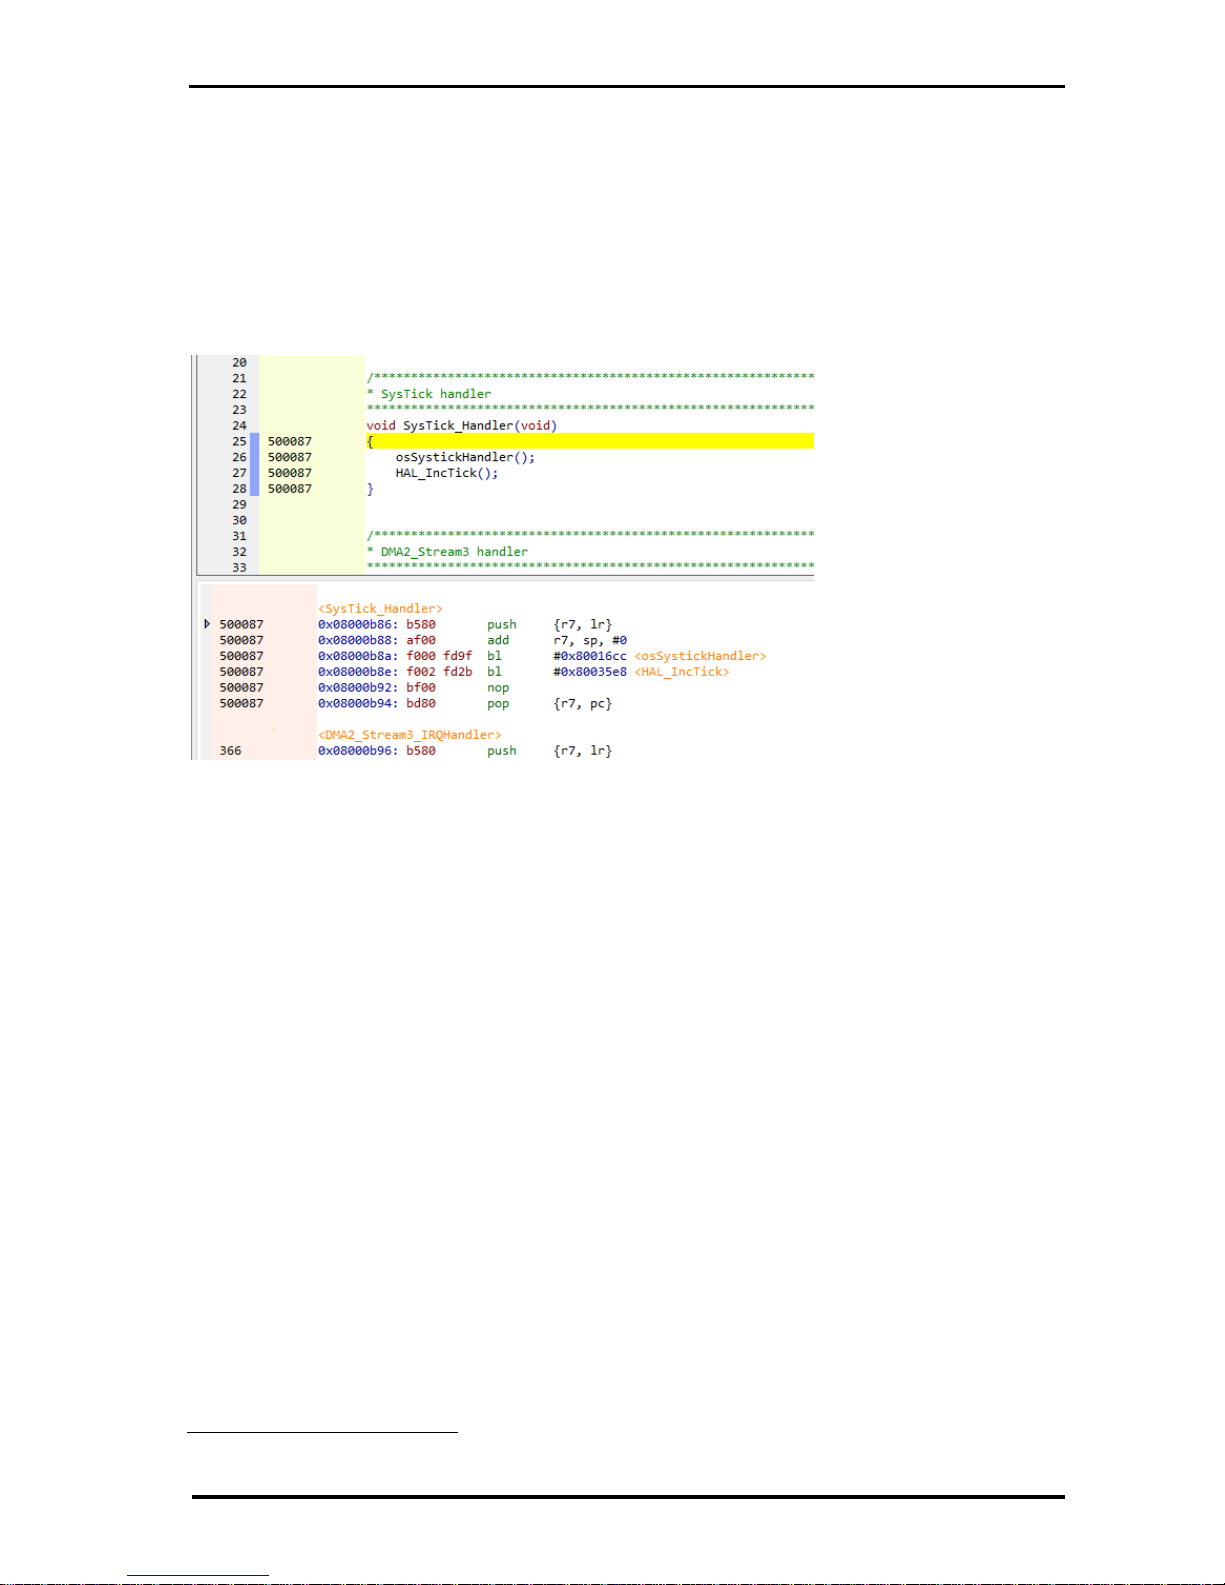
A purple block to the right of the source file line number indicates that there are underlying processor
instructions i.e. it is not just a comment or white space. To the right of each purple ‘code block’ is a
count of how many times the source line has been executed. If there is no count displayed i.e. it is blank,
then the line has not yet been executed. A similar view is shown in the disassembly window in its pink
coloured margin.
Figure 7 Code coverage in source and disassembly views
Trace data is constantly being decoded as the target program is running and as long as there is no trace
buffer overflow4 then the number of times that each CPU instruction has been executed will be
recorded. These instructions are cross referenced to C/C++ source lines and are displayed as execution
counts in the in the yellow source view margin next to the source line. The CPU instruction execution
counts are displayed in the pink margin of the disassembly window.
Note that recording execution counts for each instruction is not the same as recording every single
instruction that has been executed since reset to allow an entire execution timeline to be reconstructed.
There is, however, a similar feature in the QTrace Analyser which is limited to 8 million consecutive
instructions, see Trace Capture in section 4.
Having an indication of whether a source line has been executed, and how many times, is very powerful.
This feature is similar to having a breakpoint on every source code line but without actually affecting
processor execution. Although variables and register values can’t be inspected, knowing where the
processor has been and how many times is a ‘smoking gun’ for debugging tricky problems. This is
something that break-and-step debugging only gives when a breakpoint is hit and will be missed if a
break point was not in place when code of interest was executed.
This feature is much more effective and timesaving than sprinkling code with printf debug statements to
know if a particular line was executed. Adding debug code will alter execution timing and may
compound an issue being investigated.
4
Overflow shouldn’t happen with a suitable PC specification (see Section 10)
Page 15
Source Viewer QTRACE - USER MANUAL
© 2018 PDQLogic Ltd. QTrace User Manual Rev 1.01 Page 15
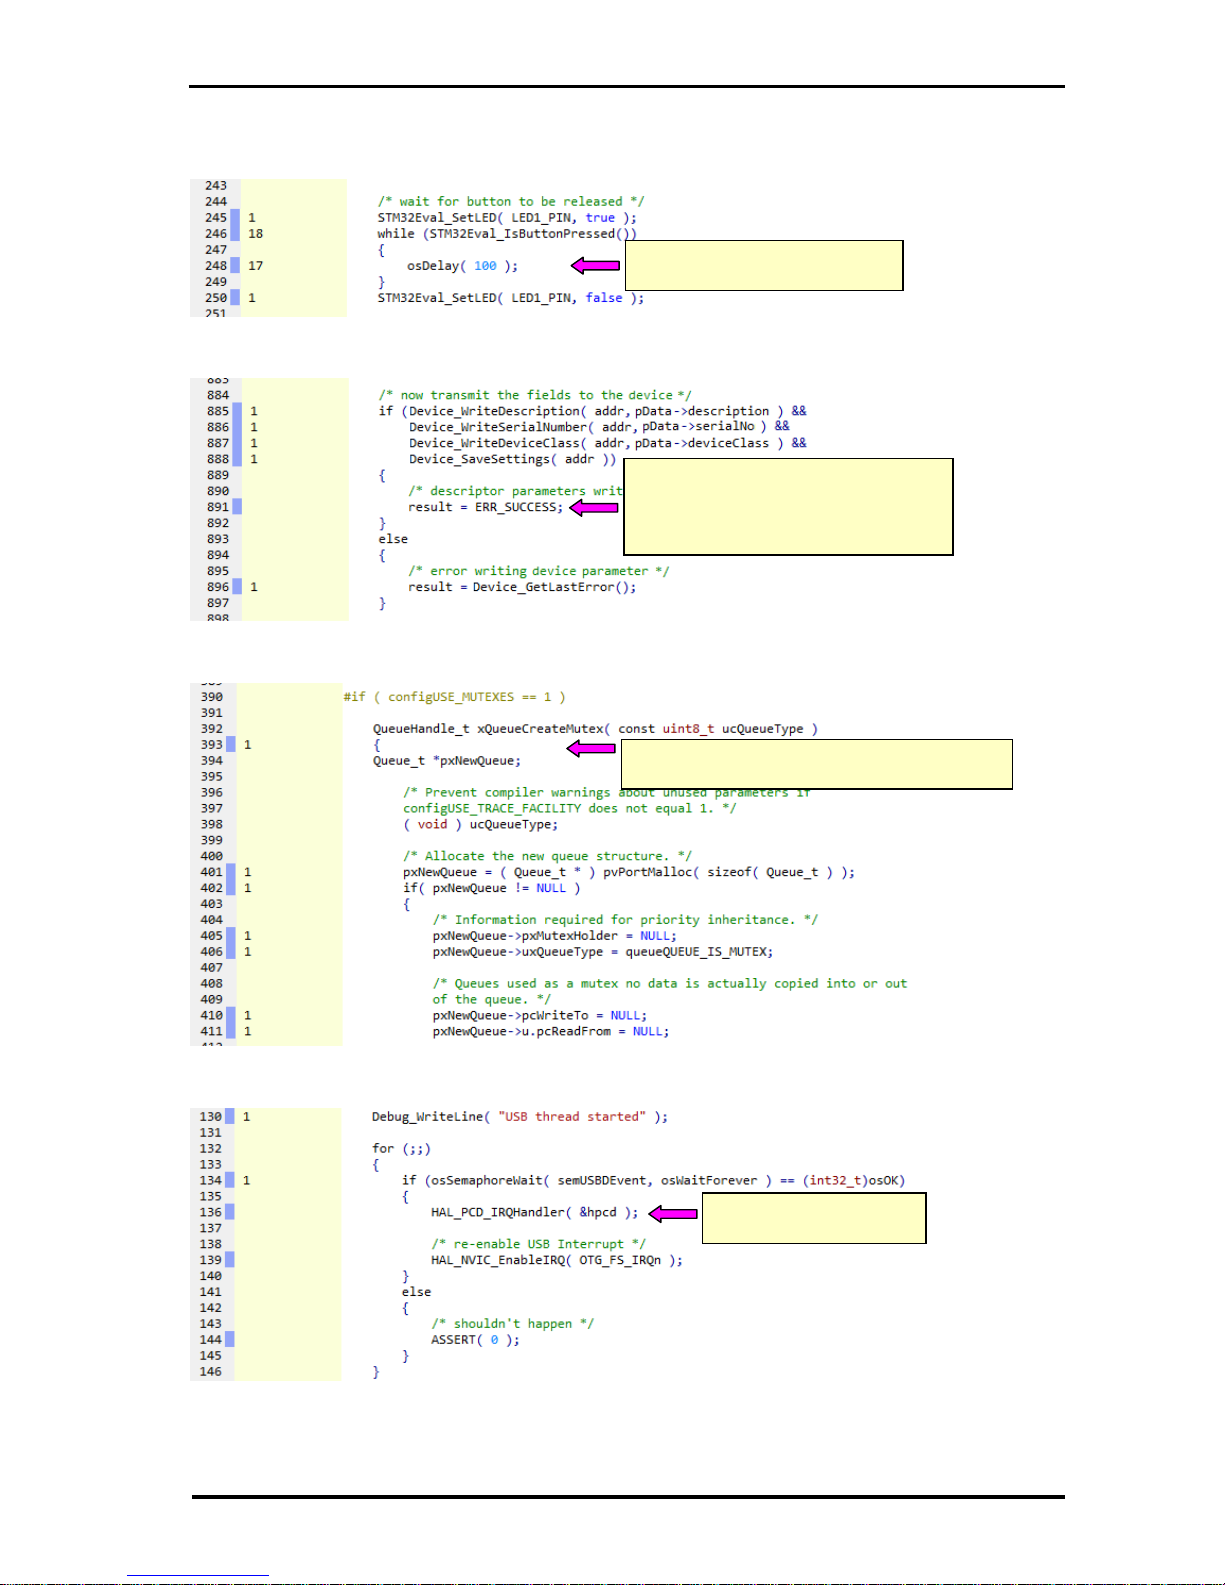
The following are examples of what debug information can be inferred from code coverage without
having to stop the CPU, or insert break-points and re-run the application or insert printf statements:
Figure 8 Code coverage #1 – Inferred time duration
Figure 9 Code coverage #2 – Multiple conditionals on separate lines
Figure 10 Code coverage #3 - Only 1 mutex created
Figure 11 Code coverage #4 – Blocked thread
Conditional statements on separate lines
quickly show which tests passed & failed
(line 891 didn’t execute therefore
Device_SaveSettings() on line 888 failed)
17 x 100ms delays
(button held between 1.7s & 1.8s)
Line not yet executed
(blocked on line 134 above)
xQueueCreateMutex() called only once
(unusual for a typical multi-threaded application)
Page 16
Source Viewer QTRACE - USER MANUAL
© 2018 PDQLogic Ltd. QTrace User Manual Rev 1.01 Page 16
3.2.2 Code coverage pause and clear
The dynamic code coverage updating can be paused by selecting View Pause Code Coverage. This will
freeze the currently displayed values but the underlying counting will continue. Selecting the menu
option again will resume coverage updating.
The code coverage counts can be cleared by selecting View Clear Code Coverage.
3.2.3 Single stepping and execution count latency
When the processor hits a break point and is then single stepped, the execution counts will likely be
several steps behind the current processor location. This is because the processors’ internal trace
hardware compresses and buffers execution information for multiple instructions before it transmits it
to the trace port. Because the QTrace Analyser does not have access to the JTAG port it cannot flush the
buffer and thus there will be latency in execution count updates. This does not result in any trace data
being lost however.
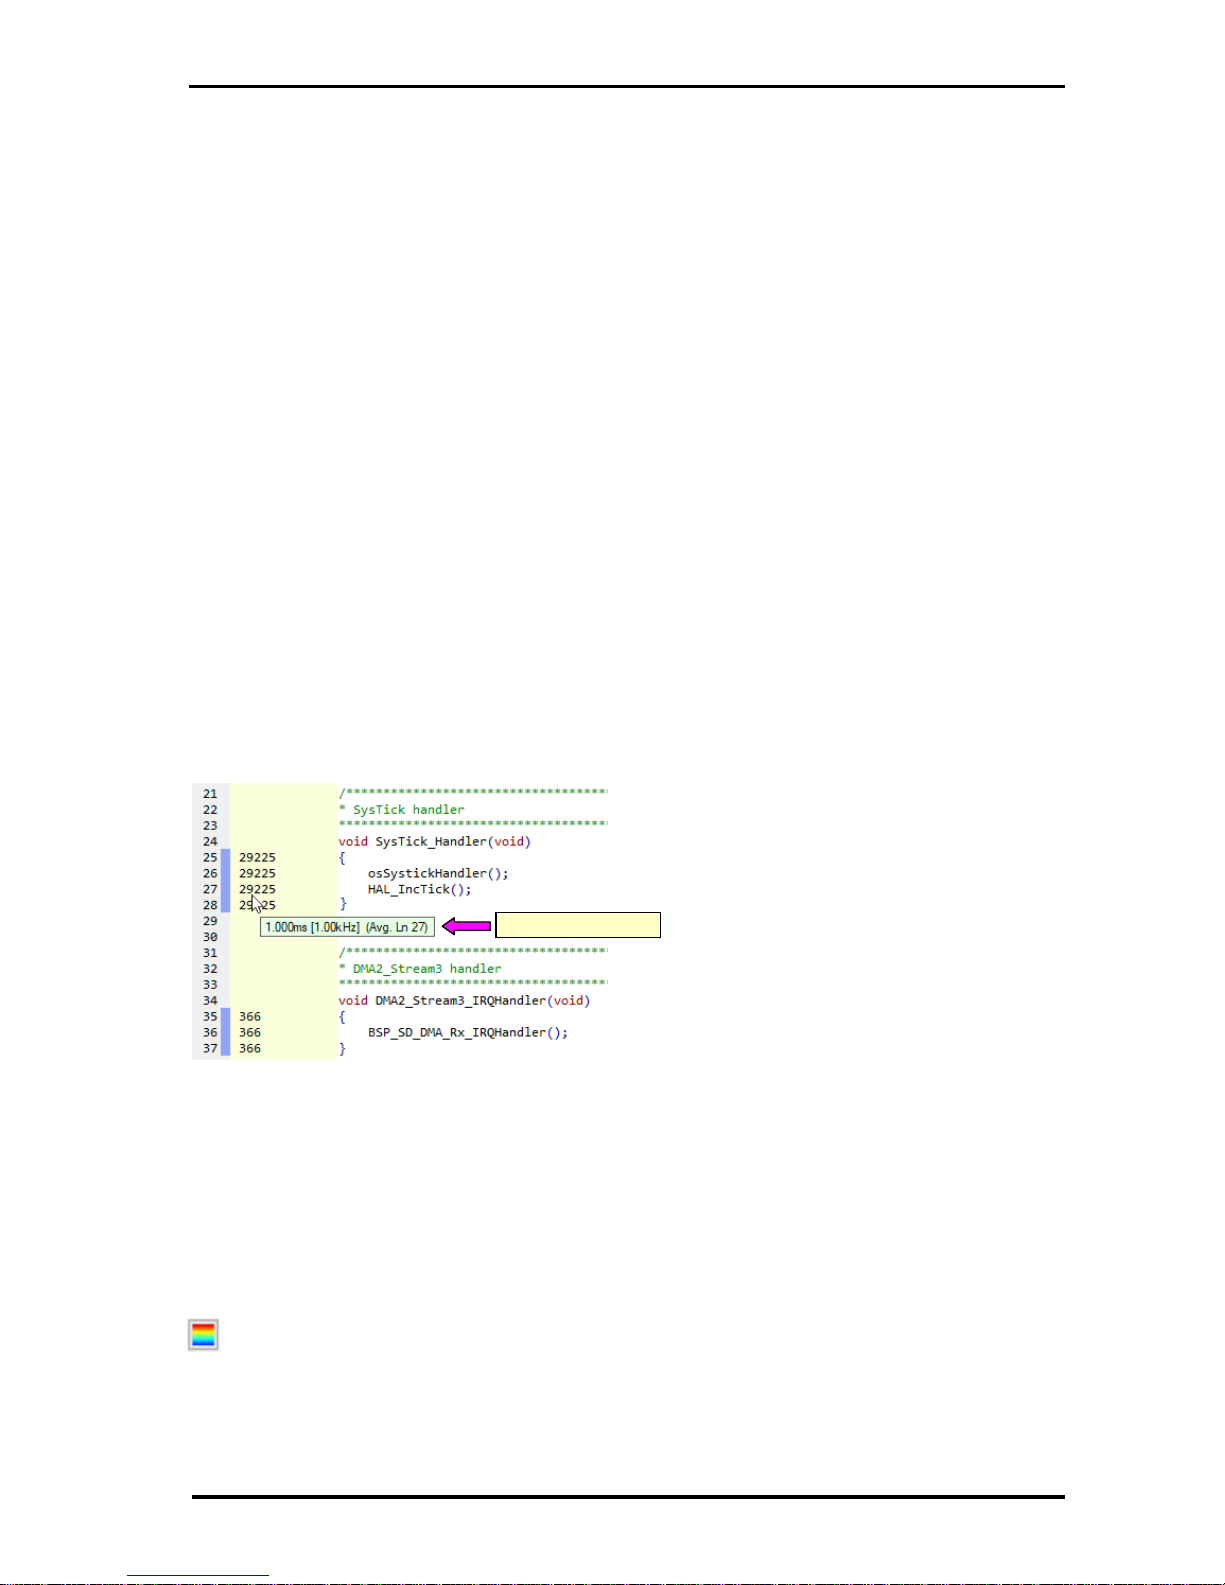
3.2.4 Loop timing
There are many occasions while debugging when knowing the timing of a loop is very helpful. Examples
include interrupt rates, timer periods, state machine cycle times, thread execution intervals, etc. The
QTrace Analyser shows this information effortlessly and without the need to modify the code to toggle
an I/O pin to view on an oscilloscope. By simply hovering the mouse cursor over an incrementing
execution count in the source file view will cause a pop-up window to be displayed that shows the rate
at which the line of code is being executed. Filtering is applied to the timing calculation with a time
constant of several seconds to derive an accurate average rate.
Figure 11 shows an example of loop timing for the SysTick handler which is being called every
millisecond as expected.
Figure 12 Source view loop timing
3.2.5 Execution heat map
On the right hand side of the source view, left of the vertical scrollbar, a thin resizable vertical window
shows an overview of the lines that have been executed in the current source file. Coloured lines on the
heat map denote source lines that have been executed. The colour of each line indicates the execution
count for that line as a percentage of the total number of counts in the source file. The colours range
from blue for the smallest number of counts up to red for the largest number. This is depicted by the
colours on the heat-map set-up button at the top right of the source view:
When the button is pressed, a pop-up menu appears allowing the appearance of the heat map to be
changed. The width of the heat map can be changed by moving the mouse cursor over the left edge
then clicking and dragging. Also, any source line can be instantly scrolled into view by clicking on an area
Loop timing pop-up
Page 17
Source Viewer QTRACE - USER MANUAL
© 2018 PDQLogic Ltd. QTrace User Manual Rev 1.01 Page 17
of interest on the map. This is particularly useful to instantly see which line in a source file is being
executed the most by clicking on the red coloured line on the heat map.
Figure 13 Source view execution heat map
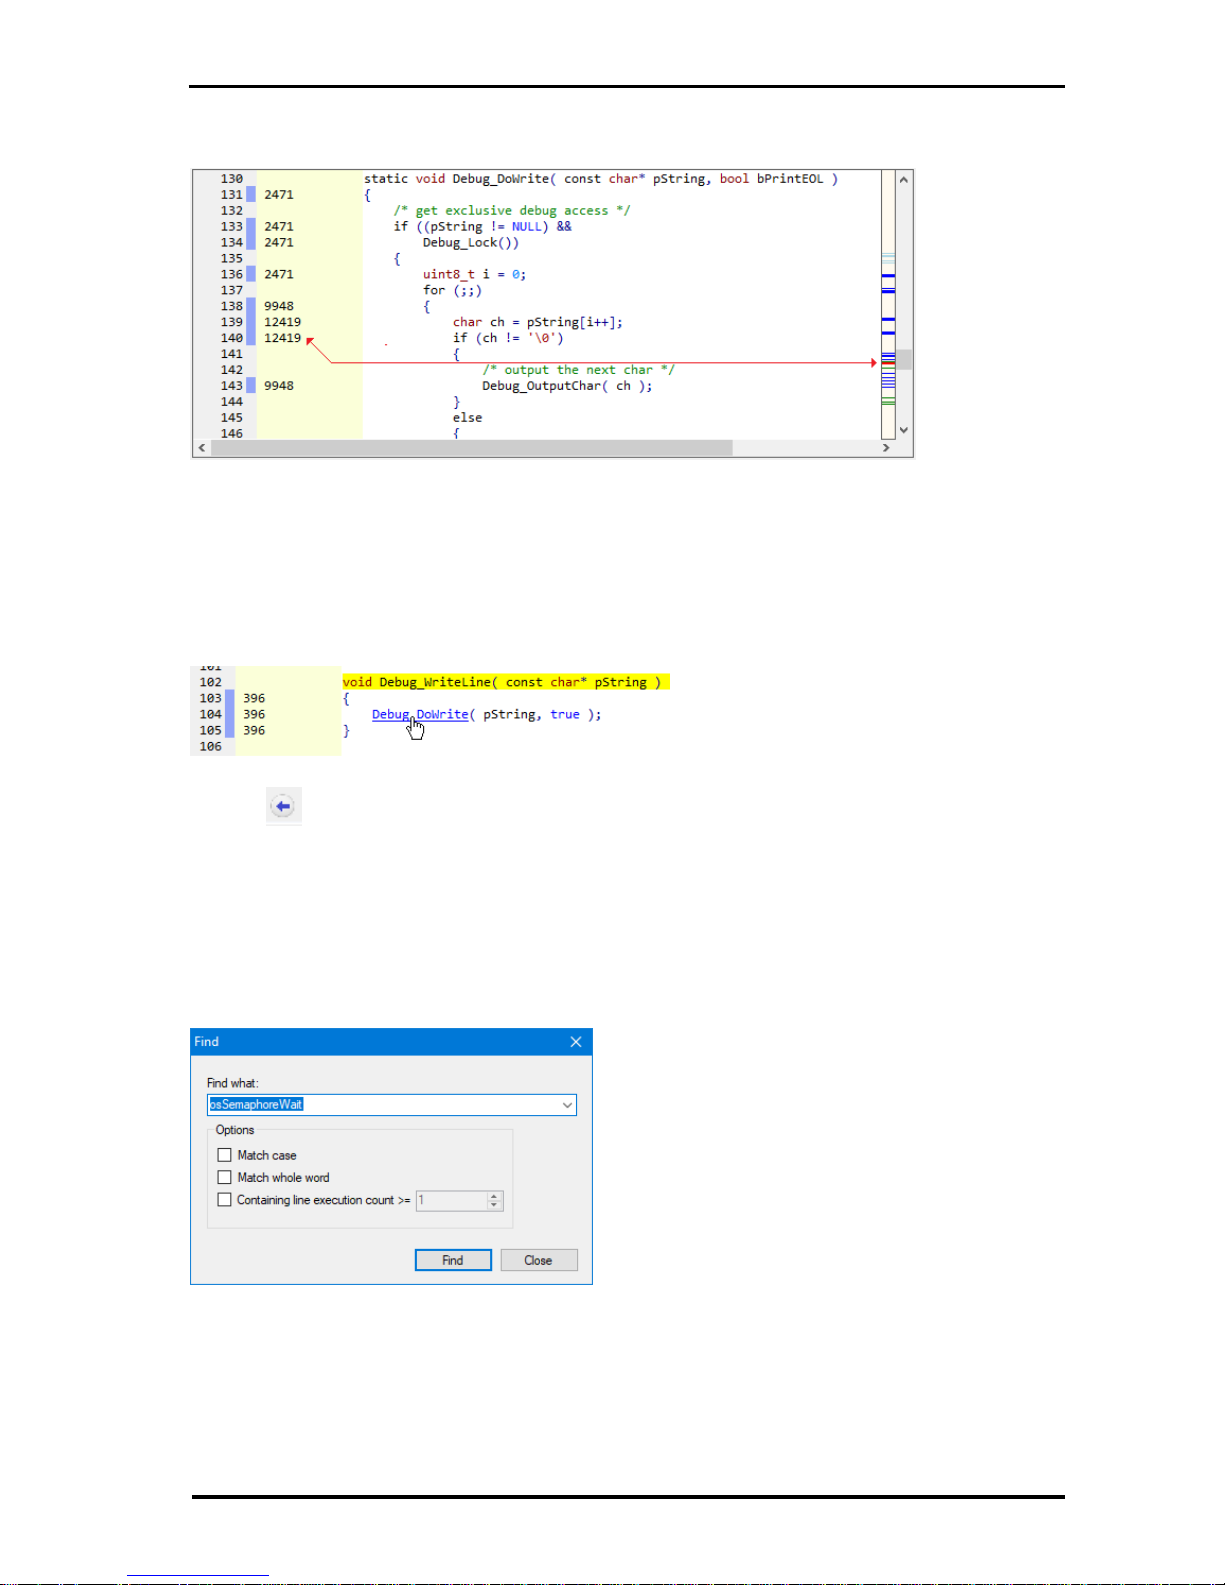
3.2.6 Navigating to function implementations
The mouse cursor will turn into a hand when it is hovered over a function implementation in the source
view. The function name will turn into hyperlink which can be clicked on to navigate to the function
source. This can be in the current source file or another file. Note that this feature will be inactive if the
function source is unavailable or if the function is a macro.
To go back to the previous view after clicking on a hyperlinked function, click the back button on the
toolbar
Note: to disable this feature, e.g. when copying text, hold the Ctrl key down while hovering over a
function.
3.2.7 Find text
The source view has a text search feature that can find specified text in the current file or in all available
source files that were used to build the ELF file. The Find dialog below is displayed by selecting menu
option View Find in Current File… or by pressing Ctrl+F.
Figure 14 Source view find text
If the text is found, it will be scrolled into view. Pressing F3 will find the next occurrence if one exists.
The Find-in-Files dialog is identical to the Find dialog and is displayed by selecting menu option View
Find in Files… or by pressing Ctrl+Shift+F. The Find-in-Files results will be listed in the ‘Find Results’ page
in the setup/status view. Clicking on any entry will display highlighted search text on the line and file
where it was found.
Page 18
Source Viewer QTRACE - USER MANUAL
© 2018 PDQLogic Ltd. QTrace User Manual Rev 1.01 Page 18
A useful feature in the find dialog is the check box option to return only results where the line on which
the text is found has been executed 1 or more times. This is particularly useful for Find-in-Files where
there will inevitably be more results and all of them would otherwise need to be reviewed.
Figure 15 Source view find in files results
3.2.8 Find function from clipboard
When switching between the IDE and QTrace Analyser there is an option to find a function
implementation from a name saved on the Clipboard. In the IDE copy the function name of interest to
the Clipboard then in the QTrace Analyser select View Find Function From Clipboard or press Ctrl+V.
If the function name can be matched then the implementation will be displayed in the source view.
3.2.9 Source view bookmarks
A bookmark can be placed or removed in the current file by selecting menu option View Toggle
Bookmark or by pressing Ctrl+F2. A marker is placed on the selected line in the margin next to the line
number and is remembered between successive edit-download cycles. By selecting View Next
Bookmark or pressing F2, the source file and line for each bookmark will be displayed.
All defined bookmarks can be viewed and deleted by selecting View Bookmarks… as shown in Figure
16. This view will also show the locations of any WFE/WFI sleep instructions that have been detected by
the QTrace Analyser. These instructions will cause erratic tracing behaviour because they suspend the
trace signals and should be disabled in builds to be traced.
Search results
Page 19

Source Viewer QTRACE - USER MANUAL
© 2018 PDQLogic Ltd. QTrace User Manual Rev 1.01 Page 19
Figure 16 Source view bookmark list
The following features are not specifically related to the source viewer but their settings are accessed
via tabs in the Settings / Status window in the source viewer and so are detailed here.
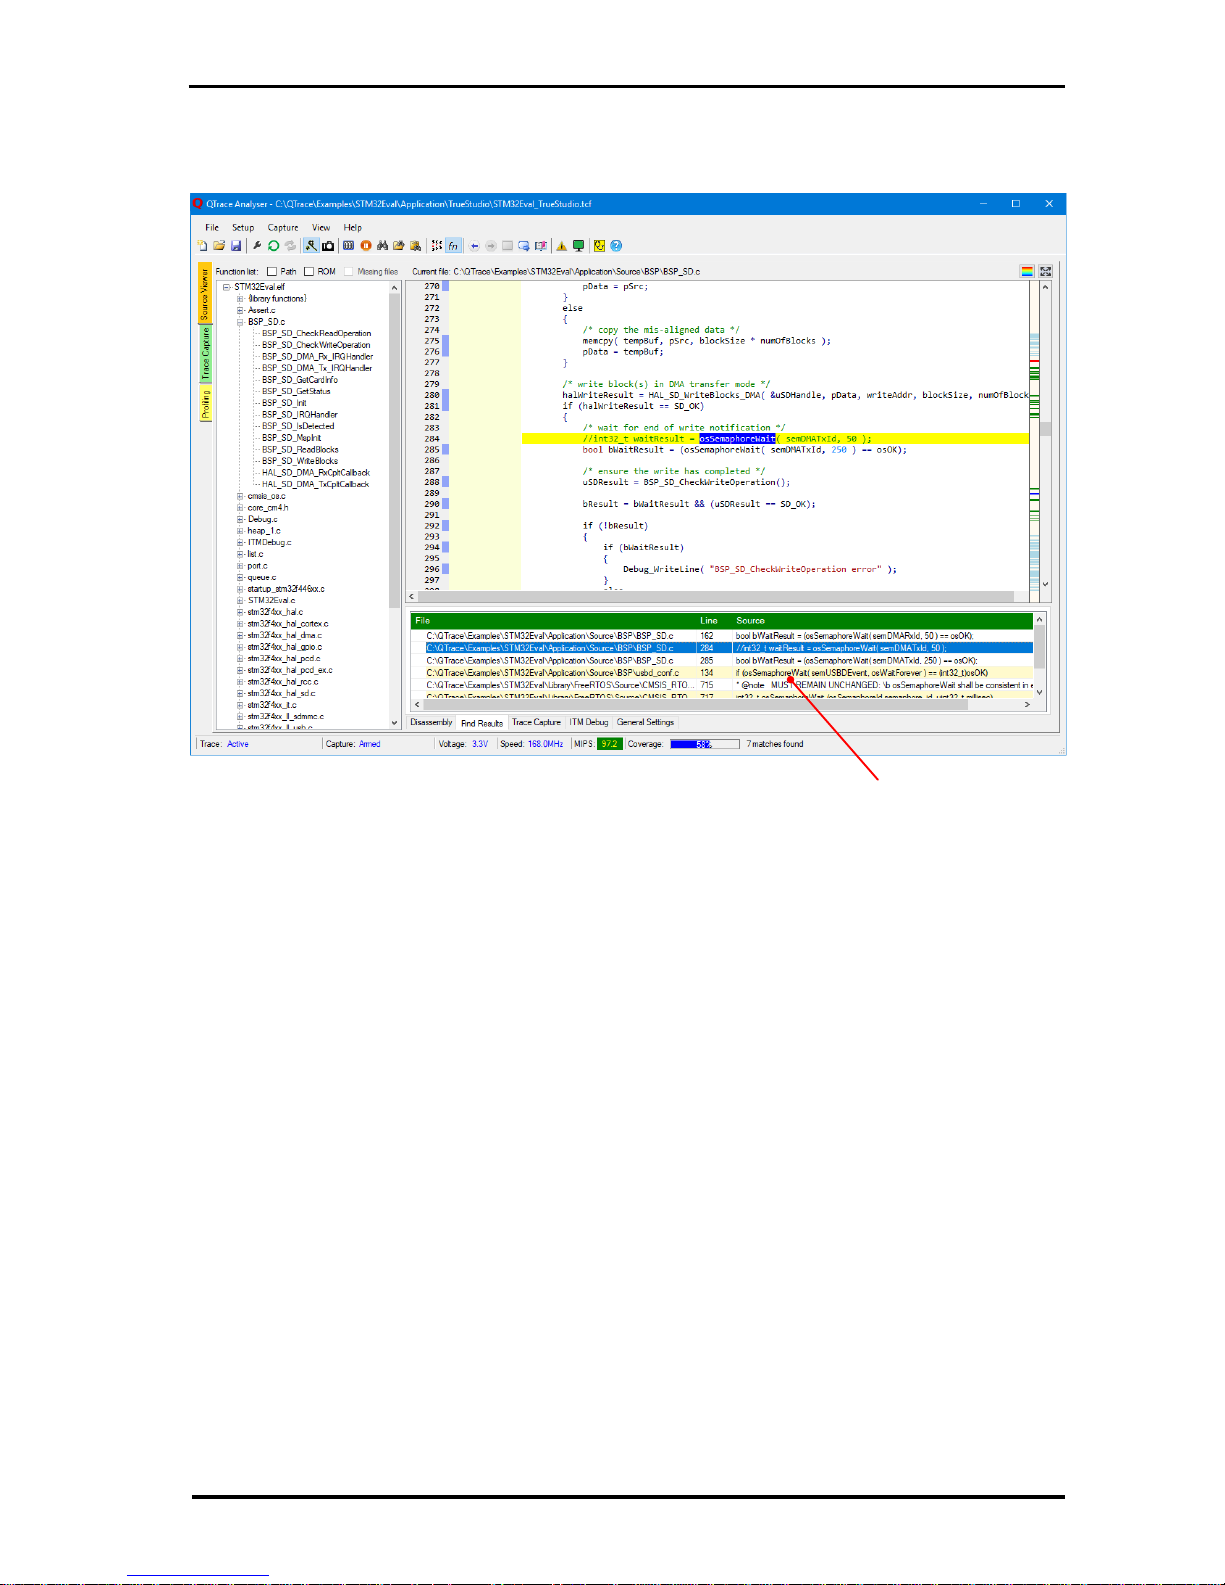
3.3 ITM debugging
The trace interface allows a very convenient, low overhead, way of passing debug data from a target
application to the QTrace Analyser for viewing in a debug window. This is achieved in the firmware
simply writing bytes to a specific memory location, effectively creating a debug channel. It is possible to
redirect the output of standard printf style library functions to this channel by implementing a custom
_write() function. This is typically implemented as a stub function in a file usually named syscalls.c. For
further details of writing to the ITM debug port, refer to the example C code installed with the QTrace
Analyser here:
C:\Users\Public\PDQLogic\QTraceAnalyser\Firmware\Examples\ITM
The ITM debug window is shown / hidden by from the menu option View ITM Viewer… or via the
toolbar:
The debug window below shows output from the STM32-Eval demonstrator detailed in Appendix B:
Page 20
Source Viewer QTRACE - USER MANUAL
© 2018 PDQLogic Ltd. QTrace User Manual Rev 1.01 Page 20
Figure 17 ITM debug window
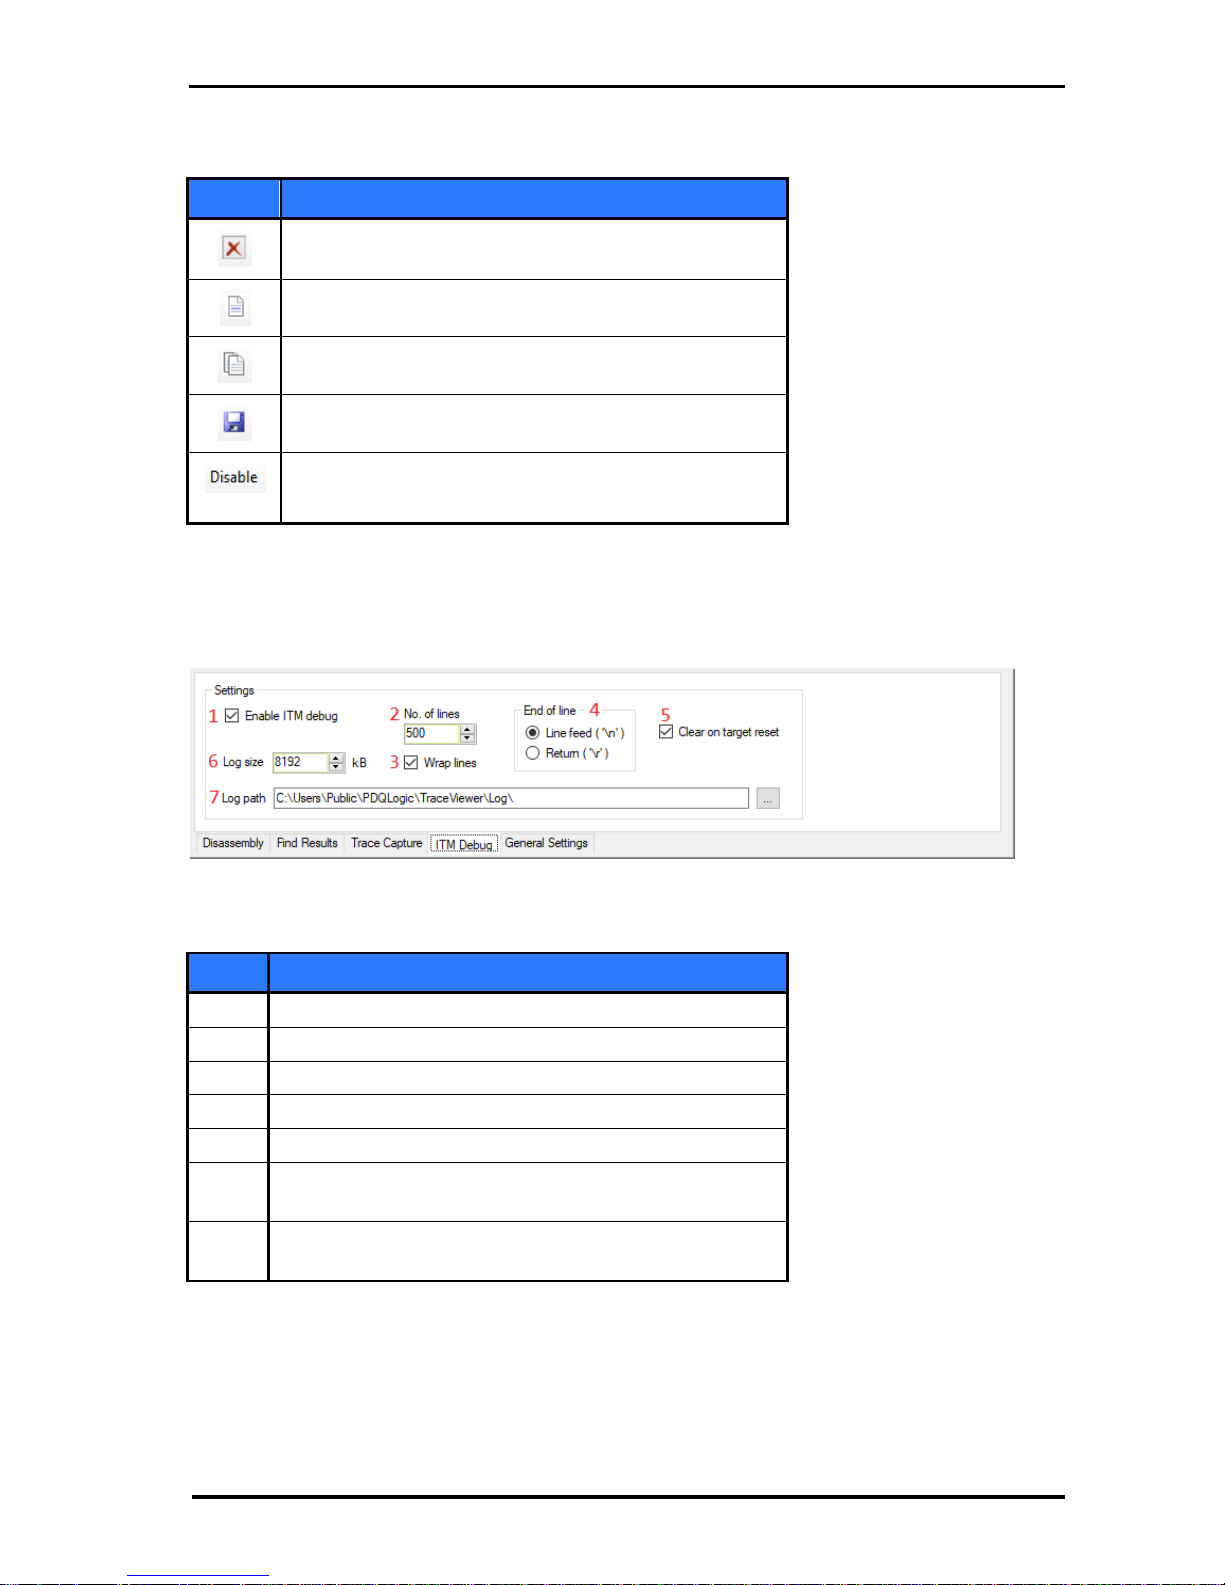
The ITM debug window toolbar buttons are summarised below:
Button
Description
Clear debug window
Copy selected line to Clipboard
Copy all lines to Clipboard
Save debug buffer to log file
Stop debug window being updated
(changes to ‘Enable’ when pressed)
Table 7 ITM debug window buttons
Figure 18 shows the settings associated with the ITM debug window. These are accessed from the ITM
Debug tab in the Settings / Status window in the Source Viewer and are summarised in Table 8.
Figure 18 ITM debug settings
Setting
Description
1
Enable / disable ITM debug function
2
Number of lines that the debug window can display
3
Wrap lines when they exceed 256 bytes or discard bytes
4
Select the character which will terminate a line
5
Optionally clear the window when the target is reset
6
Size of circular buffer used to store received debug
characters (also sets max. log file size)
7
Path to store time stamped debug logs when the save
button is pressed in the debug viewer
Table 8 ITM debug settings summary
Page 21

Source Viewer QTRACE - USER MANUAL
© 2018 PDQLogic Ltd. QTrace User Manual Rev 1.01 Page 21
3.4 General Settings
There are a number of QTrace Analyser settings that are accessible from the Settings tab in Settings /
Status window in the Source Viewer:
Figure 19 General settings
These settings are persistent and are summarised below:
Item
Description
1
Make the QTrace Analyser application the top-most window
2
Show information pop-up event windows even when the application is hidden
3
Display hyperlinks when hovering over functions in the source view
4
Display a call period popup when hovering over execution counts
5
Synchronise the file/function tree-view with changes in the source view
6
Width of tab characters in the source view
7
Set the location of the (optionally coloured) trace view selector tabs in the main window
8
Colour the main application tabs
9
Warn if no exception trigger has been set
10
Warn about WFE/WFI sleep instructions (will cause trace synchronisation issues)
11
Re-enable exception trace capture after non-exception trace capture
12
Require a target reset before tracing begins
13
Prevent trace probe flushing trace data when target halt detected e.g. single step
14
Capture trace immediately after target reset detected (useful for watchdog investigation)
15
Automatically enable trace capture triggers after target reset detected
16
Clear all code coverage information when target reset is detected
17
Switch to the main source viewer when target reset is detected
18
Maximum time to wait from detecting trace clock to trace synchronised
19
Automatically re-sync trace if sync is lost (suppress pop-up error)
20
Reset trace probe USB interface if trace sync is lost
21
Reset PC USB interface if trace sync is lost
22
Capture trace if sync is lost (useful for locating incorrect disassembly of target image)
23
Reset the trace probe if a trace buffer overflow occurs (suppress pop-up error)
24
At start-up check if a newer version of QTrace Analyser is available
25
Reload the previously opened configuration when the application starts
26
Set the application to high priority to help to avoid trace overruns
27
Workaround to stop USB driver crashing when PC sleeps
28
Check power scheme at start-up and warn if it may affect trace decoding performance
29
Allow trace probe to reset its USB interface if communication is lost
Table 9 General settings
Page 22

Trace Capture QTRACE - USER MANUAL
© 2018 PDQLogic Ltd. QTrace User Manual Rev 1.01 Page 22
4. Trace Capture
The QTrace Analyser will continually decode trace data streamed data from the QTrace probe. It
maintains a buffer of the last 8 million instructions traced and can freeze the buffer at any time. This is
referred to as trace capture. After the trace buffer has been frozen it can be viewed and analysed while
trace data decoding continues as normal. A typical view is shown below:
Trace capture is typically used to determine how the processor ended up executing a particular area of
code. There are 3 common scenarios:
1. Determine at any time where a function in the source view is being called from
2. Detect if a specific address or source line, or range, is executed
3. Reveal where a CPU exception was triggered
4.1 Trace Capture Trigger
All cases above require a trigger condition to be defined. For case 1 this is achieved with a single key
press, see section 4.1.1. Cases 2 and 3 require several parameters to be specified which is done in the
Trace Capture tab in the setup/status view:
Figure 20 Trace capture set-up
There are four triggers available which are selected using [1]. Each trigger can be configured for a single
or range of source lines or addresses [2], [4]. When a single source line or address is specified, a 'hit
count' [3] can also be specified so that a trigger will not occur until the line / address has been executed
a specified number of times.
If a source line based trigger is required then rather than manually specifying the lines in [5] click the
required line(s) in the source file view to enable the 'Use Source' button [14] which when clicked will
populate the line number(s) [5]. If the trigger was previously configured for a source line based trigger
then clicking the 'View Source' button [13] will highlight the current settings in the source file view. Each
trigger can be enabled or disabled via the 'Enabled' check box [7].
Page 23

Trace Capture QTRACE - USER MANUAL
© 2018 PDQLogic Ltd. QTrace User Manual Rev 1.01 Page 23
When the new trigger parameters have been entered, clicking the ‘Apply’ button [11] will cause them to
take effect.
Trace capture can be globally enabled / disabled by selecting menu option Capture Enable. When the
target trace is first configured trace capture is globally enabled. Whenever a trigger event occurs,
further trace captures are disabled i.e. they are globally disabled and have to be explicitly re-enabled.
When trace capture is globally disabled and the currently viewed trigger is enabled then the check box
[7] will be displayed as:
If a trigger has been designated for CPU exception handlers by ticking check box [8] then it will remain
enabled even when triggers are globally disabled. Only one trigger can be assigned to exception
handlers and it will always be enabled until it triggers. Any previous non-exception capture data will be
overwritten by the exception data as it is likely to be of more interest. See section 4.3 for further details
of exception trace capture.
4.1.1 Trace Point
A trace point is used to generate a call stack view, in a similar way to an IDE when a breakpoint is hit but
without stopping the CPU. By selecting any line of code in the source view and then pressing F9 a
temporary trace capture is defined. This is a temporary trace capture trigger in addition to the four
detailed in section 4.1. It is essentially a single source line based trigger with a hit count of 1. The left
hand margin for the line in which a trace point is defined is coloured brown. Note that only one trace
point can be defined and, unlike the other four triggers, the trace point is not reinstated when the
QTrace Analyser is restarted.
4.2 Trace capture view
When a trace capture event occurs, the trace capture view will become active. Depending on the
selection of the highlighted tab control at the bottom left corner, this view will have 2 or 3 resizable
areas and a collection of controls. The resizable areas are:
1. CPU instruction list view
2. Simple source view
3. Function Timeline (see Figure 22 on the next page)
Figure 21 Trace capture without the timeline shown
Page 24

Trace Capture QTRACE - USER MANUAL
© 2018 PDQLogic Ltd. QTrace User Manual Rev 1.01 Page 24
Figure 21 shows the simple source view displayed across the bottom half of the trace capture view.
When the timeline view is selected (tab highlighted orange in Figure 22 below), the CPU instruction list
is split and the source view is inserted.
Figure 22 Trace capture with the timeline displayed
4.2.1 CPU instruction list view
This list view (window 1, Figure 22) displays the underlying trace records which the other views build on.
There is one trace record per instruction and there are up to 8M records available. Each record consists
of:
1. Cumulative instruction cycle count (relative to the first record)
2. Instruction address
3. Instruction disassembly
4. Filename of corresponding source code
5. Line number of corresponding source code
6. Function name
7. Source code
The most recent record will be highlighted when a trace capture event occurs and it corresponds to the
instruction that was executed when the trigger conditions were met. The trigger (1-4) which initiated
the capture, and number of records captured, is displayed next to the 'Capture' label in the status bar. If
the trace point triggered the capture then no trigger number is displayed.
When a record is selected in the list view, the corresponding source code is displayed in the other two
views. Double clicking in the list view on any record with source code defined will switch to the
corresponding location in the main source viewer.
4.2.2 Simple source view
This is a view (window 2, Figure 22) shows the source code that corresponds to the currently selected
trace record. It is used to give source context to the trace record. It does not have features that the
main source viewer has such as code coverage, loop timing, etc.
Page 25

Trace Capture QTRACE - USER MANUAL
© 2018 PDQLogic Ltd. QTrace User Manual Rev 1.01 Page 25
4.2.3 Function timeline
The function timeline (window 3, Figure 22) is a graphical representation of the captured trace records
showing which functions were executed and for how long. The thick red horizontal bars represent the
time spent in each function and the thin vertical lines represent transitions to other functions. The
vertical blue line represents the selected trace record in the CPU instruction list view. The units on the
X-axis are instruction number rather than time but hovering the mouse cursor over any horizontal bar
will show a pop-up window detailing the function name and time spent in the function.
Figure 23 Trace capture timeline
4.2.3.1 Timeline controls
There a number of controls associated with the timeline as detailed below.
Figure 24 Timeline controls
The timeline controls allow the view to be adjusted by zooming in and out [1] and allows the next
function transition to be selected [2]. The number of trace records that are converted to entries in the
function timeline defaults to the last 65536. This is usually sufficient but can be increased by selecting
from a drop-down list [3] and then pressing the refresh button [4]. The new value will also be used for
further trace capture events. The refresh button is also used to manually load the timeline after a trace
capture when Auto load [5] is un-ticked.
When scrolling the timeline left or right, the function names on the left hand side can be dynamically
sorted [7] or fixed alphabetically [8]. When functions are dynamically sorted then as many red function
bars as possible will be kept visible which is useful when there are more function names than can be
displayed. This minimises or avoids scrolling up / down to see which function has been transitioned to.
If a trace record is selected in the list view that is outside of the range of loaded timeline instructions
and the ‘Load prompt’ check box [6] is ticked then there will be a prompt to load more instructions to
construct a larger timeline. If it is un-ticked then the timeline will not be updated.
1
2
3
4
5
6
7
8
Page 26

Trace Capture QTRACE - USER MANUAL
© 2018 PDQLogic Ltd. QTrace User Manual Rev 1.01 Page 26
4.2.3.2 Function pinning
If there is a function of interest, it can be ‘pinned’ to the top of the function name list to ensure it is
always visible when scrolling left and right. This is done by left clicking the mouse on the function name
and selecting Pin Function from the pop-up menu. The function will be moved to the top of the list and
will be highlighted in red to indicate it is pinned. It can be unpinned by left clicking and then selecting
the Unpin Function menu option.
Figure 25 Timeline function pinning
4.2.3.3 Timeline function search
The pop-up menu in Figure 25 above also has options to search for the next transition to a specified
function left or right of the current position. The function is specified by left clicking on the desired
function name from the list and then selecting the Search Back or Search Forward menu option. There
are short-cuts to search backwards or forwards by clicking on the function name while holding the Ctrl
or Shift key respectively.
4.2.3.4 Measuring timeline intervals
To measure the time between multiple function calls left click the mouse at the start of the function of
interest then right click to show a pop-up menu. Select Set CursorT1 to define cursor T1 and then
repeat for the second function of interest for T2. The time between the two cursors is given in the Δt
display highlighted in orange in Figure 26.
Figure 26 Measuring function call intervals
The trace capture view has several other features which affect all views and are described in the
following sections.
Page 27

Trace Capture QTRACE - USER MANUAL
© 2018 PDQLogic Ltd. QTrace User Manual Rev 1.01 Page 27
4.2.4 Find trace record
Trace capture has a search function which allows searches for a known address, a function name or
source line in the large number of trace records. The search criteria are entered in the Find Trace Record
dialog which is displayed by clicking the ‘Setup’ button in the Search controls group.
Figure 27 Find trace record dialog
If the Search by option is set to Function Name or Source file | line, then pressing the highlighted browse
button (…) will display one of the two dialogs below depending on the selected search option:
Figure 28 Find trace record function / file browse dialogs
When the search criteria have been entered, clicking the ‘Find’ button will search from the currently
selected trace record in the direction specified. If the search is successful then the new trace record will
be displayed and the other views will be updated accordingly.
To repeat the search from the new trace record position, click the ‘Previous’ or ‘Next’ search button.
Page 28

Trace Capture QTRACE - USER MANUAL
© 2018 PDQLogic Ltd. QTrace User Manual Rev 1.01 Page 28
4.2.5 Go to source
To find the trace record that corresponds to previous or next executed source line click the ‘Previous’ or
‘Next’ buttons in the Go to Source control group. This will highlight a new trace record and update the
other views accordingly.
Figure 29 Source navigation controls
4.2.6 Trace record bookmarks
When analysing trace records it is useful to have a way to mark records of interest and to be able to
easily go back to them. The bookmark controls in Figure 30 enable this.
Figure 30 Bookmark controls
By selecting a trace record of interest, pressing the bookmark ‘Toggle’ button will add the record to the
bookmark list and will colour the instruction number red as shown in Figure 31. Pressing the button
again will remove the bookmark from the list. When a bookmarked trace record is selected, the entire
record will be highlighted red. The bookmarks are easily navigated by pressing the ‘Previous’ and ‘Next’
bookmark buttons. All bookmarks can be cleared by pressing the bookmark ‘Clear’ button.
Figure 31 Bookmarked trace records
4.2.7 Instruction list-view context menu
The instruction list-view has a context menu giving access to most trace capture functions detailed in
section 4.2. Additionally, the context menu has options to copy details of the currently selected trace
record, see the highlighted menu items below:
Page 29

Trace Capture QTRACE - USER MANUAL
© 2018 PDQLogic Ltd. QTrace User Manual Rev 1.01 Page 29
4.3 Exception trace capture
One of the most useful trace capture features is the ability to detect and display when a target
exception occurs. Being able to pin-point exactly where the exception occurred and having a history of
the function calls that lead to the event is very powerful and can save hours of debugging time.
Exception trace capture requires a trigger to be defined for the ARM Cortex-M exception handlers:
NMI
HardFault
MemManage
BusFault
UsageFault
When a trace configuration is created (see section 6, page 34), a trace capture trigger is also created for
the exception handlers. The QTrace Analyser determines the locations of the handlers from the vector
table, specified in the trace configuration, and configures a trigger to cover all instructions in the
handlers. An exception trace capture will be generated if the processor executes these instructions.
The example in Figure 32 below shows a hard fault being deliberately generated by reading from a nonexistent address. The instruction highlighted in blue attempted an invalid read and the other two views
show the corresponding offending function. Note that the entry below the blue highlighted instruction
is the first instruction of the HardFault handler.
Figure 32 Exception trace capture
Additional copy options
Page 30

Trace Capture QTRACE - USER MANUAL
© 2018 PDQLogic Ltd. QTrace User Manual Rev 1.01 Page 30
4.3.1 Problems setting exception handler trigger
Exception handlers will typically be defined as a series of functions in a single source file. The linker will
usually place these functions in contiguous memory, allowing them to be defined as a single memory
range for trace capture. However, if the handlers are not in contiguous memory then the QTrace
Analyser will either be unable to set trace capture for exceptions (range > 8K) or it will generate false
exception triggers when non-exception handler code is executed that has been placed by the linker in
between exception handlers.
Pressing the toolbar button will display the target exception handlers. Figure 33 below shows
handlers that are not in all in contiguous memory (see highlighted NMI handler address).
Figure 33 Target exception handlers viewer
If the code cannot easily be refactored to achieve sequential addresses then indirect exception handlers
can be implemented in a single section. Each handler will then jump to its respective implementation.
An example is shown below:
/* keep handler functions together in the same section */
void NMI_Handler_ind( void ) __attribute__((section(".exception_handlers")));
void HardFault_Handler_ind( void ) __attribute__((section(".exception_handlers")));
void MemManage_Handler_ind( void ) __attribute__((section(".exception_handlers")));
void BusFault_Handler_ind( void ) __attribute__((section(".exception_handlers")));
void UsageFault_Handler_ind( void ) __attribute__((section(".exception_handlers")));
/* indirect NMI Handler */
void NMI_Handler_ind( void )
{
NMI_Handler();
}
.
.
/* indirect UsageFault Handler */
void UsageFault_Handler_ind( void )
{
UsageFault_Handler();
}
/* the interrupt vector table */
const void * const __vector_table[113] __attribute__((section(".isr_vectors"),used)) =
{
(const void*)STACK_BASE,
(const void*)&Reset_Handler,
(const void*)&NMI_Handler_ind,
(const void*)&HardFault_Handler_ind,
(const void*)&MemManage_Handler_ind,
(const void*)&BusFault_Handler_ind,
(const void*)&UsageFault_Handler_ind,
.
.
}
Figure 34 Indirect exception handlers
Page 31

Profiling QTRACE - USER MANUAL
© 2018 PDQLogic Ltd. QTrace User Manual Rev 1.01 Page 31
5. Profiling
This view shows a summary of the execution status of all functions defined in the ELF file. It shows static
and dynamic information including the number of times each function has been called, the amount of
time the CPU has spent in a function since reset and the percentage of instructions executed in the
function. The percentage of instructions executed for all functions is shown as a blue bar graph at the
bottom of the screen in the status bar.
As well as giving an understanding of how code being developed is running, profiling is also a great way
to understand how unfamiliar code works e.g. 3rd party library code or an inherited project.
Figure 35 Function profiling
Any function which is defined by the ELF file which does not have source code available e.g. a 3rd party
library will have a ‘*’ appended to its name. To see the corresponding code view of any function in the
list which does have the source available, double-click on the list entry to switch to the main source
viewer to see its implementation.
Two other profiling views, source file and IRQ handler, can be selected from the radio buttons in the
Sort / Filter by controls:
These views are shown in Figure 36 and Figure 37 respectively. The IRQ handler option shows all
interrupt service handlers and is very useful to see at a glance which interrupts are occurring most
frequently. Note that this option is not available if a generic Cortex-M3/M4 device was selected in the
trace configuration dialog, see section 6.1.2 on page 35.
Page 32

Profiling QTRACE - USER MANUAL
© 2018 PDQLogic Ltd. QTrace User Manual Rev 1.01 Page 32
The check box options in the Sort / Filter by controls allow library functions to be hidden (useful when
reviewing just application code) and to show/hide function filename and static information (address,
length and instruction count).
Figure 36 Profiling functions in a source file
Figure 37 Profiling Interrupt service handlers
Page 33

Profiling QTRACE - USER MANUAL
© 2018 PDQLogic Ltd. QTrace User Manual Rev 1.01 Page 33
5.1 CPU timing
The CPU Time Display radio buttons allow CPU function timing to be displayed in different forms; as a
percentage of the overall number of executed CPU instructions or the number of CPU cycles (or seconds)
spent executing instructions in the function. The CPU clock speed needs to be known in order to display
execution time in seconds. This can either be the detected CPU clock speed or a manually entered value.
Note:
Because Cortex-M does not implement cycle accurate tracing, it is not possible to generate 100%
accurate timing results and so the displayed CPU timing figures should be used as a comparative
measurement.
The following points will affect timing measurement accuracy:
1. Pipeline delays are estimated
2. Argument dependant instruction times use an average of min/max execution times
3. Function timing does not include nested calls
4. Timing calculations assume no memory wait states
Page 34

Trace Configuration QTRACE - USER MANUAL
© 2018 PDQLogic Ltd. QTrace User Manual Rev 1.01 Page 34
6. Trace Configuration
Before tracing can begin, a trace configuration needs to be created. This is done by selecting the Menu
option FileNew Configuration... or by clicking the highlighted toolbar button:
Figure 38 Selecting a new trace configuration
This will prompt for the name and location to save a new .tcf configuration file. The location is typically
the top level project folder. Once the file name and location are specified, the trace configuration dialog
will be displayed.
The following sections describe the configuration process in detail.
6.1 Trace configuration dialog
Figure 39 shows the ‘new trace configuration’ dialog and a summary of its fields:
Figure 39 Trace configuration dialog
1,2 Drop down lists of supported device
manufacturers and parts
3 Summary specification of selected device
4,5 Start address and size of program ROM
6 Trace clock divider is usually fixed at SYS-
CLK/2 but certain devices offer other options
7 Tick if project is a C++ project rather than C
8 Tick to save source file paths relative to the
configuration file
9 Base address of the interrupt vector table
10 Path of ELF / AXF file loaded into the
target by the debugger
11 Paths where source files used to build ELF
file can be located
12 Source files that cannot be located on the
filing system e.g. library source files
13 Memory range(s) of additional program
space e.g. boot ROM
14 Specifies if target trace is configured by
the debugger or by the firmware application
15 Base address of RAM used by debugger
trace configuration script
16 Path of the debugger script file used to
configure target trace
17 Voltage range of the target trace pins
Page 35

Trace Configuration QTRACE - USER MANUAL
© 2018 PDQLogic Ltd. QTrace User Manual Rev 1.01 Page 35
Figure 40 shows the trace configuration dialog populated with settings for one of the projects supplied
with the STM32-Eval board, a demonstrator for the QTrace system (see Appendix B STM32-Eval
Demonstrator).
Figure 40 Trace configuration for the STM32-Eval demonstrator project
Each entry in the trace configuration dialog is described in more detail in the following sections.
6.1.1 Manufacturer
This is a drop-down list of the supported device manufacturers. Currently ST Microelectronics is
supported but this will be updated in subsequent QTrace Analyser releases. There is a ‘Generic’ option
to allow devices that aren’t currently supported by the QTrace Analyser to be trialled.
Each manufacturer entry corresponds to a device definition file which is located at:
C:\Users\Public\PDQLogic\QTraceAnalyser\Devices
6.1.2 Part/Family
This is a drop-down list of the supported devices for the selected manufacturer. Currently, the QTrace
Analyser supports the STM32 F2/F3/F4/L4 devices. Each entry in the drop-down list may be a specific
device or a range of devices. This is dictated by the device feature set and the interrupt vector sources.
The interrupt source information is used by the profiling view, see section 5 on page 31.
6.1.3 ROM start address
This is the start of the program ROM (FLASH) in the target address space. It is a fixed address that is
specified by the manufacturer and is pre-populated. It cannot be edited except when the selected
manufacturer is ‘Generic’.
Page 36

Trace Configuration QTRACE - USER MANUAL
© 2018 PDQLogic Ltd. QTrace User Manual Rev 1.01 Page 36
6.1.4 ROM size
Each manufacturer offers different ROM sizes and because the device definition files do not detail every
single device, ROM size has to be entered manually. The ROM start address and size are used by the
QTrace Analyser to determine if an address decoded from trace data is valid.
6.1.5 Trace clock divider
This is a value used by the target processor to divide its main clock to derive the trace clock. It is usually
fixed at /2 but a number of manufacturers allow the trace clock frequency to be reduced further. This
relieves the burden on the trace decoding hardware but risks causing in internal buffer overflow in the
target trace hardware module. It is recommended to use /2 where possible.
6.1.6 C++ project
If the ELF file was compiled from a C++ project then the resulting functions will be decorated. Select this
option to make function names more readable (i.e. to demangle them).
6.1.7 Save paths relative to configuration file
Select this option to save file paths relative to the configuration file folder. This will avoid the need for
modifying the configuration file if the IDE project location is changed.
6.1.8 Vector table address
This is the base address of the interrupt vector table and will be pre-populated with the default value
for the selected processor part. The ARM Cortex-M parts allow the vector table to be relocated which is
helpful for custom bootloaders. Having the correct vector table address allows the QTrace Analyser to
determine the address of interrupt handlers used by the profiling view, see section 5.
6.1.9 ELF file
The ELF file is key to debugging an application. It contains both the binary image and a range of
debugging information including the source files used, function names, address to source line mapping,
etc. It is recommended to build the ELF file with maximum debug information to give the most accurate
source level tracing information.
If the selected ELF file does not contain debug information then the following message will be displayed:
Figure 41 No debug information in ELF file
The above message details GCC compiler switches that can be used to build the project to include debug
information. Similar settings are available for other compilers.
Figure 42 below shows how to specify the debug switches in an Eclipse based IDE.
Page 37

Trace Configuration QTRACE - USER MANUAL
© 2018 PDQLogic Ltd. QTrace User Manual Rev 1.01 Page 37
Figure 42 GCC compiler switches for maximum debug information using Eclipse based IDE
6.1.10 Source paths
This list box contains paths of the source files used to build the project. It is populated after the ELF file
is selected. Each entry can be selected as a path relative to the configuration file or an absolute path
which is useful for library files. The QTrace Analyser will try to locate all source files but occasionally
these can’t be found either because they’re not on the file system e.g. library source files, or because
there was not enough information in the ELF file. In this case there are a number of controls to the right
of the source path list box which allow additional paths to be specified.
6.1.11 Missing source files
This list box contains any files which can’t automatically be found by the QTrace Analyser or which don’t
exist on the filing system. Right clicking any entry in this list box will display a file browser which allows
the source file path to be specified. Missing files are typically library files which are either 3rd party
library files or system header files located in the compiler include directory.
After pressing the ‘OK’ button in the trace configuration dialog, the QTrace Analyser will process the ELF
file and if there are any missing source files then the trace configuration dialog will be re-displayed with
the missing files listed. A message will then be displayed as shown in Figure 43.
Page 38

Trace Configuration QTRACE - USER MANUAL
© 2018 PDQLogic Ltd. QTrace User Manual Rev 1.01 Page 38
Figure 43 Missing source files
There are 2 options:
1. Click 'Top Level' to begin a search for the missing files or
2. Select 'Close' and manually search for the missing files.
When the top level folder option is specified, the QTrace Analyser will recursively search for the missing
files in all sub-folders under the top level folder. If some or all files cannot be found after the search,
and they are known, or suspected, to be present on the disk then their locations will need to be
specified manually. This is typically a quick process using the Windows file search.
To do this, right click on an entry in the ‘missing files’ list to display the Windows Open File dialog as
shown in Figure 44. Browse to the top level folder where the missing file is suspected to be. Copy and
paste the text from the Open File dialog file name to the search text box to initiate a Windows search
for the file. If the file was found, simply double click on its file path in the Open File dialog and the
QTrace Analyser will then remove the entry from the missing files list. It will also remove any other
missing files that are located in the same folder. Repeat this process for any remaining missing files.
A missing source file can be ignored by ticking its entry in the missing file list (holding the Ctrl key while
ticking to ignore all). Note that this will not affect tracing accuracy but the code coverage for all
functions in the missing file(s) cannot be viewed in the source form, only the disassembly.
List of missing
source files
Page 39

Trace Configuration QTRACE - USER MANUAL
© 2018 PDQLogic Ltd. QTrace User Manual Rev 1.01 Page 39
Figure 44 Windows Open File dialog
6.1.12 Additional code ranges
This option allows additional code ranges to be specified that are not included in the ELF file. Typical
uses for this are boot ROMs hardcoded into the processor by the manufacturer or library files supplied
in a binary format e.g. Intel hex.
Click the button in the trace configuration dialog to display the following:
Figure 45 Additional code range dialog
If an image file is selected then the QTrace Analyser will attempt to disassemble it to create a database
of instructions to allow the QTrace Analyser to decode trace data for the additional code range e.g.
instruction size, branch address, etc.
If the additional code range is a hardcoded boot ROM in the processor, it is recommended that the ROM
image is uploaded to a file using the debugger or some other utility and then specified in the above
dialog. If there is no image specified then the QTrace Analyser will be unable to decode trace data when
the target processor executes instructions in this additional address space. In this case, the QTrace
Analyser will look for an address synchronisation packet in the trace data stream for which it has
disassembly information. Up until this point any instruction trace information will be lost but a loss-ofsync error will not be reported.
Page 40

Trace Configuration QTRACE - USER MANUAL
© 2018 PDQLogic Ltd. QTrace User Manual Rev 1.01 Page 40
6.1.13 Trace configuration source
The target trace registers can be configured by the target firmware or via a debugger script.
When trace is configured via firmware, there will be a delay between the trace stream starting and the
QTrace Analyser synchronising to it. Any instructions between these two points will be lost.
Using a debugger script is the preferred way to configure trace as it allows all instructions executed
after reset to be traced and does not require changes to the application source. When configuration via
a debug script is selected, the initialisation RAM Area and Debugger Script text boxes are enabled.
6.1.14 Initialisation RAM area
This specifies the base address of the RAM which will be used by the debugger script during trace
configuration. In most Cortex-M processor implementations this is 0x20000000.
6.1.15 Debugger script
This is the path of the script file that will be used to configure the target trace interface prior to running
the application. The script is run by the debugger after it has re-programmed the target FLASH but
before it runs the application. The script will configure the appropriate GPIO pins for trace operation
and will then configure the ETM trace registers which are common to all Cortex-M processor
implementations. The script will then run a dummy program in RAM for several 100ms to give the
QTrace Analyser time to detect, and synchronise with, the trace data stream.
A number of debugger scripts are supplied with the QTrace Analyser which support most common IDEs.
See Table 1 on page 6 for further details.
Note:
When using a debugger script, it is important that the firmware does not write to any of the trace pin
GPIO configuration registers or to the trace hardware registers as this will likely cause tracing to fail.
6.1.16 Trace port voltage
The QTrace probe supports two nominal voltage ranges, 1.8V and 3.3V. Refer to Table 2 on page 7 for
minimum and maximum voltage levels.
6.2 Finalising trace configuration
Pressing OK in the trace configuration dialog will initiate a field validation. If one or more fields are not
entered, or have invalid values, then this will be highlighted. Once the fields have been validated,
QTrace Analyser will proceed to create a configuration file.
It is likely that one or more paths that have been parsed from the specified ELF file will not exist on the
filing system or will not contain any source files that were used to create the target image. In this case a
dialog will be displayed showing these paths. In most circumstances the paths can safely be ignored and
simply clicking the ‘Close’ button in Figure 46 is all that’s required. If one or more paths should be
retained e.g. currently unavailable network drive then these entries can be checked before clicking
‘Close’.
Page 41

Trace Configuration QTRACE - USER MANUAL
© 2018 PDQLogic Ltd. QTrace User Manual Rev 1.01 Page 41
Figure 46 Missing or unreferenced source paths
If more than one issue arises during the trace configuration process then the following dialog will be
displayed:
Figure 47 Multiple trace configuration issues
1. One or more paths manually entered in the search
path list (Figure 39, item 11), or extracted from the
ELF file, are not on the filing system or don’t contain
any relevant source files. Click ‘View’ for a list of paths
and to suppress the warning.
2. One or more WFE/WFI sleep instructions have been
detected. Click View for their location(s) and see
section 9.1, item 2 for more details.
3. CPU exceptions can’t be set. Click ‘View’ for an
explanation and see section 4.3.1 for more details.
Page 42

Trace Start Sequence QTRACE - USER MANUAL
© 2018 PDQLogic Ltd. QTrace User Manual Rev 1.01 Page 42
7. Trace Start Sequence
After the target application has been compiled and the IDE has entered debug mode, the target
processor will typically be reset and its FLASH programmed via the JTAG adapter. A target reset will be
inferred by the QTrace Analyser as a loss of trace clock and a message will be displayed:
Figure 48 Target reset inferred
The QTrace Analyser icon in the Windows Taskbar will also indicate the change of target state by
changing colour to yellow:
Before target execution is started, the IDE will run the specified debugger script (section 6.1.15, page 40)
to configure the target trace interface. Once this is done, and the QTrace Analyser has detected a valid
trace data stream, the display will change to that shown in Figure 49. If the QTrace Analyser is unable to
synchronise with the trace data stream then an error message will be displayed.
If this happens the target should be reset from within the IDE to re-run the debugger script. The QTrace
Analyser will then try again to synchronise to the trace data. If the error persists, click the blue ‘Help’
hyperlink in the error message to display the diagnostics dialog (also detailed in section 11).
When the QTrace Analyser has synchronised with the trace data stream the “Target Reset Detected”
message window will close and the CPU speed in the status bar (highlighted in orange in Figure 49) will
show the frequency of the internal oscillator, e.g. 16MHz for STM32 parts. At this point the program
counter should have been set to the reset handler by the debugger script.
Page 43

Trace Start Sequence QTRACE - USER MANUAL
© 2018 PDQLogic Ltd. QTrace User Manual Rev 1.01 Page 43
Figure 49 QTrace Analyser configured and ready to trace
When the target is commanded to run by the IDE, it will start streaming trace data which the QTrace
Analyser will decode and display. The CPU speed and coverage in the status bar will be updated to
reflect their new values.
Figure 50 QTrace Analyser tracing
The QTrace Analyser icon in the Windows Taskbar will also indicate that trace data is being streamed
from the target by changing colour to green:
At this point trace is running normally and all QTrace Analyser features will be active.
Page 44

Self Test Mode QTRACE - USER MANUAL
© 2018 PDQLogic Ltd. QTrace User Manual Rev 1.01 Page 44
8. Self Test Mode
The QTrace Analyser has a self-test mode which allows the QTrace probe to be exercised without a
target processor being connected. It is selected from the Help Self Test menu option.
In the event of a problem with tracing, the self-test feature can help to identify whether the issue lies
between the target and the trace probe or between the trace probe and the QTrace Analyser. Self test
mode can also be used to evaluate the QTrace system although it is recommended that a STM32-Eval5
board is used if a custom target board is not available as this will showcase all QTrace Analyser features.
In self test mode a dedicated trace configuration file is loaded into the QTrace Analyser which
configures the trace probe to generate a sequence of trace data which was recorded from a STM32-Eval
board running at 180MHz. The configuration references the ELF file which was used to program the
STM32-Eval board when the trace sequence was recorded. It also references a single C source file
(tasks.c) which contains the small section of code that is ‘executed’ in self test mode. All other source
files used to build the ELF file are excluded for simplicity.
The trace probe repeatedly generates the trace sequence and streams it via USB to the QTrace Analyser.
This exercises the QTrace probe hardware, USB connection and QTrace Analyser at a rate representative
of a STM32-Eval board running at 180MHz.
The resulting source viewer display is shown in Figure 51 below.
Figure 51 Self-test mode
To exit the self test mode, simply select a trace configuration file from File Open Configuration menu
option.
5
Refer to Appendix B STM32-Eval Demonstrator for further details
Page 45

Recommendations QTRACE - USER MANUAL
© 2018 PDQLogic Ltd. QTrace User Manual Rev 1.01 Page 45
9. Recommendations
There are a number of factors which can affect tracing. The points below are recommendations and tips
which will help to avoid problems when tracing and improve its effectiveness.
9.1 General
1. Disable all IDE trace options including SWO trace.
2. Avoid using functions that execute WFE/WFI sleep instructions as this will cause trace output to be
suspended and will lead to erratic tracing behaviour. It is recommended to comment out WFE/WFI
instructions for builds to be used for tracing. The QTrace Analyser will detect if these instructions
are being used and will highlight their location(s).
If there is no associated source for the WFE/WFI instruction e.g. it is located in a library file, then
the WFE/WFI instruction will need to be patched with a NOP instruction. See Appendix C NoSleep
Utility for details of the NoSleep utility that can patch WFE/WFI instructions.
3. When using a debugger script6, it is important that the firmware does not write to any of the trace
pin GPIO configuration registers or to the trace hardware registers as this will cause tracing to fail.
4. Avoid running other CPU intensive PC applications while tracing.
5. To reset the target processor from within the IDE:
a) Stop the processor running
b) Issue a target reset from within the IDE
c) Manually start the processor running again
These steps will ensure the QTrace Analyser has enough time to detect the reset and to re-sync to
the target trace before execution restarts.
6. Disable instruction simulation when using a Segger J-Link, see section 12.3.
7. Connect a second screen to display the QTrace Analyser so that it can be viewed side by side with
the IDE/debugger.
8. Do not place breakpoints on exception handlers. The buffered trace data is several instructions
behind the current instruction and a breakpoint will prevent the exception being decoded.
9.2 Programming Tips
1. Turn off compiler optimisations for best results. As with conventional debugging, aggressive
compiler optimisation will affect the accuracy and effectiveness of source level debugging.
2. Ensure maximum debug information is selected in the IDE compiler settings to give the most
accurate source level tracing information. For example, when using the GCC compiler use the
following compiler switches: -gdwarf-3 & -g3.
3. Do not have an empty ‘idle’ call-back function when using a RTOS as this is likely to generate a lot
of unnecessary trace data due to the way the call to this function is usually implemented.
4. Place multiple conditionals on separate lines for easy identification of passed and failed conditions,
see Figure 9 on page 15 for an example.
5. If the IDE automatically halts the CPU when it detects an exception, simply start the CPU running
again. This will flush the offending instruction through the CPU trace hardware which the QTrace
Analyser will then detect and present an 8M instruction history prior to the exception event in the
trace capture view. The same procedure is required if a break point is placed on an exception
handler.
6
See section 6.1.13 for further details
Page 46

PC Specification QTRACE - USER MANUAL
© 2018 PDQLogic Ltd. QTrace User Manual Rev 1.01 Page 46
10. PC Specification
The specification of the PC on which the QTrace Analyser is running will have a significant impact on the
target speed that can be reliably traced. The QTrace Analyser application continuously decompresses
and decodes data streamed by the QTrace probe into machine instructions executed by the target. It
must do this quickly enough to avoid missing incoming data and with minimal latency to give a
responsive UI. Most modern PC will be capable of running the QTrace Analyser with no problem.
A comparison of QTrace Analyser performance running on different PCs is shown in Table 10 below. The
same target application was run on a STM32F446 processor running at 168MHz. The target execution
rate is approximately 97 MIPS and the incoming USB data rate is 17MB/s. The combination of the target
instruction rate and the incoming data rate dictates the level of processing required by the QTrace
Analyser.
The key indicator of how the QTrace Analyser is performing is the average decode rate. It shows how
much faster the trace data is being processed compared with the incoming data rate. The decode rate
will periodically drop as other applications require CPU processing and when Windows runs its core
services. A sustained drop in available CPU processing power that causes the decode rate to drop below
the incoming data rate will result in a buffer overflow and trace data loss. Therefore the faster the
decode rate, the more margin there to avoid data overflow.
System
CPU
Physical
Cores
RAM
QTrace Analyser
CPU Usage
Average
Decode Rate
Dell XPS 15 9560
i7-7700HQ
2.80GHz
4
16GB
3.7%
66 MB/s
Lenovo Thinkpad 20A7CTO
i7-4600U
2.10GHz
2
8GB
8.7%
53 MB/s
Asus X405UA
i3-7100U
2.40GHz
2
4GB
9.2%
46 MB/s
Samsung 90X3A
i5-2537M
1.40GHz
2
8GB
14.1%
31 MB/s
Asus X540SA
Pentium
N3700
1.60GHz
2
4GB
20.1%
22 MB/s
Table 10 Performance comparison of different PC specifications
Page 47

Troubleshooting QTRACE - USER MANUAL
© 2018 PDQLogic Ltd. QTrace User Manual Rev 1.01 Page 47
11. Troubleshooting
There are a number of potential reasons why tracing does not work or is erratic. The table below shows
a number of problem scenarios and suggestions to try to resolve them.
No.
Symptom
Category
Possible remedy(s)
1
Can't re-enumerate
into Super Speed mode
USB3
communications
issue
• Check the trace probe is connected to a USB3 port
• Verify that a different USB 3.0 device runs at Super Speed in
the same port
• Try unplugging the trace probe from the USB port and reconnecting
• Try a different USB3 hub
• If the PC was in sleep mode then try rebooting
2
Trace probe not found
USB3
communications
issue
Try a different USB3 port and USB3 hub, check 'QTrace' found
in device manager
3
No visible trace activity
but H/W buffer
overflows*
USB3
communications
issue
Power cycle USB3 hub or reboot PC if trace probe is connected
directly
4
'Target reset detected'
pop-up window
persists
Target trace
configuration
Check that:
• IDE is configured to run user script** after target FLASHing /
reset
• Target has stopped after being reprogrammed
• Target watchdog isn't repeatedly firing (excessive reset
count indicates this)
5
Unable to synchronise
to trace
Trace
configuration
Check that:
• The IDE is configured to run user script** after target
FLASHing / reset
• IDE options to enable ETM / ITM are deselected
• The correct TCF & ELF files are loaded
• The firmware is not modifying the trace I/O pin configuration
(including I/O directions)
• The firmware is not configuring Single Wire Output (SWO)
debug mode
6
Trace synchronisation
lost
Excessive
synchronisation
errors
Verify that:
• Target firmware does not overwrite trace I/O settings e.g.
for STM32 part, trace = PE2-PE6
• The firmware is not configuring Single Wire Output (SWO)
debug mode
• Any code ranges outside of the main code are defined in the
trace configuration window
• The appropriate Windows USB drivers are up to date
• The USB lead directly to the PC rather than via a hub
• Note: Persistent sync loss can indicate sub-optimal trace
signal PCB layout (try a slower clock speed)
7
Execution counts in
random places
Wrong ELF file /
out of date or
compiler
optimisations
Verify ELF is correct and/or turn off compiler optimisation
Page 48

Troubleshooting QTRACE - USER MANUAL
© 2018 PDQLogic Ltd. QTrace User Manual Rev 1.01 Page 48
8
Execution counts
missing in start-up
code
QTrace Analyser
did not
synchronise
with processor
start-up
Ensure execution started with the CPU halted at the reset
handler (use a breakpoint if required)
9
Trace decode rate*
drops quickly
PC low power
mode
Ensure Windows power scheme is set for high performance
Trace
configuration
Ensure target firmware is not:
• Overwriting trace I/O settings e.g. for STM32 part, trace =
PE2-PE6
• Configuring Single Wire Output (SWO) debug mode
10
Losing trace
synchronisation after
trace was working OK
ELF file out-ofsync
Perform a project clean and rebuild
11
Repeatable loss of
sync. in specific code
areas
ELF file issue or
QTrace Analyser
bug
Rebuild ELF file and retry. Send ELF file to PDQLogic for
analysis if issue persists
12
Trace buffer overflow
Insufficient PC
CPU time / USB
hub issue
Verify that:
• No other CPU intensive applications are running
• The QTrace Analyser option 'Set application as high priority'
is selected
• The Windows power scheme is set for high performance
• The PC spec. is sufficient e.g. 8GB+ RAM, i5 / i7 CPU
• Execution started with the CPU halted at the reset handler
(use a breakpoint if required)
Also try:
• Power cycling the USB hub if resumed from sleep or if trace
has been running OK
• Reduce target clock speed
13
Source lines with no
code margin highlights
Compiler
configuration
issue
• Try turning off optimisation and removing static function
declaration
• Deselect 'put code in separate sections' complier switch &
recompile
• Use DWARF-2 or 3, e.g. for GCC use the '-g3' & '-gdwarf-3'
complier switches
14
Tracing unexpectedly
stops when target is
still running
Potential USB
issue
• Unplug the trace probe USB lead then reconnect it
• Unplug the USB lead from the hub which the trace probe is
connected to, power cycle the hub & reconnect its USB lead
• Reboot PC (if the problem persists select menu option
HelpReport a Problem)
* See 'Trace Stats' tab
** See C:\Users\Public\PDQLogic\QTraceAnalyser\Debugger Scripts
Table 11 Troubleshooting
Page 49

Tracing with common IDEs QTRACE - USER MANUAL
© 2018 PDQLogic Ltd. QTrace User Manual Rev 1.01 Page 49
12. Tracing with common IDEs
Although every IDE performs the same basic functions, each one has a different way of interacting with
the target. This section details how to configure the debugger scripts supplied with the QTrace Analyser
for a number of common IDEs.
12.1 Location of debugger scripts
The QTrace Analyser debugger scripts that are used to configure trace are installed in the following
folder:
C:\Users\Public\PDQLogic\QTraceAnalyser\Debugger Scripts\<IDE>
Where <IDE> is the name of a particular IDE
Note:
For all IDEs, any trace options should be disabled (this is typically the default for a new configuration).
12.2 Example Projects
For each IDE detailed in the following sections there is a corresponding example project that is installed
with the QTrace Analyser. Each project is built around the same core functionality which implements a
USB FLASH disk application for the STM32-Eval demonstrator board (see Appendix B STM32-Eval
Demonstratorfor details). This board is part of the QTrace-STM32Eval kit or can be purchased separately,
see www.pdqlogic.com.
The projects can be found in the following location:
Figure 52 Location of example projects
Where appropriate, there is a Readme.txt file in the project folder. All projects are configured for a STLink JTAG adapter except Embedded Studio which uses a J-Link. The application size of each project is
under 32K and so can be used with code size limited versions of the IDEs.
Page 50

Tracing with common IDEs QTRACE - USER MANUAL
© 2018 PDQLogic Ltd. QTrace User Manual Rev 1.01 Page 50
12.3 Segger J-Link instruction simulation
A recommendation for any IDE when tracing with a Segger J-Link adapter is to disable instruction
simulation to avoid any issues with trace while single stepping code. This is done by right clicking on the
J-Link icon when the debugger has been started and then clicking the ‘Open’ option in the Windows
Tray area.
In the settings window that is then displayed, un-tick the ‘Allow instruction set simulation’
Figure 53 J-Link disable instruction simulation
Page 51

Tracing with common IDEs QTRACE - USER MANUAL
© 2018 PDQLogic Ltd. QTrace User Manual Rev 1.01 Page 51
12.4 Atollic TrueSTUDIO
Atollic TrueSTUDIO is an Eclipse based IDE which is free for the STM32 series of devices and can be
downloaded from:
https://atollic.com/truestudio/.
Begin by creating a ‘debug configuration’ for either the ST-Link or J-Link, as detailed in the TrueSTUDIO
user manual section “STARTING THE DEBUGGER”. A ST-Link configuration is shown below:
Figure 54 Atollic TrueSTUDIO debug configuration
In the text box on the ‘Target Software Startup Scripts’ tab, paste the appropriate debug script file
contents, as shown in Figure 55 below (see section 12.1 on page 49 for script paths).
Page 52

Tracing with common IDEs QTRACE - USER MANUAL
© 2018 PDQLogic Ltd. QTrace User Manual Rev 1.01 Page 52
Figure 55 Atollic TrueSTUDIO debugger script
For the J-Link adapter, this is all that is required. When the debugger is started, the script will flash the
processor, initialise the trace interface and halt at the reset vector ready to start running. For the STLink adapter the process is slightly different.
Unlike the J-Link GDB server, the ST-Link GDB server supplied with TrueSTUDIO will not compare the
image programmed into the target FLASH with the image embedded in the ELF file to determine if the
FLASH needs to be re-programmed. This means that the FLASH will be programmed unconditionally.
This is less of an issue when starting a debug session but it can add 10’s of seconds to a processor
restart operation which is often needed when debugging and is sometimes needed if the QTrace
Analyser is unable to synchronise with the target trace after the debug script has been run.
Although the TrueSTUDIO ‘Restart’ button can be used to reset the processor, it does not (as of
V9.0.0) issue a hard reset and then re-run the debugger script. As a result, the QTrace Analyser will not
detect a target reset and will not automatically clear its internal state, including code coverage.
A workaround is to press the ‘Terminate and Re-launch’ button to restart a new debug session and
re-run the debugger script (you may need to pause execution first). This will reset the processor and reinitialise the trace hardware but it will not reprogram the target FLASH as this step is intentionally
omitted from the script.
To program the FLASH at the start of a debug session, the STM32 ST-Link CLI utility is used. This is
available on the ST website at:
http://www.st.com/en/development-tools/stsw-link004.html
Page 53

Tracing with common IDEs QTRACE - USER MANUAL
© 2018 PDQLogic Ltd. QTrace User Manual Rev 1.01 Page 53
A ‘run configuration’ should be created to launch the ST-Link CLI programming utility to program the
target FLASH. An example is shown below:
Figure 56 Atollic TrueSTUDIO run configuration example
The run configuration is then combined into a ‘Launch Group’ with the debug configuration described
above, see Figure 57.
To debug the target, the run configuration is launched by clicking the TrueSTUDIO ‘Run’ button:
This will launch ST-Link CLI programming utility and when it has finished the debug configuration will be
activated and debugging can begin.
For full details of this mode see the TrueSTUDIO user manual section “USING ST-LINK UTILITY INSIDE
ATOLLIC TRUESTUDIO”.
Page 54

Tracing with common IDEs QTRACE - USER MANUAL
© 2018 PDQLogic Ltd. QTrace User Manual Rev 1.01 Page 54
Figure 57 Atollic TrueSTUDIO launch group example
The following figures show how to disable the trace options for both ST-Link and J-Link.
Figure 58 Atollic TrueSTUDIO ST-Link trace disabled
Page 55

Tracing with common IDEs QTRACE - USER MANUAL
© 2018 PDQLogic Ltd. QTrace User Manual Rev 1.01 Page 55
Figure 59 Atollic TrueSTUDIO J-Link trace disabled
Page 56

Tracing with common IDEs QTRACE - USER MANUAL
© 2018 PDQLogic Ltd. QTrace User Manual Rev 1.01 Page 56
12.5 IAR Embedded Workbench
The only step required for IAR Embedded Workbench is to specify the debugger script path for the
selected device type (see section 12.1 on page 49) and to un-tick the ‘Run to’ check box. The dialog for
these settings is displayed by selecting the Project Options menu option.
Figure 60 IAR Embedded Workbench specify debugger script path
Page 57

Tracing with common IDEs QTRACE - USER MANUAL
© 2018 PDQLogic Ltd. QTrace User Manual Rev 1.01 Page 57
12.6 Keil MDK
Two steps are required for the Keil MDK. The first is to specify the debugger script path (see section 12.1
on page 49) for the selected device type and to un-tick the ‘Run to main()’ check box, shown in Figure 61.
The dialog for these settings is displayed by selecting the Project Options menu option.
The second step is to ensure SWO tracing is disabled in the Target Driver Setup dialog, accessed by
clicking ‘Settings’.
Figure 61 Keil MDK specify debugger script path
Figure 62 Keil MDK disable SWO trace
Page 58

Tracing with common IDEs QTRACE - USER MANUAL
© 2018 PDQLogic Ltd. QTrace User Manual Rev 1.01 Page 58
12.7 Segger Embedded Studio / Rowley Crossworks for ARM
Two groups of settings need to be configured for Embedded Studio. The first group to configure are the
start-up settings where the reset handler is used as the 'Run To' function, see Figure 63.
Figure 63 Segger Embedded Studio start-up settings
The second group of settings to configure are the ‘Target Script File’ path and the ‘Debug Begin Script’ /
‘Reset Script’ functions as shown in Figure 64. See section 12.1 on page 49 for script paths.
Figure 64 Segger Embedded Studio debugger script settings
Note: After entering debug mode and re-programming the target, it may be necessary to press the
'Restart' toolbar button in Embedded Studio to ensure trace is initialised.
Page 59

Tracing with common IDEs QTRACE - USER MANUAL
© 2018 PDQLogic Ltd. QTrace User Manual Rev 1.01 Page 59
12.8 ST System Workbench
ST System Workbench is an Eclipse based IDE which is free for the STM32 series of devices and can be
downloaded from:
http://www.openstm32.org/
Currently, only the ST-Link is supported for ST System Workbench. There are two steps required.
Firstly create a debug configuration as detailed here:
http://www.openstm32.org/Creating%2Bdebug%2Bconfiguration
Next, set the debugger script path as shown in Figure 65 and then configure a break point to be set at
the reset handler as shown in Figure 66. See section 12.1 on page 49 for script paths.
Figure 65 ST System Workbench debugger script path
Page 60

Tracing with common IDEs QTRACE - USER MANUAL
© 2018 PDQLogic Ltd. QTrace User Manual Rev 1.01 Page 60
Figure 66 ST System Workbench break at reset handler
Page 61

Tracing with common IDEs QTRACE - USER MANUAL
© 2018 PDQLogic Ltd. QTrace User Manual Rev 1.01 Page 61
12.9 VisualGDB
VisualGDB is a low cost plug-in for MS Visual Studio which adds support for building projects using GCC
and debugging via GDB. It also runs with the free Community edition of Visual Studio to form a powerful
low cost embedded development platform.
The plug-in has support for the very low cost ST-Link/V2 JTAG adapter and the Segger J-Link. In both
cases, the adapter needs to be selected from the ‘JTAG/SWD Programmer’ drop-down list which is
accessed via menu option Project VisualGDB Project Properties.
The default settings for the ST-Link need to be modified. Under ‘Advanced Settings’, the ‘Command Line’
and ‘Startup GDB commands’ need to be edited as shown in Figure 67.
Figure 67 VisualGDB ST-Link configuration
For convenience the ‘Advanced Settings’ are reproduced here:
Command line
Startup GDB commands
-f interface/stlink-v2.cfg -f target/stm32f4x.cfg -f
"C:/Users/Public/PDQLogic/QTraceAnalyser/Debugger
Scripts/VisualGDB/VisualGDB_STM32_STLink.cfg" -c
init -c "reset init"
set remotetimeout 60
target remote :$$SYS:GDB_PORT$$
mon halt
mon reset init
load
tbreak Reset_Handler
mon EnableTrace
J-Link
For the J-Link settings, the default VisualGDB settings are suitable as shown in Figure 68.
The contents of the relevant debugger script file e.g.
C:\Users\Public\PDQLogic\QTraceAnalyser\Debugger Scripts\VisualGDB\VisualGDB_STM32_JLink.cfg
should be pasted into the text box entitled "The following additional GDB commands will be executed
during start-up AFTER selecting a target which is on the "Additional GDB Commands" tab as shown in
Figure 69 below.
Page 62

Tracing with common IDEs QTRACE - USER MANUAL
© 2018 PDQLogic Ltd. QTrace User Manual Rev 1.01 Page 62
Figure 68 VisualGDB J-Link configuration
Figure 69 VisualGDB J-Link debugger script
Page 63

Appendix A Manual driver installation QTRACE - USER MANUAL
© 2018 PDQLogic Ltd. QTrace User Manual Rev 1.01 Page 63
Appendix A Manual driver installation
A USB3 driver is installed with the QTrace Analyser installation and the installer will request
Administrator privileges to do this. If the request fails then this will prevent the driver from being
installed and a manual installation process is required.
Procedure
1) Disconnect QTrace from the USB port
2) Browse to DriverSetup.exe in the QTrace Analyser installation folder and run it as an
Administrator as shown below:
Figure 70 QTrace probe driver setup path
3) This will initiate a driver install and if successful a message will be displayed. If an error message
is displayed instead then the driver will need to be installed via the Windows Device Manager.
Page 64

Appendix A Manual driver installation QTRACE - USER MANUAL
© 2018 PDQLogic Ltd. QTrace User Manual Rev 1.01 Page 64
Installation via Device Manager
1) Connect the QTrace probe to a USB 3.0 port
2) If a Windows update message is displayed then cancel it
3) When no driver is installed, QTrace will be identified as ‘WestBridge’ in the Device Manager:
Figure 71 QTrace probe shown as 'WestBridge'
Right click on WestBridge and select the option ‘Update Driver Software…’ from the pop-up menu.
Select ‘Browse my Computer for driver Software’ in the displayed window then browse to:
C:\Program Files\PDQLogic\QTraceAnalyser\Drivers\WinXX\x64
where WinXX is your Windows version.
Click ‘Next’ then Windows will install the driver and will display the following if successful:
Figure 72 QTrace probe driver installed
The QTraceAnalyser can now be run and should detect and initialise the QTrace probe.
Page 65

Appendix B STM32-Eval Demonstrator QTRACE - USER MANUAL
© 2018 PDQLogic Ltd. QTrace User Manual Rev 1.01 Page 65
Appendix B STM32-Eval Demonstrator
The STM32-Eval demonstrator board is an optional add-on for the QTrace system and is designed to
showcase the QTrace capabilities without requiring an expensive development board or waiting for an
in-house PCB to be ready.
The board contains an ARM Cortex-M4 based microcontroller, a STM32F446 from ST Microelectronics,
which has an ETM trace interface connecting to a 20 way trace connector. The board also has a microSD card, a USB 2.0 interface, LEDs and button. Together these are used to demonstrate different
features of the QTrace system.
The STM32F446 comes pre-loaded with a USB FLASH disk firmware application to provide access to the
onboard micro-SD card via USB. The application source, project, trace configuration files, the QTrace
Analyser installer and a quick start guide are also on the SD card. This allows the QTrace system to be
evaluated with no additional hardware or software.
Figure 73 STM32-Eval demonstrator PCB
Page 66

Appendix C NoSleep Utility QTRACE - USER MANUAL
© 2018 PDQLogic Ltd. QTrace User Manual Rev 1.01 Page 66
Appendix C NoSleep Utility
The ARM Cortex-M instruction set contains WFE/WFI sleep instructions which are used to conserve
energy by placing the CPU in a low power state until an event or interrupt occurs. The downside to this
while tracing a program is that it also puts the ETM trace module into a halt state which can cause
synchronisation problems with the QTrace probe.
If the source code is available for the WFE/WFI sleep instruction implementations then the appropriate
lines should be commented out. If the source is unavailable e.g. part of a library file, then a command
line utility called NoSleep.exe supplied with the QTrace Analyser can be used to replace WFE/WFI
instructions in an ELF file with NOP instructions.
To use the utility, add the following command line to the IDE post-build script:
C:\Program Files\PDQLogic\Trace Analyser\NoSleep <ELF file> <addr1> <addr2> …
Where:
<ELF file> is the full path of your ELF file
<AddrX> are addresses of WFE/WFI instructions which will be replaced by NOP instructions
When WFE/WFI instructions are detected by the QTrace Analyser, their details, including their
addresses, are displayed in the Bookmark view as shown below (see section 3.2.9 for details of
Bookmarks).
Figure 74 Example of WFE/WFI sleep instructions
Click the highlighted button to copy the WFE/WFI instruction addresses to the Clipboard. These
addresses can then be pasted into the post-build script command line shown above.
Note
1) To avoid the WFE/WFI instruction addresses changing between builds, it is advisable to arrange the
linker script so that the library file(s) containing WFE/WFI instructions are placed before user code or
any other code that is likely to change during a debugging session.
2) The ELF file for final release build should not have the WFE/WFI instructions replaced.
 Loading...