

Page 1
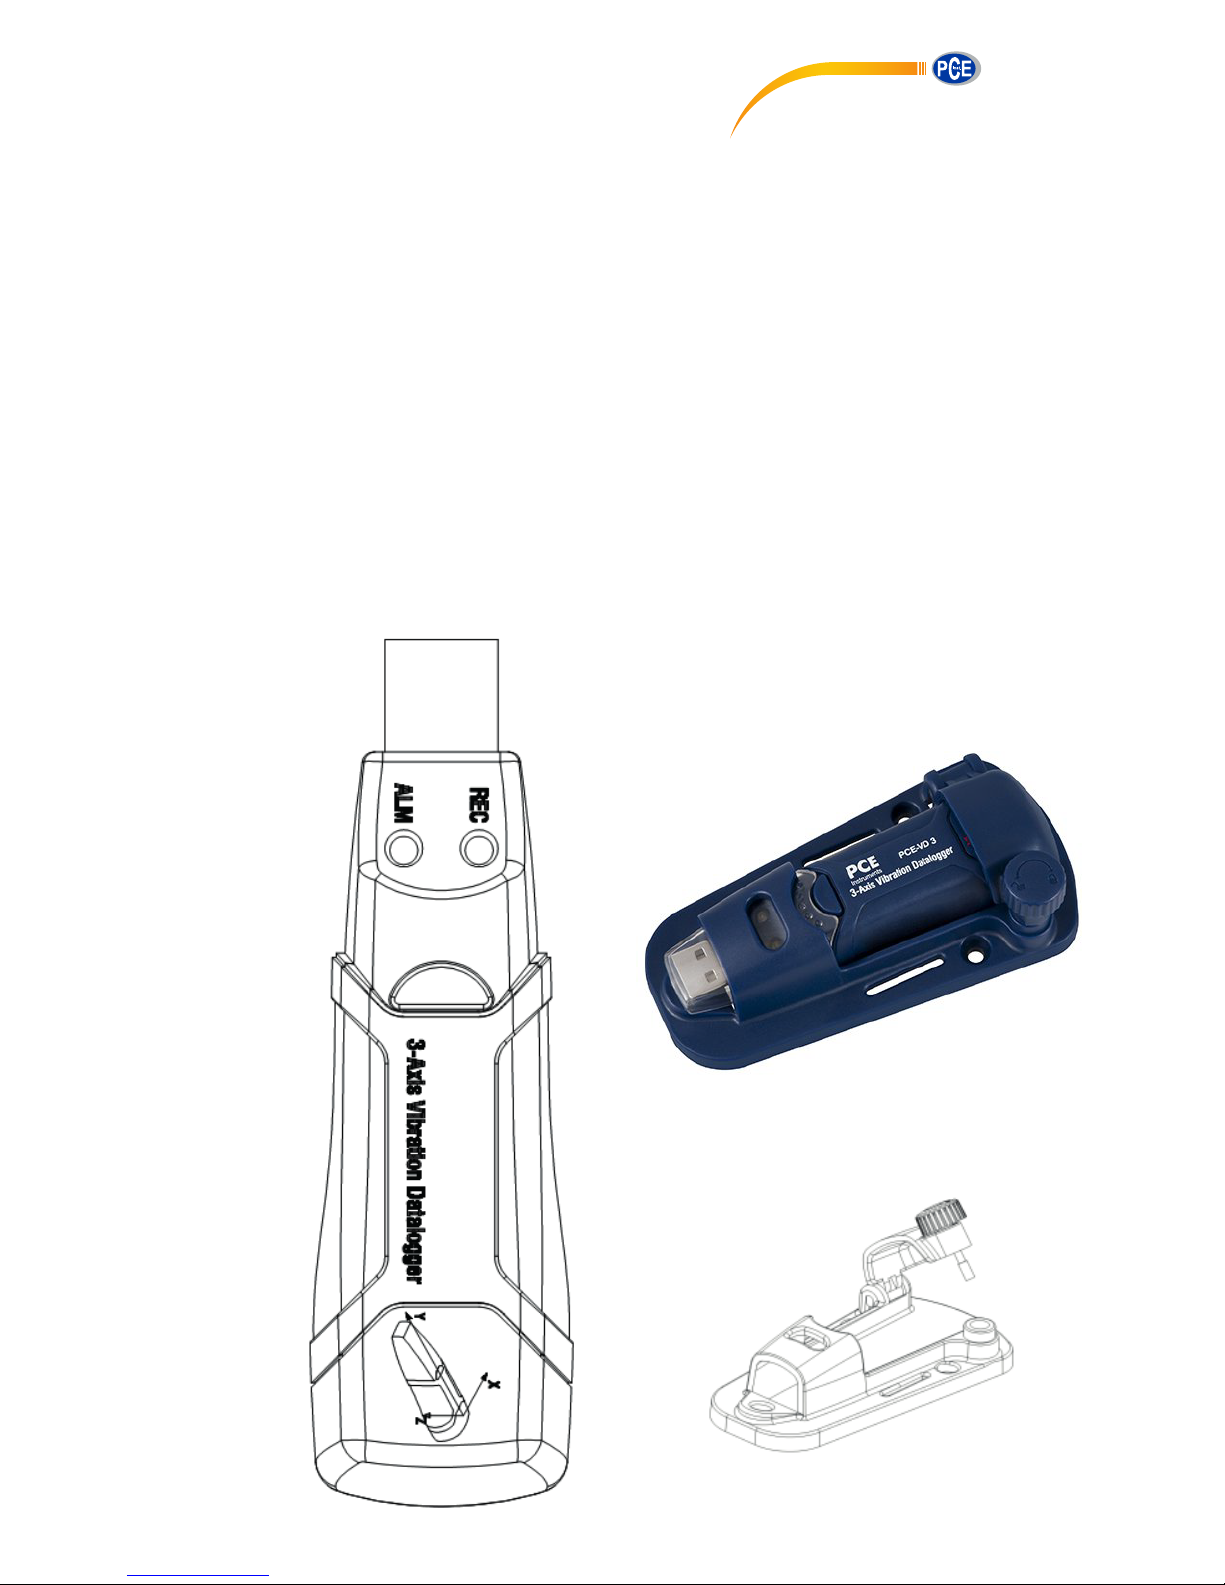
VIBRATION METER
Instruction Manual
PCE Americas Inc.
711 Commerce Way
Suite 8
Jupiter
FL-33458
USA
From outside US: +1
Tel: (561) 320-9162
Fax: (561) 320-9176
[email protected]
www.pce-instruments.com/english
www.pce-instruments.com
PCE Instruments UK Ltd.
Units 12/13
Southpoint Business Park
Ensign way
Hampshire / Southampton
United Kingdom, SO31 4RF
From outside UK: +44
Tel: (0) 2380 98703 0
Fax: (0) 2380 98703 9
PCE-VD 3
Page 2

1
1. SAFETY INFORMATION
Read the following safety information carefully before
attempting to operate or service the meter.
Use the meter only as specified in this manual:
Environment conditions
① Altitude lower than 2000 meters
② Relatively humidity ≤90%RH
③ Operation Ambient 0 ~ 40°C
Maintenance & Clearing
① Repair or servicing not covered in this manual
should be performed by qualified personnel.
② Periodically wipe the case with a dry cloth. Do not
use solvents or eradicator on this instrument.
Safety symbols
Comply with EMC
2. FUNCTIONS DESCRIPTION
This datalogger is engineered to record acceleration data of
shock/vibration. This device will record and time 3-axis
vibrations and peaks to provide a history of shock/vibration
conditions. It is applied to the shock/vibration measurement
such as transportation and Shipping Applications、building
vibration、endurance testing , etc.
Records 3-axis shock/vibration
Page 3

2
Build-in accelerometers
Measures dynamic and static acceleration
Real-time operation
Normal & Motion detecion mode
Freefall detection mode
Real-time FFT for frequency analyse
Manual & Automatic start
Note:
1. In motion detection mode, the datalogger only takes
data after the trigger level(user preset) is exceeded.
2. If freefall mode is selected, the datalogger will
record the time when freefall happens besides normal
acceleration data.
3. Specification
Acceleration Sensor: MEMS Semiconductor
Acceleration Range: ±18g
Acceleration Resolution: 0.00625g
Calibrated Accuracy: ± 0.5g
Frequency Range: 0Hz ~ 60Hz
Data Memory: 4Mbit FLASH( 85764 peak acceleration
samples and 210 freefall samples)
Data Format: time stamped peak acceleration and
freefall,average and peak vector sum
Sampling Rate: 1 second to 24 hours
Power: 3.6V battery, specs:14250 or 1/2AAA
Power Consumption: 1mA (average) recording, <15µA idle
Page 4

3
Battery Life: About 1000 hours
Computer Interface: USB
Operation temperature and humidity: 0°C ~40°C,
10%RH~90%RH
Storage temperature and humidity: -10°C ~+60°C,
10%RH~75%RH
Dimension:
The pedestal: 106mm x 56mm x 33.5mm
The datalogger: 95mm x 28mm x 21mm
System Requirement: Windows 2000 or Windows XP or
Vista, Windows 7 / 8 / 10
Minimum hardware requirement: 8M EMS memory,2M
hard disk,a free USB jack
Accessories: instruction manual, battery, windscreen,
transparent cap, CD, USB cable, pedestal
Page 5
4
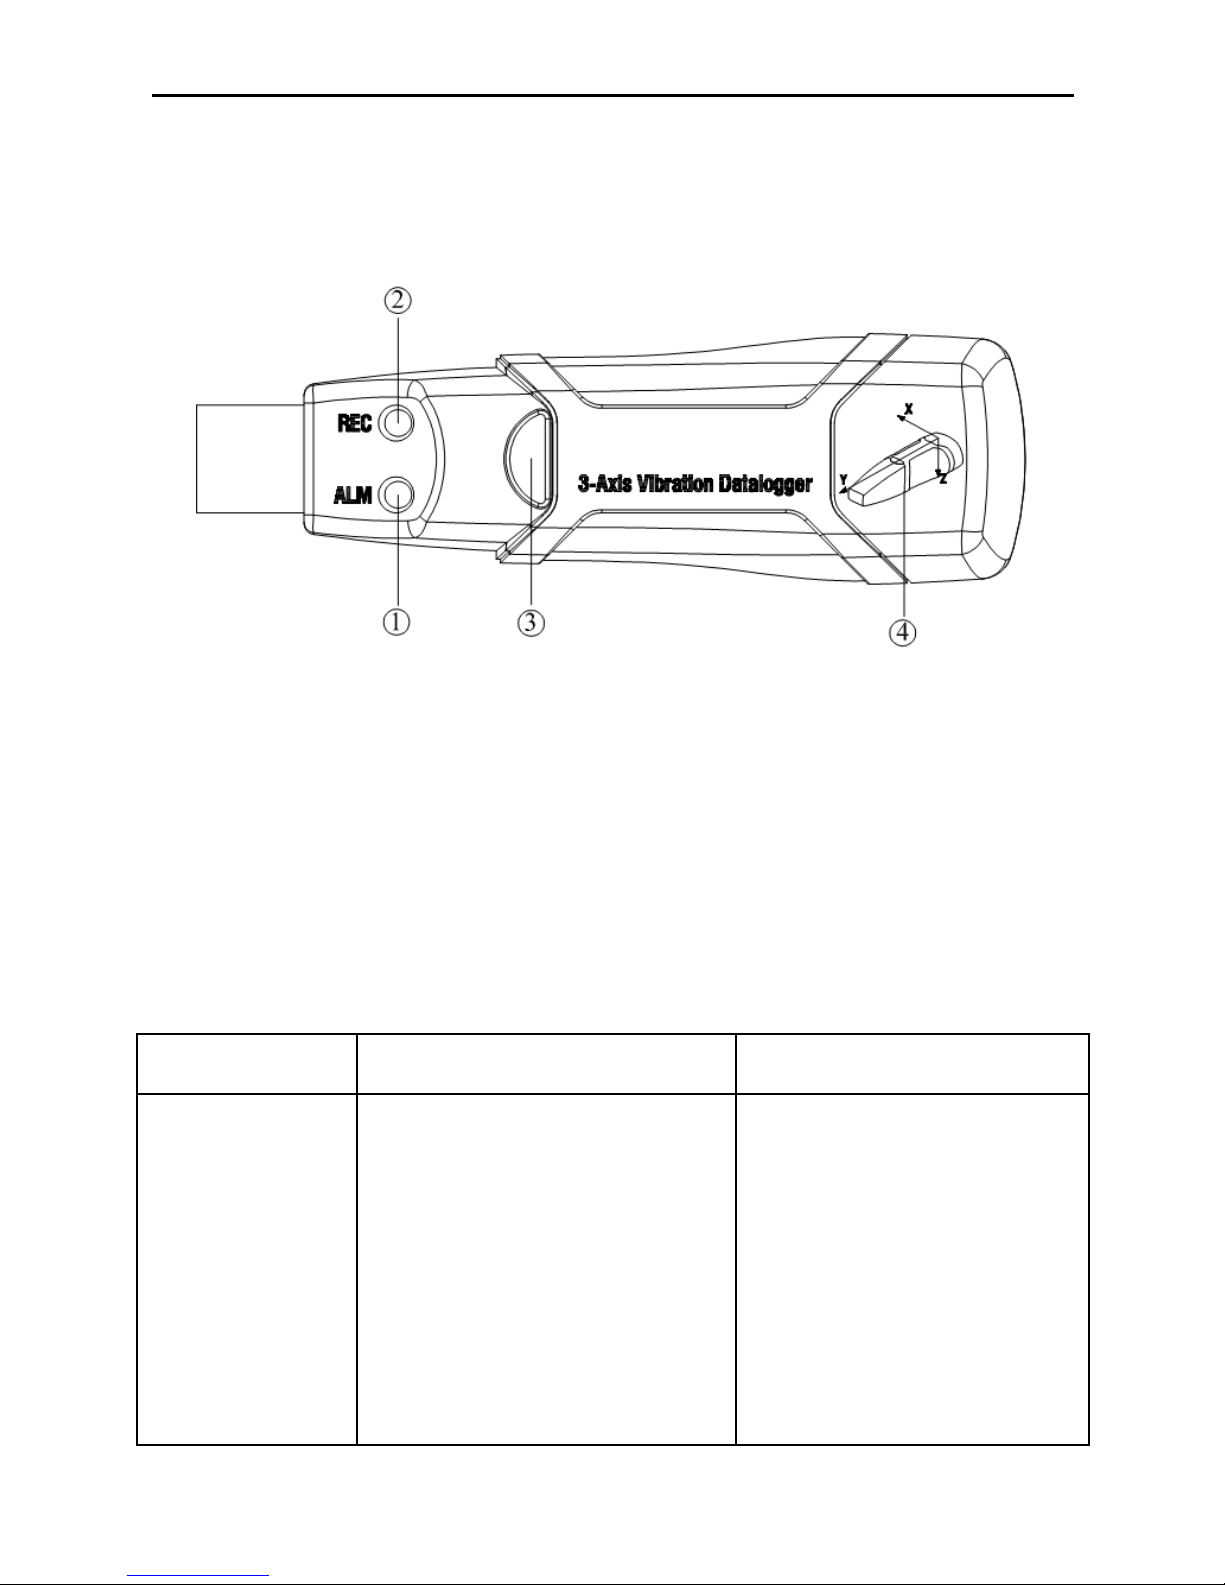
4. NAME OF PARTS AND POSITIONS
① Red Green LED
② Green Red LED
③ Button: turn on/off the Datalogger
④ Direction indication of 3-axis
LED FLASH INDICATION
LEDs
Meaning
Action
ALM REG
O O
No LEDs flash
-No logging started
-No battery fitted
-Battery completely
discharged
Fit Battery
Data won’t lose.
Replace battery and
download data
Page 6

5
ALM REG
O ⊙
Green single flash every
10 sec. *
--Logging
Press the black button
in housing of
datalogger untill
Green LED flash four
times sequencely, and
then logging will start
ALM REG
⊙ O
Red single flash every
30 sec.*
--Low battery
If logging , it will stop
automatically.Data
won’t los. Replace
battery and
download data
ALM REG
⊙ ⊙
Red and Green single
flash every 60 sec.
--Logger memory full
Download data
5. OPERATING INSTRUCTIONS
1. Setup the DataLogger by software before use it.
2. Under the Manual mode, press and hold the button for
2s, DataLogger start to measure, and LED indicates
the function at the same time.( see LED FLASH
INDICATION for details.)
3. Under the Automatic mode, the DataLogger start to
measure after setup in software,LED indicate the
function at the same time.( see LED FLASH
Page 7

6
INDICATION for details.)
4. Under the Real-time FFT mode, the data update
automaticly ,the latest FFT data will be stored.
5. During measurement, the green LED indicates the
working state by flashing with the frequency setup in
the software.
6. When datalogger memory full, Red LED and Green
will flash every 60 sec .
7. As the battery power is not sufficient, red LED will
flash every 30 sec for indication.
8. Press and hold the button for 2s untill Red LED
sequencly flash four times, and then logging will
stop,or connect the datalogger to the host and
download the data,the datalogger will stop
automaticlly.
9. DataLogger data can be read time after time, the
readings you are checking are the real time measured
ones.(1 to 85764 readings);if set the datalogger the
last data will be losed.
10. Without battery, the latest 1 hours (the most) data will
be lost. Other data can be read in software after
battery is installed.
11. When replacing the battery, turn off the meter and
open the battery cover. Then, replace the empty
battery with a new 1/2AAA 3.6V battery and go for the
cover.
Page 8
7
6. Installation instructions
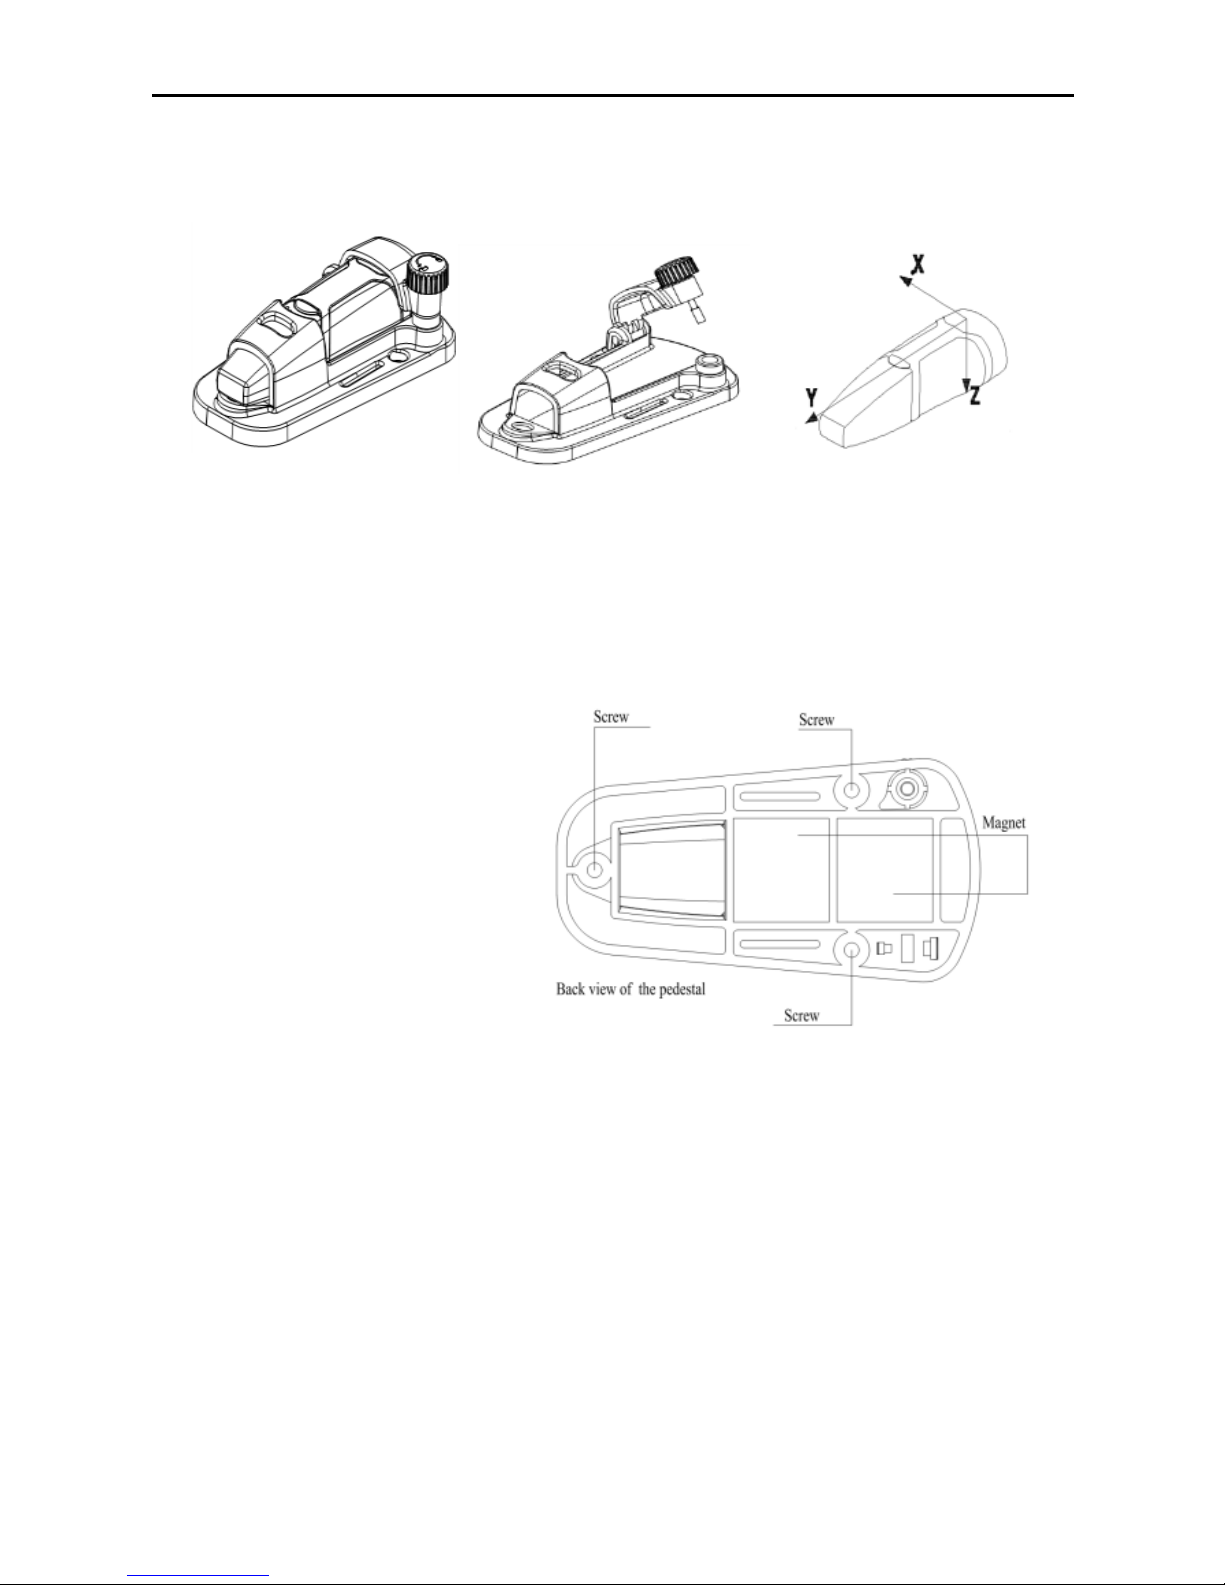
You have to fix the datalogger to the object rigidly,there are three
ways as follow:
1. Screw Install
Fix the pedestal
with three Screws , if
screws is permitted in
your application, this
way will be preferable.
2. Glue Install
Fix the pedestal
with glue,wait for the pedestal is tightly sticked to the object.
3. Magnet Install
Connect the pedestal and the object with magnetism,
this way need the object can be absorbed with a magnet.
Page 9

8
7. NOTICE
1. Do not store or operate the instrument at high
temperature and high humidity environment.
2. When not in use for long time, please take out the
battery to avoid battery liquid leakage and cautery on
the instrument
3. Without battery, the latest 1 hours (the most) data will
be lost.
4. The logger will log peak value of vibration/shock
during sampling interval.
5. You have to setup the DataLogger by software before
use it.
6. For the affection of gravity, You have to start the
logger after fix the logger tightly to the object.
otherwise the three axis X,Y,Z will not be calibrate
correctly.
8. SOFTWARE INSTALLATION AND OPERATION
1. Start windows
2. Insert the CD into the CD-ROM
3. Run SETUPGUIDE.EXE installation program in file
DISK1, install it to the directory of C:\Program
Files\Vibration Datalogger.
4. After finishing the Vibration Datalogger software
installation, this window will pop-up
Page 10
9
Click “Install” to finish the driver installation. After a
successful installation of software and drivers, you can
run the Vibration Datalogger software and
communicate with the meter.
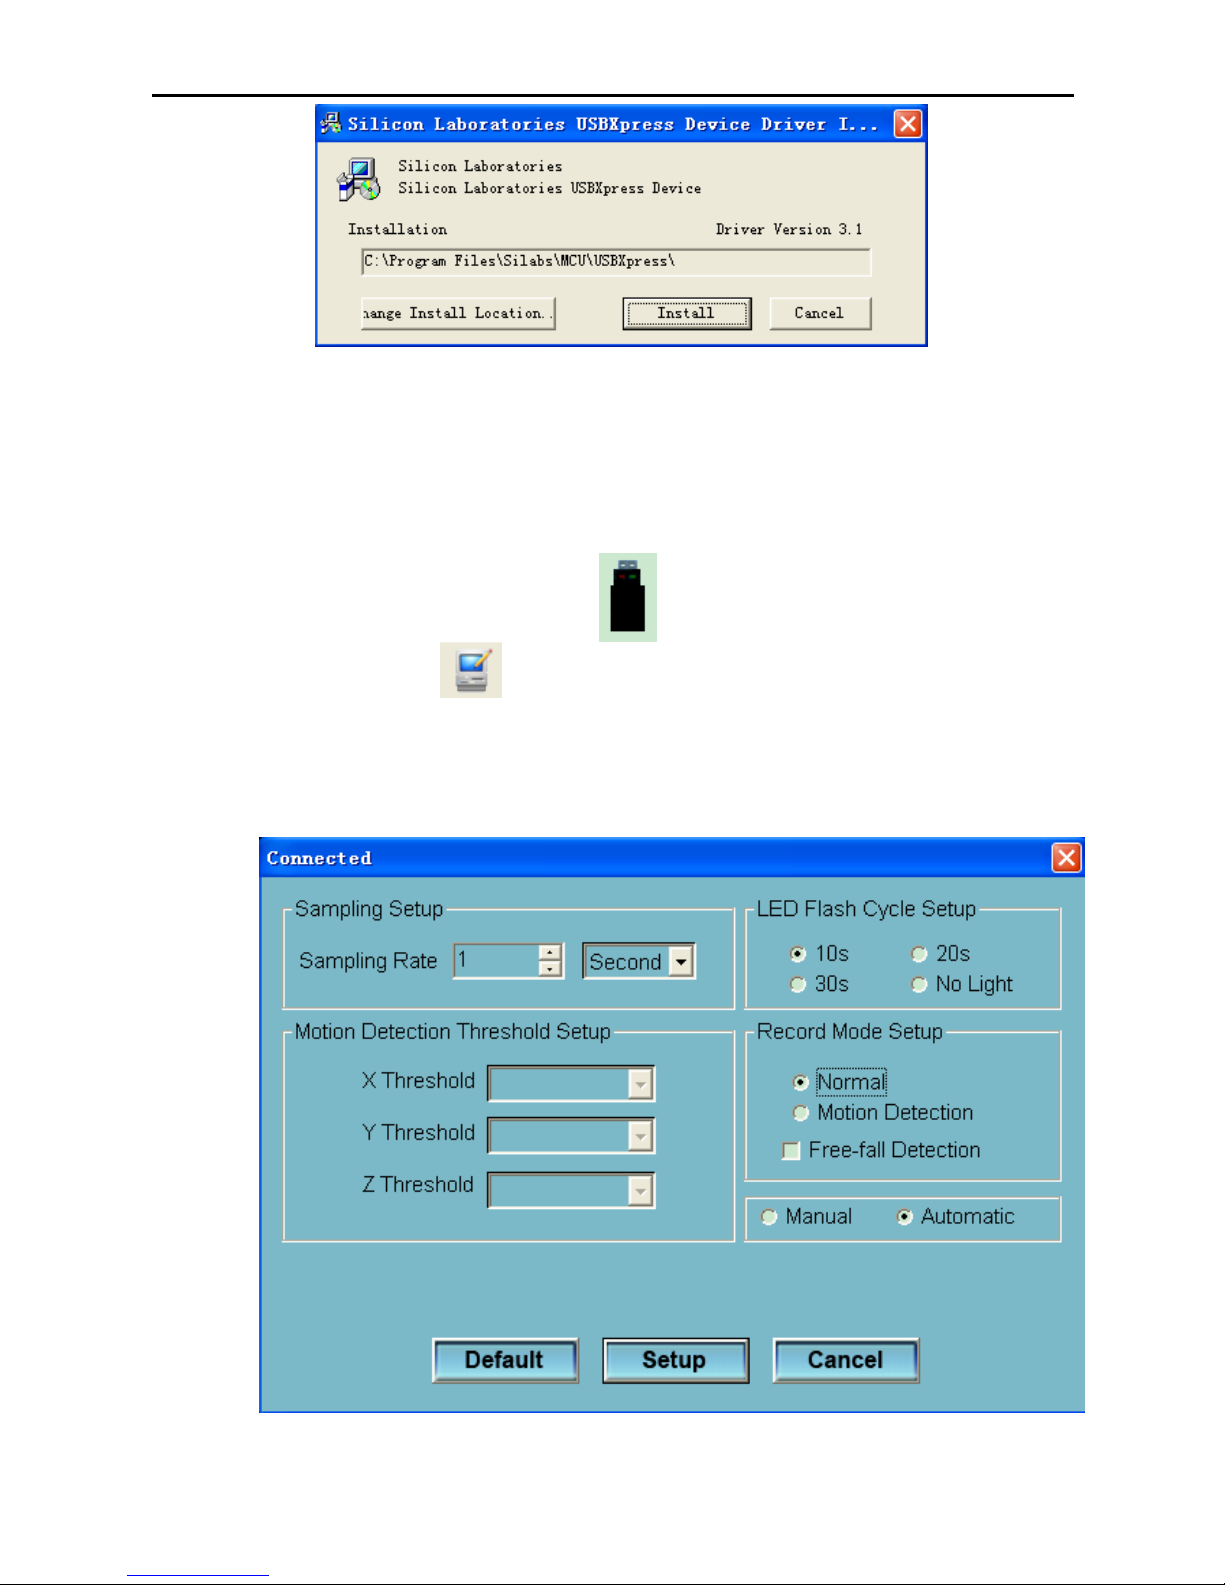
5. Double click the icon “ ” to start the software,Click
on the icon on the menu bar. The Setup window
will appear as shown below; descriptions for each
field in the Setup window are listed directly below for
illustration:
Page 11

10
The Sampling Setup field instructs the DATA
LOGGER to log readings at a specific rate . You
can input specific sampling rate data at the left
Combo box and select the time unit at the right
Combo box.
The Motion Detection Threshold Setup filed
allows the user to set the acceleration detection
threshold.Once the acceleration value is over the
threshold,the DATALOGGER will work.
The LED Flash Cycle Setup field can be set
10s/20s/30s by the user depending on the
requirement. By selecting “No Light” option, there
will be no flash there by increase the battery life.
The DATA LOGGER Record Mode can be set as
Normal and Motion Detection.
Free-fall Detection field can be set for detecting
Free-fall events or not.
The Manual and Automatic select buttons allows
the user to start data logging immediately when
exit the Setup window(Automatic) or at a later
time (Manual).
Click on the SETUP button to save changes. Press the
DEFAULT button to set the Logger to factory default
condition. Press the CANCEL button to abort the setup.
Notes:All stored data will be permanently erased when
Setup is finished. To enable you to save the data before it is
lost, click Cancel and then you need to download data.
The battery might be exhausted before logger finish
specified sample points. Always ensure that the remaining
power in the battery is sufficient for completing your logging
task. If in doubt, we recommend that you always install a
fresh battery before logging critical data.
Page 12
11
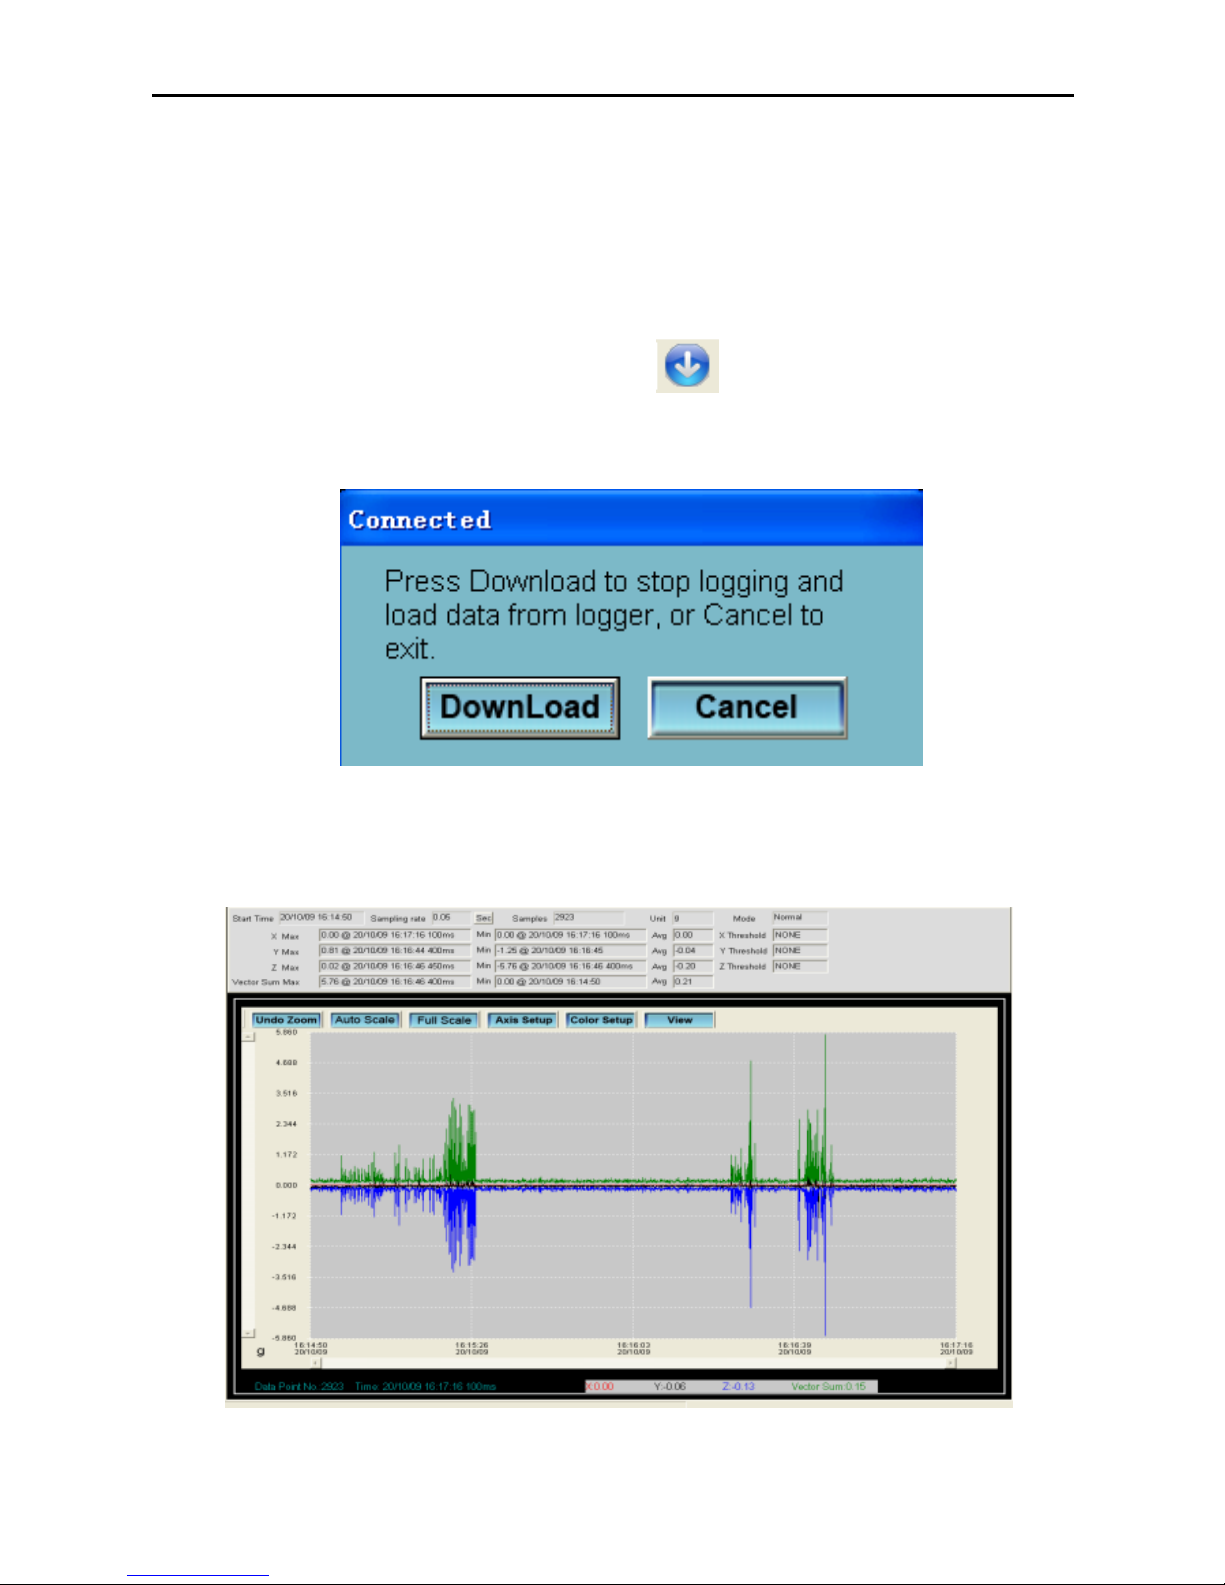
6. Download Data, To transfer the readings stored in the Logger
to the PC:
A. Connect the DATA LOGGER to the USB port.
B. Open the Datalogger software program if it is not still
running
C. Click the Download icon .
D. The Window shown below will appear. Click
DOWNLOAD to begin transferring data
Once the data is successfully downloaded, the window shown
below will appear.
Page 13
12
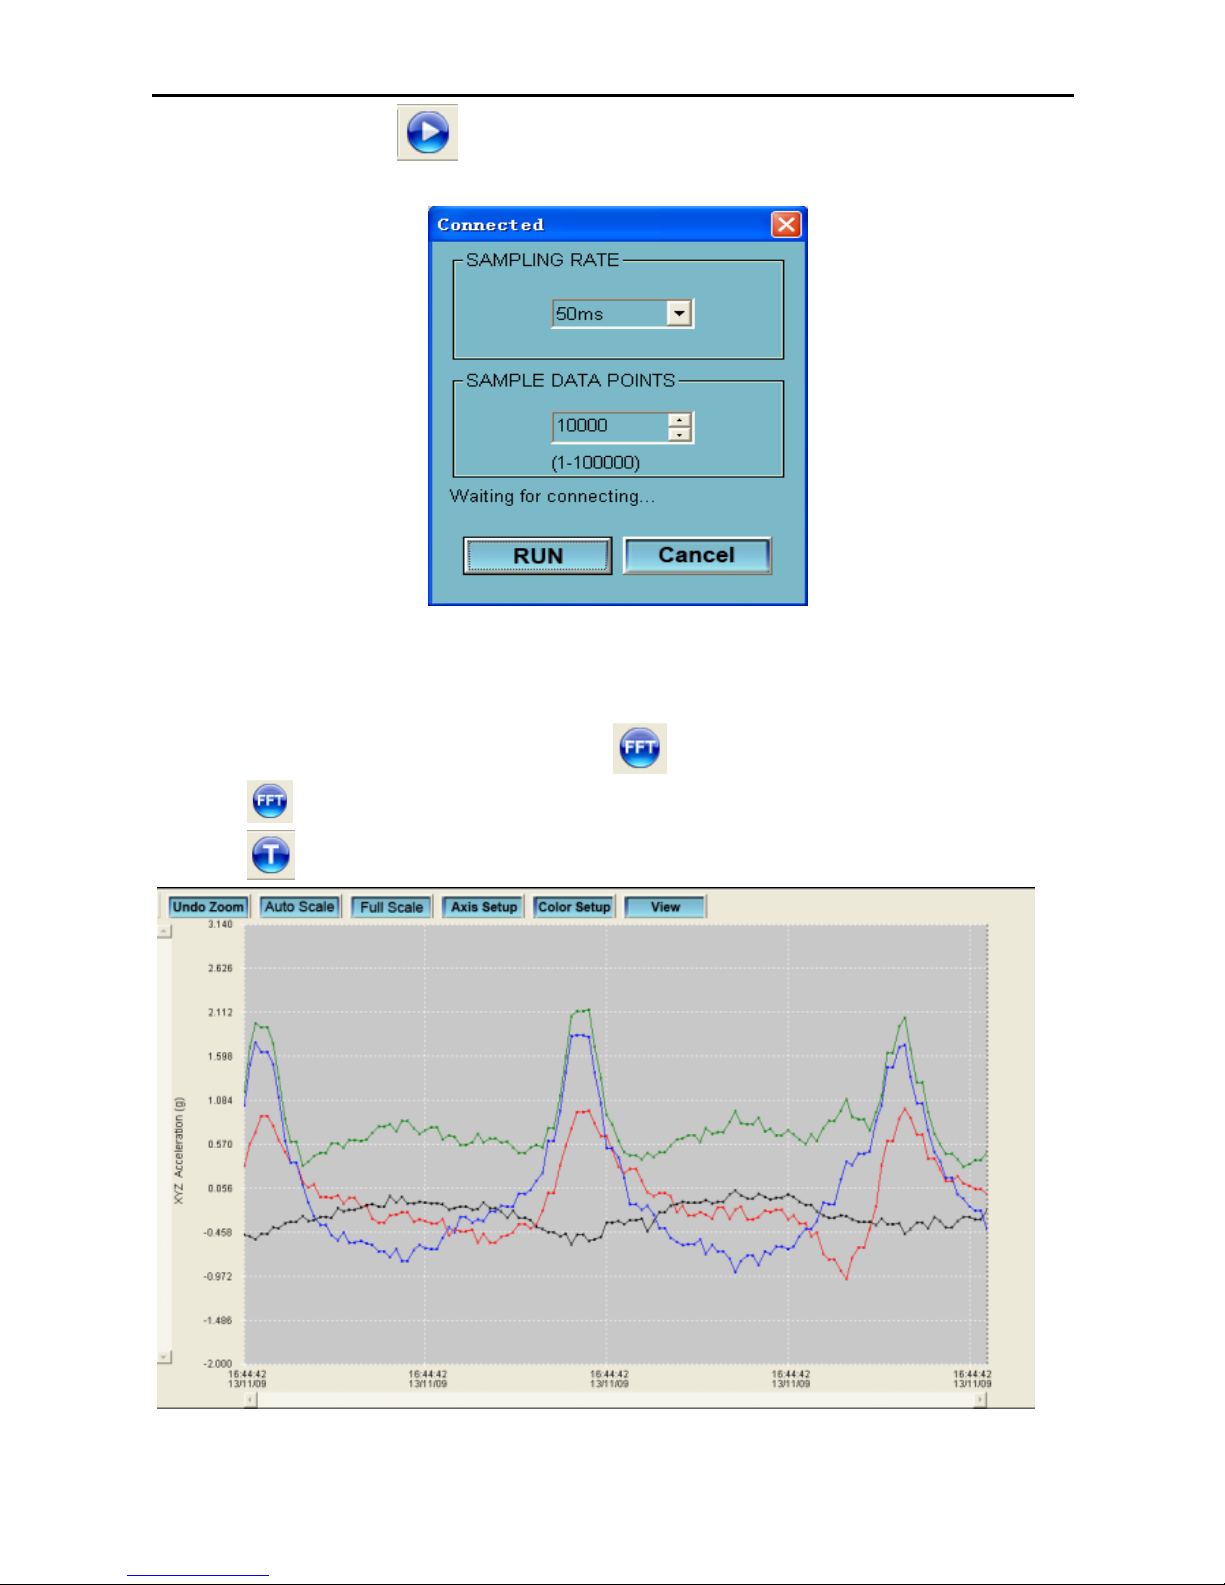
7. Run,Click icon to read real-time data from the
DATA LOGGER.
First,Setup the sampling rate and sample data points,then click
RUN to start reading.
8. Reading for FFT Analysis
Click icon to read real-time spectral data for FFT analysis.
Click to show the time-domain graph.
Page 14
13
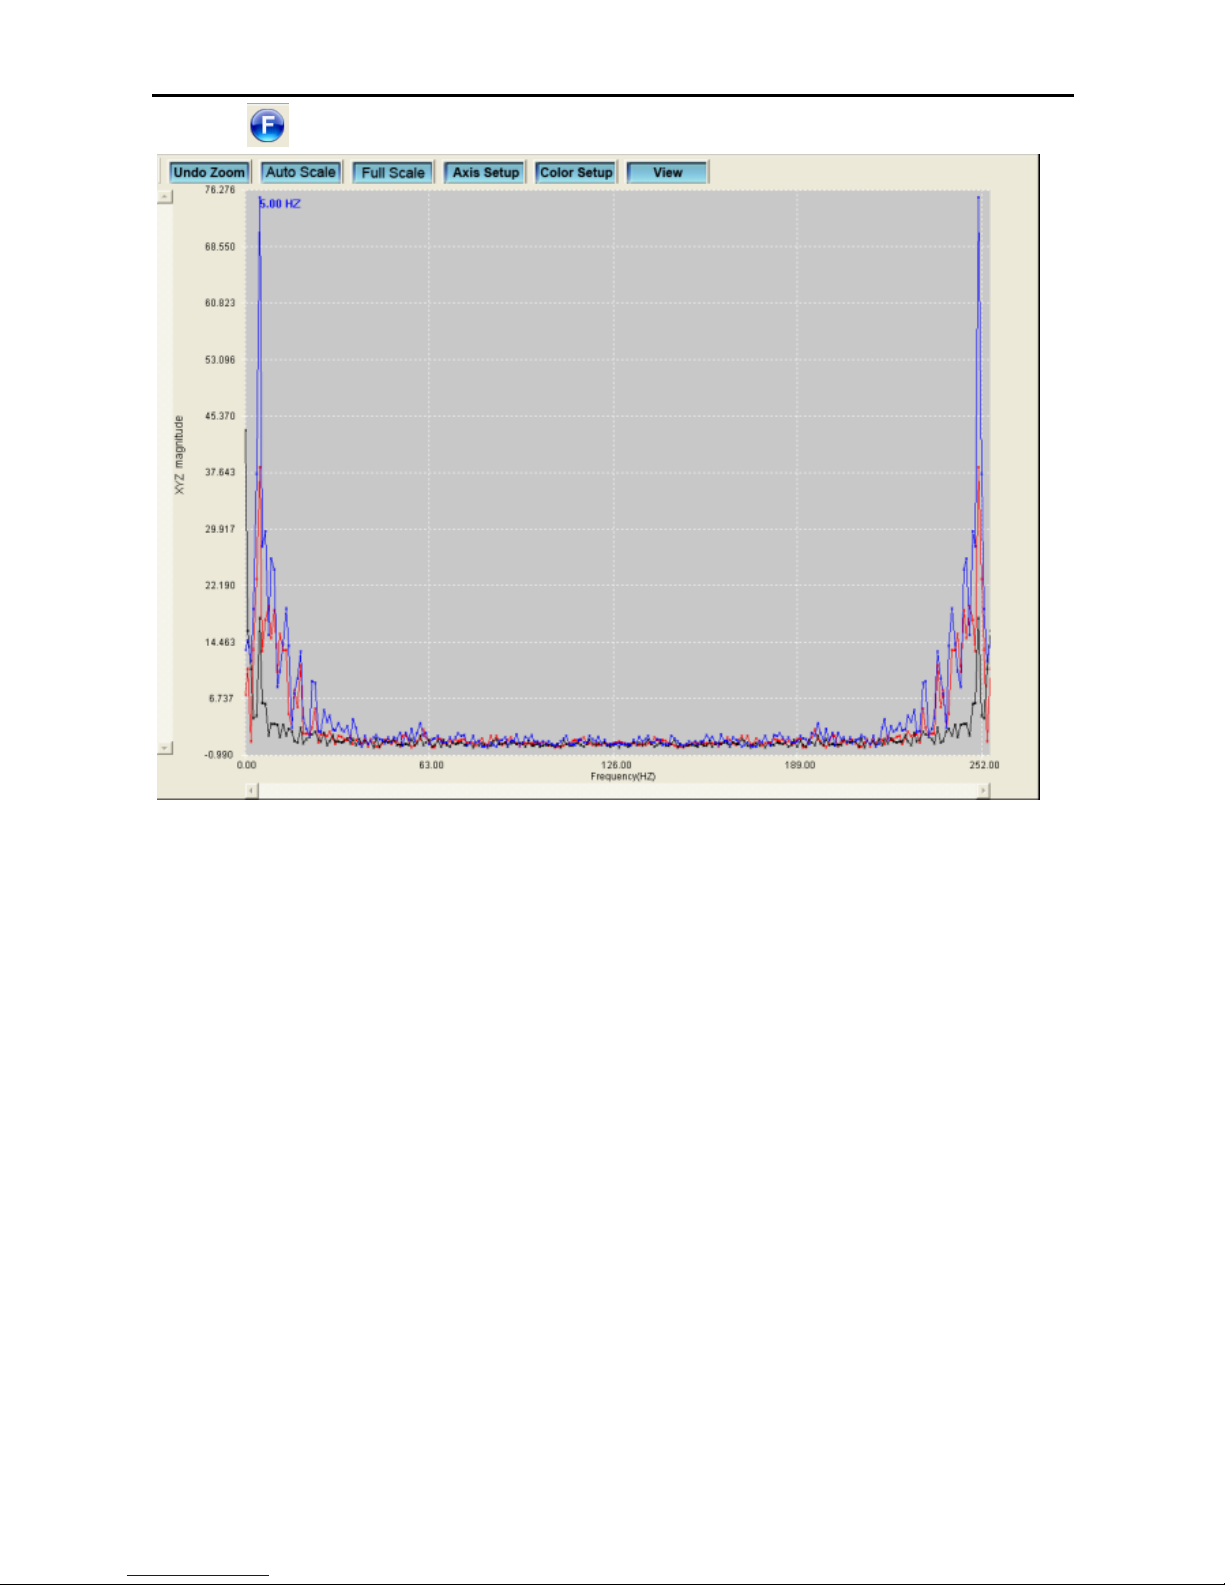
Click to show the frequency-domain graph.
The software computes real-time spectral data using an FFT from
0 to 256 HZ.
The frequency of the max magnitude will be showed on this panel
9. Please view the Help file for specific application of the
software
 Loading...