


© PCE Instruments
PCE-USC 30
User Manual
User manuals in various languages (Deutsch,
français, italiano, español, português, nederlands,
türk, polski, русский, 中文) can be downloaded here:
www.pce-instruments.com
Last change: 6 January 2017
v1.0
English

© PCE Instruments
English
Contents
1 Safety notes ........................................................................................... 1
2 Specifications ........................................................................................ 2
2.1 Technical specifications ................................................................................................... 2
3 System description ............................................................................... 4
3.1 Device .............................................................................................................................. 4
3.2 Display and Side Panels .................................................................................................. 5
Rear panel of the flaw detector: ................................................................................................. 5
3.3 Function keys ..................................................................................................................11
4 Design of the Flaw Detector ............................................................... 14
4.1 Instrument Appearance ...................................................................................................14
4.2 Structural Scheme ...........................................................................................................15
4.3 Appearance of the Flaw Detector Screen ........................................................................16
Fig. 7 – Display Appearance after switching on the Flaw Detector ............................................16
4.4 Menu Structure................................................................................................................21
4.5 “TEST” Menu ..................................................................................................................22
4.6 Guidelines for Overload Processing ................................................................................33
4.7 "Conductivity" Mode ........................................................................................................34
4.8 “General Settings” Menu .................................................................................................38
4.9 View ................................................................................................................................40
4.10 “Memory” Menu ...............................................................................................................41
4.11 “Results” Menu ................................................................................................................42
4.12 “Settings” Menu ...............................................................................................................43
4.13 Set up of “Calibration” Menu ............................................................................................43
4.14 Communication with PC ..................................................................................................46
5 Labelling and Sealing ......................................................................... 52
5.1 The flaw detector labelling complies with the manufacturer’s set of documents and
includes: ...................................................................................................................................52
5.2 Labelling is made on the flaw detector casing by polygraphic technique. .........................52
5.3 Pattern approval mark is made on the flaw detector electronic unit by at least two seals
made on screws of casing cover. ..............................................................................................52
6 Composition and Delivery Set ........................................................... 53

© PCE Instruments
6.1 Basic delivery set consists of the following components: .................................................53
7 Setting-up procedures ........................................................................ 53
7.1 The flaw detector is operated by one operator who has a corresponding level of
qualification and has studied the present operation manual. .....................................................53
7.2 Before operating charge the battery of flaw detector (if required) governed by the passport
of automatic charging device. ...................................................................................................53
8 Instructions for Use ............................................................................ 54
8.1 Single Coil Probe ............................................................................................................54
8.2 Reflection, Differential Probe ...........................................................................................54
8.3 Rotation Probe ................................................................................................................55
9 Maintenance ........................................................................................ 56
9.1 The flaw detector maintenance includes the maintenance inspection, operating repair and
calibration. ................................................................................................................................56
9.2 Intervals between the maintenance inspections are set depending on the industrial
conditions, but no less than once per month. Connecting cable fixation, condition of controls and
indicators are checked during the maintenance inspection. ......................................................56
9.3 The maintenance inspection includes an external examination and is performed by
attending personnel before starting the flaw detector electronic unit operation. .........................56
9.4 Replacement of the battery pack. ....................................................................................56
10 Typical Failures and Troubleshooting .............................................. 58
10.1 The list of the most common and probable failures is given in Table 9. ...........................58
Table 9 – Typical failures and troubleshooting ..........................................................................58
11 Transportation and Storage ............................................................... 58
12 Warranty ............................................................................................... 58
13 Disposal ............................................................................................... 59


© PCE Instruments
1
English
Thank you for purchasing a PCE-USC 30 from PCE Instruments.
1 Safety notes
Please read this manual carefully and completely before you use the device
for the first time. The device may only be used by qualified personnel and
repaired by PCE Instruments personnel. Damage or injuries caused by nonobservance of the manual are excluded from our liability and not covered by
our warranty.
The device must only be used as described in this instruction
manual. If used otherwise, this can cause dangerous situations for
the user and damage to the meter.
The instrument may only be used if the environmental conditions
(temperature, relative humidity, …) are within the ranges stated in
the technical specifications. Do not expose the device to extreme
temperatures, direct sunlight, extreme humidity or moisture.
Do not expose the device to shocks or strong vibrations.
The case should only be opened by qualified PCE Instruments
personnel.
Never use the instrument when your hands are wet.
You must not make any technical changes to the device.
The appliance should only be cleaned with a damp cloth. Use only
pH-neutral cleaner, no abrasives or solvents.
The device must only be used with accessories from PCE
Instruments or equivalent.
Before each use, inspect the case for visible damage. If any damage
is visible, do not use the device.
Do not use the instrument in explosive atmospheres.
The measurement range as stated in the specifications must not be
exceeded under any circumstances.
In operation with the flaw detector, it is necessary to observe the
safety measures while charging the storage battery unit of the flaw
detector by means of automatic charger.
In operation with the flaw detector an operator should be governed
by the safety standards in effect at the enterprise.
Non-observance of the safety notes can cause damage to the
device and injuries to the user.

© PCE Instruments
2
English
We do not assume liability for printing errors or any other mistakes in this
manual.
We expressly point to our general guarantee terms which can be found in
our general terms of business.
If you have any questions, please, contact PCE Instruments. The contact
details can be found at the end of this manual.
Safety symbols
Safety-related instructions the non-observance of which can cause damage
to the device or personal injury carry a safety symbol.
Symbol
Designation / description
General warning sign. ATTENTION!
Non-observance can cause damage to the device and injuries
to the user.
2 Specifications
2.1 Technical specifications
Range of operating frequencies adjustment – from 10 Hz to 16
МHz.
Setup of the max. sampling frequency – 10 kHz.
Setup of the range of adjustment of ECP excitation signal voltage
(double amplitude) – from 0.5 to 6.0 V.
Preamplifier adjustment – from minus 6 to plus 40 dB with a step of
0,1; 1; 10 dB.
Gain adjustment – from 0 to 30 dB with a step of 0,1, 1 and 10 dB.
Horizontal gain adjustment – from -30 to 30 dB with a step of 0.1, 1
and 10 dB.
Vertical gain adjustment – from -30 to 30 dB with a step of 0.1, 1
and 10 dB.

© PCE Instruments
3
English
When displaying the signal in a complex plane it is possible to have
the following variants: а) the complex plane center is situated in the
center of display area; b) the complex plane center is situated in the
left upper corner; c) the complex plane center is situated in the right
upper corner; d) the complex plane center is situated in the left
bottom corner; e) the complex plane center is situated in the right
bottom corner; f) all frequencies and mixtures are displayed on the
same page (when operating in dual-frequency mode); g) manual
adjustment of the positioning of the center of the complex plane.
There is automatic LED and sound flaw alarm (ALARM) in the flaw
detector.
In processing of the testing results the flaw detector provides the
following options:
− changing of ECP signal phase (the range of signal turn – from 0°
to 360° with a step of 0.1°; 1°; 10°);
− filtering of ECP signal (there are 5 types of filters: Averaging,
Differential, Low-pass, High-pass, Bandpass);
− formation of a mix of two frequencies (for combining an operator
can select one of 4 algorithms: summation, subtraction, summation
with horizontal inversion, summation with vertical inversion).
Time of continuous operation of the flaw detector from fully charged
storage battery – no less than 8 hours.
Average mean time between failures – no less than 40000 hours.
Defined no-failure operating time – 4000 hours.
Total average service life – 10 years. The criterion of marginal state
of the flaw detector is economical inexpediency of restoration of its
performance by repair.
The flaw detector is powered from the in-built storage battery with
rated voltage of 12 V.
Weight of the flaw detector with a storage battery (without ECP set,
cables and casing) – no more than 0.9 kg.
Overall dimensions of the flaw detector – no more than 230 mm x
135 mm x 98 mm.

© PCE Instruments
4
English
3 System description
3.1 Device
User manual of PCE-USC 30 portable eddy current flaw detector (hereinafter
referred to as "Flaw detector"), is intended for the study of operation
principles of the flaw detector and its operating instructions, and includes the
information on application, specifications, operating principle and structure,
operating instruction, and also other information allowing a full-scale
implementation of flaw detector technical capabilities.
The flaw detector is intended for manual and mechanized testing by
eddy current method for the presence of surface and subsurface
defects, such as material discontinuity (cracks, laps, cissings, fine
cracks etc.), for conductivity and thickness measurement.
The flaw detector can be applied for the testing of products during
their manufacture and operation by NDT services and laboratories of
enterprises that provide the products quality control.
The parameters of testing objects, which limit the flaw detector
application area, are specified in regulatory documents for a specific
type of testing products and materials.
The flaw detector provides the possibility of connecting and
operating ECP of the following types:
- differential ECP;
- differential ECP, connected by the bridge circuit;
- differential transformer ECP with center-point earth;
- differential transformer ECP;
- single (parametric) ECP;
- single transformer ECP.
The evaluation of resistance of the flaw detector and ECP
functioning quality to the impact of electromagnetic interferences of
"В" criterion according to

© PCE Instruments
5
English
3.2 Display and Side Panels
Rear panel of the flaw detector:
1 – Ethernet port for connecting a communication cable to PC;
2 – USB port for updating the flaw detector software and recording the
testing
results on the external Flash-Card
Fig. 1 – PCE-USC 30 Rear Panel
© PCE Instruments
6
English
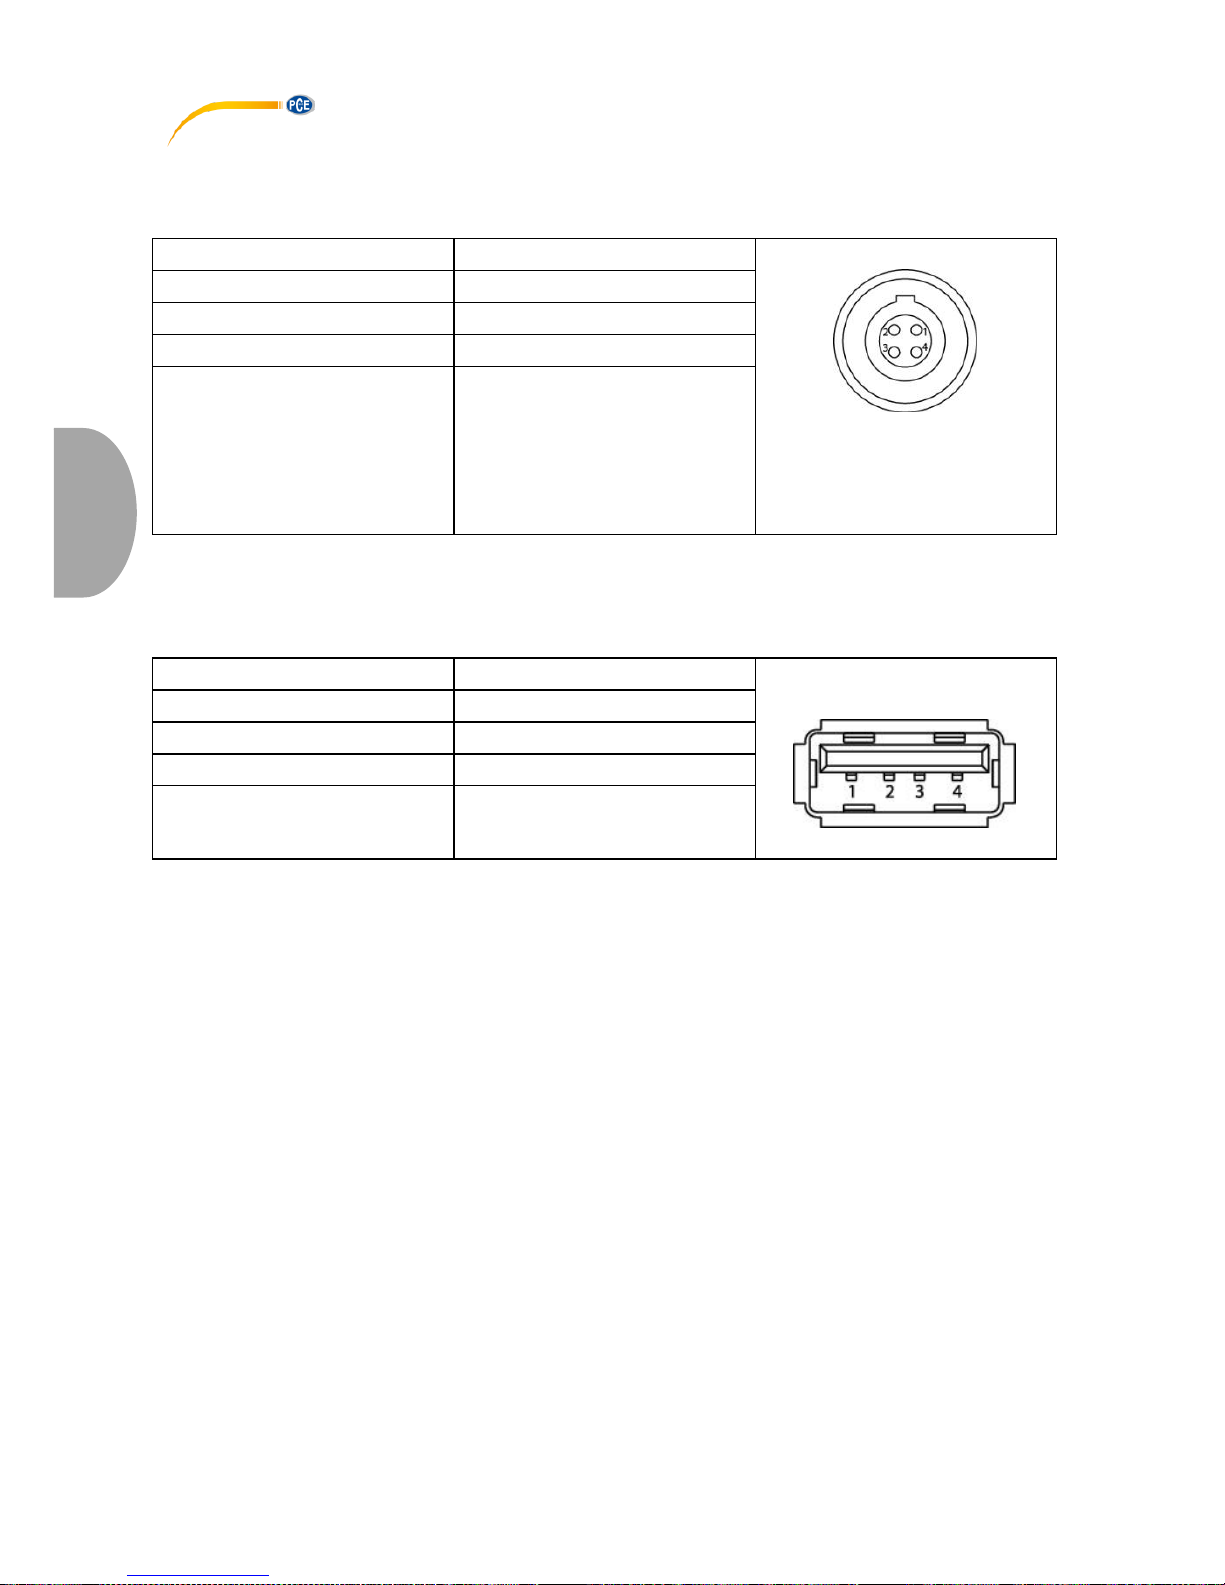
Table 1 – Description of connector for the instrument connection to
the PC Ethernet port
Contact
Description
Ethernet
ERA.0S.304.CLL
(front view)
1
Data of transmitter «+»
2
Data of transmitter «–»
3
Data of receiver «+»
4
Data of receiver «–»
Table 2 – Description of connector for the instrument connection to
the PC USB port
Contact
Signal
USB type A (front
view)
1 +5 V
2
Data -
3
Data +
4
Common

© PCE Instruments
7
English
Front Panel
Fig. 2 – PCE-USC 30 Front Panel

© PCE Instruments
8
English
Left side panel of the flaw detector:
1 - LEMO jack for headphones with microphone connection;
2 - Charger connector;
3 - Switching On/Off the instrument.
Fig. 3 – PCE-USC 30 Left Side Panel
Table 3 – Description of LEMO jack for headphones with microphone
connection
Cont.
Signal
EGG.0B.304.CLL
(front view)
1
Input signal from the
microphone
2
Right audio output
3
Common
4
Left audio output

© PCE Instruments
9
English
Table 4 – Description of charger connector
Cont.
Signal
EGG.1B.304.CLL
(front view)
1
Charging device -
2
Not used
3
Charging device +
4
Sync signal output
Right side panel of the flaw detector:
1 – Single coil (parametric) eddy current probe (ECP) connector;
2 - Universal connector for eddy current probe (ECP) and eddy current rotary
scanner;
3 - Encoder (Enc) connector
Fig. 4 – PCE-USC 30 Right Side

© PCE Instruments
10
English
Table 5 – Description of single coil (parametric) eddy current probe
(ECP) connector
Cont.
Signal
Lemo ERA.00.250CLL
1
Parametric ECP
2
Common for parametric ECP
Table 6 – description of encoder (Enc) connector
Cont.
Signal
Lemo
EGG.1B.308CLL
(front view)
1
Positive signal input "A"
2
Power "+5V"
3
Negative signal input "Z"
4
Positive signal input "Z"
5
Negative signal input "B"
6
Positive signal input "B"
7
Negative signal input "A"
8
Common
© PCE Instruments
11
English
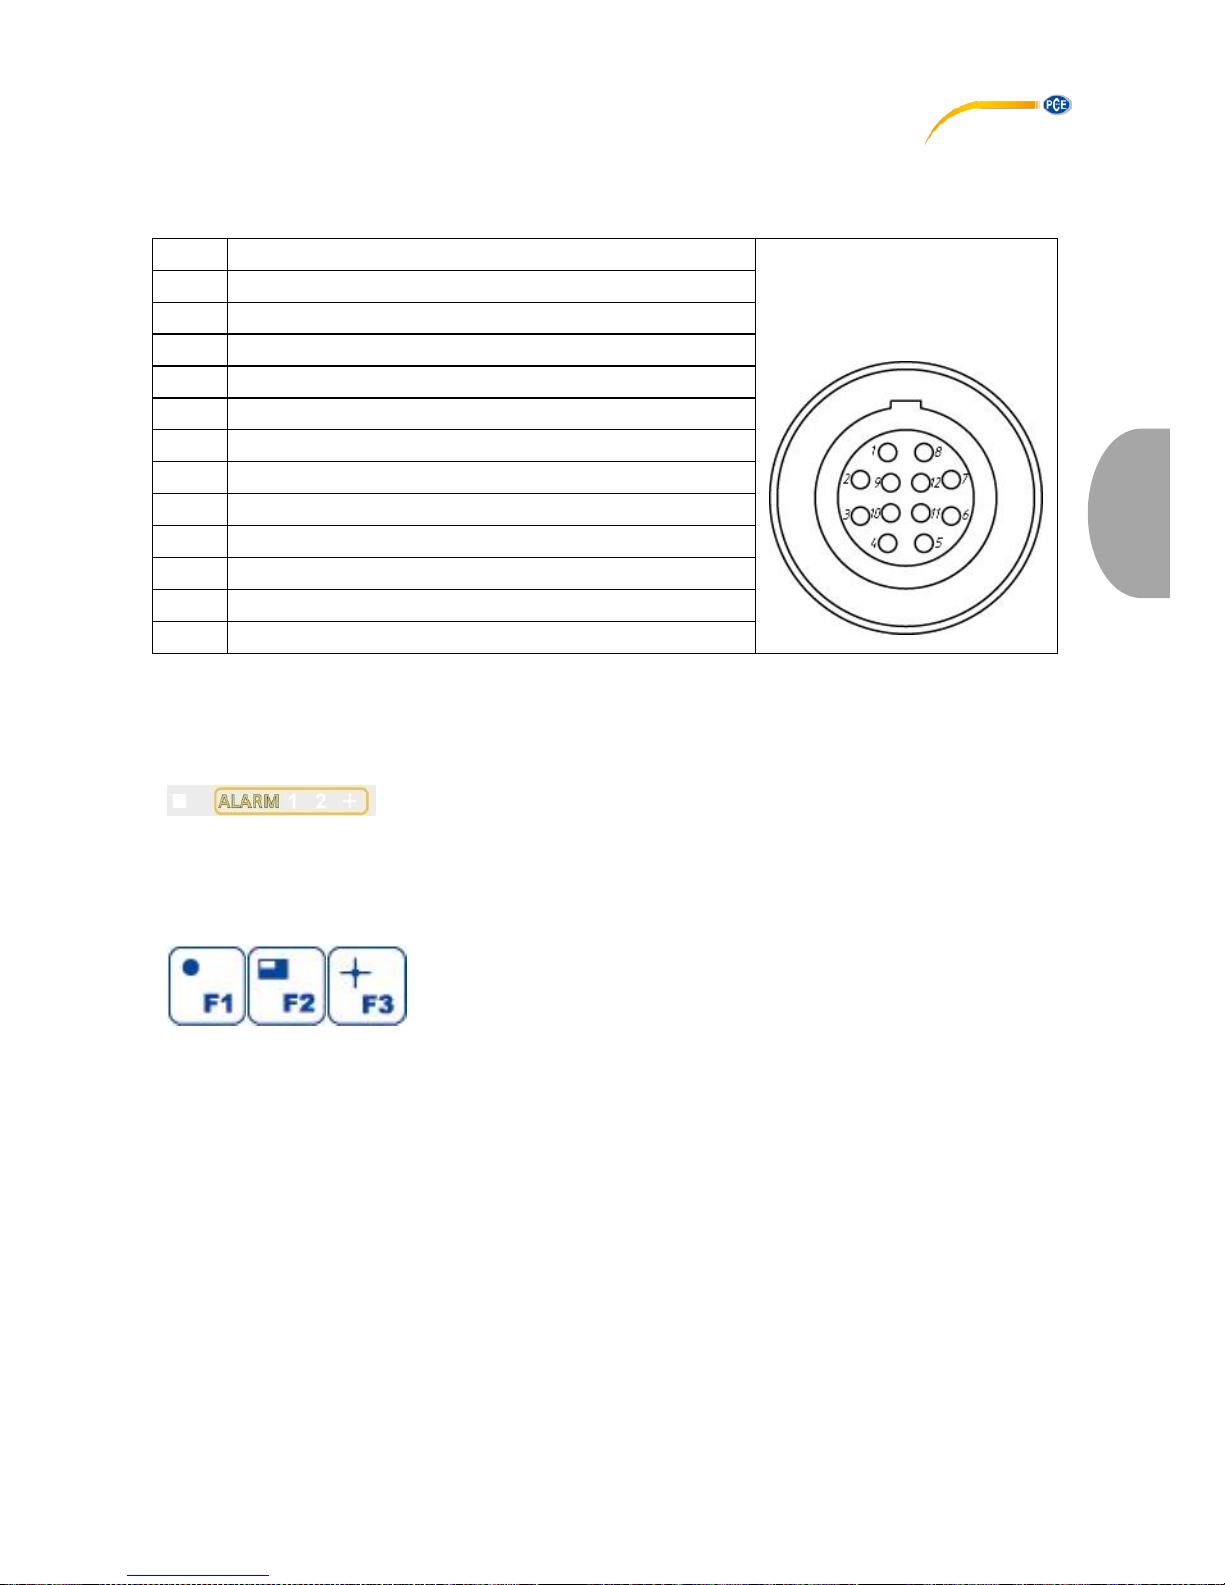
Table 7 – Description of connector for eddy current probe (ECP)
and eddy current rotary scanner
Pin
Signal
Lemo
EGG.2B.312CLL
(front view)
1
Gen Ret
2
Gen Out
3
+12V Battery
4
Motor -
5
Motor +
6
Gnd
7
Dif Input 1
8
Dif Input 2
9
Synchro Input
10
Motor On
11
Rotary On
12
Alarm LED
3.3 Function keys
Automatic flaw alarm by the first and second frequencies,
respectively, and by the mix of the 1st and 2nd frequencies, as well as
overloading alarm square. If ALARM triggers during testing, the signal
amplitude and phase are automatically measured and the signal is evaluated
by the calibration curve.
Function keys
Respectively:
"F1 Balancing", "F2 Full-screen mode", "F3 Centering"– in "TEST" menu;
"F1 Import data", "F2 Export data "– in “MEMORY” menu;
"F1 Load", "F2 Create/ Save","F3 Delete"– in "RESULTS"/"SETTINGS"
submenu;
"F1 An" (An - amplitude noise) – in "VIEW" menu;
"F2 OK” save calibration curve – in "CALIBRATION" menu.

© PCE Instruments
12
English
Key
Function
- automatically puts a displayed signal from lift-off (or from
any interference) in horizontal position;
- in the mode of name editing – selects a digit/letter
- changes the parameter variation step;
- in the mode of name editing – selects a digit/letter
- increases the selected parameter;
- in the mode of name editing – selects a digit/letter
- changes the frequency;
- in the mode of name editing – selects a digit/letter
- moves up through the menu;
- in the mode of name editing – selects a digit/letter
- decreases the selected parameter;
- in the mode of name editing – selects a digit/letter
- cancels the selection;
- in the mode of name editing – selects a digit/letter;
- pressing the key results in displaying the firmware version
in "SETTINGS" menu;
- delete point in “CALIBRATION" menu;
- freeze the display in the test menu
- moves down through the menu;
- in the mode of name editing – selects a digit/letter
- confirms the selection;
- in the mode of name editing – selects a digit/letter;
- pressing the key in "TEST" menu results in saving of
current setup as a default one (if the current item is above
the ALARM item);
- add point in “CALIBRATION" menu
- quick access to "TEST" menu
- quick access to "SETTINGS" menu

© PCE Instruments
13
English
- quick access to "VIEW" menu
- quick access to "MEMORY" menu;
- confirms the saving of the entered name of the file or
folder while operating in "MEMORY" menu
- quick access to "CALIBRATION" menu
- automatically sets the parameters of single coil
(parametric) ECP with switched On Single input;
- sets the number of rounds while operating with eddy
current rotary scanner
- switches On/Off the instrument

© PCE Instruments
14
English
4 Design of the Flaw Detector
4.1 Instrument Appearance
Fig. PCE-USC 30 eddy current flaw detector

© PCE Instruments
15
English
4.2 Structural Scheme
Structural scheme of the flaw detector.
Fig. 6 – Structural Scheme of the Flaw Detector
Structurally, the flaw detector consists of:
a) casing and cover plate with the membrane keypad, indicators of ALARM
and overloading, Ethernet port for connection to PC, USB port for external
flash-card connection, charger connector, headphones and microphone;
b) connector, ECP connector;
c) TFT display;
d) processor and memory boards;
e) analog board;
f) battery.

© PCE Instruments
16
English
4.3 Appearance of the Flaw Detector Screen
Fig. 7 – Display Appearance after switching on the Flaw Detector
Working filed in the testing mode is divided in 3 areas of signal reflection and
display area title:
Working field (display areas – complex plane, time charts);
Bottom horizontal field (data line);
Navigation menu:
o FREQ – test frequency;
o PRE AMP – preamplifier gain;
o GAIN – main gain;
o H GAIN – horizontal gain;
o V GAIN – vertical gain;
o DRIVE – probe drive level;
o PHASE – phase adjustment;
o FILTER – filter type;
o POSITION – spot position;

© PCE Instruments
17
English
o GRID – grid;
o AXIS – axis;
o ALARM – short cut to ALARM Setting;
o SWEEP – number of points in a screen scan;
o PROBE – type of connector;
o RPM – rounds per minute for the eddy current rotary scanner;
o ROT PRESENT– type of connected rotary eddy current scanner.
The flaw detector displays two time charts of time dependence of signal
and eddy current signal which is displayed in a complex plane for the
selected
frequency.
1 – Navigation menu
2 – Time charts
3 – ALARM frame
4 – Eddy current signal
5 - Signal display area

© PCE Instruments
18
English
6 - Parameters of the measured signal (A – amplitude in “Volts”, P – phase
in “degrees”, D – equivalent depth of flaw in “mm” or conductivity in
“MSm/m”), T - current value of a receive circuit parameters (“…/” – load of
the input circuit before the balancing; “…/” non-balance of the input circuit;
“…” – the current value of the input circuit expressed in % from the maximum
possible), F- sampling frequency
7 - Frequency number
8 - Battery life indicator
9 - Temporary memory indicator of the flaw detector
10 - Digital overload indicators for receiving circuit
11 - digital trigger indicators of ALARM levels for the first, second and mix of
frequencies respectively (from left to right)
Fig. 8 – The Flaw Detector Interface
Note – Parameter "T: …/…/... %" shows:
1) The value of a signal amplitude at the input of the receiving circuit
expressed in % from the maximum possible,
2) Input circuit is not balanced, after performing the balancing in %;
3) Current value of the load of the input circuit expressed in % from the
maximum possible.
The most suitable option is one in which the two parameters do not
exceed, or exceed but not significantly the 50%. Operation in mode, in
which one of the parameters exceeded the threshold of 90% is
unacceptable and requires the adjustment of flaw detector parameters.
Lighting of a left overload indicator (pos. 10, Fig. 8) – indicates that
unacceptably large amplitude signal came to the input of the receiving
circuit.
The flaw detector electronic unit displays the signal in the complex plane that
allows to foil defects by waveform analysis (Fig. 9):

© PCE Instruments
19
English
Fig. 9 – Display of signal in the complex plane (XY)
Fig. 10 – Mix of two frequencies (MIX)
The flaw detector has the mechanism of automatic flaw alarm (ALARM). It is
provided for the creation of up to 4 "frames" (threshold levels) of alarm for
each frequency and mix (examples of threshold levels see Figure 14, 15, 16,
17). These frames together with the signal form an event (for example, the
threshold level exceeding by the signal). An operator is able to adjust the
reaction to an event. Reaction to an event can be the following:
− LEDs illuminating on the instrument panel;
− or LEDs illuminating and sound alarm.
"ALARM" menu setup
This menu allows setting of ALARM (automatic flaw alarm). There is a
possibility to setup ALARM for each frequency and mix. ALARM itself is the
response of flaw detector to the event occurring at crossing or non-crossing
of alarm frame (threshold level) by a signal. All in all one alarm frame can be
activated for each frequency.

© PCE Instruments
20
English
Frame setup is carried out in special item of ALARM settings - from
"TEST" menu. To change the type of the alarm frame operator should press
or key on “ALARM” position (if the icon is displayed, the
frames are switched off). To enter in alarm frame setup operator should
press key.
Note. An operator is offered to set up the frame according to the
frequency, he plans to work with.
Automatic measurement of the signal amplitude and phase provides a
possibility to evaluate the defect size in analyzing the data. The measured
values of the voltage phase or amplitude are required for estimating the
defect size in conformity with the selected calibration curve. Such curve
compares the parameters of signal amplitude or phase with the defect
parameters in millimeters or percent from the wall thickness. The flaw
detector interface allows calibration curves plotting both by the phase and
amplitude.
The flaw detector connectors for the eddy current probes connection (see
Fig. 4) provide the possibility of ECP connection of various constructions
(see Fig. 11):
differential ECP, connection by the bridge circuit;
single transformer ECP;
differential ECP, connection by the bridge circuit;
differential transformer ECP with center-point ground;
single (parametric) ECP;
differential transformer ECP.

© PCE Instruments
21
English
Fig.11 – Circuits of probe connection
4.4 Menu Structure
Fig. 12 – Menu Structure

© PCE Instruments
22
English
Navigation of the menu map described below is performed with the help of
the following keys:
The instrument menu is divided in five inserts: "TEST", "SETTINGS", "VIEW",
"MEMORY", "CALIBRATION", the first and the fourth ones are also divided in
submenus.
4.5 “TEST” Menu
"Test" menu is displayed immediately after switching On the instrument (see
Figure13) and contains main settings an operator will need to set during
operation.
Fig.13 – “TEST” menu
In this menu, an operator can set (change) the settings of the selected
frequency, the values of operating frequency, gain and preamplifier,
generator voltage, initial phase of signal, filter type and its parameter, input
type, general scale and independently to axles, position of complex plane
center as well as set up ALARM and general flaw detector parameters.

© PCE Instruments
23
English
Moving through the vertical menu of the electronic unit parameters is carried
out by , keys. In order to change the value of any parameter one
should use , keys. A step of parameter variations can be changed
by multiple pressing of key.

© PCE Instruments
24
English
Quick selection to "TEST", "SETTINGS", "VIEW", "MEMORY",
"CALIBRATION" inserts is carried out by pressing
keys.
"Hot keys" which are operated by "F1", "F2", "F3" function keys are situated
on the keypad of the flaw detector:
− F1 (Balancing)1 – to balance the signal (place it in the screen center) and
clear the flaw detector screen;
− F2 (Full-screen mode) – the complex plane and time chart is maximized to
fill the entire screen.
− F3 (Clearing) – clear the flaw detector screen;
“Balancing” – it is hardware compensation of input signal. It is carried out
by summation of input signal with reference signal of the same amplitude but
opposite in phase. Current procedure is conducted after preamplifier
according to radio signal (before signal detecting). Balancing algorithm is
iterative and takes some time. The procedure is necessary for ECP nonbalance voltage compensation. After the balancing of flaw detector the
centering is carried out automatically.
Balancing should be applied in case if:
− ECP type was changed;
− One of following parameters was changed: ECP frequency, gain
coefficient, preamplification coefficient, ECP excitation voltage;
− Testing object was changed;
− The auto-adjustment of ECP was activated (if Single input was used).
Clearing should be used if persistence is switched off.
1. “ F, Hz"- operating frequency of probe2; varied in the range
from 10 Hz to 16 MHz with a step of 1, 10, 100, 1000, 10000,
100000, 1000000, 10000000 Hz.
Here you adjust the test frequency of the probe that is connected to the
instrument. The frequency depends on the probe you use and the
application at hand. You can select the frequency between 10 Hz and 16
MHz.
1
Balancing of the flaw detector is required after the ECP operating frequency
was set or changed. Also, the balancing should be carried out after the ECP
replacement. If the flaw detector was once balanced and its operating
frequencies were not changed, it is possible to carry out centring.
2
Operating frequency of probe is selected from the rage of frequencies
indicated in the registration certificate for the given ECP.

© PCE Instruments
25
English
2. “ PRE AMP” - preamplifier for amplifying the probe voltage;
varied in the range from -6 to 40 dB with a step of 0,1, 1, 10 dB.
To adapt the eddy current probe that is to be used, you can adjust
the preamplification in 0.1; 1; 6; 10 dB steps between 0dB and 40dB.
Please avoid a preamplification overload because it may tamper with the
results of the measurement. The overload is indicated by the amber light
of the ALARM-LED.
3. " GAIN" - gain for amplifying the probe voltage; varied in the
range from 0 to 30 dB with a step of 0,1; 1; 10 dB.
Here you adjust the signal amplitude for the best possible display of the
eddy current signal by moving the probe across a reference defect while
slowly increasing the gain. You can adjust the gain between 0 dB and 30
dB. The display shows the overall gain simultaneously for X and Ycoordinates.
4. " H GAIN" – horizontal gain for amplifying the probe voltage;
varied in the range from 0 to 30 dB with a step of 0,1; 1; 10 dB.
5. " V GAIN dB" – vertical gain for amplifying the probe voltage;
varied in the range from 0 to 30 dB with a step of 0,1; 1; 10 dB. This
item is often used to set up single coil probe for visual increase of
angle between lift-off signal and signal from defect.
6. " DRIVE" - ECP excitation voltage3; it is possible to set specified
values of 0.5; 1; 2; 4; 6 V (double amplitude value). The maximum
voltage for single coil probe is 2V. The maximum voltage for other
types of probes is limited by 6V. High voltage is used for subsurface
defects detection.
7. " PHASE" - signal phase change (signal turn) – from 0 to 360˚
with a step of 0.1˚, 1˚, 10˚.
3
ECP exciting voltage is selected from the range indicated in the
registration certificate for the given ECP.

© PCE Instruments
26
English
8. " FILTER" - Filter type: Averaging, Differential, Low-pass, High-
pass, Bandpass;
Filters setup is carried out for the channel Frequency 1 and
Frequency 2.
Averaging Filter
Switching on of the averaging filter "Avrg" sets a number of points N
to be averaged from 2 to 127 points with a step of 1, 10, 100 points.
Can be used when working with high gains and scales to reduce
noise signal by smoothing it.
Differential Filter
Switching on of a differential filter “Diff” activates its settings, where L
– filter depth, set in the range from 2 to 127 units with a step of 1, 10,
100.
Low-Pass Filter
Switching on of a low-pass filter activates the field for setting up the
frequency LF from 1 to 4000 Hz with a step of 1, 10, 100, 1000 Hz.
The frequencies from 0 Hz to the set value of Hz are allowed.
The low-pass filter is used to reduce the noise respectively highfrequency non-essential signal components by displaying only those
signals whose alternating frequency is lower (i. e. slower) than the
frequency of the selected low-pass filter. Since electronic noise is
usually caused by high- frequency signals, the noise on the screen is
lower, if the frequency of the low-pass filter is set low, too.
The low-pass filter is used for static applications (usually with handheld probes).
It is important that the low-pass filter is not too low, because defect
signals are not displayed anymore, if you move the probe across the
crack at a speed that is too high with regards to the filter frequency.
If for example you move the probe very slowly across the crack, then
the dot slowly tracks the full defect signal at a low-pass frequency of
10 Hz. If, one the other hand, you move the probe across the crack
more quickly at the same low-pass frequency, you will see only a
small amplitude on the screen. This happens because the frequency
of the signals is now too high for the low-pass filter frequency you
selected.
If, however, you increase the low-pass filter frequency, the full
amplitude of the defect signal is displayed, i. e. the higher the test
speed the higher the frequency of the low-pass filter to be selected.
Since differential probes generate a dual signal that changes more
quickly than that of an absolute probe at the same speed, you

© PCE Instruments
27
English
should select a higher low-pass frequency for differential probes
than for absolute probes. Thus the minimum low-pass frequency to
be selected for a particular application depends on the test speed
and the coil system of the probe you use.
The easiest way to determine the minimum low-pass frequency is
probably by trial and error.
High-Pass Filter
Switching on of a high-pass filter activates the field for setting up the
frequency HF from 1 to 5000 Hz with a step of 1, 10, 100, 1000 Hz.
The frequencies from the set value of Hz to F
sampling
/2 Hz (where
F
sampling
– sampling frequency) are allowed.
If you use a high-pass filter, the signal dot always returns to the
selected compensation point, if the probe is not moved relative to the
surface of the test specimen. This can be likened to an „automatic
reset". Thus, if you move the probe across materials with varying
electric conductivity, the signal dot briefly moves to a position on the
screen that varies depending on the material; the dot then returns to
the selected compensation point.
The filters are intended to improve the signal/noise ratio and/or
supress undesired signals so that the signal evaluation and test
sensitivity are optimized. The noise can be “electronic” (caused by
the instrument or the probe), or it can be caused by other factors
such as scanning rough surfaces. You can easily identify electronic
noise by the so-called “fuzzy” signal image instead of a steady dot.
This happens frequently, if you carry out inspections with low
frequencies or high gain. The filter frequency does not depend on
the alternating frequency of the current that flows through the coils,
but on how frequently the test signals change. If for example you
move a probe across a crack, the frequency depends on how fast
you do so. The high-pass filter is designed so that only those signals
whose frequency is greater than that of the high-pass filter are
depicted by deflecting the signal dot. If the high-pass fil filter is active
the signal dot on the screen remains on the compensation point.
Bandpass
Switching on of a bandpass filter activates its settings:
Carrier frequency F is set from 1 to 5000 Hz with a step of 1; 10;
100; 1000 Hz;

© PCE Instruments
28
English
F ≤
Fsampling
2
where Fsampling – frequency is set in "SETTINGS" (sampling frequency);
WF bandpass is set from 1 to 5000 Hz with a step of 1; 10; 100; 1000 Hz.
You can use the bandpass-function to adjust both the high pass and the low
pass. This is very helpful when you want to quickly determine the frequency
band for the best possible defect display - especially for rotor applications or
inspections of rotating parts.
Note. Only one filter can be set in the frequency selected by an
operator. Activation of the other filter makes the earlier selected filter inactive
within the set frequency.
9. " " - selection of the position of complex plane centre. Can be set
in the following positions: - complex plane centre, - in the right
centre of the screen, - in the right upper corner, - in the upper
centre of the screen, - in the left upper corner, - in the left
centre of the screen, - in the left bottom corner, - in the bottom
centre of the screen, - in the right bottom corner, - per-
channel display when operating in double frequency mode.
10. " Grid"– variants of marking for the complex plane: " "– square,
" " – radial, " " – Off.
11. " Axis"– activates coordinate axes.
12. " ALARM" – activation and setting of frames (threshold levels).
Types of frames: - frames are switched off, - circle frame type,
- threshold frame type, - sector frame type, - cut-off frame
type.
13. "SWEEP" – number of samplings displayed on time charts (see
Figure 8, pos. 4) - 256; 512; 1024; 2048; 4096; 8192; 16384, 32768
measurements.
14. "PROBE" – Connector type: "Refl", "Bridge", "Single".
15. "RPM" – rounds per minute for the eddy current rotary scanner.
Selected from the standard range: 600, 840, 1020, 1200, 1500,
1800, 2100, 2400, 2700, 3000.
16. "ROT" – type of connected rotary eddy current scanner SVR-02 or
MINI DRIVE.
17. "Mix type" – is selected for the frequencies mixing (setting is
available in double frequency mode), where: "+" – summation, "–" –
subtraction, "~X+" - summation with inversion in Х-direction, "~Y+" summation with inversion in Y-direction.

© PCE Instruments
29
English
If the mix type is "+", then:
XCi=X1i*M1+X2i*M2;
YCi=Y1i*M1+Y2i*M2.
If the mix type is "-», then:
XCi=X1i*M1-X2i*M2;
YCi=Y1i*M1-Y2i*M2.
If the mix type is «~Y+», then:
XCi=X1i*M1-X2i*M2;
YCi=Y1i*M1+Y2i*M2.
If the mix type is «~X+», then:
XCi=X1i*M1+X2i*M2;
YCi=Y1i*M1-Y2i*M2.
Where XCi, X1i, X2i – horizontal components of the mix of the 1st and 2nd
frequencies, respectively;
YCi, Y1i, Y2i – vertical components of the mix of the 1st and 2nd frequencies,
respectively;
M1, M2 – scales of the 1st and 2nd frequencies, respectively.
Threshold levels setup
Setup of "Circle" type frame
To set up circle type frame, operator should select "Type: " in special item
of settings ALARM – (see Figure 14).
Fig. 14 – Setup of “Type: “ threshold level

© PCE Instruments
30
English
"R:" parameter variation allows change the inner radius of threshold level.
Height parameter variation is carried out in the range from 0 to 32768 with a
step of 1, 10, 100, 1000, 10000 (see Fig.14).
Setup of "Threshold" type frame
To set up threshold type frame, operator should select "Type: " in special
item of settings ALARM – (see Fig. 15).
Fig. 15 – Setup of “Type: “ threshold level
"H:" parameter variation allows change the height of the threshold level.
Parameter variation is carried out in the range from 0 to 32768 with a step of
1, 10, 100, 1000, 10000 (see Fig. 15).
Setup of "Sector" type frame
To set up sector type frame, operator should select "Type: " in special
item of settings ALARM – (see Figure 16).

© PCE Instruments
31
English
Fig. 16 – Setup of “Type: “ threshold level
"R:" parameter variation allows change the inner radius of threshold
level. Height parameter variation is carried out in the range from 0 to 32768
with a step of 1; 10; 100; 1000; 10000 (see Fig. 16).
"W:" parameter variation allows change the width of threshold level.
Radius parameter variation is carried out in the range from 0 to 32768 with a
step of 1; 10; 100; 1000;10000 (see Fig. 16).
"α:" parameter variation allows change turning angle of threshold level
relative to the complex plane centre. Turn angle variation is carried out in the
range from 0˚ to 359˚ with a step of 1˚; 10˚; 100˚ (see Fig. 16).
"β" parameter variation allows change turning angle of threshold level.
Turn angle variation is carried out in the range from 0˚ to 180˚ with a step of
1˚; 10˚; 100˚ (see Fig. 16).
Select the frame polarity "Pol:", which makes the alarm trigger:
– the signal gets beyond the limits of the threshold level;
– the signal is within the limits of the threshold level.
If the symmetrical displaying of threshold level on the position “Symm:”
with , keys is required, this parameter can be activated.

© PCE Instruments
32
English
Setup of "Trapezium" type frame
To set up cut-off type frame, operator should select "Type: " in special
item of settings ALARM – (see Figure 17).
Fig. 17 – Threshold level setup "Type: "
"X1:" parameter variation allows to change the angle position of threshold
level in X1-direction. X1 parameter variation is carried out in the range from 32768 to 0 with a step of 1; 10; 100; 1000; 10000 (see Fig. 17).
"X2:" parameter variation allows to change the angle position of threshold
level in X2-direction. X2 parameter variation is carried out in the range from
0 to 32768 with a step of 1; 10; 100; 1000; 10000 (see Fig. 17).
"Y1:" parameter variation allows to change the angle position of threshold
level in Y1-direction. Y1 parameter variation is carried out in the range from 32768 to 32768 with a step of 1; 10; 100; 1000; 10000 (see Fig. 17).
"Y2:" parameter variation allows to change the angle position of threshold
level in Y2-direction. Y2 parameter variation is carried out in the range from
32768 to
- 32768 with a step of 1; 10; 100; 1000; 10000 (see Fig. 17).
Select the frame polarity "Pol:", which makes the alarm trigger:
– the signal gets beyond the limits of the threshold level
– the signal is within the limits of the threshold level.

© PCE Instruments
33
English
4.6 Guidelines for Overload Processing
4.6.1 For the Input – "Refl", "Bridge":
4.6.1.1 Reduce the probe drive;
4.6.1.2 Perform the probe balance by pressing key.
4.6.2 For the Input – "Single":
4.6.2.1 Choose the capacitor by pressing key
4.6.2.2 Perform the probe balance by pressing key;
4.6.2.3 If the recommendations specified in paras 4.6.2.1-4.6.2.2 didn`t resolve the
overload, then it is necessary to reduce the probe drive and repeat paras 4.6.2.1-
4.6.2.2.
Lightning of the right overload indicator (pos. 10, Fig. 8) – indicates the
general overload of the input of the receiving circuit. General overload may
include: overload by the input of the receiving circuit (exceeding the
maximum allowed signal amplitude at input of the receiving circuit), ADC
overload (exceeding the maximum allowed signal amplitude at ADC input).
4.6.3 For the input – "Refl", "Bridge" and "Single":
4.6.3.1 If the left indicator lights, then repeat the steps described for overload processing
for the left indicator (see above);
4.6.3.2 If the right indicator lights only, then it is required alternately reduce the “ PRE
AMP” and “ GAIN”. After each gain change it is required to press key.

© PCE Instruments
34
English
4.7 "Conductivity" Mode
Basics of Conductivity
The SI derived unit for conductivity is the Siemen per meter, but conductivity values are often
reported as % IACS. IACS is an acronym for International Annealed Copper Standard, which is
the material used to make traditional copper electrical wire. The conductivity of the annealed
copper is 5.8 x 10⁷ S/m and copper is defined to be 100 % IACS at 20 °C. All other conductivity
values are related back to this conductivity of annealed copper.
Conductivities of metals at ambient temperature are typically in the range of 1 to 60
MegaSiemens per meter.
The PCE-USC 30 measures the conductivity of non-magnetic metals and alloys in the range 0.8
to 110.0 % IACS. It uses the Eddy Current technique for measuring the conductivity of materials
in % IACS, or MSiemens/meter.
It is important to understand that eddy current measurement is essentially a ‘skin’ effect.
The eddy current field intensity is greatest at the surface and decreases exponentially with
depth. The depth at which the field strength reduces to 1/e (37 %) of its surface value is referred
to as the ‘standard depth of penetration’. This depends primarily on the operating frequency and
the conductivity of the metal.
It is generally considered that materials of thickness greater than 3 standard depths of
penetration can be measured without any correction factors being required. For example, at 60
kHz this figure (the “effective depth of penetration”) is around 0.05” (1.25 mm) in Aluminium
Alloys (conductivity approximately 35 % IACS) and 0.32” (8 mm) in Titanium alloy, (conductivity
approximately 1% IACS). At 500 kHz the corresponding values are 0.02” (0.5 mm) and 0.11”
(2.8 mm).
Care must also be taken when measuring non-homogeneous materials, for example materials
which have been surface heat-treated, clad or plated, or where the surface is rough or corroded.
Measurements at different frequencies will give different results due to the different distribution
of energy within layers of different conductivity. Care must be taken to always measure such
materials at the same frequency (usually 60 kHz).
Setting up the device for measuring the conductivity and the thickness of nonconductive coatings
To use the PCE-USC 30 for Conductivity measurement requires the following:
- PCE-USC 30 flaw detector;
- Standard 60 kHz Probe (CP-13) and Cable (Lemo 12 - Lemo 04 Conductivity).
Conductivity standards of known value in a range from 0.59 MS/m (1.02 % IACS) to 63.8 MS/m
(110 % IACS). To connect the flaw detector with Cable and the eddy current probe CP-13 for
measuring the electrical conductivity.
Connect the flaw detector with cable and the eddy current probe CP-13 for measuring the
electrical conductivity.
ATTENTION! THE INSTRUMENT SETUP AND ELECTRIC CONDUCTIVITY
MEASUREMENT SHOULD BE CARRIED OUT AT AN AMBIENT AND TEST OBJECT
TEMPERATURE OF 20 ˚ С (68 ˚ F). BEFORE CARRYING OUT THE SETTING UP
PROCEDURE AND ELECTRIC CONDUCTIVITY MEASUREMENT, IT IS REQUIRED THAT
THE INSTRUMENT TO BE OPERATED AT LEAST OF 15 MINUTES AT A TEMPERATURE
OF 20 ˚ С (68 ˚ F).

© PCE Instruments
35
English
To press the button for entering the instrument menu «SETTINGS» and to choose «Test
mode» - «CONDUCTIVITY».
Fig.18 – “Conductivity” Test Mode
To press to enter the «TEST» menu. In the menu «TEST» under the position «Current
set», to choose by , buttons the appropriate setting for the measurement at a
specified frequency and to press the button to activate the settings. «CP13 – 60 kHz»;
«CP13 – 480 kHz».
Fig. 19 – Choosing and activating Settings “CP 13 – 60 KHZ”
After settings activation make calibration at standard samples
Note – For setting up procedure, use certified calibration blocks only.

© PCE Instruments
36
English
To determine the material by its conductivity the setting up samples should generate the range
of the conductivity, wherein the first sample value is lower and the second sample value is
higher than the conductivity of the material being measured.
Conductivity measurement tolerances are:
- ±0.5 % IACS [±0.3 MS/m] for the conductivity range from 0.9 % to 62 % IACS [0.5 to
36 MS/m];
- ±1.0 % IACS [±0.6 MS/m] for the conductivity range from 62 % to 110 %.
Tolerances for coating thickness measurement:
- ±1 mil [±0.0254 mm] for the thickness range 0-20 mil [0-0,508 mm].
Note – The narrower the range is, formed by the setting up samples, the more accurate
is the measurement.
Before beginning the calibration at the positions of Cond 1 (the lower conductivity value) and
Cond 2 (higher conductivity value) there must be set the values of the conductivity of the
samples, which will be calibrated, using the , buttons.
To set up the coatings thickness measurement there must be used the 20 mil [0.5 mm] film
thickness. Gap value is 20 mil [0.5 mm] to be set.
For beginning the calibration - to press the button and to follow the instructions displayed
on the screen of the flaw detector.
Hold the eddy current probe in the air at a considerable distance from metal objects and press
.
Set the eddy current probe on the sample with Cond 1 conductivity and press .
Figure 20 – Entering the conductivity value for the sample Cond 1
Set the eddy current probe on the sample with Cond 2 conductivity and press .

© PCE Instruments
37
English
Figure 21 – Entering the conductivity value for the sample Cond 2
To put on the sample with Cond 1 conductivity the gap element (20 mil [0.5 mm]), set the eddy
current probe on the sample and press .
Figure 22 – Entering the gap value for setting on the Cond 1 sample
After carrying out the setting up procedure, you can proceed with the measurement of electric
conductivity at real objects. During the operation it is required periodically to check the accuracy
of measurement of electric conductivity at calibration blocks.
In case, the value measured at calibration block differs from the nominal one and exceeds the
measurement tolerance, then it is required to reactivate the operating setup and perform the
adjustment at calibration blocks.
Note. In case, the ambient and test object temperature will be different from 20 ˚С (68˚
F), then the displayed value will be with an error.

© PCE Instruments
38
English
Setting up the threshold level in the mode of electric conductivity measurement
- set up the low value of electric conductivity Min;
- set up the high value of electric conductivity Max;
- set up the trigger logic for threshold level:
-light and sound ALARM shall be triggered, when the measured value of electric conductivity
gets into the middle of a selected range
Min – Max;
light and sound ALARM shall be triggered, when the measured value of electric conductivity
gets beyond the selected range
Min – Max.
Measuring Conductivity and Coating Thickness with the PCE-USC 30
Guidelines for successful operation:
- For accurate measurement of conductivity, the surface coating thickness should be
0.5 mm (0.020 inches).
- The surface to be measured should be flat, or of the same curvature as the calibration
standards. Where curved surfaces must be measured, additional error may be
introduced.
- Measurement close to edges and on thin materials may give erroneous results.
- Check on a known consistent material to establish the influence of these effects.
- The coating thickness measurement function does not require further calibration, it
should be accurate to better than 10 % of the displayed value on base materials
having a conductivity between approximately 1 % and 100 % IACS.
- The electric conductivity measurement should be carried out at an ambient and test
object temperature of 20 ˚ С (68 ˚ F).
4.8 “General Settings” Menu
When selecting "General settings" menu, the flaw detector displays the window with margins for
the flaw detector settings correction
Fig. 23 – “General Settings" menu

© PCE Instruments
39
English
An operator sets the following values in the corresponding menu lines:
- "Test mode" – test mode. Can be "Expert" and "Simple". In "Simple" mode the part of
operating settings is not displayed.
- "Max smp frequency" – measurement frequency for the "TEST" mode. Samplings frequency in
Hz (sampling frequency of ECP per 1 second) from 1 kHz to 10 kHz. If the value of the selected
frequency from a fixed number of measurement set a given operating frequency of ECP is not
supported, then the instrument will automatically determine the maximum possible frequency of
measurement.
- "Double frequency mode" – activated when there is a possibility to remove the interfering
factor by means of frequencies mixing.
- "Persistence" – time value, on the expiry of which all data on the flaw detector screen is
deleted (at the switched on "Persistence"), from (0.1 s, 0.5 s, 1 s, 2 s, 3 s, 4 s);
- "Сolor scheme" – 1. "Light" - for operation with faint outer lighting; 2. "Dark" - for operation with
intense outer lighting; 3. "Standard" – standard scheme.
- "Brightness" – display brightness in % - from 10 to 100 with a step of 10%;
- "Rounds"– the number of full turns of rotating ECP displayed in time chats.
- "Sound" – sound alarm if the ALARM triggers.
- "Language" - language selection.
- "TRIGGERING":
1) Internal – synchronization from inner generator;
2) Enc – synchronization from encoder;
Cenc (pulses/mm)4 – number of pulses per 1 mm generated by encoder – from 10 to10000
pulses/mm with a step of 1; 10; 100; 1000 pulses/mm;
- N meas/mm – number of measurements per 1 mm.
- "Input" – active connector for ECP – 1) Single (for single coil ECP), 2) Refl (for other ECP);
- "Date" – selection of current date (year, month, date);
- "Time" – selection of current time (hours, minutes, seconds)
4 Cenc value (pulses/mm) is indicated in the registration certificate for the scanning device
where an encoder (Enc) is used

© PCE Instruments
40
English
4.9 View
When entering "VIEW" menu, an operator is offered to view and analyze current testing results
as well as the saved results. In order to view the current testing results, it is necessary to press
key.
Fig. 24 – "VIEW" menu
Note. To view previously saved testing results, it is necessary to press key, choose
the "RESULTS" submenu and press key. Then, move the cursor to the certain result and
press key – "F1 Load". Then, an automatic enter in "VIEW" is carried out.
Position “Position” – moves the measurement cursor in the time chart.
Position “Width” – sets the width of the measuring cursor.
Position “Type” – the type of cursor measurement. Four types of measurement are available.
° Pk-Pk – the measurements are made between two points situated at the max. distance from
each other in cursor width.
° Cnt-Pk - the measurements are made between the cursor centre and the point situated at the
max. distance from the centre in cursor width.
° Cnt-K - the measurements are made between the centre and the cross point of cursor centre
signal.
° Vrt-M – vertical maximum - the measurements are made between two points situated at the
max. distance from each other in the cursor width in vertical projection.
Position “Measurer” – is intended for meter signal parameters displaying in complex plane.
Position “Scan” – is for changing the number of points in a strip chart. When moving the cursor
in the strip chart, the complex plane display is updated with the signal, which is located within
the cursor width. The values of amplitude in volts, phase in degrees and defect depth in
millimetres or percent are displayed in the information line.
© PCE Instruments
41
English
Note. The flaw detector has a feature, which allows the quick signal/noise ratio
measurement. In order to measure the ratio, first place the measuring cursor on defect free-area
in the strip chart and press – defect free area "F1 An" key, then move the centre of
measuring cursor to the signal peak from a defect. The result appears in the right bottom corner
of the flaw detector electronic unit at the "К= …" position, the measured signal/noise ratio will be
displayed.
In the view menu it is possible to estimate the saved or just taken data; carry out the
assessment of detected defects depth. By changing the position of measuring cursor, change
the cursor width in such way that the signal from defect stays within the cursor width. In this
case, the amplitude “A: ”, phase “P: ” and estimated defect size in millimetres or percent “D: ”
will be displayed in the flaw detector bottom information bar; the path data in mm will be
displayed in the top panel during the testing with ENC. By moving the cursor to the next signal
from defect, the data corresponding to the marked defect will be displayed on the screen.
The depth of the defect will be displayed only if the correct calibration curve is created!
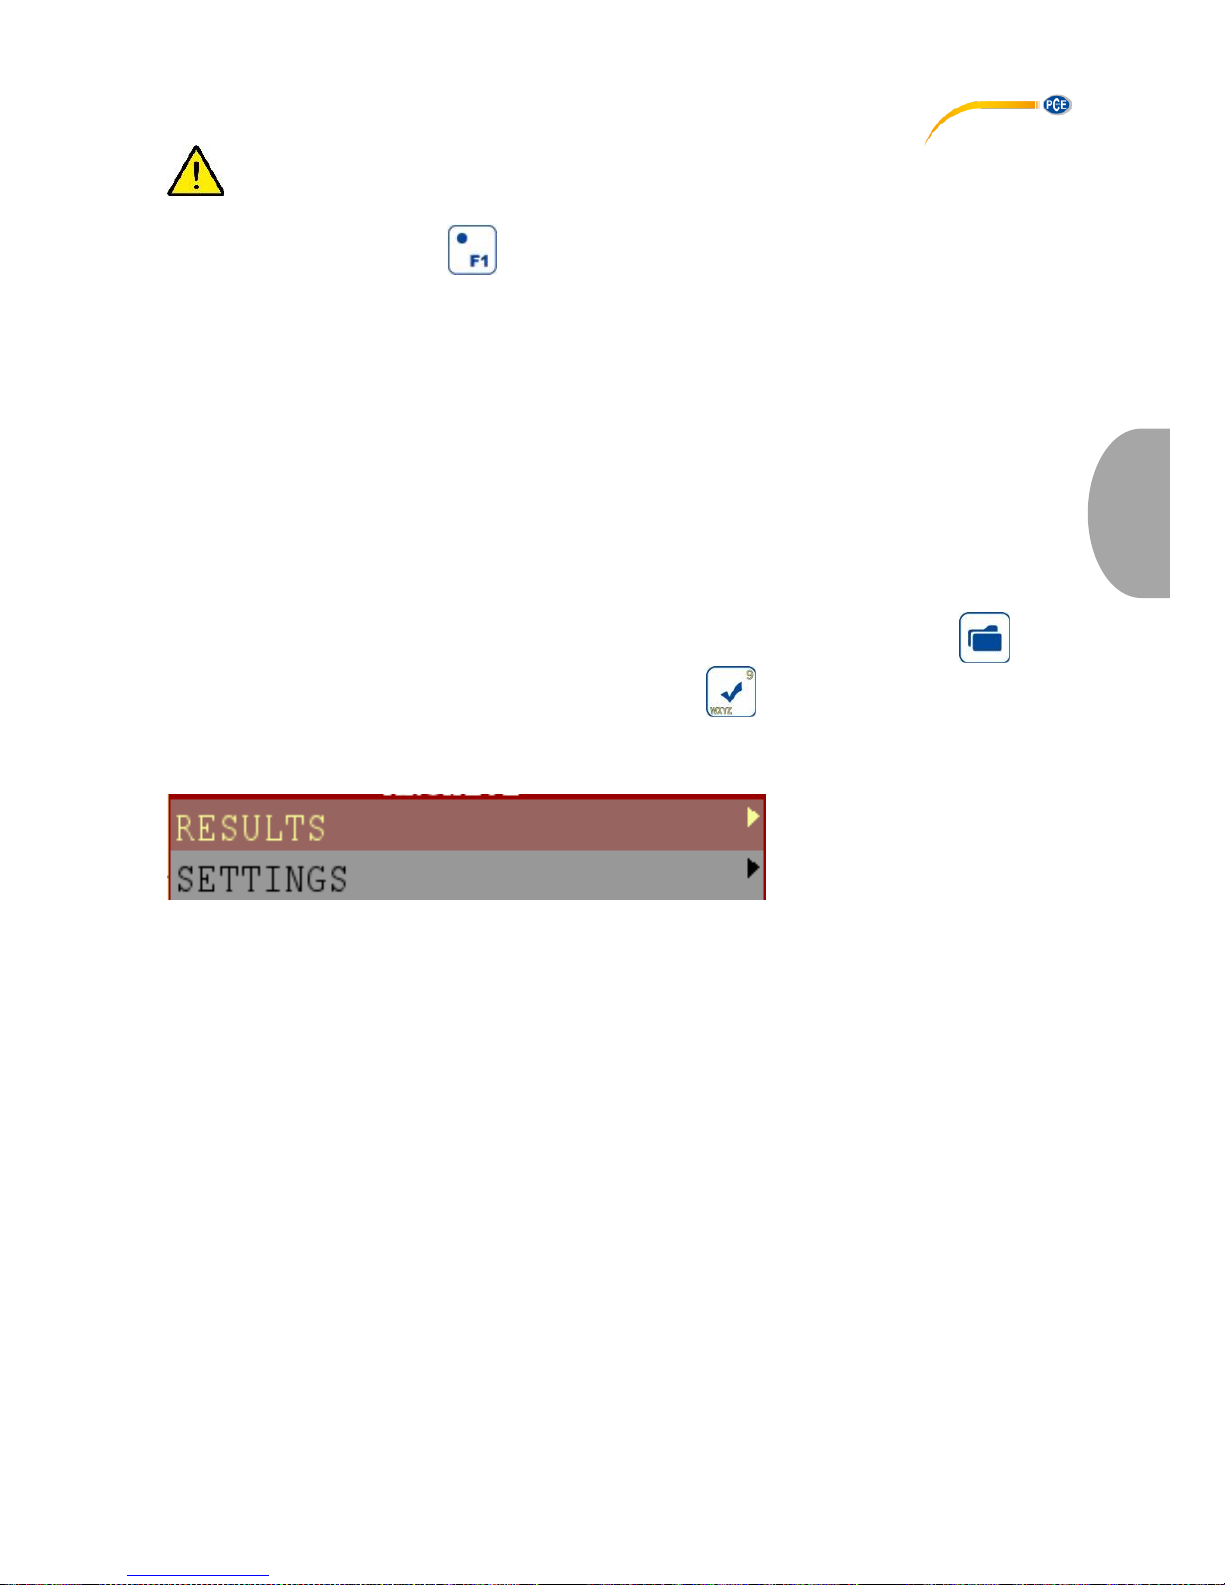
4.10 “Memory” Menu
In order to load/save testing results or device settings, it is necessary to press - key,
choose submenu "RESULTS" or "SETTINGS" and press key. The flaw detector is capable
of storing of more than 1000 settings and up to 1000 testing results (depending on the
defectogram size) in the memory.
Fig. 20 – "RESULTS" menu
© PCE Instruments
42
English
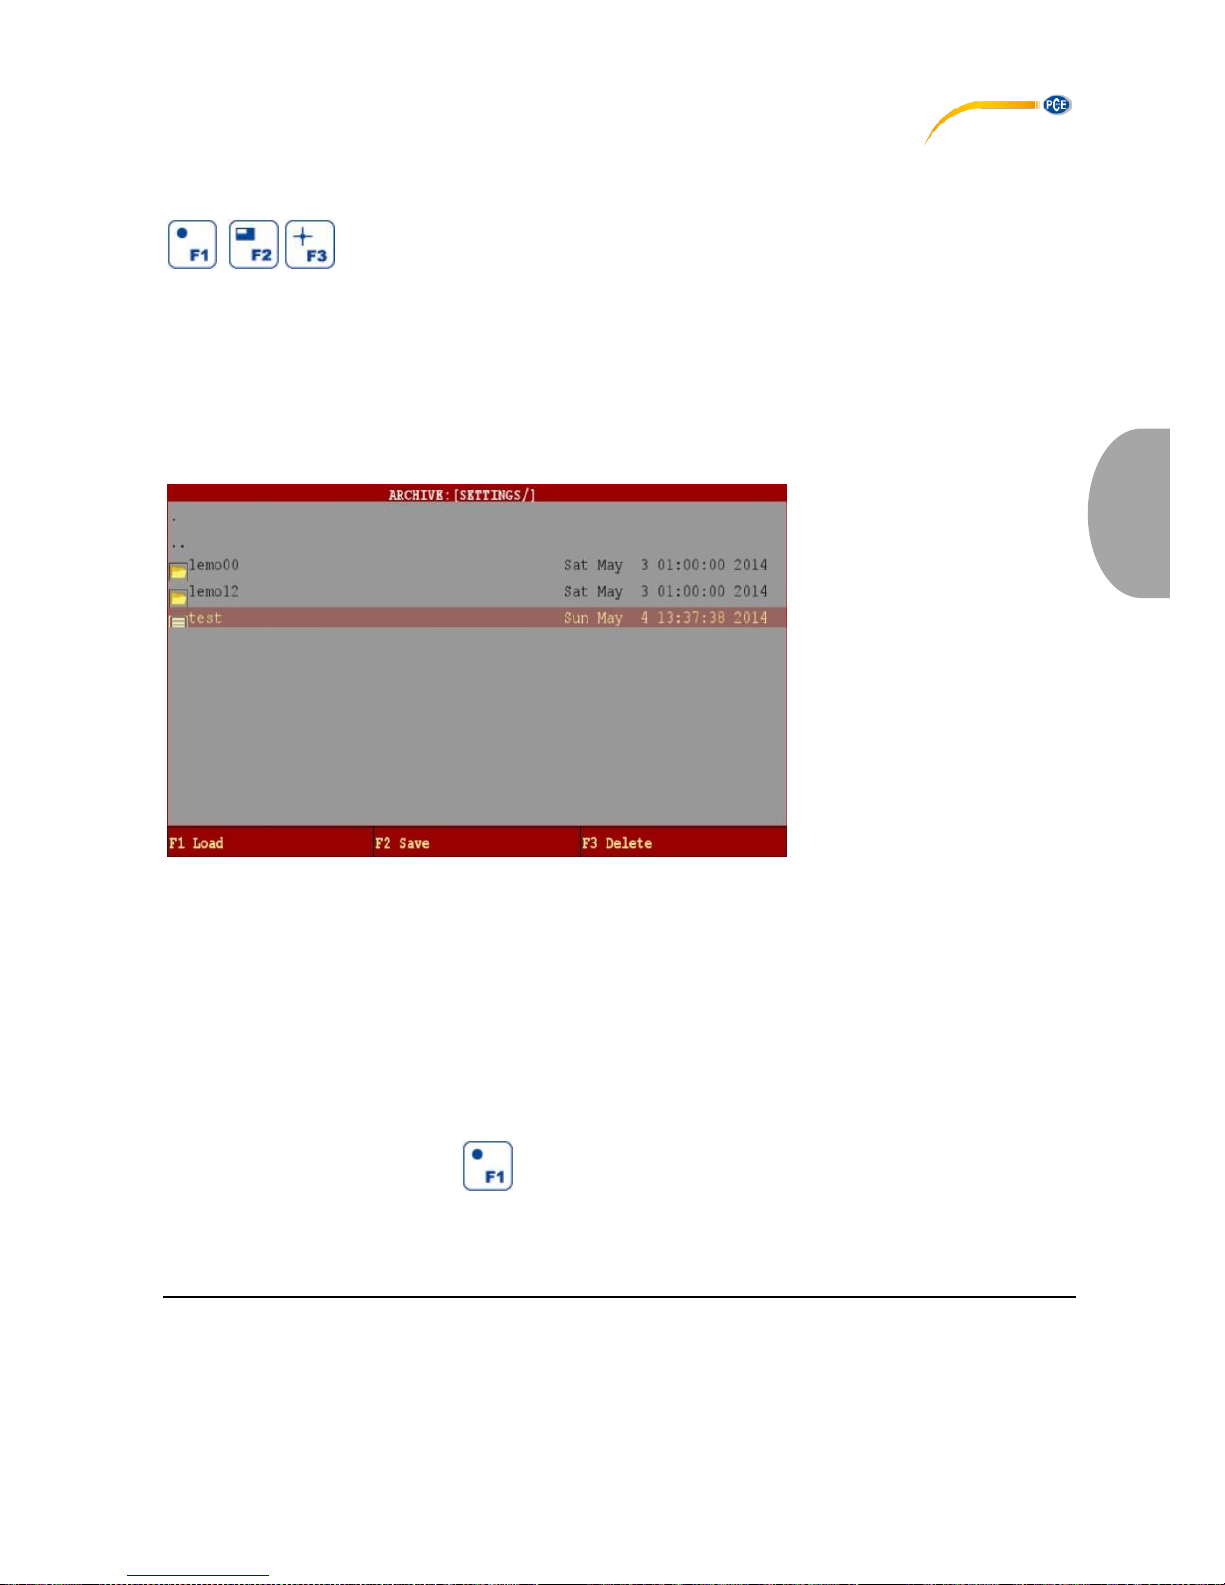
4.11 “Results” Menu
The given menu allows storing and loading of the testing results.
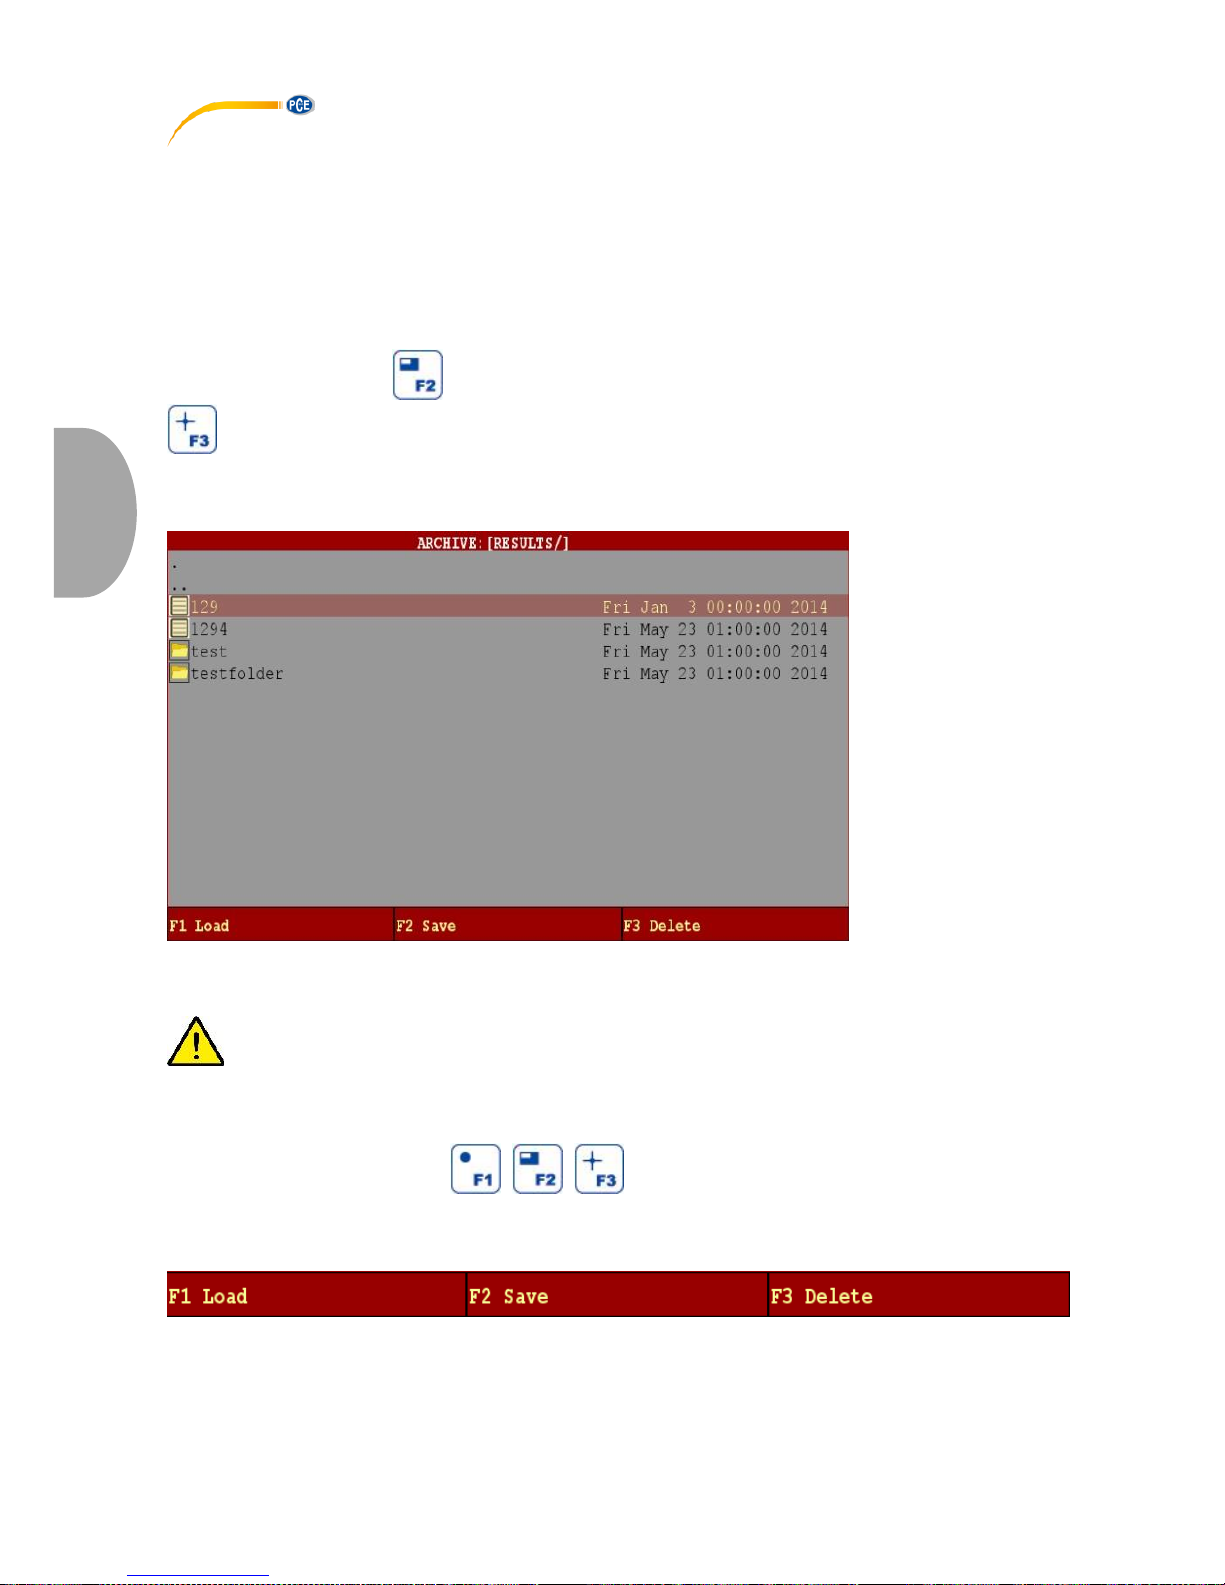
In selecting "Results" menu the flaw detector displays the window with a list of results (Figure
26). The list of results contains catalogues (folders) and files. The catalogues are displayed in
the top part of the list (and are marked with the folders icon), the files – in the bottom part and
are numbered. The catalogues, in their turn, can comprise subdirectories and files.
A new catalogue is created by placing the cursor on the line with colon or on the existing
catalogue and pressing key ("F2 Create"). The existing catalogue is deleted by pressing
key ("F3 Delete").
Having placed the cursor on an empty string or on the existing file, function keys change their
function for the operation with files of results or settings.
Fig. 26 – "RESULTS" menu. List of catalogues and files
Note. To prevent an accidental deleting of catalogues with useful information, the flaw
detector has a protection, which allows only empty catalogues deleting. In order to delete the
catalogues, firstly you need to delete its contents.
With the help of function keys , , – "F1 Load", "F2 Save",
"F3 Delete" (see Figure 27) – an operator can load the selected result (settings and data are
automatically loaded), save the current result and delete the selected result.
Fig. 27 - Operations with the testing results
© PCE Instruments
43
English
When loading the saved testing results, the setups which were used while the testing are set in
the instrument and the automatic transition (move) to "VIEW" menu is carried out.
When saving the results (and anywhere where it is necessary to enter the text information), "
, , " function keys delete the previous character – "backspc", move left – “move”
and cancel the information input – "cancel".
4.12 “Settings” Menu
When selecting "Settings" menu the flaw detector displays the window with a list of settings (see
Figure 23). The given menu allows the testing results saving and loading.
After a setups file loading, automatic enter in "Testing" menu is carried out.
Fig. 28 – "Settings" menu
4.13 Set up of “Calibration” Menu
The calibration curve plotting will be illustrated using the calibration block. To plot the calibration
curve, it is essential to set up all parameters of the flaw detector for operation with a specific
probe (i.e. select the ECP operating frequency from the range indicated in the registration
certificate, the required ECP exciting voltage, gain, scale) and take the calibration block (Ra
1.25).
In the "TEST" menu place the ECP on the flaw-free section before an artificial flaw with the
depth of 0.1 mm5 and press key (balancing). Pass all defects, having chosen such
scanning speed to have all signals from defects of regular shape (i.e. max symmetric relative to
the peak signal on time charts, see Figure 29).
The signals from the defect are not bound to stay only within the limits of one screen scan.
5
When operating with MDF probes, the mark on ECP case must coincide with the direction of
scanning trajectory.

© PCE Instruments
44
English
Fig. 29 – Appearance of defectogram for the calibration curve plotting
After the acquisition of defectogram, press key, for the quick transition to "CALIBRATION"
menu.
1 - Set a curve for evaluation of the defect depth (Amplitude, Phase);
2 - Select the units of defect measurement (mm, %);
3 - Calibration marker by the registered calibration blocks;
4 - Calibration block selection
5 - Position of the measuring cursor on the time chart;
6 - Width of the measuring cursor on the time chart;
7 - The type of the measuring cursor, see item 3.9

© PCE Instruments
45
English
Fig. 30 – "Calibration" menu
Note. After plotting the calibration curve, there is no point in changing the units of defects
measurements.
Before plotting the calibration curve, it is necessary to delete all points of previous calibration
curve by pressing key.
Select the type of measurement in the cursor "Type" – Pk-Pk. Move to the "Position: " menu
item and by the , and keys, position the central line of the cursor on the peak of
signal from the min defect. Move to the “Width:” menu item and increase the cursor width to
such an extent that only one friendly signal could get there, i.e. the signal from the defect (see
Figure 31). Having placed the cursor on a defect, press the key – add the calibration
curve point.
With the help of , keys, move to the "CURVE POINTS" – 1) and by , and
keys, set the depth of the first defect of the calibration curve, i.e.0.1 mm (see Fig. 31).
Then it is essential to perform similar operations for all other defects by setting corresponding
depth.
Fig. 31 – Plotting of the calibration curve

© PCE Instruments
46
English
Each newly added point of the calibration curve is assigned with a number (1), 2), 3) and so on).
The max number of the calibration curve points – 128.
Note. If calibration is carried out on any of the listed calibration blocks in pos. 4, Figure
30, then an operator can easily activate marker STD (pos.3, Fig. 30) and select an appropriate
type of the calibration block before adding of the calibration curve points. Then add in order,
starting with a minimum, all signals from defects of a given calibration block and the flaw
detector will automatically assign the wanted depth to the defects.
4.14 Communication with PC
The flaw detector in a set with "PCE-USC 30" software ensures communication mode with a PC
for the information input to the PC from the flaw detector memory (testing results, operating
setups) and the possibility to print out this information and to form a report.
4.14.1 Running the Program
To run the program it is required:
- to copy the files to the PC hard disk drive from the disk, that is included to the flaw detector
delivery set;
- run the file “.exe”.
4.14.2 Program Description
The operating window of the program includes the following areas (Fig. 32):
1 - main menu; 2 - tab panel; 3 - time diagrams area; 4 – signal display area (active area); 5 –
bottom status bar
Fig. 32 – Active window of PCE-USC 30 program

© PCE Instruments
47
English
4.14.2.1 Main Menu
Main menu bar includes the following menu items:
- File;
- Report.
"File" menu item includes the subitems:
Fig. 33
When selecting "Open" subitem, there appears a window for selection the path to the saved
testing results (by default the "RESULTS" folder is proposed, saved on the hard disk drive of PC
in the program directory of «PCE-USC 30»).
This file can be located in the flaw detector memory or also be stored on hard disk drive of PC
(if previously copied to the hard disk drive (4.14.3.2)). Double-click of the mouse left button
opens the file.
"Loading" subitem allows to view the files of all testing results saved in the flaw detector
memory and to copy them to the hard disk drive of PC (4.14.3.2).
When selecting "Device settings" subitem, there appears a window with the flaw detector
settings of the carried-out testing (Fig. 34).
Fig. 34 – “Flaw detector settings” window

© PCE Instruments
48
English
When selecting "Language" subitem, there appears a window for selecting the language of
program interface.
Fig. 35 – “Selecting the interface language” window
Note – Reload the program to change the interface language.
Select "Exit" subitem to finish the "PCE-USC 30" program.
When selecting "Report" item of the main menu, there appears a window for filling in the report
form of the testing carried out (Fig. 36).
Fig. 36 – Report form of a testing carried out

© PCE Instruments
49
English
After pressing button, there appears a window to preview the testing protocol.
There is an option to select between: weather to print out the setting parameters of the flaw
detector or not.
To abstain from printing out the flaw detector settings, put a tick in front of "Disable setting".
To print-out the testing protocol, press "Print" button in the upper part of a testing
protocol window.
To save the testing protocol in a «*.pdf» format, press button.
To exit the review mode of a testing protocol it is required to press button.
4.14.2.2 Tab Panel
Tab panel includes three tabs. Each tab corresponds to the selected frequency or to the mix of
frequencies (MIX): Frequency 1, Frequency 2, MIX.
Note - Frequency 2 and MIX are available for viewing only if the testing is carried out in a
two-frequency mode.
4.14.2.3 Time diagram area
Two diagrams of signal to time dependence are displayed in time diagram area (item 3, Fig. 32).
4.14.2.4 Signal display area (active area)
In the display area of eddy current signals is displayed the eddy current signal, which is
represented by an image in the complex plane for the frequency selected (item 4, Fig. 32). In
the active area are displayed the signals that come into the area covered by the measuring
cursor.
4.14.2.5 Bottom status bar
Fig. 37
"Duration of time sweeps" – sets the number of measurements to be displayed on time
sweeps. Duration of time sweep is measured in a range from 256 to 32768.
“Type of measurement” – allows to select the required type of cursor measurement from the
following list:
- Peak-Peak (the measurement is made between two points situated at the max. distance from
each other in cursor width);
- Vrt-M (vertical maximum – the measurement is made between two points situated at the max.
distance from each other in cursor width in vertical projection);
- Cnt-Pk (centre peak - the measurements is made between the cursor centre and the point
situated at the max. distance from the centre in cursor width);
- Cnt-K (centre cursor - the measurements is made between the centre and the cross point of
cursor centre signal);

© PCE Instruments
50
English
ENC (encoder) – displays the reference number by encoder when synchronizing from ENC.
Cursor position – displays the current vertical position of a measuring cursor in readings.
Fig. 38
To change the cursor position, it is required to place the "mouse" cursor onto the centre of a
measuring cursor (item 2, Fig. 38), and when there is a cursor, move the measuring cursor
to the required position by holding the left mouse button down.
- Cursor width – displays a set width of a measuring cursor (in readings).
To change the width of a measuring cursor, place the "mouse" cursor to the extreme position of
the measuring cursor (item 1, Fig. 38), and, when there is a cursor, set the required width of a
measuring cursor by holding the left mouse button down.
"Signal angle" – allows to change the signal phase:
- selects the step for signal phase change (from 0 to 90°);
- changing the signal phase with counter clockwise rotation considering the selected
step;
- changing the signal phase with clockwise rotation considering the selected step;
- restoring the initial signal phase.
Scale (HV) - simultaneous horizontal and vertical scaling of a signal image:
- scaling-up the signal image;
- scaling down the signal image;
- restoring the initial horizontal to vertical ratio.
Scale (H) – allows to adjust the horizontal scaling of a signal image:
- scaling-up the signal image horizontally;
- scaling down the signal image horizontally;

© PCE Instruments
51
English
- restoring the initial scale horizontally.
Scale (V) - allows to adjust a vertical scaling of a signal image:
- scaling-up the signal image vertically;
- scaling down the signal image vertically;
- restoring the initial scale vertically.
Signal parameters located in a measuring cursor are displayed in information area of a bottom
status bar:
− Amplitude (V);
− Phase (deg.);
− D (mm) - conditional defect depth;
− Аn (dB) - noise amplitude;
− S/N – measured value of signal to noise ratio.
Note – In order to measure the S/N ratio, place the measuring cursor on defect free-area
and press "An" key, then move the measuring cursor to the signal peak from the defect. The
measured signal/noise ratio will be displayed in the amplitude area.
4.14.3 Working with the program
4.14.3.1 Connecting the flaw detector to PC
Connect the flaw detector to PC using the USB connecting cable that is included to the flaw
detector delivery set.
Switch on the flaw detector by pressing the power On / Off button and hold it pressed until
a short beep sound is emitted.
Wait until the flaw detector is recognized on PC as a removable media (when the flaw detector
is recognized as a removable media, it is displayed on PC screen).
4.14.3.2 Saving the testing results from the flaw detector memory to PC
To save the testing results from the flaw detector memory to PC, connect the flaw detector to
PC using a USB cable (item 4.14.3.1). In the menu of «PCE-USC 30» program select the item
"Loading", and after, in the program window there are displayed the files of all the testing
results stored in the flaw detector memory. Then, the program window asks to select the files
that can be automatically copied to the selected location on the hard disk drive of PC.

© PCE Instruments
52
English
4.14.3.3 Viewing results of testing
Download «PCE-USC 30» program to PC.
In "File" item of the main menu choose the sub-item "Open".
In the window that appears, choose the path to removable media – the flaw detector memory or
the path where previously there was stored data on PC, move the cursor to the necessary file
with the testing results and click "Open".
After opening the file in the time diagrams window and in the active area of the program there is
displayed the stored defectogram and there is the possibility to view the testing results,
measurements of the signal parameters, as well as to make the report protocol followed by its
printing out.
Note - Viewing a list of data on the testing results from the flaw detector memory does
not store this data automatically in PC memory.
4.14.3.4 Printing out results of testing
To print out the testing results it is required:
- Select "Report" item in the main menu.
- Fill in the report form (Fig. 36).
- In the preview window of testing results click "Print" .
4.14.3.5 Disconnecting the flaw detector with PC
- Turn off the flaw detector by pressing the On / Off button .
- Disconnect the USB cable.
5 Labelling and Sealing
5.1 The flaw detector labelling complies with the manufacturer’s set of documents and
includes:
- manufacturer’s name and trade mark;
- name and designation of the flaw detector;
- year and quarter of manufacture;
- serial number;
- designation of specifications (TU);
- pattern approval mark.
Labelling is performed in English.
5.2 Labelling is made on the flaw detector casing by polygraphic technique.
5.3 Pattern approval mark is made on the flaw detector electronic unit by at least two seals
made on screws of casing cover.

© PCE Instruments
53
English
6 Composition and Delivery Set
6.1 Basic delivery set consists of the following components:
Table 8
Name and reference designation
Quantity
PCE-USC 30 electronic unit
SS340K09DA0 eddy current probe in protective case
Connection cable (Electronic unit/ECP)
Connection cable (PC/electronic unit)
Automatic charger Mascot
Calibration block SOP 2353.08 (Rz 40, D16T)
Case
Label for ECP
EC Probe CP13 (for conductivity measurement)
Cable Lemo12-Lemo04, 1200 mm
Documentations
Operation manual for ES.14327992.01.13 RE
Operation manual for Mascot
Passport for SOP 2353.08 PS (with roughness Rz 40,
material-D16T)
* Can be complemented with probes from the Appendix B.
** Quantity is according to ordered ECPs.
7 Setting-up procedures
7.1 The flaw detector is operated by one operator who has a corresponding level of
qualification and has studied the present operation manual.
7.2 Before operating charge the battery of flaw detector (if required) governed by the
passport of automatic charging device.
ATTENTION! WHEN CHARGING THE BATTERY, FLAW DETECTOR ELECTRONIC
UNIT MUST BE SWITCHED OFF.

© PCE Instruments
54
English
8 Instructions for Use
8.1 Single Coil Probe
1. Connect the ECP to the flaw detector using a connecting cable.
2. Set the ECP frequency in a range specified in the registration certificate for the ECP.
3. Set the ECP drive not more than 2 V.
4. Press key to select the capacity.
5. Place the ECP to the flaw-free area of a calibration block.
6. Press key to balance the ECP.
7. Put a signal from a lift-off in the horizontal plane. For this, it is necessary to decline the ECP
from the vertical axis at an angle of 15-45 ˚. While the vector end is deviated, press key. In
case, if the first attempt to put the signal from the lift-off horizontally failed it is necessary to
repeat the steps described above, or put the lift-off signal manually using the phase change (
parameter). The signal from a defect should be appeared in the first or second quadrant
of the complex plane.
8. By increasing the gain on preamplifier and amplifier you should maximize the
signal amplitude, but at the same time monitor behind parameters of the input circuit.
9. After changing any parameter that affects the absolute value of the signal it is necessary to
perform balancing by pressing key.
10. While testing aluminium alloys it is recommended to use the vertical gain " V GAIN" for
the visual spread of signals from the distortion and signals from a defect in a phase.
11. Select the required type of a threshold level.
12. Move the probe across the artificial defect at calibration block for several times and visually
set up the ALARM relative to the signal from the defect. After the ALARM was properly set up,
the light alarm while detecting the defect will be triggered on the flaw detector keypad (digital
indicators on the display) and sound alarm (if it has not been turned off in "SETTINGS" menu).
8.2 Reflection, Differential Probe
1 Connect the ECP to the flaw detector using a connecting cable.
2 Set the ECP frequency in a range specified in the registration certificate for the ECP.
3 Set the ECP drive not more than recommended in a registration certificate for the ECP.
4 Place the ECP to the flaw-free area of a calibration block.
5 Press key to balance the ECP.
6 It is recommended, the signal from the defect to be placed in the first or second quadrant of
the complex plane. To correct the ECP phase use parameter.
7 Increasing the gain on preamplifier and amplifier you should maximize the signal
amplitude, but at the same monitor behind parameters of the input circuit.

© PCE Instruments
55
English
8 After changing any parameter that affects the absolute value of a signal it is necessary to
perform balancing by pressing key.
9 Select the required type of a threshold level.
10 Move the probe across the artificial defect at calibration block for several times and visually
set up the ALARM relative to the signal from the defect. After the ALARM was properly set up,
the light alarm while detecting the defect will be triggered on the flaw detector keypad (digital
indicators on the display) and sound alarm (if it has not been turned Off in "SETTINGS" menu).
8.3 Rotation Probe
1. Connect the rotary scanner to the flaw detector using the connection cable.
2. Connect the ECP to the rotary scanner. Approximate marks on the case of the probe and
scanner should coincide.
3. Without applying excessive force insert the ECP in the scanner. In case, when carrying out
the connection you felt that the mating connectors have rested at each other, but the marks on
the cases match, you must slightly decline the ECP from the vertical axis and insert the ECP
until it stops. When the ECP is properly placed in the scanner, the o-rings should not be seen.
4. Set the ECP frequency in a range specified in the registration certificate for the ECP.
5. Set the ECP drive not more than recommended in a registration certificate for the ECP.
6. At "ROT PRESENT" position, set up "On". In displayed menu choose the type of the rotary
scanner and press key.
7. At "RРМ" position, firstly set the min rounds – 600.
8. Press the switched On button on the case of the rotary scanner. The ECP should be in the
air.
9. To set the scanner rounds properly, press key and wait for the end of the procedure.
10. Press the switched On button of the rotary scanner.
11. Set the required rounds for the scanner.
12. Put the ECP into the hole of the calibration block.
13. Press the switched On button on the case of the rotary scanner.
14. Press key to balance the ECP.
15. It is recommended, the signal from the defect to be placed in the first or second quadrant of
the complex plane. To correct the ECP phase use parameter.
16. Increasing the gain on preamplifier and amplifier maximize the signal amplitude,
but at the same monitor behind parameters of the input circuit.
17. After changing any parameter that affects the absolute value of the signal it is necessary to
perform the balancing by pressing key.
18. Select the Bandpass filter and perform it`s setting. First of all, minimize the distortion signals
from ECP in the hole by setting the "LB" parameter, and then proceed the "HB" setting. The
filter is set by trial and error.
19. During the ECP rotation in a hole perform the ALARM setup. Visually set the ALARM
relative to the signal from a defect. After the ALARM was properly set up, the light alarm will be
triggered on the flaw detector keypad at detecting the defect (digital indicators on the display)
and sound alarm (if it has not been turned off in "SETTINGS" menu).

© PCE Instruments
56
English
9 Maintenance
9.1 The flaw detector maintenance includes the maintenance inspection, operating repair
and calibration.
9.2 Intervals between the maintenance inspections are set depending on the industrial
conditions, but no less than once per month. Connecting cable fixation, condition of
controls and indicators are checked during the maintenance inspection.
9.3 The maintenance inspection includes an external examination and is performed by
attending personnel before starting the flaw detector electronic unit operation.
9.4 Replacement of the battery pack.
9.4.1 Unscrew two screws (item 1 Fig. 39).
Fig. 39

© PCE Instruments
57
English
9.4.2 Open the contact terminal (item 1 Figure 40), pressing the clip (item 2 Figure 40).
Fig. 40
9.4.3 Remove the battery pack (item 1 Figure 41).
Fig. 41
9.4.4 Battery pack mounting is carried out strictly in reverse order.

© PCE Instruments
58
English
10 Typical Failures and Troubleshooting
10.1 The list of the most common and probable failures is given in Table 9.
Table 9 – Typical failures and troubleshooting
Failure
Probable cause
Remedy
When pressing "Power"
key, the screen is not
lightened
The storage battery is
discharged
Charge the storage battery
When the instrument is
switched On, the inscription
"Storage battery needs
charging"
is displayed
The storage battery is
discharged
Charge the storage battery
ATTENTION! THE FLAW DETECTOR MUST BE SWITCHED OFF WHEN NONTYPICAL IMAGES APPEAR ON THE FLAW DETECTOR SCREEN AND SOFTWARE
PROGRAMS BUZZ. IF REPEATED SWITCHING ON OF THE FLAW DETECTOR (NOT
EARLIER THAN IN 3 MINUTES) DOES NOT LEAD TO THE RESETTING OF NORMAL
OPERATION, THE FLAW DETECTOR SHOULD BE SENT TO THE MANUFACTURER FOR
REPAIR OR IT IS NECESSARY TO ADDRESS THE SERVICE CENTER.
11 Transportation and Storage
1. Climatic conditions for transportation of the eddy current flaw detector electronic unit – 2 (C)
according to GOST 15150, but for operating temperature range from minus 20 °C to plus 40 °C.
2. Transportation of the packed eddy current flaw detector may be shipped by any type of
closed transport (except for the sea one) that protects the eddy current testing system from
direct impact of precipitations, with a possibility of transshipping from one type of transport to
the other. Air shipments are allowed only in the pressurized modules. Arrangement and fixation
of boxes in transport vehicles should prevent them from displacement, shocks or impacts.
3. The flaw detector storage conditions in the manufacturer’s packing should meet the
requirements 2 (C) according to GOST 15150, but for operating temperature range from minus
20 °C up to plus 40 °C.
4. Storing the flaw detector in one room with acids, reagents, paints and other chemicals and
materials, the vapors of which may have a harmful effect on the instrument is not permitted.
5. In storage, the flaw detector and ECP should not be affected by electromagnetic fields.
Evaluation of stability of the flaw detector and ECP performance under the effect of
electromagnetic interferences should correspond to "B" criterion according to GOST 29073.
12 Warranty
You can read our warranty terms in our General Business Terms which you
can find here: https://www.pce-instruments.com/english/terms.

© PCE Instruments
59
English
13 Disposal
For the disposal of batteries in the EU, the 2006/66/EC directive of the
European Parliament applies. Due to the contained pollutants, batteries
must not be disposed of as household waste. They must be given to
collection points designed for that purpose.
In order to comply with the EU directive 2012/19/EU we take our devices
back. We either re-use them or give them to a recycling company which
disposes of the devices in line with law.
For countries outside the EU, batteries and devices should be disposed of in
accordance with your local waste regulations.
If you have any questions, please contact PCE Instruments.
APPENDIX A
Requirements to Charging Device for Portable Eddy Current Flaw
Detector PCE-USC 30
1 Special-purpose charging device for Li-Ion battery charging (3 elements)
with rated voltage of 12 V and capacity of 4.5 Аhour.
2 Charge type – accelerated.
3 Charge rate – (2.3 ± 10%) А.
4 After accelerated charging, the trickle charge mode is activated.
5 Electric supply of charging device: AC mains voltage from 100 to 240 V
and frequency of (47 ÷ 63) Hz. Current consumption at full load up to 0.9 A.
6 Cable length of charging device – no more than 2.0 m.
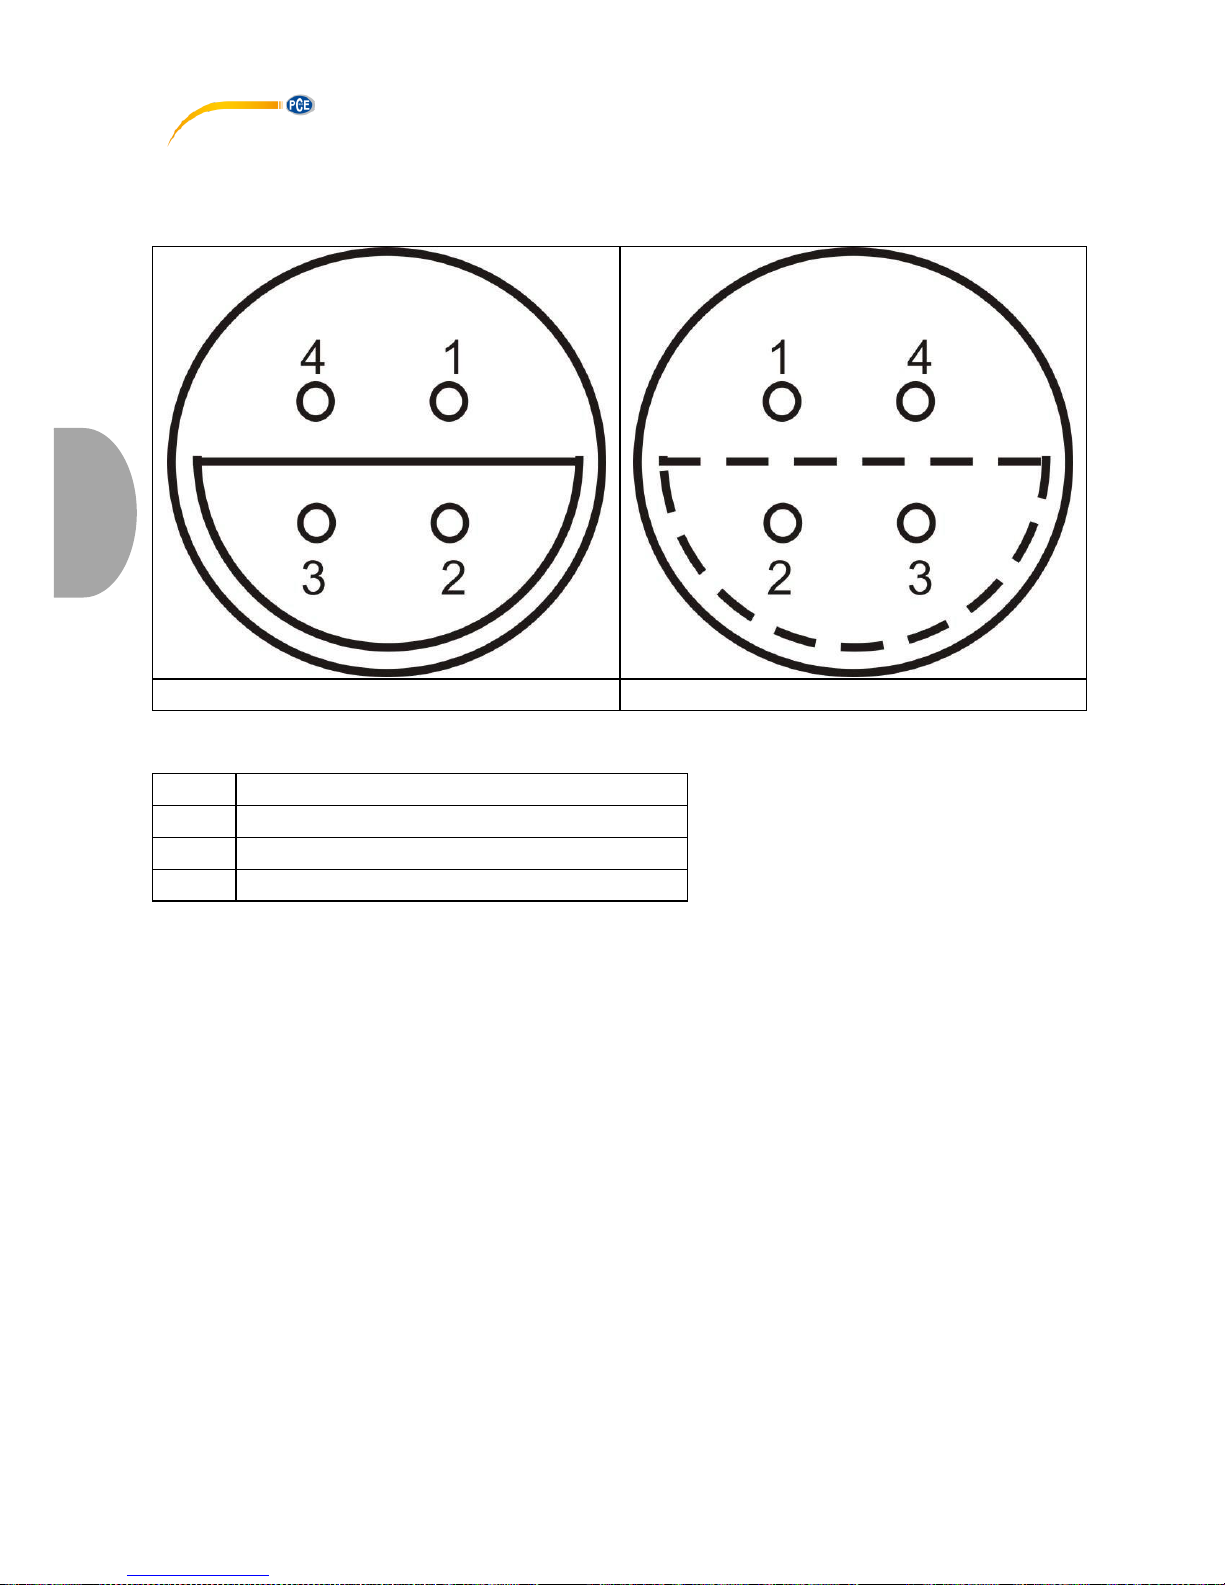
© PCE Instruments
60
English
Lemo FGG.1B.304.CLАD42
Front
Component side view
1
“-“ Charging device
2 - 3 - 4
“+” Charging device
Fig. A.1 – Soldering pattern of charging device output cable for the flaw
detector connection

© PCE Instruments
61
English
PCE Instruments contact information
Germany France Spain
PCE Deutschland GmbH PCE Instruments France EURL PCE Ibérica S.L.
Im Langel 4 76, Rue de la Plaine des Bouchers Calle Mayor, 53
D-59872 Meschede 67100 Strasbourg 02500 Tobarra (Albacete)
Deutschland France España
Tel.: +49 (0) 2903 976 99 0 Téléphone: +33 (0) 972 3537 17 Tel. : +34 967 543 548
Fax: +49 (0) 2903 976 99 29 Numéro de fax: +33 (0) 972 3537 18 Fax: +34 967 543 542
info@pce-instruments.com info@pce-france.fr info@pce-iberica.es
www.pce-instruments.com/deutsch www.pce-instruments.com/french www.pce-instruments.com/espanol
United States of America United Kingdom Italy
PCE Americas Inc. PCE Instruments UK Ltd PCE Italia s.r.l.
711 Commerce Way suite 8 Units 12/13 Southpoint Business Park Via Pesciatina 878 / B-Interno 6
Jupiter / Palm Beach Ensign Way, Southampton 55010 LOC. GRAGNANO
33458 FL Hampshire CAPANNORI (LUCCA)
USA United Kingdom, SO31 4RF Italia
Tel: +1 (561) 320-9162 Tel: +44 (0) 2380 98703 0 Telefono: +39 0583 975 114
Fax: +1 (561) 320-9176 Fax: +44 (0) 2380 98703 9 Fax: +39 0583 974 824
info@pce-americas.com info@industrial-needs.com info@pce-italia.it
www.pce-instruments.com/us www.pce-instruments.com/english www.pce-instruments.com/italiano
The Netherlands Chile Hong Kong
PCE Brookhuis B.V. PCE Instruments Chile SPA PCE Instruments HK Ltd.
Institutenweg 15 RUT 76.423.459-6 Unit J, 21/F., COS Centre
7521 PH Enschede Badajoz 100 oficina 1010 Las Condes 56 Tsun Yip Street
Nederland Santiago de Chile / Chile Kwun Tong
Telefoon: +31 (0) 900 1200 003 Tel. : +56 2 24053238 Kowloon, Hong Kong
Fax: +31 53 430 36 46 Fax: +56 2 2873 3777 Tel: +852-301-84912
info@pcebenelux.nl info@pce-instruments.cl jyi@pce-instruments.com
www.pce-instruments.com/dutch www.pce-instruments.com/chile www.pce-instruments.cn
China
Turkey
Pingce (Shenzhen) Technology Ltd. PCE Teknik Cihazları Ltd.Şti.
West 5H1,5th Floor,1st Building Halkalı Merkez Mah.
Shenhua Industrial Park, Pehlivan Sok. No.6/C
Meihua Road,Futian District 34303 Küçükçekmece - İstanbul
Shenzhen City Türkiye
China Tel: 0212 471 11 47
Tel: +86 0755-32978297 Faks: 0212 705 53 93
lko@pce-instruments.cn info@pce-cihazlari.com.tr
www.pce-instruments.cn www.pce-instruments.com/turkish

© PCE Instruments
User manuals in various languages
(German, French, Italian, Spanish, Portuguese, Dutch, Turkish, Polish,
Russian, Chinese)
can be downloaded here: www.pce-instruments.com
Specifications are subject to change without notice.
 Loading...