

Page 1
PCE Americas Inc.
711 Commerce Way
Suite 8
Jupiter
FL-33458
USA
From outside US: +1
Tel: (561) 320-9162
Fax: (561) 320-9176
[email protected]
www.pce-instruments.com/english
www.pce-instruments.com
PCE Instruments UK Ltd.
Unit 11
Southpoint Business Park
Ensign way
Hampshire / Southampton
United Kingdom, SO31 4RF
From outside UK: +44
Tel: (0) 2380 98703 0
Fax: (0) 2380 98703 9
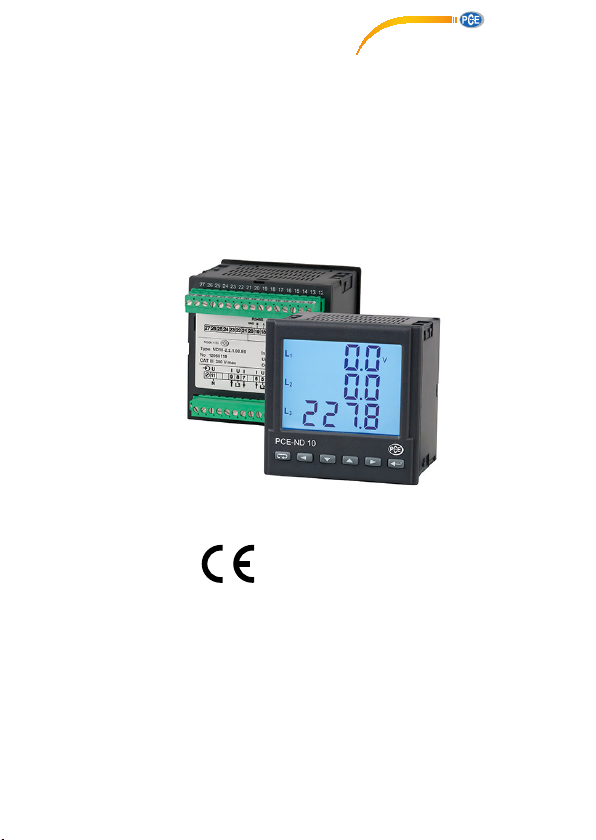
DIGITAL INDICATOR
PCE-ND10
USER’S MANUAL
1
Page 2

Contents
1. APPLICATION ................................................................... 5
2. METER SET ...................................................................... 6
3. BASIC REQUIREMENTS AND OPERATIONAL SAFETY ..................... 6
4. INSTALLATION .................................................................. 7
5. METER DESCRIPTION ......................................................... 8
5.1 Current inputs .............................................................. 8
5.2 Voltage inputs ............................................................. 8
5.3 Connection diagrams ..................................................... 9
6. ND10 METER PROGRAMMING .............................................. 12
6.1 Front panel ................................................................ 12
6.2 Power-on messages .....................................................13
6.3 Parameter display ........................................................ 14
6.4 Operating modes ......................................................... 17
6.5 Parameter settings ....................................................... 18
6.5.1 Setting of meter parameters ......................................... 19
6.5.2 Setting of output parameters .........................................21
6.5.3 Setting of alarm parameters ......................................... 22
6.5.4 Setting date and time .................................................29
7. SOFTWARE UPGRADES ...................................................... 30
8. RS-485 INTERFACE ........................................................... 32
9. ERROR CODES ................................................................. 46
10. TECHNICAL DATA ............................................................. 48
11. ORDERING CODES ............................................................ 52
12. MAINTENANCE AND GUARANTEE ........................................... 53
3
Page 3

1. APPLICATION
The
PCE-ND10 meter is a digital programmable panel
meter destined for the measurement of the 3-phase, 4-wire
power network parameters in balanced and
unbalanced systems. It is also capable of displaying
measured quantities and their simultaneous digital
transmission. The meter is also capable of controlling and
optimization of the power electronic devices, systems, and
industrial installations. The meter can be used for measuring:
RMS value of voltage and current; active, reactive and
apparent power; active and reactive energy, power
parameters; frequency, 15-, 30- and 60-minute mean active
power and THD. Additionally, a current in the neutral wire
is calculated from the phase current vectors . Voltage and
cur-rent values are multiplied by given voltage and current
ratios of measuring transformers. Power and energy
indications take into account all programmed ratio values. Any
and all measured values can be sent to the master via the
RS-485 interface. The relay outputs signal alarm when
selected parameters exceed set limits. Impulse output can
be used for consump-tion check of the 3-phase real energy.
This meter is also able to detect and signal incorrect phase
sequence. The meter is powered by the measuring
circuit, i.e. from the voltage output.
There is a galvanic separation between following units of
the meter:
- voltage and current inputs,
- RS-485 output,
- pulse output.
5
Page 4
2. METER SET
Complete set of the meter includes:
- PCE-ND10 Meter
- connection clamps
- user’s manual
1 pcs.
2 pcs.
1 pcs.
3. BASIC REQUIREMENTS AND
OPERATIONAL SAFETY
In the safety service scope, the transducer meets to
requirements of the EN 61010-1 standard.
Observations Concerning the Operational Safety:
• The meter should be installed and connected only
byaqualiedpersonnel.Allrelevantsafetymeasuresshould
be observed during installation.
• Always check the connections before turning the meter on.
• Removal of the meter housing during the warranty period
voids the warranty.
• This meter conforms to all requirements of the electromag-
netic compatibility in the industrial environment.
• Building power network should include switch or automatic
circuit breaker positioned in the convenient vicinity of the
meter. It should be properly marked and available to operator at all times.
6
Page 5
4. INSTALLATION
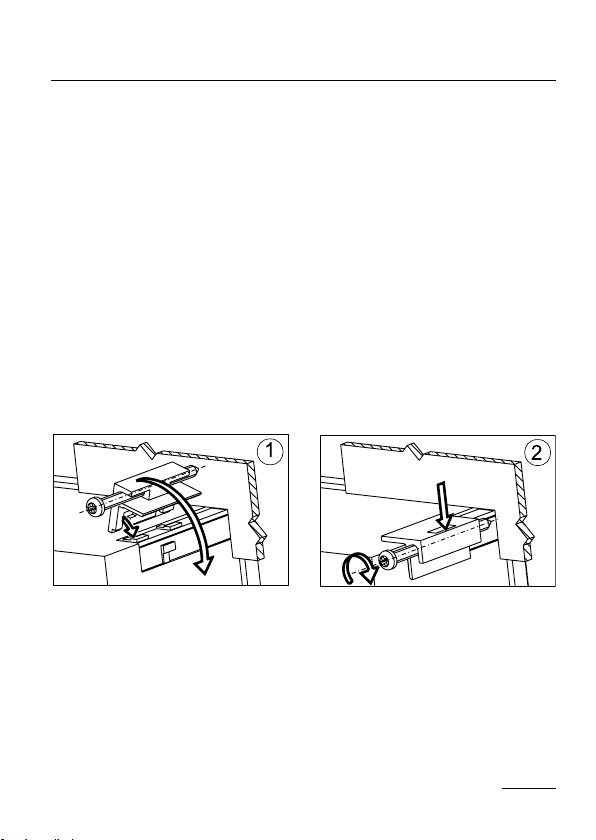
PCE-ND10 Meter is adapted to be mounted to the panel
with mounting brackets (see Fig. 1). Meter housing is made
of plastic.
Housing dimensions: 96 x 96 x 77 mm. On the outer side of the
meter there are screw and tab terminal strips that can be us
for connecting external wires with diameter up to 2.5 mm2.
Prior to installation a 92.5
+0.6
x 92.5
+0.6
mm slot must be made
in the panel. The thickness of the panel material should not
exceed 15 mm. The meter must be placed in the panel from
the front. During installation the powering voltage must be
off. When the panel is inserted in the slot, mount it in place
with provided mounting brackets.
Fig. 1. Meter tting.
ed
7
Page 6
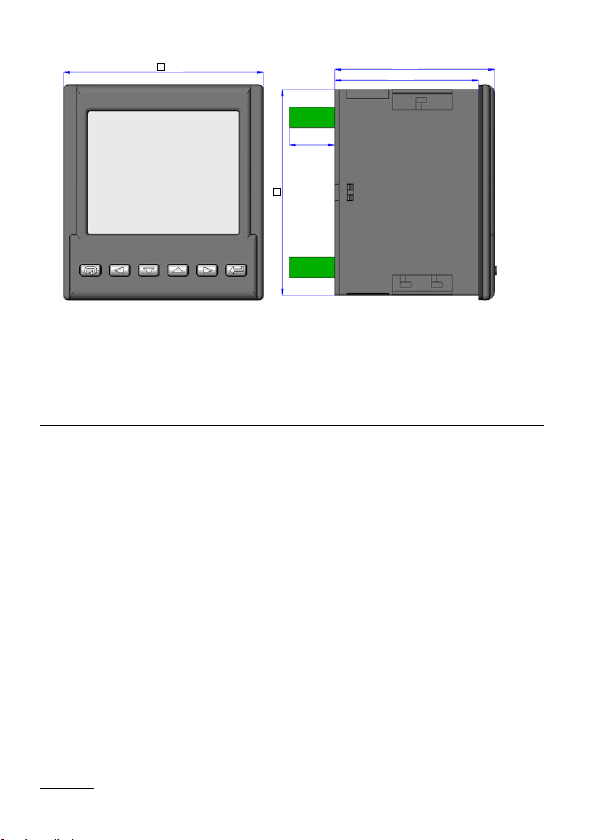
96
22
92
76,7
69
Fig. 2. Meter dimensions.
5. METER DESCRIPTION
5.1. Current inputs
All current inputs are galvanically isolated (internal current transformers). The meter is suited to operate together with external
measuring current transformers. Displayed values of currents as
well as their derivative values are automatically calculated using
set ratio value of the external transformer. Current inputs are
speciedintheorderaseither1Aor5A.
5.2 Voltage inputs
Displayed values of voltages as well as their derivative values
are automatically calculated using set ratio value of the external
transformer.Voltageinputs are specied in the order aseither
3 x 57,7/100 V, 3 x 230/400 V or 3 x 290/500 V.
8
Page 7

5.3 Connection diagrams
OUT
Direct measurement
in a 4-wire network
PCE-ND10
9
Page 8

Semi-indirect measurement
in a 4-wire network
OUTimp
PCE-ND10
10
Page 9
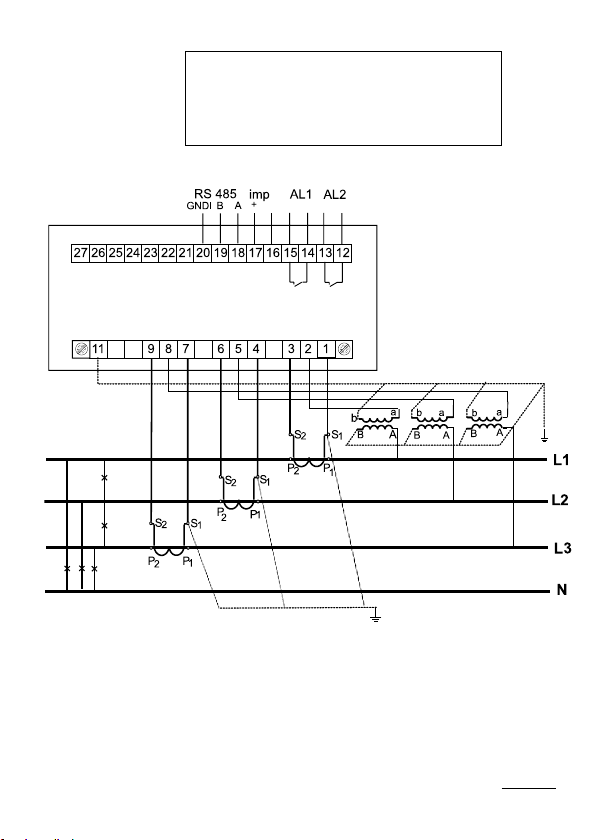
Indirect measurement using
3 current transformers and 3 voltage
transformers in 4-wire network
OUT
PCE-ND10
Caution: It is recommended to connect PCE-ND10 meters
(RS-485) to a computer with a shielded wire. A shield should be
connected to ground in a single point. Shielded wire must be
used in case there are many interferences in the environment.
Fig 3. Connection diagrams of the meter in the 4‑wire
network.
11
Page 10

6. PCE-ND10 METER PROGRAMMING
6.1 Front panel
Fig. 4. Front panel.
Front panel description:
1 – cancel button (ESC)
2 – move left button
3 – decrease value button
4 – increase value button
5 – move right button
6–conrmbutton(ENTER)
7 – digital data transmission symbols
12
8 – connection / alarm symbols
9 – unit at displaying THD and power
guard
10 – THD value display symbols
11–powercoefcientandpower
tangent display symbol
Page 11
12 – mean active power value
display symbol
13 – menu safety symbol
14 – units of the displayed values
15 – 3-phase values display
symbol
16 – base values ratios
17–eldfordisplayingbase
values, power, THD, date,
mean values, frequency,
time and power guard
18 – min / max value symbols
19 – symbols of value-phase
connection
20 – power and energy characte ristics symbol
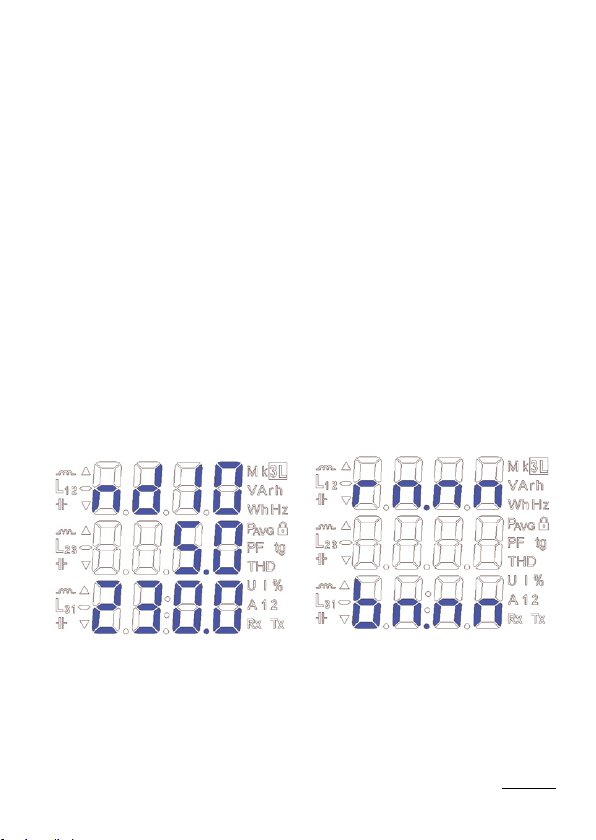
6.2 Power-on messages
After connection of voltage inputs the meter performs a
display test and displays the PCE-ND10 meter name, build
and current software version.
where: r n.nn is a number of the current software version or special build number.
b n.nn is a bootloader version number.
Fig. 5. Meter start messages
Caution! If the display shows Err Cal or Err EE message,
please contact the maintenance service.
13
Page 12
6.3 Parameter display
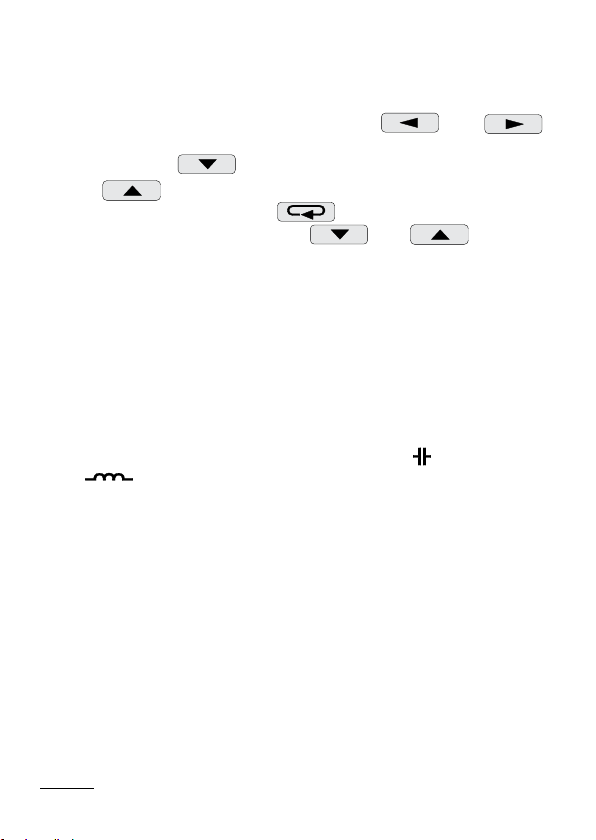
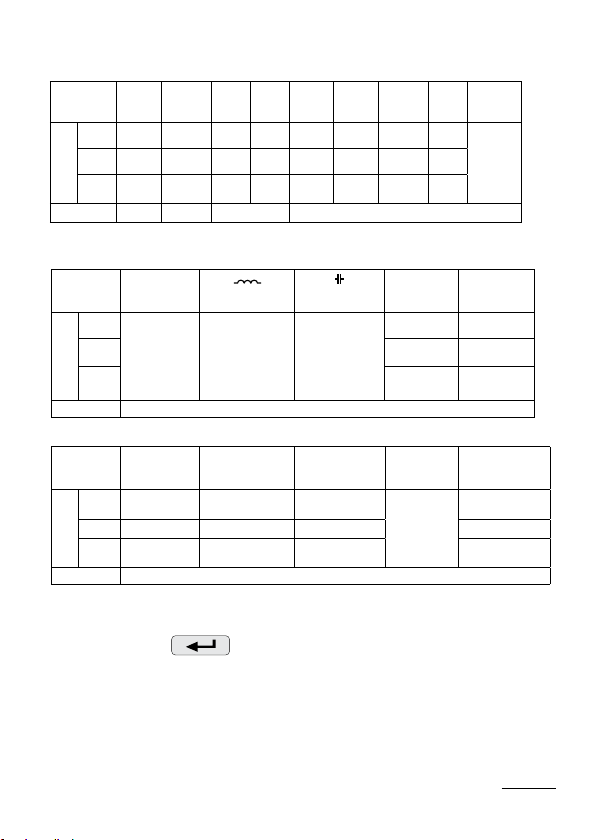
In the measurement mode, values are displayed
according to set tables. Pressing button
allows user to switch between displayed base values (Table 1).
Pressing button
button
are displayed, pressing the
or maximal values. When buttons
sed simultaneously, respective mean 3-phase values are displayed, together with minimal and maximal values (see Table 2).
RS-485 interface allows setting the values that are to be
displayed.
Error display is described in section 8.
When reactive power is displayed, this indication is accompanied by a symbol of the load: capacity load ( ) or inductive
load ( ).
Basevaluesdisplayedintheeld17(Fig.4.).Option(parameter)
shown in the Table 1 indicated that displaying of this parameter may be turned off in register 4056 via RS485. Turning this
parameter off (from U to tg) disables displaying their respective
mean / 3-phase values.
displays maximal value. When these values
displays minimal value and pressing
button resets all minimal
and are pres-
or
14
Page 13
L1, V
L1-2, V
L1, A
L1, W
L1, Var
L1, VA
Displayed
symbols
row 1 U1 U12 I1 P1 Q1 S1 PF1 tg1
row 2 U2 U23 I2 P2 Q2 S2 PF2 tg2
row 3 U3 U31 I3 P3 Q3 S3 PF3 tg3
Displayed values
Display
2-3
2
2
L
L2
L3
xed optional xed optional
L
L3-1
L3
2
L
L
L3
L3
L1, PF
2
L
L
L3
L3
Table 1
L1, tg
2
2
kWh
L
L3
Imported
active
energy
Displayed
symbols
row 1
row 2
row 3
Displayed values
Display
Displayed
symbols
row 1
row 2
row 3
Displayed values
Display
-, kWh
Exported
active
energy
Hz
f(L3)
min
max
kVarh kVarh
reactive inductive
energy
/
reactive positive
energy
3L, W P
AVG
ΩP3-phase(15,30
or 60 min.)
min
max
1,THD U
L
L
2,
3
L
reactive capacitive
energy
/
reactive negative
energy
optional
A % Date/Time
I
(N)
min
max
optional
THD U1 % THD I1 %
THD U2 % THD I2 %
THD U3 % THD I3 %
Ordered
power con
sumption
(within 15, 30
or 60 min.)
-
L1, THD I
L
2,
3
L
Year
Month. day
Hours: minutes
Mean values and corresponding minimal and maximal values
(when pressed
ontherst8basevaluescreens,following
markers are highlighted: 3L, ,) .
15
Page 14

Table 2
Displayed
symbols
Displayed values
3L, V 3L, V 3L, A 3L, W 3L, Var 3L, VA 3L, PF 3L, tg
row
row
row
U
1
3-phase
2
3
LNav.
U
LLav.
3-phase
I
av.
3-phase
P Q S PF tg
min
max
When upper limit of the indication range is exceeded, it is indicated by two horizontal lines in upper part of the display.
Conversely, when lower limit is exceeded, it is indicated by two
horizontal lines in the lower part of the display. When mean
powerismeasuredΣP
for 15-second quantum. Depending on chosen value (15 min, 30
separate measurements are made
3-phase
min, 60 min) calculated mean value is based on 60, 120 or 240
measurements. After the meter is turned on or after the power is
reset,therstvaluewillbecalculatedin15secondsafterturning
meter on or resetting. Until all probed values of the active power
are acquired, mean power value is calculated from values already
measured. Current in the neutral wire I(N) is calculated from
phase current vectors.
When alarms are activated, symbols A1 and/or A2 are displayed.
When alarms are deactivated and alarm signalization latch is
turnedon,ashingsymbolsA1and/orA2aredisplayed.
16
Page 15
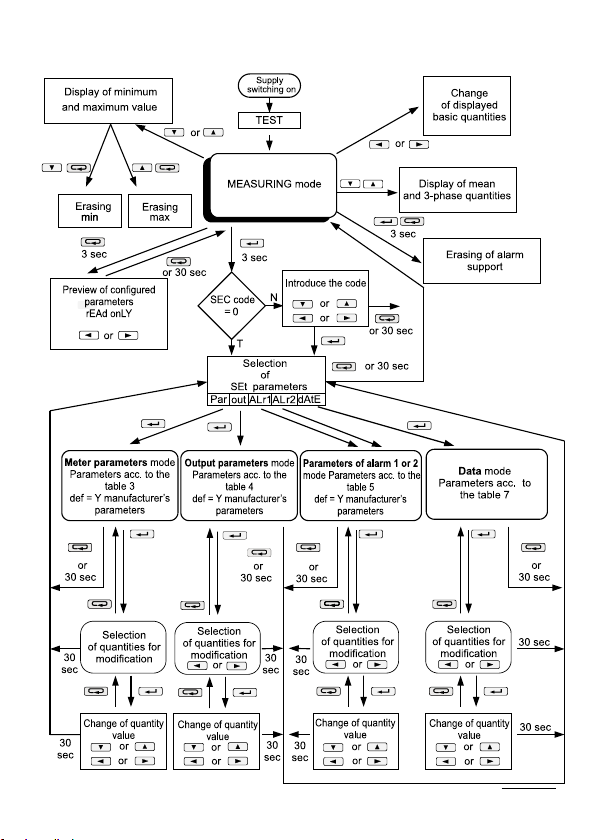
6.4 Operating modes
Fig. 6. PCE-ND10 meter operating modes.
17
Page 16
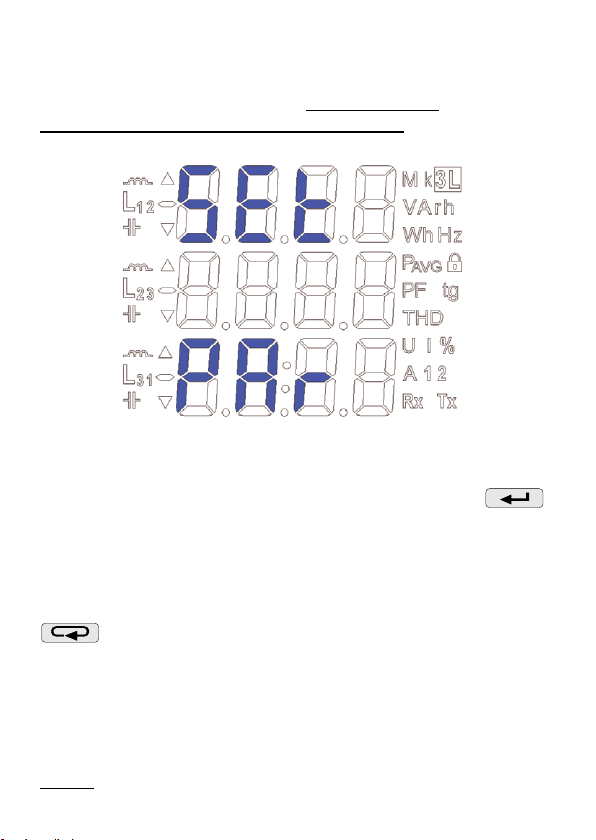
6.5 Parameter setting
PCE-ND10 meters are configured with the use of LPCon
software available for free on the https://www.pceinstruments.com/english/download-win_4.htm web site.
Fig 7. Setup menu.
Programming mode is enabled by pressing and holding
button for about 3 seconds. To enable the programming user
bust enter a correct access code. If there is not such a code,
the program transits into the programming option. Message SET
(inthe rst row) and rst parameter group PA r are displayed.
User can view parameters at any time by pressing and holding
button for about 3 seconds.
18
Page 17

6.5.1 Setting of Meter Parameters
In options menu choose PAr (using
buttons)andconrmselectionwiththe
Item
1
2
3
4
5
name
arameter
P
Access
code entry
Current
transformer
ratio
Voltage
transformer
ratio
-
Mean ac
tive power
synchronization
Recording
minimal
-
and maxi
mal values
complete
with errors
Marking
SEC
tr_I 1 … 10000 1
tr_U
Syn
erLi o
Range
oFF,
1 … 60000
0.1 … 4000.0 1
Mean active power synchro
15, c_15,
c_30, c_60
FF
c_15 – measurement synchr
with clock every 15 min.
c_30 – measurement synchr.
with clock every 30 min.
c_60 – measurement synchr.
with clock every 60 min.
o
FF – recording only correct
values (within measurement
, on
on – recording all errors
occurring in measurements
(values in 1e20 and -1e20
or
button.
Notes/
description
0 – no code 0
nization:
15 - 15-minute moving
window
range),
registers)
Table 3
Manufacturer’s
-
.
15
on
value
19
Page 18
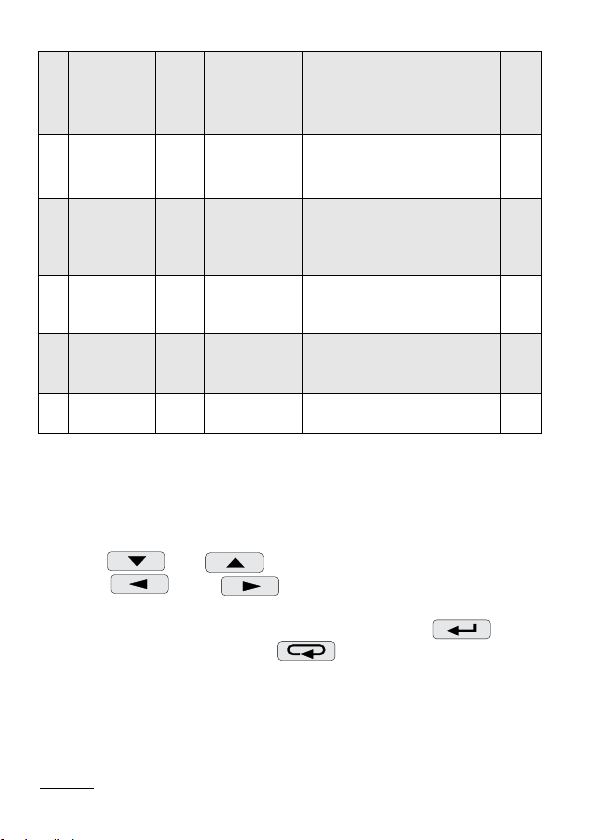
6
7
8
9
10
11
Method of
reactive
energy
calculation
Display
panel illumination
Energy
counters
erasing
Mean acti
ve power
erasing
Ordered
power
Default
settings
En_q cAP, sIGn
oFF
diSP
En_0
P
A_0 no, yES yES – erase power no
PAor 0 … 144.0
dEf no, yES
,1…60,
on
no, EnP, Enq,
ALL
cAP – inductive and capacity
energy
sIGn – positive and negative
energy
off, on, 1..60 – illumination
time (in seconds) from pres-
sing the button
no – no activity,
EnP – erase active energy,
Enq – erase reactive,
ALL – erase all energies
Power ordered to establish
power consumption in % of
rated power
Reverting to default (factory)
group settings
cAP
on
no
100
no
The automatic erasing of energy is carried out:
- for active energy when changing: voltage or current ratio;
- for reactive energy when changing: voltage or current ratio,
reactive energy calculation method;
Buttons
buttons
and are used for setting the values while
and are used for choosing position
of the number to be set. The active position is signaled by the
cursor. Set value can be accepted by pressing the
or canceled by pressing the
button. When value is to
button
be accepted, it is checked against the acceptable value range.
If the set value falls outside the allowable range, the meter
remains in parameter setting mode and the value is set to
the highest possible value (when entered value is too high)
or lowest possible value (when it is too low).
20
Page 19
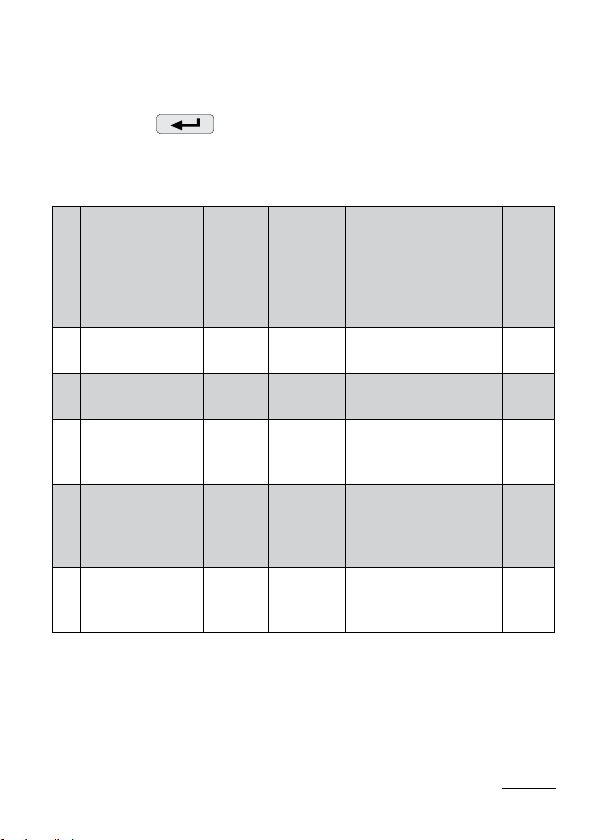
6.5.2 Setting of Output Parameters
In Options choose the out mode and conrm your choice by
pressing the
button.
Table 4
Item
1 Number of
impulses
2 MODBUS Ne
name
Parameter
-
Marking
Range
Io_n 5000 …
20000
Number of impulses
per kWh
Notes/
description
Adr 1 … 247 1
twork Address
3 Transmission
mode
trYb 8n2,
8e1,
8o1, 8n1
4 Transmission
speed
bAUd 4.8 k,
9.6 k,
19.2 k,
reverting to default
(factory) group
settings
38.4 k
5 Default settings dEf no, yES reverting to default
(factory) group
settings
value
Manufacturer’s
5000
8n2
9,6 k
no
21
Page 20
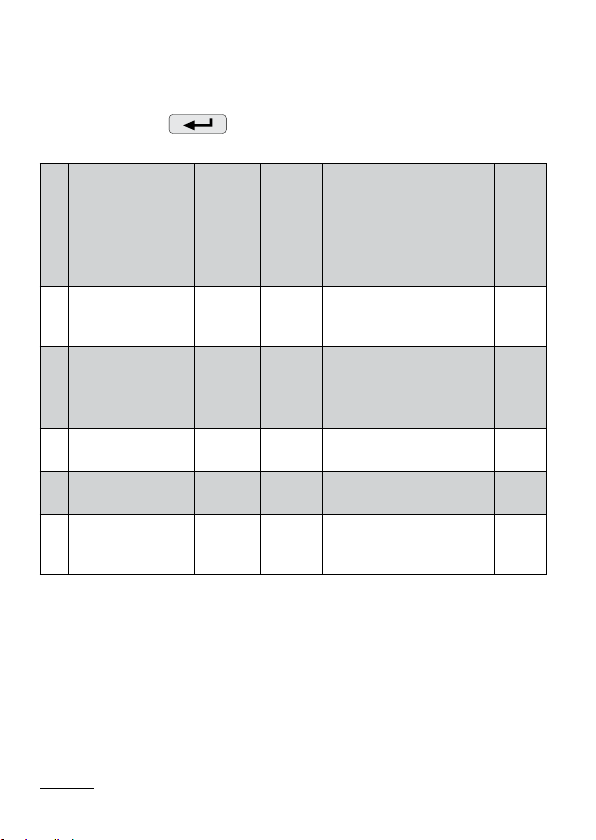
6.5.3 Setting alarm parameters
In Options choose ALr1 or ALr2modeandconrmyourselection
by pressing the
button.
Table 5
Item
Value on alarm
1
output (code as
in Tab. 6)
Alarm type A1_t,
2
Lower value of
3
the input range
Upper value of
4
the input range
Time delay of the
5
switch reaction
name
Parameter
22
A1_n,
A2_n
A2_t
A1oF,
A2oF
A1on,
A2on
A1dt,
A2dt
Marking
Range
table 6 P
n-on,
Fig. 8. n-on
n-oFF,
on,oFF,
H-on,
H-oFF
-144.0…
-144.0…
0…900 in seconds (for A1_n =
in % of the rated quantity
144.0
value
in % of the rated quantity
144.0
value
P_ord, delay occurs only
when alarm is activated)
Notes/
description
value
Manufacturer’s
99.0
101.0
0
Page 21
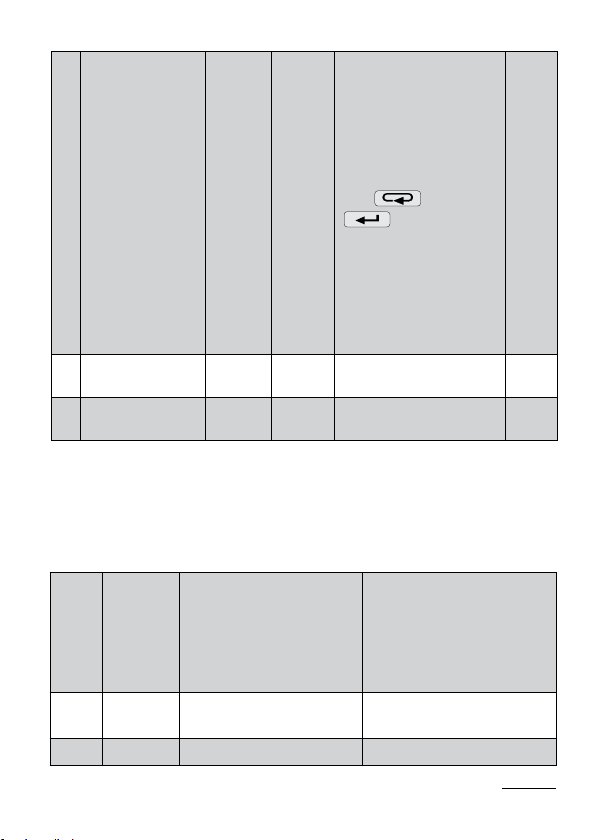
Alarm signaliza-
6
tion latch
Alarm re-activa-
7
tion block
Default settings dEf no,
8
A1_S,
A2_S,
A1_b,
A2_b,
oFF, onWhen alarm signaliza-
tion latch is enabled
and the alarm state
ends, alarm symbol
is not turned off but
beginstoash.Alarm
symbolashesuntilit
is turned off by pressing
both and
buttons (for 3
seconds). This function
refers only to the alarm
signalization, so the
relay connectors will
operate without support
according to the selected
alarm type.
0 …
in seconds 0
900
reverting to default
yES
(factory) group settings
no
The write of the value ALon lower than ALoF switches the alarm
off.
Selection of the monitored value:
Table 6
4015 register
Item / value in
Quantity type
element
Displayed
00 oFF no quantity /alarm
disabled/
01
U
_1 L1 phase voltage
outputs and
Value needed
alarm values
of percentage
for calculations
none
U
n [V] *
(100 %)
23
Page 22
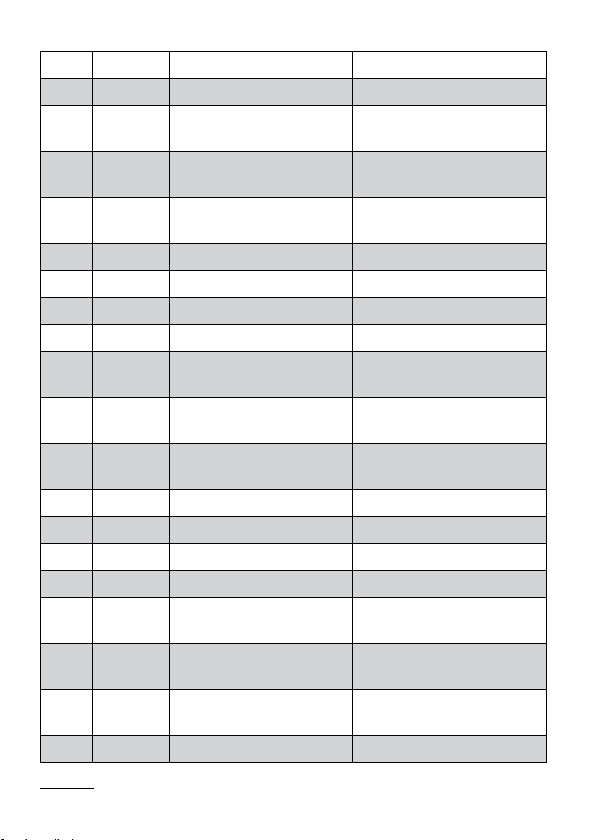
02 I_1 L1 phase wire current In [A] *
03 P_1 L1 phase active power Un x In x cos(0°) [W] *
04 q_1 L1 phase reactive
power
05 S_1 L1 phase apparent
power
06 PF1 L1 phase active power
factor
07 tg1 tgj factor of L1 phase 1
08 U_2 L2 phase voltage Un [V] *
09 I_2 L2 phase wire current In [A] *
10 P_2 L2 phase active power Un x In x cos(0°) [W] *
11 q_2 L2 phase reactive
power
12 S_2 L2 phase apparent
power
13 PF2 L2 phase active power
factor
14 tg2 tgj factor of L2 phase 1
15 U_3 L3 phase voltage Un [V] *
16 I_3 L3 phase wire current In [A] *
17 P_3 L3 phase active power Un x In x cos(0°) [W] *
18 q_3 L3 phase reactive
power
19 S_3 L3 phase apparent
power
20 PF3 L3 phase active power
factor
21 tg3 tgj factor of L3 phase 1
Un x In x sin(90°) [var] *
Un x In [VA] *
1
Un x In x sin(90°) [var] *
Un x In [VA] *
1
Un x In x sin(90°) [var] *
Un x In [VA] *
1
24
Page 23
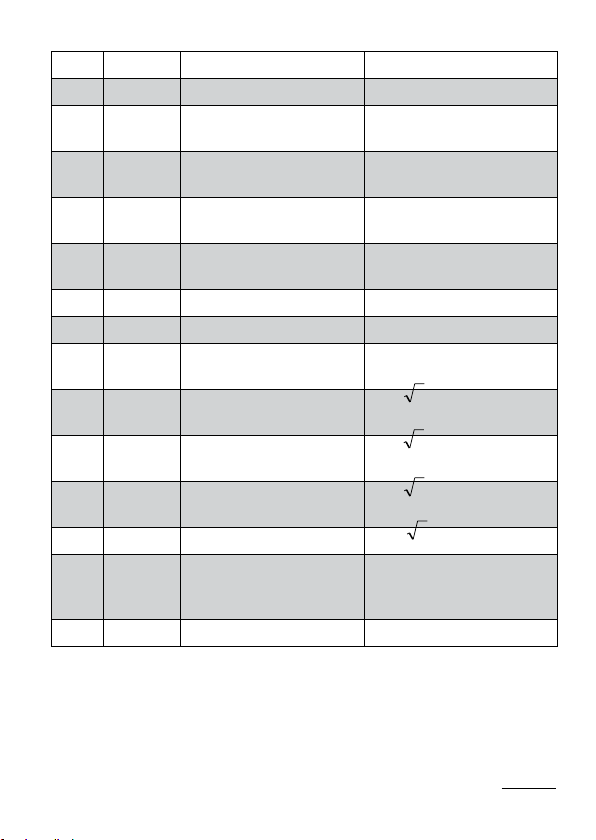
22 U_A mean 3-phase voltage Un [V] *
3
3
3
3
23 I_A mean 3-phase current In [A] *
24 P
25 q 3-phase reactive power
26 S
27 PF_A 3-phase active power
28 tg_A tgj factor for 3 phases 1
F
29
30
U
31
U
32 U31 phase-to-phase voltage
U
33
34 P_At mean active power 3 x Un x In x cos(0°) [W]*
35 P_ord used % of the ordered
36 I_ne neutral wire current In [A] *
3-phase active power
(P1+P2+P3)
Q1+Q2+Q3)
(
3-phase apparent
power (S1+S2+S3)
factor
rEq frequency 100 [Hz]
12 phase-to-phase voltage
L1-L2
23 phase-to-phase voltage
L2-L3
L3-L1
4_A mean phase-to-phase
voltage
active power (used
energy)
3 x
Un x In x cos(0°)
[W] *
3 x Un x In x sin(90°)
[var] *
Un x In [VA]*
3x
1
n [V] *
U
n [V] *
U
Un [V] *
U
n [V] *
100 [%]
*Un, In – voltage and current rated values
25
Page 24
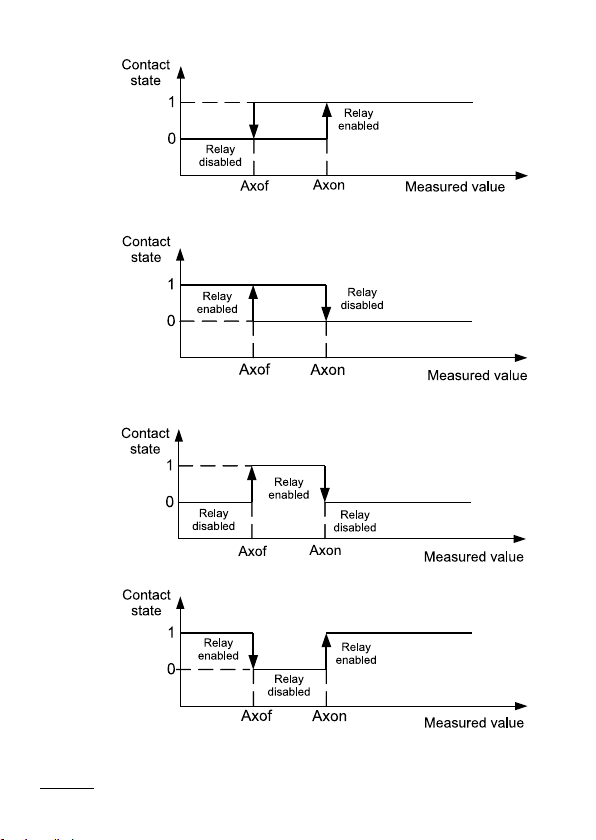
a) n-on
b) n-oFF
c) On
d) OFF
Fig. 8. Alarm types (x – alarm no.): a),b) normal c) off d) on.
26
Page 25

Remaining types of the alarm:
H-on – always on;
H-oFF – always off.
Example 1 of alarm setting:
Set n-on alarm type for monitored quantity P – 3-phase active
power,
Version: 5 A; 3 x 230/400 V. Setting the alarm on after exceeding
3800 W, switching the alarm off after power drops to 3100 W.
Calculations: rated 3-phase active power: P = 3 x 230 V x 5 A
= 3450 W
3450 W – 100 % 3450 W – 100 %
3800 W – A1on % 3100 W – A1oF %
In conclusion: A1on = 110,0 % A1oF = 90,0 %
Set: Monitored quantity: P; type of alarm: n-on, A1on 110,0,
A1oF 90,0.
Example no 2 of alarm setting:
The value of ordered power consumption may be used for
the purpose of prior warning that ordered power might be exceeded. Ordered power consumption is calculated according
to time period set for the mean active power synchronization
and value of the ordered power. Pre-emptive alarm should
be set so that it indicates the possibility of exceeding ordered power of 1MW at 90 %
(900 s). Measuring current transformer 2500: 5A, voltage 230 V.
Peak max power consumption 1,5 MW.
Calculations:
PCE-ND10 meter active rated 3-phase power: P = 3 x kU x Un x
kI x In = 3 x 1 x 230 V x 500 x 5A = 1,725 MW g100 %.
Ordered-to-rated power ratio = 1 MW / 1.725 ≈ MW 57,97 %
of meter rated value (rounded down) - Pord;
assuming allocation of 15-minutes
27
Page 26
Alarm operation hysteresis: alarm should be activated at 90 %
to=10 %∗
[
1 MW∗900 s
1,5 MW
]
=60 s
1.5 MW
ordered power (A1on), and deactivated for e.g.: at 1 % lower
89 % (A1of).
Optimization of power limit function (delay at alarm activation):
alarm activation delay
A1on=90.% A1of=89.9%
Time of delay A1dt= 0 sec
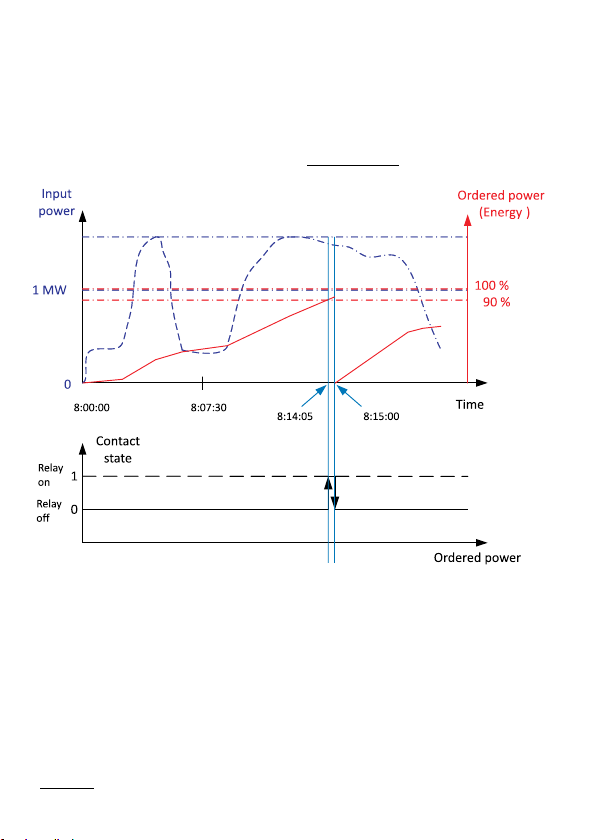
Fig. 9 shows an example of how the consumed ordered active power parameter can be used to alarm activation. Delay time is set at 0 seconds (A1dt).
In presented example for the remaining 10 % of ordered power at
maximum power consumption, all devices could operate for additional
60 seconds without imposing penalties. If the delay time A1dt had been
set to 60 seconds, alarm would not have been activated.
Fig. 9. Measurement of used ordered 15 minutes’ active
power consumption synchronized with the clock,
with alarm set on a 90% consumption.
28
(A1dt).
Page 27
Set alarm as following: monitored quantity: A1_n = P_ord; alarm
type: A1_t = n-on; A1on = 90,0, AL1oF = 89,9; delay time A1dt
= 0 or 60 s; A1_s = 0; A1_b = 0. Parameters should be set as
following: tr_I = 500; Syn = 15 or c_15, and Pord = 57.9.
6.5.4 Setting Date and Time
In Options choose dAtE mode and conrm the selection with
button. Seconds are reset to 0 after hour and minute
values are set.
Table 7
Item
Parameter
name
1 Hour, minute t_H 0…23,
2 Month, day t_d 1…12,
3 Year t_y 2001 …
Marking Range
0..59
1…31
2100
Manufacturer’s
value
00.00
1.01
2001
29
Page 28

7. SOFTWARE UPGRADE
Function enabling updating of software from the com-puter of
the PC with software eCon was implementation in meter PCE-
ND10(withdigitaloutput).FreesoftwareeConandupdatefiles
are accessible on the site https://www.pce-instruments.com/
english/download-win_4.htm. The connected to the computer
converter RS485 is required on USB to the updat-ing, e.g.: the
converter PCE-PD10.
Note! After updating the software, the manufacturer’s settings
of the meter should be set, so it is recommended to save the meter
parameters before updating using the software eCon.
30
Page 29

After starting eCon’s software COM port, baudrate,
transmission mode and adress should be set. It can be done in
Options. Then, PCE-ND10 meter should be selected from
Device. Push icon Load to read and save current settings.
Open window Updater – from Updating->Updating of devices
rmware. Push Connect. Update progress is shown in
Messages section. Text Port opened appear after correctly
opened port. Putting meter in update’s mode can be done in
two ways: remote from Updater (with settings from eCon –
port, baudrate, transmission mode and adress) or by turning
power on while button pressed. Meter display shows
the „boot” inscription with bootloader version, Updater shows
message „Device found” with name and current version of
firmware. Using button browse to the meter upgrade file.
If the file is opened correctly, a File opened message is
displayed. Press the Send button. When upgrade is
successfully completed, meter reverts to the default settings
and begins normal operation while the information window
displays Done message and upgrade elapsed time. Close
Updater and go to Restoration of default parameters. Select
checkbox and press Apply button. After the Updater window is
closed, press the Save icon to save all initially read
parameters. Current firmware version can be checked when
meter is power on.
Warning! Turning the meter off during upgrade process may
result in permanent damage!
31
Page 30

8. RS-485 INTERFACE
Overview of the PCE-ND10 serial port
parameters.
• identifier 0xCB
• meter address 1..247
• transmission speed 4.8, 9.6, 19.2, 38.4 kbit/s,
• operation mode Modbus RTU,
• transmission mode 8N2, 8E1, 8O1, 8N1,
• max. response time 750 ms.
• max. no. of registers read
in a single query
- 40 4-byte registers,
- 80 2-byte registers,
• implemented functions - 03, 04, 06,16, 17,
- 03, 04 register read,
- 06 1st register write,
- 16 register write,
- 17deviceidentication.
Manufacturer’s settings: address 1, speed 9.6 kbit/s, mode RTU 8N2.
ND10 meter register map
PCE-
PCE-ND10 meter has data contained in 16-bit and 32-bit
registers. Process variables and meter parameters are placed
in the address area of registers in a way depended on
the variable value type. Bits in 16-bit registers are numbered
from the youngest to the oldest (b0-b15). 32-bit registers include
num-bers of float type in IEEE-754 standard. Sequence of
3210bytes– theoldestistransmittedasthefirst.
32
Page 31
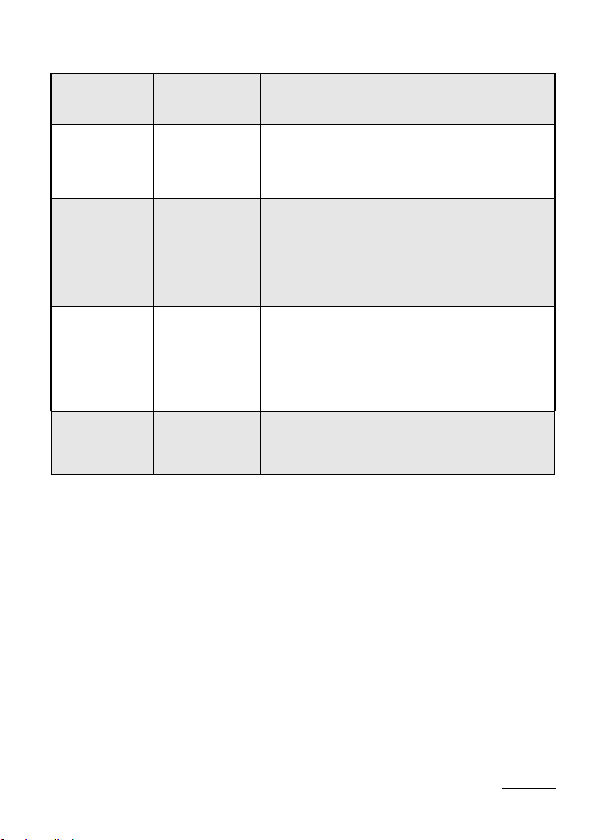
Range of
addresses
4000
– 4057
6000
– 6319
7000
– 7319
7500
– 7659
Type of
value
Integer
(16 bits)
Float
(2x16 bits)
Float
(2x16 bits)
Float
(32 bits)
Table 8
Description
Value set in the 16-bit register.
Register description is presented
in Table 9. Read and write registers.
Value is set in the two following 16-bit
registers. These registers contain the
same data as 32-bit registers from
7500 – 7659 range. Readout registers.
Bit sequence (1-0-3-2).
Value is set in the two following 16-bit
registers. These registers contain the
same data as 32-bit registers from
7500 – 7659 range. Readout registers.
Bit sequence (3-2-1-0).
Value set in the 32-bit register.
Register description is presented in
Table 10. Readout registers.
33
Page 32
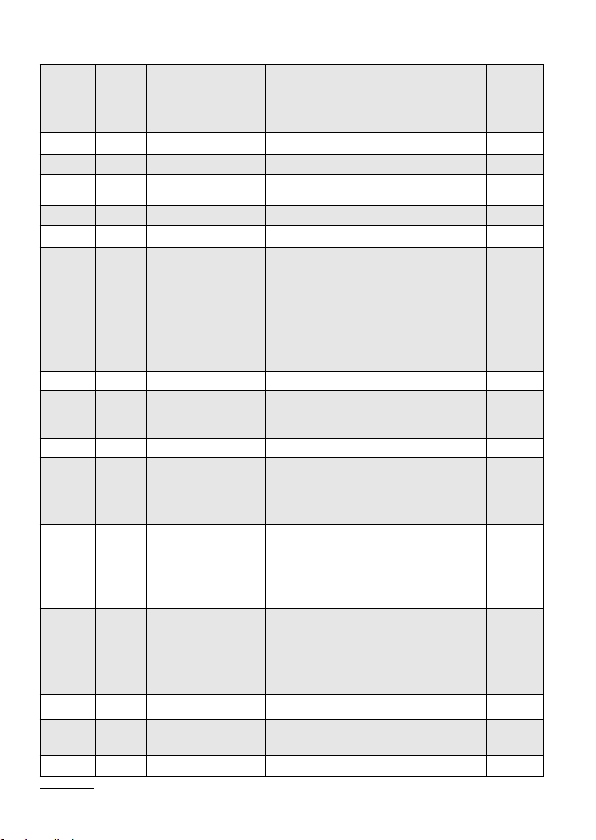
Regi-
Table 9
Ope-
ster
ra-
ad-
tions
dress
4000 RW 0 … 60000 Protection - password 0
4001 RW Reserved
4002 RW 0...1200 [
4003 RW 1 … 10000 Current transformer ratio 1
4004 RW 1 … 40000 Voltage transformer ratio *10 10
4005 RW 0...3
4006 RW Reserved
4007 RW 0.1
4008 RW Reserved
4009 RW 0.1
4010 RW 0 … 61
4011 RW 0..3
4012 RW 0.1 Erasing of mean active power P
4013 RW Reserved
4014 RW 0.1 Erasing of min. and max. 0
Range Description
o
/oo]
Mean ordered power *10
nominal signals
Mean active power synchronization:
0 - 15-minute moving window
1 – measurement synchr. with
clock every 15 minutes,
2 – measurement synchr. with
clock every 30 minutes,
3 – measurement synchr. with
clock every 60 minutes
Max and min value saving
method: 0 – no errors,
1 – with errors
Reactive energy calculation
method:
0 – inductive and capacity energy
1 – positive and negative energy
Display panel illumination:
0 – off,
1-60 – illumination time in seconds from pressing the button;
61 – always on
Energy counters erasing
0 – no changes,
1 – erase active energies,
2 – erase reactive energies,
3 – erase all energies
AV
De-
fault
1000
0
0
0
61
0
0
34
Page 33
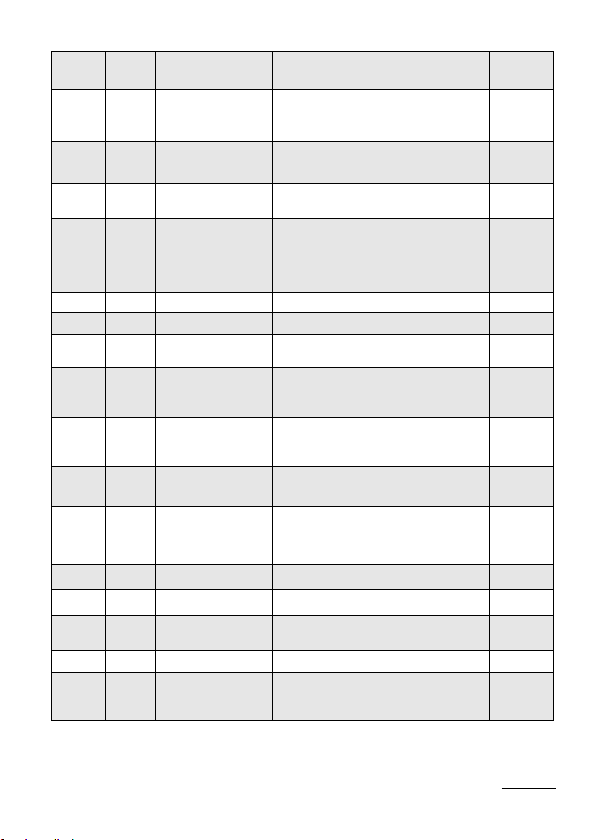
4015 RW 0.1...35
Quantity on the relay output of
alarm 1 (code as in Table 6)
Output type 1: 0 – n-on, 1– n-oFF,
4016 RW 0..5
2 – on, 3 – oFF, 4 – H-on,
5 – H-oFF
4017 RW
4018 RW
-1440...0...1440
o
[
/oo]
-1440...0...1440
o
[
/oo]
Lower value of the alarm 1 switch
of the rated input range
Upper value of the alarm 1 switch
of the rated input range
990
1010
Alarm 1 switch delay value
4019 RW 0...900 s
(for AL_n = P_ord – register 4015
= 35, delay occurs only at alarm
activation)
4020 RW 0.1 Alarm 1 signalization latch 0
4021 RW 0...900 s Alarm 1 re-activation block 0
4022 RW 0.1..35
Quantity on the relay output of
alarm 2 (code as in Table 6)
Output type 1: 0 – n-on, 1– n-
4023 RW 0..5
oFF, 2 – on, 3 – oFF, 4 – H-on,
5 – H-oFF
4024 RW
4025 RW
-1440...0...1440
o
/oo]
[
-1440...0...1440
o
/oo]
[
Lower value of the alarm 2
switch of the rated input range
Upper value of the alarm 2 switch
of the rated input range
990
1010
Alarm 2 switch delay value (for AL_n
4026 RW 0...900 s
= P_ord – register 4015 = 35, delay
occurs only at alarm activation)
4027 RW 0.1 Alarm 2 signalization latch 0
4028 RW 0...900 s Alarm 2 re-activation block 0
4029 RW 5000 … 20000
No. of impulses for the impulse
output
5000
4030 RW 1..247 MODBUS Network Address 1
4031 RW 0..3
Transmission mode: 0->8n2,
1->8e1, 2->8o1, 3->8n1
24
0
0
24
0
0
0
35
Page 34
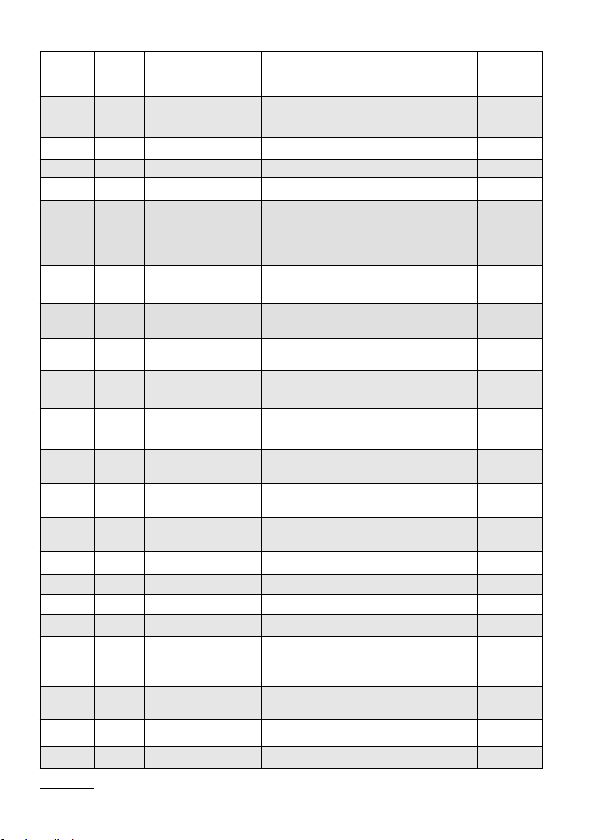
4032 RW 0...3
4033 RW 0.1
4034 RW 0 … 2359 Hour *100 + minutes 0
4035 RW 101 … 1231 Month * 100 + day 101
4036 RW 2009 … 2100 Year 2009
4037 RW 0.1
4038 RW 0..15258
4039 RW 0..65535
4040 RW 0..15258
4041 RW 0..65535
4042 RW 0..15258
4043 R 0..65535
4044 R 0..15258
4045 R 0..65535
4046 Reserved
4047 Reserved
4048 Reserved
4049 Reserved
4050 R 0..65535
4051 R 0..65535
4052 Reserved
4053 R 0..65535 Serial number two older bytes -
Transmission speed: 0->4800,
1->9600, 2->19200, 3->38400
Upgrade change of transmission
parameters
Standard parameters save
(complete with reseting energy
as well as min, max and mean
power to 0)
Imported active energy,
two older bytes
Imported active energy,
two younger bytes
Exported active energy,
two older bytes
Exported active energy,
two younger bytes
Reactive inductive energy,
two older bytes
Reactive inductive energy,
two younger bytes
Reactive capacity energy,
two older bytes
Reactive capacity energy,
two younger bytes
Status Register –
see description below
Status Register 2 –
see description below
1
0
0
0
0
0
0
0
0
0
0
36
Page 35

4054 R 0..65535 Serial number two younger bytes -
4055 R 0..65535 Software version (*100) -
4056 RW 0..65535
4057 Reserved
uantity parameters displayed 0xFFFF
Q
Brackets [ ] contain, respectively: resolution or unit.
Energy is made available in hundreds of watt-hours (var-hours)
in double 16-bit register, and for this reason, one must divide
them by 10 when calculating values of particular energy from
registers, e.g.:
Imported active energy = (reg. value 4038 x 65536 +
reg. value 4039) / 10 [kWh]
Exported active energy = (reg. value 4040 x 65536 +
reg. value 4041) / 10 [kWh]
Exported inductive energy = (reg. value 4042 x 65536 +
reg. value 4043) / 10 [kVarh]
Exported capacity energy = (reg. value 4044 x 65536
+ reg. value 4045) / 10 [kVarh]
37
Page 36

Status Register (address 4050, R):
Bit 15 – „1” – damage of non-volatile memory
Bit 14 – „1” – lack of calibration or invalid calibration
Bit 13 – „1” – error of parameter values
Bit 12 – „1” – error of energy values
Bit 11 – „1” – error of phase sequence
Bit 10 – current range „0” – 1 A ~; „1” – 5 A ~
Bit 9 Bit 8 Voltage range:
0 0 57.8 V ~
0 1 230 V~
Bit 7 – „1” – the interval of power averaging has not elapsed
Bit 6 – „1” – frequency for THD calculation outside ranges:
- 48 – 52 for 50 Hz,
- 58 – 62 for 60 Hz
Bit 5 – „1” – too low voltage to measure the frequency
Bit 4 – „1” – L3 phase voltage too low
Bit 3 – „1” – L2 phase voltage too low
Bit 2 – „1” – L1 phase voltage too low
Bit 1 – „1” – RTC
Bit 0 – „1” – relay output state „1” – on, „0” - off
38
Page 37

Status Register 2 – reactive power characteristics
(address 4051, R):
Bit 15...12 - reserved
Bit 11 – „1” – capacity 3L max,
Bit 10 – „1” – capacity 3L min.
Bit 9 – „1” – capacity 3L
Bit 8 – „1” – capacity L3 max.
Bit 7 – „1” – capacity L3 min.
Bit 6 – „1” – capacity L3
Bit 5 – „1” – capacity L2 max.
Bit 4 – „1” – capacity L2 min.
Bit 3 – „1” – capacity L2
Bit 2 – „1” – capacity L1 max.
Bit 1 – „1” – capacity L1 min.
Bit 0 – „1” – capacity L1
Congurationregisterofdisplayedbasequantities parameters
(address 4056, R/W):
Bit 15 – „1” – date and time display
Bit 14 – „1” – usage of ordered power display
Bit 13 – „1” – neutral wire current display
Bit 12 – „1” – mean active power display
Bit 11 – „1” – frequency display
Bit 10 – „1” – current THD display
Bit 9 – „1” – voltage THD display
Bit 8 – „1” – reactive inductive energy display
Bit 7 – „1” – reactive capacitive energy display
Bit 6 – „1” – active exported energy display
Bit 5 – „1” – active imported energy display
Bit 4 – „1” – power tangent display
Bit 3 – „1” – power factor display
Bit 2 – „1” – apparent power display
Bit 1 – „1” – reactive power display
Bit 0 – „1” – phase-to-phase volage display
39
Page 38
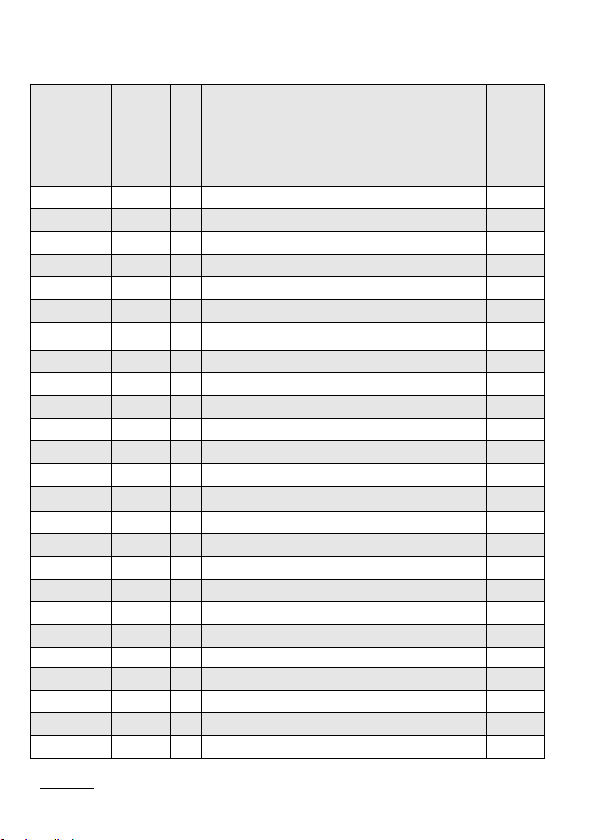
Table 10
Ad-
Address
of 16 bit
registers
6000/7000 7500 R L1 phase voltage V
6002/7002 7501 R L1 phase current A
6004/7004 7502 R L1 phase active power W
6006/7006 7503 R L1 phase reactive power var
6008/7008 7504 R L1 phase apparent power VA
6010/7010 7505 R L1 phase power factor (PF) -
6012/7012 7506 R L1 phase reactive to active power ratio -
6014/7014 7507 R L2 phase voltage V
6016/7016 7508 R L2 phase current A
6018/7018 7509 R L2 phase active power W
6020/7020 7510 R L2 phase reactive power var
6022/7022 7511 R L2 phase apparent power VA
6024/7024 7512 R L2 phase power factor (PF) -
6026/7026 7513 R L2 phase reactive to active power ratio -
6028/7028 7514 R L3 phase voltage V
6030/7030 7515 R L3 phase current A
6032/7032 7516 R L3 phase active power W
6034/7034 7517 R L3 phase reactive power var
6036/7036 7518 R L3 phase apparent power VA
6038/7038 7519 R L3 phase power factor (PF) -
6040/7040 7520 R L3 phase reactive to active power ratio -
6042/7042 7521 R Mean 3-phase voltage V
6044/7044 7522 R Mean 3-phase current A
6046/7046 7523 R 3-phase active power (P1+P2+P3) W
6048/7048 7524 R 3-phase reactive power (Q1+Q2+Q3) var
dress
of 32
bit
regi-
sters
Description
Operations
Unit
40
Page 39
6050/7050 7525 R 3-phase apparent power (S1+S2+S3) VA
6052/7052 7526 R Mean power factor (PF) -
6054/7054 7527 R Mean reactive to active power ratio -
6056/7056 7528 R Frequency Hz
6058/7058 7529 R Phase-to-phase voltage L1-L2 V
6060/7060 7530 R Phase-to-phase voltage L2-L3 V
6062/7062 7531 R Phase-to-phase voltage L3-L1 V
6064/7064 7532 R Mean phase-to-phase voltage V
6066/7066 7533 R
Active power, 3-phase, 15, 30, 60 minutes
(P1+P2+P3)
6068/7068 7534 R THD U1 %
6070/7070 7535 R THD U2 %
6072/7072 7536 R THD U3 %
6074/7074 7537 R THD I1 %
6076/7076 7538 R THD I2 %
6078/7078 7539 R THD I3 %
6080/7080 7540 R Cosine of U1 and I1 angle -
6082/7082 7541 R Cosine of U2 and I2 angle -
6084/7084 7542 R Cosine of U3 and I3 angle -
6086/7086 7543 R Mean 3-phase cosine -
6088/7088 7544 R Angle between U1 and I1
6090/7090 7545 R Angle between U2 and I2
6092/7092 7546 R Angle between U3 and I3
6094/7094 7547 R
6096/7096 7548 R
6098/7098 7549 R
6100/7100 7550 R
6102/7102 7551 R
Neutral wire current (calculated from
vectors)
Active 3-phase input energy (no. of register
7549overows,resetsto0afterreaching
99999999.9 kWh)
Active 3-phase input energy (counter counting up to 99999.9 kWh)
Active 3-phase output energy (no. of
register7551overows,resetsto0after
reaching 99999999,9 kWh)
Active 3-phase output energy (counter
counting up to 99999.9 kWh)
100
MWh
kWh
100
MWh
kWh
W
o
o
o
A
41
Page 40
6104/7104 7552 R
Reactive 3-phase inductive energy (no. of
register7553overows,resetsto0after
reaching 99999999,9 kVarh).
100
Mvarh
6106/7106 7553 R
6108/7108 7554 R
6110/7110 7555 R
6112/7112 7556 R Reserved
6114/7114 7557 R Reserved
6116/7116 7558 R Reserved
6118/7118 7559 R Reserved
6120/7120 7560 R Time – hours, minutes -
6122/7122 7561 R Time – month, day -
6124/7124 7562 R Time - year 6126/7126 7563 R Usage of ordered power %
6128/7128 7564 R Voltage L1 min V
6130/7130 7565 R Voltage L1 max V
6132/7132 7566 R Voltage L2 min V
6134/7134 7567 R Voltage L2 max V
6136/7136 7568 R Voltage L3 min V
6138/7138 7569 R Voltage L3 max V
6140/7140 7570 R Current L1 min A
6142/7142 7571 R Current L1 max A
6144/7144 7572 R Current L2 min A
6146/7146 7573 R Current L2 max A
6148/7148 7574 R Current L3 min A
6150/7150 7575 R Current L3 max A
6152/7152 7576 R Active power L1 min W
6154/7154 7577 R Active power L1 max W
Reactive 3-phase inductive energy (counter
counting up to 99999.9 kVarh)
Reactive 3-phase capacity energy (no. of
register7555overows,resetsto0after
reaching 99999999,9 kVarh)
Reactive 3-phase capacity energy (counter
counting up to 99999.9 kVarh)
kvarh
100
Mvarh
kvarh
42
Page 41
6156/7156 7578 R Active power L2 min W
6158/7158 7579 R Active power L2 max W
6160/7160 7580 R Active power L3 min W
6162/7162 7581 R Active power L3 max W
6164/7164 7582 R Reactive power L1 min var
6166/7166 7583 R Reactive power L1 max var
6168/7168 7584 R Reactive power L2 min var
6170/7170 7585 R Reactive power L2 max var
6172/7172 7586 R Reactive power L3 min var
6174/7174 7587 R Reactive power L3 max var
6176/7176 7588 R Apparent power L1 min VA
6178/7178 7589 R Apparent power L1 max VA
6180/7180 7590 R Apparent power L2 min VA
6182/7182 7591 R Apparent power L2 max VA
6184/7184 7592 R Apparent power L3 min VA
6186/7186 7593 R Apparent power L3 max VA
6188/7188 7594 R Power factor (PF) L1 min -
6190/7190 7595 R Power factor (PF) L1 max -
6192/7192 7596 R Power factor (PF) L2 min -
6192/7194 7697 R Power factor (PF) L2 max -
6196/7196 7698 R Power factor (PF) L3 min -
6198/7198 7699 R Power factor (PF) L3 max -
6200/7200 7600 R Reactive to active power ratio L1 min -
6202/7202 7601 R Reactive to active power ratio L1 max -
6204/7204 7602 R Reactive to active power ratio L2 min -
6206/7206 7603 R Reactive to active power ratio L2 max -
6208/7208 7604 R Reactive to active power ratio L3 min -
6210/7210 7605 R Reactive to active power ratio L3 max -
6212/7212 7606 R Phase-to-phase voltage L1-2 min V
6214/7214 7607 R Phase-to-phase voltage L1-2 max V
6216/7216 7608 R Phase-to-phase voltage L2-3 min V
6218/7218 7609 R Phase-to-phase voltage L2-3 max V
6220/7220 7610 R Phase-to-phase voltage L3-1 min V
43
Page 42
6222/7222 7611 R Phase-to-phase voltage L3-1 max V
6224/7224 7612 R Mean 3-phase voltage (min) V
6226/7226 7613 R Mean 3-phase voltage (max) V
6228/7228 7614 R Mean 3-phase current (min) A
6230/7230 7615 R Mean 3-phase current (max) A
6232/7232 7616 R 3-phase active power (min) W
6234/7234 7617 R 3-phase active power (max) W
6236/7236 7618 R 3-phase reactive power (min) var
6238/7238 7619 R 3-phase reactive power (max) var
6240/7240 7620 R 3-phase apparent power (min) VA
6242/7242 7621 R 3-phase apparent power (max) VA
6244/7244 7622 R Power factor (PF) min -
6246/7246 7623 R Power factor (PF) max -
6248/7248 7624 R
6250/7250 7625 R
6252/7252 7626 R Frequency min Hz
6254/7254 7627 R Frequency max Hz
6256/7256 7628 R Mean phase-to-phase voltage (min.) V
6258/7258 7629 R Mean phase-to-phase voltage (max.) V
6260/7260 7630 R Active power, 3-phase, 15, 30, 60 minutes (min.) W
6262/7262 7631 R Active power, 3-phase, 15, 30, 60 minutes (max.) W
6264/7264 7632 R harmonic U1 / THD U1 min V/%
6266/7266 7633 R harmonic U1 / THD U1 max V/%
6268/7268 7634 R harmonic U2 / THD U2 min V/%
6270/7270 7635 R harmonic U2 / THD U2 max V/%
6272/7272 7636 R harmonic U3 / THD U3 min V/%
6274/7274 7637 R harmonic U3 / THD U3 max V/%
6276/7276 7638 R harmonic I1 / THD I1 min A/%
6278/7278 7639 R harmonic I1 / THD I1 max A/%
6280/7280 7640 R harmonic I2 / THD I2 min A/%
6282/7282 7641 R harmonic I2 / THD I2 max A/%
6284/7284 7642 R harmonic I3 / THD I3 min A/%
6286/7286 7643 R harmonic I3 / THD I3 max A/%
Reactive to active power ratio (3-phase
mean min.)
Reactive to active power ratio (3-phase
mean max.)
-
-
44
Page 43
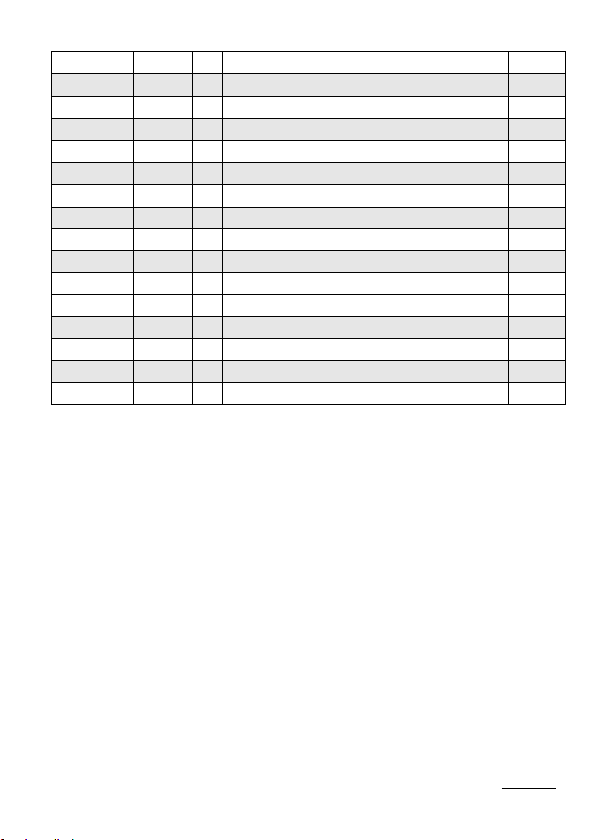
6288/7288 7644 R Cos of U1 and I1 angle (min.) -
6290/7290 7645 R Cos of U1 and I1 angle (max.) -
6292/7292 7646 R Cos of U2 and I2 angle (min.) -
6294/7294 7647 R Cos of U2 and I2 angle (max.) -
6296/7296 7648 R Cos of U3 and I3 angle (min.) -
6298/7298 7649 R Cos of U3 and I3 angle (max.) -
6300/7300 7650 R Mean 3-phase cos (min.) -
6302/7302 7651 R Mean 3-phase cos (max.) -
6304/7304 7652 R U1 and I1 angle (min.)
6306/7306 7653 R U1 and I1 angle (max.)
6308/7308 7654 R U2 and I2 angle (min.)
6310/7310 7655 R U2 and I2 angle (max.)
6312/7312 7656 R U3 and I3 angle (min.)
6314/7314 7657 R U3 and I3 angle (max.)
o
o
o
o
o
o
6316/7316 7658 R Neutral wire current (min.) A
6318/7318 7659 R Neutral wire current (max.) A
When lower limit is exceeded, a -1e20 value is displayed.
Conversely, when upper limit is exceeded, a 1e20 value is
displayed.
45
Page 44

9. ERROR CODES
During the meter operation, error messages may be
displayed. Following list shows causes of particular errors.
- Err1 – too low voltage or current during measurement:
- PF
, tgji, cos, THD less than 10% Un,
i
- PF
, tgji, cos less than 1% In,
i
- THD less than 10% In,
- f less than 10% Un,
- I
less than 10% In;
(N)
- bAd Freq – during THD measurement, when frequency value
is outside 48 – 52 Hz range for 50Hz and outside
58 – 62 Hz range for 60 Hz;
- Err bat – internal RTC battery. The measurement is carried out
after switching the supply on and every day at midnight.
Then the message may be turned off by pressing
the button. Then the message will be inactive until
the meter is turned off and on again;
- Err CAL, Err EE – meter memory damaged. In such case meter
should be sent back to the manufacturer.
- Err PAr – incorrect operational parameters of the meter.
In such case meter should be set to default (factory)
settings (from menu or via RS-485 interface). Message
can be disabled by pressing button.
- Err Enrg – incorrect energy parameters. Message can be
disabled by pressing button. Incorrect energy values are
set to 0.
46
Page 45

- Err L3 L2 – phase sequence error. Switch phase 2 and
phase 3 connections. Message may be disabled
by pressing the button. Then the message will be
inactive until the meter is turned off and on again;
-
– lower limit exceeded. Measured value is lower that
----
the lower measuring limit for a given quantity.
----
-
– upper limit exceeded. Measured value is higher that
the upper measuring limit for a given quantity
or measurement error occurred.
47
Page 46
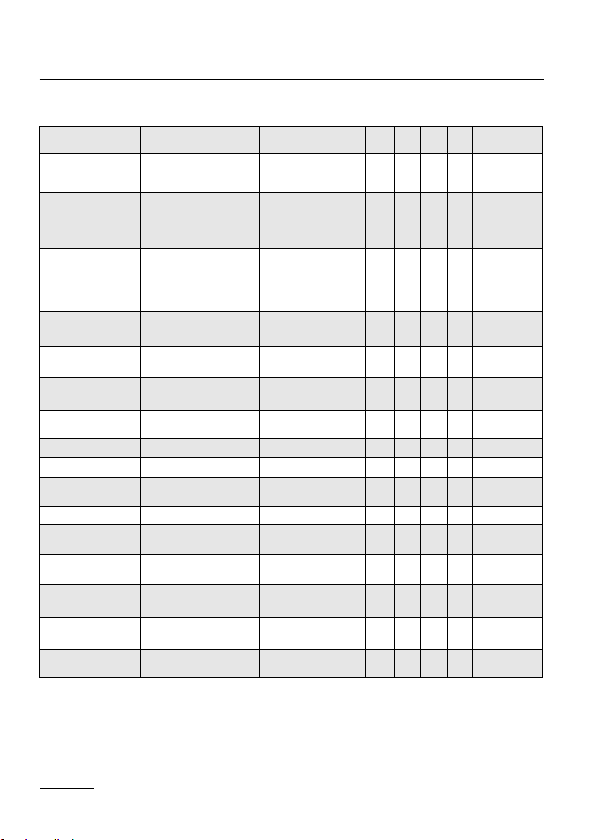
10. TECHNICAL DATA
Measuring Ranges and Admissible Basic Errors
Measured
value
Current In
1 A
A
5
Voltage L-N
57.7 V
230 V
290 V
Voltage L-L
100 V
400 V
500 V
F
requency 47.0 ... 63.0 Hz 47,0 ... 63.0 Hz
Active power
Reactive power
Apparent power 0,00 VA ... 9999 MVA 1,0 VA ... 1,52 kVA
Power factor PF
j
Tangent
j
Cosinus
j
Imported active
energy
Exported active
energy
Reactive inductive
energy
Reactive
capacitive energy
THD 0...100% 0...100%
Indication
range*
0,00 ... 1.5 kA
0,00 ... 60 kA
0,0 ... 230.8 kV
0,0 ... 1.012 MV
0,0 ... 1.200 MV
0.0 ... 440 kV
0.0 ... 1.752 MV
0.0 ... 2.000 MV
-9999 MW ...0,00 W
... 9999 MW
-9999 Mvar ...0,00
var ... 9999 Mvar
-1 ... 0 ... 1 -1 ... 0 ... 1
-1.2 ... 0 ... 1.2 -1,2 ... 0 ... 1.2
-1 ... 1 -1 ... 1
-180 ... 180 -180 ... 180
0 ...99 999 999.9
kWh
0 ...99 999 999.9
kWh
0...99 999 999,9
kVarh
0...99 999 999,9
kVarh
Measuring
range
0,005 ... 1,200 A~
0,025 ... 6.000 A~
49 ... 64 V~
195 ... 253 V~
246 ... 300 V~
85 ... 110 V~
340 ... 440 V~
425 ... 520 V~
-1,52 kW ...1,0 W
... 1,52 kW
-1,52 kvar ...1,0
var ... 1,52 kvar
L1 L2 L3
l l l
l l l
l l l
l l l
l l l l
l l l l
l l l l
l l l l
l l l l
l l l l
l l l
l l l
S
l
l
l
l
Table 11
Basic
error
±0.2% rng
±0.2% m.q.
±0.5% m.q.
±0.2% m.q.
±0.5% rng
±0.5% rng
±0.5% rng
±1% rng
±1% rng
±1% rng
±0.5% rng
±0.5% rng
±0.5% rng
±0.5% rng
±0.5% rng
±5% rng
*Depending on the setting of tr_U (voltage transformer ratio: 0.1 ... 4000.0
and tr_I (current transformer ratio: 1 ... 10000)
m.q. - error in relation to measured quantity
rng - error relevant to range value
Caution! Correct measurement requires L3 phase voltage higher
than 0.85 Un.
48
Page 47

Power consumption:
- in L1 and L2 voltage circuit 0.05 VA
- in L3 voltage circuit 3 VA
- in current circuits 0.05 VA
Display dedicated 3.5” LCD display,
Relay outputs 2 relays, volt-free NO contacts
current capacity 250 V~/ 0,5 A~ (a.c.)
Serial interface RS485: address 1..247
mode: 8N2, 8E1, 8O1,8N1
baud rate: 4.8, 9.6, 19.2, 38,4 kbit/s
transmission protocol: Modbus RTU
response time: 750 ms
Energy impulse output OC (NPN) output, class A passive,
compliant with EN 62053-31;
supply voltage 18...27 V,
current 10...27mA
Pulsing constant
of OC output 5000 - 20000 pulses/kWh
independently of set tr_U, tr_I ratios
Protection grade of the casing
from the front IP 65
from behind the panel IP 20
Weight 0.3 kg
Dimensions 96 x 96 x 77 mm
49
Page 48

Reference and rated operating conditions
- supply voltage /in L3 phase measurement circuit/:
50 .. 64 V a.c. or 195 .. 253 V a.c. or 246 .. 300 V a.c.
47 ...63 Hz
- input signal: 0...0.005...1,2In for current;
0.85..1,1Un for voltage;
0...0.01...1.2In; 0..0.85..1.1Un;
for factors PF
frequency 47...63 Hz;
,tgj
i
i
sinusoidal ( THD 8% )
- power factor -1...0...1
- ambient working temperature -20...23...+55
- storage temperature -30...+70
o
C
o
C
- humidity 25 ... 95 % (no condensation)
- max peak factor:
- current 2
- voltage 2
- externalmagneticeld 0...40...400 A/m
- short-term overload (5 s)
voltage inputs 2 Un
current inputs 10 In
- working position any
- warm-up time 5 min.
Real time clock battery: CR2032
Additional errors:
in % of the base error
- from input signal frequency < 50%
- from ambient temperature changes < 50 % / 10
- for THD > 8% < 100 %
50
o
C
Page 49

ND10 meter complies with following standards:
Electromagnetic compatibility:
- interference immunity acc. to EN 61000-6-2
- interference emission acc. to EN 61000-6-4
Safety requirements: acc. to EN 61010-1
• circuit-to-circuit insulation: basic,
• installation category III,
• pollution level 2,
• max working voltage in reference to ground:
- for power and measurement circuits: 300 V
- for remaining circuits: 50 V
• altitude a.s.l. < 2000 m.
51
Page 50
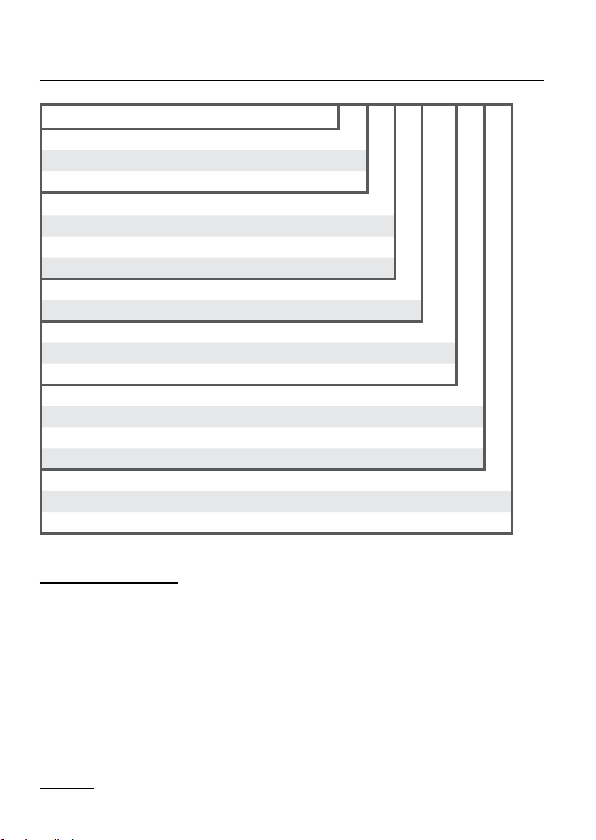
11. ORDERING CODES
Table 12
PCE-ND10 X
Current input In:
1 A (X/1) 1
5 A (X/5) 2
Voltage input (phase/phase-to-phase) Un:
3 x 57.7/100 V 1
3 x 230/400 V 2
3x 290 / 500 V 3
Digital input:
with RS485 interface 1
Version:
standard 00
custom-made* XX
Language:
Polish P
English E
other X
Acceptance tests:
withanextraqualityinspectioncerticate 1
acc. to customer’s requirements* X
* after agreeing with the manufacturer
Example of Order:
The code: PCE-ND10 221100E1 means:
PCE-ND10 – meter of network parameters of PCE-ND10 type
2 – current input In: 5 A (X/5),
2 – input voltage (phase/phase-to-phase) Un = 3 x 230/400 V,
1 – digital input - RS485 interface
00 – standard version,
E – language: english
1 – withanextraqualityinspectioncerticate.
X X XX X X
Table 12
52
 Loading...