

Page 1

Graphic AC Power Analyzer
PCE Americas Inc.
711 Commerce Way
Suite 8
Jupiter
FL-33458
USA
From outside US: +1
Tel: (561) 320-9162
Fax: (561) 320-9176
[email protected]
www.pce-instruments.com/english
www.pce-instruments.com
PCE Instruments UK Ltd.
Southpoint Business Park
Hampshire / Southampton
United Kingdom, SO31 4RF
Units 12/13
Ensign way
From outside UK: +44
Tel: (0) 2380 98703 0
Fax: (0) 2380 98703 9
PCE-GPA 62
Users Manual
Page 2

Caution, risk of danger.
Refer to accompanying documents
Caution, risk of electric shock.
Double Insulation
Application around and removal from HAZARDOUS
LIVE conductors is permitted.
Earth (ground)
AC (Alternating Current)
DC (Direct Current)
Both direct and alternating current
Conforms to relevant European Union directives.
Do not dispose of this clamp meter as unsorted
municipal waste. Contact a qualified recycler for
disposal.
SYMBOLS showed on the clamp meter or in this manual:
Page 3

EN 61010-2-032
CAT III 600V
Pollution Degree 2
WARNING: If the flexible tester is used in a manner
Not specified by the manufacturer, the protection
Provided by the clamp meter may be impaired.
Overvoltage Category I (CAT I):
Equipment for connection to circuits in which measures are
taken to limit the transient overvoltages to an appropriate low level.
Overvoltage Category II (CAT II):
Energy-consuming equipment to be supplied from the fixed
installation.
Overvoltage Category III (CAT III):
Equipment in fixed installations.
SAFETY INFORMATION: (Read First Before Operation)
Please follow the following instructions carefully for safe operation.
■ NEVER use the clamp meter for Voltages higher than 600V.
■ DO NOT hold the clamp meter beyond its tactile barrier.
■ DO NOT use the clamp meter and accessories if they look
damaged.
■ USE CAUTION when working with high voltages.
■ USE CAUTION when measuring the voltages higher than
30VAC rms or 60VDC. These voltages pose a shock hazard.
■ USE EXTREME CAUTION when working around bare
conductors or bus bars.
■ ALWAYS use the clamp meter as the instructions in the manual.
Page 4

TABLE OF CONTENTS
I. FEATURES ................................................................................................................ 1
II. PANEL DESCRIPTION ............................................................................................ 2
III. OPERATING INSTRUCTIONS .............................................................................. 4
III.1 Setup ................................................................................................................... 4
III.2 Measurement of RMS value, THD-F and Harmonics of ACV ....................... 13
III.3 Measurement of RMS value, THD-F and Harmonics of ACA ....................... 16
III.4 Waveforms of ACV and ACA with Phase Angle (φ) ........................................ 19
III.4.1 Waveform of ACV with Peak Value .......................................................... 20
III.4.2 Waveform of ACA with Peak Value .......................................................... 21
III.5 Measurement of Single Phase AC Power Quality .......................................... 22
III.5.1 True Power (W) and Power Factor (PF) .................................................. 23
III.5.2 Apparent Power (VA, KVA) and Reactive Power (VAR, KVAR) ............. 23
III.5.3 Maximum Demand (KW and KVA) .......................................................... 24
III.5.4. Energy (KWh, PFh, KVARh, and KVAh) ................................................. 24
III.5.5 Phasor Diagram ........................................................................................ 24
III.5.6 RMS values of Voltage and Current ......................................................... 25
III.6 Measurement of Balanced 3 Phase AC Power Quality ................................. 26
III.6.1 AC Watt (W) and Power Factor (PF) ........................................................ 26
III.6.2 Apparent Power (VA, KVA) and Reactive Power (VAR, KVAR) ............. 27
III.6.3 Maximum Demand (KW and KVA) .......................................................... 27
III.6.4 Energy (KWh, PFh, KVARh, and KVAh) .................................................. 27
III.6.5. Phasor Diagram ....................................................................................... 28
III.6.6. RMS values of Voltage and Current ........................................................ 28
IV. DATALOGGING OF VOLTAGE (RMS VALUE) AND HARMONICS ............... 29
IV.1 Scheduled Datalogging ............................................................................... 29
IV.2 Immediate Datalogging ................................................................................ 32
V. DATALOGGING OF CURRENT (RMS VALUE) AND HARMONICS ............... 33
V.1 Scheduled Datalogging ................................................................................ 33
V.2 Immediate Datalogging ................................................................................. 35
I
Page 5

VI. DATALOGGING OF VOLTAGE AND CURRENT WAVEFORMS ................... 36
VI.1 Datalogging of both Voltage and Current Waveforms ............................... 36
VI.2 Datalogging of Voltage Waveform .............................................................. 37
VI.3 Datalogging of Current Waveform .............................................................. 38
VII. DATALOGGING OF TRANSIENT DETECTION .............................................. 39
VIII. DATALOGGING OF AC POWER ..................................................................... 44
VIII.1 Scheduled Datalogging ............................................................................. 44
VIII.2 Immediate Datalogging ............................................................................. 46
IX. CLEAR DATA MEMORY ...................................................................................... 47
X. RS-232 INTERFACE PROTOCOL ....................................................................... 47
XI. SPECIFICATIONS (23C±5
XII. BATTERY REPLACEMENT ............................................................................... 52
XIII. MAINTENANCE & CLEANING ......................................................................... 54
C) ............................................................................ 48
II
Page 6

I. FEATURES
a. Power Quality Analysis for Single and Balanced Three Phase System.
b. Harmonic Analysis of Voltage and Current (1 to 50th order).
c. True RMS measurement of V with 0.5% of reading basic accuracy.
d. True RMS measurement of A with 1% of reading basic accuracy
e. Graphic Waveform of Voltage and Current
f. Graphic Phasor Diagram
g. Transient Detection and Logging of Swell, Dip, and Outage.
h. Fast peak function (39μs for 50 Hz, 33μs for 60Hz).
i. Active (W, KW, HP), reactive (VAR, KVAR) and apparent (VA, KVA) power
j. Power factor (PF), phase angle (Φ), and energy (WH, KWH, KVARH, PFH).
k. Measurement of balanced 3Φ Power Quality.
l. Programmable VT ratio from 1 to 3000.
m. Hold functions.
n. Auto power off function in 15 minutes (selectable).
o. Datalogging and Download to a PC.
p. Optical isolated USB data connection.
q. Unlimited datalogging facility on a PC.
1
Page 7

II. PANEL DESCRIPTION
600V
COM
V
L1
L3
1. Jaw Assembly
2. Trigger
Press the trigger to open the jaw assembly.
3. HOLD/CANCEL/BACK LIGHT
Press this button to HOLD the display in LCD, or turn the backlight on or off.
It is also used to delete harmonics in the harmonics configuration
4. Rotary Switch
Select setup, measurement of current, voltage, transient detection, or power.
Turn the unit on or off.
5. LCD
This is a dot matrix LCD with backlight.
2
Page 8

6. + ► Button
. Increment value by 1
. Move the reference axis up
. Move the line cursor right to previous harmonics
. Page up to next transient events
7. REC
Press this button to start Datalogging. Press again to stop. Holding the button and
turning the power on will clear the data memory.
It is also used to add harmonics in the harmonics configuration.
8. - ◄ Button
. Decrement value by 1
. Move the reference axis down
. Move the line cursor left to next harmonics
. Page down to next transient events
9. FUNC Button
Press this button to select different display.
10. V Input Terminal
This terminal is used as input for voltage.
11. COM Terminal
This terminal is used as common voltage reference input.
12. RS-232 window and Battery Cover
3
Page 9
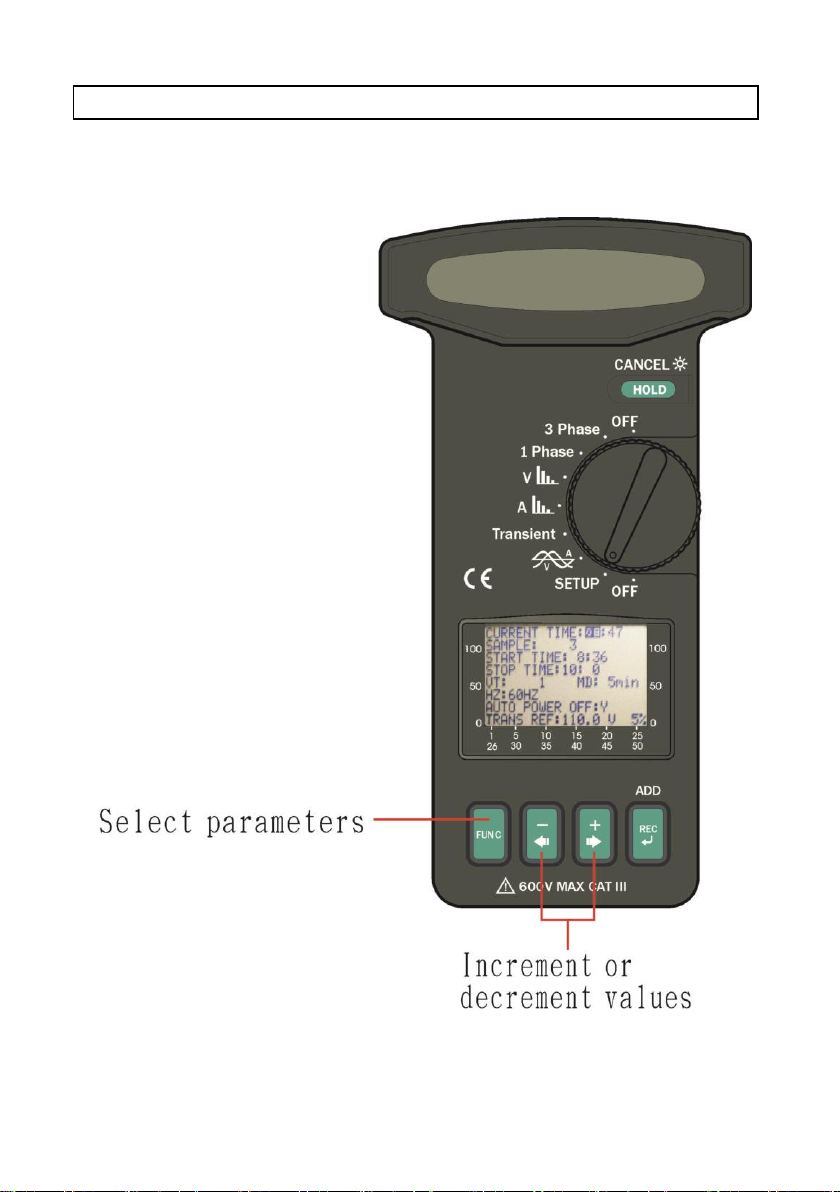
III. OPERATING INSTRUCTIONS
III.1 Setup
Move the rotary switch to the SETUP position. Users should setup the parameters
of the meter before use.
4
Page 10
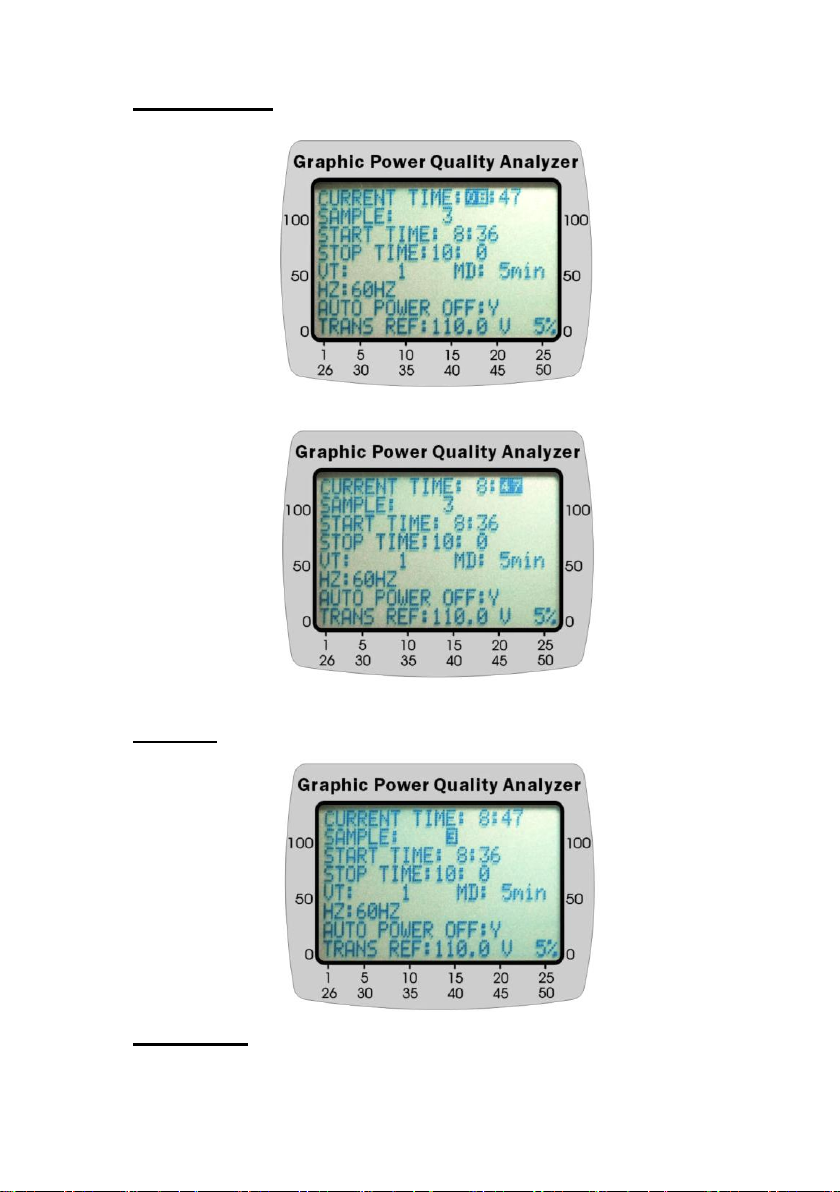
CURRENT TIME: There is a calendar clock inside the meter. Users should
setup the correct time.
HOUR
MINUTE
SAMPLE: Setup the sampling interval in seconds for Datalogging.
START TIME: schedule when to start datalogging
5
Page 11
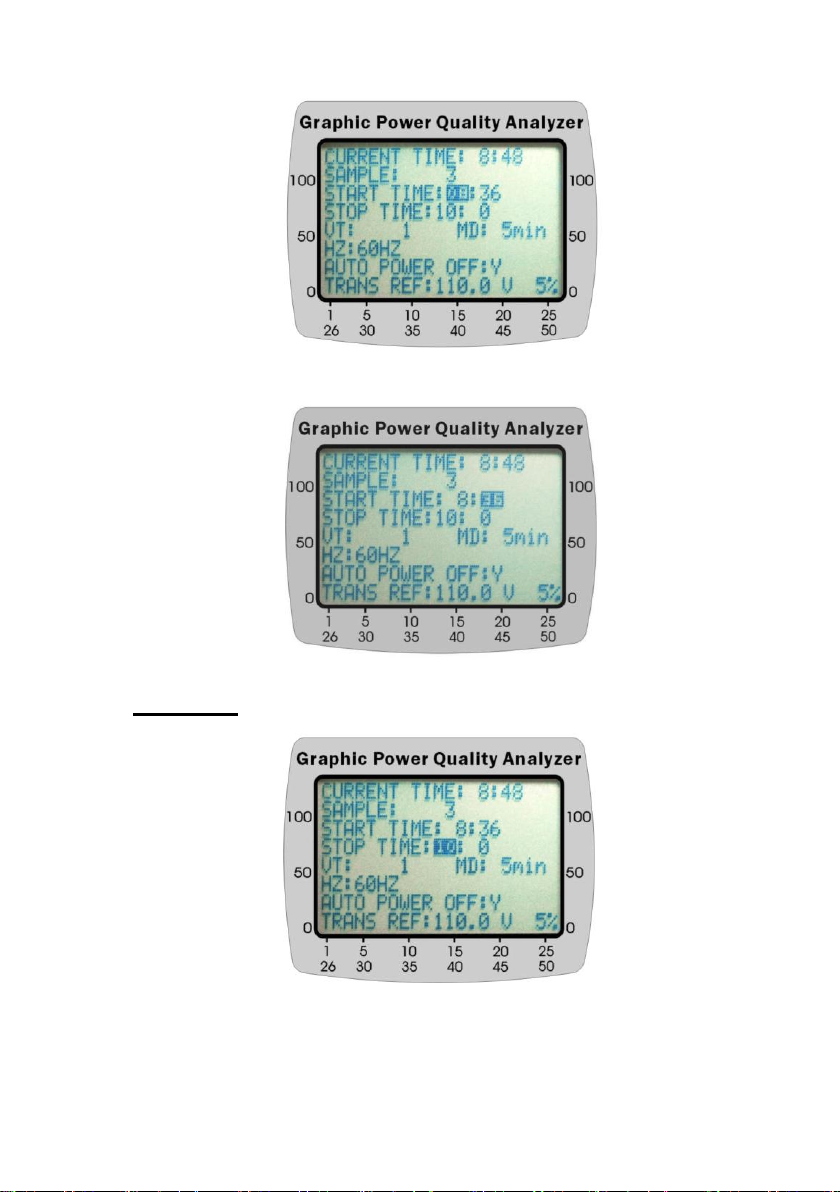
HOUR
MINUTE
STOP TIME: schedule when to stop datalogging
HOUR
6
Page 12
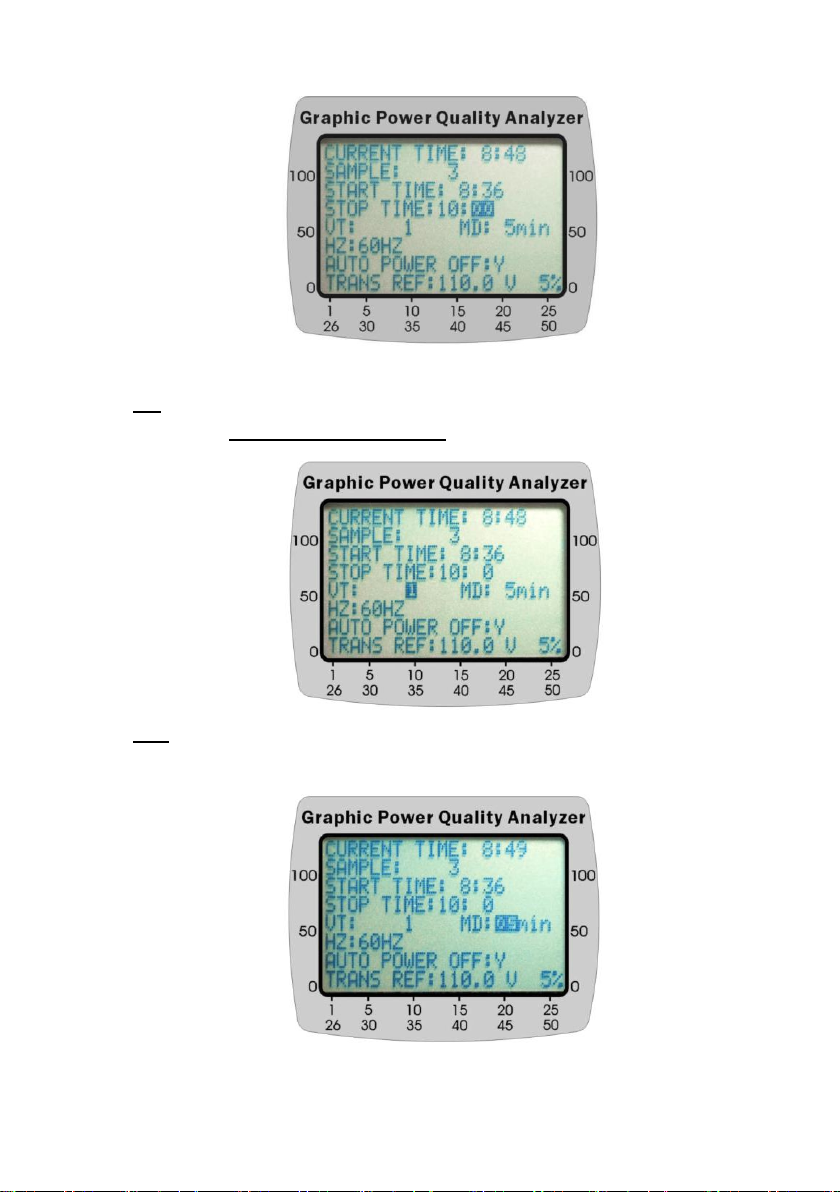
MINUTE
VT: set the ratio of voltage transformer, normally 1.
V (reading) = Voltage * VT
MD: set the time interval form maximum demand in minutes (1 to 60 minutes),
normally 15.
7
Page 13
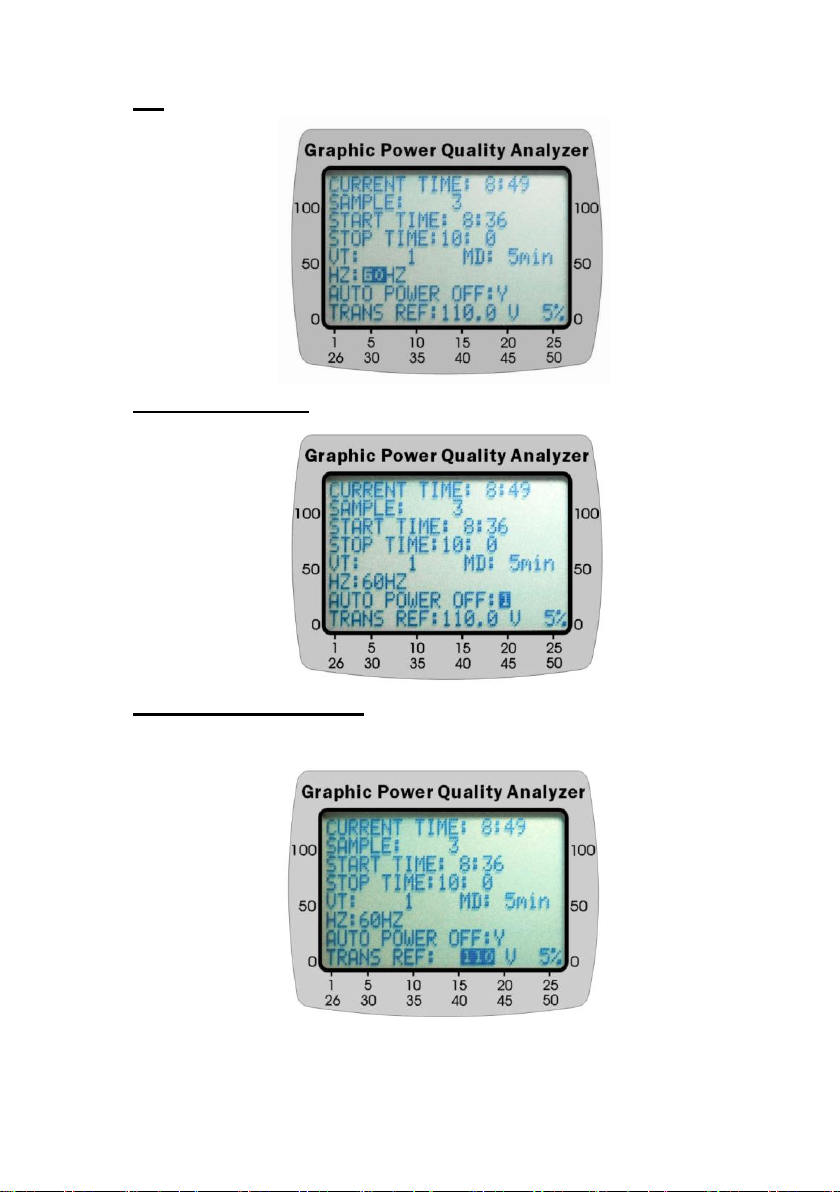
HZ: set the operating frequency to 50Hz, 60Hz, or Auto.
AUTO POWER OFF: enable (1) or disable (0) auto-power-off function.
TRANSIENT REFERENCE: set the nominal voltage and threshold (%) for
transient capture.
NOMINAL VOLTAGE
8
Page 14
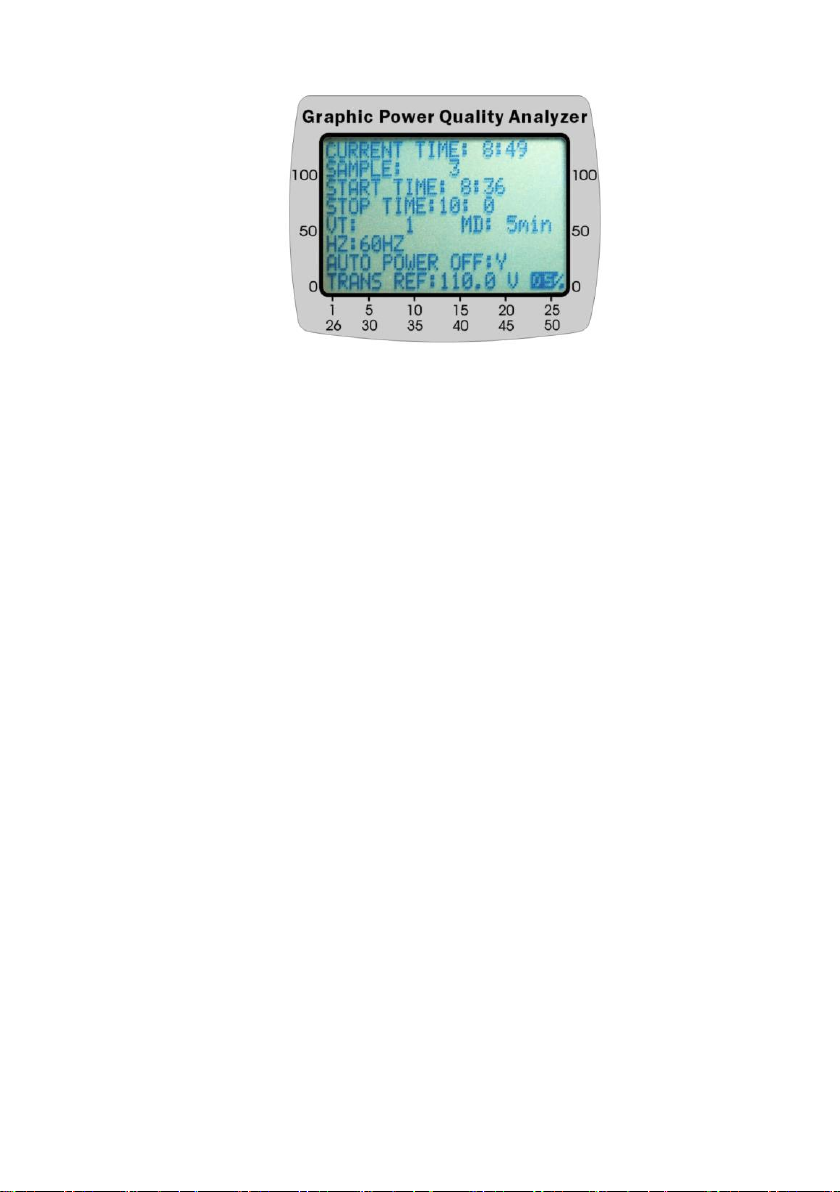
TOLERANCE
9
Page 15

HARMONICS CONFIGURATION: select the harmonics to be logged.
NOTE: The unit will adjust the sampling time according to the amount of
harmonics to be logged
10
Page 16

WAVEFORM CONFIGURATION: set the points to be logged for each cycle of
NOTE: The unit will adjust the sampling time according to the processing time
required to log waveform.
the waveform. There are four options, 32, 64, 128, and 256.
DATE: set the date of the internal calendar clock.
YEAR
11
Page 17

MONTH
DAY
12
Page 18
III.2 Measurement of RMS value, THD-F and Harmonics of ACV
L3
L1
V
COM
600V
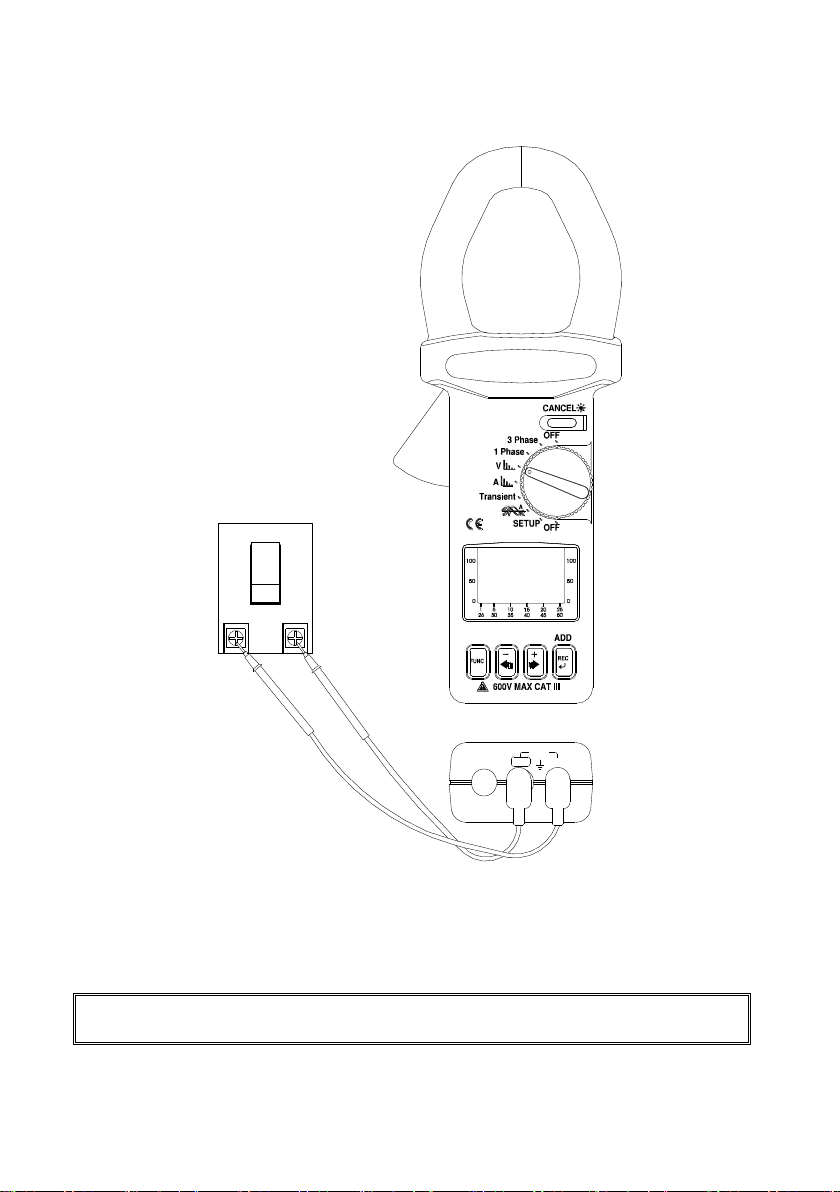
NOTE: If the peak value of the input AC voltage is greater than the maximum
value of the range, then symbol of OL will be displayed.
Voltage:
a. Set the rotary switch at V position.
b. Insert the test leads into the input jack. Connect the test prods of the test
leads in PARALLEL to the circuit to be measured.
13
Page 19

%THD-F: Total Harmonic Distortion with respect to Fundamental frequency
%THD-F = (√(V22+ V32 + … +V492+ V502)) / V1) * 100
Where,
V1: magnitude at the nominal frequency (eg.50 or 60 Hz)
V2: magnitude at the second harmonics
…
V50: magnitude at the 50-th harmonics.
14
Page 20
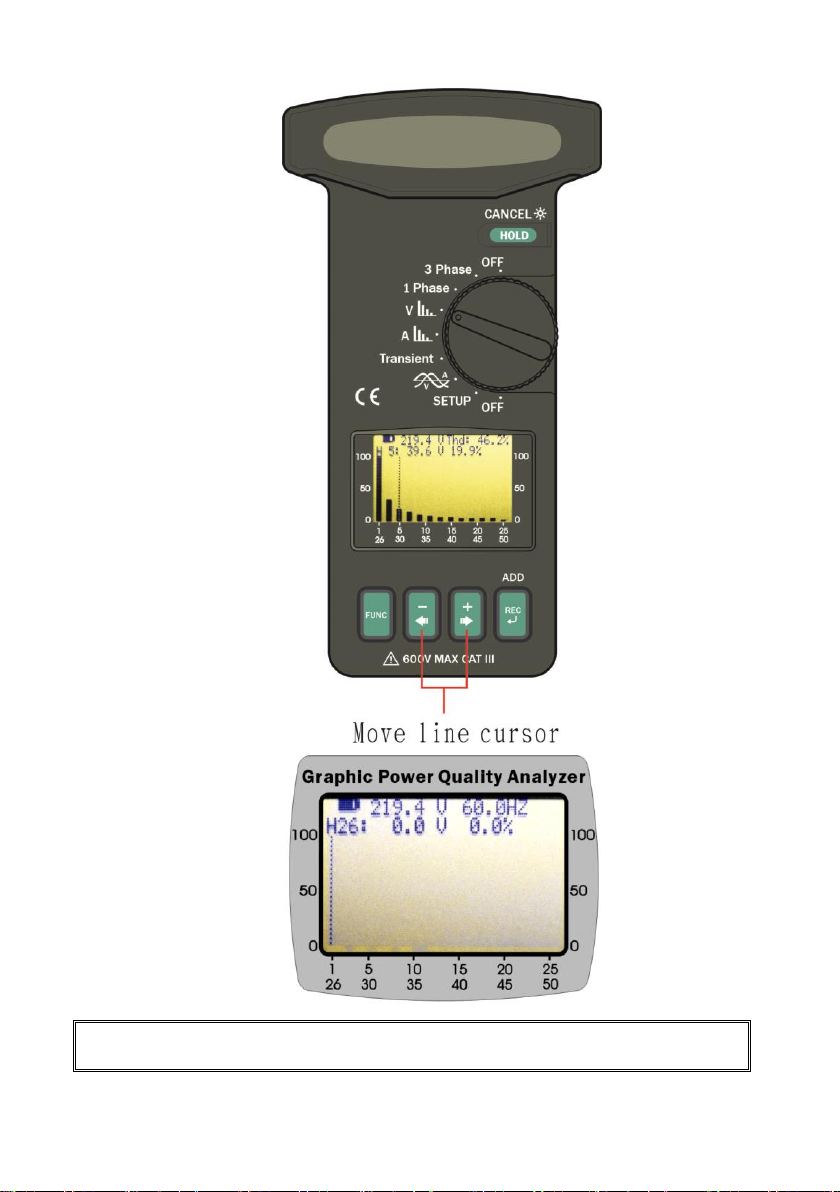
NOTE: Frequency (Hz) is displayed in the second page (Harmonics order 25th to
50th order).
15
Page 21
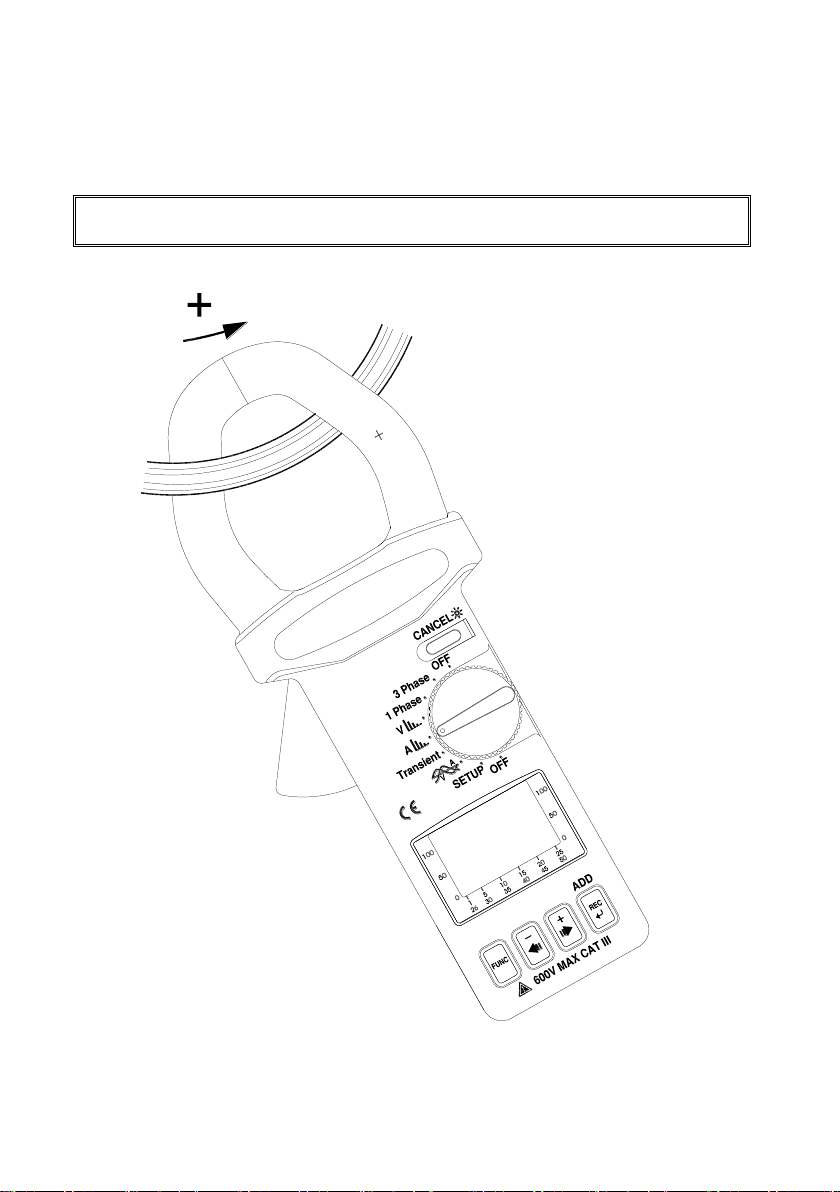
III.3 Measurement of RMS value, THD-F and Harmonics of ACA
WARNING: Make sure that all the test leads are disconnected from the meter's
terminals for current measurement.
a. Set the rotary switch at A position.
b. Clamp on to the conductor, and read the data from LCD display.
16
Page 22
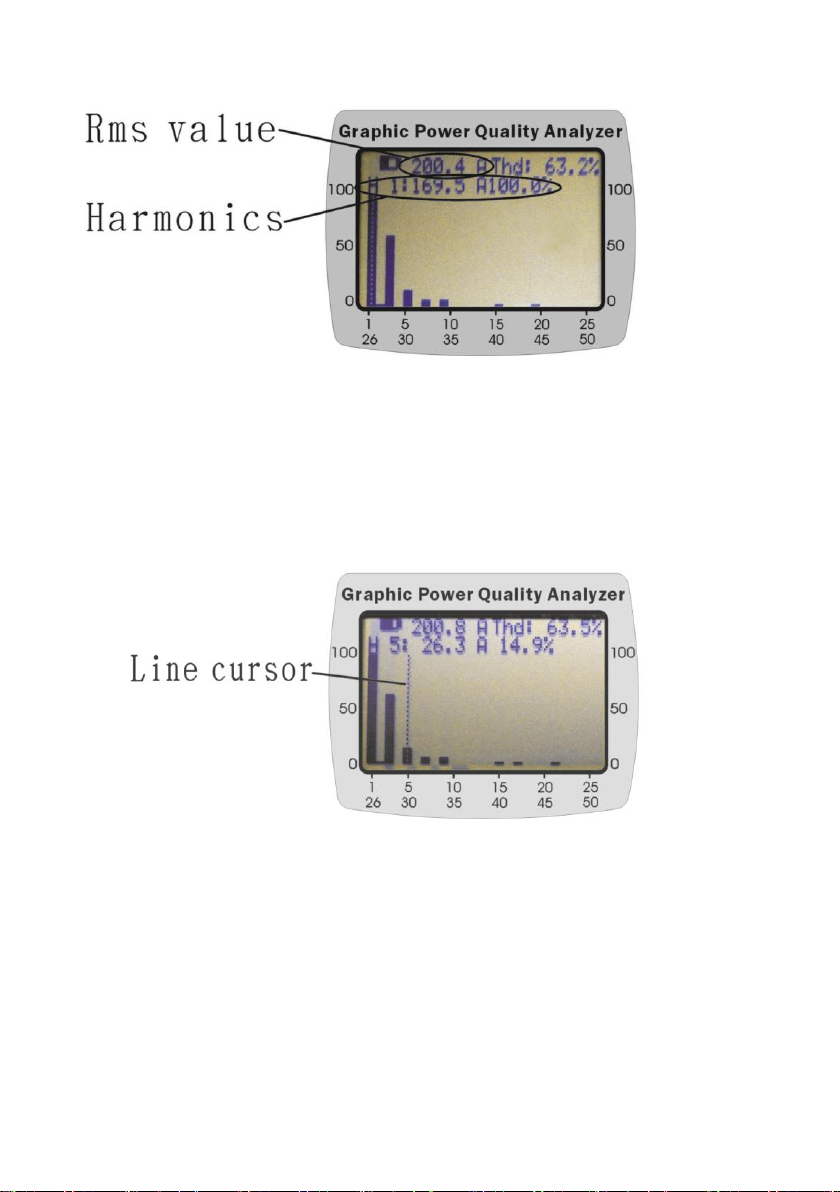
%THD-F: Total Harmonic Distortion with respect to Fundamental frequency
%THD-F = (√(V22+ V32 + … +V492+ V502)) / V1) * 100
Where,
V1: magnitude at the nominal frequency (eg.50 or 60 Hz)
V2: magnitude at the second harmonics
…
V50: magnitude at the 50-th harmonics.
17
Page 23

NOTE: Frequency (Hz) is displayed in the second page (Harmonics order 25th to
50th order).
18
Page 24
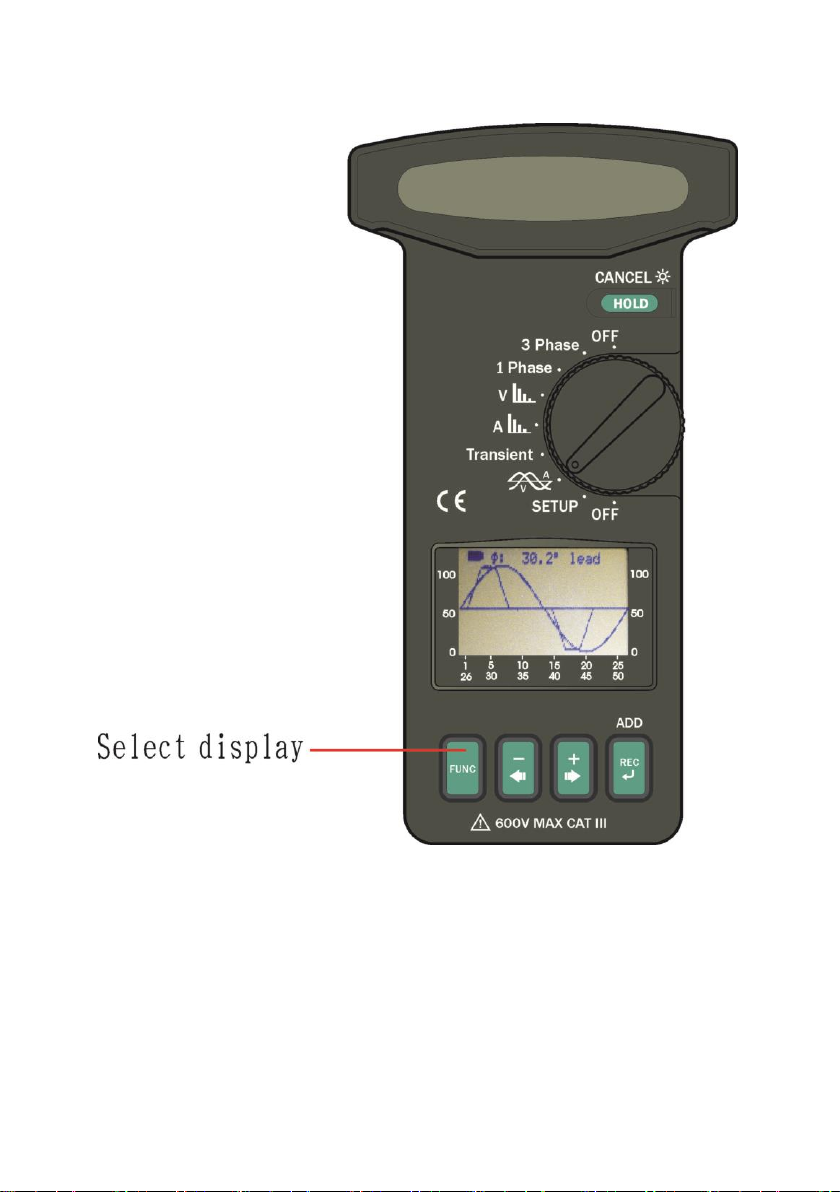
III.4 Waveforms of ACV and ACA with Phase Angle (φ)
19
Page 25
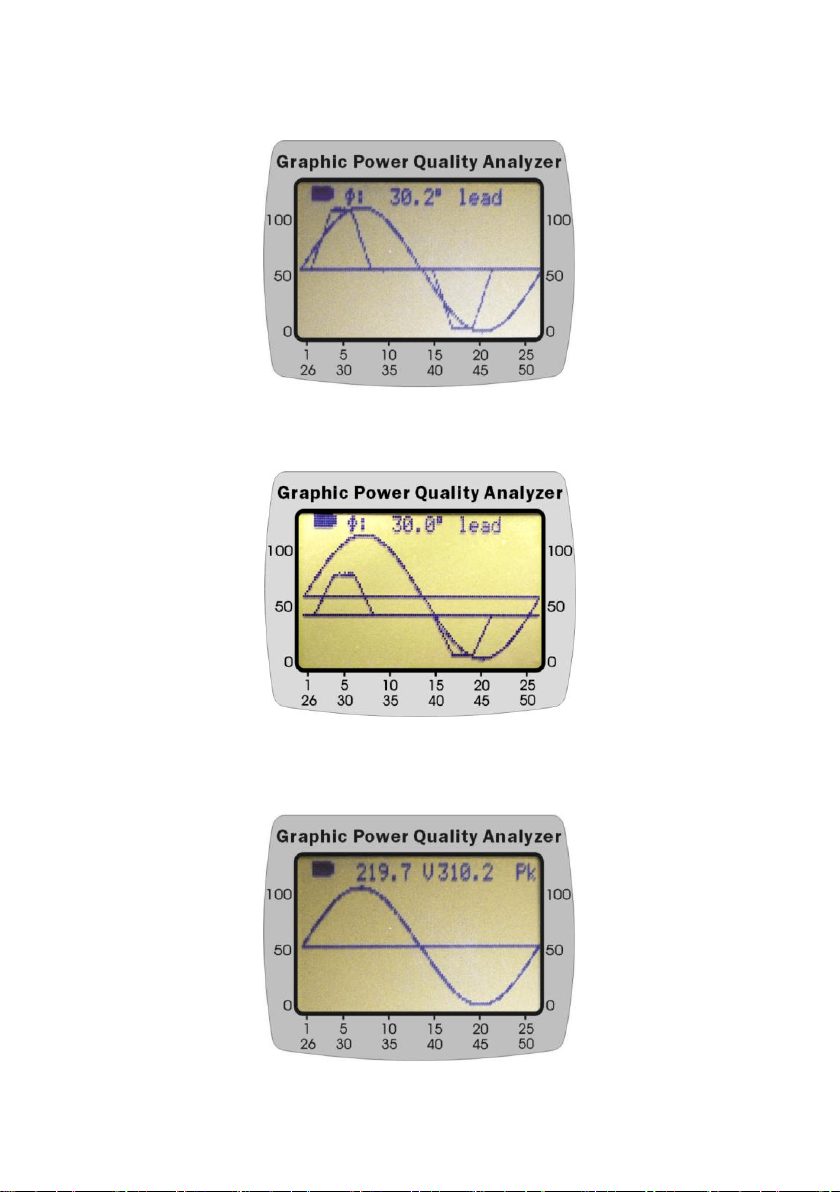
When users set the rotary switch at waveform position, the unit will display both
voltage and current waveform with phase angle.
Users can press the +►or -◄ buttons to move the 0 reference axis of current up or
down. So the waveforms of voltage and current can be easily distinguished as in the
following figure.
III.4.1 Waveform of ACV with Peak Value
Press the FUNC button to select display of voltage waveform with RMS value and
peak value
20
Page 26
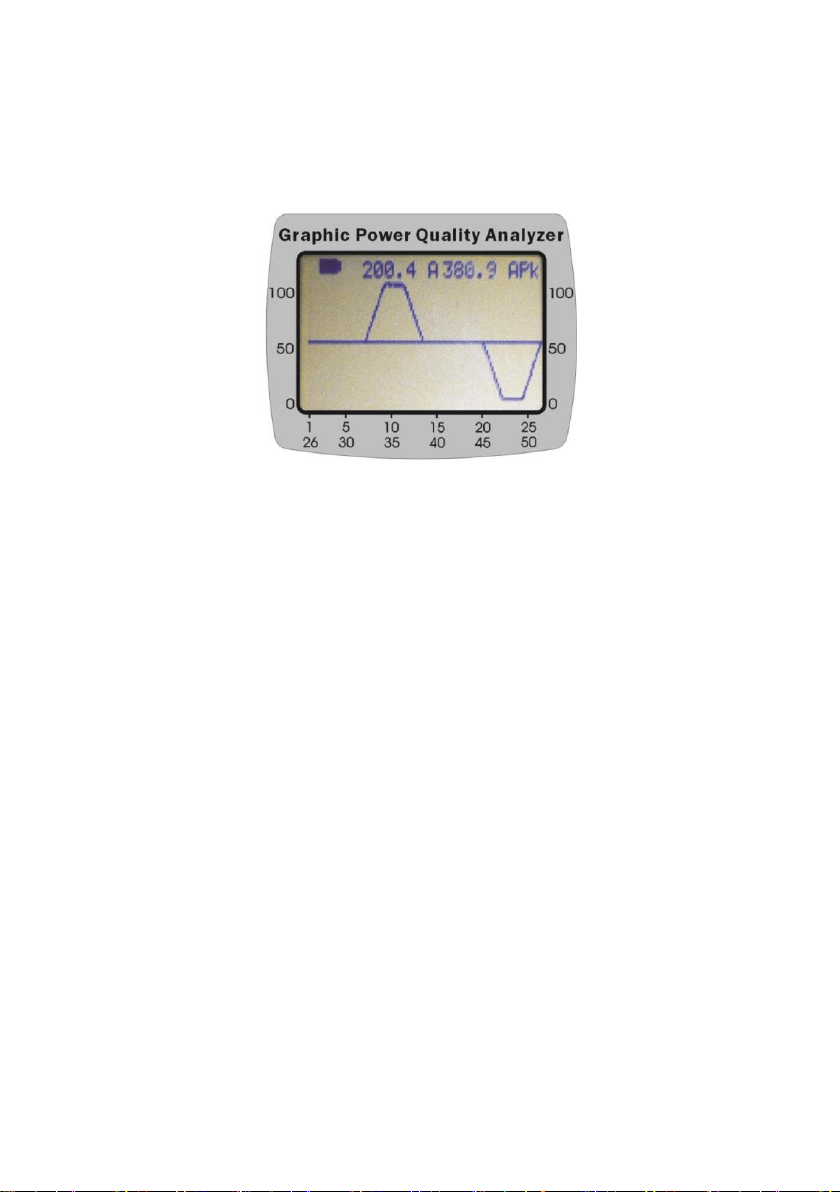
III.4.2 Waveform of ACA with Peak Value
Press the FUNC button to select display of current waveform with RMS value and
peak value
21
Page 27

III.5 Measurement of Single Phase AC Power Quality
NOTE: If the peak value of the input AC current or AC voltage is greater than the
maximum value of the range, then symbol of OL will be displayed.
NOTE: If the VT ratio is not 1, the readings of shown in LCD is equal to the W, VA,
and VAR values measured by the tester multiplied by VT ratio (W
LCD
= W × VT,
VA
LCD
= VA × VT, VAR
LCD
= VAR × VT, WH
LCD
= WH × VT).
--
+
+
--
+
L3
L1
V
COM
600V
a. Set the rotary switch at the 1 Phase position
b. Connect the test leads to the voltage source in parallel with the load.
c. Clamp on one of the wire to the load. The current should flow from the front of
the tester to the side of the battery cover
d. Press FUNC to select following display.
22
Page 28

III.5.1 True Power (W) and Power Factor (PF)
III.5.2 Apparent Power (VA, KVA) and Reactive Power (VAR, KVAR)
23
Page 29
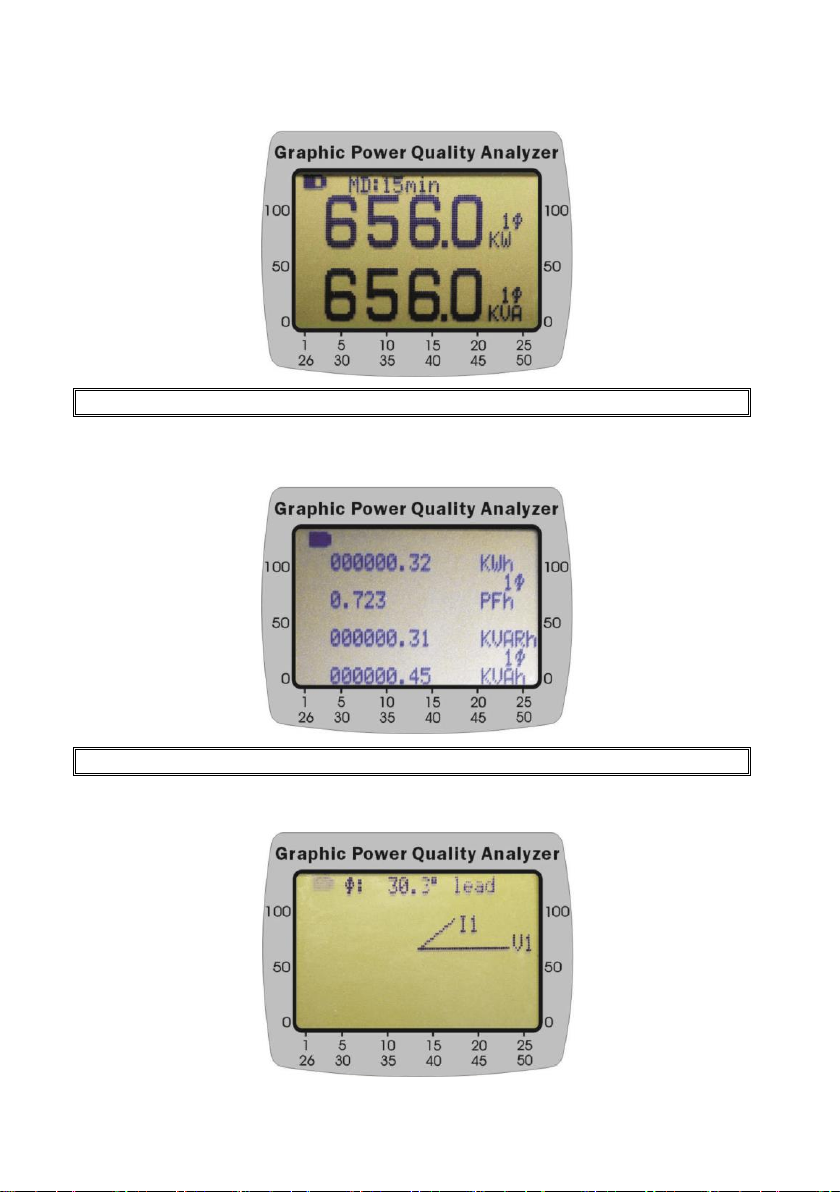
III.5.3 Maximum Demand (KW and KVA)
WARNING: Must disable auto-power-off for this measurement.
WARNING: Must disable auto-power-off for this measurement.
III.5.4. Energy (KWh, PFh, KVARh, and KVAh)
III.5.5 Phasor Diagram
24
Page 30

III.5.6 RMS values of Voltage and Current
25
Page 31
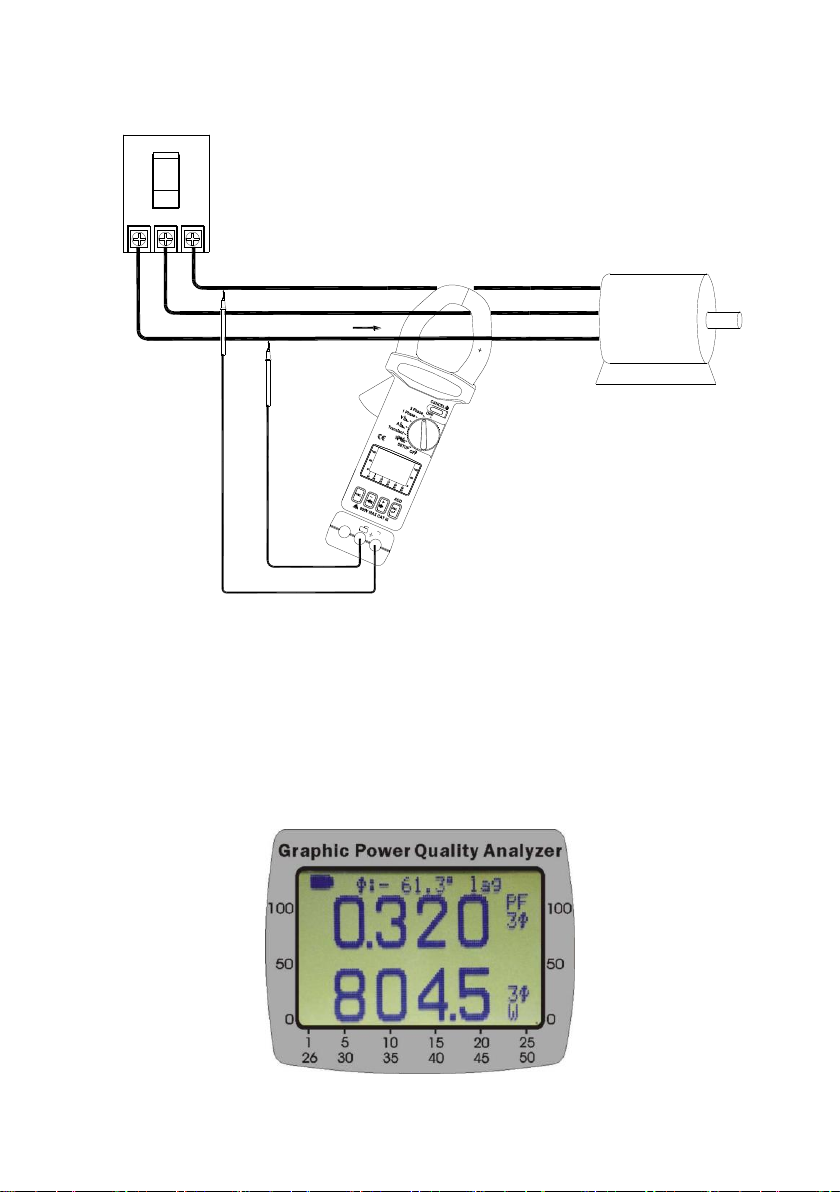
III.6 Measurement of Balanced 3 Phase AC Power Quality
L1
L3
L1
L2
L3
+
600V
COM
V
L1
L3
a. Set the rotary switch at the 3 Phase position
b. Connect the test leads to the voltage source in parallel with the load.
c. Clamp on one of the wire to the load. The current should flow from the
front of the tester to the side of the battery cover
d. Press
3φ
button for balanced
3φ
system measurement.
e. Press the FUNC button to select following displays
III.6.1 AC Watt (W) and Power Factor (PF)
26
Page 32
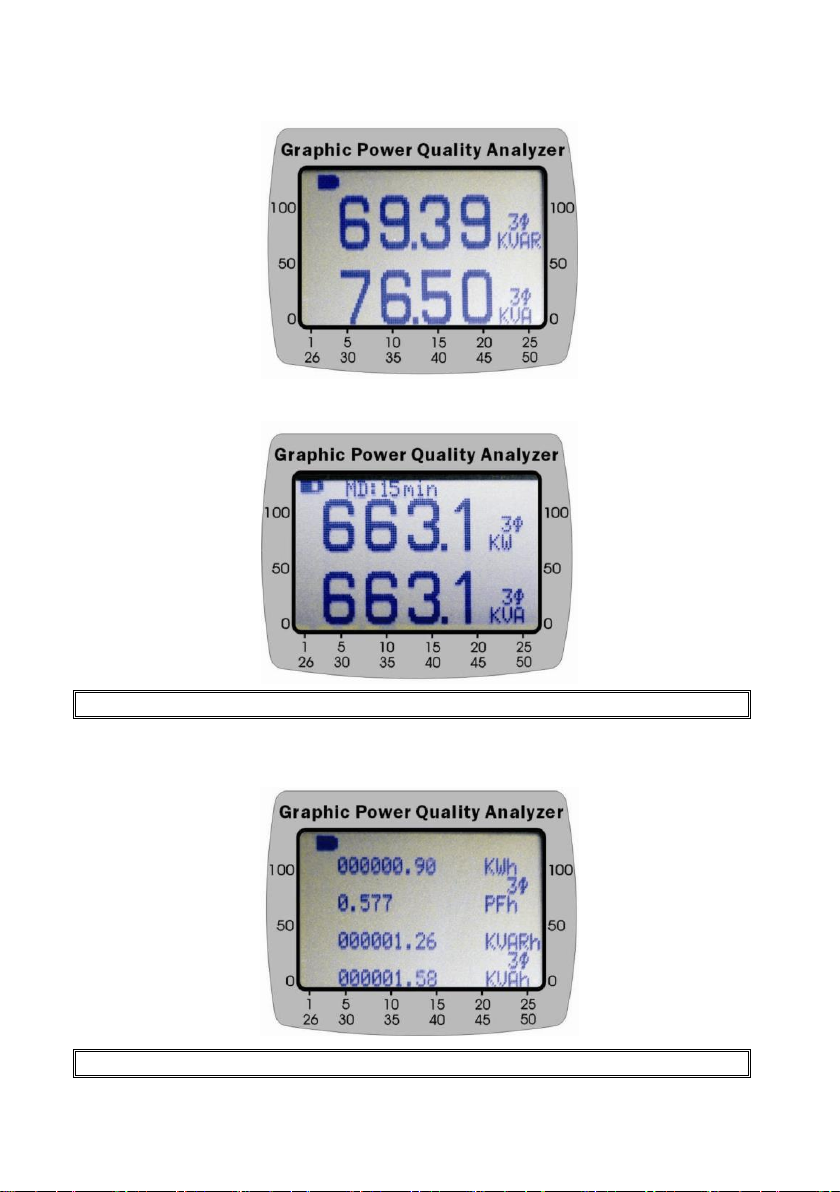
III.6.2 Apparent Power (VA, KVA) and Reactive Power (VAR, KVAR)
WARNING: Must disable auto-power-off for this measurement.
WARNING: Must disable auto-power-off for this measurement.
III.6.3 Maximum Demand (KW and KVA)
III.6.4 Energy (KWh, PFh, KVARh, and KVAh)
27
Page 33
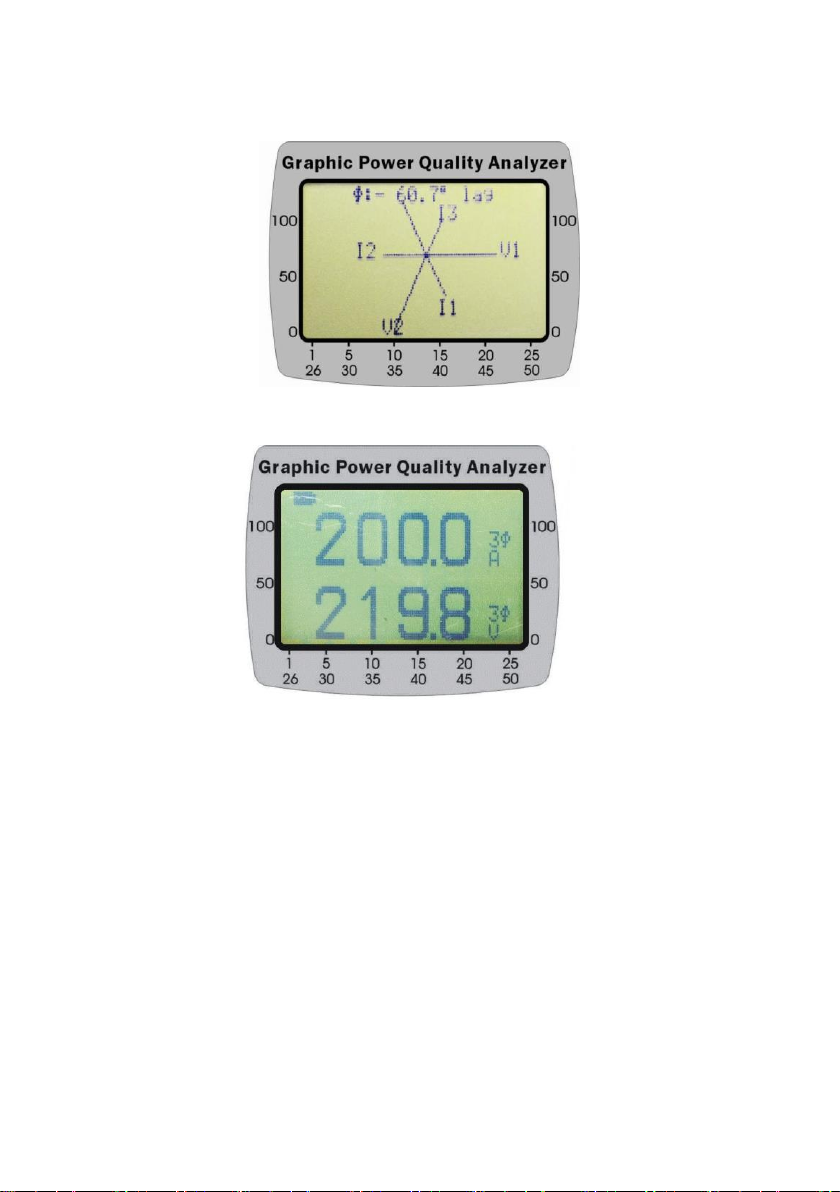
III.6.5. Phasor Diagram
III.6.6. RMS values of Voltage and Current
28
Page 34
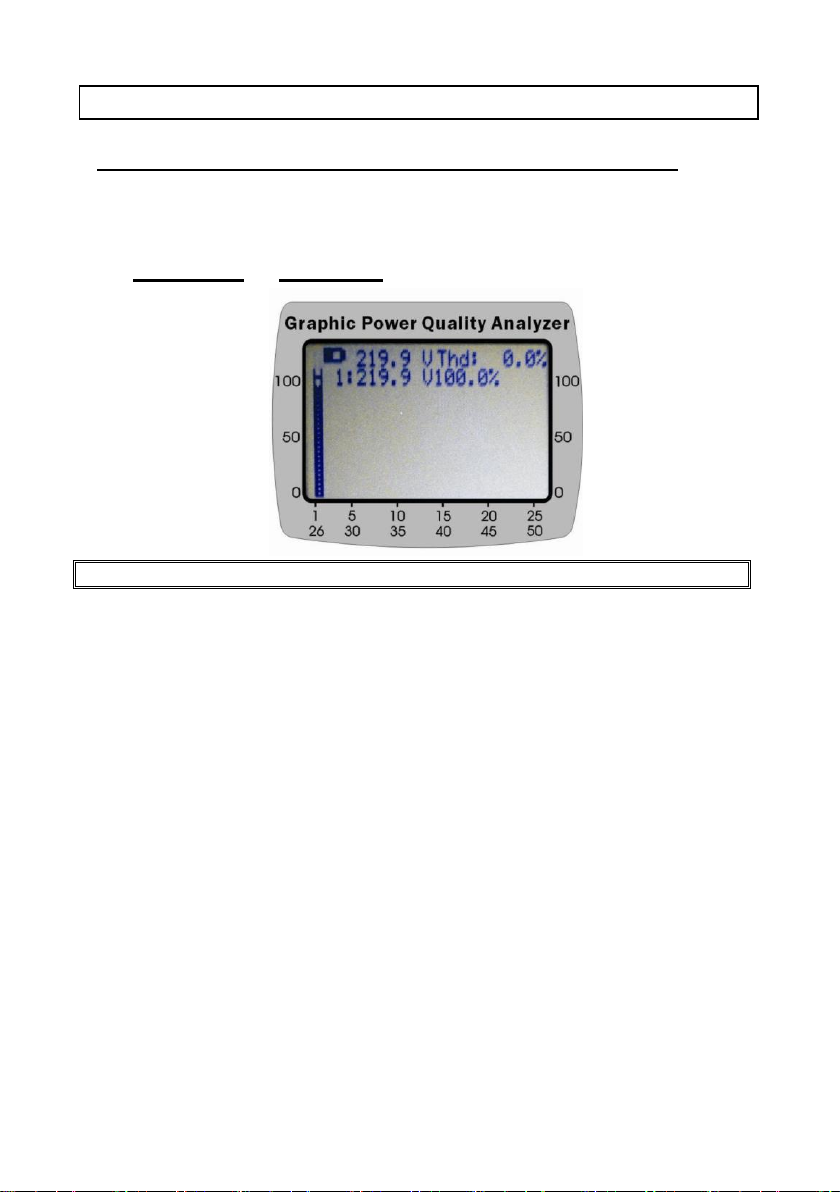
IV. DATALOGGING OF VOLTAGE (RMS VALUE) AND HARMONICS
NOTE: The true RMS value and the first harmonics are always logged.
IV.1 Scheduled Datalogging
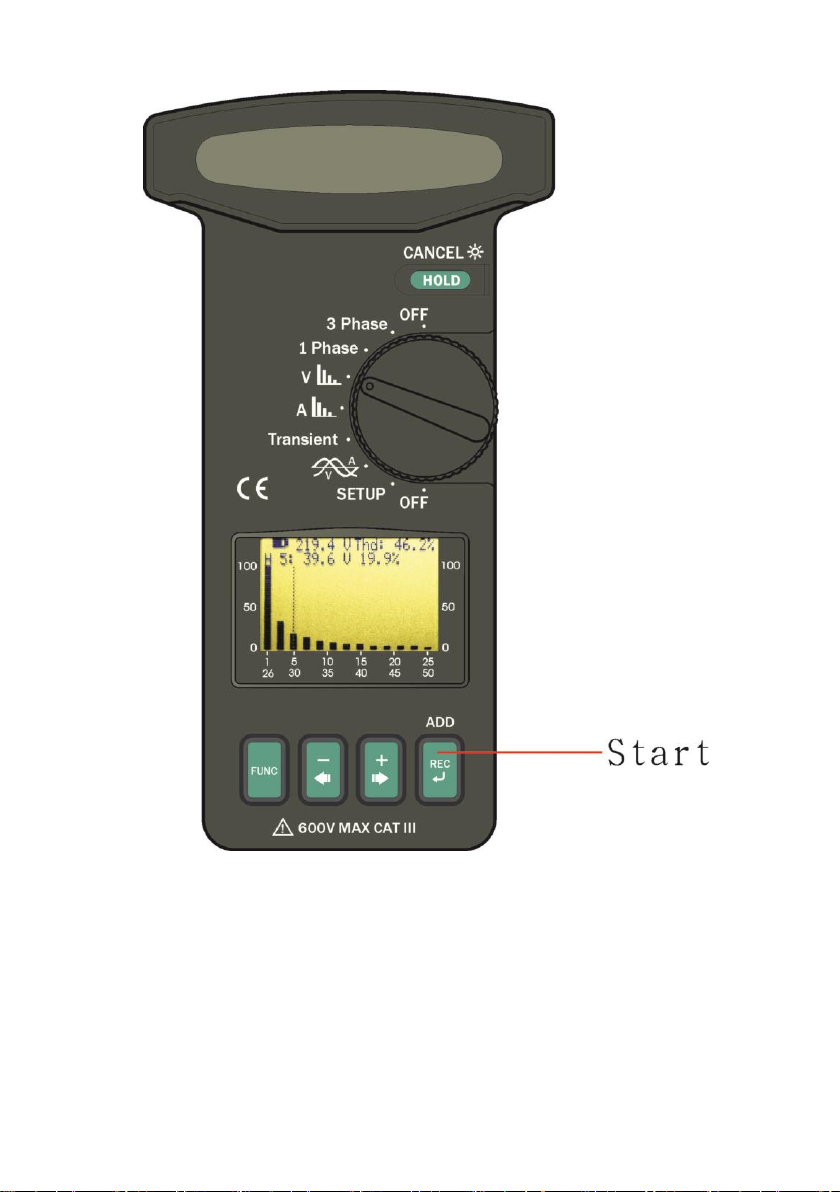
Set the rotary switch at the V position and press the REC button ONCE.
If users see the following display and press the REC button, the true RMS value of
voltage and selected harmonics set in the configuration will be logged at specified
sampling interval.
The START TIME and STOP TIME is set in the SETUP.
29
Page 35
30 31
Page 36

When the REC button is pressed, users will see the following display.
Users always have 8 seconds to cancel Datalogging by pressing the HOLD button
for about 2 seconds. If users do not press HOLD/CANCEL button, the unit starts
Datalogging, and the LED next to the REC button starts blinking.
Page 37

IV.2 Immediate Datalogging
Press the REC button TWICE
START TIME will be changed to next minute.
STOP TIME will be changed to current time tomorrow.
Please refer to HARMONICS CONFIGURATION of SETUP for selecting
harmonics.
32
Page 38

V. DATALOGGING OF CURRENT (RMS VALUE) AND HARMONICS
V.1 Scheduled Datalogging
Set the rotary switch at the A position and press the REC button ONCE.
The true RMS value of current and selected harmonics set in the configuration will
be logged at specified sampling interval. The START TIME and STOP TIME is set
in the SETUP.
33
Page 39

When the REC button is pressed, users will see the following display.
Users always have 8 seconds to cancel datalogging by pressing the HOLD button
for about 2 seconds. If users do not press HOLD/CANCEL button, the unit starts
datalogging, and the LED at the bottom starts blinking.
34
Page 40

Please refer to HARMONICS CONFIGURATION of SETUP for selecting
NOTE: The true RMS value and the first harmonics are always logged.
harmonics.
V.2 Immediate Datalogging
Press the REC button TWICE, the unit start Datalogging in the next minute.
START TIME will be changed to next minute.
STOP TIME will be changed to current time tomorrow.
35
Page 41
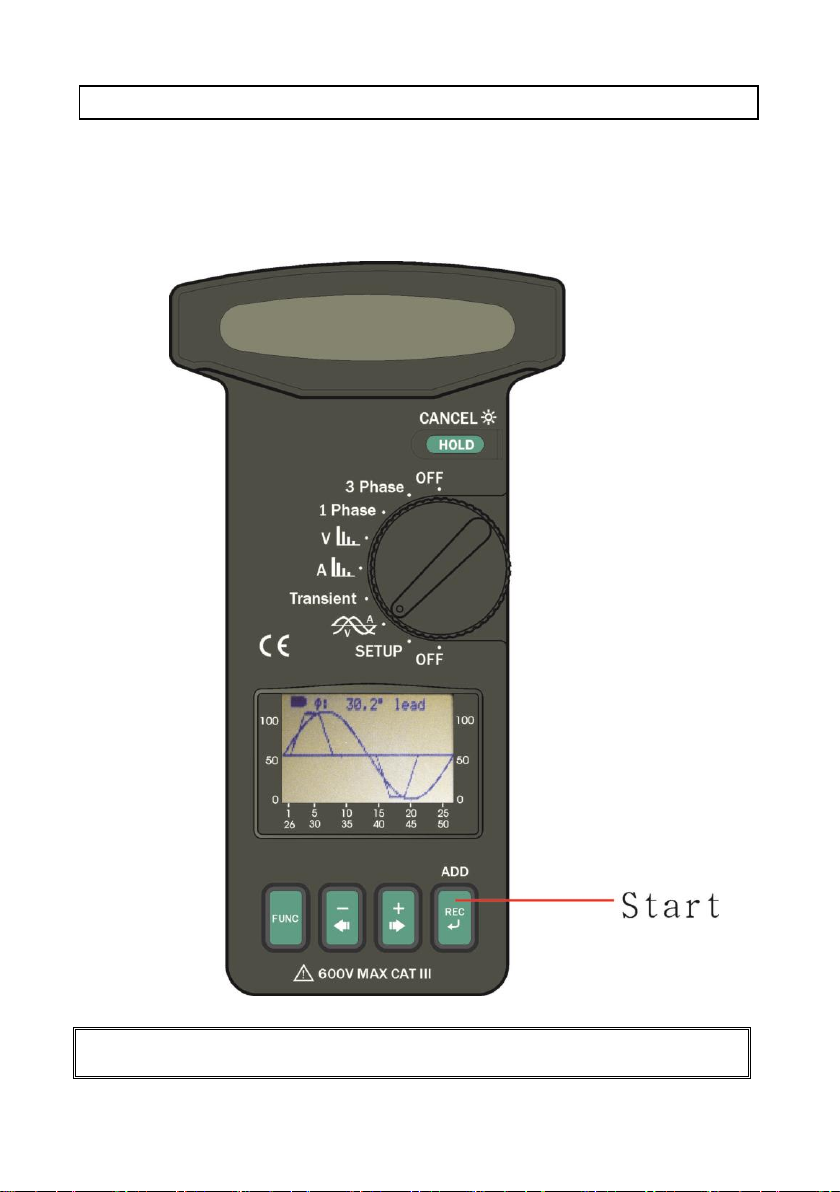
VI. DATALOGGING OF VOLTAGE AND CURRENT WAVEFORMS
NOTE: Users can specify how many points per cycle in the WAVEFORM
CONFIGURATION of SETUP.
VI.1 Datalogging of both Voltage and Current Waveforms
Set the rotary switch at the VA waveform, and press the FUNC to select
display of both voltage and current waveforms.
Press the REC button once to do scheduled Datalogging. Both voltage and
current waveforms will be logged.
36
Page 42
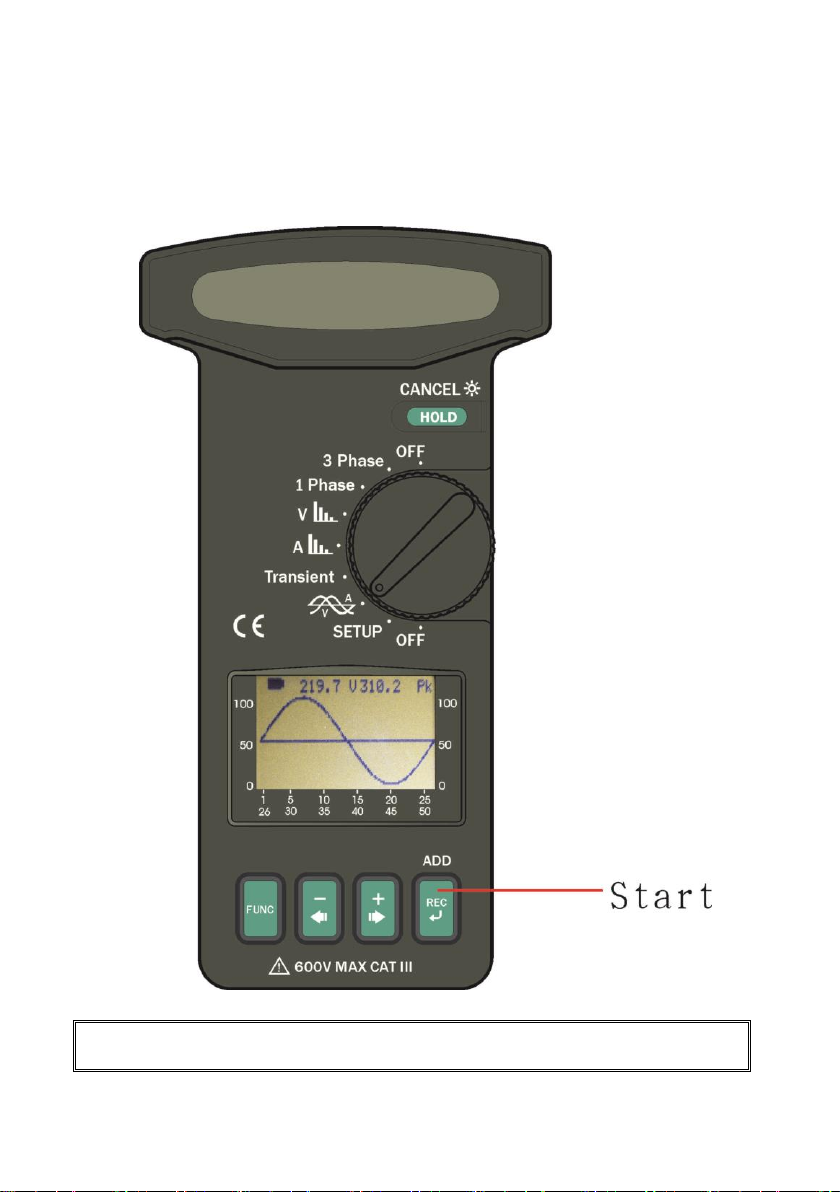
VI.2 Datalogging of Voltage Waveform
NOTE: Users can specify how many points per cycle in the WAVEFORM
CONFIGURATION of SETUP.
Set the rotary switch at the VA waveform and press the FUNC to select display
of voltage waveform.
Press the REC button once to do scheduled Datalogging. Voltage waveform
will be logged.
37
Page 43

VI.3 Datalogging of Current Waveform
NOTE: Users can specify how many points per cycle to be logged in the
WAVEFORM CONFIGURATION of SETUP.
Set the rotary switch at the VA waveform and press the FUNC to select
display of current waveform.
Press the REC button once to do scheduled Datalogging. Current waveform
will be logged.
38
Page 44
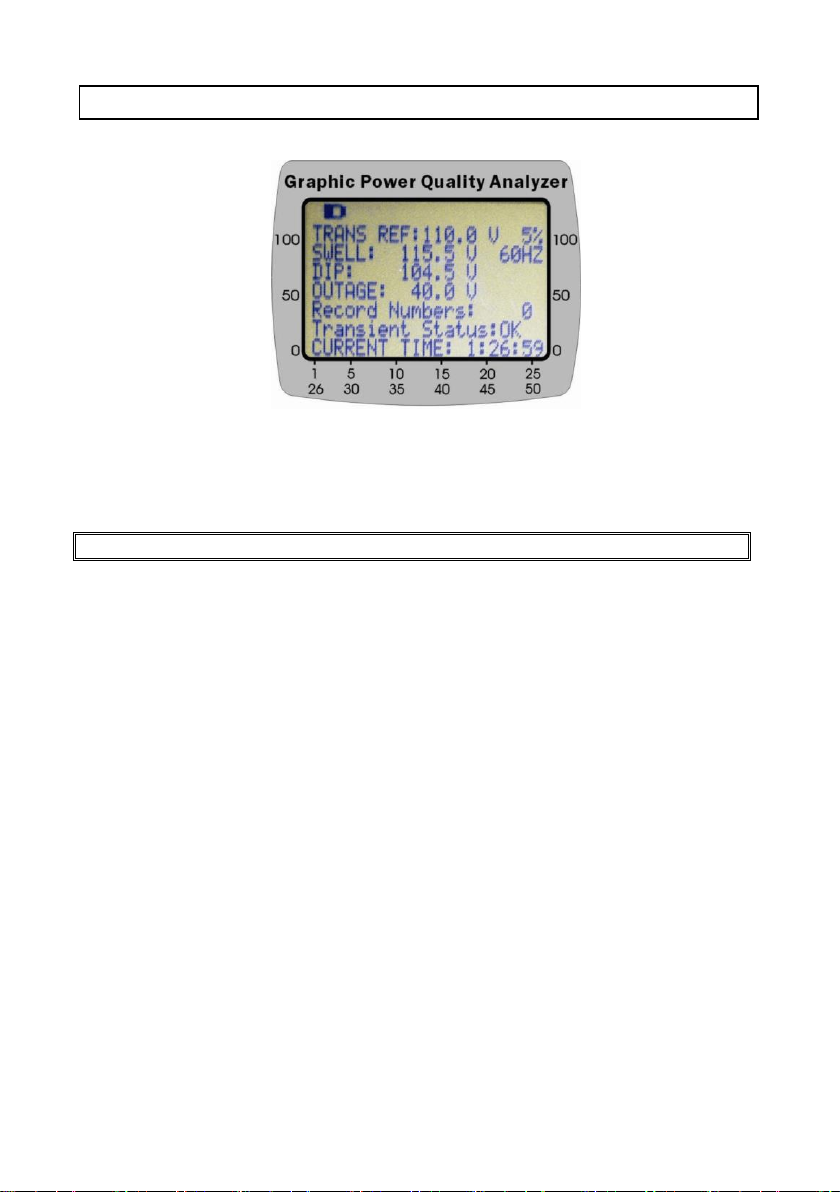
VII. DATALOGGING OF TRANSIENT DETECTION
NOTE: Maximum 32000 events
Set the rotary switch to the Transient position, the following display is shown.
It shows the reference voltage is AC 110.0V (TRANS REF), and the threshold is
5%. If the voltage exceeds 115.5V (SWELL) or is less than 104.5V (DIP), or is less
the 40.0V (OUTAGE), one transient event will be logged.
39
Page 45
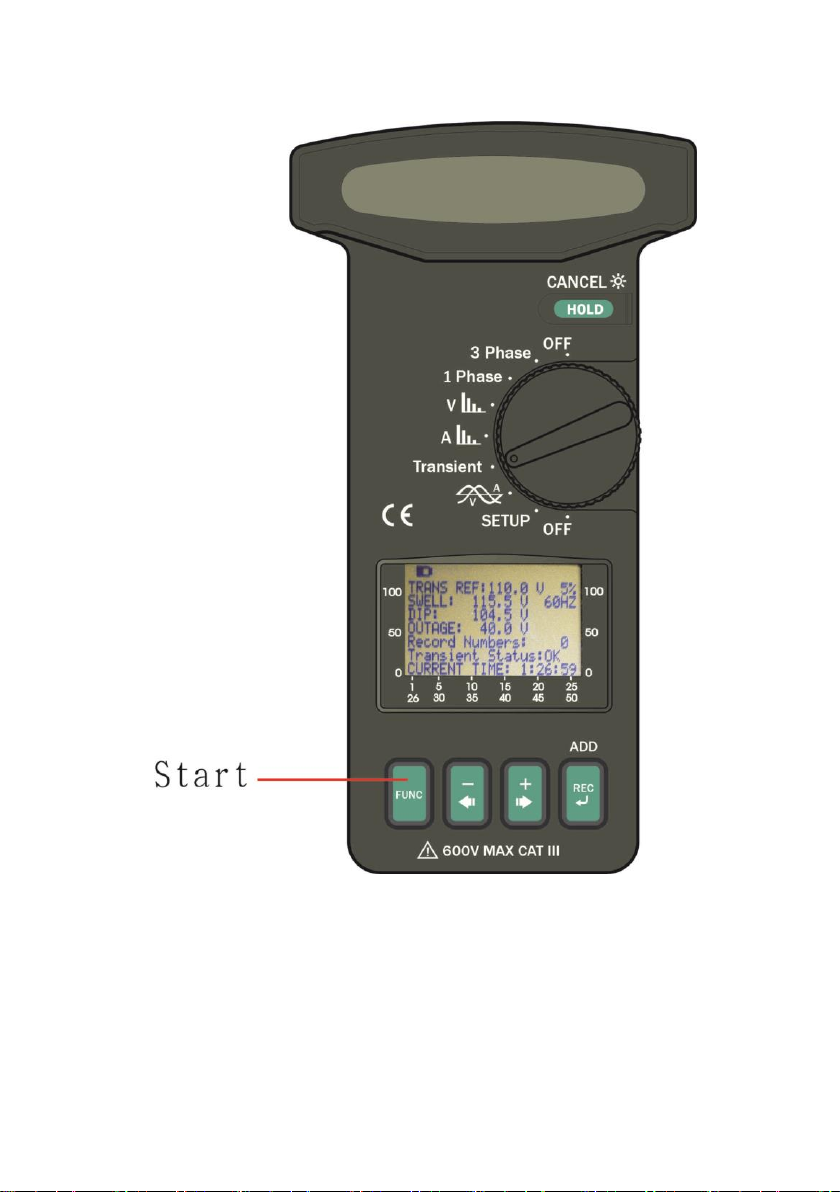
Press the FUNC button to start transient detection.
40
Page 46

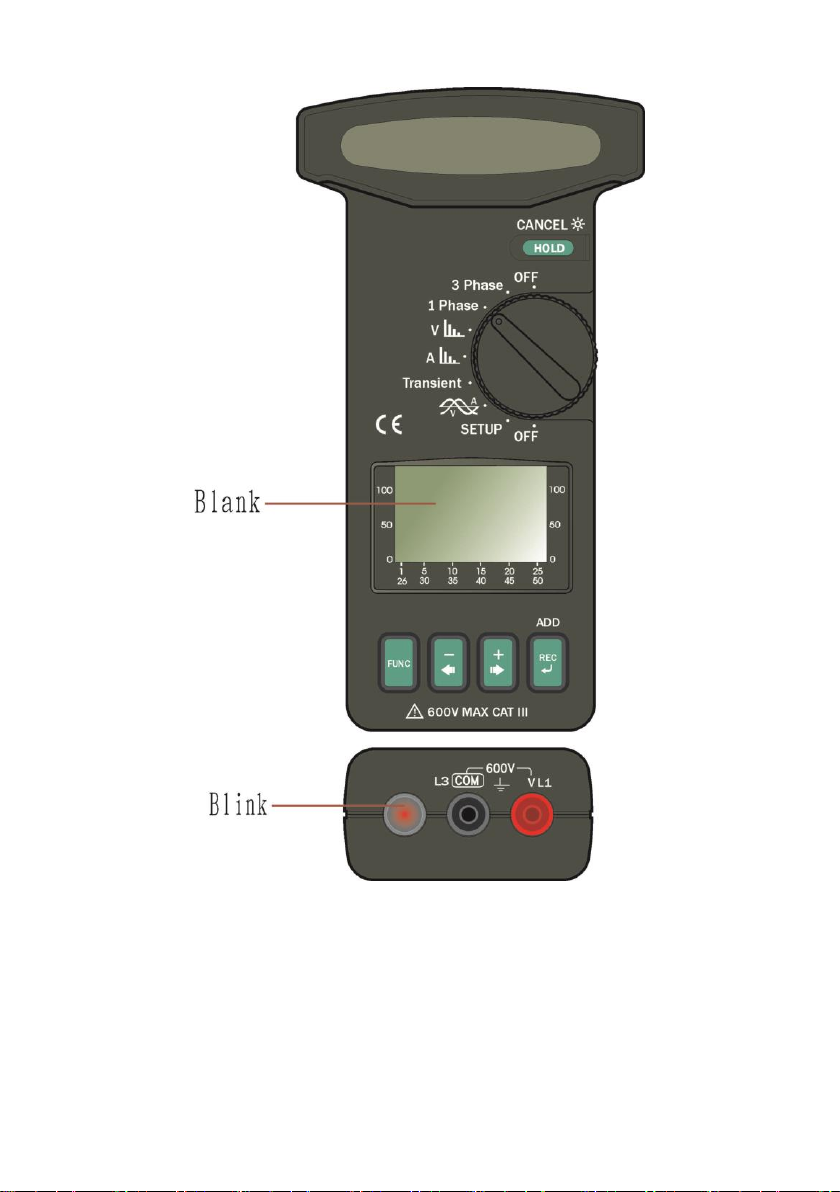
After users press the FUNC button, the LCD will become blank and the LED at the
bottom starts to flash.
41
Page 47
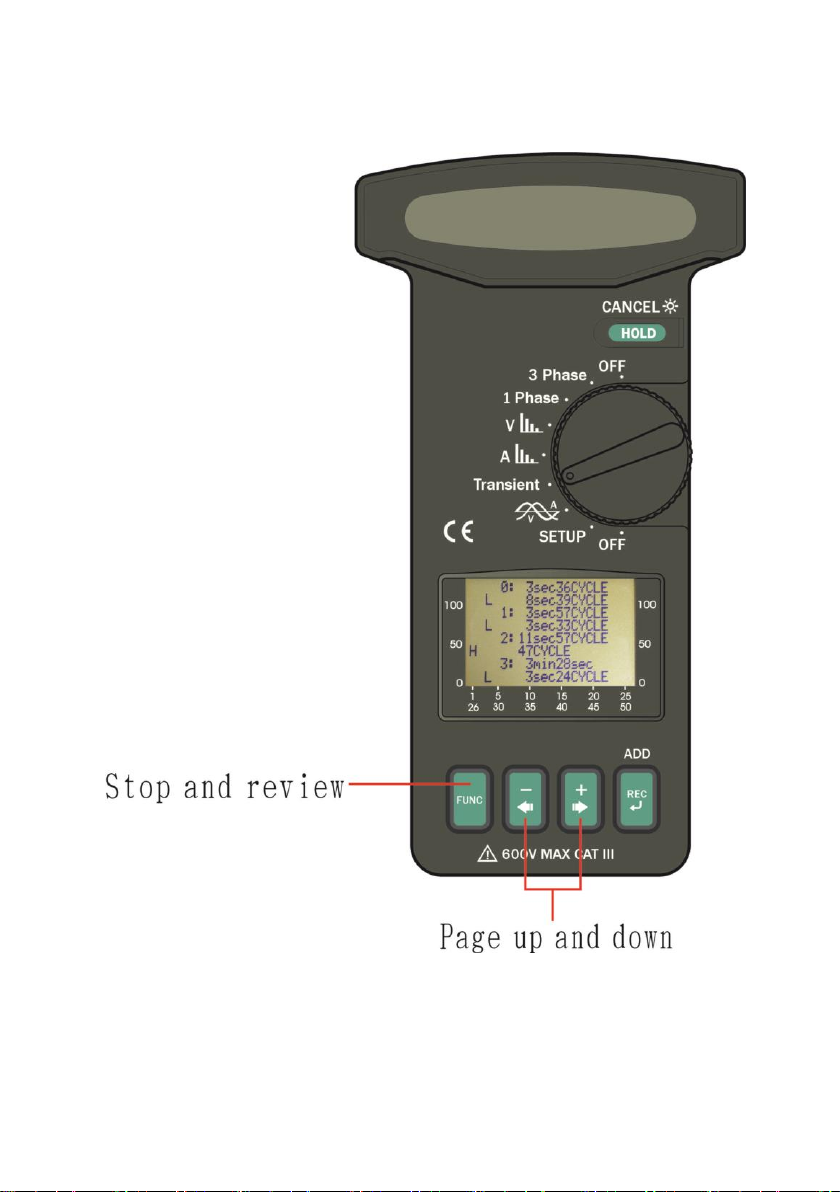
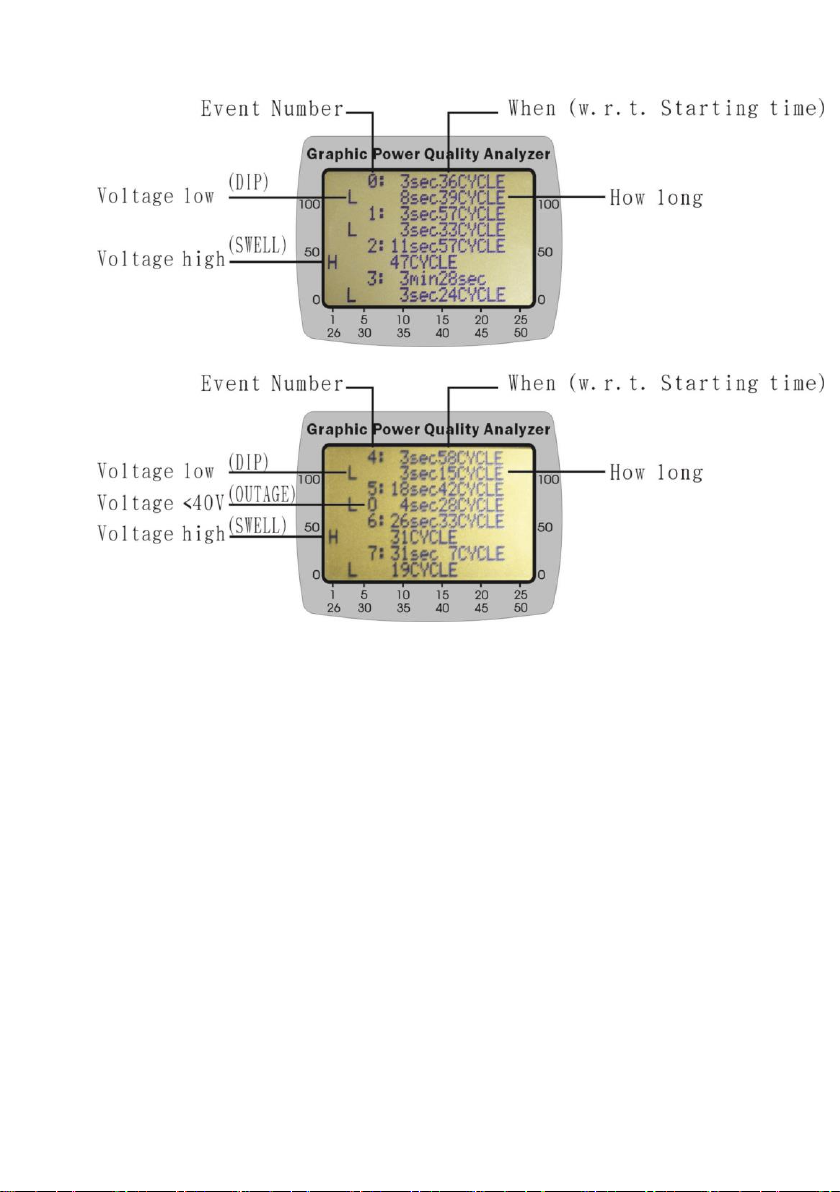
To stop transient detection and review events, press the FUNC button again. Press
the +►or -◄ buttons to review events.
42
Page 48
43
Page 49

VIII. DATALOGGING OF AC POWER
VIII.1 Scheduled Datalogging
Press the REC button ONCE
Users can press the REC button once to start scheduled datalogging. The START
TIME and STOP TIME is set in the SETUP.
44
Page 50

When the REC button is pressed, users will see the following display.
Users always have 8 seconds to cancel Datalogging by pressing the HOLD button
for about 2 seconds. If users do not press HOLD/CANCEL button, the unit starts
Datalogging, and the LED next to the REC button starts blinking.
45
Page 51
The unit will log 50,000 records of (Date/Time, VA, W, VAR, PF, KVAH, KWH,
KVARH, PFH, AD(VA), AD(W), MD(VA), MD(W), Phase, HP).
VIII.2 Immediate Datalogging
Press the REC button TWICE
START TIME will be changed to next minute.
STOP TIME will be changed to current time tomorrow.
46
Page 52
IX. CLEAR DATA MEMORY
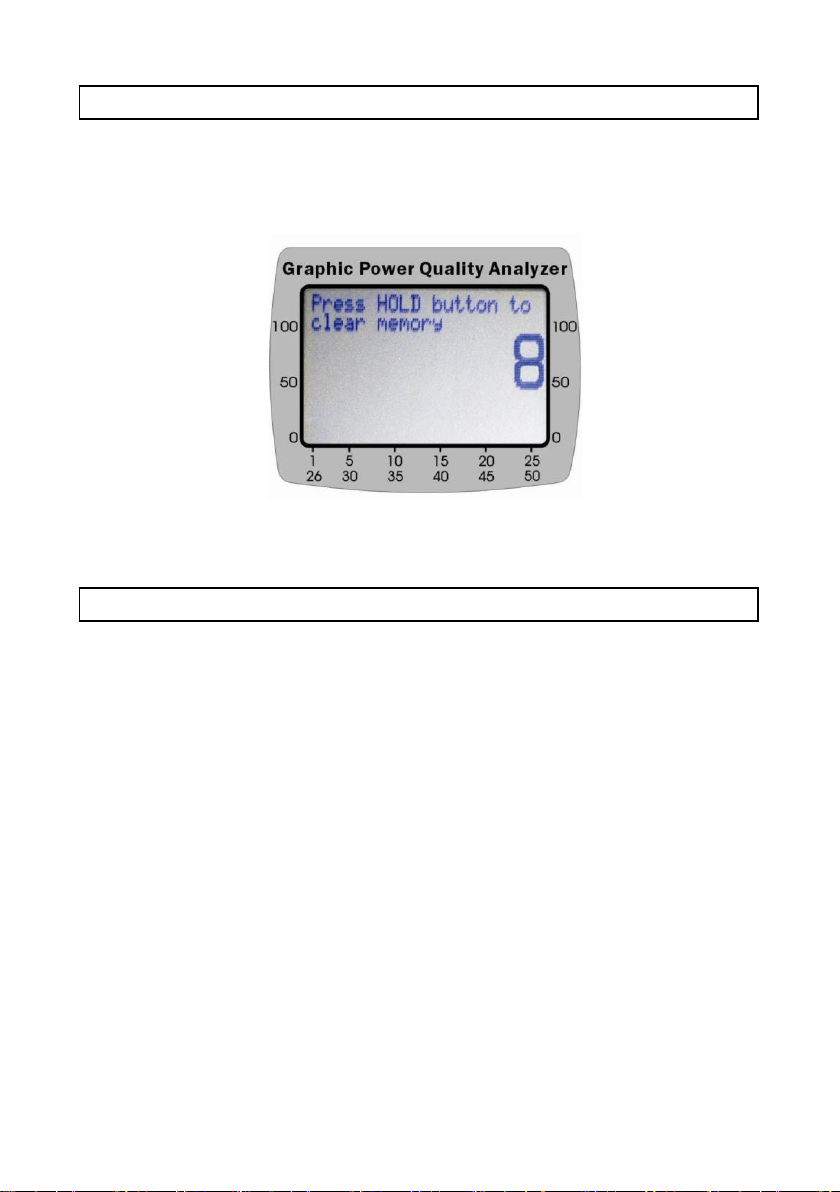
To clear the memory of data logger, hold the REC button and turn the power on.
The following display will be shown in LCD. Users press the HOLD button to
confirm the clearance of memory. The unit is turned off after the memory is
cleared.
If users do not press the HOLD button in 8 seconds, the memory is not clear. This
timer could avoid users accidentally clear the memory.
X. RS-232 INTERFACE PROTOCOL
Baud Rate: 9600
Data Bits: 8
Stop Bit: 1
Parity: None
Format: ASCII
47
Page 53

XI. SPECIFICATIONS (23C±5C)
Range (0 to 1500A)
Resolution
Accuracy of Readings1
> 20 V and > 20A
< 20V or < 20A
10.0 – 999.9 W
0.1W
±1% ±20dgts
±2% ±40dgts
1.000 – 9.999 KW
0.001 KW
±1% ±20dgts
±2% ±40dgts
10.00 – 99.99 KW
0.01 KW
±1% ±20dgts
±2% ±40dgts
100.0 – 999.9 KW
0.1 KW
±1% ±20dgts
±2% ±40dgts
1000 – 9999 KW
1 KW
±1% ±20dgts
±2% ±40dgts
Range (0 to 1500A)
Resolution
Accuracy of Readings1
> 20 V and > 20A
< 20V or < 20A
10.0 – 999.9 VA
0.1VA
±1% ±20dgts
±2% ±40dgts
1.000 – 9.999 KVA
0.001 KVA
±1% ±20dgts
±2% ±40dgts
10.00 – 99.99 KVA
0.01 KVA
±1% ±20dgts
±2% ±40dgts
100.0 – 999.9 KVA
0.1 KVA
±1% ±20dgts
±2% ±40dgts
1000 – 9999 KVA
1 KVA
±1% ±20dgts
±2% ±40dgts
Range (0 to 1500A)
Resolution
Accuracy of Readings1
> 20 V and > 20A
< 20V or < 20A
10.0 – 999.9 VAR
0.1VAR
±2% ±30dgts
±3% ±40dgts
1.000 – 9.999 KVAR
0.001 KVAR
±2% ±30dgts
±3% ±40dgts
10.00 – 99.99 KVAR
0.01 KVAR
±2% ±30dgts
±3% ±40dgts
100.0 – 999.9 KVAR
0.1 KVAR
±2% ±30dgts
±3% ±40dgts
1000 – 9999 KVAR
1 KVAR
±2% ±30dgts
±3% ±40dgts
AC Watt (50 or 60 Hz, PF 0.5 to 1.0, VT = 1, Voltage > 5V AC, Current > 5A AC
for A range, and continuous waveform)
1
For VT ≠1, the accuracy in percentage is the same (±1%). But the additional
wattage should be multiplied by the VT ratio.
For example, ±0.2W becomes ±0.2W * VT ratio
AC Apparent Power (VA, from 0.000VA to 9999 KVA, PF 0.5 to 1)
1
For VT ≠1, the accuracy in percentage is the same (±1%). But the additional
wattage should be multiplied by the VT ratio.
For example, ±0.2VA becomes ±0.2VA * VT ratio
AC Reactive Power (VAR, from 0.000 VAR to 9999 KVAR)
1
For VT ≠1, the accuracy in percentage is the same (±2%). But the additional
wattage should be multiplied by the VT ratio.
For example, ±0.2VAR becomes ± 0.2VAR * VT ratio
48
Page 54

Range
Resolution
Accuracy of Readings
4.0 – 1500.0 A
0.01 A
±1.0% ± 5dgts
Range
Resolution
Accuracy of Readings1
4.0 V – 600.0 V
0.1 V
±0.5% ± 5dgts
Range
Resolution
Accuracy
1 – 20th
0.1%
±2%
21 – 50th
0.1%
4% of reading ±2.0%
Range
Resolution
Accuracy
1 – 20th
0.1%
±2% ± 0.5V
21 – 50th
0.1%
4% of reading ±0.5V
Range of VT (Voltage Transformer) Ratio: 1 to 3000
AC Active Energy (WH, or KWH, from 0 WH to 999,999 KWH)
WH = W * Time (in hours)
AC Current (50 or 60 Hz, Auto Range, True RMS, Crest Factor < 4, Overload
Protection AC 2000A)
AC Voltage (50 or 60 Hz, Auto Range, True RMS, Crest Factor < 4, VT=1, Input
Impedance 10 MΩ, Overload Protection AC 800V)
1
For VT ≠1, the accuracy in percentage is the same (±0.5%). But the
additional digits should be multiplied by the VT ratio.
For example, ±5digits becomes ± 5digits * VT ratio
Harmonics of AC Voltage in Percentage( 1 to 50th order, minimum voltage at 50
or 60 Hz > AC 80V. If the voltage is 0 at 50 or 60 Hz, all the percentage (%) display
is 0.)
Harmonics of AC Voltage in Magnitude (1 to 50th order, minimum voltage at 50 or
60 Hz > AC 80V, VT=1)
49
Page 55
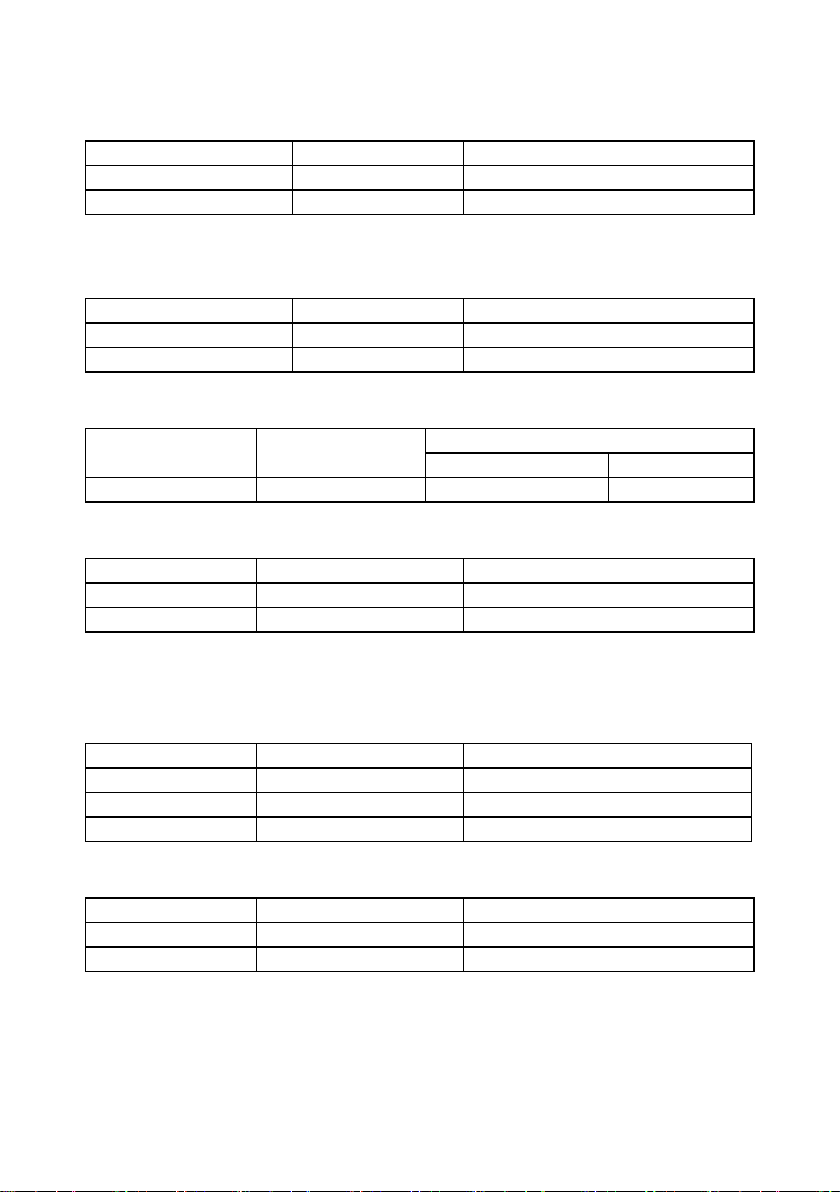
Harmonics of AC Current in Percentage (1 to 50th order, minimum current at 50
Range
Resolution
Accuracy
1 – 20th
0.1%
±2%
21 – 50th
0.1%
4% of reading ±2.0%
Range
Resolution
Accuracy
1 – 20th
0.1%
±2% of reading ±0.4A
21 – 50th
0.1%
±4% of reading ±0.4A
Range
Resolution
Accuracy
> 20V and > 20A
< 20V or < 20A
0.000 – 1.000
0.001
± 0.04
±0.1
Range
Resolution
Accuracy
-180° to 180°
0.1°
± 1°
0° to 360°
0.1°
± 1°
Range
Resolution
Accuracy
0.0 – 20%
0.1%
± 2%
20.1 – 100%
0.1%
± 6% of reading ± 1%
100.1 – 999.9 %
0.1%
± 10% of reading ± 1%
Range
Sampling Time
Accuracy of Reading
50 Hz
39 μs
± 5% ± 50 digits
60 Hz
33 μs
± 5% ± 50 digits
or 60 Hz > 20 A. If the current is 0 at 50 or 60 Hz, all the percentage (%) display is 0.)
Harmonics of AC Current in Magnitude (1 to 50th order, minimum current at 50 or
60 Hz > 20A)
Power Factor (PF)
Phase Angle (Φ)
Total Harmonic Distortion (THD-F with respect to the 50 or 60 Hz, min. value at 50
or 60 Hz > 80V and > 20 A, 1 to 50th Harmonics. If the voltage or current is 0 at 50 or
60 Hz, all the percentage (%) display is 0)
Peak Value of AC Voltage (peak value > 10V) or AC Current (peak value > 20A)
50
Page 56

Frequency (RMS value > 20V) or ACA (RMS value > 30A)
Range
Resolution
Accuracy
46 – 65
0.1
± 0.3Hz
Indoors Use
Conductor Size: 55mm (approx.), 65 x 24mm (bus bar)
Battery Type: two 1.5V SUM-3
Display: 128 X 64 dot matrix LCD with backlight
Range Selection: Auto
Overload Indication: OL
Power Consumption: 10 mA(approx.)
Auto-Power-Off: 15 minutes after power-on
Update Time: 2 times/second (display)
No. Of Samples per Period 512 (voltage or current)
256 (power)
Operating Temperature: -10C to 50C
Operating Humidity: less than 85% relative
Altitude: up to 2000M
Storage Temperature: -20C to 60C
Storage Humidity: less than 75% relative
Dimension: 271mm (L) x 112mm (W) x 46mm (H)
10.7" (L) x 4.4" (W) x 1.8" (H)
Weight: 647g / 22.8 oz (battery included)
Accessories: Test leads
Carrying bag x 1
Users manual x 1
Software users manual x 1
Software CD x 1
Batteries 1.5V x 2
Alligator clips
RS232 to USB bridge x 1
51
Page 57
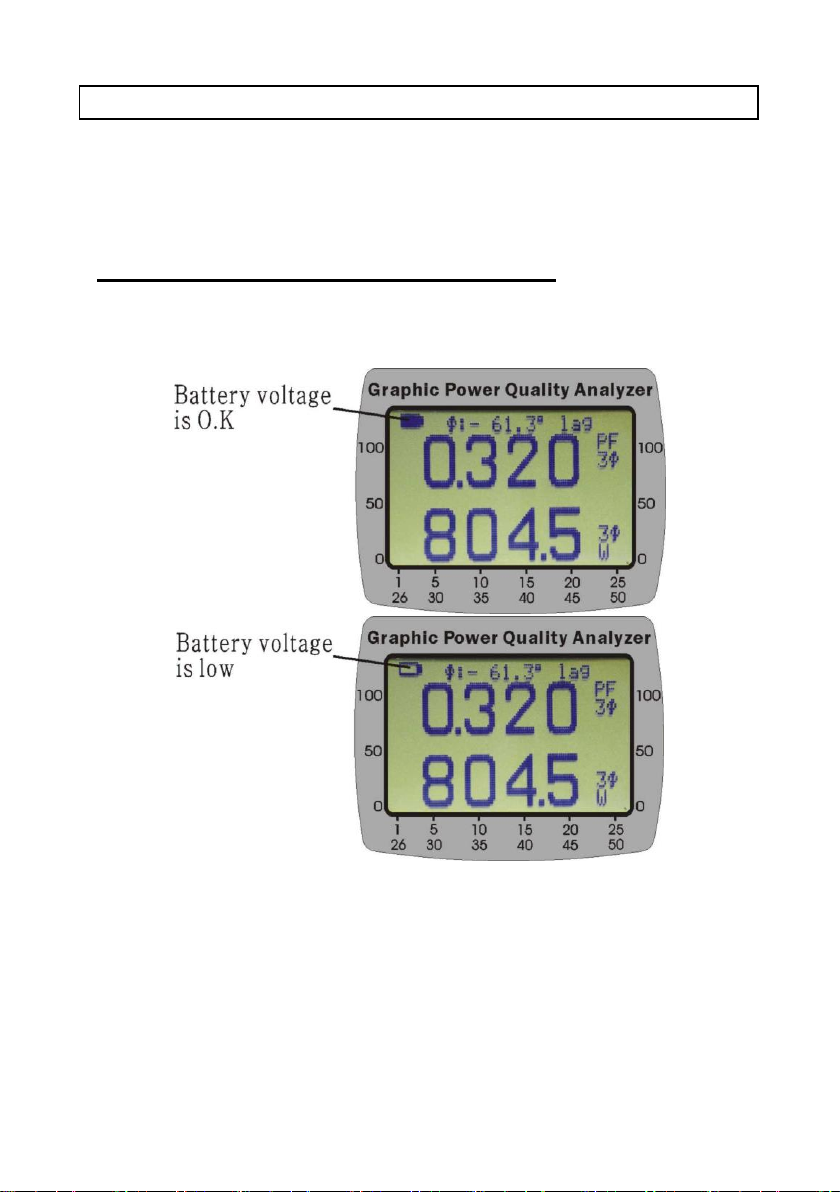
XII. BATTERY REPLACEMENT
When the battery voltage low is shown in LCD,
A. Turn the power off and remove the test leads from the box.
B. Remove the screw of the battery compartment.
C. Lift and remove the battery compartment.
D. Remove the old batteries
E. Press the FUNC button for 2 seconds to discharge.
F. Insert two new 1.5V SUM-3 batteries.
G. Replace the battery compartment and secure the screw.
52
Page 58

53
Page 59
XIII. MAINTENANCE & CLEANING
Servicing not covered in this manual should only be performed by qualified
personnel. Repairs should only be performed by qualified personnel.
Periodically wipe the case with a damp cloth and detergent; do not use abrasives or
solvents.
Address of Agent, Distributor, Importer, or Manufacturer
54
 Loading...