


DATA SHEET
© PCE Instruments
User Manual
PCE-CSM 10 Color Meter
EN
PCE Americas Inc.
711 Commerce Way
Suite 8
Jupiter
FL-33458
USA
From outside US: +1
Tel: (561) 320-9162
Fax: (561) 320-9176
info@pce-americas.com
PCE Instruments UK Ltd.
Units 12/13
Southpoint Business Park
Ensign way
Hampshire / Southampton
United Kingdom, SO31 4RF
From outside UK: +44
Tel: (0) 2380 98703 0
Fax: (0) 2380 98703 9
info@pce-instruments.com
www.pce-instruments.com/english
www.pce-instruments.com

MANUAL
© PCE Instruments
CONTENTS
INDUCTION ............................................................................................................................................................... 1
CAUTIONS ................................................................................................................................................................. 1
1. INTERFACE DESCRIPTION ................................................................................................................................ 2
2 .BATTERY DESCRIPTION .................................................................................................................................... 3
3. BATTERY INSTALLATION .................................................................................................................................. 3
4. OPERATING INSTRUCTION ............................................................................................................................... 4
4.1TURN ON ...................................................................................................................................................................... 4
4.1.1 Preparations ........................................................................................................................................................ 4
4.1.2 Turn On ................................................................................................................................................................ 4
4.2 WHITE CALIBRATION AND BLACK CALIBRATION ......................................................................................................... 5
4.3 MEASUREMENT ........................................................................................................................................................... 6
4.3.1 Measurement Locating ........................................................................................................................................ 6
4.3.2 Standard Measurement ................................................................................................................................... 6
4.3.4 Measure and View Spectral Reflectance Graph ................................................................................................... 8
4.4 CONNECTING TO PC .................................................................................................................................................... 9
4.5 PRINT........................................................................................................................................................................... 9
5. SYSTEM FUNCTION DESCRIPTION ................................................................................................................. 9
5.1 DATA MANAGEMENT ................................................................................................................................................. 10
5.1.2 Check Spectral Reflectance Curve ...................................................................................................................... 12
5.1.3 Editing Record Name ......................................................................................................................................... 13
5.1.4 Deleting a Single Record .................................................................................................................................... 14
5.1.5 Turning Standard Record into Measurement Standard ..................................................................................... 14
5.1.6 Turning Sample Record into Measurement Standard ........................................................................................ 14
5.1.7 Deleting All Records ........................................................................................................................................... 14
5.1.8 Standard Input ................................................................................................................................................... 15
5.2 TOLERANCE SETTING ................................................................................................................................................ 16
5.3 LIGHT SOURCE SETTING ............................................................................................................................................ 17
5.4 AVERAGE MEASUREMENT ......................................................................................................................................... 18
5.5 COLOR OPTIONS ........................................................................................................................................................ 19
5.5.1 Color Space ........................................................................................................................................................ 20
5.5.2 Color Index ......................................................................................................................................................... 25
5.5.3 Observer Angle .................................................................................................................................................. 30
5.7 FUNCTION SETTING ................................................................................................................................................... 32
5.7.1 Auto Save ........................................................................................................................................................... 32
5.7.2 Time Set ............................................................................................................................................................. 32
5.7.3 Language Selection ............................................................................................................................................ 35
5.7.4 Backlight Time ................................................................................................................................................... 35
5.7.5 Screen Brightness .............................................................................................................................................. 35
5.7.6 Buzzer Switch ..................................................................................................................................................... 35
5.7.7 Restore Factory Settings .................................................................................................................................... 36
6.TECHNICAL PARAMETERS ............................................................................................................................... 37
6.1 PRODUCTS FEATURES ................................................................................................................................................ 37
6.2 TECHNICAL SPECIFICATIONS ...................................................................................................................................... 38

MANUAL
© PCE Instruments
Induction
PCE-CSM 10 spectrophotometer is independently developed by PCE which is in
accordance with CIE (International Commission on Illumination) and CNS (China
National Standards). The instrument features with touch screen and large screen display. It
is configured with high-end color quality management software. Meanwhile it has characters
of stable performance, precise measurement and easy to use. The instrument is powered by
Li-ion battery or DC power adapter.
Advantages
1. Touch screen, easy to operate.
2. Large screen (3.5 inch), high resolution (320*480), full-view display with clear image.
3. Aesthetic design perfectly combined with ergonomics structure.
4. D/8 geometry optical structure, accord to CIE, ISO, ASTM, DIN Standards.
5. Two standard observer angles, multiple light sources modes, a variety of color
systems.
6. High hardware configuration with a number of innovative technologies.
7. Oversized integrating sphere, more effective homogenization ray of lights and precise
measurement.
8. Visible spectrum 400~700nm reflectance curve.
9. Input standard data manually, easy to operate.
Cautions
● The spectrophotometer is a precise measuring instrument. Please avoid dramatic changes
of external environment when measuring. These changes, including the flicker of
surrounding light and the rapid change of temperature, will affect measurement accuracy.
● Keep the instrument balanceable; make sure the measuring aperture close to the test
sample, and no shaking or shifting when measuring. Please prevent the colorimeter from
fierce collision or crash.
● The instrument is not waterproof. Do not use it in high humidity environment or in water.
● Keep the instrument clean. Avoid dust, powder or solid particles entering the measuring
aperture and the instrument.
● Replace the white calibration cavity and put the spectrophotometer into instrument case
when not in use.
● Please take out the battery to prevent the instrument from damage if you don’t use it for a
long time.
● Please keep the instrument in a cool dry place.
● Any unauthorized changes to the instrument are not permitted, or it will affect the
measuring accuracy, even cause irreversible damage.

MANUAL
© PCE Instruments
1. Interface Description
Figure 1 Instrument Structure Diagram
Port Description
1. Power Switch: Push the switch to “1” to turn on the instrument. Push the switch to “0”
to turn it off.
2. DC Power Port: Connect with AC adapter. The adapter specification is 5V=2A.
3. USB / RS-232 port: This port is a common port. The instrument will judge the
connection status automatically. USB port is used to transfer data to PC. RS-232 port
is used to connect to the printer.
DC Power Port
USB/RS-232 Port
Power Switch

MANUAL
© PCE Instruments
2 .Battery Description
1. Battery specification: Li-ion 3.7V = 0.5A. The capacity is 3200mAh.
2. Please use original Li-ion battery. Do not use other batteries. Otherwise it will cause
irreversible damage.
3. Please remove the battery if you don’t use it for a long time.
4. When charging the battery, please connect power adapter or USB cable (to PC).
Meanwhile, push the switch to “1” to turn it on, and then the battery will be charging. If
not charge the battery, you can remove the battery and connect power adapter, the
instrument still works normally.
5. When charging, dynamic battery icon will display on the top right corner of
measurement interface.
3. Battery Installation
1. When installing battery, be sure the power is cut off. (Push the switch to “0”). Then
remove the battery cover.
2. Insert the Li-ion battery into battery compartment and push it gently. Please pay
attention to the battery contacts.
3. Put the battery cover on Li-ion battery, and then push it up as shown in Figure 2.
Figure 2 Battery Installation
Li-ion Battery
Battery Cover

MANUAL
© PCE Instruments
4. Operating Instruction
4.1Turn On
4.1.1 Preparations
Check whether it is powered by battery or adapter.
4.1.2 Turn On
Push the power switch to “1”, the screen will light and display logo. After a few seconds, it
will enter Standard Measurement interface automatically, and the default display is
L*a*b*C*H as shown in Figure 3.
Figure 3 Standard Measurement

MANUAL
© PCE Instruments
4.2 White Calibration and Black Calibration
Click “Menu” to enter main menu interface as shown in Figure 4.
Figure 4 Main Menu
Select “Calibration” to enter white and black calibration interface as shown in Figure 5.
Figure 5 White and Black Calibration

MANUAL
© PCE Instruments
Click “White Calibration”, it will prompt you to put away the white board. Put the measuring
aperture on white board. Make sure the measuring aperture is close to the white board. Click
“OK” or press “Testing” key to perform white calibration. Please pay attention that the serial
number of white board must correspond to the instrument.
Click “Black Calibration”, it will prompt you to put away black cavity. Put the measuring
aperture into black calibration cavity. Click “OK” or press “Testing” key to perform black
calibration.
Then, white calibration and black calibration are completed.
4.3 Measurement
4.3.1 Measurement Locating
The instrument can visually locate through the cross of measuring aperture. It can be done
by observing the alignment between the cross and the sample, while moving the measuring
aperture to adjust the position.
4.3.2 Standard Measurement
Please enter “Standard Measurement” interface to perform measurements as shown in
Figure 6.
Put the measuring aperture on the standard sample, press “Testing” key. The colorimeter will
display color data of the standard sample.
Figure 6 Standard Measurement

MANUAL
© PCE Instruments
Click “No Name”, it will enter “Edit Name” interface as shown in Figure 16. You can edit the
name of the current standard.
Click “D65”, it will enter “Light Source” interface as shown in Figure 19. You can set the light
source of the current standard.
Click “10°”, you can switch the observer angle between 2° and 10°.
Click “LAB”, it will enter “Color Space” interface as shown in Figure 22. You can change the
color space of the current standard.
4.3.3 Sample Measurement
After testing the standard, press “Sample Measure”, it will enter Sample Measurement
interface as shown in Figure 7. Put the measuring aperture on the sample, press “Testing”
key. The colorimeter will display color data of the sample.
The L*a*b*C*h* data on the left side is current sample data. The data on the right side is
color difference data between current sample and standard.
Figure 7 Sample Measurement
Click “No Name”, it will enter “Edit Name” interface as shown in Figure 16. You can edit the
name of the current standard.
Click “D65”, it will enter “Light Source” interface as shown in Figure 19. You can set the light
source of the current standard.
Click “10” or “2”, you can switch the observer angle between 2° and 10°.
Click “LAB”, it will enter “Color Space” interface as shown in Figure 22. You can change the
color space of the current standard.

MANUAL
© PCE Instruments
4.3.4 Measure and View Spectral Reflectance Graph
Under standard or sample measurement interface, click “ ” to switch to next page. It will
display the spectral reflectance curve. Click “ ”, it will display wavelength data and
reflectance data of next wave band. Click “ ”, it will display wavelength data and
reflectance data of previous wave band. The wavelength range of the instrument is
“400-700nm”. The interval is 10nm.
Figure 8 Spectral Reflectance Interface

MANUAL
© PCE Instruments
4.4 Connecting to PC
Click “Comm” to enter the interface shown in Figure 9. Follow the tips to connect instrument
to PC. Click “OK”, the instrument will enter “Communicating…” as shown in Figure 10. Then
you can control the instrument through the software.
Figure 9 USB Communication Figure 10 Communicating
4.5 Print
Connect the instrument to micro printer. It can print measurement data automatically under
“Standard Measurement” or “Sample Measurement” interface.
5. System Function Description
You can set the system function from main menu as shown in Figure 4.

MANUAL
© PCE Instruments
5.1 Data Management
Click “Data” in main menu to enter data management interface as shown in Figure 11. Data
management is mainly for checking, operating the measured records and inputting standard
data manually.
Figure 11 Data Management
Check Record
1) Check Standard Record
Select “Check Record” to enter “Standard Record” interface as shown in Figure 12. It’s the
standard data. You can check different standard data by clicking “↑” and “↓” at the bottom of
the screen. “T001” in the figure means standard record No. “no name” means the default
name of the standard.
2)Check Sample Record
Click “Sample” in standard record interface to check the sample data and the color
difference between the standard and the sample as shown in Figure 13. You can check
different sample data by clicking “↑”and “↓” at the bottom of the screen. “No.001” means the
sample record No. “T001” means standard record No.
3) Switch Standard Record and Sample Record
Click “Sample” in standard record interface to switch to sample record interface.
Click “Standard” in sample record interface to switch to standard record.

MANUAL
© PCE Instruments
Figure 12 Standard Record
Figure 13 Sample Record
Click “No Name”, it will enter “Edit Name” interface as shown in Figure 16. You can edit the
name of the current standard.
Click “D65”, it will enter “Light Source” interface as shown in Figure 19. You can set the light
source of the current standard.
Click “10”, you can switch the observer angle between 2° and 10°.
Click “LAB”, it will enter “Color Space” interface as shown in Figure 22. You can change the
color space of the current standard.

MANUAL
© PCE Instruments
5.1.2 Check Spectral Reflectance Curve
Under standard or sample measurement interface, click “ ” to switch to next page. It will
display the spectral reflectance curve. Click “ ”, it will display wavelength data and
reflectance data of next wave band. Click “ ”, it will display wavelength data and
reflectance data of previous wave band. You can check the spectral reflectance curve of
difference standards or samples by clicking “↑”and “↓” at the bottom of the screen.
Figure 14 Spectral Reflectance Curve of Standard Record

MANUAL
© PCE Instruments
5.1.3 Editing Record Name
Click “Operate” in record interface, popup a small menu as shown in Figure 15. Click “Edit
Name” to enter figure 16. Click the characters or numbers on the virtual keyboard to edit
current record name.
Figure 15 Record Operation Interface
Figure 16 Name Edit Interface

MANUAL
© PCE Instruments
5.1.4 Deleting a Single Record
In the popup menu under the standard record shown in Figure 15, click “Delete Record”. It
will pop up a warning interface. Click “OK”, then the current standard and its sample records
will be deleted. If delete record in sample record interface, it will only delete a single sample
record.
5.1.5 Turning Standard Record into Measurement Standard
If you need to measure color difference under a saved standard, you can click “Standard
Entering” in “Record Operation Interface” pop-up menu. Then the standard record is
transferred to measurement interface. Click “Sample Measure”, you can start to perform
sample measurement.
5.1.6 Turning Sample Record into Measurement Standard
In some cases, you need to use a saved sample record as a standard. You can click
“Standard Entering” in “Record Operation Interface” pop-up menu. Then, the sample record
will be transferred to measurement interface as a standard (Meanwhile, it will save as a new
standard automatically.). Click “Sample Measure”, you can start to perform sample
measurement.
5.1.7 Deleting All Records
Select “Data Delete” in main menu. It has two options: “Delete All Samples” and “Delete All
Records”
1)Delete All Samples
Click “Delete All Samples”. It will pop up a warning interface. Click “OK”, all sample records
will be deleted, but the standard records are still retained.
2)Delete All Records
Click “Delete All Records”, the records (including standard records and sample records) will
be deleted. Then, it will pop up a warning interface. Click “OK”, all records in the instrument
will be deleted permanently.
Note: Please pay attention to this operation in case of accidentally deleting the needed
historical records.

MANUAL
© PCE Instruments
5.1.8 Standard Input
Select “Standard Input” in main menu. It includes two functions “Input L*a*b” and “Input
XYZ”.
1) Input LAB
Click “Input LAB”, enter “Input L*” interface as shown in Figure 17. Click the numbers in
virtual keyboard. Input value L*, click “OK”. Then input value a* and b* and enter “Edit Name”
interface.
Figure 17 Input LAB
2) Input XZY
It is the same with “Input L*a*b”

MANUAL
© PCE Instruments
5.2 Tolerance Setting
Select “Tolerance” in main menu as shown in Figure 18. Click the virtual keyboard to input
tolerance. Then click “OK” to save the settings and back to main menu.
If you don’t want to set or modify tolerance, click “Back” to return to the main menu.
Figure 18 Tolerance Setting
Tolerance is set by users according to their color management requirements. The instrument
will judge whether the color difference ΔE is qualified or not. If ΔE is less than tolerance, the
sample color is qualified. If ΔE is greater than tolerance, then sample color is unqualified.

MANUAL
© PCE Instruments
5.3 Light Source Setting
Click “Light Source” in main menu to select light sources as shown in Figure 19. Users can
select different light source to do measurements. This instrument includes D65、D50、A、C、
D55、D75、F1、F2、F3、F4、F5、F6、F7、F8、F9、F10、F11、F12 totally 18 light sources.
After Selecting, click “OK” to save the settings and back to main menu.
Figure 19 Light Source Setting

MANUAL
© PCE Instruments
5.4 Average Measurement
Click “Average” in main menu to enter Figure 20. Click the virtual keyboard. Users can set
the number of average measurements according to the requirements. Then click “OK” to
save the settings and back to main menu. If set to “0” or “1”, the instrument will only do single
measurement. The default measurement is single measurement.
Figure 20 Average Measurement

MANUAL
© PCE Instruments
5.5 Color Options
Click “Color Options” in main menu to enter Figure 21. Users can select different “Color
Space”, “Color Index”, “Observer Angle”, and “Color Parameter”. Select the options by “↑”
and “↓”, and press “OK” to save all the settings. This selection will affect the display content
in “Standard Measurement” and “Sample Measurement”.
Figure 21 Color Options

MANUAL
© PCE Instruments
5.5.1 Color Space
Click “Color Space” to enter Figure 22 interface. There are six color space modes in this
instrument: “CIE LAB, LCh”, “CIE XYZ, Yxy”, “CIE LUV, LCh”, “LAB &WI &YI”, “Color
Fastness”, “Staining Fastness”.
Different modes are corresponding to different standard measurement and sample
measurement interface. The standard measurement interface of “CIE LAB, LCh”, “Color
Fastness” and “Staining Fastness” is shown in Figure 3. The standard measurement
interface of “CIE XYZ, Yxy”, “CIE LUV, LCh”, “LAB &WI &YI” is shown in Figure 23~25.
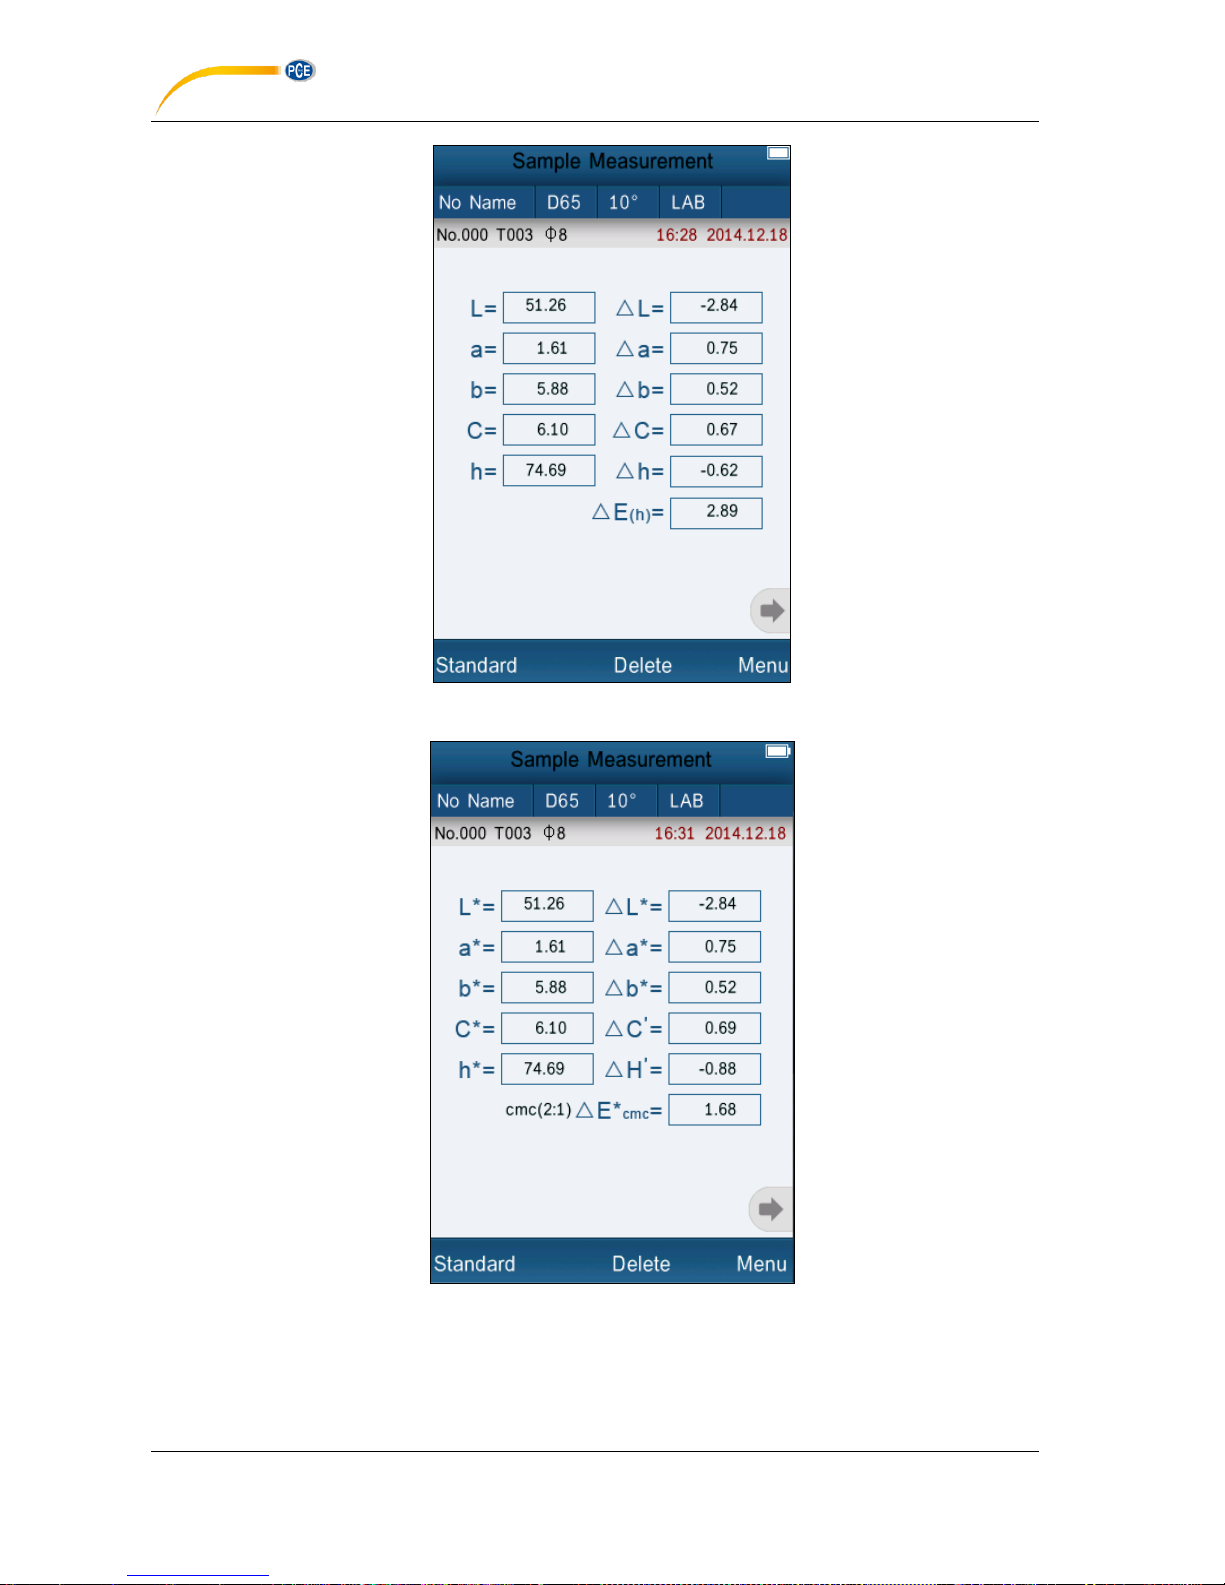
The sample measurement interface of “CIE LAB, LCh” is shown in Figure 7. The sample
measurement interface of “CIE XYZ, Yxy”, “CIE LUV, LCh”, “LAB &WI &YI” is shown in
Figure 26~30.
Figure 22 Color Space

MANUAL
© PCE Instruments
Figure 23 CIE XYZ Standard Measurement
Figure 24 CIE L*U*V* Standard Measurement

MANUAL
© PCE Instruments
Figure 25 LAB &WI &YI Standard Measurement
Figure 26 CIE XYZ Sample Measurement
MANUAL
© PCE Instruments
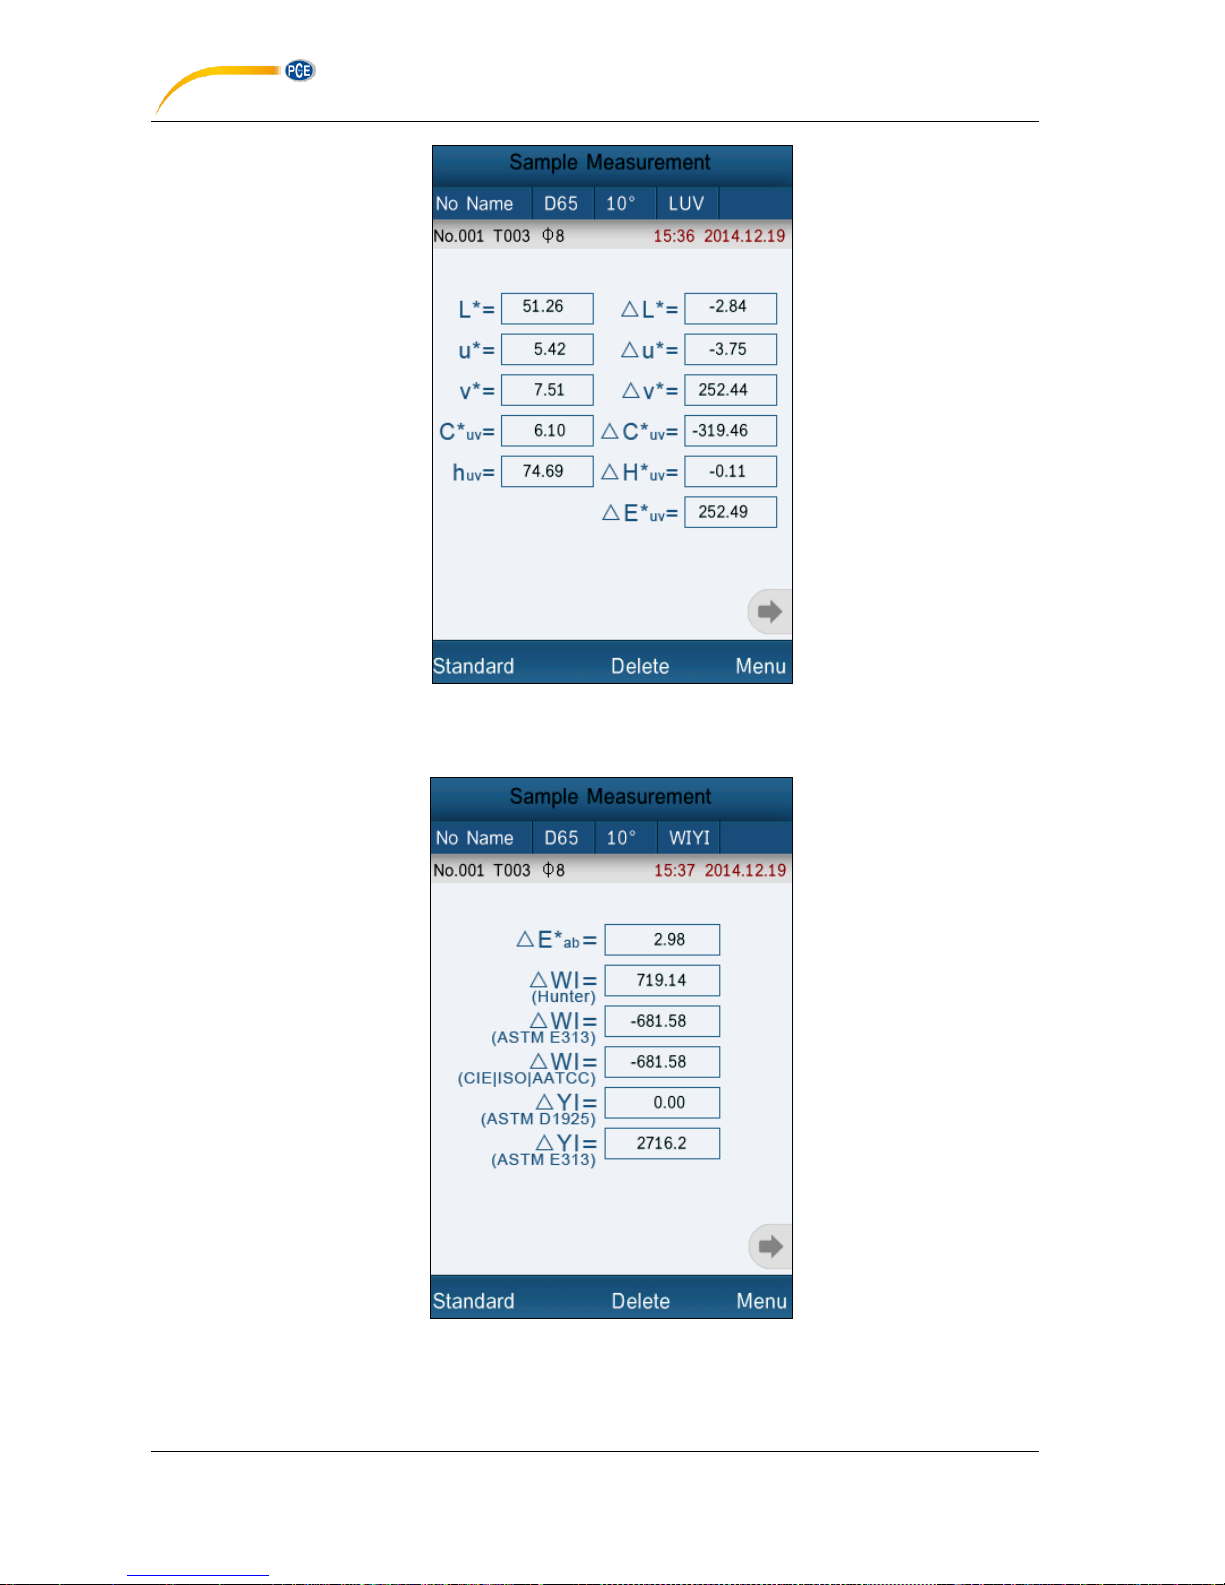
Figure 27 CIE L*U*V* Sample Measurement
Figure 28 LAB &WI &YI Sample Measurement

MANUAL
© PCE Instruments
Figure29 Color Fastness Measurement
Figure 30 Staining Fastness Measurement

MANUAL
© PCE Instruments
5.5.2 Color Index
Click “Color Index” to enter Figure 31. There are six color index modes in this instrument.
“CIE1976 △E*ab”, “CIE94 △E*94”, “△E(Hunter)”, “△E*cmc(2:1)”, “△E*cmc(1:1)”, “CIE2000
△E*00”, “Metameric Index”, “Color Strength”.
Color Index is available to “CIE LAB, LCH” color space. Under color index, different modes
are corresponding to special color difference formula. Each mode has different display in
sample measurement interface as shown in Figure 32~37.
Figure 31 Color Index

MANUAL
© PCE Instruments
Figure 32 Color Index CIE1976 Sample Measurement
Figure 33 Color Index CIE94 Sample Measurement
MANUAL
© PCE Instruments
Figure 34 Color Index Hunter Sample Measurement
Figure 35 Color Index cmc(2:1) Sample Measurement

MANUAL
© PCE Instruments
Figure 36 Color Index cmc(1:1) Sample Measurement
Figure 37 Color Index cmc(l:c) Sample Measurement

MANUAL
© PCE Instruments
Figure 38 Color Index CIE2000 Sample Measurement
Figure 39 Metameric Index Sample Measurement

MANUAL
© PCE Instruments
Figure 40 Color Strength Sample Measurement
5.5.3 Observer Angle
In accordance with CIE standard, the instrument has two observer angles: 2° and 10°. Click
“Observer Angle” in color options interface to select it.
5.5.4 Color Parameter
Color Parameter includes “Metameric Settings”, “CIE94 △E*94”,
“△E*cmc(l:c)”、“CIE2000 △E*00” factor setting。
Metameric settings can select two kinds of lights and observer angles, and you can set the
coefficient factor of CIE94 △E*94”, “△E*cmc(l:c)”、“CIE2000 △E*00”.

MANUAL
© PCE Instruments
5.6. Display Setting
Display setting includes the function of turn-on and off for “Color Offset”, “Tolerance Prompt”,
and “Screen Inversion”.
Click “Color Offset” and turn on it, then it will display color offset prompt on the right of △L、
△a*、△b* in the sample measurement interface.
Click “Tolerance Prompt” and turn on it, then it will display “fail” or “pass” on the right of △E in
the sample measurement interface.
When △E is less than the value of tolerance (setting in “Tolerance Setting”), it displays
“Pass”. Otherwise, it will display “Fail”.
“Color Offset” and “Tolerance Prompt:” as shown in Figure 41.
Figure 41 “Color Offset” and “Tolerance Prompt”
Click “Screen Inversion” and turn on it, then all the display interfaces will be inversion
display.

MANUAL
© PCE Instruments
5.7 Function Setting
Click ‘Settings” to set other functions as shown in Figure 42.
Figure 42 Function Settings
5.7.1 Auto Save
Click “Auto Save” in “Settings” interface. It has two options: “On” and “Off”. If select “Off”, you
have to save the data manually when measuring. If select “On”, the instrument will save data
automatically.
5.7.2 Time Set
Click “Time Set” in “Settings” interface, as shown in Figure 43.
Click “Set Time” to set the current time as shown in Figure 44.
Click “Set Date” to set the current date as shown in Figure 45.
Click “Time Format” to set the required time format as shown in Figure 46.
Click “Date Format” to set the required date format as shown in Figure 47.

MANUAL
© PCE Instruments
Figure 43 Time & Date Setting
Figure 44 Set Time

MANUAL
© PCE Instruments
Figure 45 Set Date
Figure 46 Time Format

MANUAL
© PCE Instruments
Figure 47 Date Format
5.7.3 Language Selection
Click “Language Selection” in “Settings” interface. Users can choose English or Chinese.
5.7.4 Backlight Time
Click “Backlight Time” in “Settings”. Users can set the backlight time according to the
requirement.
5.7.5 Screen Brightness
Click “Screen Brightness” in “Settings”. Users can adjust the brightness by “+” and “-“.
5.7.6 Buzzer Switch
Click “Buzzer Switch” in “Settings”. When click “Off”, it will not make a sound when
measuring. When click “On”, it will make a sound when measuring.
MANUAL
© PCE Instruments
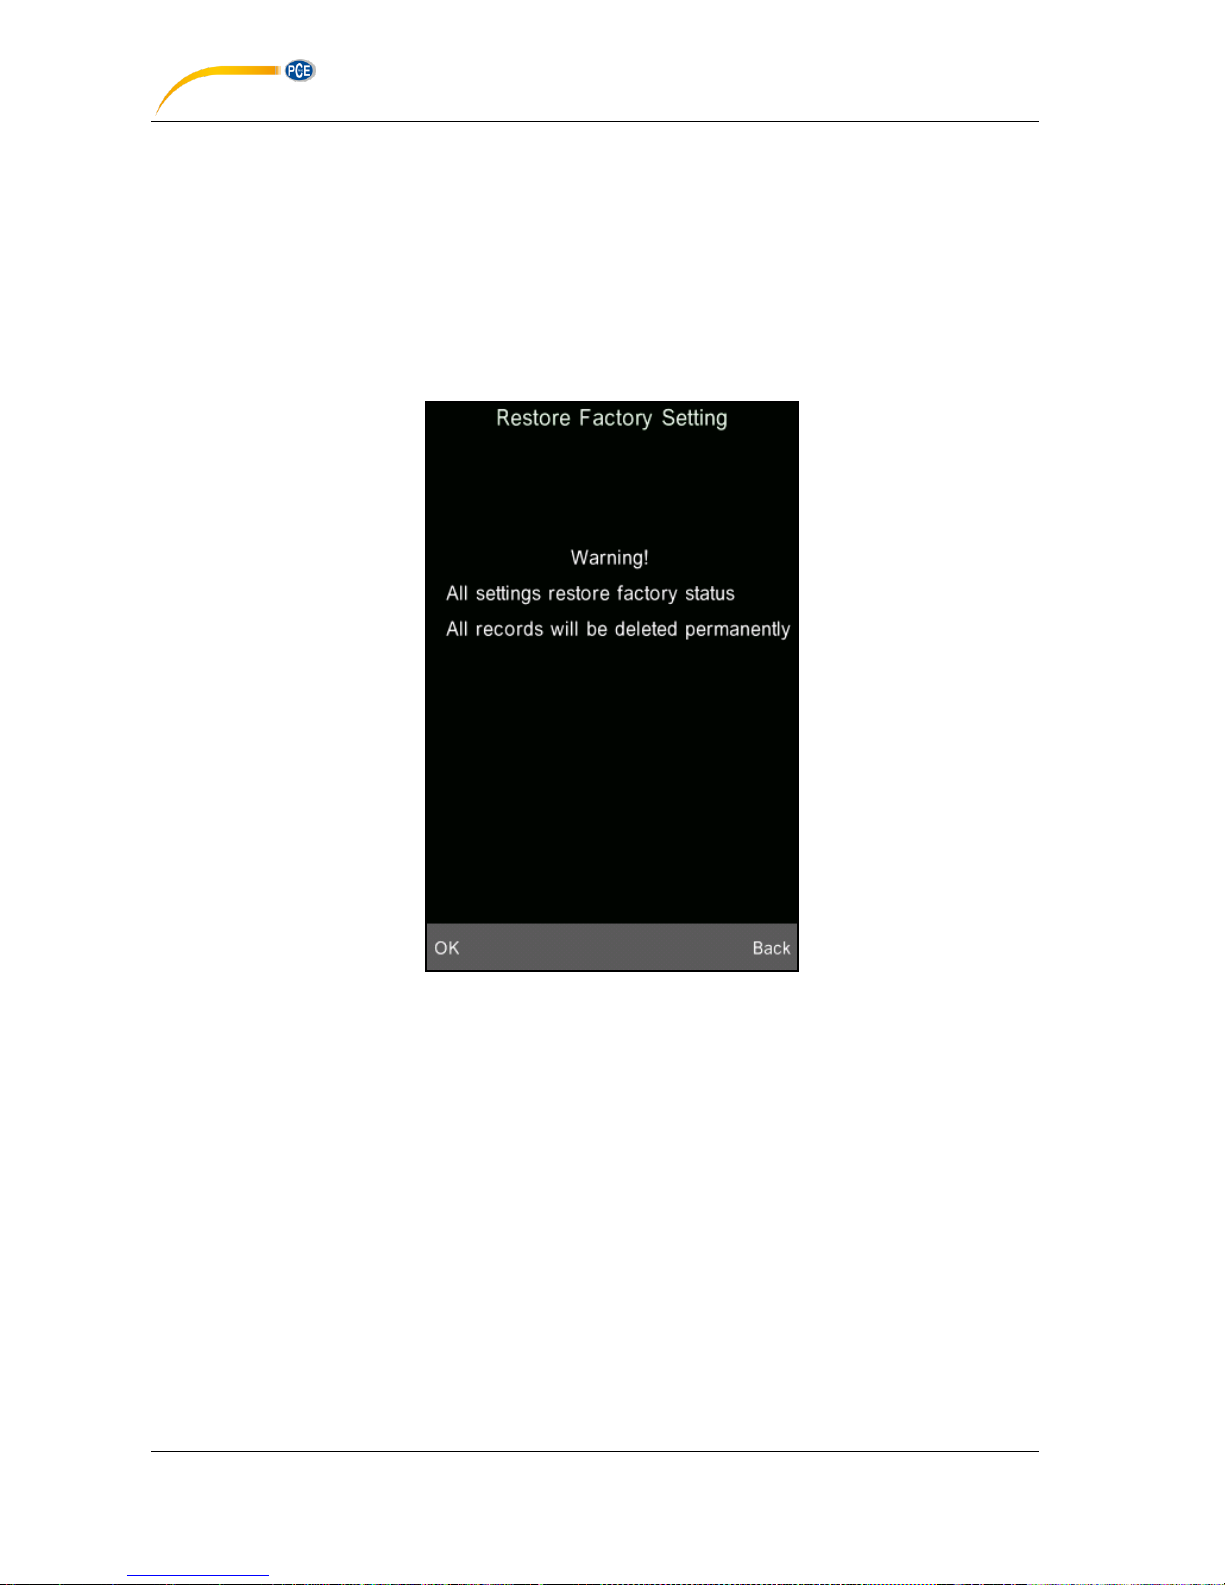
5.7.7 Restore Factory Settings
Click “Restore Factory Setting” in “Settings” as shown in Figure 44. Click “OK”, the
instrument will restore to factory settings and all records will be cleared.
Note: When set it, there will be a warning. Please operate it carefully. If you don’t want to
restore to factory settings, please click “Back”.
Figure 48 Restore Factory Settings

MANUAL
© PCE Instruments
6.Technical Parameters
6.1 Products Features
1) Touch screen, easy to operate.
2) Large screen (3.5 inch), high resolution (320*480), full-view display with clear image.
3) Aesthetic design perfectly combined with ergonomics structure.
4) D/8 geometrical optics structure, comply with CIE, ISO, ASTM, DIN standard.
5) Visible spectrum 400~700nm reflectance curve.
6) Two standard observer angles, multiple light sources modes, a variety of color systems.
7) The repeatability ΔE*ab is within 0.04, the errors between each instrument ΔE* ab is less
than 0.2.
8) PC software with powerful extension functions.
9) High hardware configuration with a number of innovative technologies.
10) Oversized integrating sphere, more effective homogenization ray of lights and precise
measurement.
11) 15° oblique angle screen, more in line with the human eye observation.
12) Large capacity storage, can save more than 10000 data.
13) Input standard data manually, easy to operate.

MANUAL
© PCE Instruments
6.2 Technical Specifications
Model
NS810
Illumination/observation
system
D/8 (Diffused illumination, 8-degree viewing angle) Conforms to
CIE No.15, GB/T 3978
Integrating sphere Size
Φ58mm
Light Source
Combined LED sources
Sensor
Silicon photodiode array
Wavelength range
400~700nm
Wavelength interval
10nm
Measuring Aperture
Φ8mm
Color Space
CIE LAB, XYZ, Yxy, LCh, CIE LUV, HunterLAB
Color Index
ΔE
*
ab
, ΔE
*
uv
, ΔE
*
94
, ΔE
*
cmc(2:1)
, ΔE
*
cmc(1:1)
, ΔE
*
00,
ΔE(h)
Chromaticity Data
WI(ASTM E31CIE/ISO, AATCC, Hunter)
YI(ASTM D1925,ASTM E313)
TI(ASTM E313,CIE/ISO)
Metamerism Index Mt, Color Strength
Color Stain, Color Fastness
Observer
2°/10°
Illuminant
D65, D50,A,C,D55,D75,F1,F2,F3,F4,F5,F6,F7,
F8,F9,F10,F11,F12
Display Data
Spectral Value/Graph, Colorimetric Value, Color Difference
Value/Graph, PASS/FAIL Result, Color Offset, Color Simulation
Minimum Interval
between Measurement
1.5s
Repeatability Spectral
Reflectance
standard deviation within 0.1% (400~700nm: within 0.2%),
Colorimetric Value: Standard deviation within Delta E*ab 0.04

MANUAL
© PCE Instruments
Errors between each
instrument
Within Delta E*ab 0.2 (Average for 12 BCRA Series II color tiles)
Dimension: (L*W*H)
90*77*230mm
Weight
600g
Battery
Li-ion battery, 5000 times within 8 hours.
Lamp Life
5 years, more than 1.6 million measurements
Display Screen
TFT 3.5inch Capacitive Touch Screen
Port
USB/RS-232
Storage
1000 Standards, 15000 Samples
Operating Temperature
0~40℃(32~104°F)
Storage temperature
-20~50℃(-4~122°F)
Humidity range
less than 85% relative humidity, no condensation
Standard Accessories
Power Adapter, Li-ion Battery; Operation
Manual, Software CD; USB Cable, White and
Black Calibration Cavity, Protective Cover, Wrist Strap
Optional Accessory
Universal Test Components for liquid, powder and particle test,
Powder Test Box
*Note: The specifications are subject to change without notice.
 Loading...