

Page 1
PCE Americas Inc.
711 Commerce Way
Suite 8
Jupiter
FL-33458
USA
From outside US: +1
Tel: (561) 320-9162
Fax: (561) 320-9176
[email protected]
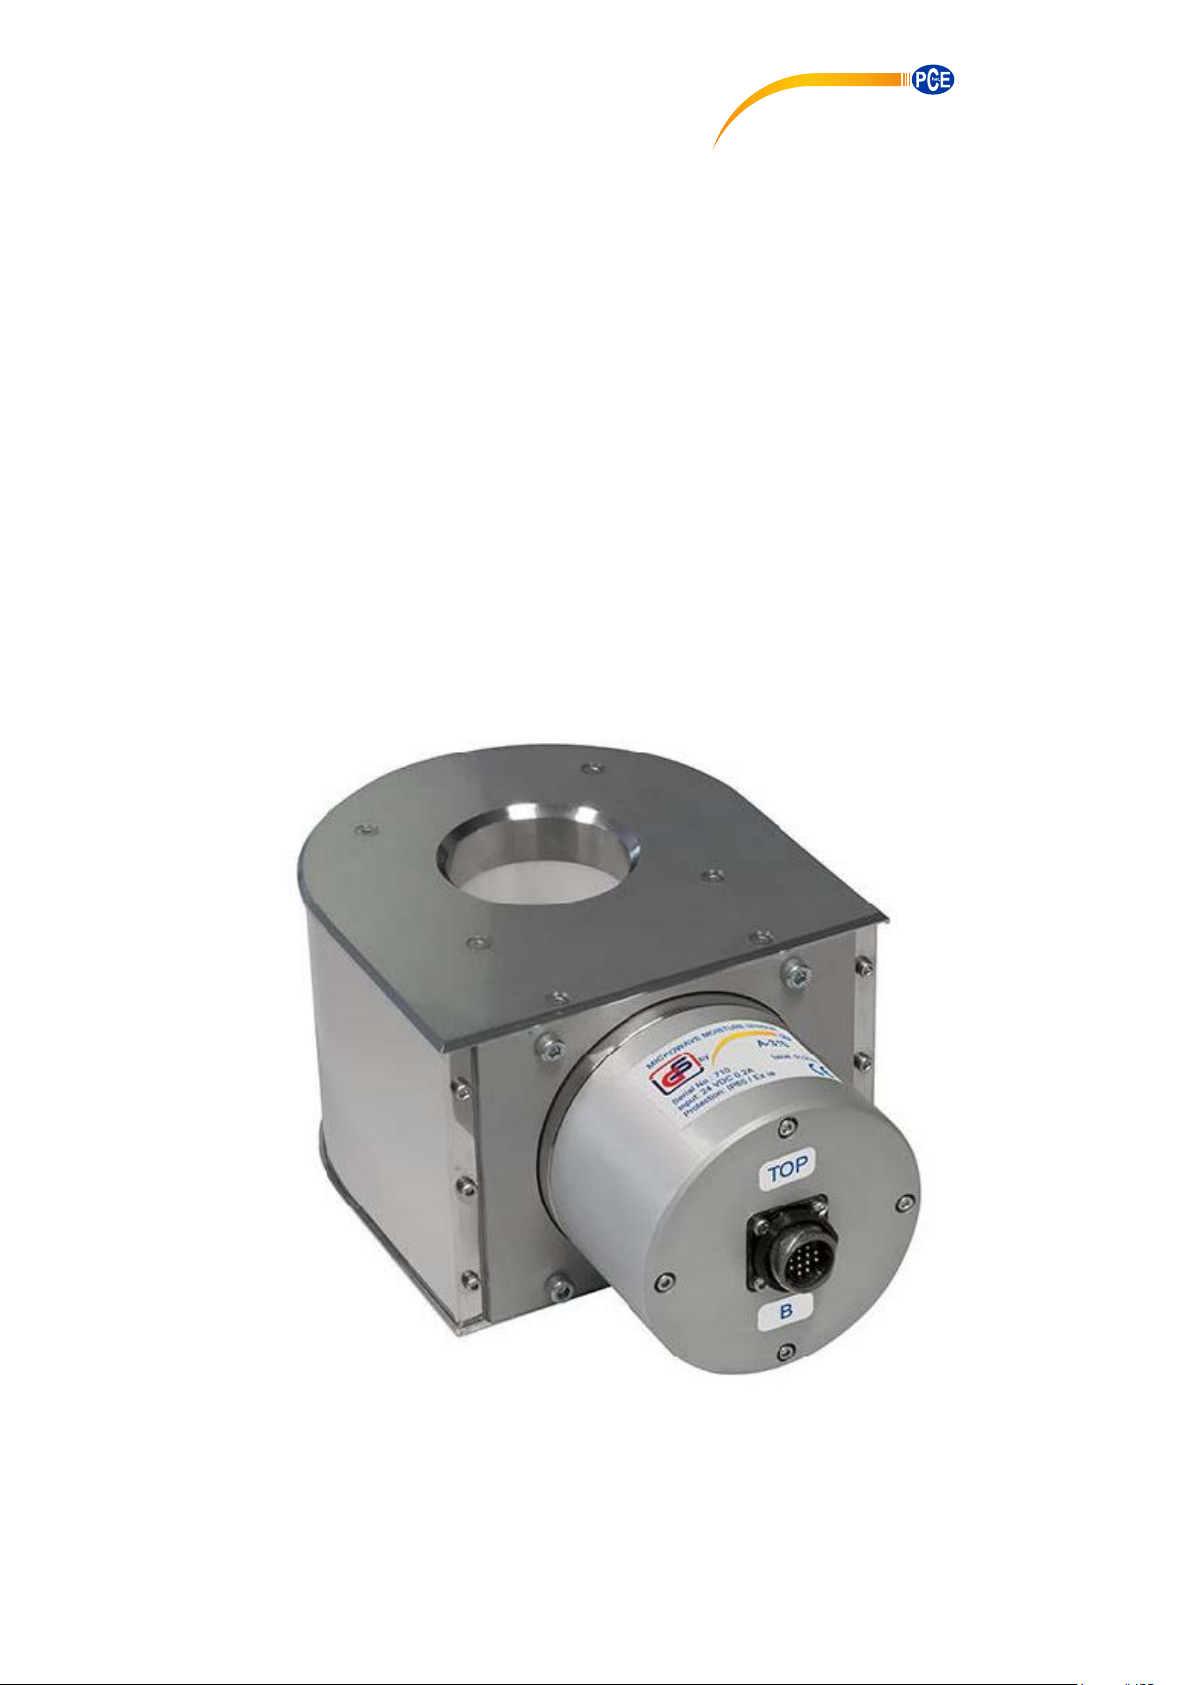
Grain Moisture Analyzer
PCE-A-315
INSTRUCTION MANUAL
PCE Instruments UK Ltd.
Unit 11
Southpoint Business Park
Ensign way
Hampshire / Southampton
United Kingdom, SO31 4RF
From outside UK: +44
Tel: (0) 2380 98703 0
Fax: (0) 2380 98703 9
www.pce-instruments.com/english
www.pce-instruments.com
Page 2

Contents
Contents
GENERAL SAFETY RECOMMENDATIONS .............................................................. 3
1. GENERAL INFORMATION ..................................................................................... 4
2. SPECIFICATIONS................................................................................................... 6
3. PRINCIPLE OF OPERATION ................................................................................. 7
4. WORKING WITH CONTROL PANEL...................................................................... 8
4.1. CONNECTIONS .................................................................................................... 8
4.2. SELECTING PRODUCT AND PERFORMING MOISTURE MEASUREMENTS ..................... 10
4.3. TREND VIEW ..................................................................................................... 13
4.4. ENTERING CORRECTIONS AND PARAMETERS ....................................................... 15
4.5. VIEWING ARCHIVE DATA ..................................................................................... 23
4.6. SETTING TIME AND DATE .................................................................................... 24
5. INSTALLATION ..................................................................................................... 25
6. TROUBLESHOOTING .......................................................................................... 27
7. DIMENSIONAL DRAWING ................................................................................... 29
2/29
Page 3
General safety recommendations
The product is designed for industrial use. Installation and service must
be carried only out by trained and authorized personnel and according
to valid standards.
Before making any electrical connections, ensure that power supply
voltage and frequency meet the specifications provided on the labels of
devices and in this manual.
Incorrect connection may cause damage to the device. When installing,
always refer to relevant safety regulations.
Before carrying out any welding work near the device, make sure that
the device is disconnected from the power supply.
Do not use the device with damaged insulation of cables. In the case of
damage to the cable, disconnect the device from the power supply and
contact manufacturer or local dealer for cable replacement.
In case of device malfunction do not attempt to disassemble and repair
the device. Please, contact manufacturer or local dealer for repair.
Take precautions when mounting the equipment by using appropriate lift
gear, platforms and tools.
General safety recommendations
3/29
Page 4
General information
Grain:
- wheat
- barley
- oats
- triticale
- rye
- corn
- buckwheat
- millet
- sorghum
- rice
Oil crops:
- rape
- sunflower
- jojoba
Leguminous
crops:
- peas
- lupine
- soybean
Other:
- seaweed
- coffee
1. General information
The system of online moisture content measurement is designed for continuous
measurement of current moisture content of grain products, oil or leguminous crops
and other products at inlet and outlet of continuous flow grain dryers.
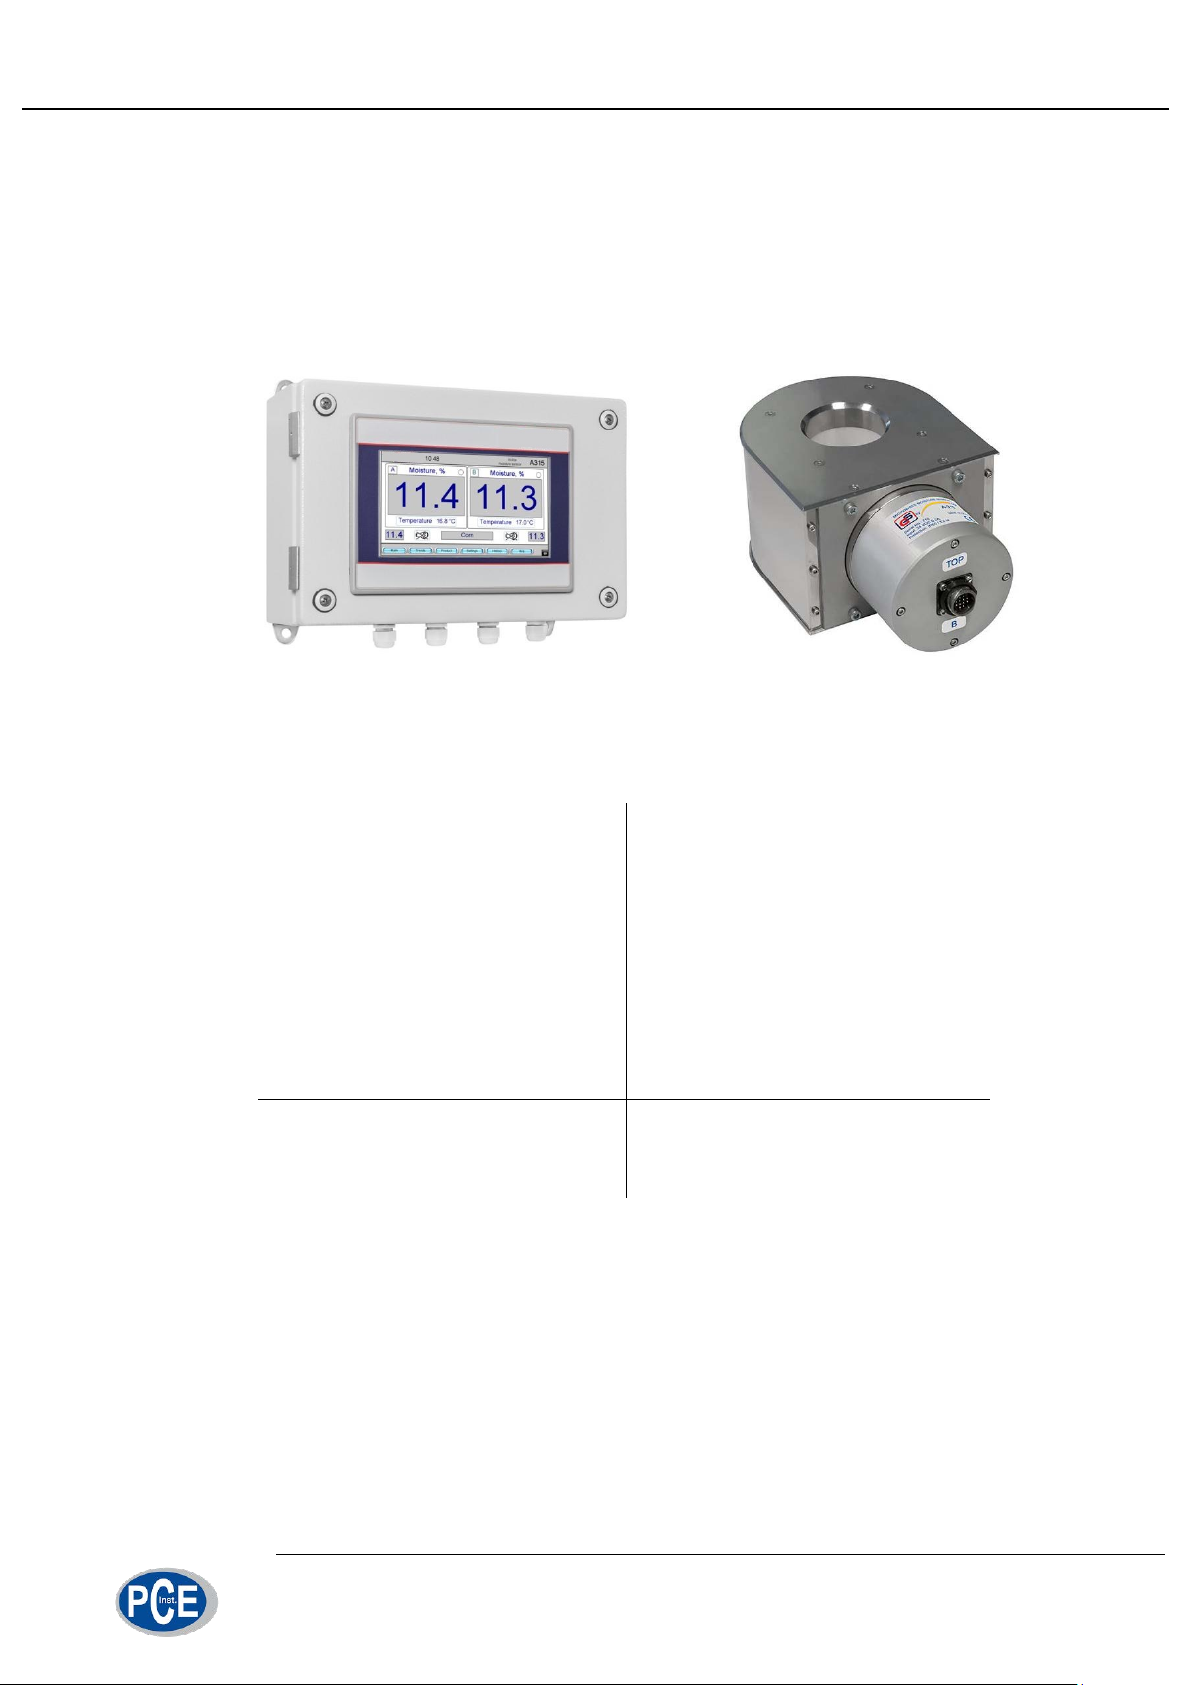
fig 1. System of online moisture content measurement
The system can be used for measuring moisture content of the following products:
The system of online moisture content measurement consists of two А315 microwave moisture sensors and control panel (fig. 1). One moisture sensor is installed
at the inlet of dryer and another is at the outlet of dryer. If grain drying complex has
two drying shafts, one moisture sensors can be installed at the outlet of each shaft.
Control panel is installed at the operator station and intended for monitoring of
input and output flow moisture. Information about grain moisture and temperature is
displayed in digital form and in the form of charts (trends).
4/29
Page 5

General information
Control panel allows adjusting scaling settings of two moisture content current
loop outputs for use in automation systems, storing correction coefficients for measured moisture content of every product, time-averaging of measurement results and
other functions described in this manual.
5/29
Page 6

Specifications
2. Specifications
Sensor type .................................................................. microwave;
Measuring mode ........................................................... continuous;
Measuring range .......................................................... 5 – 40%;
Moisture content measurement error (up to 18%) ........ ±0.5% max;
Moisture content measurement error (18-40%) ........... ±1% max;
Product temperature ..................................................... +5ºС – +55ºС;
Ambient temperature ................................................... 0ºС – +55ºС;
IP rating ....................................................................... IP65;
Communication protocol ............................................... RS-485;
Cable length between sensor and control panel .......... up to 100 m;
Analog output ............................................................... 4-20 or 0-24 mA;
Analog output loading capability .................................. 400 Ω max;
Sensor weight ............................................................... 6.5 kg;
Control panel weight ..................................................... 4.5 kg;
Control panel power supply .......................................... 100-240VAC / 50-60Hz;
Sensor power supply .................................................... 24VDC.
6/29
Page 7
Principle of operation
3. Principle of operation
The principle of sensor A315 operation is based on the considerable difference
of the permittivity of dry substances and water at ultra-high frequencies (UHF).
The feature and important advantage of A315 moisture content sensor is that
due to simultaneous measurement of resonant frequency and amplitude of the resonance and special processing algorithm, moisture content measurements become
practically independent of product bulk density.
The sensing element is based on a ring resonator. The resonator has a cavity
formed by a PTFE tube for grain flow. Interaction of grain flow with resonator field inside the tube influences parameters of the resonator. Temperature sensors in measuring channel allow automatic correction of measured value of moisture content from
the grain temperature.
Electronics of the sensor consists of two units – UHF module and data processing module that control frequency response of measurement resonator, provide
necessary calculations and transfer of data to control panel via RS-485 interface.
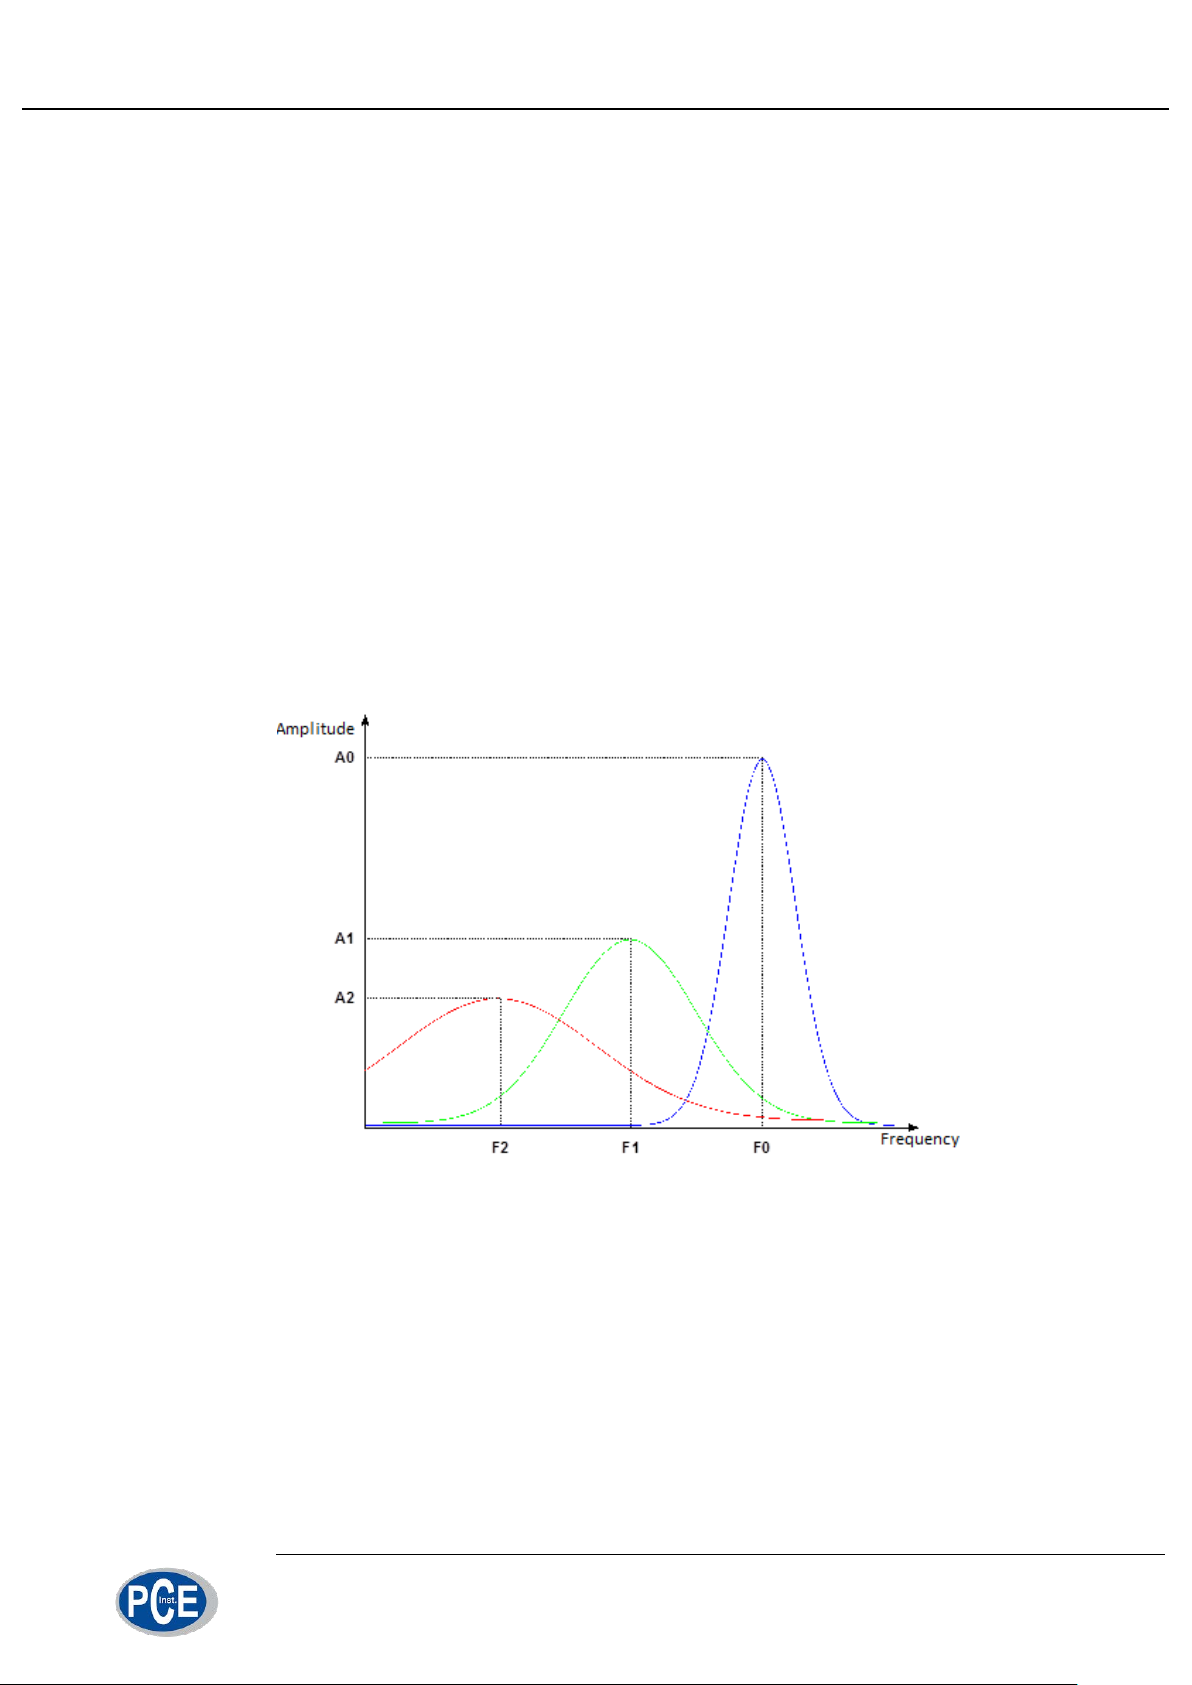
fig 2. Principle of operation
When the measuring channel is empty, the resonator has resonant frequency
F0 and amplitude A
ture content, the resonant frequency and amplitude decrease to F
(fig. 2). When the channel is filled with grain with certain mois-
0
and А1 respective-
1
ly. With the increase of moisture content in measured product, resonant frequency
and amplitude decrease even more (F
and А2). Simultaneous measurement of res-
2
onant frequency and amplitude allows determining moisture content independently of
grain density.
7/29
Page 8
Working with control panel
4. Working with control panel
4.1. Connections
Control unit is designed to work with two A315 grain moisture content sensors.
One of the sensors has address A, and the second one – address B.
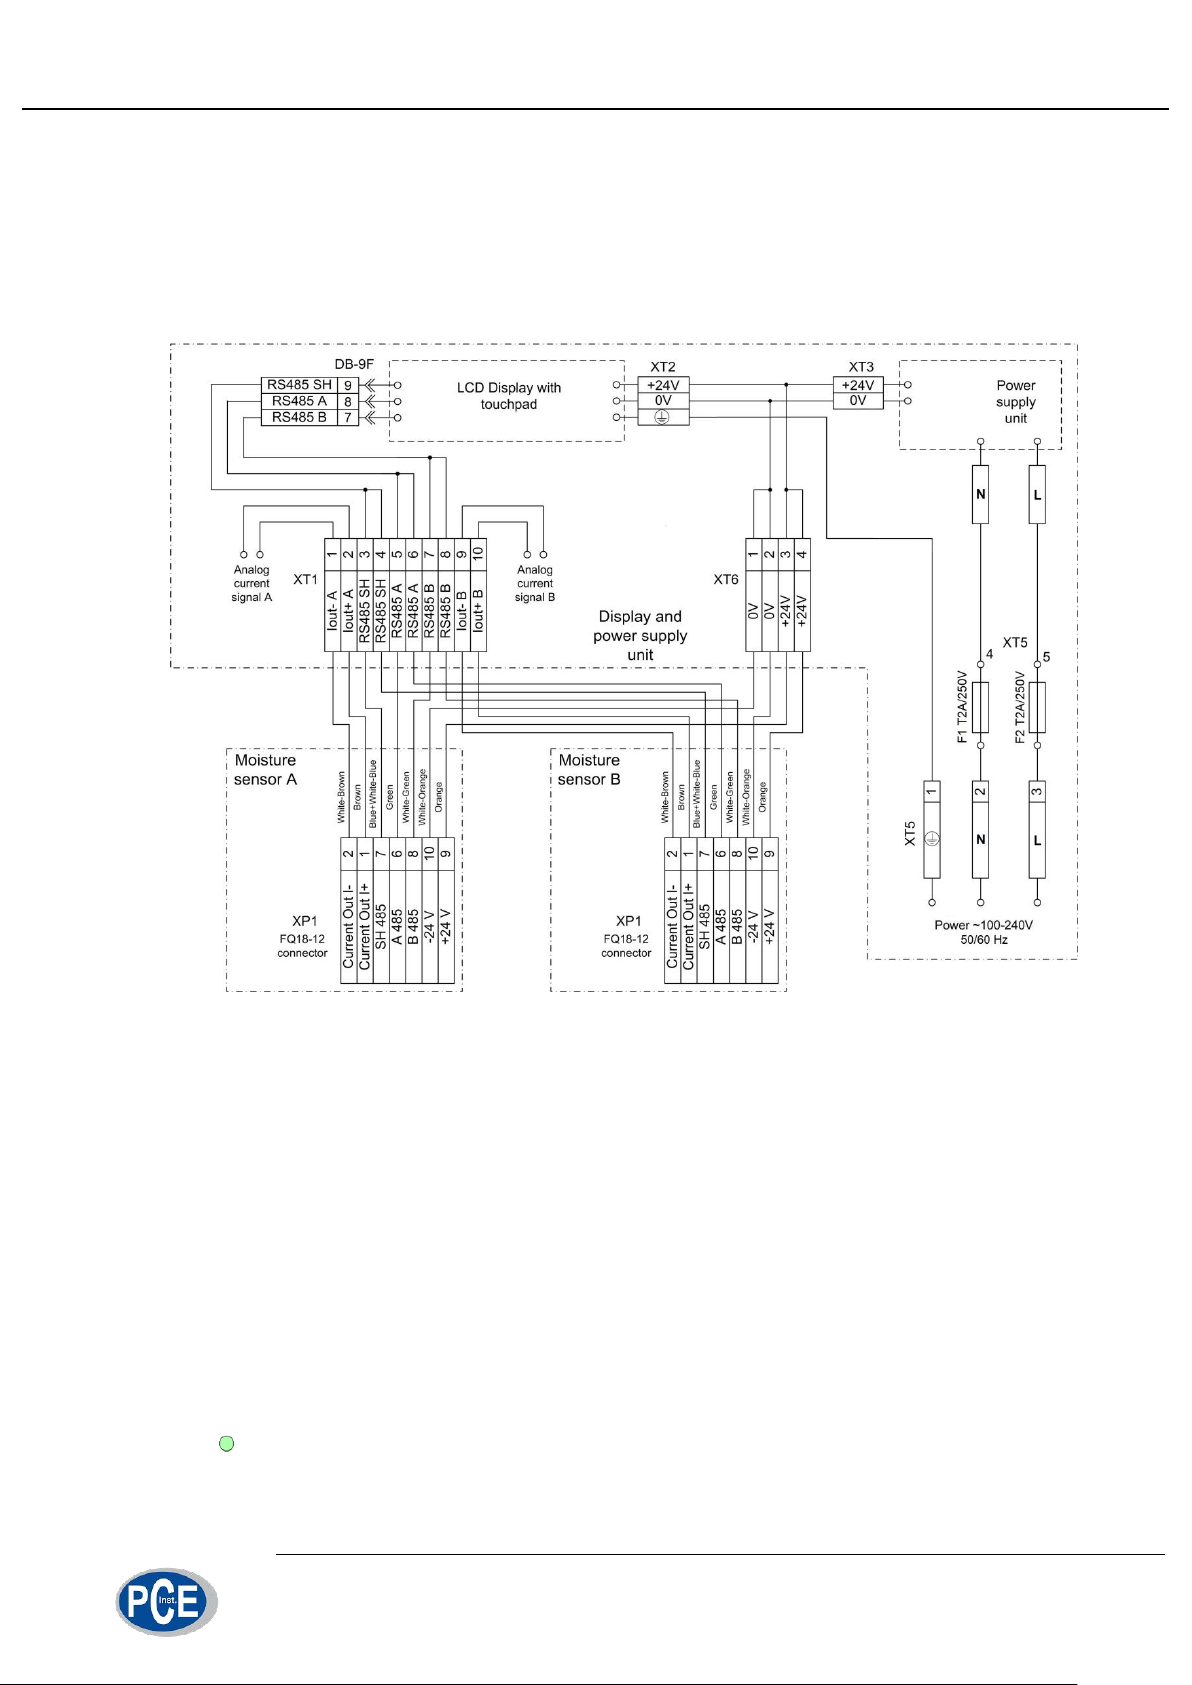
fig 3. Wiring diagram
Control panel is supplied with two pre-wired cables (3 m each) for connecting
the sensors. This allows to quickly plug the sensors and check their operation before
installation on the grain dryer and to learn how to work with the control panel.
For installation on the grain dryer 7-terminal junction box should be mounted at
the distance of up to 3 m from a sensor and sensor cable should be connected to it.
Communication lines (4 twisted pairs) of the required length (up to 100 m) from each
junction box are wired to the operator station where control panel is installed. Connections should be performed according to wiring diagram shown in fig. 3.
In order to check operation of measurement system place both sensors on a ta-
ble, connect the cables from control panel to sensors A and B and power up the con-
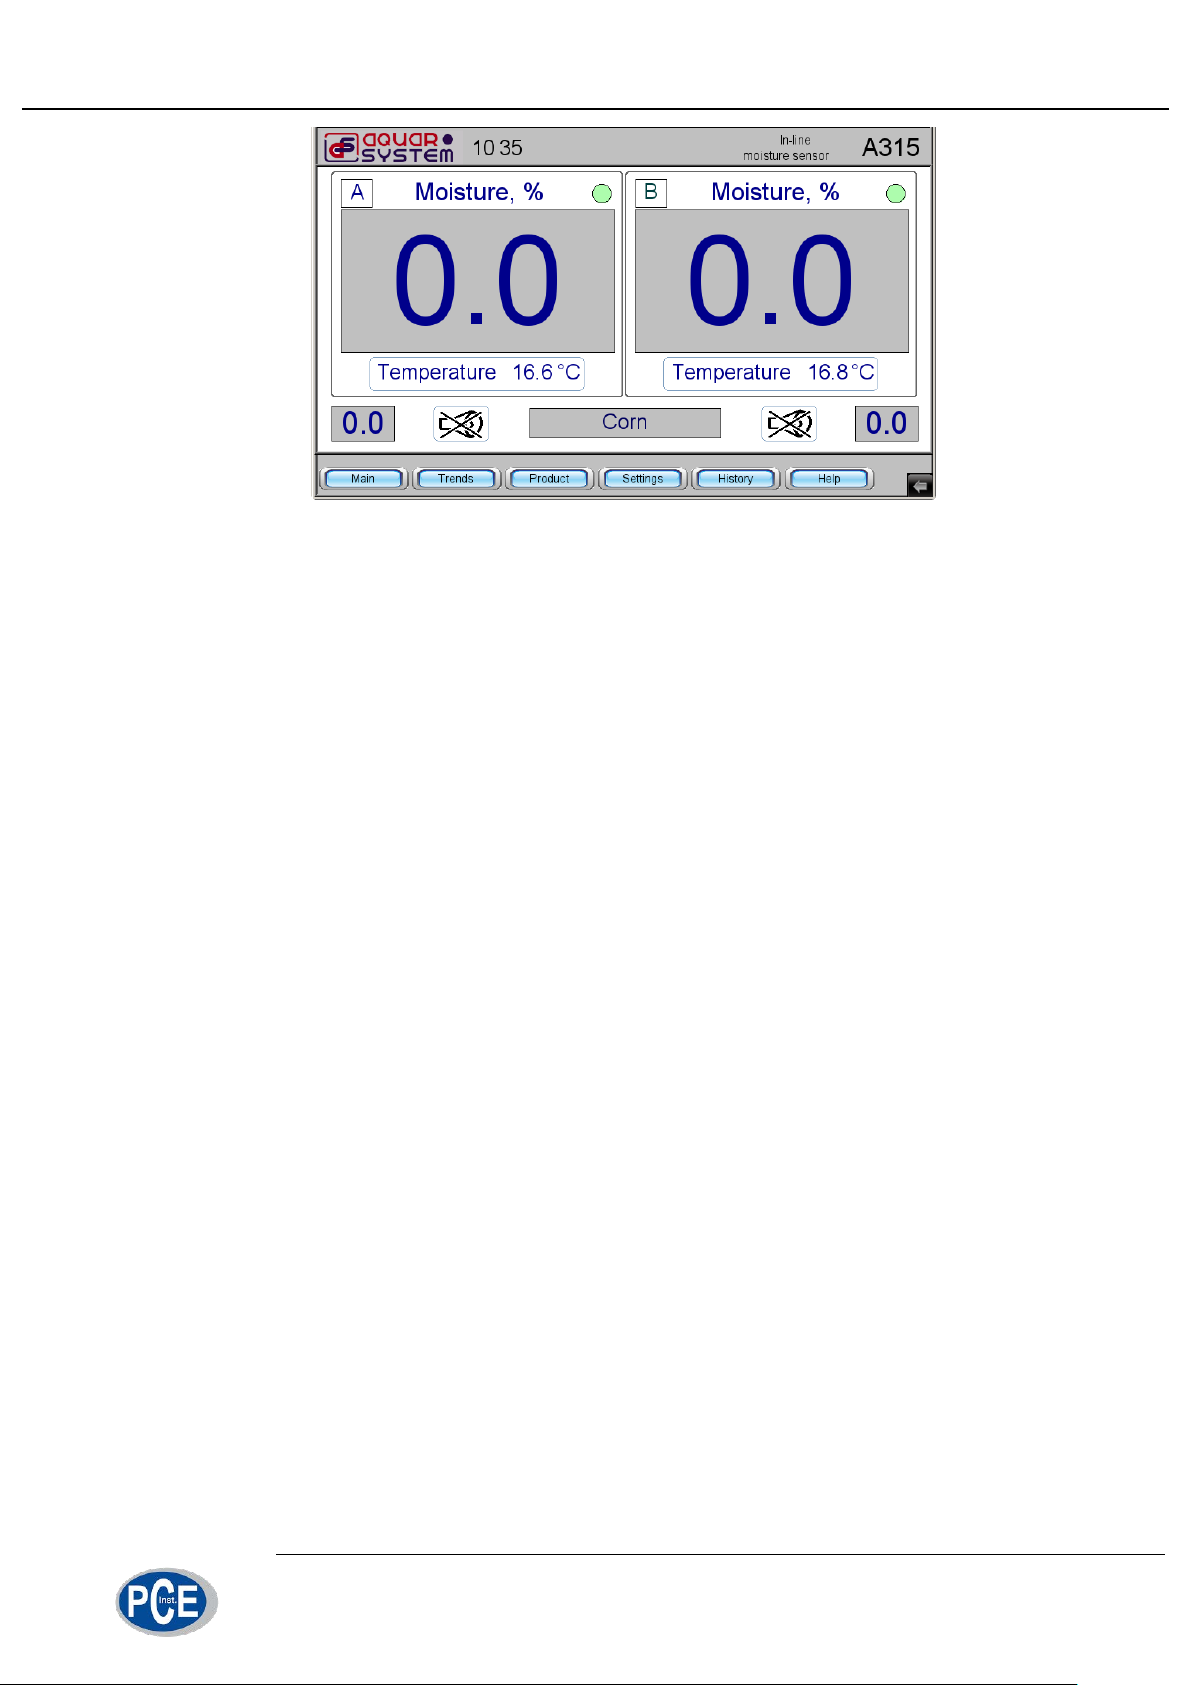
trol panel. After startup the display should look as shown in fig. 4. Two green indicators show that sensors are ready for measurements.
8/29
Page 9
Working with control panel
fig 4. Control panel screen after system startup
9/29
Page 10
Working with control panel
4.2. Selecting product and performing moisture measurements
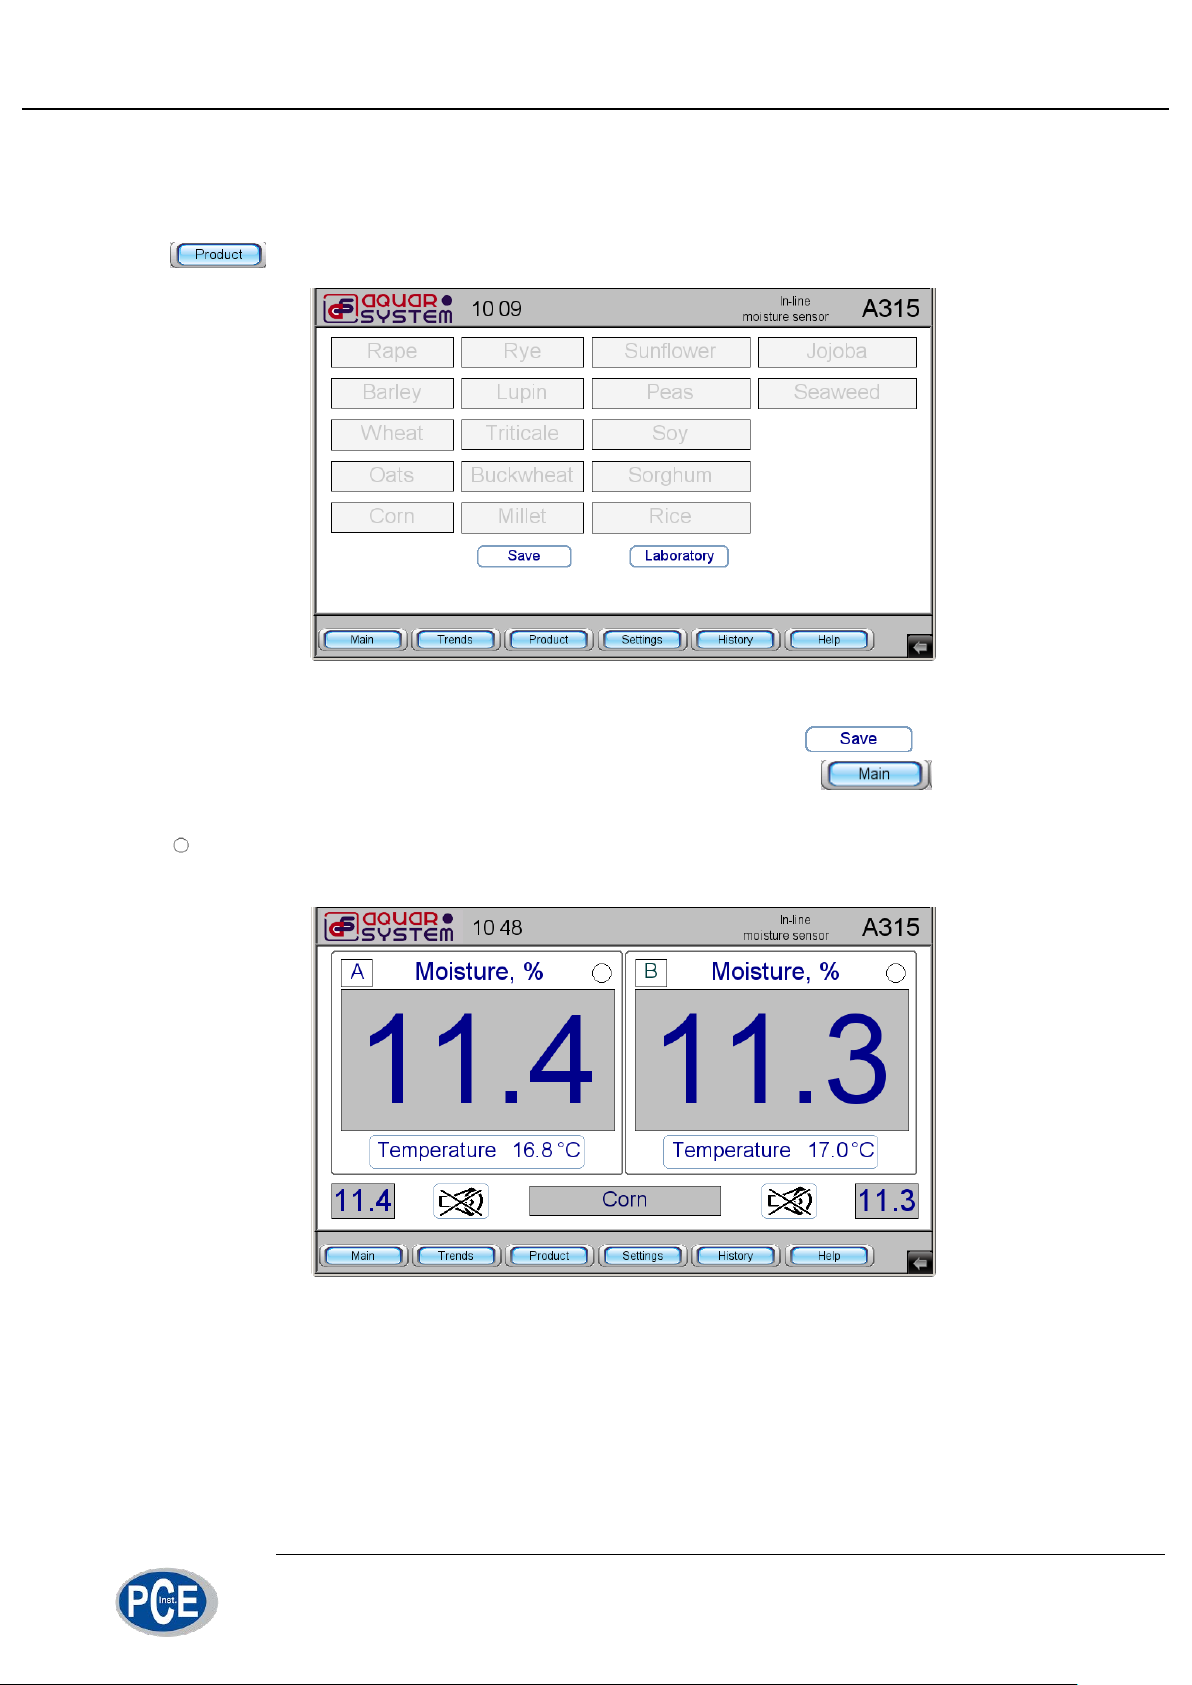
The work with moisture content sensors starts with product selection. Press
to open product selection menu (fig. 5).
fig 5. Product selection menu
Select the product and confirm selection by pressing . Now moisture
sensors are ready to work with the selected product. Select mode and fill
the measurement channels of the sensors with grain. Green indicators will turn white
and measured value of moisture content for each sensor will be shown on the dis-
play (fig. 6).
fig 6. Instantaneous and averaged moisture values
Small numbers in the bottom-left and bottom-right corners of the display represent instantaneous measured values for each sensor. Large numbers in the center of
the display show moisture contents values averaged over time (see section 4.4 for
averaging settings).
10/29
Page 11
Working with control panel
When grain is removed from moisture meters, the current values of the moisture
will show zero, but the average values will retain their previous readings (fig. 7). Averaged values can be reset by pressing on them when the measurement channel of
the sensor is empty.
fig 7. Showing average moisture values
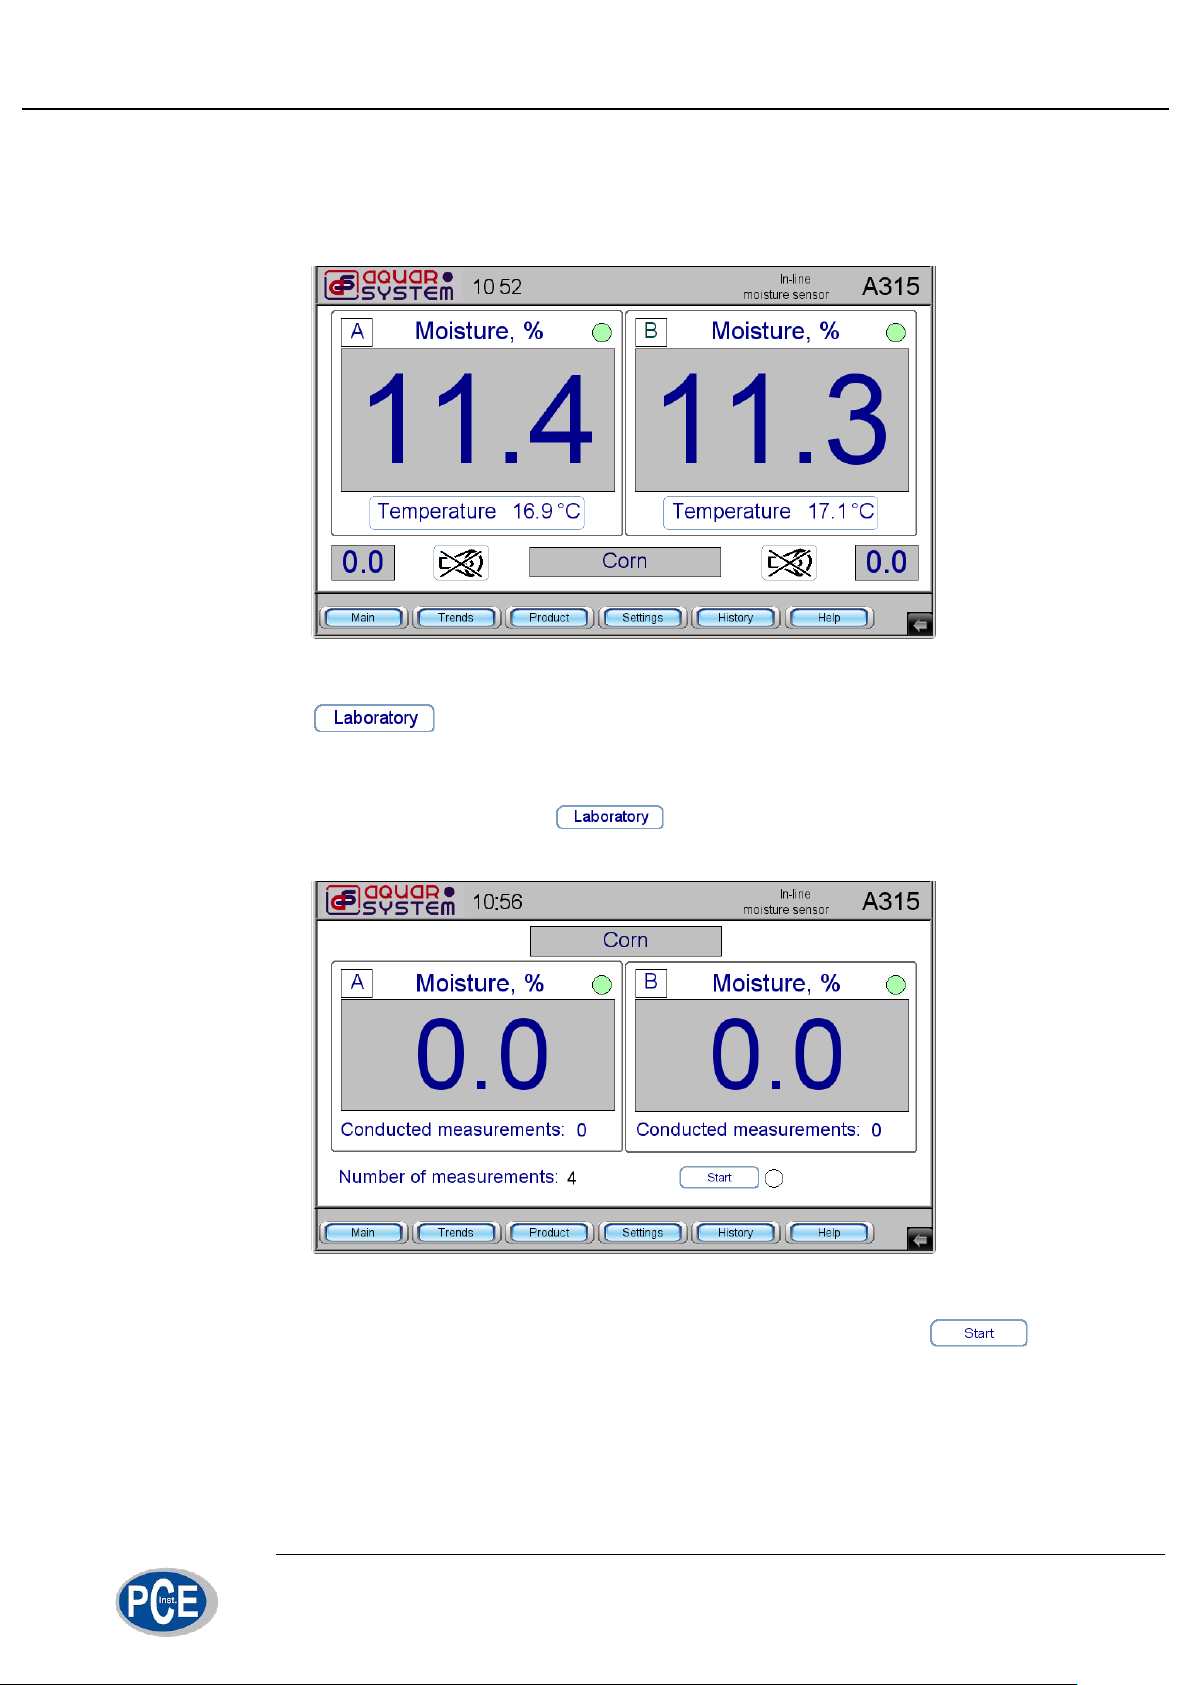
Special mode can be used in order to simulate flow measurement
process in the moisture control system (fig. 8). It allows obtaining an average moisture value for the same product based on the results of several single measurements.
After selection of the product press button to switch to “Laboratory” mode
(fig. 8).
fig 8. “Laboratory” mode
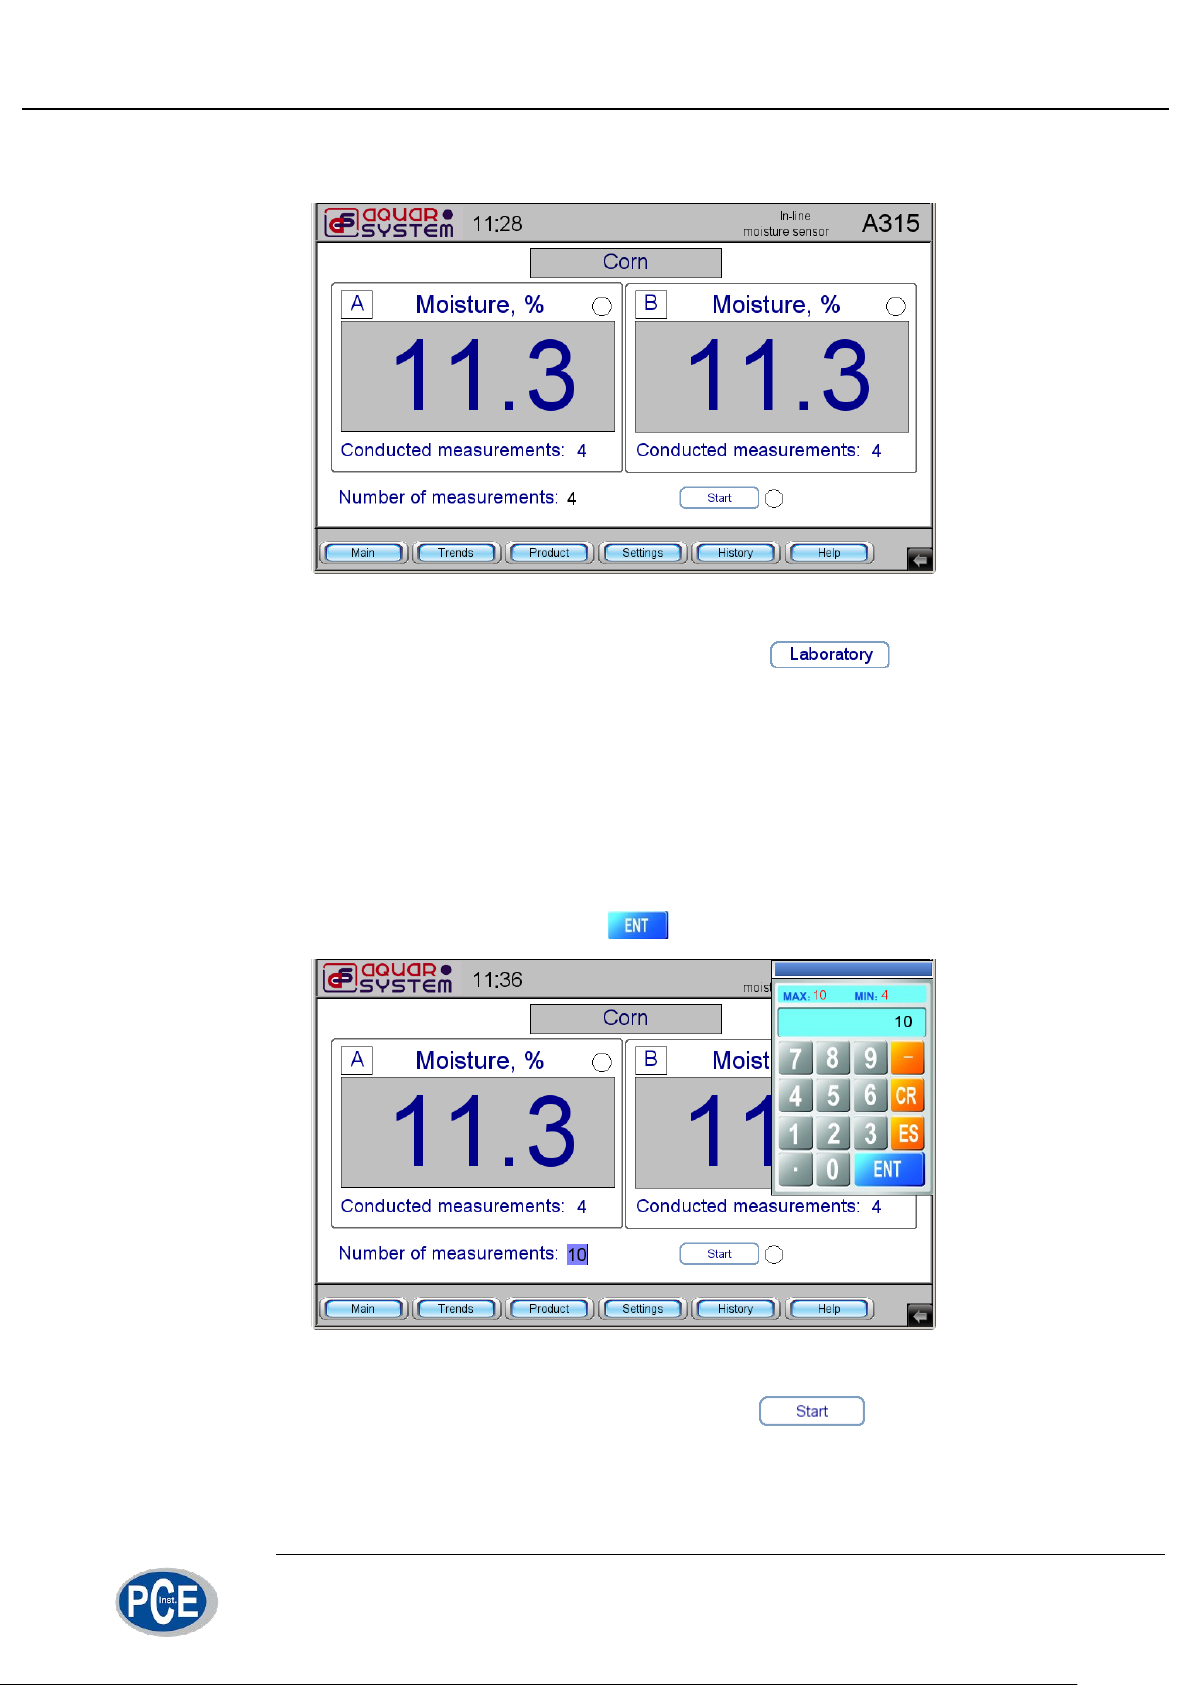
By default “Number of measurements” line should read 4. Press but-
ton and fill moisture sensor A with a portion of grain. Wait for sound signal and the
appearance of figure “1” in “Conducted measurements” line. Remove grain from the
sensor and then fill in the sensor with again to see figure “2” after the signal. Repeat
the procedure four times. After the four measurements “Moisture %” window would
11/29
Page 12
Working with control panel
display average of moisture content of the product based on four sample measure-
ments. After this the similar procedure can be performed for sensor B (fig. 9).
fig 9. Product moisture measured in “Laboratory” mode
In certain cases the number of measurements in mode should be
increased for correct measurements. This is especially important for wet grain (more
than 18% for grain and leguminous products and more than 13% for oilseeds) because wide dispersion of moisture and density of samples is usually observed. For
example in order to obtain correct measurement results for wet corn the number of
measurements should be increased to 10.
In order to change the number of measurements press on the digit following
“Number of measurements” line and enter a new number using the appeared numer-
ic pad (fig. 10), confirm input by pressing .
fig 10. Selecing number of measurements for “Laboratory” mode
After setting the number of measurements, press button and perform
10 fillings to get the correct moisture content value.
12/29
Page 13
Working with control panel
4.3. Trend view
Control panel provide an option to display trends of measured grain temperature
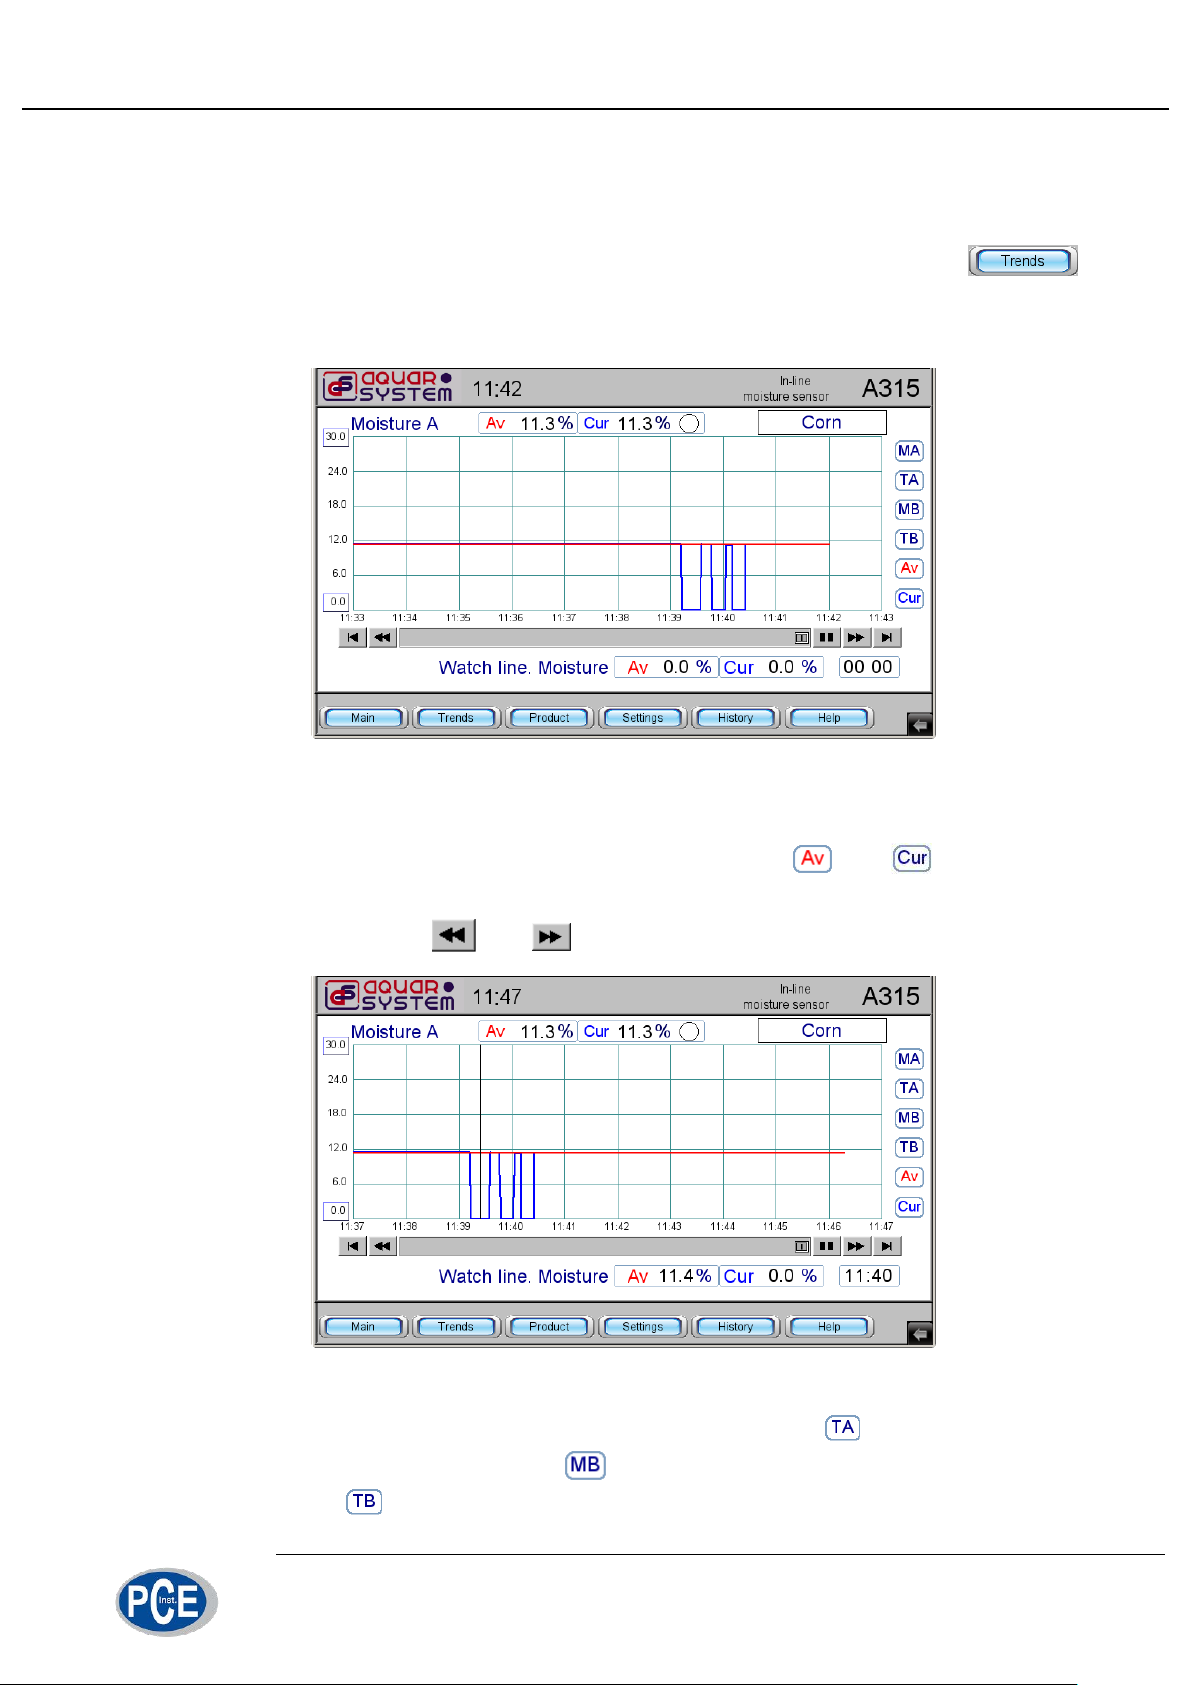
and moisture content for the time period since the sensor start up. Press
button to view trends. The screen will display the last 10 minutes trend of moisture
content for sensor A (fig. 11).
fig 11. Moisture content trend
The blue line shows the instantaneous (current) value of moisture, the red line
shows the time-averaged value. By pressing the buttons and you can turn
on and off the current and average value trends. To see trends for different time peri-
ods press arrow buttons and below the chart.
fig 12. Watch line
To view the trend of grain temperature in sensor A click , to view the trend of
moisture content in sensor B press , to view the trend of grain temperature in
sensor B press . To see the value of either moisture or temperature for each of
13/29
Page 14
Working with control panel
the sensors at a particular moment of time click on a trend section corresponding to
this moment and read the value in the "Watch line" line at the bottom of the screen
(fig. 12).
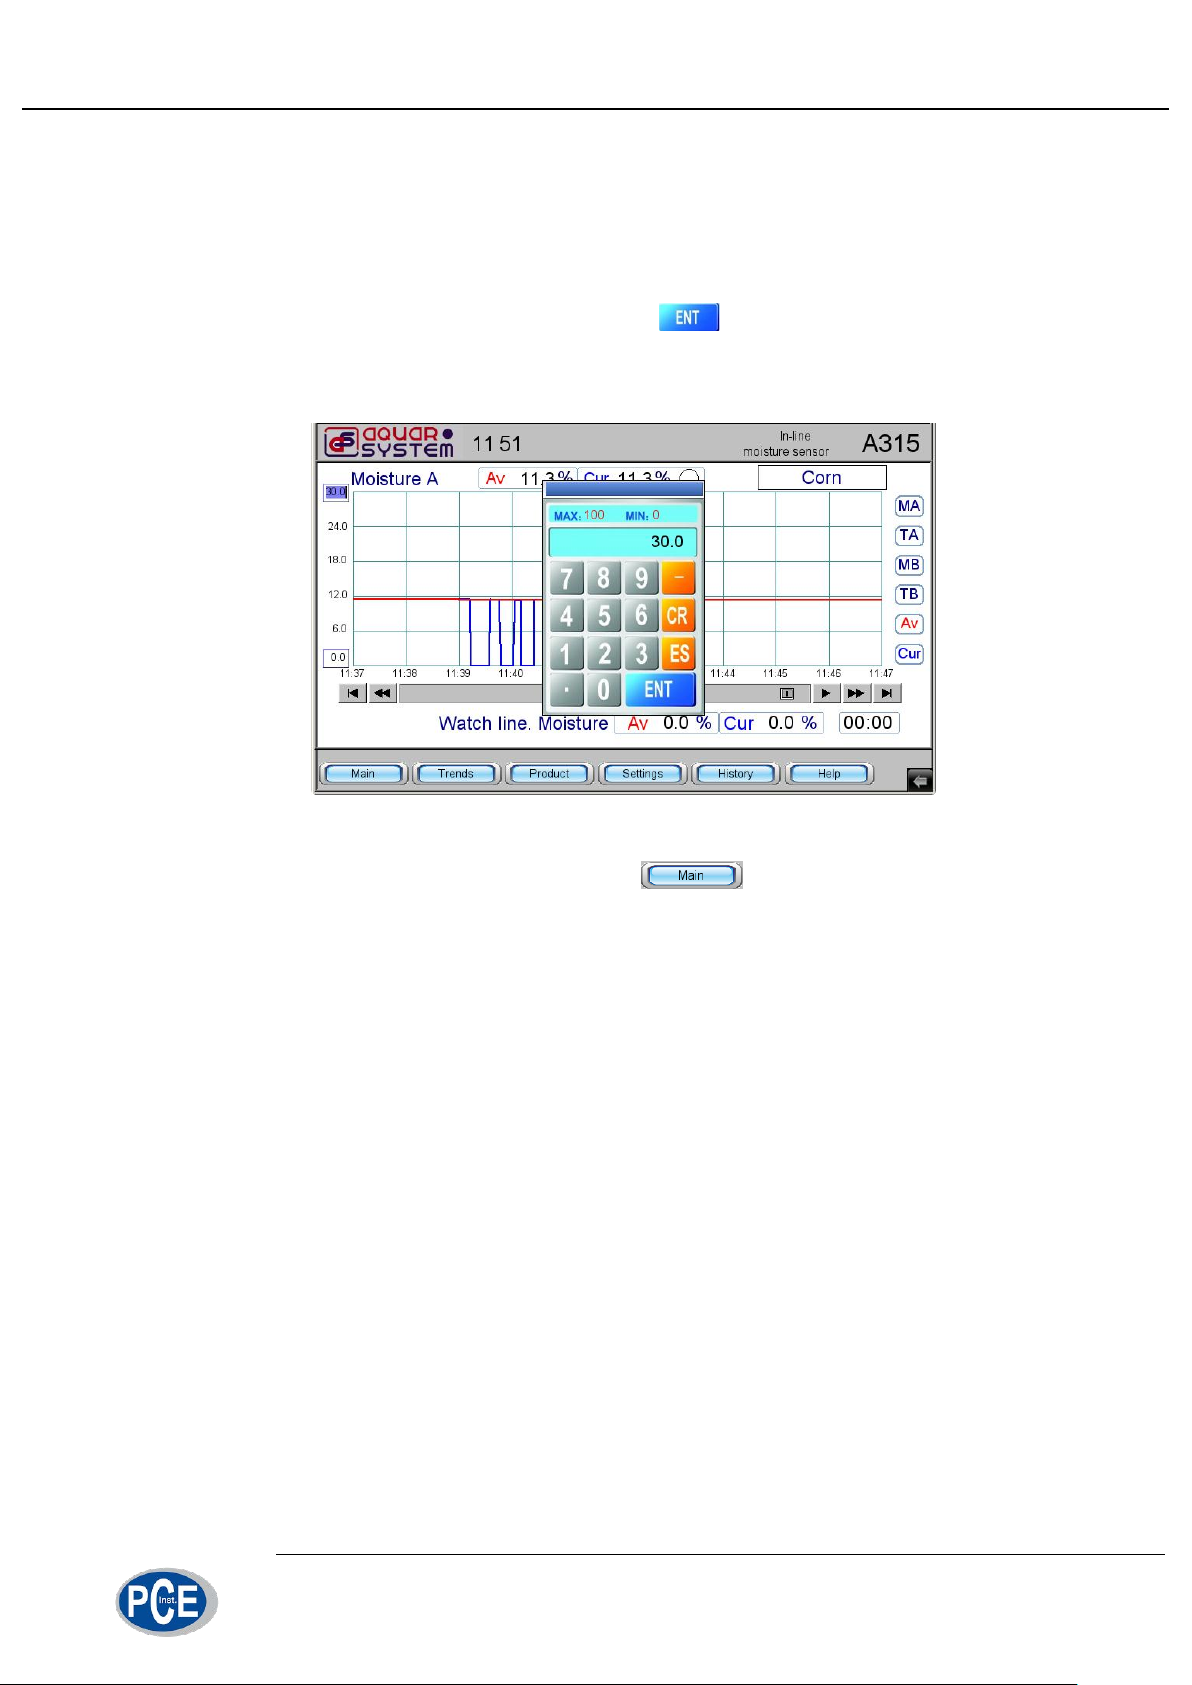
The scale of vertical axis can be changed. To change the upper limit press on
the limit value and enter a new value using numeric keypad. The limit can be
changed in increments of 5% (fig. 13). Press button on the numeric keypad to
complete the operation. Similarly you can change the lower limit value of the trend in
increments of 5% by pressing the lower limit of vertical axis.
fig 13. Changing vertical axis limits
“Trends” mode can be accessed from mode (fig. 4). Press the figure
of instantaneous value of moisture content or temperature for chosen sensor to
switch to “trends” mode.
14/29
Page 15
Working with control panel
4.4. Entering corrections and parameters
The system of online moisture control allows adjusting scaling parameers of current loop outputs and applying individual correction and averaging coefficients for
each sensor.
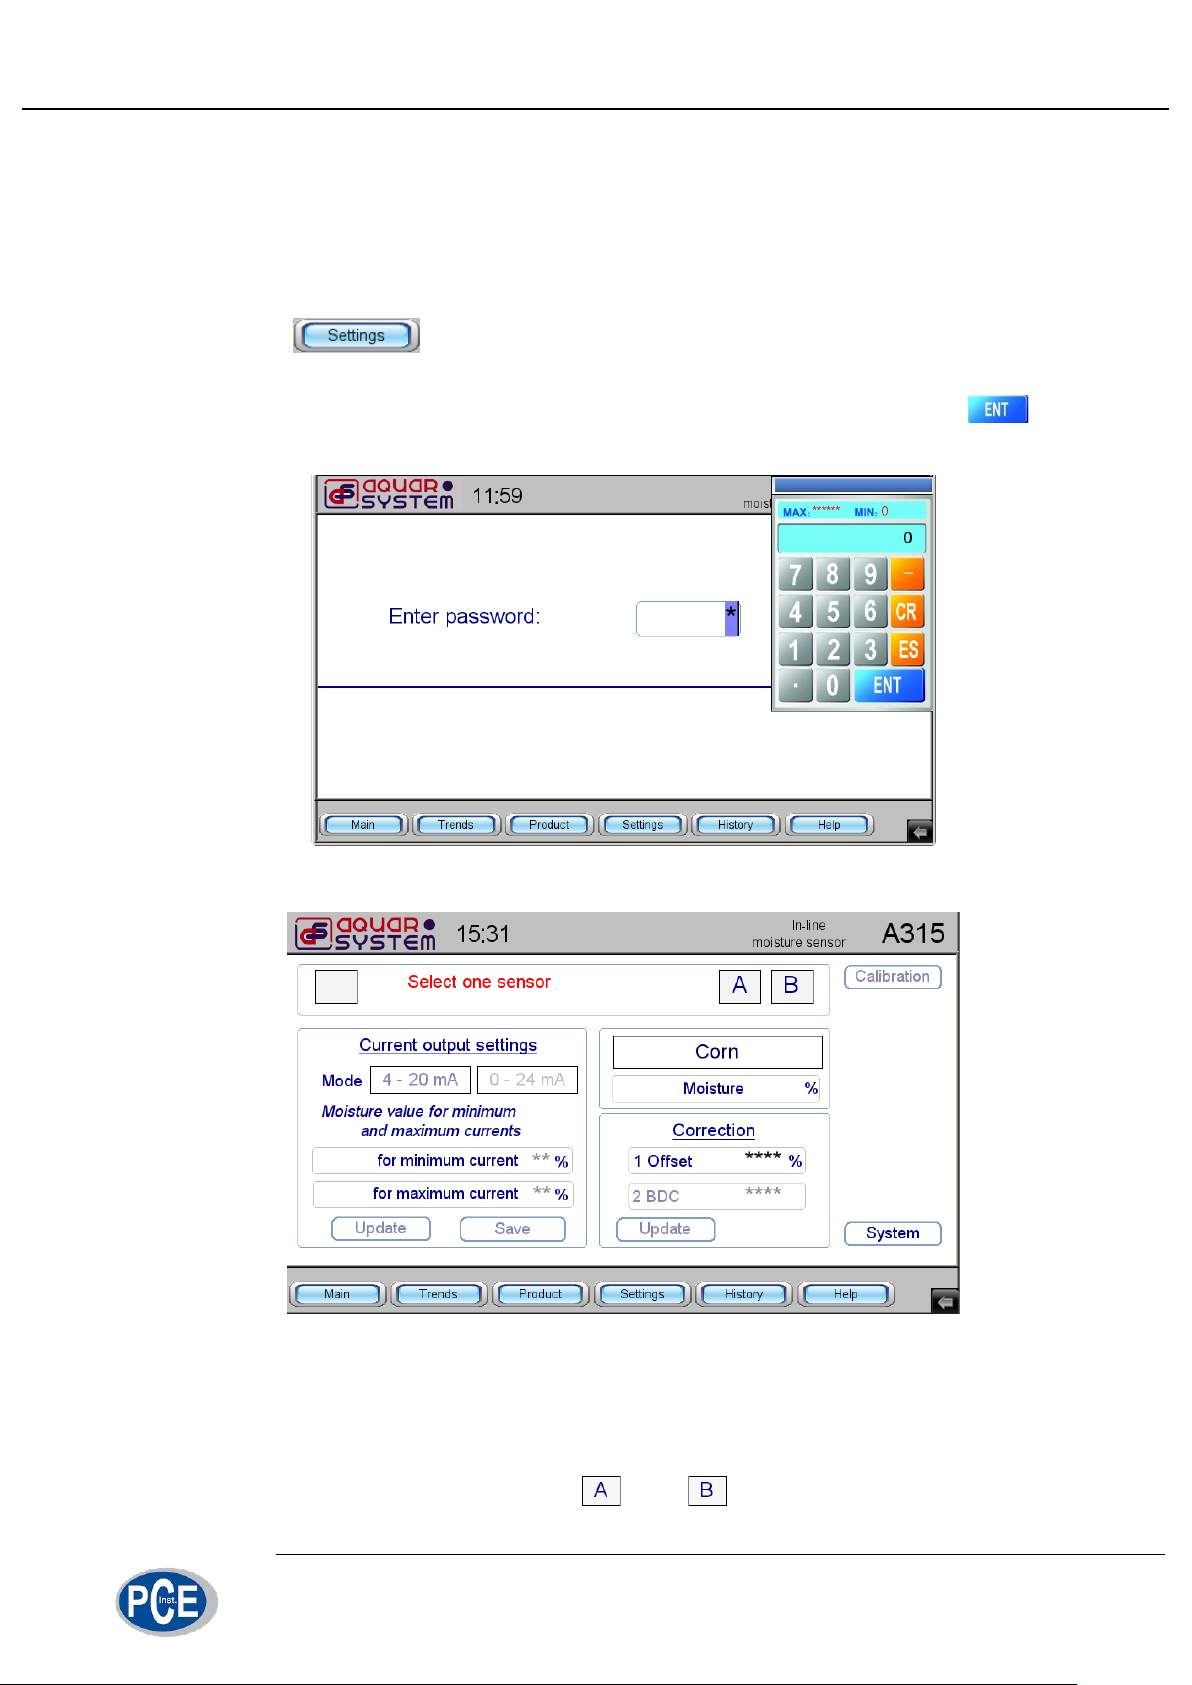
Press button to enter “Settings” menu. The display will show password enter screen. Press symbol * on the display to see keypad for entering pass-
word (fig. 14). Enter “315” as the password using the keyboard and press button. “Settings” menu is shown in fig. 15.
fig 14. Password screen
fig 15. “Settings” screen
Correction parameters can be selected for each sensor individually. If the system operates two sensors together or both of them are switched off than at the top of
the display the following warning text will appear: “Select one sensor”. In order to se-
lect the required sensor press buttons and located in the upper right corner
15/29
Page 16
Working with control panel
of the screen. The selected sensor is indicated by the corresponding letter in the left
top corner of the panel (fig. 16).
fig 16. Selecting sensor А
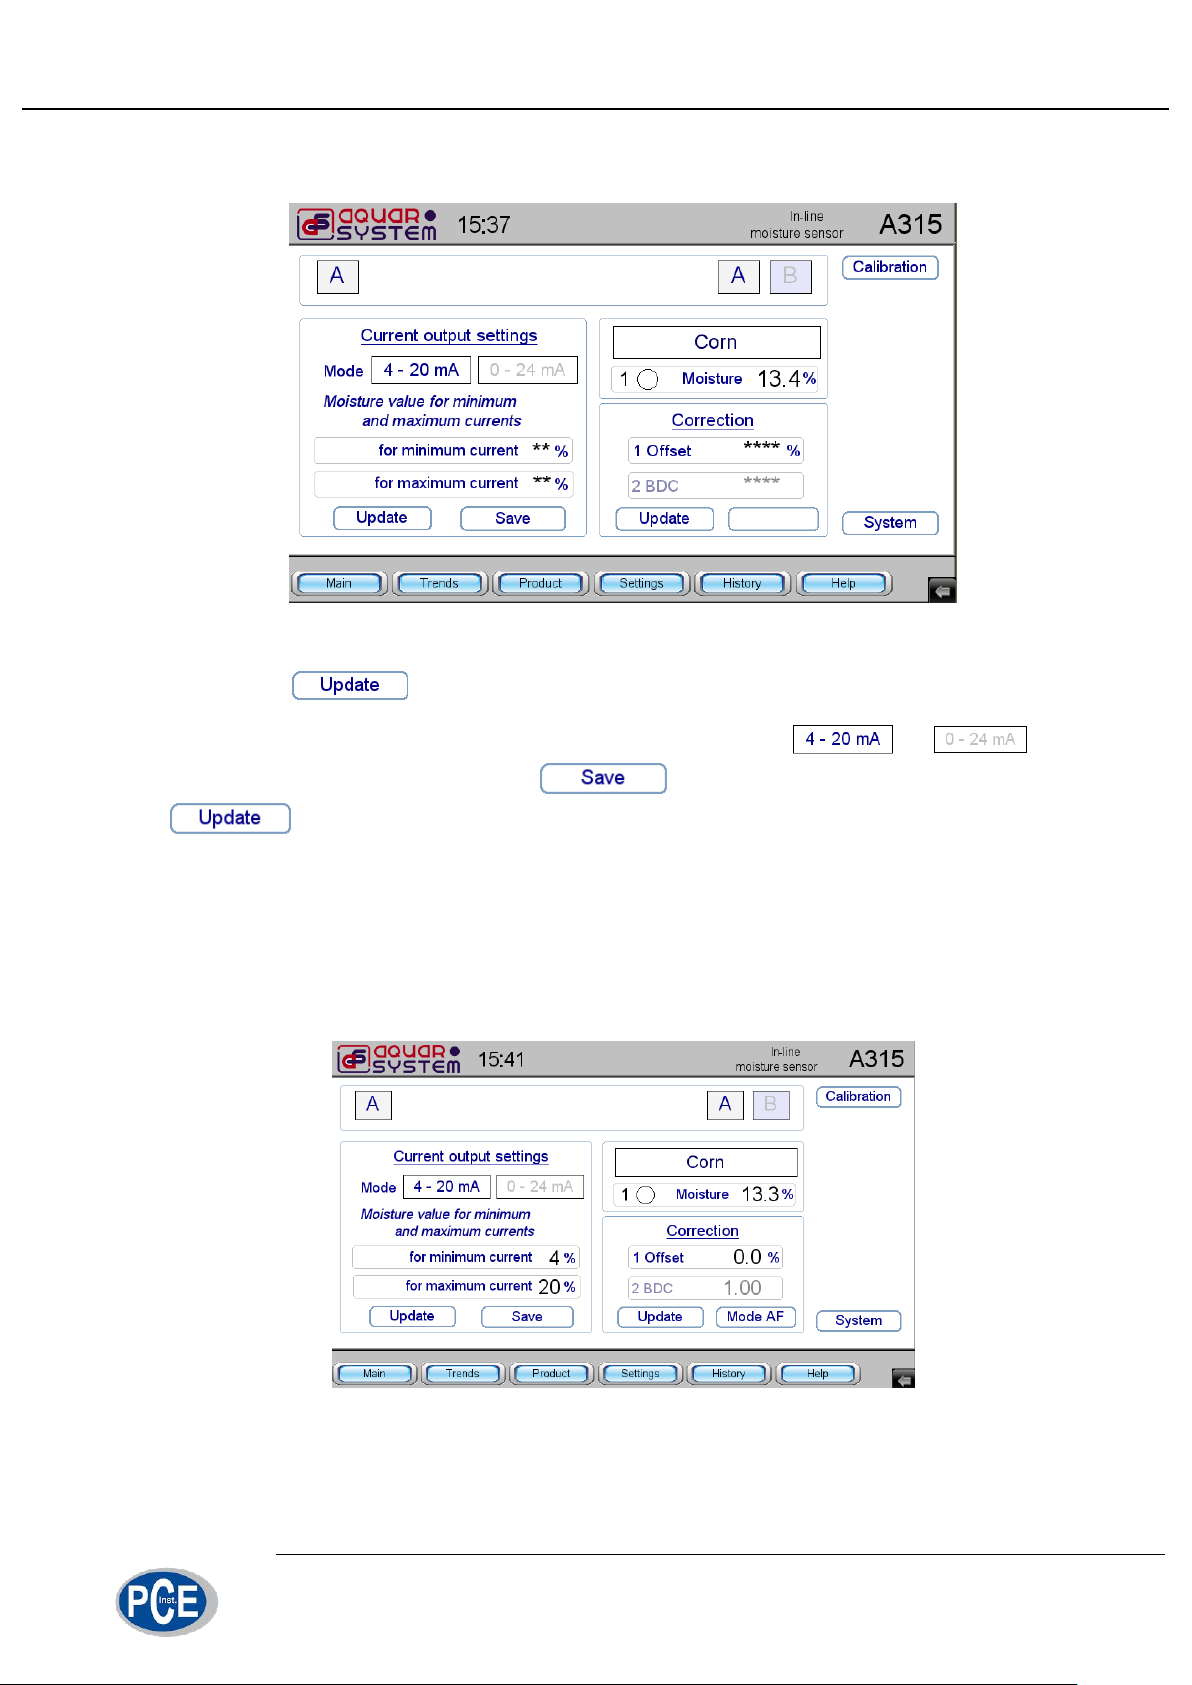
Press button to read parameters from sensor A (fig. 17).
To select mode for current loop output press button or and
confirm selection by pressing . Check the settings by pressing
.
Current loop output is adjusted by setting moisture values for minimum and
maximum currents. Fig. 17 shows that 4-20 mA mode is selected - the minimum current value 4 mA corresponds to 4% moisture content and the maximum current value
20 mA corresponds to moisture of 20%. That means that if moisture of 12.9% is indi-
cated on your sensor A than the current output signal shall be 12.9 mA
fig 17. Current output settings
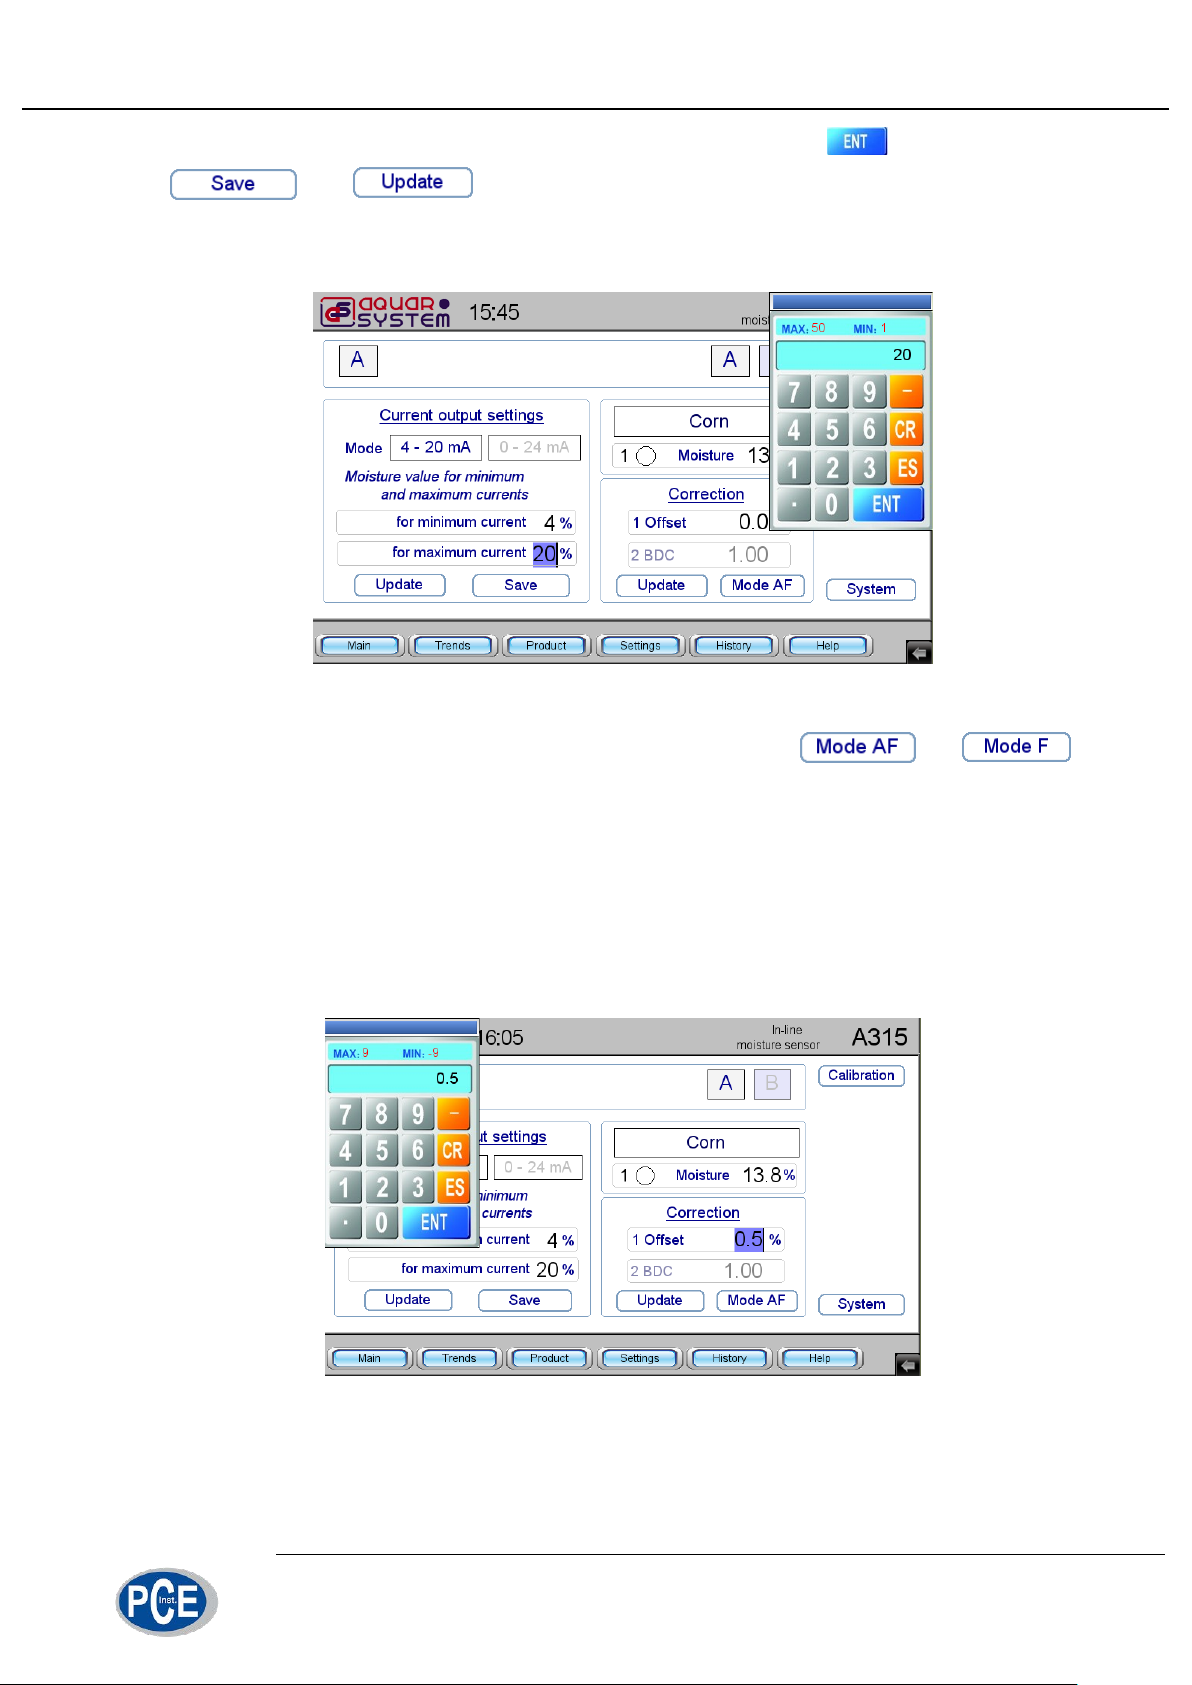
Moisture content values for minimum and maximum currents are set in the following manner. To change the value for the maximum current press on the figure in
16/29
Page 17
Working with control panel
“for minimum current” line. Enter new value and press (fig. 18). Press
and in the “Current output settings” to apply and check new
settings. The moisture content value corresponding to the minimum current can be
changed in similar way.
fig 18. Adjusting current output settings
A315 sensor can perform measurements in mode or .
Moisture calculation in “Mode AF” is performed using two algorithms. Calculation algorithm is selected automatically by the sensor depending on grain moisture content
and temperature. Selected method is indicated with number “1” or “2” in “Moisture”
line. Both algorithms allow to apply correction coefficients.
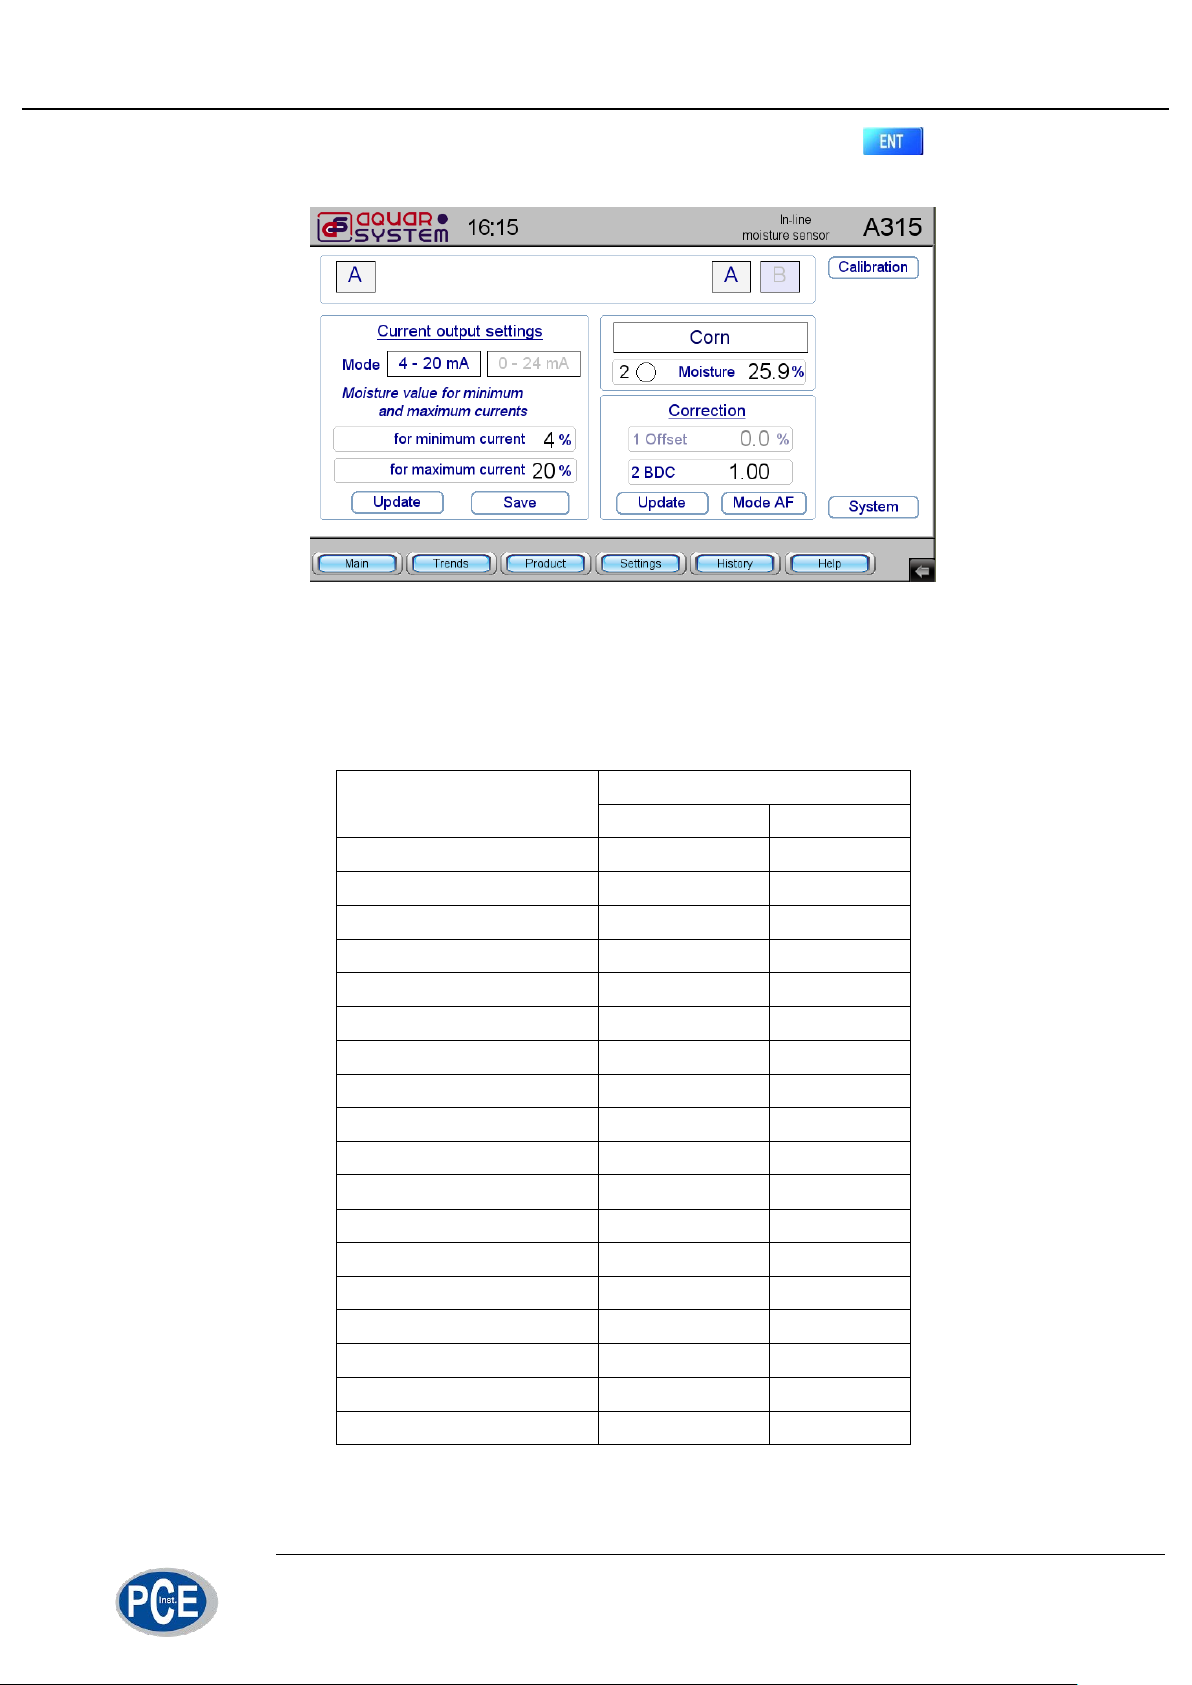
Fig. 17 shows figure “1” in “Moisture” line with measured moisture content value
reading 13.3 %. It means that moisture calculation is performed using algorithm “1”
and only correction coefficient “1 Offset” is valid for this algorithm.
fig 19. Entering correction for algorithm 1
If for grain sample with known moisture content, for example, 13.8% the sensor
reads 13.3 %, then the correction of 0.5% must be applied. To input correction press
17/29
Page 18
Working with control panel
PRODUCT
Bulk density (test weight)
kg/l
Lb/bu
Rape
0.646
50.19
Barley
0.702
52.54
Wheat
0.789
61.32
Oats
0.560
43.51
Corn
0.726
56.40
Rye
0.713
55.39
Lupine
0.810
62.90
Triticale
0.711
55.24
Buckwheat
0.608
47.23
Millet
0.726
56.40
Sunflower
0.415
32.24
Peas
0.810
62.90
Soybean
0.717
55.70
Sorghum
0.454
35.27
Rice
0.514
39.93
Jojoba
0.574
44.59
Seaweed
0.480
37.29
Coffee
0.685
53.22
“1 Offset - 0.0%” and enter “0.5%” confirming input by pressing . After this the
“Moisture” line should read 13.8% (fig. 19).
fig 20. Algorithm 2
Algorithm 2 uses Bulk Density Coefficient (BDC) (fig. 20). Sensor A315 is calibrated for different products with bulk densities (test weight) as per Table 1.
Table 1.
18/29
Page 19
Working with control panel
When it is possible to determine bulk density of the custom product then correction coefficient “2 BDC” may be tuned for better measurement accuracy. For example, the measured bulk density of corn passing through sensor is 0.810 kg/l. According to Table 1, bulk density of corn for which the moisture sensor was calibrated is
0.726 kg/l. Then the value of BDC correction can be calculated:
«BDC» = 0.726/0.810 = 0.896
Changing the value of "BDC" is carried out by analogy with the changing of the
"Offset" correction. "BDC" can be further adjusted manually to achieve better agreement of sensor’s readings with laboratory result within ±1.0% error. Increase of
"BDC” value leads to increase in moisture readings and vice versa. Recommended
step when changing “BDC” value is 0.01-0.02.
Moisture correction shall be performed only when measurement channel of the
sensor is filled with grain to know which correction shall be entered - “1 Offset” or “2
BDC”.
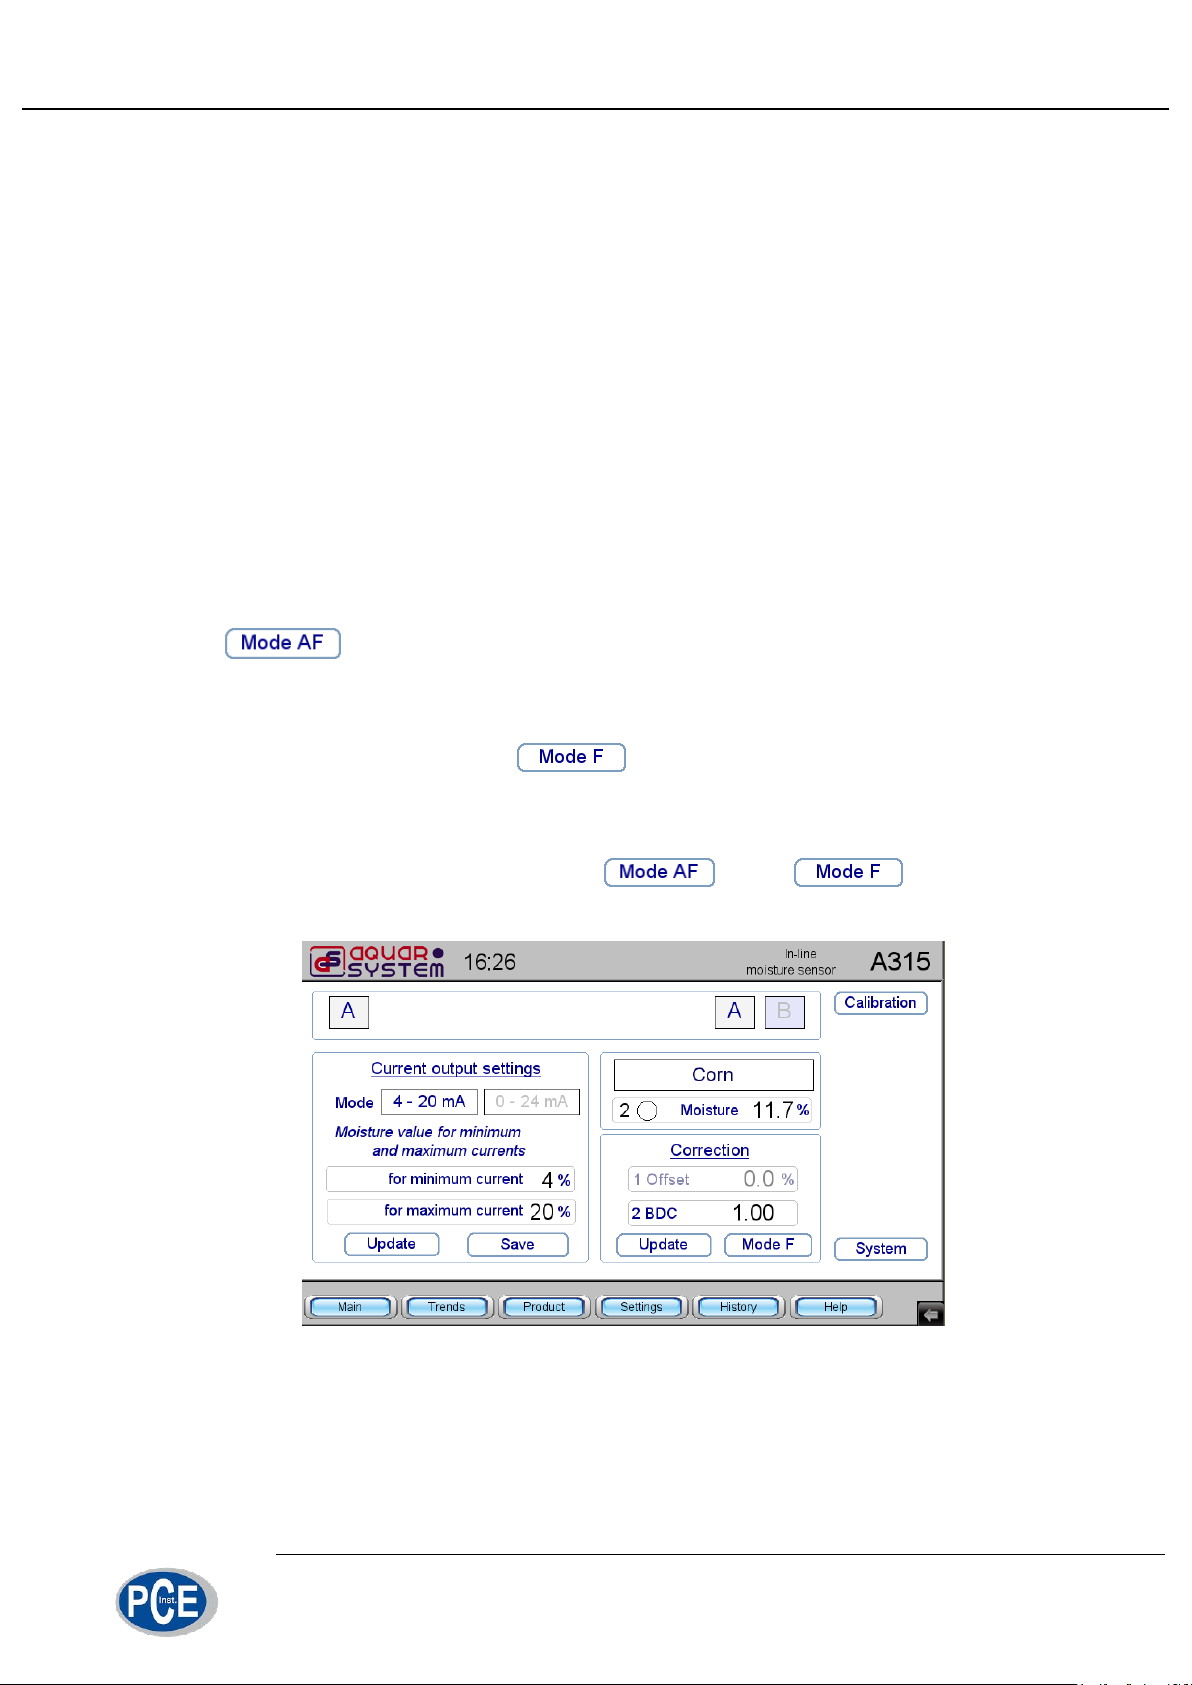
is more preferable because it provides the most accurate measure-
ment of moisture at the grain dryer outlet for products with temperature up to 40˚С.
When grain temperature at dryer outlet is higher and moisture contents if higher
at the inlet it’s preferable to use , however this increases measurement error. The choice of specific measurement mode must be made according to on-site
conditions and the results of laboratory measurements.
To change the mode press button . Than will appear that
confirms mode changing (fig. 21).
fig 21. Changing moisture measurement mode
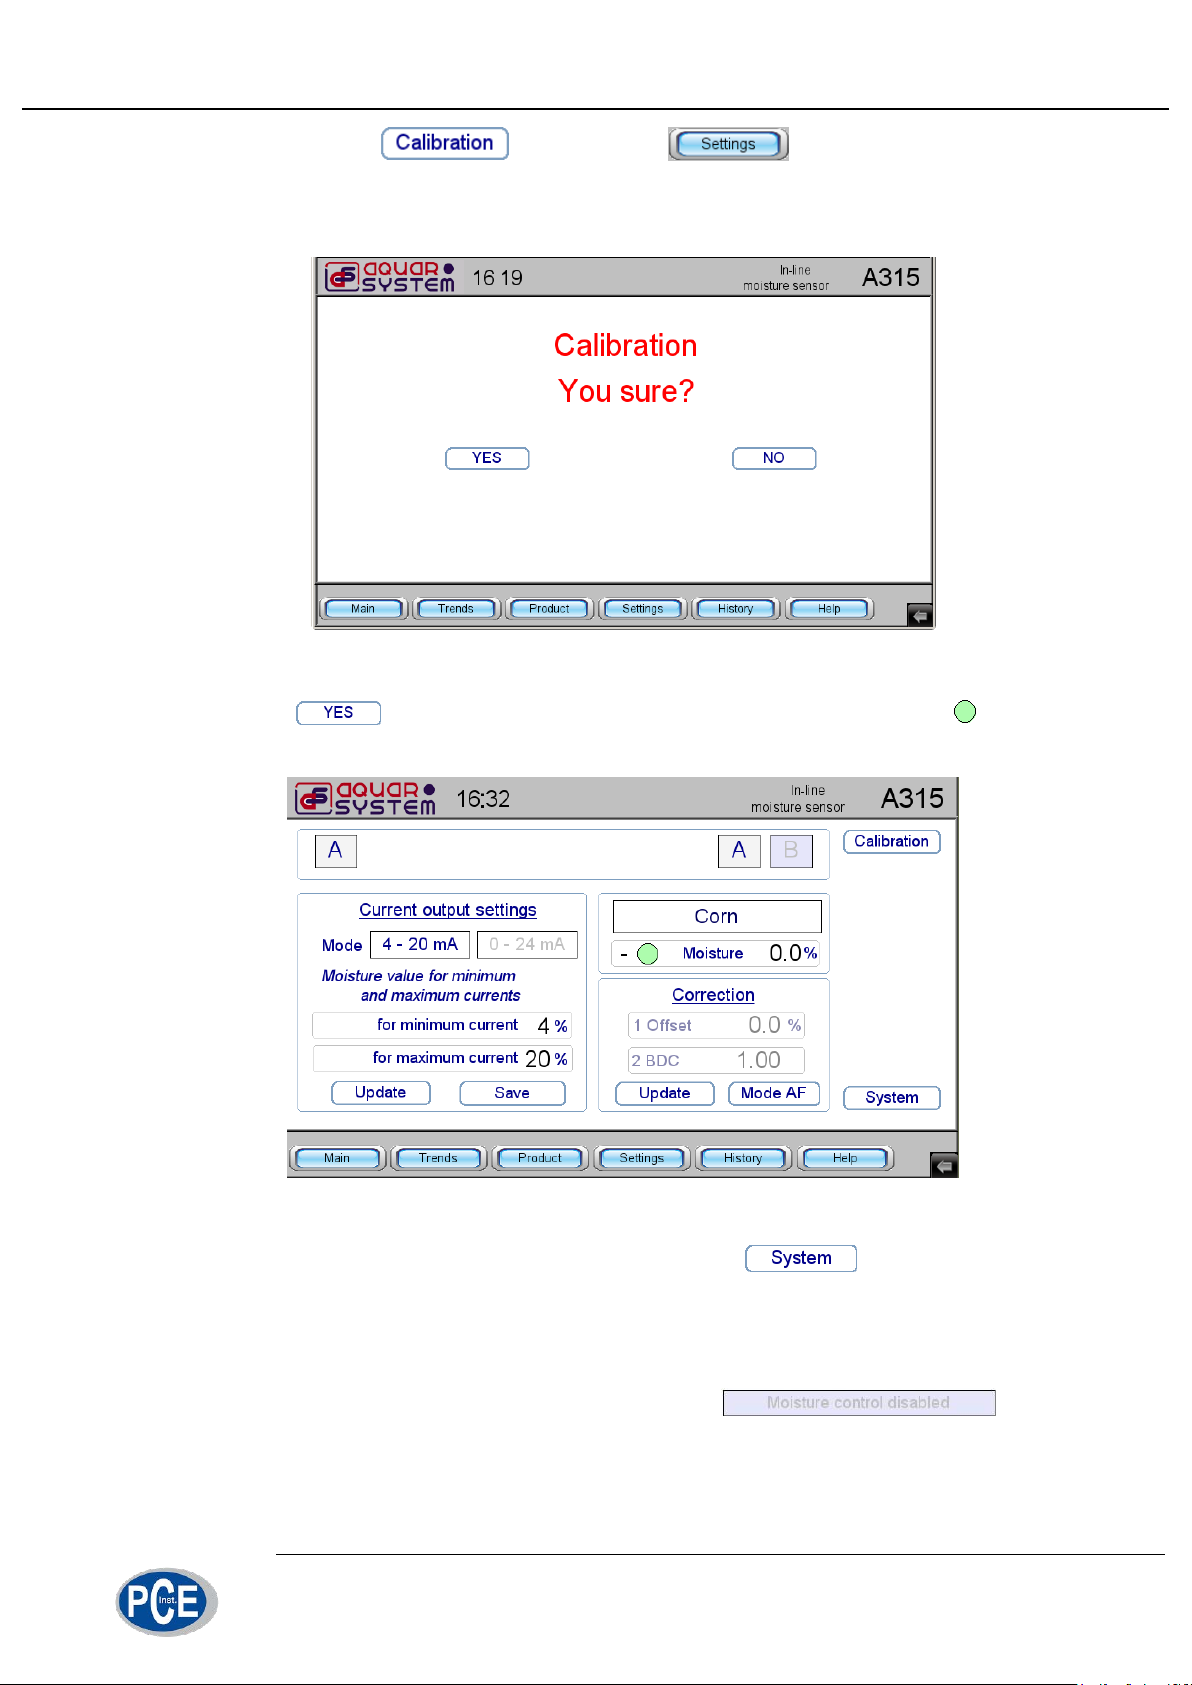
When A315 sensor shows non-zero moisture content value with empty measurement channel or green light indicating the readiness for measurement is off, that
means the sensor requires zero calibration. To perform calibration empty the meas-
19/29
Page 20
Working with control panel
urement and press button on the screen. Calibration screen
will appear (fig. 22).
fig 22. Calibration
Press and after the calibration the screen should show “– Moisture
0.0%” (fig. 23). Calibration is finished and the sensor is ready for measurements.
fig 23. “Settings” screen after the calibration
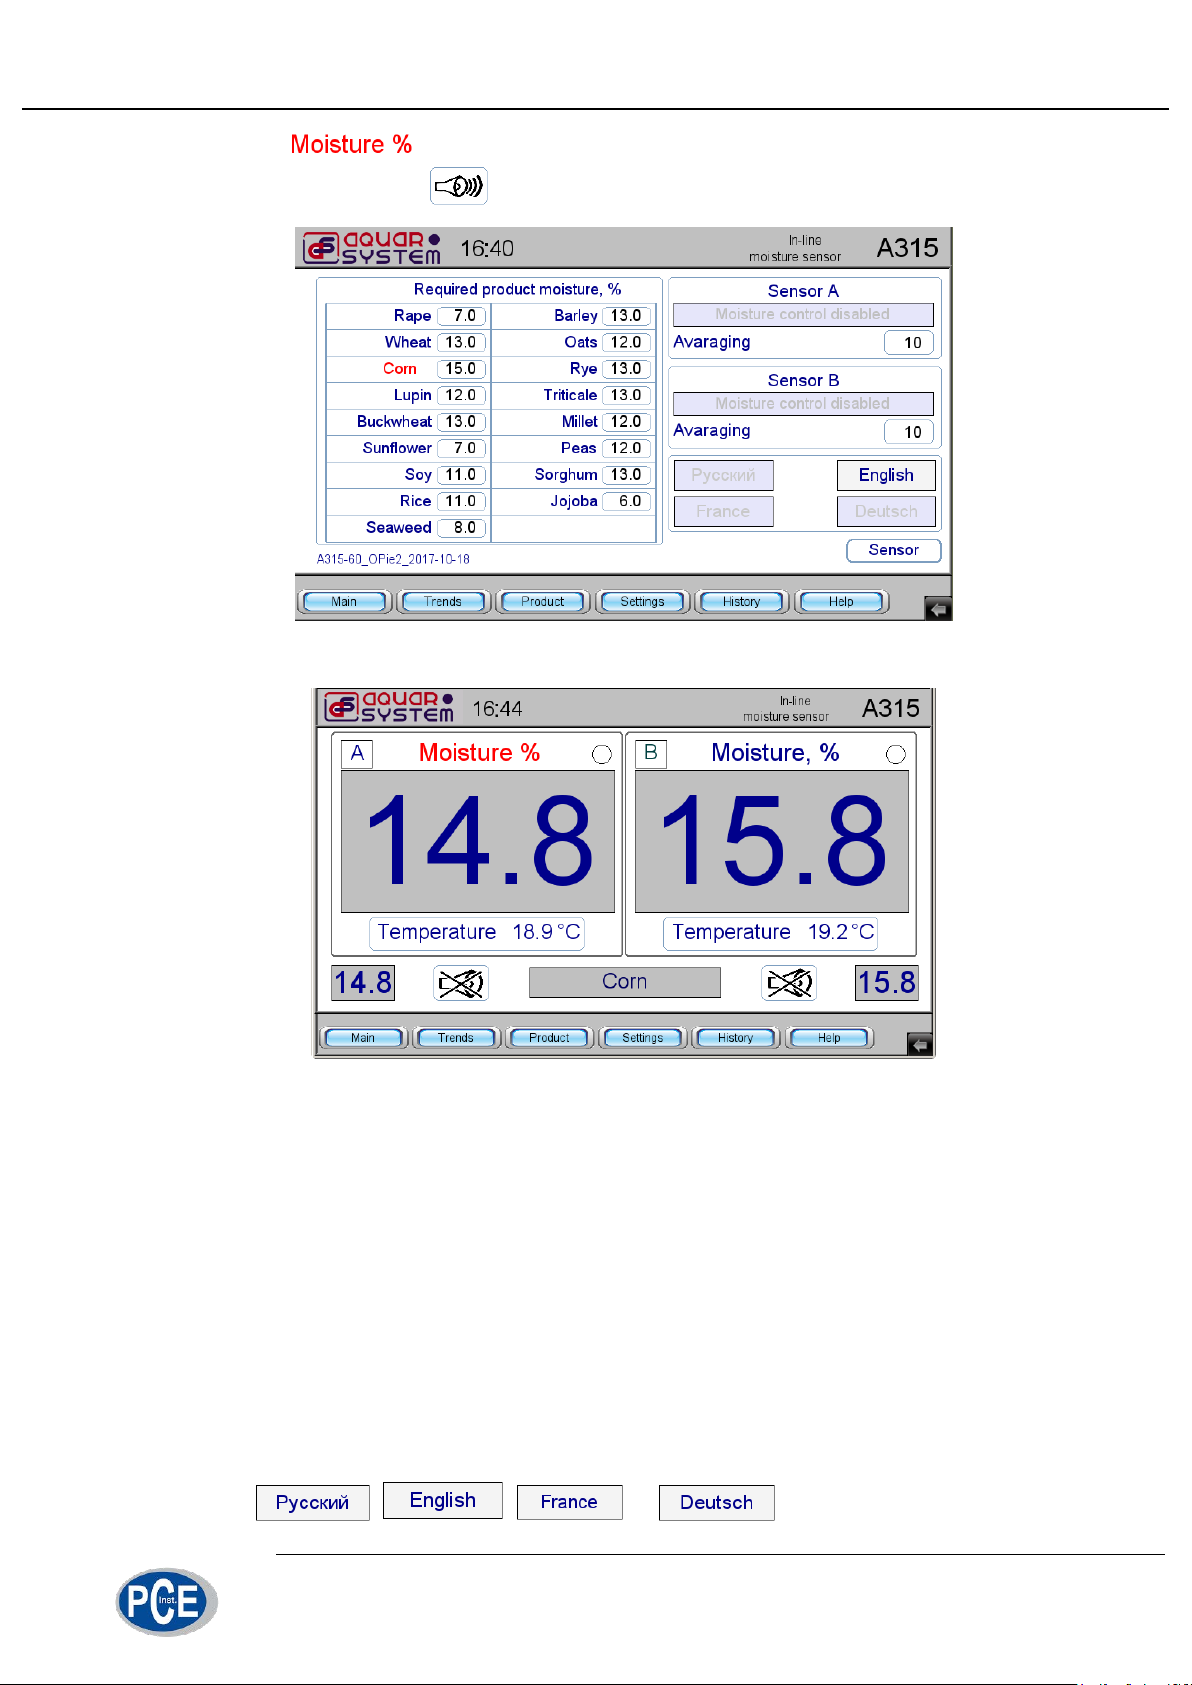
To access service functions menu (fig. 24) press button.
The left area of the screen displays the table of target moisture levels for drying
process for each product. The signal is sent to operator when the target value of
moisture content for selected product is achieved. Moisture content control mode can
be enabled for each sensor individually by pressing button.
For example, the target moisture content for corn is set at 15% (fig. 24). Sound
alarm will be triggered when measured moisture content will become lower than the
20/29
Page 21
Working with control panel
target and line will turn red and start flashing (fig. 25). Sound alarm can
be disabled by pressing button.
fig 24. «System» screen
fig 25. Moisture level alarm
Sliding window averaging may be used for averaging of moisture content
measurement results. Window size can be changed from 1 to 200 samples. With a
sampling speed of 1 sample per second this equals to 1...200 seconds.
Specific value of averaging parameter is chosen experimentally with regard to
drying dynamics. To set window size refer to “Averaging” line in the upper-right area
of the screen.
Setting of target moisture and averaging parameter is carried by analogy with
setting of other parameters as described above.
Four interface languages are available: Russian, English, French and German.
To select your language press the corresponding button in the lower-right area of the
screen: , , or .
21/29
Page 22
Working with control panel
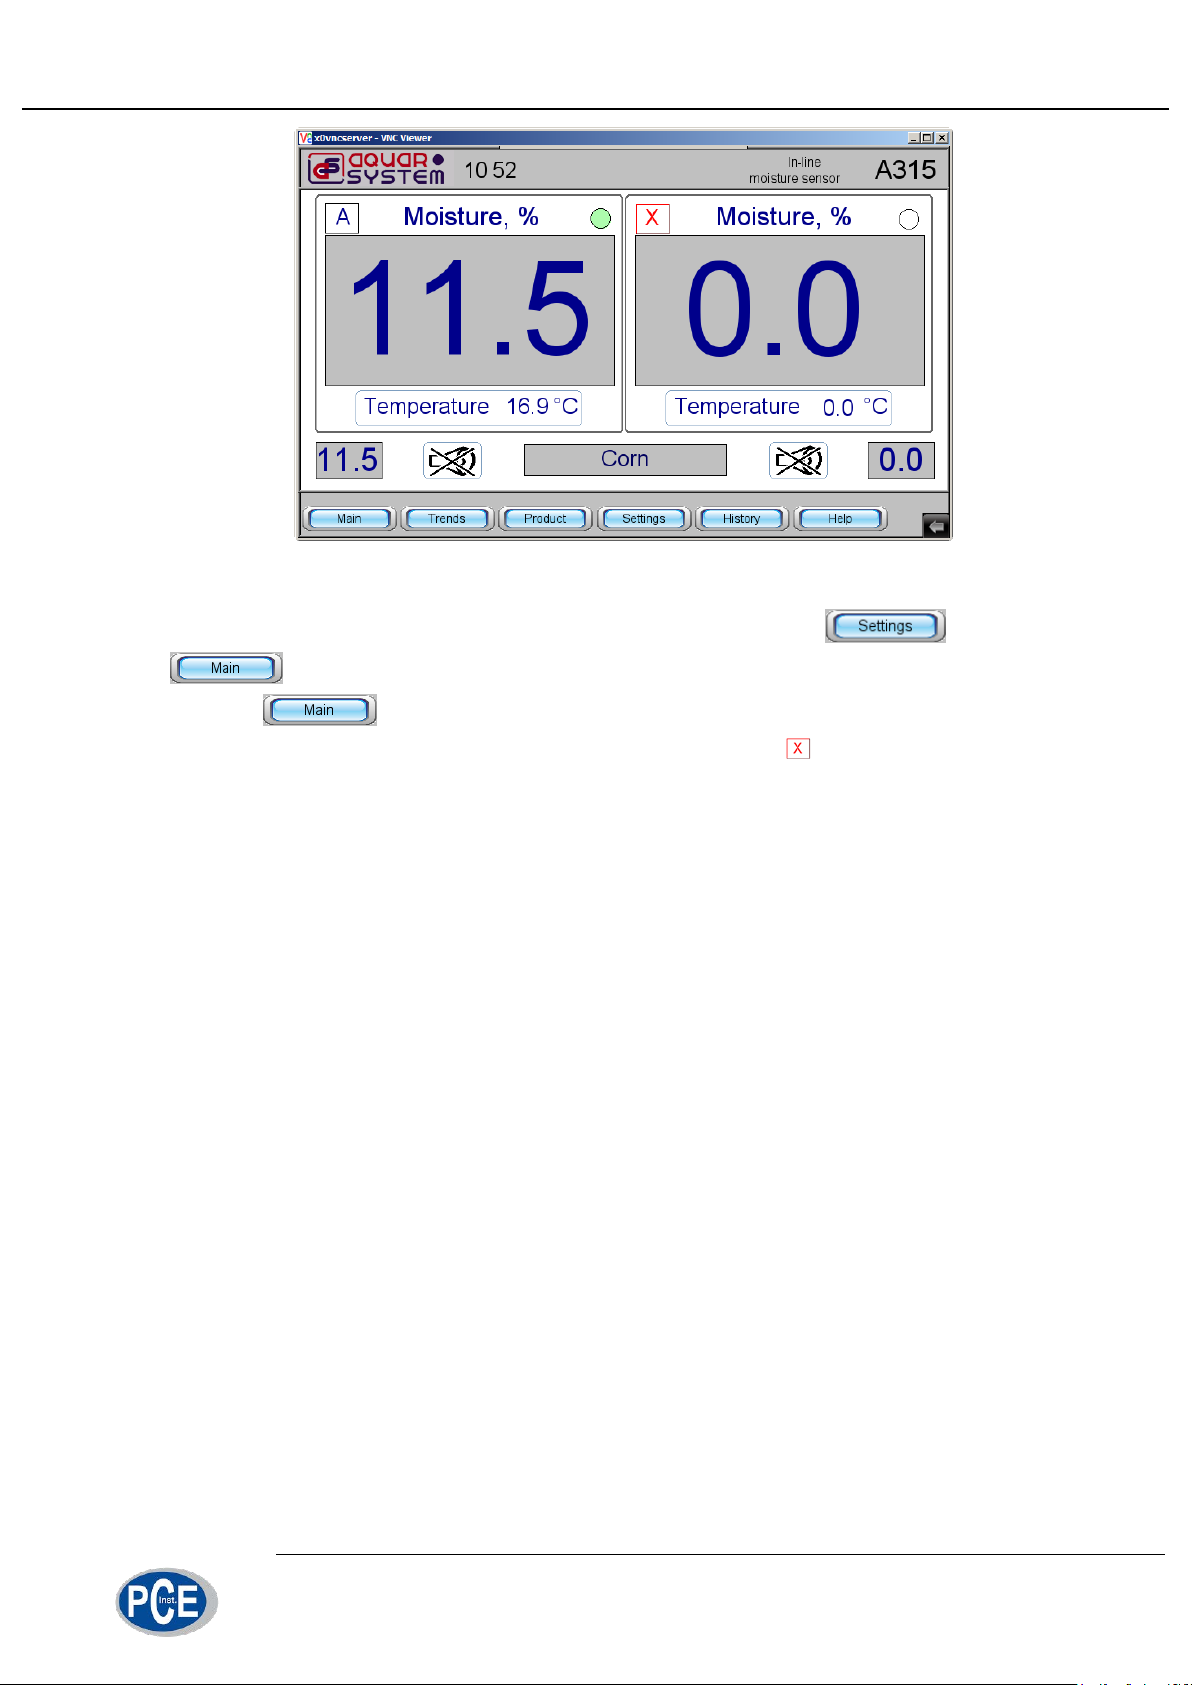
fig 26. Turning off sensors
Selection of sensor А or В can be performed not only in mode but in
mode (fig. 4) as well. Pressing the letter corresponding to the sensor ad-
dress in mode will turn the sensor off (fig. 26). Moisture and temperature
values will read zero. To switch the sensor back on press button.
22/29
Page 23
Working with control panel
4.5. Viewing archive data
Control panel stores data archive for the whole period of grain dryer operation.
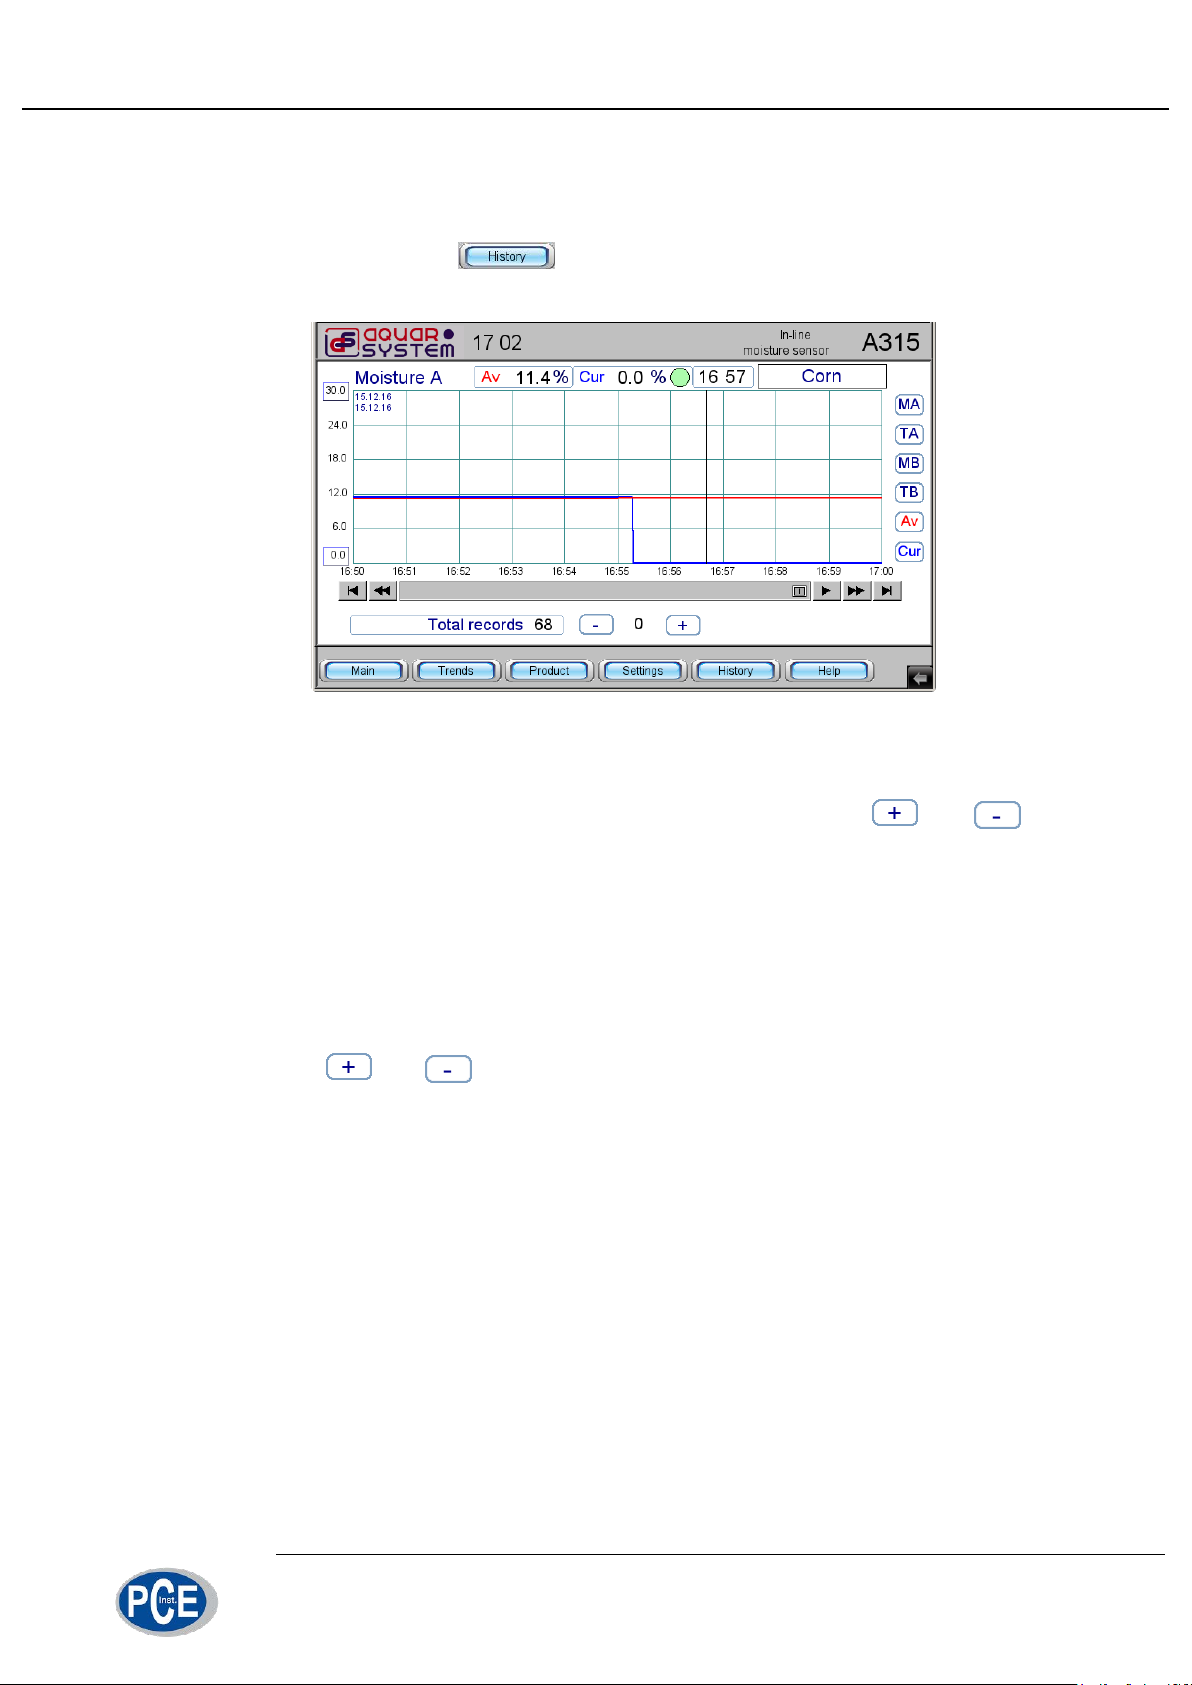
To view the archive, press button, and the panel will display image of moisture content trend over the past day (fig. 27).
fig 27. “History” mode
Navigation and operation in “History” mode is the same as in “Trends” mode
(see section 4.3). To view history data for the different day press and . The
date corresponding to displayed information is shown the upper left corner of the
chart.
To get the value of moisture or temperature for each of the sensors at a particular moment of time click on a trend section corresponding to this moment and read
the values in the line above the chart.
Specific number of history record can be entered by pressing of a number be-
tween buttons and .
23/29
Page 24
Working with control panel
4.6. Setting time and date
To set time and date press button in the bottom right corner of the display.
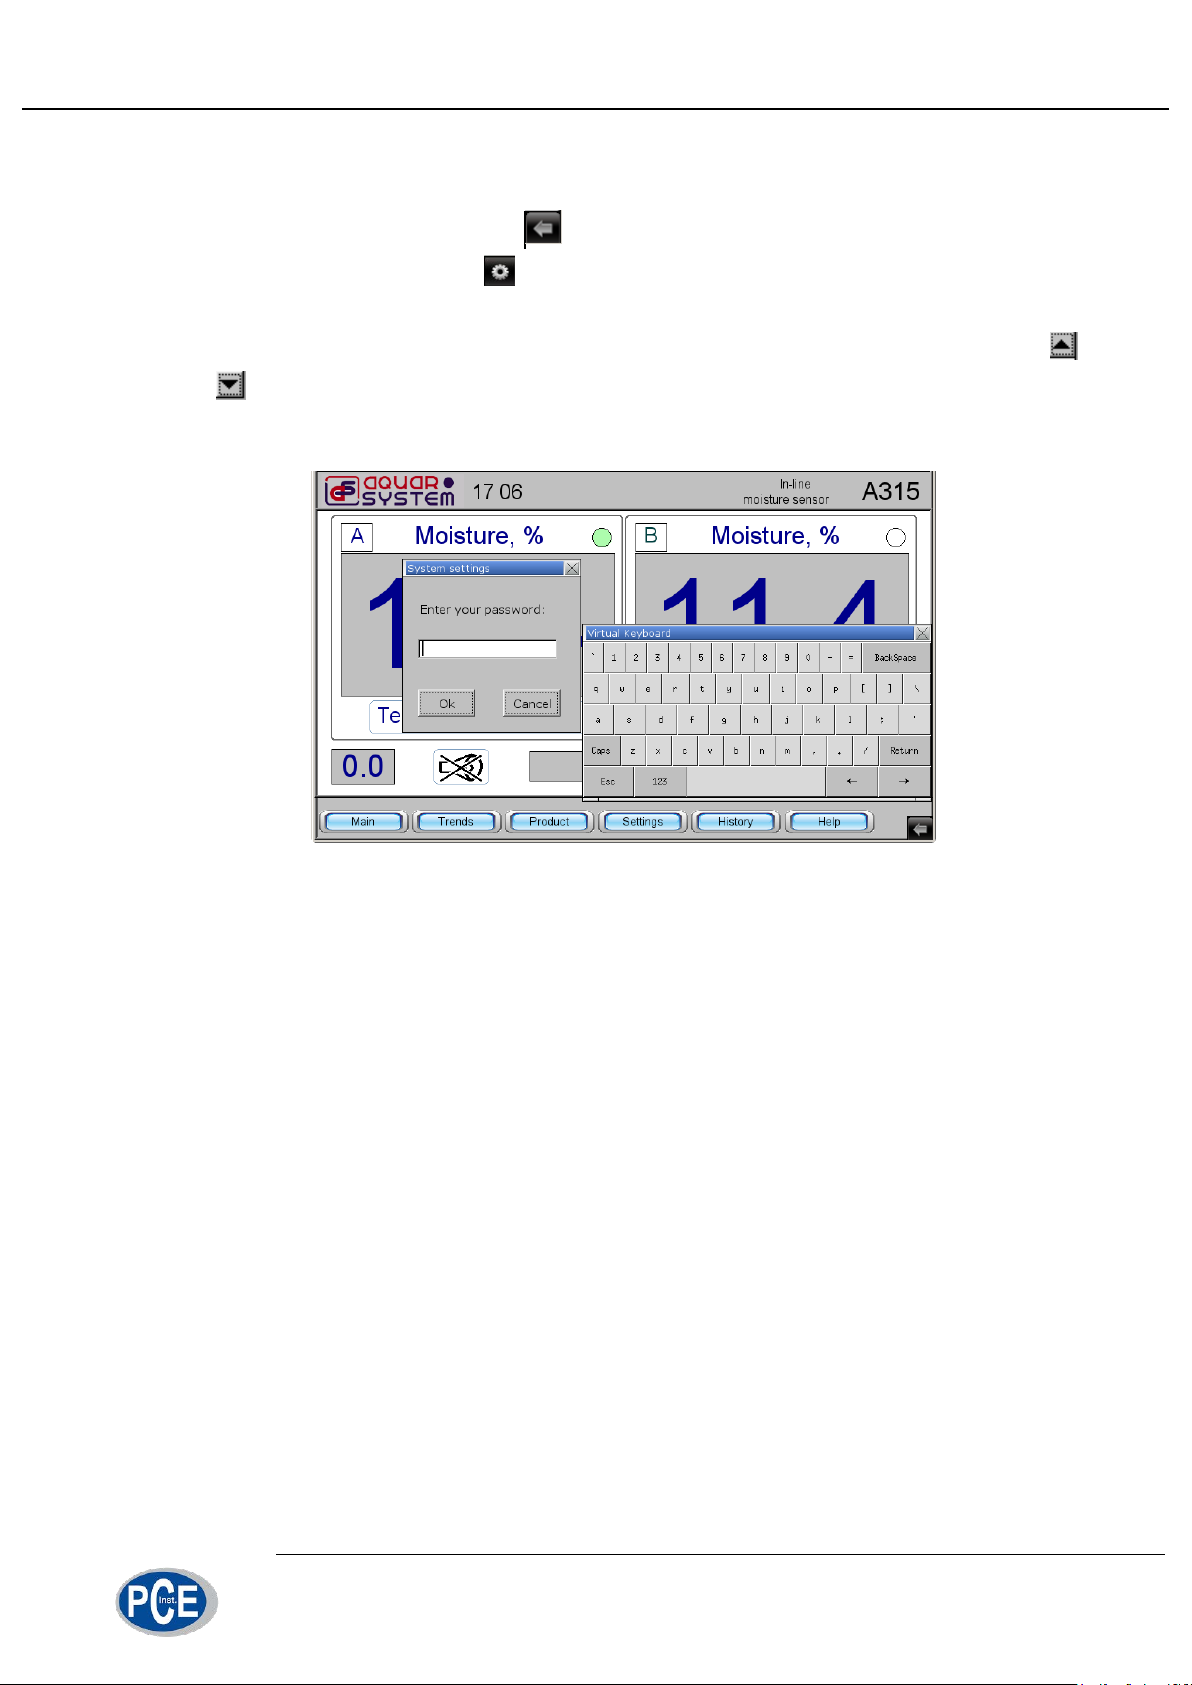
In the appeared menu press button. Password window and keyboard will appear
(fig. 28). Input “111111” (six times “one”) as the password. Press “Time/Date” button
to enter time and date settings mode and set correct time and date with buttons
and . Confirm time and date settings by pressing “ОК”.
Control panel must be switched off and of after this operation.
fig 28. Enter password to access control panel system settings
24/29
Page 25
Installation
5. Installation
For correct operation and measurement complete filling of sensor’s measuring
channel with grain must be ensured.
Depending on the design of grain dryer sensors can be installed different ways.
Several methods are described in this manual.
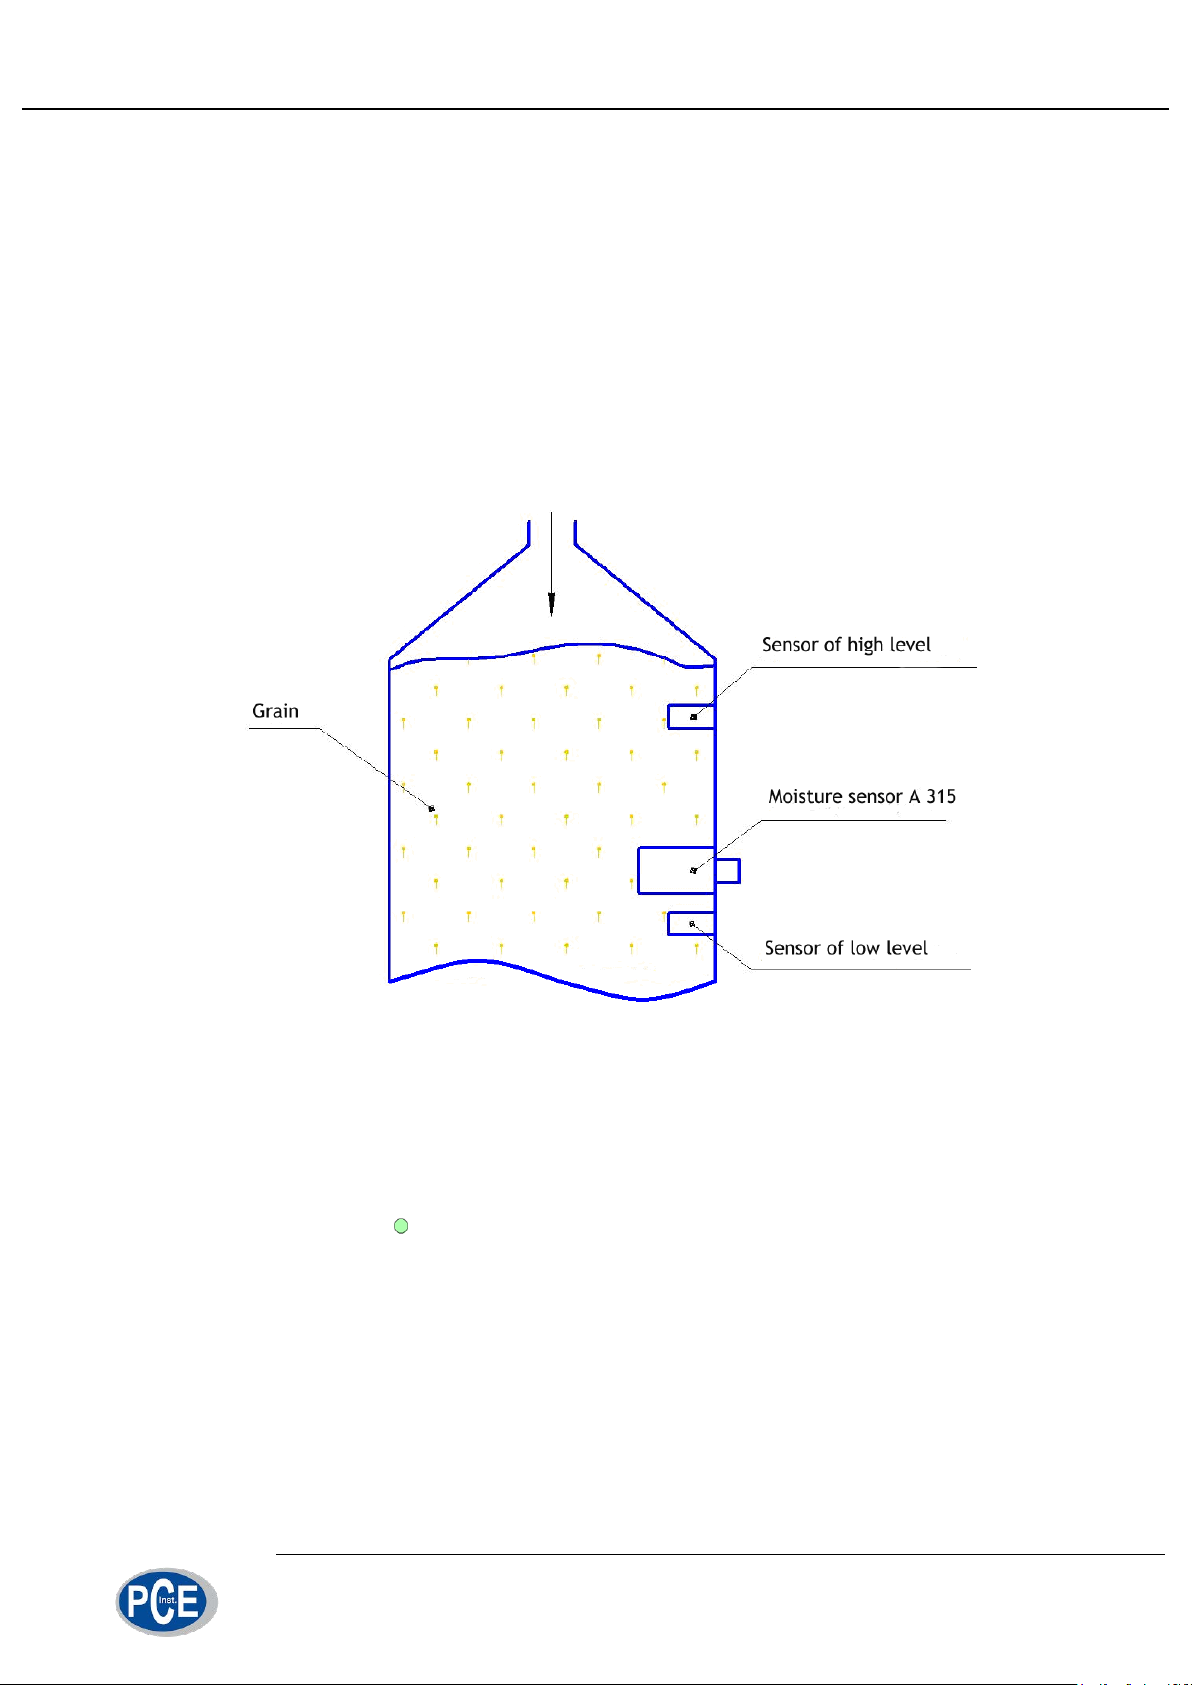
To control flow moisture content of at the inlet the sensor should be installed on
the side wall of bunker in its upper part where the bunker is filled. A315 sensor
should be placed between high and low level sensors of the drying column closer to
the low level sensor (fig. 29).
fig 29. Installation on the side wall of the bunker
As the grain is filling the drying column and sensor measurement channel is filling as well and the sensor begins to measure moisture content of the product. When
the grain level falls below the sensor level, the measurement channel becomes empty of grain and moisture sensor reads zero values and automatic calibration is per-
formed (green light on the panel). The process repeats for the new loading of
grain.
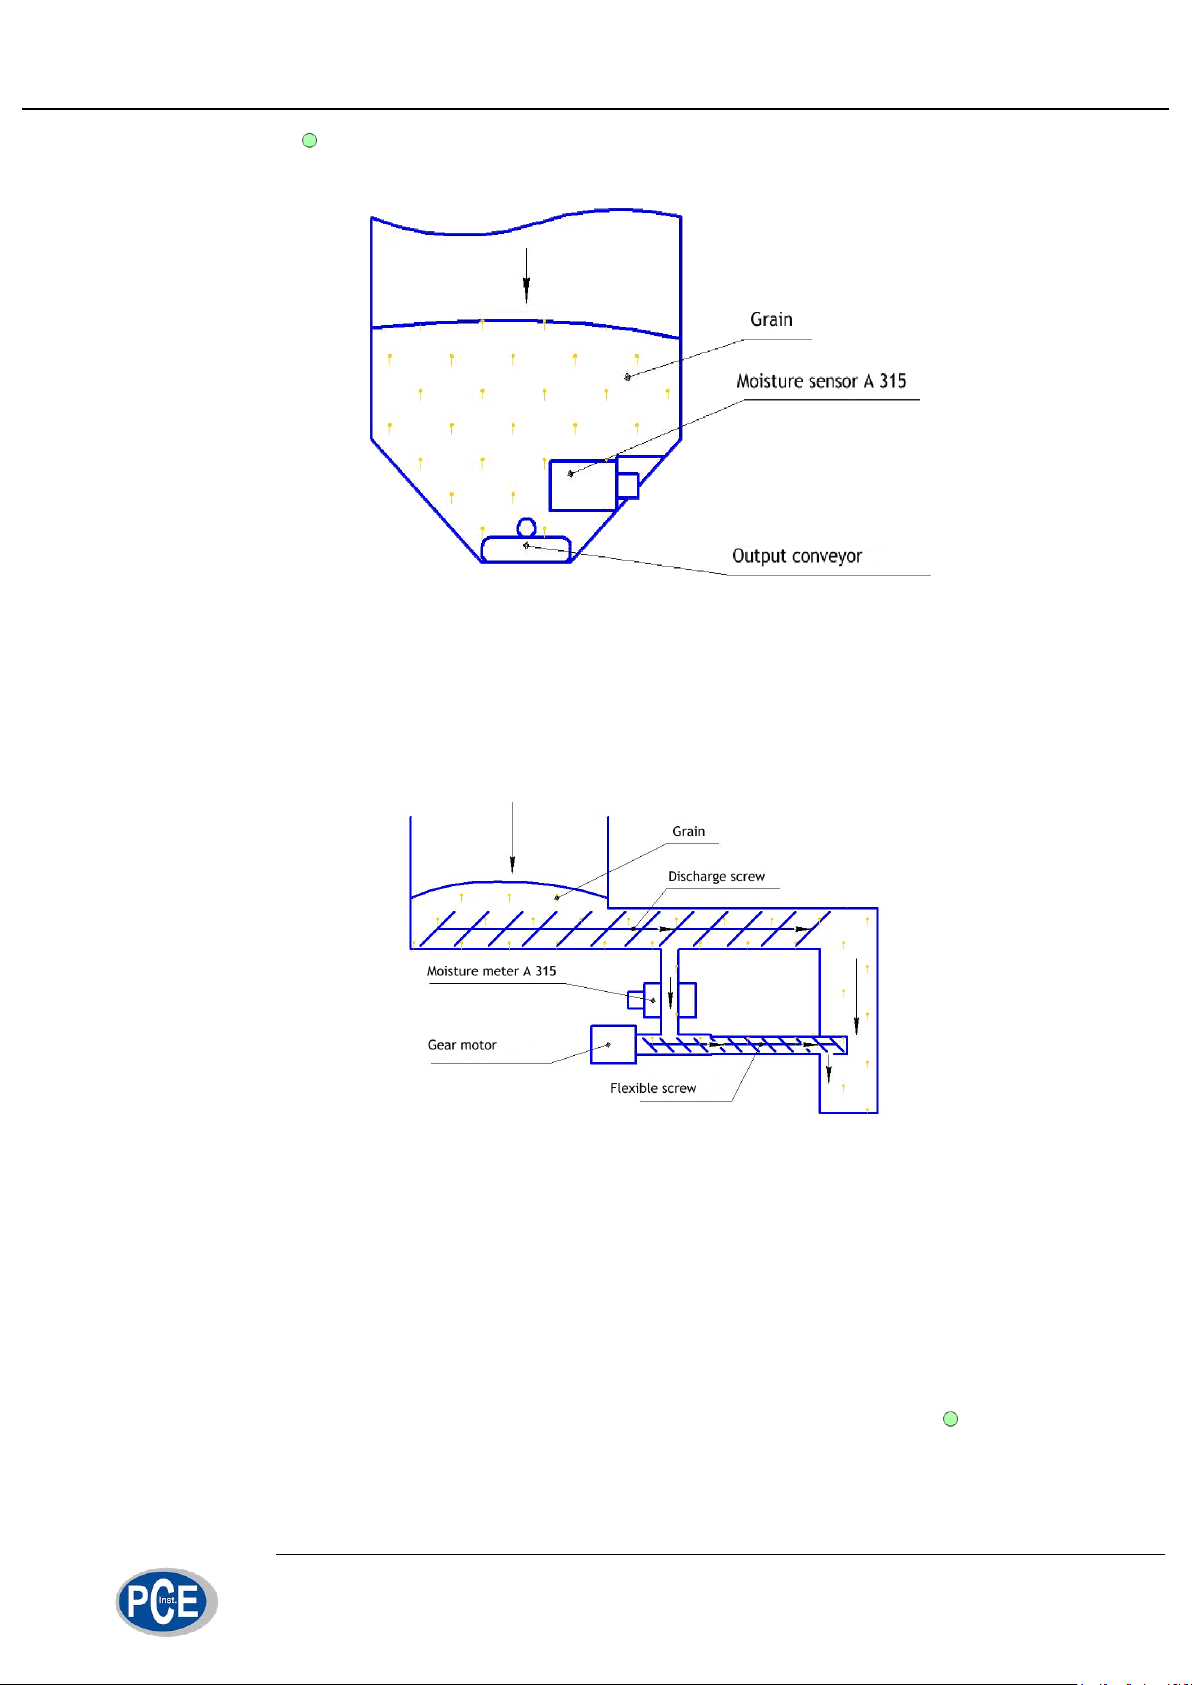
To control flow moisture content at the outlet of dryer the sensor is placed in
output bunker above output conveyor (fig. 30).
When a certain portion of dried grain is discharged from the bunker, moisture
contents sensor gets fully covered and grain slowly passes through the measurement
channel and is then carried away by output conveyor. Measurement continues until
the measurement channel is empty. After this the sensor is automatically calibrated
25/29
Page 26
Installation
(green light glows on the panel) and is ready for measuring moisture content of a
new portion of grain.
fig 30. Installation in the output bunker
Not all grain dryer allow installing A315 sensors in the described manner. In
case grain is unloaded from the bunker in small portions, the most accurate measurements can be demonstrated when using small flexible spiral screw conveyor
mounted below moisture sensor (fig. 31).
fig 31. Instation with a sampling conveyor
Part of grain flow from the unloading conveyor passes through DN60 (60 mm)
pipe to the measurement channel. Spiral screw with the same diameter (DN60) is
mounted below the sensor. The screw is driven be electric motor reducer rotating at
the speed of 1-2 RPS (60-120 RPM) and slowly conveying grain passing through the
moisture content and returning it to the main flow. When this method of installation is
used, the grain flow through the sensors should be interrupted for 20 -30 seconds
every 30 minutes in order to initiate automatic calibration of sensor. After interruption
of grain flow the sensor shall read zero moisture value and green light shall glow
on the panel indicating its readiness for the new portion of grain.
26/29
Page 27
Troubleshooting
6. Troubleshooting
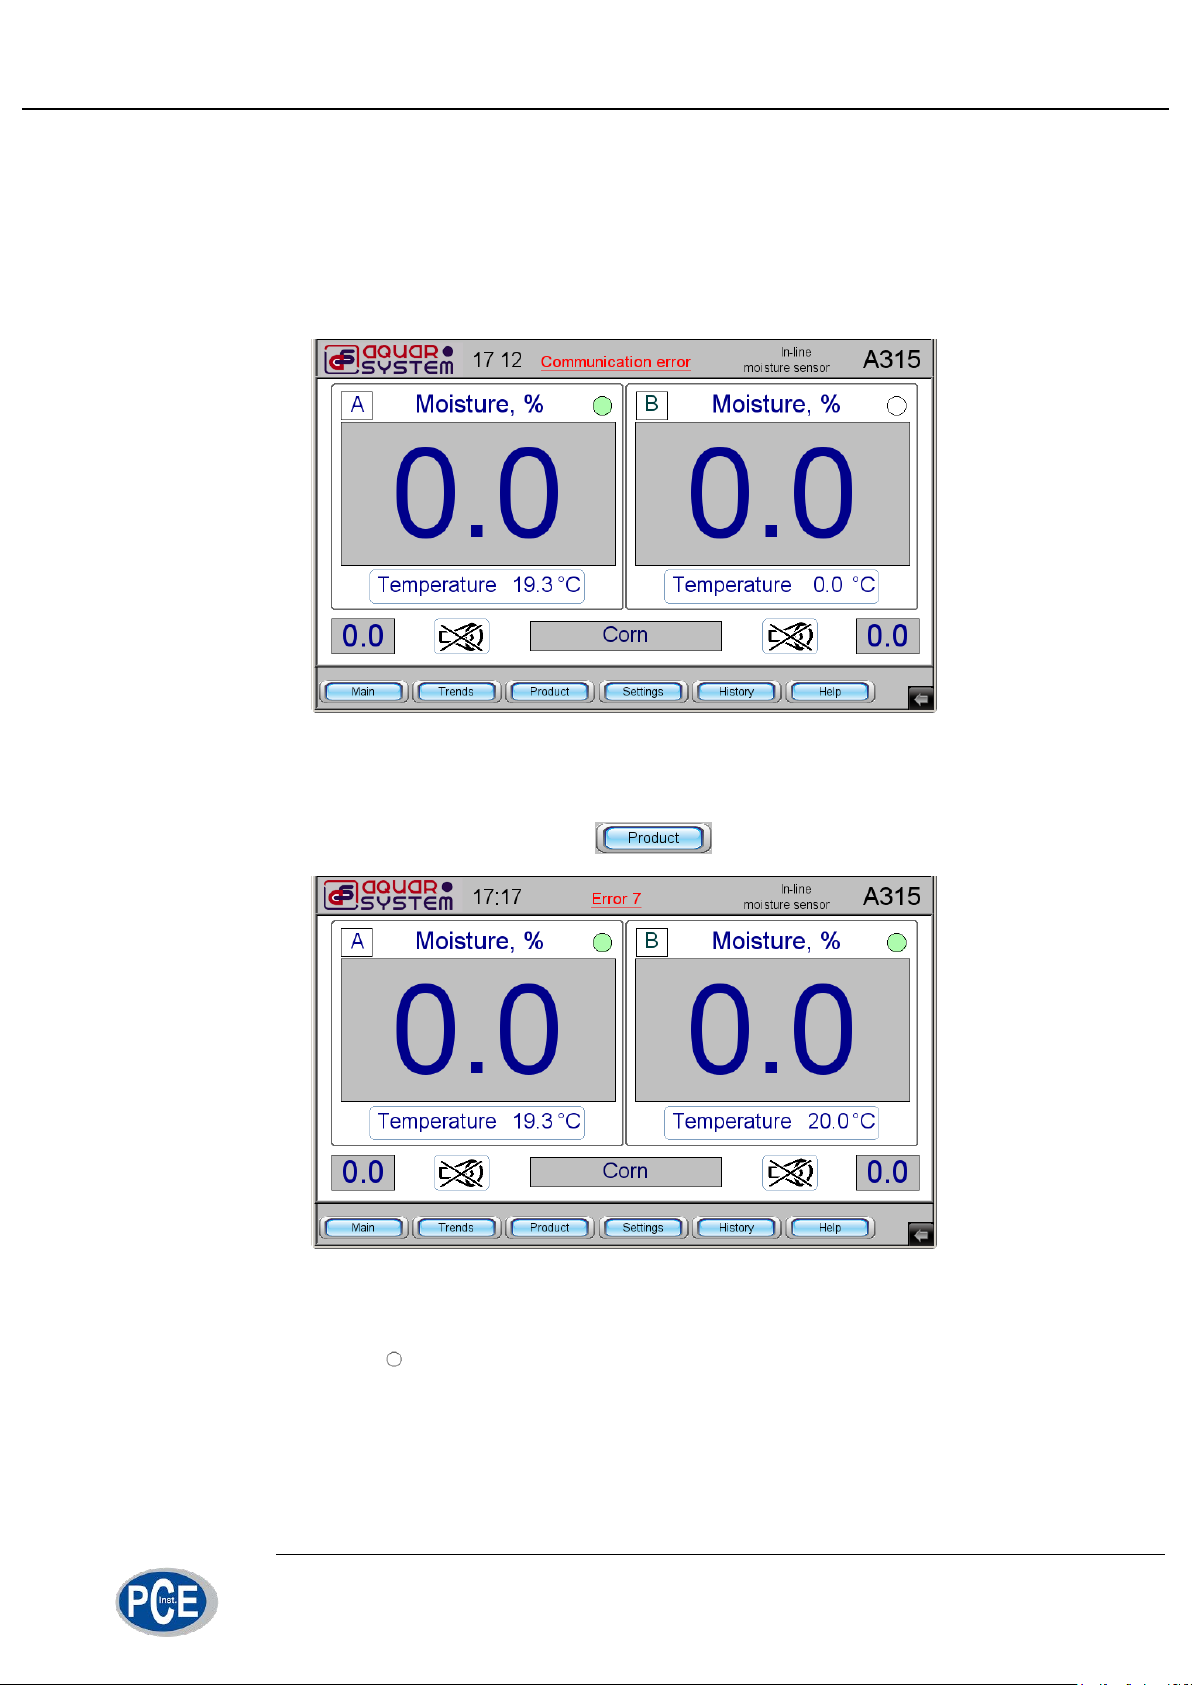
Problem: «Communication error» message on the screen (fig. 32).
Solution: check the integrity of communication cables from moisture sensors to the
control panel and reliability of connecting leads.
fig 32. “Communication error” message
Problem: «Error 7» message on the screen (fig. 33).
Solution: repeat selection of product in mode.
fig 33. “Error 7” message
Problem: one or both sensors show moisture values other than 0.0% and readiness
indicators are white when there is no grain in measuring channel.
Solution: perform calibration according to section 4.4 of this manual.
27/29
Page 28

Troubleshooting
In case of other failures please contact the manufacturer representatives or local dealer.
After the end of drying season it is recommended to dismount moisture sensors
from the grain dryer and store them in dry heated space. Moisture sensor connectors
shall be protected from direct water effect.
28/29
Page 29
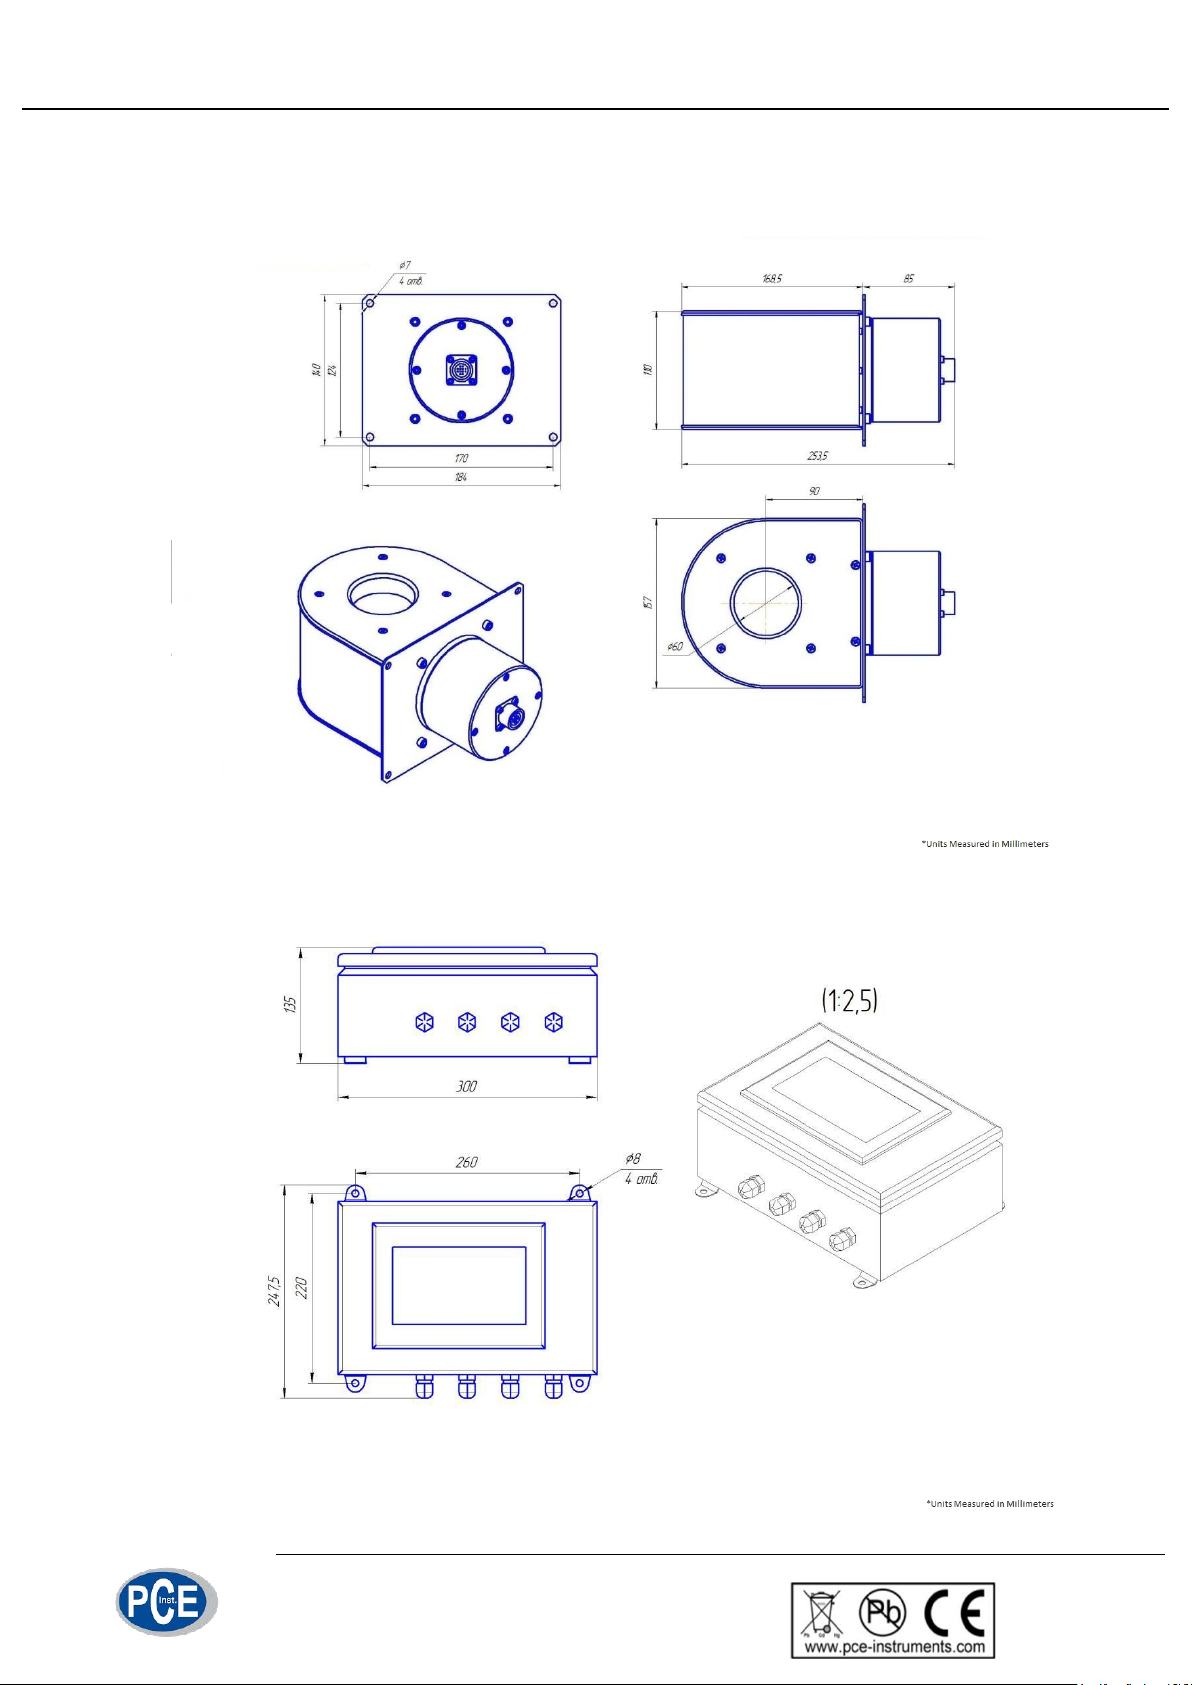
7. Dimensional drawing
Dimensional drawing
29/29
 Loading...