

Page 1
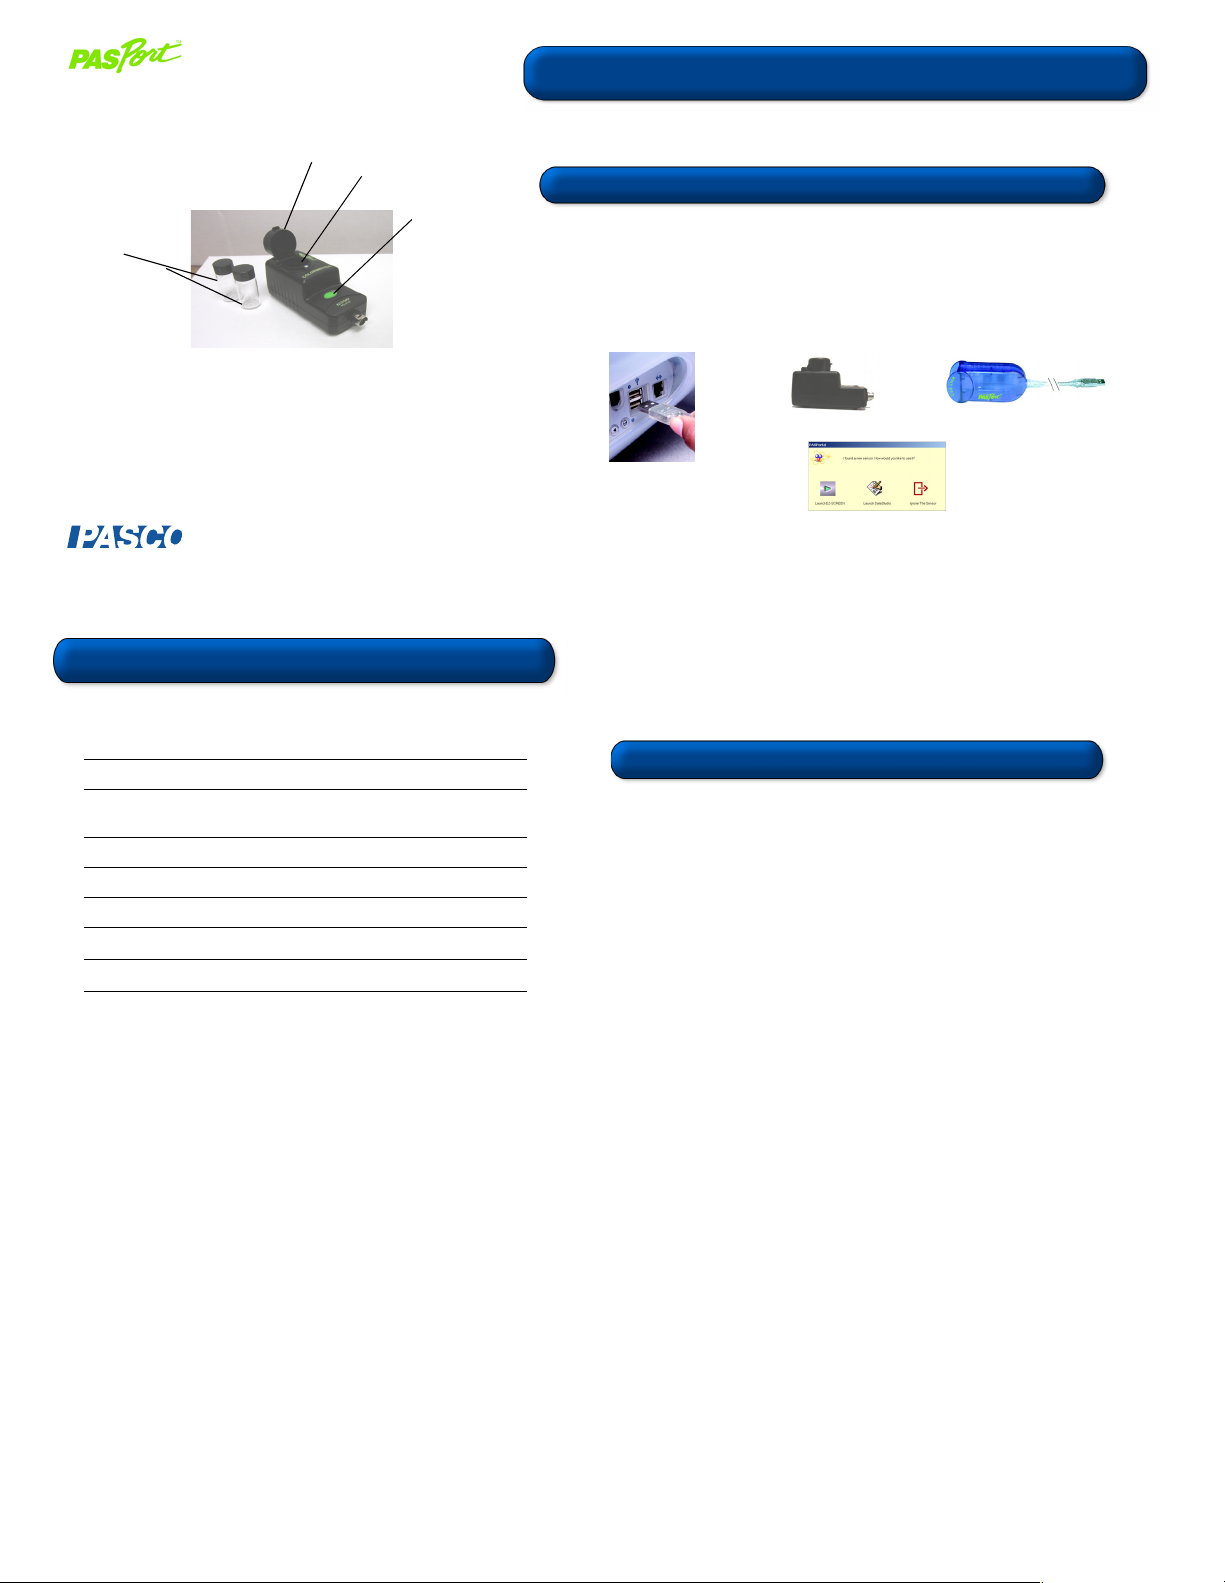
Colorimeter
PS-2121
cuvette
lid
cuvette holder
Calibration
button
CARD 1A
Colorimeter Quick Start
The PS-2121 Colorimeter measures the transmittance (%) of different colors of
light through a solution, and can be used to determine a solution’s concentration.
Equipment Setup
1. Connect a PASPORTTM interface to a USB port on your computer or to a USB hub.
(If using an Xplorer, connect the Xplorer cable to a USB port on your computer.)
2. Connect the sensor to the PASPORT interface (USB Link, PowerLink, Xplorer, etc.).
3. The software launches when it detects a PASPORT
the PASPORTAL window.
sensor. Select a choice from
Equipment equipment needed:
• PASPORT interface with USB-compatible computer or Xplorer (PS-2000)
• DataStudio
®
, DataStudio Lite, or EZscreen software
®
800-772-8700 • 916-786-3800 • techsupp@pasco.com • www.pasco.com
Colorimeter Specifications
Specifications:
Range:
Wavelengths:
Accuracy:
Resolution:
Default sample rate
Maximum sample rate:*
Temp. Range:**
0 to 100% transmittance
Red (660 nm), orange (610 nm),
green (565 nm), blue (468 nm)
±
0.5% transmittance
0.1% transmittance
1 sample/sec
5 samples/sec
5–40°C (recommended)
1
3
2
012-08158C
CARD 1B
Colorimeter Usage Tips
* The recommended sample rate is 1 Hz for color and Beer’s law studies.
If you plan to do reaction order studies, use a faster sample rate.
**The temperature range applies to both the temperature of the solution in
the cuvette and the ambient temperature. Using the Colorimeter above
or below the recommended range or with condensation may give false
readings.
Page 2
Activity: Transmittance and
Absorbance of Colors in Solution
CARD 2A
Equipment Required: PS-2121 Colorimeter, DataStudio or DataStudio Lite,
PASPORT
red (or other) food coloring, 2 cuvettes
1. Fill one cuvette with distilled water and screw the cap on securely.
2. Fill another cuvette with colored solution (i.e. 2 drops of red food coloring
3. Insert the cuvette containing distilled water into the cuvette holder and
4. Plug the Colorimeter into the PASPORT interface, launch DataStudio,
5. Open the Colorimeter lid, remove the first cuvette, and replace it with the
™ interface connected to a USB-compatible computer, distilled water,
and 6 ml of water). Screw on the cap, then gently rock the cuvette back
and forth to evenly mix the solution without creating bubbles.
tightly close the lid.
and click the Start button to begin collecting data. The default graph
displays the transmittance readings for each of the four possible
wavelength settings. Click the Stop button to end data collection.
cuvette containing the colored solution. Repeat steps 3 and 4 to collect
data for the colored solution.
®
800-772-8700 • 916-786-3800 • techsupp@pasco.com • www.pasco.com
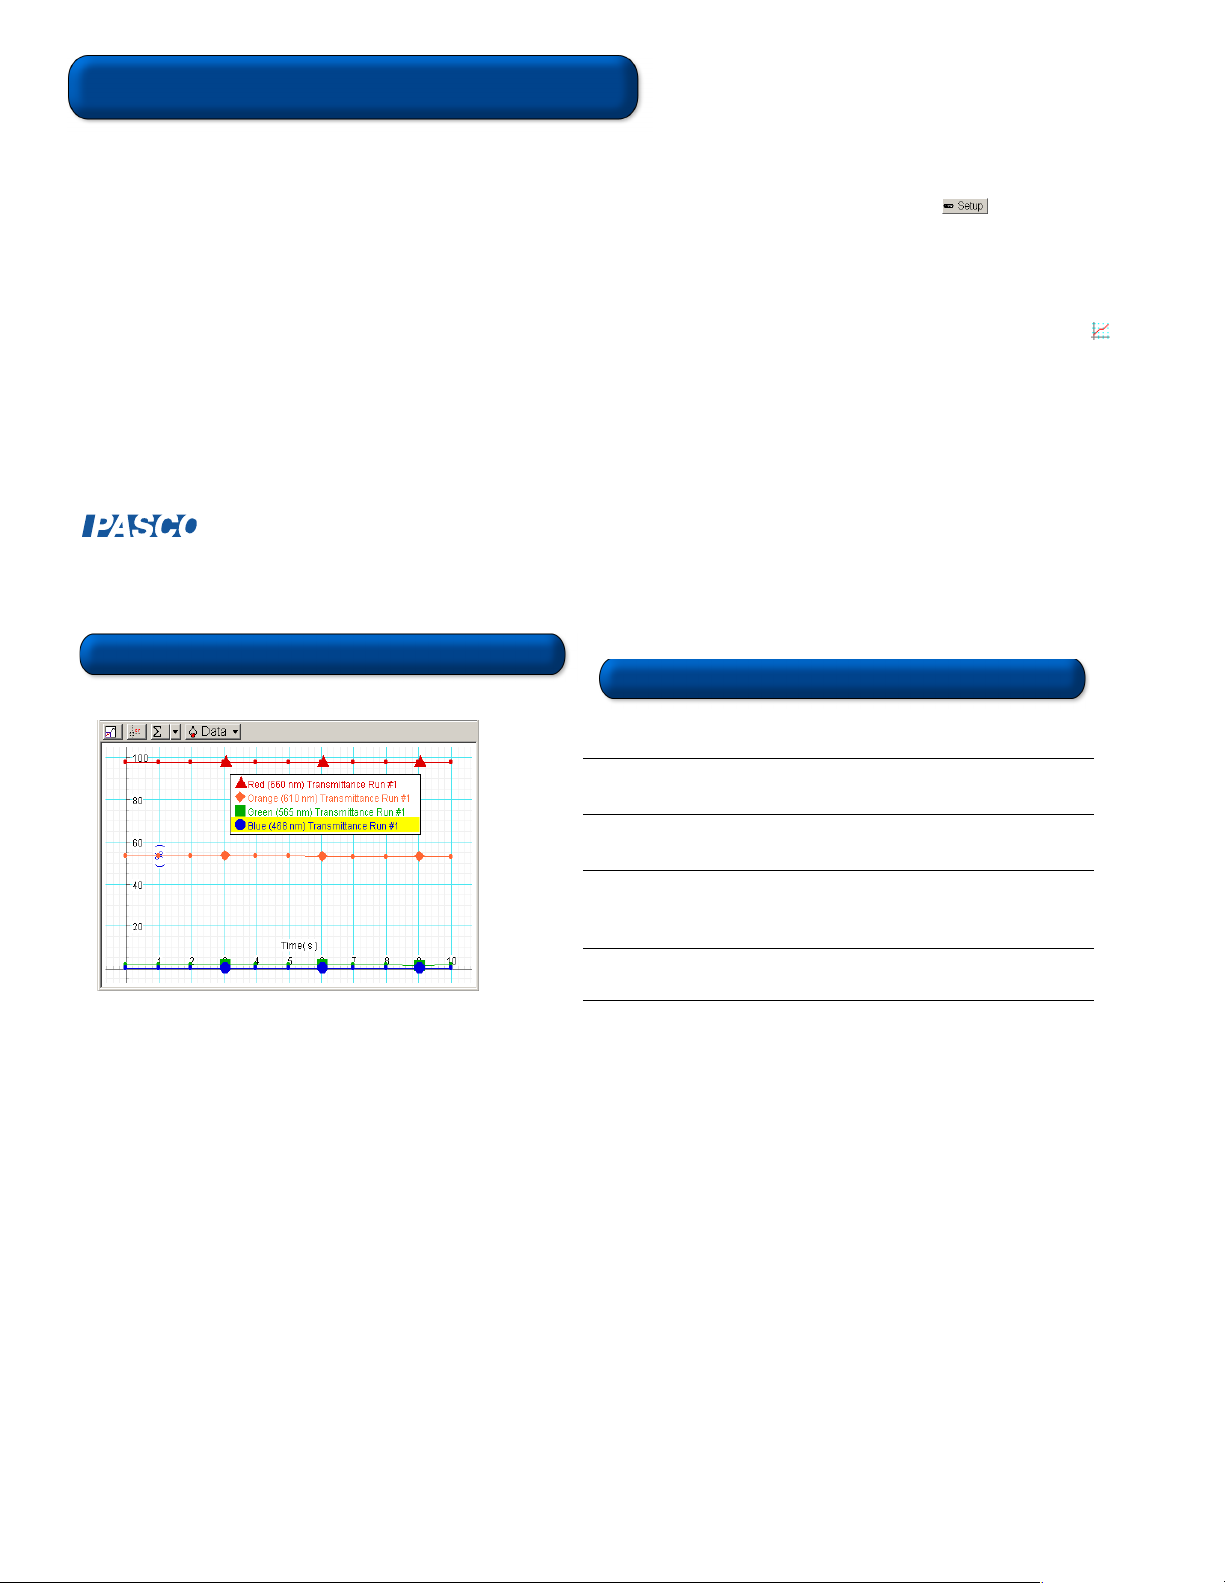
Activity Example (Continued): Sample Results
Transmittance of Colors through a Red Solution
6. Examine the graph display from run #2 (the colored solution). Note
the transmittance readings at each wavelength setting. How do
they differ from transmittance readings for the distilled water?
7. To view absorbance data, click on the button to open the
PASPORT Setup window. Maximize the PASPORT Setup window
to view the Colorimeter options.
8. Uncheck each of the four transmittance boxes, and click to place an
“X” next to each of the four absorbance boxes. (Note the changed
“Data” list in the Summary bar to the left.) Close the Setup window.
9. To open a new Graph display, double click on the Graph icon in
the Data list. When the dialog box appears, select a data source to
display absorbance for a data run and wavelength. Click OK to
open Graph 2, which will display Absorbance vs. Time. (Note: If
desired, you can use a Digits display instead of a Graph.)
10. To compare absorbance values for the distilled water and colored
solution, drag the appropriate icons from the Data list to Graph 2.
Analyze which colors were absorbed or transmitted for each run
and explain your results.
012-08158C
CARD 2B
Viewing Results in DataStudio
Note: Only the first data run of all four colors (red, blue, green,
orange) will correspond to the graph colors that DataStudio
displays. (This applies to either default measurements or the first
four chosen in the PASPORT Setup window).
DataStudio/DS Lite
View transmittance or
absorbance results:
Open the Experiment
Setup window:
Set up the Colorimeter
to read absorbance:
View a linear fit*:
Procedure
From the Data list, drag a colored Transmittance or
Absorbance icon to a Graph or other display.
On the main toolbar, click on the Setup button to
open the Experiment Setup window.
In the upper right corner of the Experiment Setup
window, click on the Maximize button. Scroll to the
Colorimeter box and check the absorbance boxes.
Click on the Fit menu button. From the Fit menu,
select “Linear Fit.”
*To calculate the log or inverse of absorbance, create an equation using the
DataStudio Calculator. The linear fit and Calculator features are not available
in DataStudio Lite.
Page 3

Sample Preparation
CARD 3A
Before taking measurements, always do the following:
1. Fill the cuvette with at least 6 ml of sample. Screw the cap on securely.
2. Gently rock the cuvette back and forth to distribute the solute molecules
equally throughout the solution.
bubbles to enter.
3. Handle the cuvette by the cap and wipe the outside glass lens clean with
a non-abrasive cleaning tissue.
fingers!
4. (Optional): Place one of the provided labels on the cap of the cuvette. (See
“Orienting the Cuvette” below.)
1
®
2
Do not shake the cuvette or allow air
Avoid touching the glass with your
800-772-8700 • 916-786-3800 • techsupp@pasco.com • www.pasco.com
3
Calibration Procedure
Calibration of the Colorimeter is not always required, but is recommended for
better accuracy. You can calibrate the colorimeter when it is connected to either
an Xplorer or a USB link. All calibration readings are stored in flash memory
inside the PS-2121. When you unplug the sensor and reconnect it, the sensor
retains the last calibration reading.
CAUTION: To avoid errors when calibrating, do not use the Colorimeter
around bright lights or with turbid solutions. Always close the lid tightly before
taking measurements. For accurate readings, fill the cuvette to the lid with
sample.
1. To calibrate for 100% transmittance, insert a cuvette filled with distilled
water into the cuvette holder and tightly close the lid.
2. Press the green Calibration button on the sensor. The light
illuminates to indicate calibration is in progress.
3. Wait for the light to turn off and then remove the sample.
4. To check your calibration, reinsert the cuvette, close the lid, and click
the Start button in DataStudio. All color readings should approximate
100% transmittance.
Orienting the Cuvette (Optional)
To minimize reading variance due to natural differences or imperfections in the
glass of the cuvette, do the following for each cuvette you plan to use:
1. Insert the cuvette containing distilled water or other solution into the
cuvette holder.
2. Put a piece of black cloth over your hand and the cuvette (so that no
light seeps through). Click the Start button in DataStudio.
3. With your covered hand, rotate the cuvette while observing the reading
in DataStudio. At the highest transmittance reading, click the Stop
button. Do not rotate the cuvette any further.
4. With the cuvette still in the holder, place one of the provided arrow labels
on the cap, with the arrow pointing toward the screw on the holder. (For
subsequent measurements, always align the arrow with the screw on
the holder. Do not switch caps between cuvettes!)
012-08158C
CARD 3B
Note: While in calibration mode, please do not start collecting data. The
PS-2121 Colorimeter cannot communicate during this time and an error
will occur.
A blinking red light on the Calibration button means either (a): The dark
count is too high; stray light is entering the cuvette holder or (b): The
sensor measurement is out of range. The light turns off when the reading
is within the normal range.
Experiment Suggestions
• Performing reaction rate, enzymatic, and bacterial growth studies
• Monitoring the concentration of substances in water or other solutions
Page 4

Using the Colorimeter with DataStudio
By default, when you plug a Colorimeter into a PASPORT interface and click
the Start button, DataStudio automatically displays the percent
transmittance readings for each of the four colors (red, green, blue, orange)
in a Graph display. Any time you need to change the Colorimeter’s settings
to read a different measurement, you must use the PASPORT Setup
window in DataStudio. To open the PASPORT Setup window, click the
button on the main toolbar. Then click to place an “X” next to the
desired measurement. To remove the setting, click on the “X” again.
Example: You want the Colorimeter to read absorbance instead of %
transmittance for all four colors. In the boxes next to the colors with the
“transmittance” unit, click to remove the “X.” Then click to place an “X” in
each of the boxes next to the colors with the “Absorbance” unit.
CARD 4A
Use the down
arrow and the Plus
and Minus buttons
to change the
sample rate.
Note: Colorimeter options appear in the Setup window when you connect
a Colorimeter to a USB link. To view all Colorimeter measurement options,
use the Maximize button in the Setup window.
012-08158C
Using the Colorimeter with the
PASPORT EZscreen
1. Plug the Colorimeter into the PASPORT interface. When the
PASPORTAL window opens, select “Launch EZ-SCREEN.”
2. To begin collecting data, click the Start/Stop button.
3. To end data collection, click the Start/Stop button.
4. To cycle through the different colors and measurement types, click
the Colorimeter icon in the bottom right corner of the screen.
5. To toggle between separate runs of data, click the Toggle
button.
Note: To simultaneously view all colors in one graph, you must use either
DataStudio or DataStudio Lite.
CARD 4B
Using the Colorimeter with Xplorer
1. Turn on the Xplorer.
2. Plug the Colorimeter into the Xplorer. (Note: If you wish to perform
calibration, you must have Xplorer connected to your computer. Use
the procedure described on the reverse of this card.)
3. To collect data, click the Start button. The LED light flashes
when Xplorer is storing data. (To stop, click the Start button again.)
4. To cycle through the measurements (transmittance or absorbance) for
each color, click the Plus button (to more forward) or Minus button (to
move backward.)
5. To view your data in DataStudio, connect the Xplorer cable to the USB
port on your computer and to the USB port on the side of Xplorer.
6. At the DataStudio prompt, click Retrieve Now. DataStudio
automatically displays the % transmittance readings for the four
colors.
Note: To view absorbance readings in DataStudio, you must open the Setup
window and change the settings. See “Using the Colorimeter with DataStudio”
on this card.
 Loading...