

Page 1
®
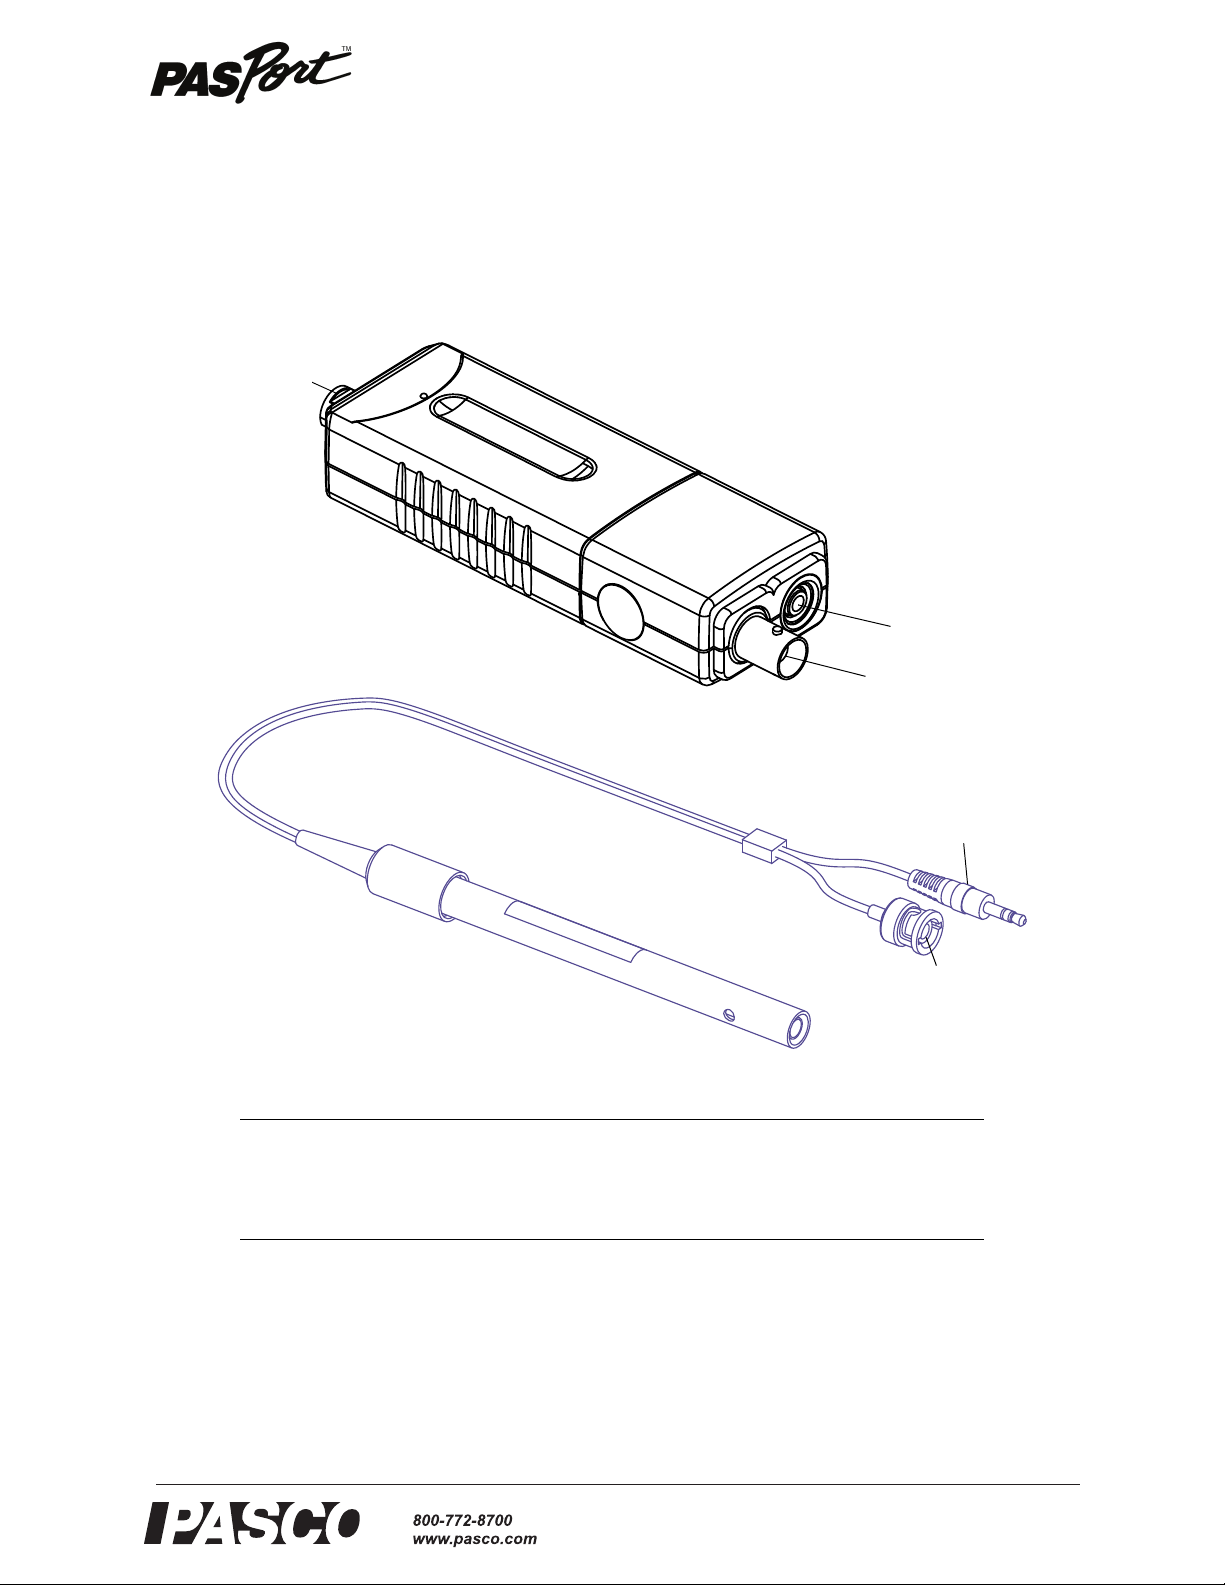
Salinity Sensor
Temperature
Input port
Six pin mini-
DIN connector
Conductivity
Input port
Conductivity
BNC connector
Temperature
Input plug
Salinity
Sensor
Salinity
Sensor Probe
The illustrations are not to scale.
PS-2195
Instruction Sheet
012-10546A
*012-10546*
\
Included Equipment Part Number
Salinity Sensor PS-2195
Salinity Sensor Probe, 10 X, Conductivity/Temperature 699-11064
Recommended Items
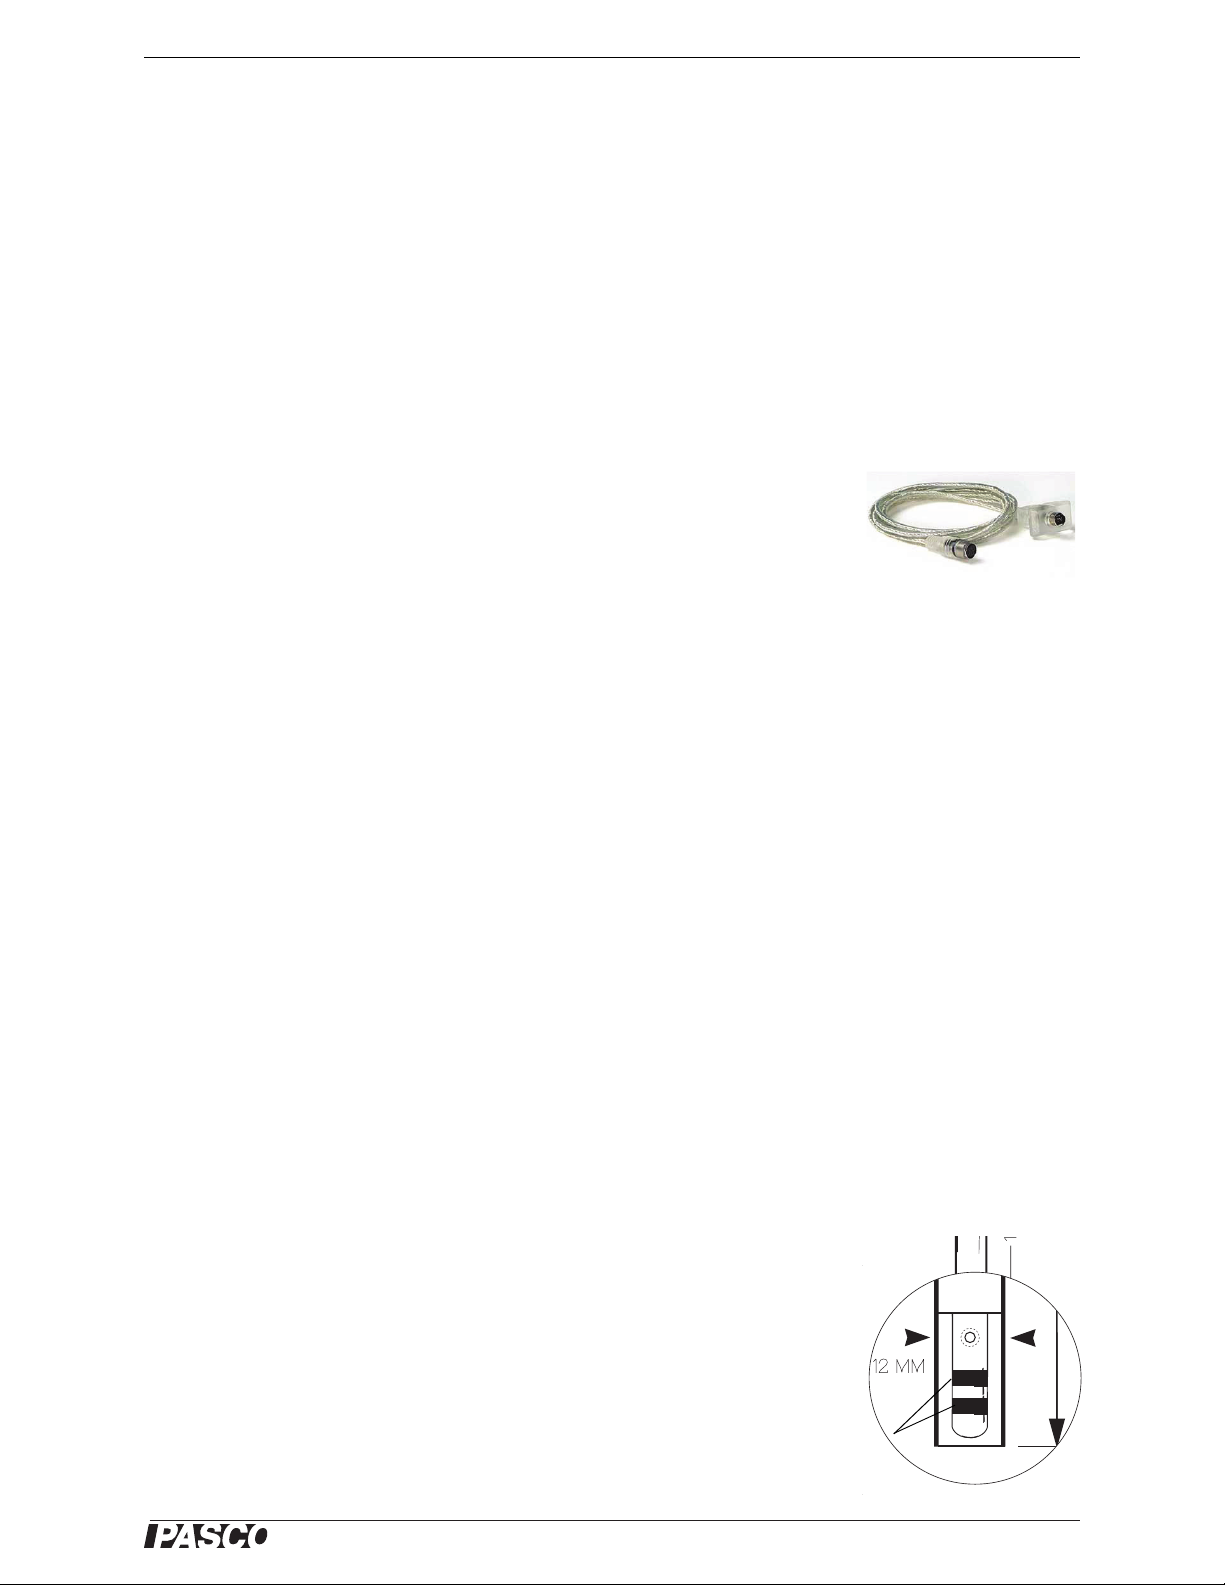
PASPORT Extension Cable PS-2500
PASCO Interface Catalog or web site*
Data Acquisition Software Catalog or web site*
*See the PASCO catalog or web site at www.pasco.com for compatible PASPORT interfaces and Data Acquisition Software..
Page 2
®
Model No.PS-2195 Introduction
PS-2500 PASPORT
Extension Cable
Water Salinity
<0.5 ppt - fresh water
0.5 to 30 ppt - brackish water
30 to 50 ppt - saline water
>50 ppt - brine
Ocean Water
Ocean water is about 3.5%
salt, or 35 ppt, and the salt is
90% sodium chloride.
The sensor actually measures conductance, the
inverse of resistance,
expressed in siemens. Conductivity depends on the
conductance and the cell
constant of the probe. The
cell constant depends on
the geometry of the electrodes in the probe.
Introduction
Salinity is an ecological factor of considerable importance, influencing the types of
organisms that live in a body of water. Salinity also influences the kinds of plants that
can grow in a body of water, or on land fed by the body of water. A quantity of water
is considered saline if it contains moderate or relatively high amounts of dissolved
salts. The term is most often employed to describe water that would, if evaporated
fully, leave behind salts incorporating sodium, calcium, or magnesium. Salinity is the
degree to which a water is saline.
The PASPORT Salinity Sensor works with the 10X Salinity Sensor Probe to measure
salinity, conductivity, and temperature. The sensor determines salinity based on electrical conductivity. The sensor has a built in calculation to compensate for the change
in conductivity due to temperature change based on the Practical Salinity Scale (PSS).
Essentially the conductivity increases as the temperature increases because ions in
solution are more mobile. It is possible to approximate a calculation of total dissolved
solids (TDS) using data from the sensor.
The Salinity Sensor can be connected to any PASPORT interface (such as the Xplorer
GLX or PowerLink). The sensor can be used with the PASPORT Extension Cable.
This cable is 2 meters in length, extending the distance a sensor can reach from a
computer or portable datalogger.
Salinity is often expressed as parts per thousand (ppt) which is approximately equal to
grams of salt per liter of solution. However, salinity is the sum weight of many different elements within a given volume of water; not just sodium from sodium chloride.
In the 1970’s, salinity was redefined as the conductivity ratio of a water sample to a
standard potassium chloride (KCl) solution.
Usage
One use for the sensor is to explore the salinity of local water sources. Another use for
the sensor is to explore the interrelationship of salinity, temperature, and
conductivity. The sensor can be used to measure the change in the salinity of saltwater
as the water evaporates.
About the Sensor
The PS-2195 Salinity Sensor’s conductivity range is from 1,000 microsiemens (S)
to 100,000 S. The temperature range is from 0 celsius (C) to 50 °C. The salinity
range is from 1 part per thousand (ppt) to 55 ppt ±10% without calibration.
The temperature compensation is ±0.5 ppt from 0 C to 45 C at 33 ppt.
If the temperature of the solution is out of range, the sensor reports the salinity as
0 ppt. If the conductivity of the solution is below 1,000 S, the sensor reports the
conductivity as 0 S.
The Salinity Sensor measures the electric current through a solution between the two
platinized platinum electrodes in the Salinity Sensor Probe. The current through the
solution is due to the movement of ions, so the higher the concentration of ions in the
solution, the higher its conductivity. A voltage (AC) is applied across the two electrodes in the tip of the probe and the measured current is proportional to the conductivity of the solution.
Platinized platinum
electrodes
2
Page 3
®
Model No.PS-2195 Setup
TIPS
DO NOT submerge the
entire Salinity Sensor
Probe in a liquid. The top
end of the probe is not
waterproof.
Use distilled water from a
wash bottle to rinse the
end of the probe before
making another measurement.
DO NOT put the probe in
viscous, organic liquids,
such as heavy oils or ethylene glycol. Do not put
the probe in acetone or
non-polar solvents, such
as pentane.
Clean the electrodes
when necessary by soaking the tip in acid (e.g.,
vineagar or diluted hydrochloric acid (muriatic
acid)) and then rinsing
with water.
If the tip is heavily fouled
with organic material,
soak the tip in alcohol or
bleach and then rinse with
water. Gently wipe the tip
with a soft, nonabrasive
cloth towel.
Setup
Hardware Setup
The following steps can be performed in any order.
1. Connect the Salinity Sensor Probe to the Salinity Sensor. Connect the Conductivity BNC connector from the probe to the Conductivity input port on the sensor.
Push the BNC connector onto the port and turn the connector clockwise
(left-to-right) until the connector locks into place on the port.
2. Connect the Temperature input plug from the probe to the Temperature input port
on the sensor.
3. Connect the Salinity Sensor to a PASPORT interface.
4. If you will be using a computer, connect the PASPORT interface to the com-
puter’s USB port.
Using the Probe
Before using the Salinity Sensor Probe, soak the probe in distilled water for 5 to 10
minutes. Use a towel to dry any water droplets that are on the probe so that the water
will not dilute the sample that is to be measured.
Submerge the tip of the probe at least 5 centimeters (cm) into the sample to be measured. Start recording data. Watch the display in your data acquisition program.
DataStudio Setup
If you will be using the Salinity Sensor
with a computer, install the latest version of DataStudio first. Check the
PASCO web site at www.pasco.com
for information.
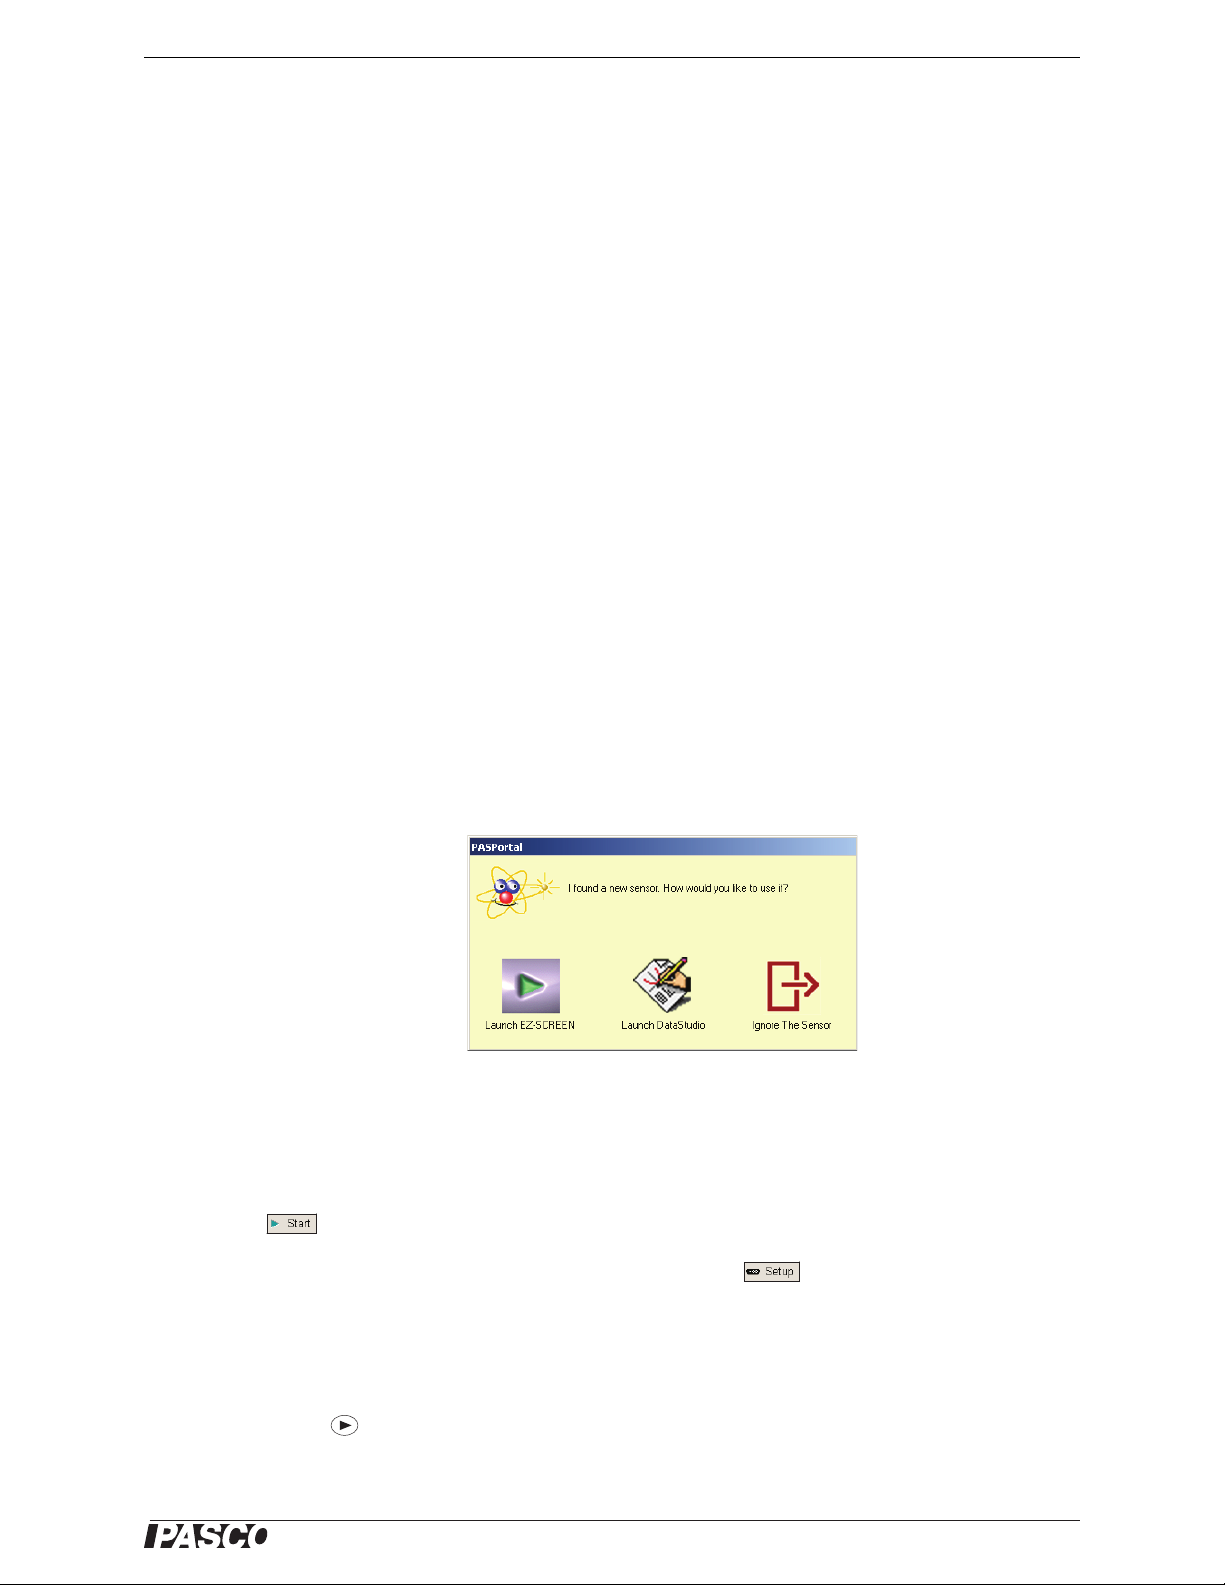
1. When you connect the Salin-
2. Select Launch DataStudio in the PASPortal window.
A Digits display for salinity, temperature, and conductivity will open automatically.
3. Click to begin data collection.
To view and change the sample rate and other sensor properties, click .
Xplorer and Xplorer GLX Setup
If you will be using an Xplorer or Xplorer GLX in logging mode (not connected to a
computer), connect the Salinity Sensor to the Xplorer or Xplorer GLX, turn the interface on, and press to begin data collection.
ity Sensor to the computer
through a PASPORT interface, the PASPortal window
will launch automatically (if
DataStudio is not already running).
3
Page 4

®
Salinity Sensor Setup
Start button
See the User’s Guides for
the Xplorer GLX or the
SPARK Science Learning
System for calibration
instructions.
(1)
(2)
(3)
(4)
(5)
SPARK Setup
• If the SPARK Science Learning System (SLS) is off, press and hold the power
button on the bottom to turn it on and then wait for the SPARK to boot up. The
screen will show a message to plug in a sensor.
• Connect the PASPORT sensor to either of the ports on the top of the SPARK. The
screen will show the list of quantities measured by the connected sensor.
Graph Display (default)
To open a graph display, touch any quantity in the list and then touch SHOW to open
PAGE 1. Touch the right arrow next to PAGE 1 to go to the next display (digits).
Touch the Start button to begin collecting data.
Select a Display
To set up a particular display (e.g., digits display), touch BUILD. Touch a quantity
from the list, and then touch one of the display icons. Touch OK to open the display,
and then touch the Start button to begin collecting data.
Calibration
Prepare a salinity calibration solution.
You will need reagent grade sodium chloride (salt), a liter of distilled or deionized
water, a stir rod, and a container with accurate volume markings. Pour 500 milliliters
(mL) of distilled water into the container. Add 33.03 g sodium chloride (NaCl) and
stir the mixture until the salt dissolves. Next, add enough distilled water to make one
liter (1000 mL) of solution. This solution has a salinity value of 35 ppt at 25 °C.
1 Point Calibration
In DataStudio., click ‘Setup’ to open the Experiment Setup window and click ‘Calibrate Sensors…’. (1) In the Calibrate Sensors window, select ‘Salinity (ppt)’ as the
measurement from the second menu in the upper left corner. (2) Select ‘1 Point
(Adjust Slope Only)’ as the Calibration Type in the lower left corner.
Place the Salinity Sensor probe into the calibration solution and wait until the data in
the ‘Sensor Value’ window stabilizes. (3) Make sure that the Standard Value reads
35.000 ppt. (4) Click ‘Read From Sensor’.(5) Click ‘OK’ to close the Calibrate Sen-
sors window.
4
Page 5

®
Model No.PS-2195 Specifications
More About Calibration
You can also calibrate the Salinity Sensor using a standard salinity solution purchased
from a company such as Hach (www.hach.com) or Lamotte (www.lamotte.com) that
offers water quality testing equipment. A third way is to make a calibration solution
from “Instant Ocean
®
Sea Salt” (www.instantocean.com) which can be purchased at
most aquarium supply stores.
Total Dissolved Solids (TDS) and Conductivity
Total dissolved solids (TDS) is a measure of the amount of mineral and salt impurities
in a sample of water. TDS is usually measured in parts per million (ppm) and drinking
water is typically below 500 ppm. For example, one kilogram of water containing 1
milligram of dissolved solids has a TDS of 1 ppm. One way to measure the amount of
TDS in a sample is to measure the electric conductivity of the sample.
A conversion factor is used to convert conductivity to the approximate concentration
of TDS. The conversion factor depends on the specific dissolved solids and can vary
between 0.40 and 0.96, depending on the dissolved solids. A value of 0.65 is used as
an approximation if the dissolved solids are not known. As an example,
TDS (ppm) = 0.65 x Conductivity (S). Since conductivity varies with temperature,
the Salinity Sensor has built-in compensation for temperature.
Table: Conversion Chart to Estimate TDS of Aqueous Solutions at 25 °C
Conductivity
(S)
1.000 0.650 0.500 0.400
1.250 0.813 0.625 0.500
1.667 1.083 0.833 0.667
2.500 1.625 1.250 1.000
5.000 3.250 2.500 2.000
10.000 6.500 5.000 4.000
20.000 13.000 10.000 8.000
40.000 26.000 20.000 16.000
80.000 52.000 40.000 32.000
158.730 103.175 79.635 63.492
312.500 203.125 156.250 125.000
625.000 406.250 312.500 250.000
1250.000 812.500 625.000 500.000
2500.000 1625.000 1250.000 1000.000
5000.000 3250.000 2500.000 2000.000
10000.000 6500.000 5000.000 4000.000
As Ion As CaCO
Parts per Million
3
As NaCl*
Specifications
Measurement Ranges Other Values
Conductivity 1,000 to 100,000 S Sample rate (maximum) 50 Hz
Temperature 0 to 50 degrees C Temperature compensation ±0.5 ppt from 0 to 45 °C at 33 ppt
Salinity 1 to 55 ppt ±1%* Cell constant 10X
(*with calibration)
5
Page 6

®
Salinity Sensor Technical Support
Storage
The Salinity Sensor Probe can be stored dry. Rinse the tip with distilled water and
then dry it using a soft, nonabrasive towel.
Technical Support
For assistance with any PASCO product, contact PASCO at:
Address: PASCO scientific
10101 Foothills Blvd.
Roseville, CA 95747-7100
Phone: 916-786-3800 (worldwide)
800-772-8700 (U.S.)
Fax: (916) 786-3292
Web: www.pasco.com
Email: support@pasco.com
For more information about the Salinity Sensor and the latest revision of this Instruction
Sheet, visit:
www.pasco.com/go?PS-2195
Limited Warranty For a description of the product warranty, see the PASCO catalog. Copyright The
PASCO scientific 012-10546A Salinity Sensor Instruction Sheet is copyrighted with all rights reserved.
Permission is granted to non-profit educational institutions for reproduction of any part of this manual,
providing the reproductions are used only in their laboratories and classrooms, and are not sold for
profit. Reproduction under any other circumstances, without the written consent of PASCO scientific, is
prohibited. Trademarks PASCO, PASCO scientific, DataStudio, PASPORT, Xplorer, and Xplorer GLX
are trademarks or registered trademarks of PASCO scientific, in the United States and/or in other
countries. For more information visit www.pasco.com/legal. Windows is a registered trademark of
Microsoft Corporation in the United States and/or other countries. Mac is trademark of Apple Computer, Inc., registered in the U.S. and other countries.
Product End of Life Disposal Instructions:
This electronic product is subject to disposal and recycling regulations that vary by
country and region. It is your responsibility to recycle your electronic equipment per
your local environmental laws and regulations to ensure that it will be recycled in a
manner that protects human health and the environment. To find out where you can
drop off your waste equipment for recycling, please contact your local waste recycle/disposal service, or the place where you purchased the product.
The European Union WEEE (Waste Electronic and Electrical Equipment) symbol (to
the right) and on the product or its packaging indicates that this product must not be
disposed of in a standard waste container.
6
Page 7

®
Model No.PS-2195 Experiment: Temperature Dependence of Conductivity in Dilute
The distilled or deionized
water for the samples should
be at or below room tempera
ture.
Figure 1
Experiment: Temperature Dependence of Conductivity in Dilute Aqueous Solutions
Purpose
The purpose of this experiment is to explore the relationship between temperature and
conductivity in aqueous solutions.
Materials and Equipment Needed Product Number or Quantity
PASPORT Salinity Sensor PS-2195
Data Acquisition Interface and Software (See the PASCO web site at www.pasco.com)
Hot plate with magnetic stirrer
Ohaus triple-beam balance SE-8723
Base and support rod ME-9355
Graduated cylinder SE-7713
250-mL Beaker (4) SE-7702
1000-mL Beaker SE-7288
Utility (buret) clamp SE-9446
Wash bottle
Apron, gloves and goggles Per student
Sodium chloride 1000 mg
Sodium hydroxide 200 mg
Distilled or deionized water 1400 mL
Procedure
1. Soak the Salinity Sensor Probe in distilled or deionized water for 5–10 minutes.
2. Prepare solutions:
• Prepare a 0.1% sodium chloride (NaCl) solution by dissolving 200 mg of NaCl in
100 ml of distilled or deionized water and then adding more distilled or deionized
water until the volume is 200 ml.
• Prepare a 0.4% NaCl solution by dissolving 800 mg of NaCl in 100 ml of dis-
• Prepare a 0.005 M sodium hydroxide (NaOH) solution by dissolving 200 mg of
tilled or deionized water and then adding more distilled or deionized water until
the volume is 200 ml.
NaOH in 500 ml of distilled or deionized water and then adding distilled or
deionized water until the volume is 1000 ml. Pour 200 ml of the solution into a
250 ml beaker.
7
Page 8

®
Salinity Sensor Experiment: Temperature Dependence of Conductivity in Dilute Aqueous
Calibration is not needed
for this experiment.
3. Connect the Salinity Sensor to the data acquisition interface. Support the Salinity
Sensor Probe with a clamp that is mounted on a base and support rod (see Figure
1). Place the hot plate with magnetic stirrer below the tip of the probe.
4. Start the data acquisition program. Set up a graph display that shows conductivity
on the vertical axis and temperature on the horizontal axis.
5. Put the beaker with the first 200 ml sample on the hot plate. Arrange the Salinity
Sensor Probe so that at least 5 cm of the tip is in the solution.
6. Turn on the hot plate and magnetic stirrer. The heat and the stirring controls
should be set to a mid-range value.
7. Start recording data. Tap the Salinity Sensor Probe occasionally to avoid the formation of air bubbles in the probe’s cell. When the temperature of the solution
reaches 50 °C, stop recording data.
8. Remove the Salinity Sensor Probe from the first sample. Rinse the end of the
probe with distilled water.
9. Repeat the data collection process with the other two samples.
Data Analysis
1. Autoscale the graph display and select Run #1.
2. Use the data analysis features of the data acquisition software to select a “Linear
Fit” for the data. Determine the slope of the first run of data.
3. Use the Smart Cursor feature of the software to find the conductivity at the place
in the graph where the temperature is 25 °C.
4. Divide the slope by the value of the conductivity at 25 °C. Convert the answer to
a percentage to determine ‘percent change/°C’. Record your result in the Data
Table.
5. Repeat the data analysis process for the other runs of data.
Data Table
Sample percent change/ °C at 25 °C
0.1% NaCl (1000 ppm)
0.4% NaCl (4000 ppm)
0.005 M NaOH (1000 ppm)
Questions
8
1. Describe the effect of temperature on the conductivity of the solutions.
2. Compare the experimentally determined values of percent change per degree C at
25 °C for the samples.
3. What are some factors that affect the conductivity of a solution?
Page 9

®
Model No.PS-2195 Notes on the Experiment
Notes on the Experiment
If bubbles form inside the probe, the conductivity reading will be reduced because the
bubbles will form an insulating later on one or both of the electrodes. One way to
eliminate the bubbles is to tap the probe. Another way is to increase the speed of the
magnetic stirrer to allow more solution to flow through the probe.
If time is limited, prepare the solutions before the period begins.
Data Table
Solution percent change/ °C at 25 °C
0.1% NaCl (1000 ppm) 2.1
0.4% NaCl (4000 ppm) 2.0
0.005 M NaOH (1000 ppm) 1.9
Data Analysis
The table lists typical experimental results. In general, ionic salts at low to moderate
concentrations have a temperature dependence of 2% per degree at 25 °C. Acids,
bases, and concentrated salt solutions have somewhat lower values, typically 1.5%
per °C. In contrast, ultra pure water has a much larger value; 5.2% per °C.
Questions
1. The conductivity increases linearly with temperature over the observed temperature range.
2. The slopes are approximately equal for all the solutions.
3. Temperature, concentration, and solubility will affect the conductivity of a solu-
tion.
9
Page 10

®
Salinity Sensor Notes on the Experiment
10
 Loading...