

Page 1
Instruction Manual
GPS Position Sensor
PS-2175
012-09919A
®
Page 2

GPS Position S ensor Table of Contents
Contents
Introduction . . . . . . . . . . . . . . . . . . . . . . . . . . . . . . . . . . . . . . . . . . . . . . . . . . . . . . . . . . . 3
Theory of Operation . . . . . . . . . . . . . . . . . . . . . . . . . . . . . . . . . . . . . . . . . . . . . . . . . . . . 4
Sensor Set-up . . . . . . . . . . . . . . . . . . . . . . . . . . . . . . . . . . . . . . . . . . . . . . . . . . . . . . . . . 4
Modes . . . . . . . . . . . . . . . . . . . . . . . . . . . . . . . . . . . . . . . . . . . . . . . . . . . . . . . . . . . . . . . 5
Sensor Data . . . . . . . . . . . . . . . . . . . . . . . . . . . . . . . . . . . . . . . . . . . . . . . . . . . . . . . . . .6
Data Collection . . . . . . . . . . . . . . . . . . . . . . . . . . . . . . . . . . . . . . . . . . . . . . . . . . . . . . . .6
Typical GLX Procedures . . . . . . . . . . . . . . . . . . . . . . . . . . . . . . . . . . . . . . . . . . . . . . . . . 7
Transfer Data to DataStudio . . . . . . . . . . . . . . . . . . . . . . . . . . . . . . . . . . . . . . . . . . . . . . 8
Plot Data in
My World GIS
(example) . . . . . . . . . . . . . . . . . . . . . . . . . . . . . . . . . . . . . . . 9
Using the Position Sensor with Other Interfaces . . . . . . . . . . . . . . . . . . . . . . . . . . . . . 10
Specifications . . . . . . . . . . . . . . . . . . . . . . . . . . . . . . . . . . . . . . . . . . . . . . . . . . . . . . . . 11
Technical Support . . . . . . . . . . . . . . . . . . . . . . . . . . . . . . . . . . . . . . . . . . . . . . . . . . . . . 11
Page 3
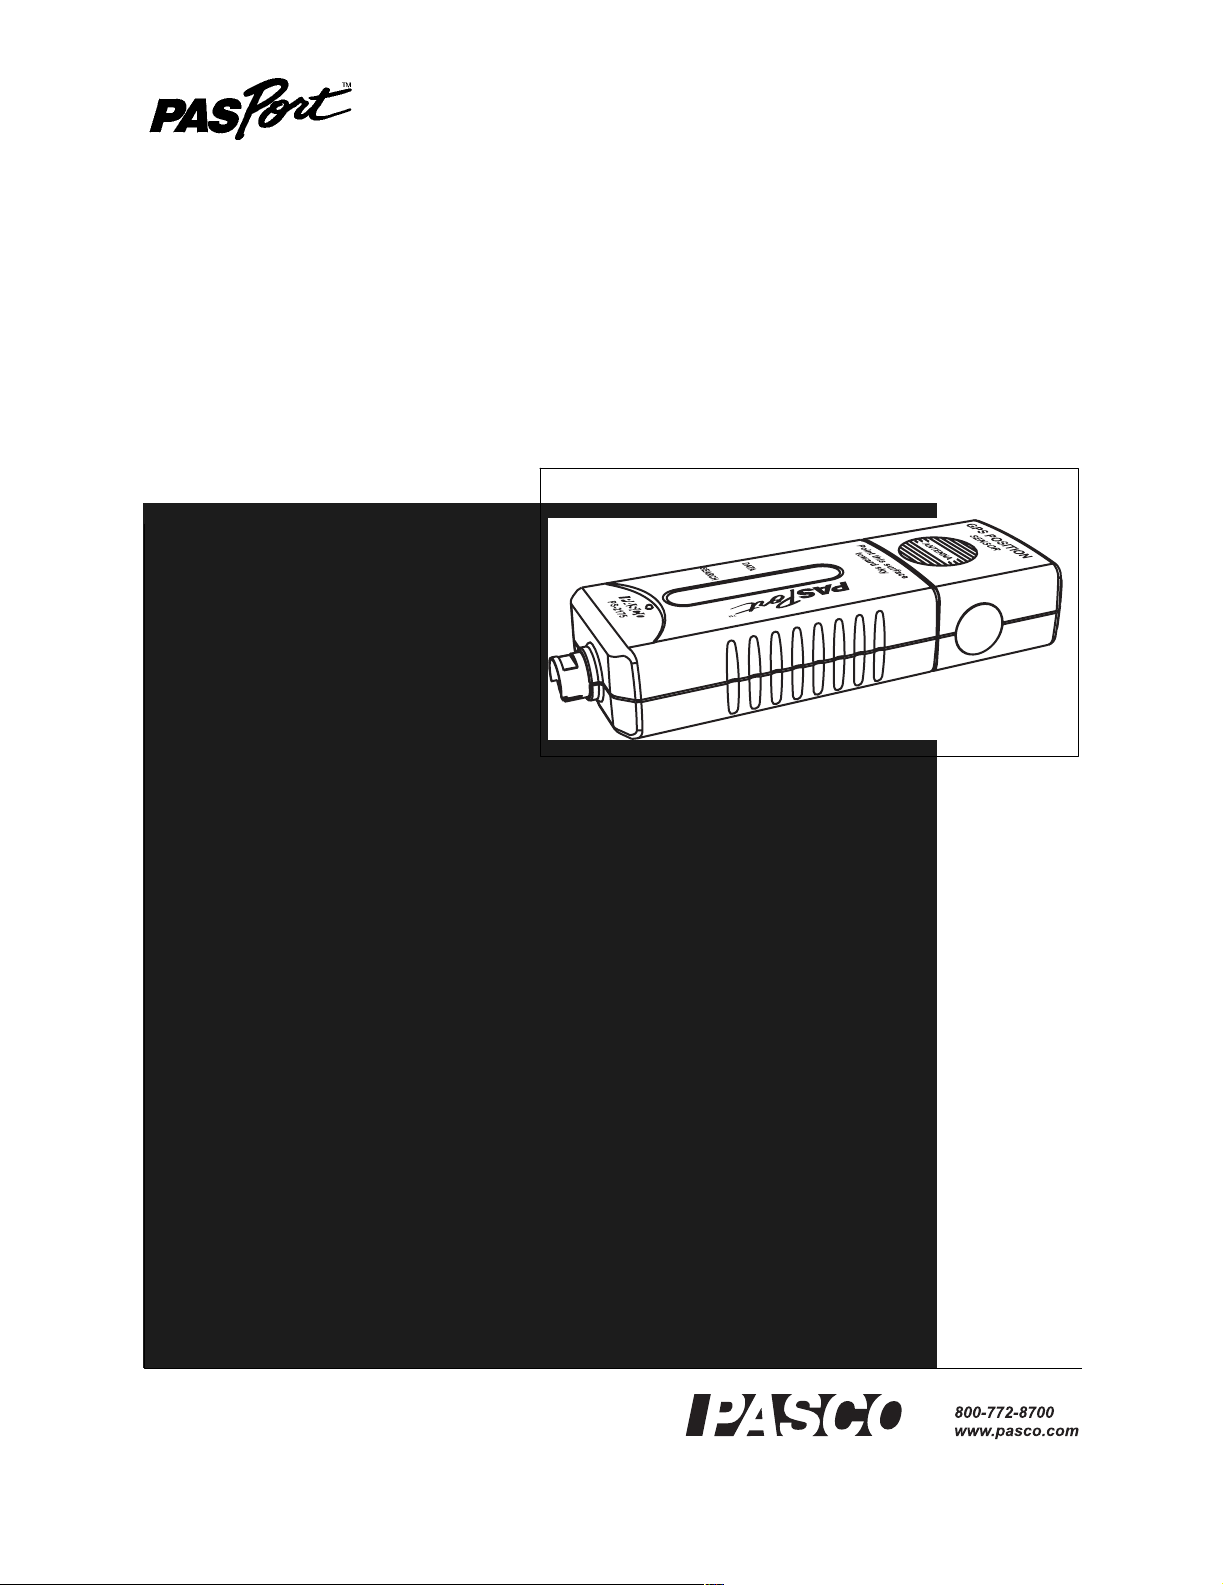
GPS Position Sensor
PS-2175
Included Equipment Part Number
GPS Position Sensor PS-2175
PASPORT Extension Cable PS-2500
Required Equipment
Xplorer GLX
or other PASPORT Interface
1
See PASCO catalog or www.pasco.com
Recommended Equipment
USB Flash Drive
My Worl d GIS
2
PS-2551 or similar
software See PASCO catalog or
www.pasco.com/myworld/
1
PASPORT interfaces include the Xplorer GLX (PS-2002), Xplorer (PS-2000), AirLink (PS-2005),
PowerLink (PS-2001), and USB Link (PS-2100)
2
For transferring data from Xplorer GLX to My World GIS software.
Introduction
The PASPORT GPS Position Sensor uses signals received from the Global Positioning System to determine its
latitude, longitude, altitude and horizontal velocity anywhere on earth. Use it al one or in conjunc tion with other
sensors for outdoor experiments in environmental science, physics, and other subjects.
Data from the GPS Position Sensor is relayed to a PASPORT inte rface such as the Xplorer GLX. You can view
and analyze the data on the GLX, or transfer it to a computer running DataStudio or My W orld GIS.
The Pos i ti o n S e nsor is co mpatib le wi th all PASPORT interf ac e s , bu t is most easily used with th e X p lo r er G L X .
The instructions in this manual assume that you are using an Xplorer GLX. See page 10 for additional information on using othe r interfaces.
®
3
Page 4
GPS Position S ensor Theory of Operation
Theory of Operation
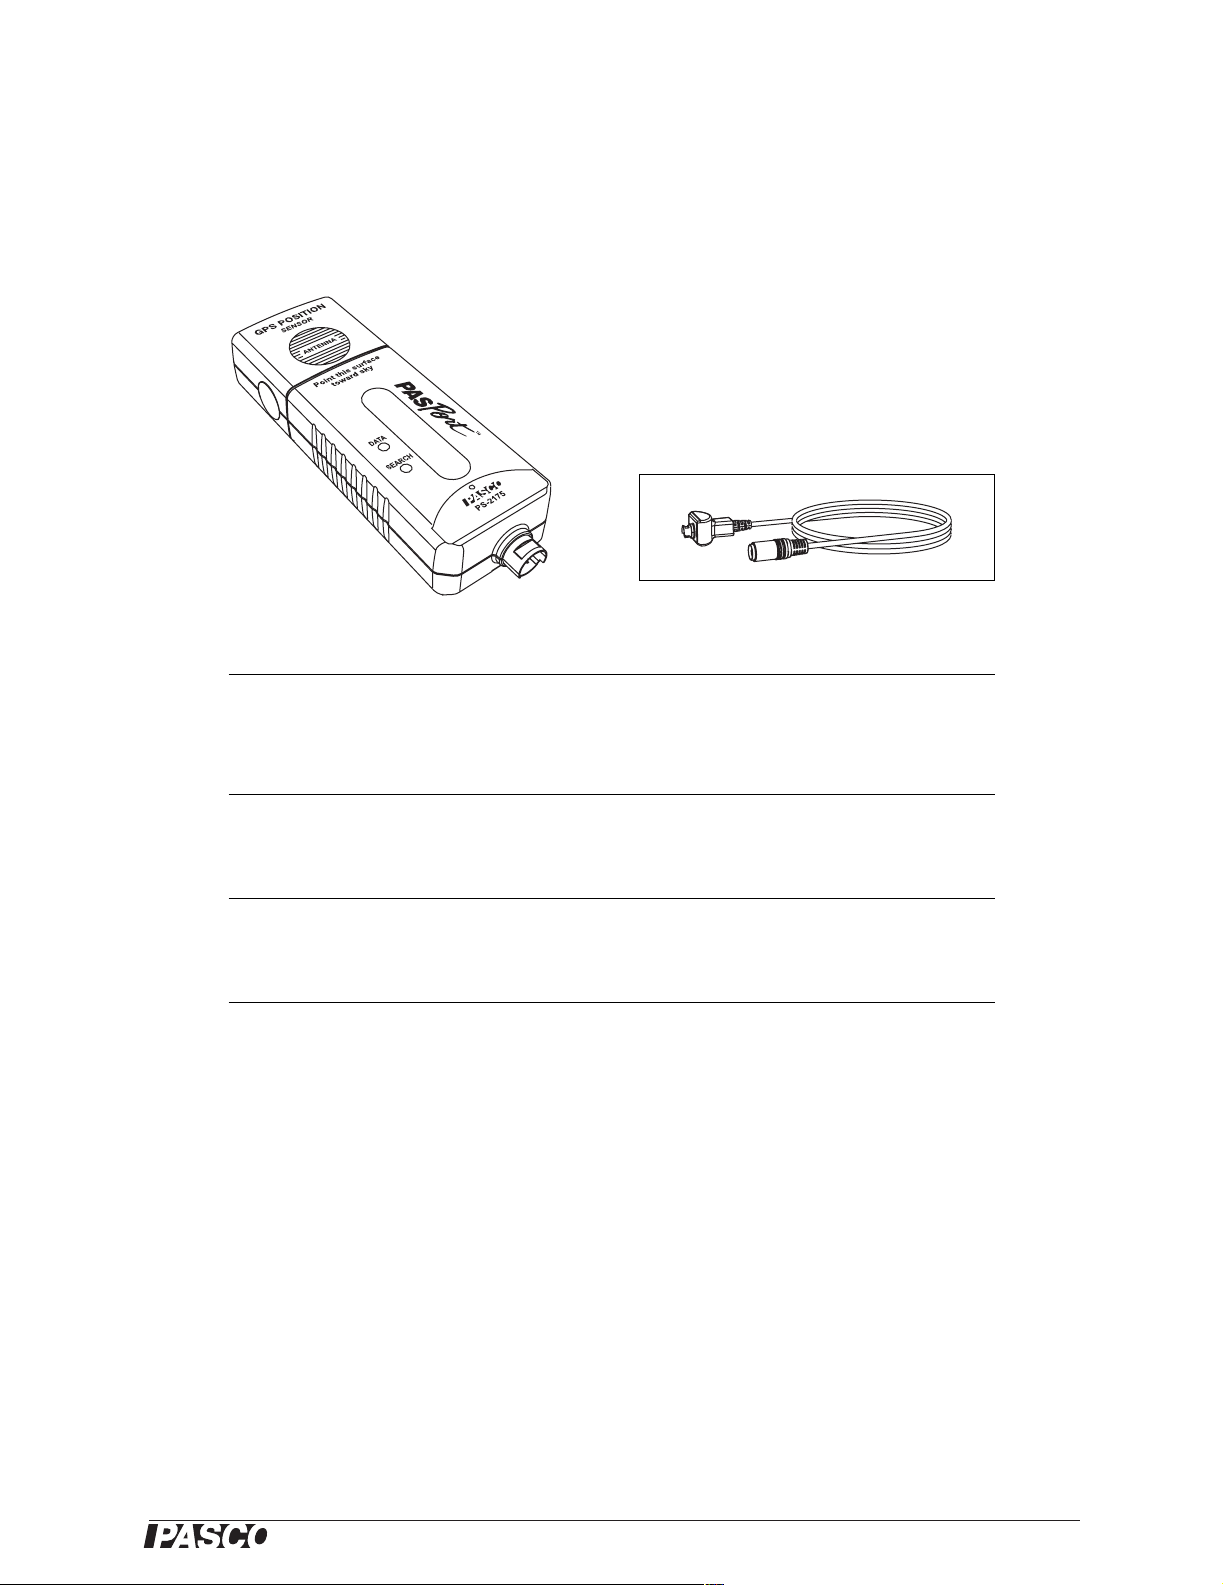
GPS stands for Global Positioning System. This system is maintained by the
U.S. government for u se by people anywhe re on e arth. The syste m con sists of
more than 24 satellites orbiting at an altitude of about 20000 km. The satellites broad cast ranging signals and necessary data for the Position Sensor to
determine its own position and velocity. The Position Sensor only receives
data from th e satellites; it does not transmit any signal.
To determine its position, the sensor must receive data from at least thre e satellites. When the sensor is first po wer ed on, it searches the sky for available
satellites. This process typically ta kes between 30 seconds and 2 minutes.
Once satel lites have been identified, the sensor actively tracks them and
acquire s ne w sa tellites as they come into view.
The Position Senso r performs best outdoors wit h a clear view of the sky.
Sensor Set-up
up
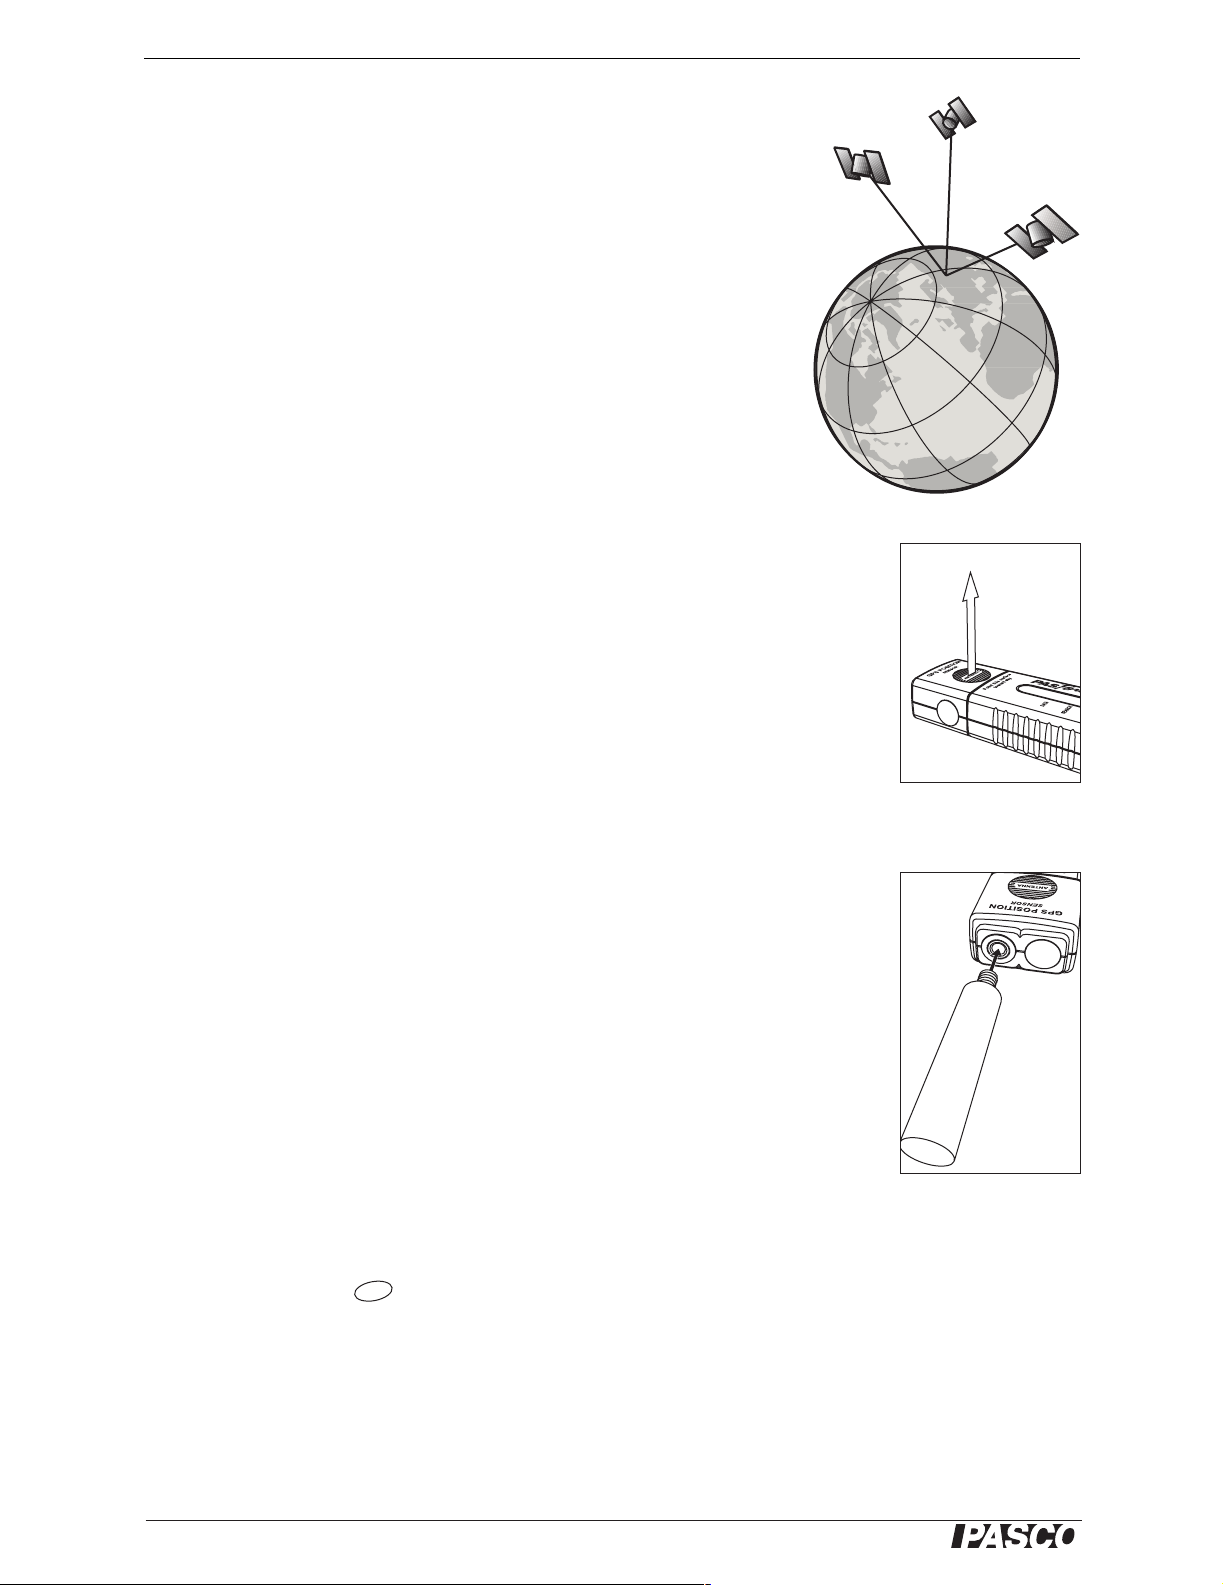
Orientation and Positioning
It is importa nt to or ient t he sensor pr oper ly to re ceive sign al s from sa tell it es overhe ad,
especi al ly d uri n g initial search mode (when the red
SEARCH indicator is blinking).
The antenna detects signals th rough the labeled side of the sensor. Hold the sensor
with the labeled side approximately horizontal and facing the sky. Do no cover the
marked antenna area.
If the sensor is connected directly to the Xplore r GLX (without a cable), connect it to
channel 1 or 2 (not 3 or 4) and hold the GLX horizontally.
A 1/4-20 th rea ded insert is provided for attachment of a mounting rod or thumbscrew
as illustrated.
Interface set-up
The P o si tion S ensor wo rk s be st w ith GL X firmw ar e v er si on 1.40 or lat er. Visit www.pasco. co m/ glx
to download the newest firmware.
Before taking the GLX outdoors, leave it connected to AC power for several hours to ensure that
the battery is fully charged.
1. Plug the Position Sensor directly into channel 1 or 2 of the Xplorer GLX, or use
the included cable to connect it to any channel.
2. Press and hold the power button to turn on the GLX. The GLX automatically
detects the s ens or and opens the Digits display showing Latitude and Longitud e
measurements.
Orientation fo r
search
Optional mounting rod
attachment
initial
mode
3. (Optional) Pre ss to see all eight of the se nsor’s primary measurements.
F4
If you plan to use other sensors to collect data alongside GPS data, connect them to
other ports of the GLX.
4
®
Page 5

Model No. PS-217 5 Modes
Modes
LED indicator lights in the GPS Position Sensor tell you whether or not the sensor is
ready to make measure ments. If you see the green
If you see the red
SEARCH indicator (or both green and red), the sensor is not ready.
DATA indicator, the sensor is ready.
At initial power on, the sensor enters initial search mode, in which it searches the sky
for available satellites. Initial search mode typically lasts between 30 seconds and 2
minutes. In initial search mode, the red
SEARCH indicator flashes.
When the sens or is actively tracking three or more satellites, it switches to GPS valid
mode. In this mode, the se nsor continuously updates its position and velocity measurements. In GPS valid mode, the green
DATA indicator glows steadily.
If the sensor cannot tra ck at least thre e sate ll ites , it e nters GPS lo st mode. In this mode
it continue s to repo rt its most re cent posit ion measureme nts. Us e this “s tale ” data with
caution ; it is incorrect if the sens or has moved since its last valid measurement. In
GPS lost mo de, both indicators flash.
Trackin g fe w er th an
three satelli te s
Initial se arc h
mode
Tracking three or
more satellites
GPS valid
mode
LED
Indicators
GPS POSITION
Point this surface
toward sky
DATA
SEARCH
GPS lost
mode
SENSOR
ANTENNA
PS-2175
Table 1: Modes
Mode LED Indicators Reporte d Data
Initial search
GPS valid
GPS lost
Data: off
Search: flashing (red )
Data: on (green)
Search: off
Data: flashin g ( gree n)
Search: flashing (red )
Latitude: 0.0
Longit ude: 0.0
Latitude: valid
Longit ude: valid
Latitude: last valid report
Longitude: last valid report
Track in g t hre e or
more satelli te s
Satellite
count Note
0 No posit io n avail abl e
≥ 3 Good positions available
Stale positions available,
0
use with caution
®
5
Page 6

GPS Position Sen sor Sensor Da ta
Sensor Data
The sensor simultaneously reports several different measurements. When the GLX
recor d s data, it records all of these measurements, even if they are not displayed. The
measurements are described in Table 2.
Tabl e 2: Measurements
Measurement
Lati tude ±90.00 0000° 0.000 001° (~2 m)
Longitude ±180.000000° 0.000001° (~2 m) -121.316544°
Altitude 0 to 1800 0 m 1 m 34 m
Horizontal speed 0 to 515.00 m/s 0.01 m/s 1.07 m/s
Course over ground 0 to 360° 0.01° North: 0°
Satellite Count 0 to 20 1 Number of satellites that the Position Sensor
Latitude Relative ±10000 m ~0.2 m Relative displacement from location at the
Longitude Relative ±10000 m ~0.2 m 1.8
Latitude Minutes 0 to 60.0000' 0.0001' (~0.2 m)
Longi tude Minutes 0 to 60.0000' 0.0001' (~0.2 m) -18.9935'
1
See specifications on page 11 for accuracy information .
2
Examp le data acquired at 38° 48.2271´ north latitude, 121° 18.9935´ west longitude, walking north-northeast.
1
Range Resolution Notes Example
Global position appropriate for
other mapping applications
East: 90°
South: 180°
West: 270°
Reliable when the Position Sensor is moving
is actively tracking
start of data recording; origin is reset each
time a new data run starts
Minutes within the current degree
My World
and
38.803772°
24.74°
5
2.3
48.2271'
2
Data Collection
Whenever it is powere d on, the Position Sensor continuously receives (or att empts to
receive) data from GPS satellites, even if data is not being rec orded by the GLX. The
sensor uses the sate llite data to calculate latitude, longitude, and the other quantities
listed in Table 2 . These measurements are reported to the GLX.
If the sensor is not actively tracking satellites, it still reports data to the GLX. Use this
data with caution. In initial se arch mode (flashing red), it reports latitude and longi-
tude value s of zero. In GPS lost mode (flashing red and green), it reports the las t valid
measurements.
To r ecor d dat a:
1. Press on the GLX. By default, the GLX records data at its maximum rate of
once per second and displays Latitude and Longitude (in decimal degrees) in the
Digits display.
2. To stop recording, press again.
To record another run of data, repeat steps 1 and 2.
If you want to observe your current position without recording data, the steps above are not nec essary. The Digits display always displays a live reading.
6
®
Page 7

Model No. PS-2175 Typical GLX Procedure s
Typical GLX Procedures
For complete instructions on using the GLX to collect, display, and analyze data, refer to the
Xplorer GLX Users’ Guide.
Display Relative Displacement in a Graph
The Latitude Relative and Longitude Relative measurements are the north-south
and east-west displa cement s (in mete rs) from your st arting poi nt. The starting point is
reset every ti me you star t data recor ding . Follow the se st eps t o pl ot Latitude Rel ative
versus Longitude Relative.
1. Press , to open the Graph display.
F1
By default, the Gr aph ap pears with Latitude versus time.
2. Press .
The Graph’s active areas light up with Latitude highlighted.
3. Press to open the data source menu. Use the arrow keys to highlight
Latitude Relative. Press .
4. Press to light up the Graph’s active areas again.
5. Press the down arrow key to highlight time.
6. Press to open the data source menu. Use the arrow keys to highlight
Longitude Relative. Press .
Display Data in Degrees and Minutes
Follow the se ste ps to di splay Lati tude a nd Longi tud e in de grees and min ute s wit h “N”
or “S” to indi ca te north or sout h of t he equ ator an d “E” o r “W” to i ndi cate east or we st
of the prim e meridian.
Relative displacement
graph
1. In the Digits display, press to light up the active areas.
2. Use the arrow keys to highlight Latitude.
3. Press to open the data source menu. Use the arrow keys to highlight Data
Properties. Press .
The Data Properties box opens.
4. Use the down arrow key to highlight Numeric Style.
5. Press to open the m enu. Use the ar row ke ys to hi ghlight NSEW 00 0°00.000.
Press .
6. Press (OK).
F1
7. Repeat steps 1 through 6 for Longitude.
®
Position displayed in
default style (top)
and in deg rees and
minutes (bottom)
7
Page 8

GPS Position Sensor Transfer Data to DataStudio
Change the Sampling Rate
By default, the GLX r ecords data from the Posit ion Se nsor once every s econd. Fol low
these steps to select a longer time between samples.
1. Press , to o p en the Sensors scre en .
F4
2. Use the left and right a rrow keys to selec t the GPS Posit ion Sensor icon at the top
of the screen.
3. Press the down arro w key t o highlig ht Sampl e Rate Unit. For sam ple rates faster
than once every 60 s, leave this setting on seconds. Otherwise, press to o pen
the menu, use the arrow keys to highlight minutes or hours, and press .
4. Press the down arrow key to highlight Sample Rate. Press and to set
+
the time between sampl es (ranging from 1 s to 4 hours).
Collect Data in Manual Sampling Mode
In manual sampling mode, you trigger the recording of each data point by pressing a
key. This mode is useful for making a series of “spot measuremen ts” instead o f a continuous recording.
1. Press , to o p en the Sensors scre en .
2. Press to open the Mode menu. Use the down arrow key to highlight
Manual. Press . The Data Properties windo w opens.
3. Press (No Data). (This step configures the GLX to acquire sensor data
without prompting you to enter keyboard data.)
F4
F1
F2
4. Open a Graph, Table, or other display of your choice.
5. Press to start the data run.
6. Go to the location where you will record a data point.
7. Press to record a single data poin t from the Pos ition Sensor (and any other
connected sensors).
8. Repeat steps 6 and 7 to record mo re data points.
9. After you have recorded every da ta point, press to end the data run.
Transfer Data to DataStudio
Follow these st eps to transfer recorded data to DataStudio for display and analysis on
your computer.
1. After coll ectin g dat a, use the ca ble incl uded with the GL X to con nect the GLX to
the USB port of a c omputer with DataStudio installed. DataStud io will launch
automatical ly and open the Fil e Manager window. Y ou wil l find the dat a that you
just collected in the RAM folder under the filename “untitl ed” or “untitled (2)”,
“untitled (3)”, etc.
2. Click this data file once to select it; then click OK to transfer the file to
DataStudio and open it.
8
®
Page 9

Model No. PS-2175 Plot Data in M y World GIS (exa mple)
Plot Data in
My Wo rld GIS
(example)
Once you have collec ted data on the GLX with the GPS Positi on Sensor and other
sensors, you can import it into My World software to be plotted on a map or aerial
photograph and combined with other datasets. This procedure r equires a USB flash
drive and a computer with My World installe d .
In this ex ample you will use the temperature probe included with the Xplorer GLX to
record tempera ture a longs ide GPS data. You can use a si milar proc ed ure to re cord a nd
plot measurements from other sensor s such as humidity, pH, or light intensity.
I. Acquire Data
1. Connect the Pos ition Sensor to the GLX.
2. Connect a temperature probe to temperature port 1 or 2 on the left side of the
GLX.
3. Turn on the GLX (if it is not al ready on).
4. Take the GLX outdoors.
5. Wait for the sensor to enter GLX valid mode (green
DATA indicator glowing).
6. Press to start recording data.
7. Go for a short walk. Remember to hold the Position Sensor with the label faci ng
the sky. Walk thro ugh a variety of areas where the temperature is likely to vary
due to proximity to buildings, vegetation, or bodies of water.
8. Press to stop recording.
II. Transfer Data to
My World
1. Connect a USB flash drive to the USB port on the right side of the GLX.
2. Press , to open the Table display.
3. Press to open the T abl es menu. Use the arro w keys to highli ght Export All
F2
F4
Data. Press . The Export All Data box opens.
4. Press (Add All).
F4
5. Note the Export File Name. (You can edit it if you wish.)
6. Press (OK). A tab-delim ited text file containing your data is saved on the
F1
USB flash drive. The mes sage “Data export is co mpl ete” appears on the GLX.
USB Flash Drive
7. Remove the flash dr ive from the GLX.
8. Connect the fla sh drive to your computer.
9. Launch My World.
10. In My World, open the File menu and sel ect Import Lay er from File. Navigate
to the USB flash drive and open the file that you saved in step 6.
®
9
Page 10

GPS Posi tion Sensor Using the Pos ition Sensor with O ther Interfaces
The Imp o r t Text Data window appears.
11. Change the Begin Impor t in g on Lin e setting to 2.
12. Click OK. The Save Imported Data As window appears.
13. Type the filename Temperature Walk.tsv. Click Save. This new dataset,
Temperature W a lk, appears in the Data Library on the left sid e of your screen.
III. Plot Data
1. Drag Temperature Walk from the D ata Library to the Layer List.
2. Click the Visualize tab.
3. In the Layer List, click Temperature Walk to select that dataset.
4. In the Map section, click the Zoom button to zoom i n on the data plot.
A plot of the route that you walked appears in the Map section.
5. In the Layer List, open the Color F ield menu (see right) and select
Temperature.
The plotted points are now color-coded to indicate the temperature measured at each poin t.
• To change the color co ding and other appearance properties, click the Edit
Appearance button.
• T o c ombine your dat a plot with a map, aerial p hoto graph, o r ot her dat asets , ret urn
to the Construct tab and drag the desired dataset fr om th e Data Li brary to the
Data List.
• For more instructions on using My W orld, visit www.pasco.com/myworld/
Using the Pos ition Sensor with Other Interfaces
Xplorer (PS-2000) Connect the Position Sensor the Xplorer either dire ctly or
using th e inc lu d ed cab l e. En su re t hat th er e ar e fr es h ba tter i es in t h e Xpl ore r. Press and
hold the power button to turn on the Xplorer . Press to start recor ding data. Press
again to stop. After you have collec t at least one data run, connect the Xplorer to
a computer running DataStudio to display and analyze the data.
Computer-based PASPORT Interfaces Computer-b a s ed in te r f aces inc lu d e
the AirLink (PS-2005), PowerLink (PS-2001) , and USB Link (PS - 2100). You can
also use the Xpolorer and Xplorer GLX in computer-bas ed mode.
Connect the PASPORT interface to your computer (see in structions included with
your interface). Connect the Position Sensor to interfac e ei ther directly or using the
included ca ble. Start DataStudio. Click Start to start recording data. Click Stop to
stop recording.
10
®
Page 11

Model No. PS-217 5 Specifi cations
Specificat ions
Position accurac y 10 m, 2D RMS
Velocity accuracy 0.1 m/s
Maximum sample rate 1 Hz
Time to first fix (average) 42 s, cold start
Channels 20
5 m, 2D RMS with WAAS enabled
38 s, warm start
1 s, hot start
Technical Support
For assistance with any PASCO product, contact PASCO at:
Address: PASCO scientific
10101 Foothills Blvd.
Roseville , CA 95747-7100
Phone: 916-786-3800 (worldwide)
800-772-8700 (U. S.)
Fax: (916) 786-7565
Web: www.pasco.com
Email: support@pasco.com
Limited Warranty
For a description of the product warranty, see the PASCO cat alog.
Copyright
The PASCO scientific 012-09919A
granted to non-profit educational institutio ns fo r reprod uction of any part of this manual, provi ding the reprod uctions are used only in
their laboratories and classrooms, and are not sold for profit. Reproduction under any other circumstances, without the written consent of PASCO scientific, is prohibited.
Trademarks
PASCO, PASCO sc ientific, DataStudio, PASPORT, Xplorer, and Xplorer GLX are trademarks or registered trademarks of PASCO
scient i fic , in the Un ite d S tat es a nd/o r in oth er coun tr ies . A ll ot he r br a nds , pr o duc ts, or servi ce n ame s are or m ay be tr ad ema rks or service marks of, and are used to identify , products or services of, their respective owners. For more information visit
www.pasco.com/legal.
My Wo rld GIS is a trademark of Northwestern University.
GPS Positi on Se ns or I ns tructi on Man ua l
is copyrighted with all rights reserved. Permission is
®
11
 Loading...