

Page 1
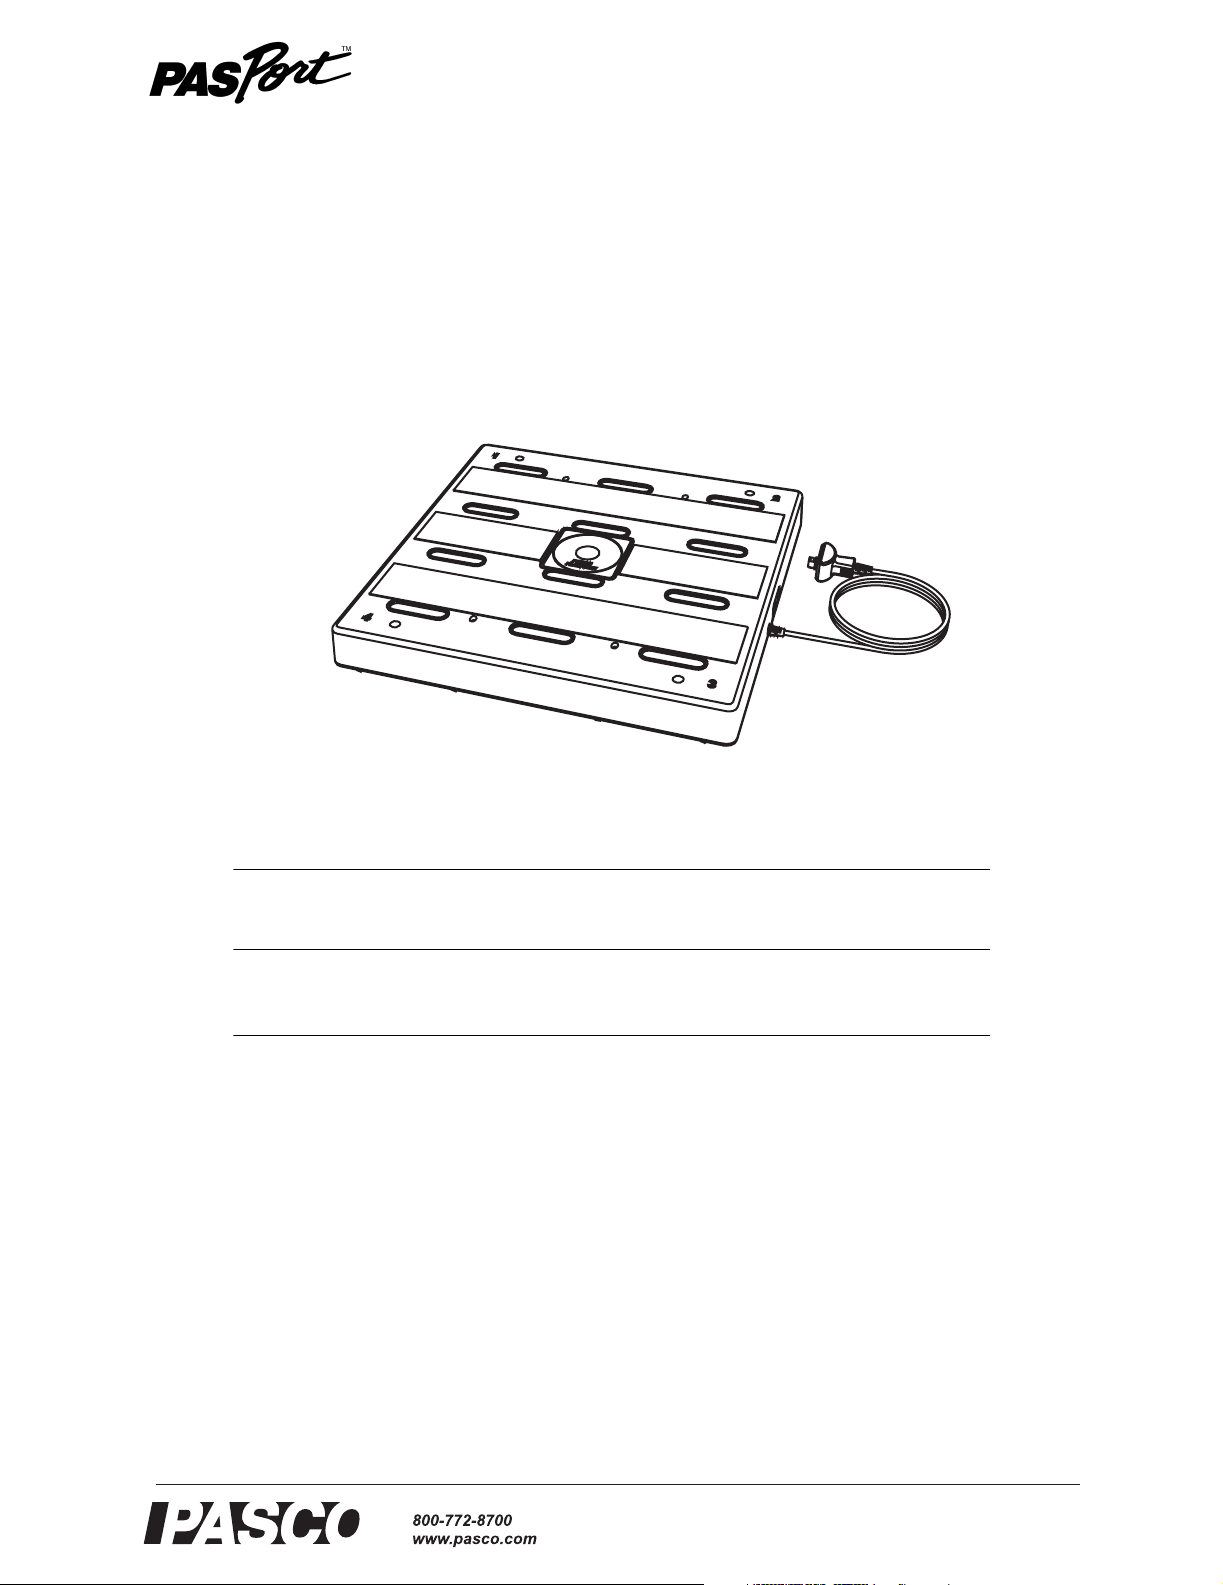
Force Platform
PS-2141
Instruction Manual
012-09118B
Included Equipment Part Number
Force Platform PS-2141
Required Equipment
PASPORT Interface
Optional Equipment
Handle Set PS-2548
1
Compatible PASPORT interfaces include the Powerlink (PS-2001), Xplorer GLX (PS-2002), USB Link
(PS-2100), and others. See the PASCO catalog, visit www.pasco.com, or contact PASCO tech support for
more information. Xplorer (PS-2000) with firmware version 1.14 or earlier is compatible in computer-based
(non-logging) mode.
1
See PASCO catalog or www.pasco.com
Introduction
The PASPORT Force Platform, used with a PASPORT interface, continuously measures force (up to 4400 N or
1000 pounds) applied by a person or object. You can use the Force Platform to measure the static weight of a person standing on it, or the dynamic vertical force involved in moving and jumping. It has the measurement range
and strength to accommodate people of all sizes and the sensitivity to measure smaller forces such as the weight
of a ball. Put the platform on the floor or tabletop to measure vertical force, or mount it on a wall to measure horizontal force. With the optional handle set, you can use the platform to measure both “pulling” and “pushing”
force.
®
Page 2
Force Platform How It Works
How It Works
When an object is placed on the Force Platform, it applies a force normal to the platform's surface; this force is the object's weight. Because the Force Platform does not
move (much), the force applied by the floor to the platform's feet increases by an
amount equal to the object’s weight. Each of the four feet is connected to a beam with
a strain gauge, through which the platform's electronics measure the force. The platform calculates and outputs the sum of these four forces. Force is measured in this
way even if it is not constant, for instance, the force applied by a bouncing ball or
jumping person.
As well as the sum of the forces applied to the four beams, the platform can be set to
output the separate force measured by each beam. See below for instructions on making these measurements visible.
Hardware Setup
On the floor
Place the Force Platform on the floor. It works best on a hard
floor, such as tile or wood, rather than carpet, which would
allow the platform to move slightly when you step on it. If the
floor is not perfectly level, adjust the platform's feet by turning
them to make the platform level and stable. The platform
should have all four feet on the floor, with nothing touching
the flat bottom surface.
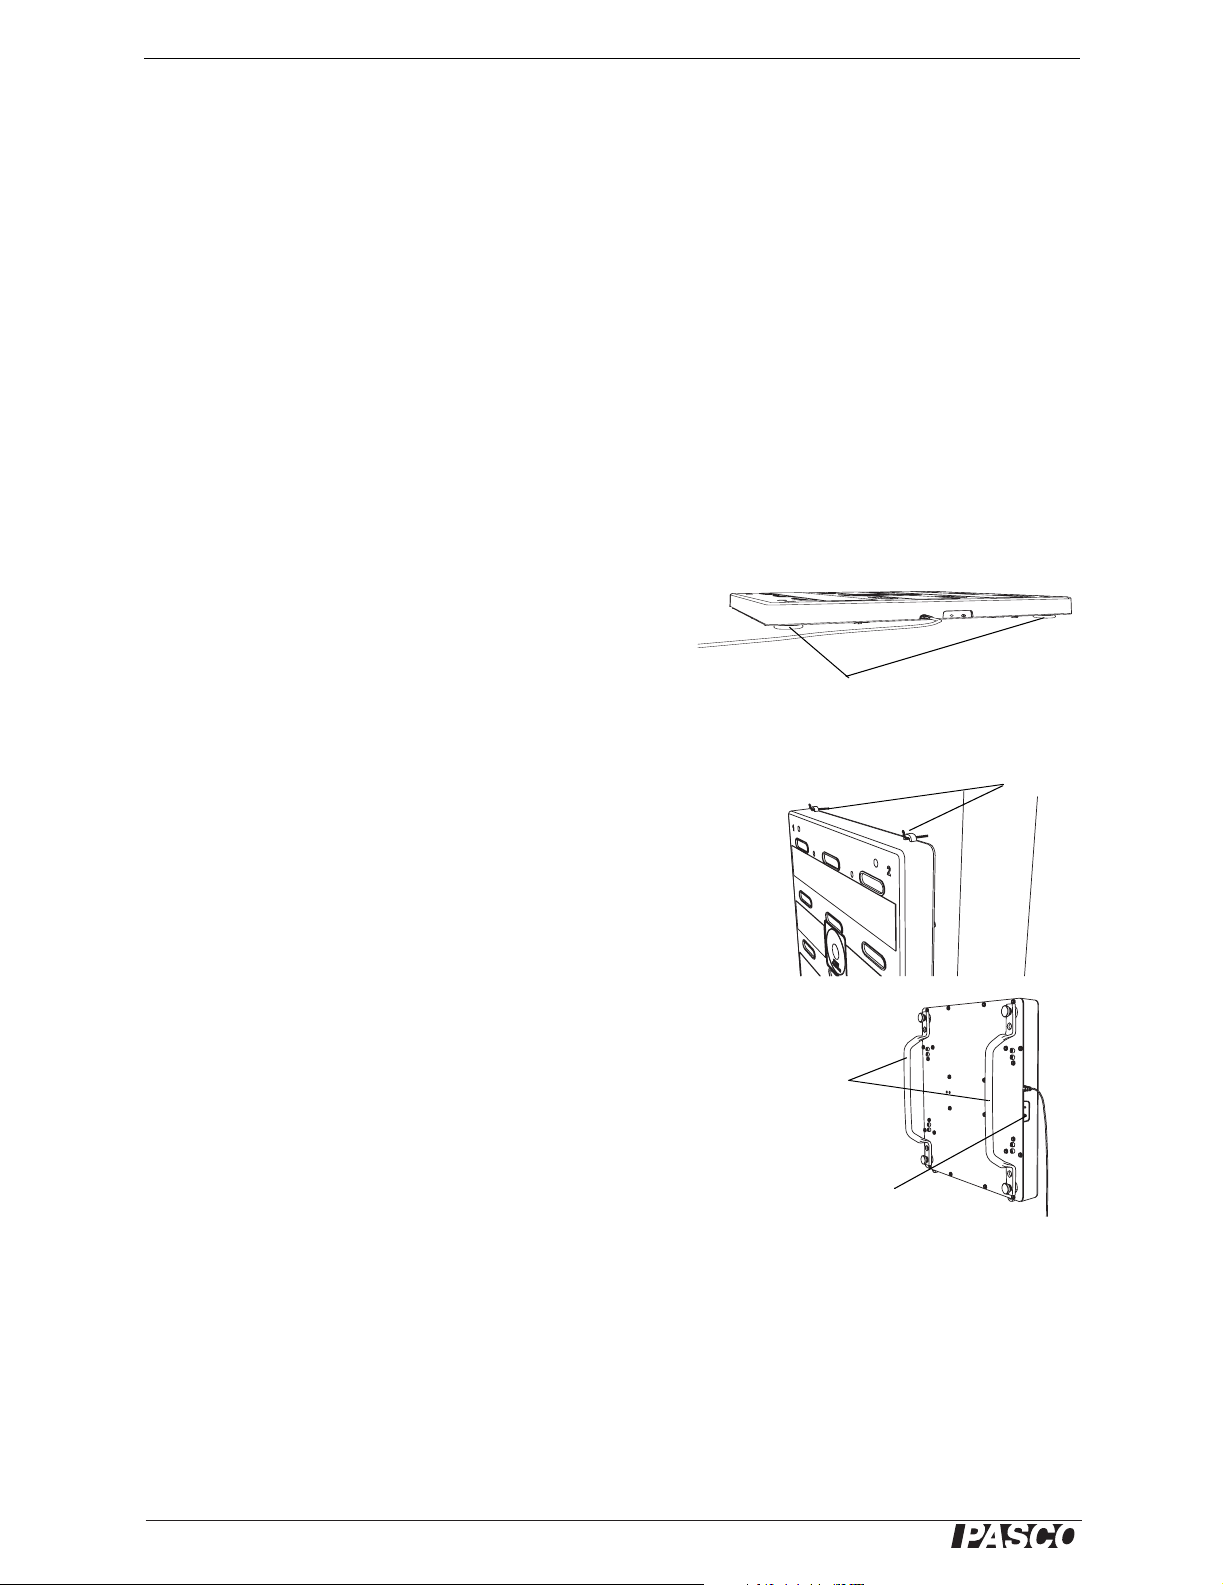
Hang the Force Platform using side tabs
Turn feet to level Force Platform
On a Wall
To measure horizontal force, use the tabs on the side of the
platform to hang it from a pair of bolts or hooks on a wall.
Make sure that all four feet are in stable contact with the wall.
With the Optional Handle Set
Fasten the handles to the threaded brass inserts on the top of
the platform, or remove the feet and fasten the handles to the
bottom of the platform. With the handles, you can hold the
platform against a wall to measure horizontal pushing force. If
you have two platforms with handles (attached to the bottom),
you can demonstrate Newton's third law by pushing the platforms together. Note that the platform measures only the component of force normal to the surface.
Optional handles
attached to bottom of
Force Platform
Interface and Software Setup
Connect the platform's cable to a PASPORT interface. A green LED on the side of the
platform lights to indicate that the unit is powered and ready to take data. Press the
tare button to set the output to zero.
Tare button
Using the Force Platform with DataStudio
If you are using a computer, start DataStudio. Click the Start button to begin data collection. By default, the platform collects data at 10 samples per second and displays it
2
®
Page 3
Model No. PS-2141 Safety
in units of newtons (N). You can change these settings in the Experiment Setup window. (Click the Setup button to open the window.) In the Setup window you can also
make the separate force measurement of each beam visible. For more instructions on
using DataStudio, press F1 to open DataStudio's on-line help.
Using the Force Platform with the Xplorer GLX
If you are using an Xplorer GLX without a computer, press to start data collection. By default, the platform collects data at 10 samples per second and displays it in
units of newtons (N). You can change these settings in the Sensors screen. (From the
Home screen, press to open the Sensors screen.) In the Sensors screen you can
also make the separate force measurement of each beam visible. For more instructions on using the Xplorer GLX, refer to the GLX Users' Guide.
F4
Safety
Teachers: The Force Platform is designed for use by students under the supervision of a
teacher. Ensure that all users understand and follow these guidelines when jumping or stepping on the platform.
• Do not stand on or jump off tables, chairs, or other inappropriate objects.
• Before you jump or step on the platform, be certain that it will not skid or move
and that you will land with your foot or feet entirely on the platform, not hanging
over the edge.
• Use the platform away from objects that may interfere with your movements or
injure you if you fall.
• Follow all other safety rules and guidelines that apply to you.
Suggested Activities
Hang Time
Stand on the platform and jump vertically. Look at a graph of
force versus time to determine your “hang time,” or how much
time you spend in the air. Is you hang time related to how high
you jump? What other factor affect hang time?
For more precise time measurements, use a higher sampling
rate.
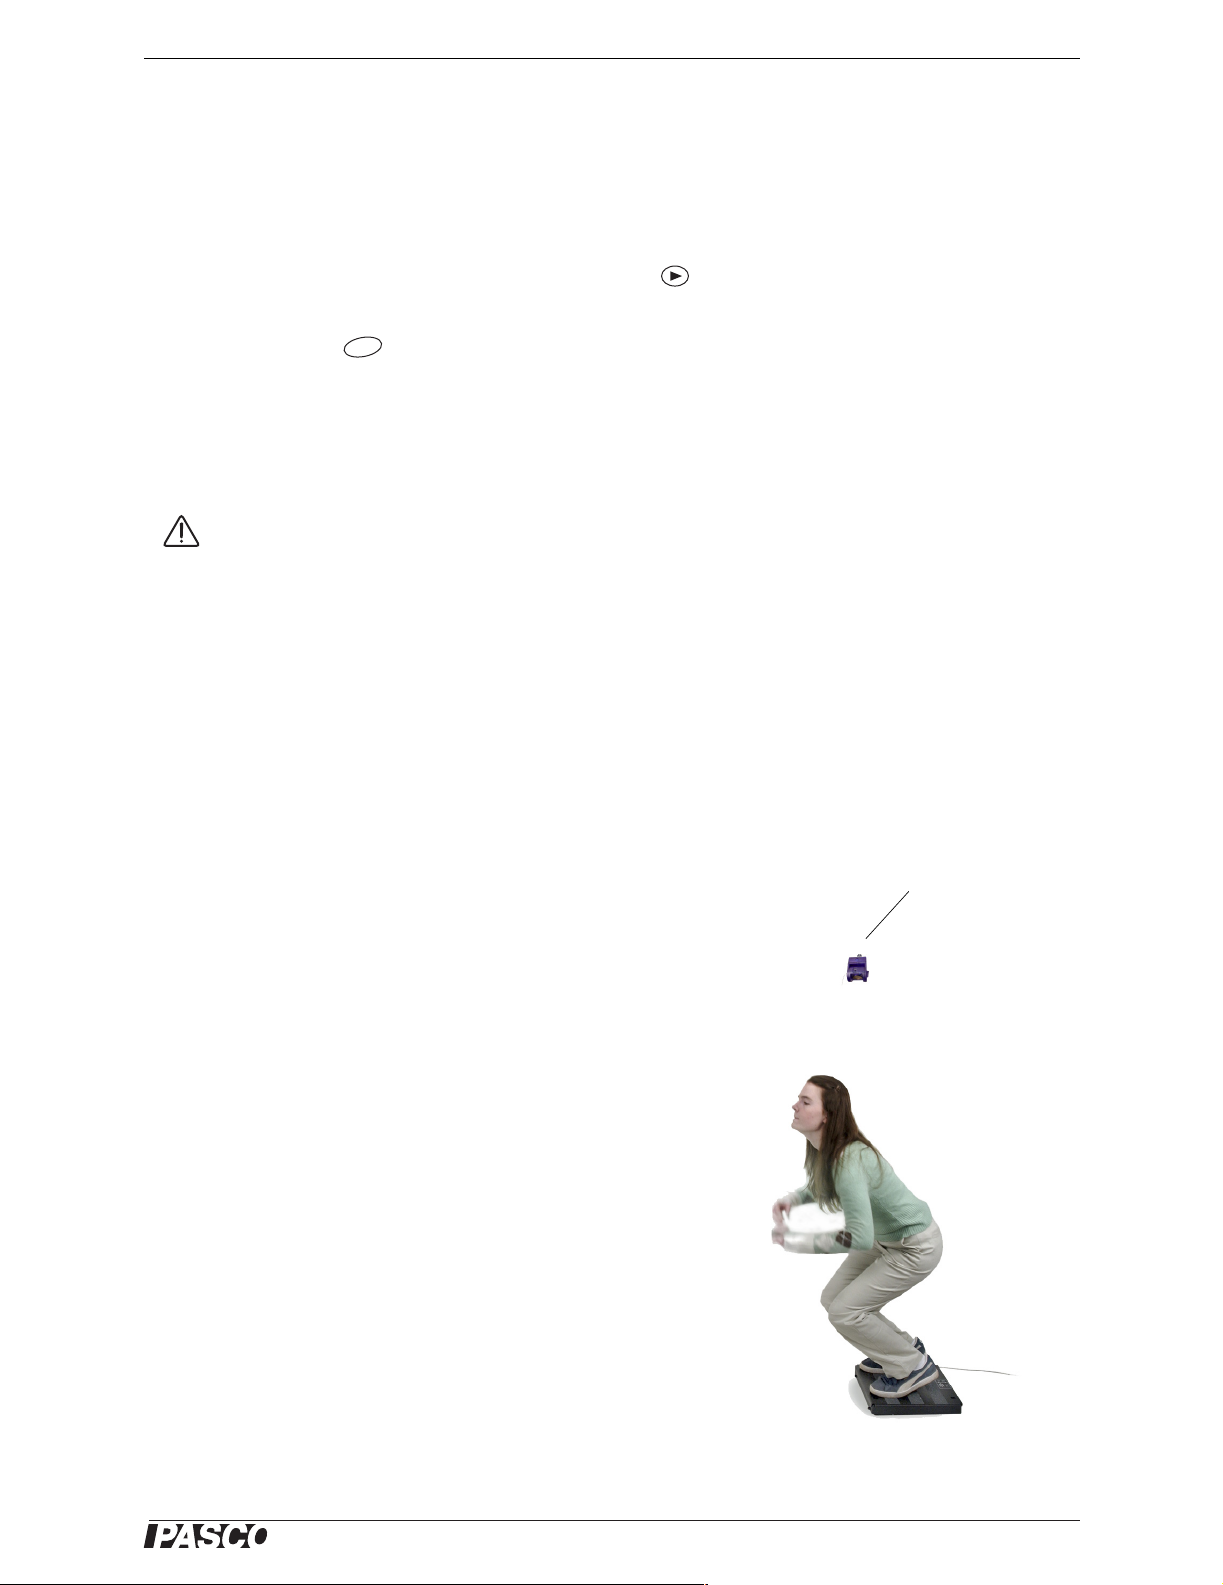
Vertical Impulse
Motion Sensor
Use a motion sensor (PS-2103) to measure the position and
velocity of the top your head as you jump on the platform.
What is your measured vertical velocity at the moment your
feet leave the platform? If you assume that you are a point
mass, does this velocity correspond with your measured hang
time? Why not?
Stand on the platform and press the tare button. Bend your
knees and jump with one smooth motion. The area under the
®
3
Page 4

Force Platform Suggested Activities
force versus time plot is the impulse. How does the impulse of jumping compare to
the impulse of landing? Using the measured impulse, calculate your launch velocity.
Compare the velocity measured by a motion sensor to the velocity calculated from the
impulse. Why are they not necessarily equal?
Horizontal Impulse
Hang the Force Platform on a wall. Press the tare button. Sit on a rolling chair, a
kinesthetics cart (SE-8747), or a hovercraft (ME-9838) and push off against the platform. Measure the impulse, or the area under a plot of force versus time. How is the
impulse related to your momentum immediately after pushing off?
Use a motion sensor (PS- 2103) to measure your velocity as you push off. Use this
velocity to calculate your momentum and compare it to the impulse. (Remember to
take into account the mass of the person and the chair, cart, or hovercraft.)
Force Distribution (With a Single Platform)
On a graph, display the separate force measurements of each of the platform's four
beams. Stand on the platform and slowly shift your weight from your left foot to your
right foot. Slowly shift your weight from your heels to your toes. What happens to the
forces measured at the four corners of the platform? What happens to the sum of these
forces?
Force Distribution (With Two Platforms)
Place two Force Platforms on the floor, and place two parallel boards (as pictured) to
act as a bridge. Press the tare buttons. Place a heavy ball on the boards. Set up a
motion sensor (PS-2103) to measure the position of the ball. While collecting data,
give the ball a push so that it rolls along the boards.
What is the relationship between the position of the ball and the force measured by
each platform? How does the sum of the forces change?
Calculate the changing torques applied to the boards by each platform and the ball as
the ball rolls. How does the sum of the torques change?
4
®
Page 5

Model No. PS-2141 Experiment: Bouncing Ball
Experiment: Bouncing Ball
Required Equipment Part Number
Force Platform PS-2141
PASPORT Interface See PASCO catalog or www.pasco.com
Inflated Rubber Ball
In this experiment you will drop a ball on the Force Platform and allow it to bounce.
In Part 1 you will examine the relationship between the impulse of a single bounce
and the time between bounces. In Part 2, you will observe what happens as the ball
undergoes a series of decreasing bounces and comes to rest on the platform.
Theory
As a ball undergoes a series of bounces on the platform, there are two alternating
phases.
Phase 1: ball in contact with platform
This phase starts when the descending ball makes contact with the platform and ends
when the ball leaves the platform. During this time, the platform applies force (measured by the platform) which causes a change in velocity (
where
V
(a negative value) is the velocity of the ball as it hits the platform and V
down
V
− V
) of the ball,
down
up
(positive) is the velocity as it leaves the platform. The change in momentum (∆P) of
the ball is given by
(eq. 1)
∆PmV
where m is the mass of the ball. By Newton’s Second Law, , the change
–()=
upVdown
FdPdt⁄=
in momentum is equal to the impulse of the collision.
==
∆P impulse Ftd
∫
Thus ∆P is also equal to the area under a force versus time plot.
Phase 2: ball in free fall
The free-fall phase occurs between bounces, when the ball is not in contact with the
platform. (Though it is said to be in free “fall,” the ball travels upwards during the
first half of this phase.) If the ball’s maximum height is less than about a meter, the
frictional air drag is small, and we can assume that the ball undergoes constant acceleration while in free fall.
up
If the ball leaves the platform at time t
= 0, traveling (upwards) with a velocity of V0,
0
we can write
(eq. 2)
where
V is the velocity at some later time t and g = 9.8 m/s
the ball spends in the air between bounces (the “hang time”), then
VV
0
gt–=
2
. If t is equal to time that
V = −V
. In other
0
words, the ball hits the platform at the same speed that it previously left the platform.
Thus,
®
5
Page 6

Force Platform Experiment: Bouncing Ball
1
(eq. 3)
---
V
gt=
0
2
By measuring the hang times before and after a collision, we can calculate the speeds
of the ball just before and just after the collision. (Note that we do not assume these
speeds to be equal.) Using these speeds, we can calculate the change in momentum.
The change in momentum can be compared to the impulse calculated using the area
under the force versus time graph.
Coefficient of Restitution
The coefficient of restitution is the ratio of the ball’s speeds just before and just after a
single bounce (both speeds are measured as positive values). This ratio is the same for
every bounce. You can see the effect of this speed reduction by observing that the
maximum height after each successive bounce decreases. With the Force Platform
you can also observe that the maximum force of each bounce decreases and the time
between bounces decreases.
An ideal ball on an ideal surface would continue bouncing indefinitely, with the maximum height after each bounce approaching zero asymptotically. A real ball eventually stops bouncing, but continues to oscillate for some time while remaining in
contact with the platform before finally coming to rest.
Part 1: Impulse and Momentum
Procedure
1. Set the sample rate of the Force Platform as high as possible (either
1000 Hz or 2000 Hz).
2. Press the tare button.
3. Hold the ball about 0.5 m above the platform. Start data collection and
drop the ball. Allow the ball to bounce three times. Stop data collection.
The ball should hit the platform close to the center at every bounce. If it
does not, delete the data and try again.
Analysis
1. Measure the hang time between the first and second bounces (t
2. Calculate the velocity of the ball just before the second bounce.
1
V
down
---
–=
gt
before
2
before
).
3. Measure the hang time between the second and third bounces (t
4. Calculate the velocity of the ball just after the second bounce.
1
---
V
=
gt
up
after
2
6
after
).
®
Page 7

Model No. PS-2141 Experiment: Bouncing Ball
5. Set the sample rate of the platform to 5 Hz. Press the tare button. Place the ball on
the platform and collect data for a few second. Use the measured force to calculate the mass of the ball (m).
6. Calculate the change in momentum of the ball:
∆Pm
VupV
–()=
down
If the ball left the platform slower than it hit, why is ∆P positive?
7. On the graph of force versus time, zoom in on the second bounce. Measure the
area under the curve over the time interval starting when the ball touches the platform and ending when it leaves the platform; this is the impulse. Compare this
value to your answer from step 6.
Part 2: Coefficient of Restitution
Procedure
Repeat the procedure from Part 1, but this time drop the ball from a lower height and
allow it to continue bouncing until is comes to rest on the platform. You will probably
have to try several times.
Analysis
1. What is the maximum force measured during the first bounce? How does it compare to the weight of the ball? What is the force measured between bounces when
the ball is in the air?
2. Notice that the maximum force of each bounce is less than the preceding bounce.
Find an simple equation that approximately models this decrease over the entire
series of bounces.
3. At some point on the graph, the ball stops bouncing off the platform but continues to oscillate while remaining in contact with the platform. How can you identify this point?
4. Zoom in on the area of the graph where the ball is oscillating but not bouncing.
Describe what happens to the minimum force measured for each cycle of oscillation as the ball comes to rest.
5. What is the final force measured after the ball has come to rest on the platform?
How is this force related to the ball’s mass?
Further Study
1. Measure the hang times between several successive bounces and record them in a
table. Use Equation 3 to calculate the launch speed of the ball after every bounce.
(Assume that the launch speed after a bounce is equal to the impact speed before
the next bounce.) Make a graph of these speeds and use an exponential curve fit
to find the coefficient of restitution.
2. Measure the impulses of two or more bounces. Can you find the coefficient of
restitution using only the impulse data? (Hint: for any single bounce, show that
∆P is proportional to the impact speed.)
®
7
Page 8

Force Platform Experiment: Bouncing Ball
Sample Data and Teachers’ Notes
Part 1
The ball is allowed to bounce three times. Before the second
bounce, the hang time is 0.832 s.
V
down
1
---
–
gt
before
2
1
---
9.81 m/s
()0.832 s()–4.08– m/s== =
2
2
After the second bounce, the hang time is 0.730 s.
1
---
V
up
gt
after
2
1
---
()0.730 s()3.58 m/s== =
9.81 m/s
2
2
The weight of the ball is 5.74 N; thus m = 0.585 kg, and
VupV
∆Pm
–()=
down
0.585 kg()3.58 m/s 4.08 m/s+()4.48 N·s==
For the second bounce, the impulse determined from area under the force versus time
plot is 4.54 N·s, about 1% deviation from ∆P calculated above.
The area under the curve is an approximate measure of impulse, since the graph shows only the
force exerted by the platform, not the net force on the ball (which includes gravitational force). A
more correct measure of impulse can be obtained by taring the platform with the ball resting on it
so that the measured force equals the net force on the ball; however this would make little practical difference.
Part 2
In this case, the maximum force is about 40 times the weight
of the ball (results will vary with the type of ball and its initial
height). The measured force is zero when the ball is in the air.
The maximum force of the bounces decays exponentially.
After the balls stops bouncing, the ball oscillates on the platform. At first, the minimum force goes almost down to zero,
indicating that the ball is almost bouncing off the platform. As
the amplitude decreases, the minimum of each cycle
approaches the static weight of the ball.
When the ball has come to rest, the measured force is its
weight, equal to mg.
8
®
Page 9

Model No. PS-2141 Specifications
Specifications
Range −1100 N to +4400 N (−250 pounds to +1000 pounds)
Resolution 0.1 N
Maximum Sampling Rate 2000 Hz with Xplorer GLX, 1000 Hz with other PASPORT interfaces
Zero (Tare) Function Push Button
Platform Size 35 cm × 35 cm
Mass 4 kg
Force Overload Protection Up to 6600 N (1500 pounds; 1700 N or 375 pounds per beam)
Technical Support
For assistance with any PASCO product, contact PASCO at:
Address: PASCO scientific
10101 Foothills Blvd.
Roseville, CA 95747-7100
Phone: 916-786-3800 (worldwide)
800-772-8700 (U.S.)
Fax: (916) 786-3292
Web: www.pasco.com
Email: support@pasco.com
Limited Warranty
For a description of the product warranty, see the PASCO catalog.
Copyright
The PASCO scientific 012-09118B
non-profit educational institutions for reproduction of any part of this manual, providing the reproductions are used only in their laboratories and classrooms, and are not sold for profit. Reproduction under any other circumstances, without the written consent of PASC O
scientific, is prohibited.
Trademarks
PASCO, PASCO scientific, DataStudio, PASPORT, Xplorer and Xplorer GLX are trademarks or registered trademarks of PASCO scientific, in the United States and/or in other countries. All other brands, products, or service names are or may be trademarks or service marks of, and are used to identify, products or services of, their respective owners. For more information visit
www.pasco.com/legal.
Force Platform Instruction Manual
is copyrighted with all rights reserved. Permission is granted to
®
9
 Loading...