

Page 1
Experiment Guide
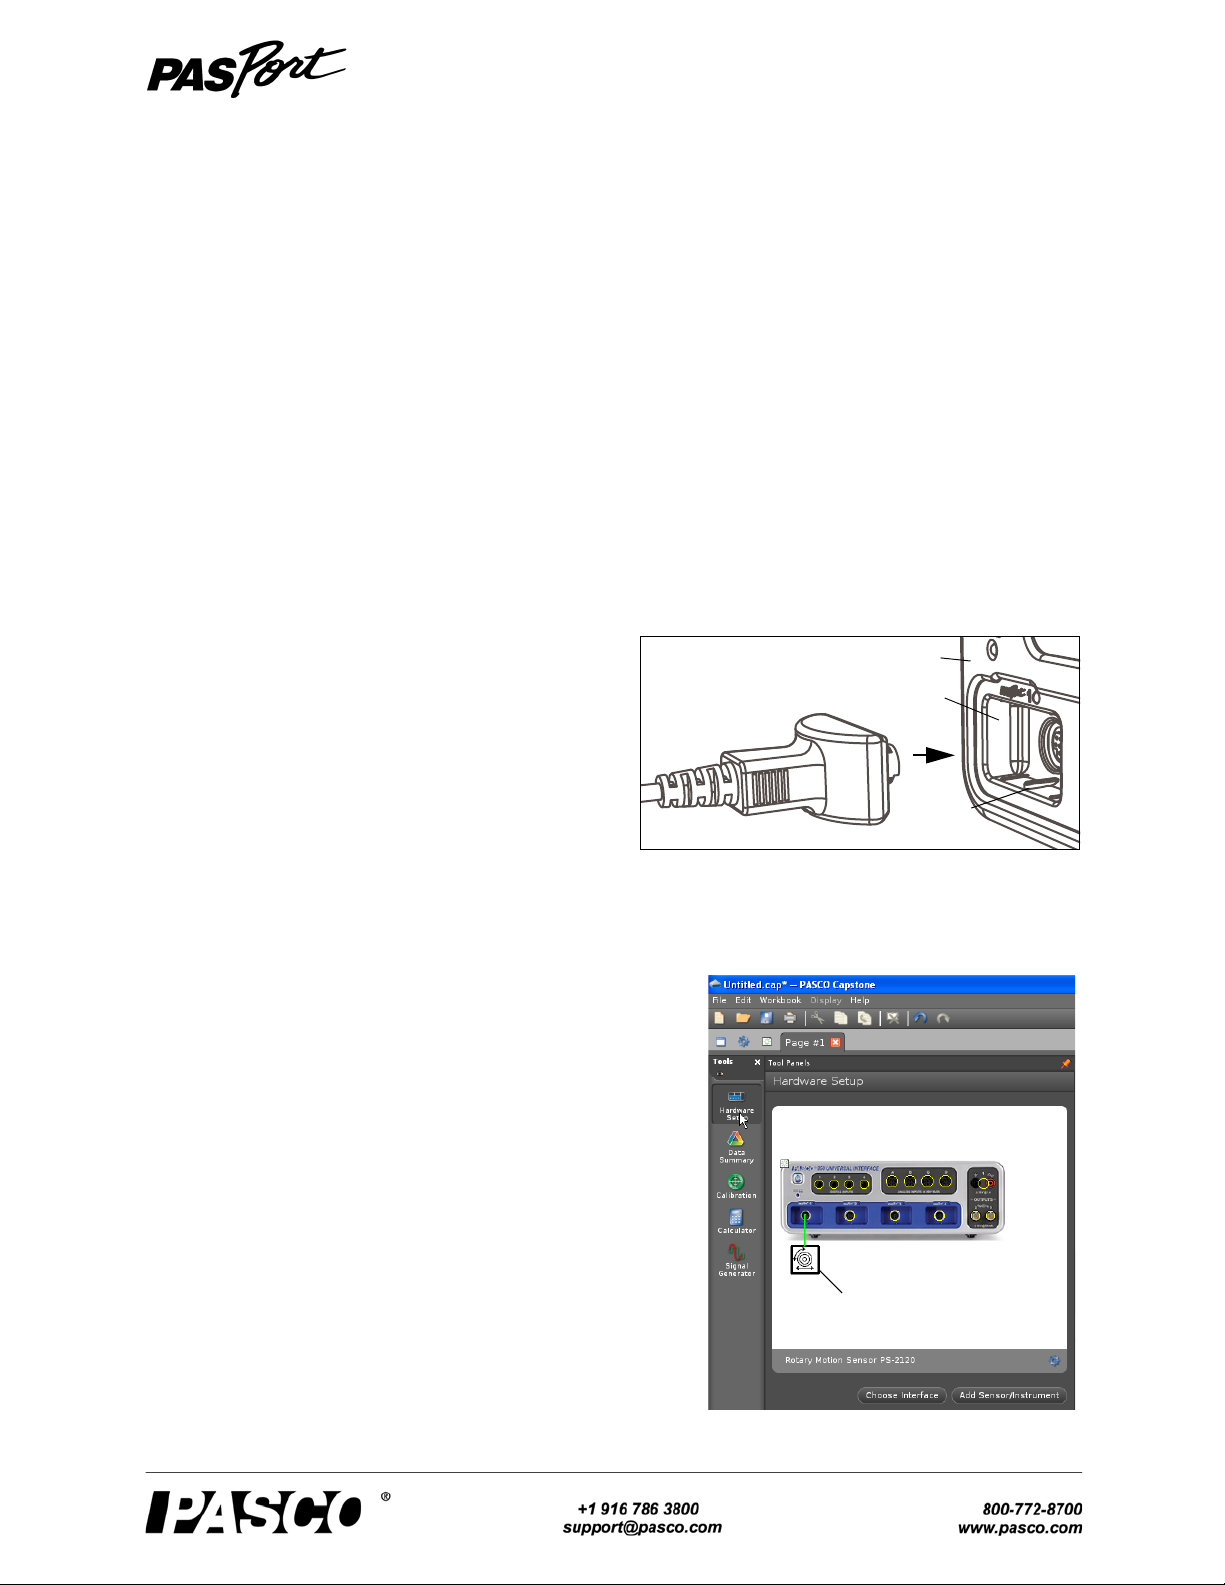
Sensor Plug
Alignment
tab
PASPORT
input port
850 Universal Interface
Capstone Hardware Setup panel
Rotary Motion
Sensor icon
850 Universal
Interface
013-13496A
Rotary Motion Sensor
PS-2120A
Contents
Using the Rotary Motion Sensor with Data Acquisition Software..........................................................................1
Experiment 1: Rotational Inertia of a Point Mass....................................................................................................3
Experiment 2: Rotational Inertia of Disk and Ring .................................................................................................5
Experiment 3: Conservation of Angular Momentum ..............................................................................................7
Using the Rotary Motion Sensor with Data Acquisition Software
• Plug the Sensor Plug into a P ASPORT input port of
a PASPORT-compatible PASCO interface (such as
the 850 Universal Interface, Xplorer GLX, or
SPARK Science Learning System (SLS)).
• Turn on the PASPORT-compatible interface.
• For the PASPORT-compatible interface, start the
PASCO Capstone software.
• For the SPARK SLS, if the sensor is plugged in, the SPARKvue software will start automatically when you
turn on the interface. The SPARKvue software will show the SPARK SLS Home Screen with the Rotary
Motion Sensor.
PASCO Capstone Setup
• In PASCO Capstone, click “Hardware Setup” in the Tools
palette to open the Hardware Setup panel. Confirm that the
Hardware Setup panel shows the interface you are using
and the icon of the Rotary Motion Sensor.
Page 2
®
PS-2120A Contents
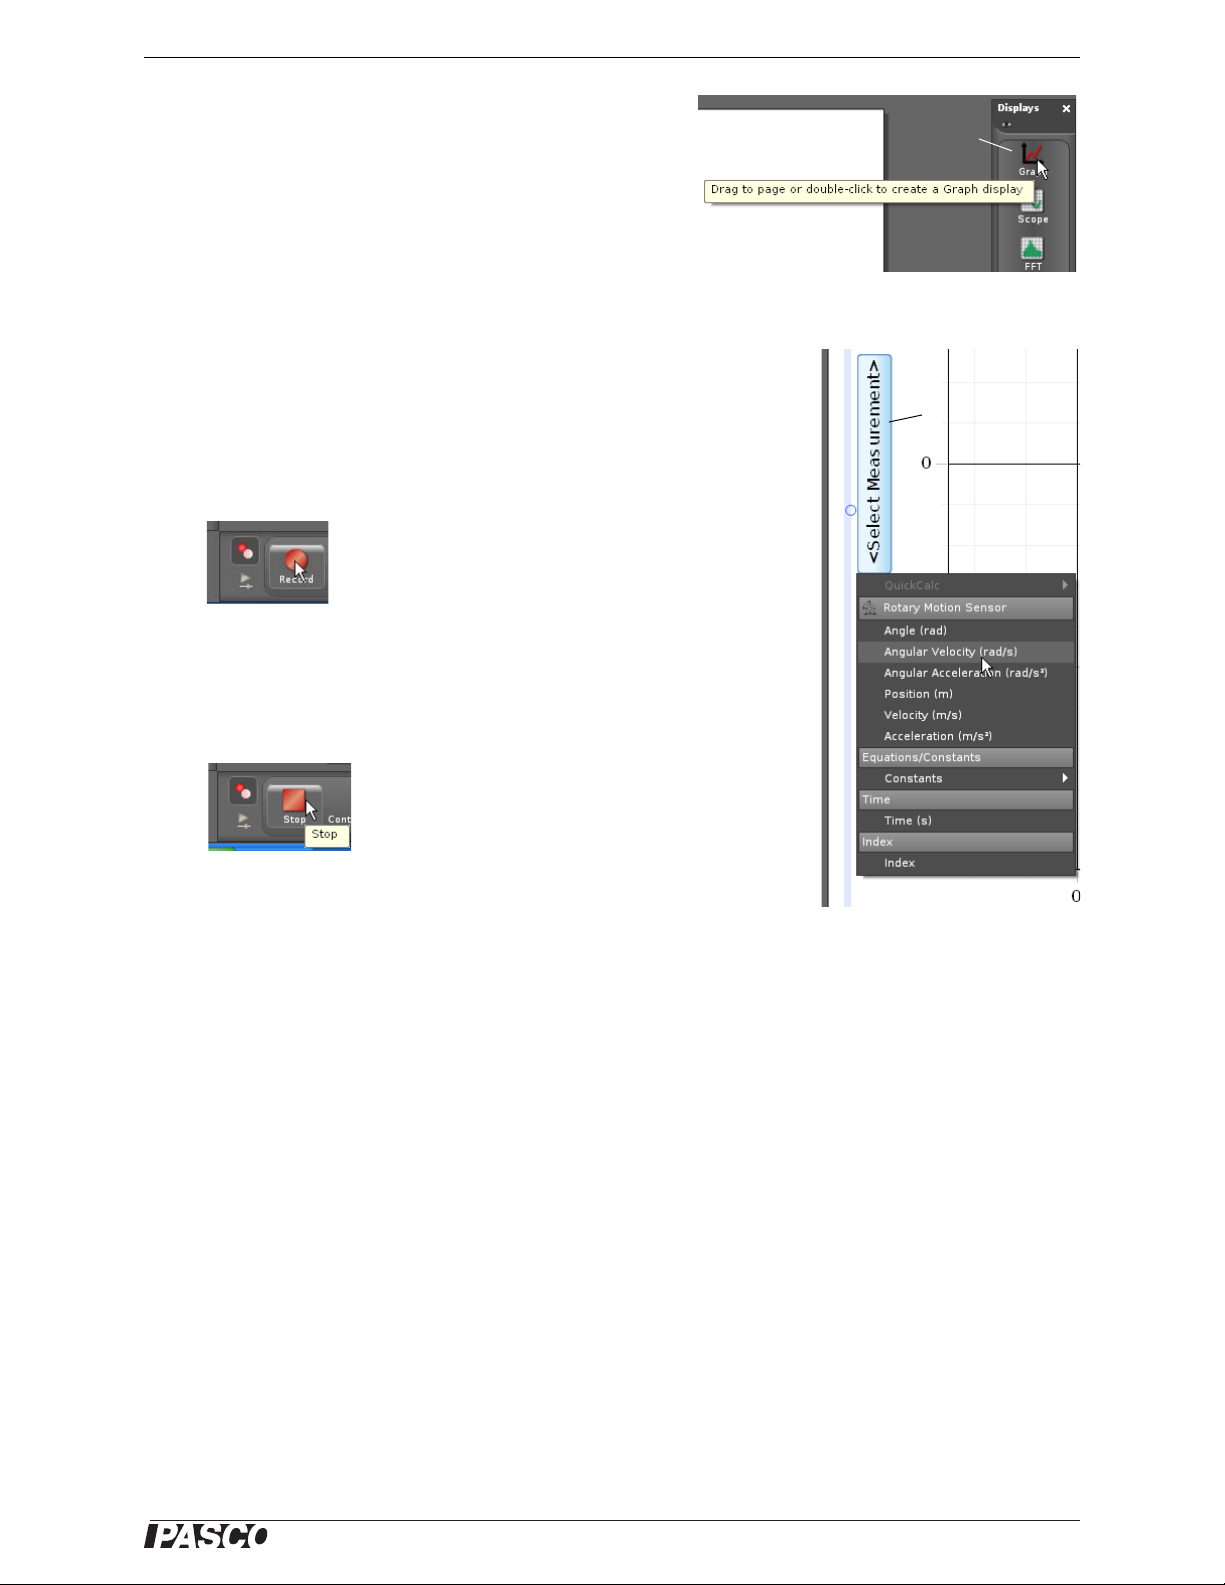
Create a Graph display
Graph display
icon
Click the “Select
Measurement”
menu button
Select “Angular Velocity”
Click “Record”
Click “Stop”
• Set up a data display. For example, drag the Graph icon
from the Displays palette onto the workbook page, or double-click the icon to create a Graph display..
• Set up the Graph display to show Angular Velocity (rad/s) on the vertical
axis. Click the “Select Measurement” menu button on the vertical axis
and pick Angular Velocity (rad/s) from the menu. Time (s) automatically
shows on the horizontal axis.
• Click ‘Record’ in the lower left corner of the PASCO Capstone window
to begin recording data. (The “Record” button changes to “Stop”.)
• Turn the shaft of the Rotary Motion Sensor back-and-forth. V iew the data
• Click “Stop” to end data recording.
• SETUP: For detailed information on setting up the data acquisition software and recording data,
in the Graph display.
refer to the User’s Guide and the online help for the data acquisition software.
Experiment Guide
2
Page 3
®
PS-2120A Contents
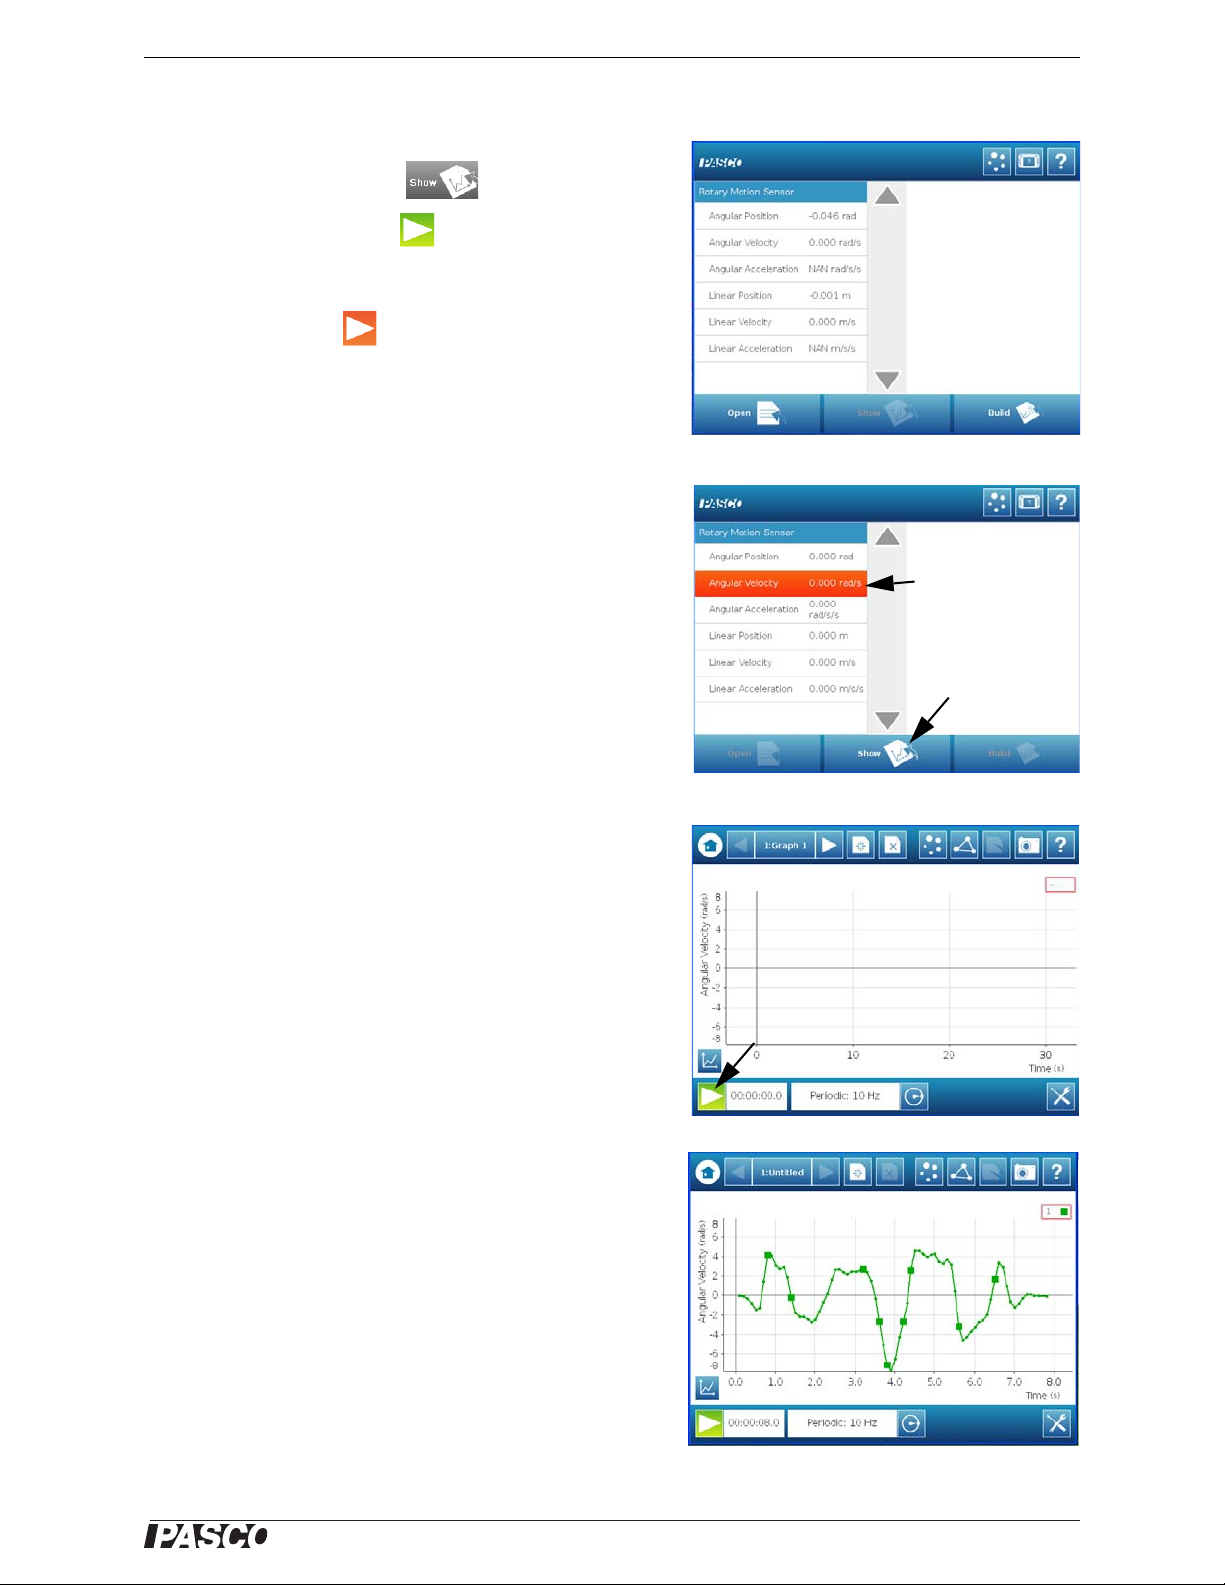
SPARK SLS Home Screen for
the Rotary Motion Sensor
Press
Show
Press “Angular
Velocity”
Press “Angular Velocity” and
then press “Show”
Press “Start”
Press
Start
Turn the Rotary Motion
Sensor shaft
SPARK SLS Setup
• In the Home Screen, press “Angular Velocity” and then
press the Show button ( ) to open a graph display.
• Press the Start button ( ) to begin recording data.
Turn the shaft of the sensor and view the data in the display.
• Press the Stop ( ) button to end data recording.
• SETUP: For detailed information on setting up the
data acquisition software and recording data, refer
to the User’s Guide and the online help for the data
acquisition software.
Technical Support
For assistance, contact PASCO:
Address: PASCO scientific
10101 Foothills Blvd.
Roseville, CA 95747-7100
Phone: +1 916-786-3800 (worldwide)
800-772-8700 (U.S.)
Web: www.pasco.com
Email: support@pasco.com
Experiment Guide
3
Page 4

®
Rotary Motion Sensor Contents
4
Experiment Guide
Page 5

®
PS-2120A Experiment 1: Rotational Inertia of a Point Mass
I
total
M
total
R
2
=
I =
rT=
FmgT– ma==
Tmga–=
Experiment 1: Rotational Inertia of a Point Mass
Equipment Required* Equipment Required*
PASPORT-Compatible Interface Rotary Motion Sensor (PS-2120A)
Mini-Rotational Accessory (CI-6691) Mass and Hanger Set (ME-8979)
Base and Support Rod (ME-9355) Triple Beam Balance (SE-8723)
Paper clips (for masses <1 g) Calipers (SF-8711)
*Click the equipment item to go to the PASCO web site.
Purpose
The purpose of this experiment is to find the rotational inertia of a point mass experimentally and to verify that
this value corresponds to the calculated theoretical value.
Theory
Theoretically, the rotational inertia, I, of a point mass is given by I = MR2, where M is the mass, and R is the distance the mass is from the axis of rotation. Since this experiment uses two masses equidistant from the center of
rotation, the total rotational inertia will be
where M
To find the rotational inertia experimentally, a known torque is applied to the object and the resulting angular
acceleration is measured. Since
where
the weight hanging from the thread that is wrapped around the 3-step Pulley.
where r is the radius of the chosen pulley about which the thread is wound, and T is the tension in the thread
when the apparatus is rotating.
Applying Newton’s Second Law for the hanging mass, m, gives
= M1 + M2, the total mass of both point masses.
total
= I,
is the angular acceleration, which is equal to a/r (a = linear acceleration), and is the torque caused by
(see Figure 1.1). Solving for the tension in the thread gives:
After the angular acceleration of the mass (m) is measured, the torque and the linear acceleration can be obtained
for the calculation of the rotational inertia.
Experiment Guide
5
Page 6
®
Rotary Motion Sensor Experiment 1: Rotational Inertia of a Point Mass
T
mg
a
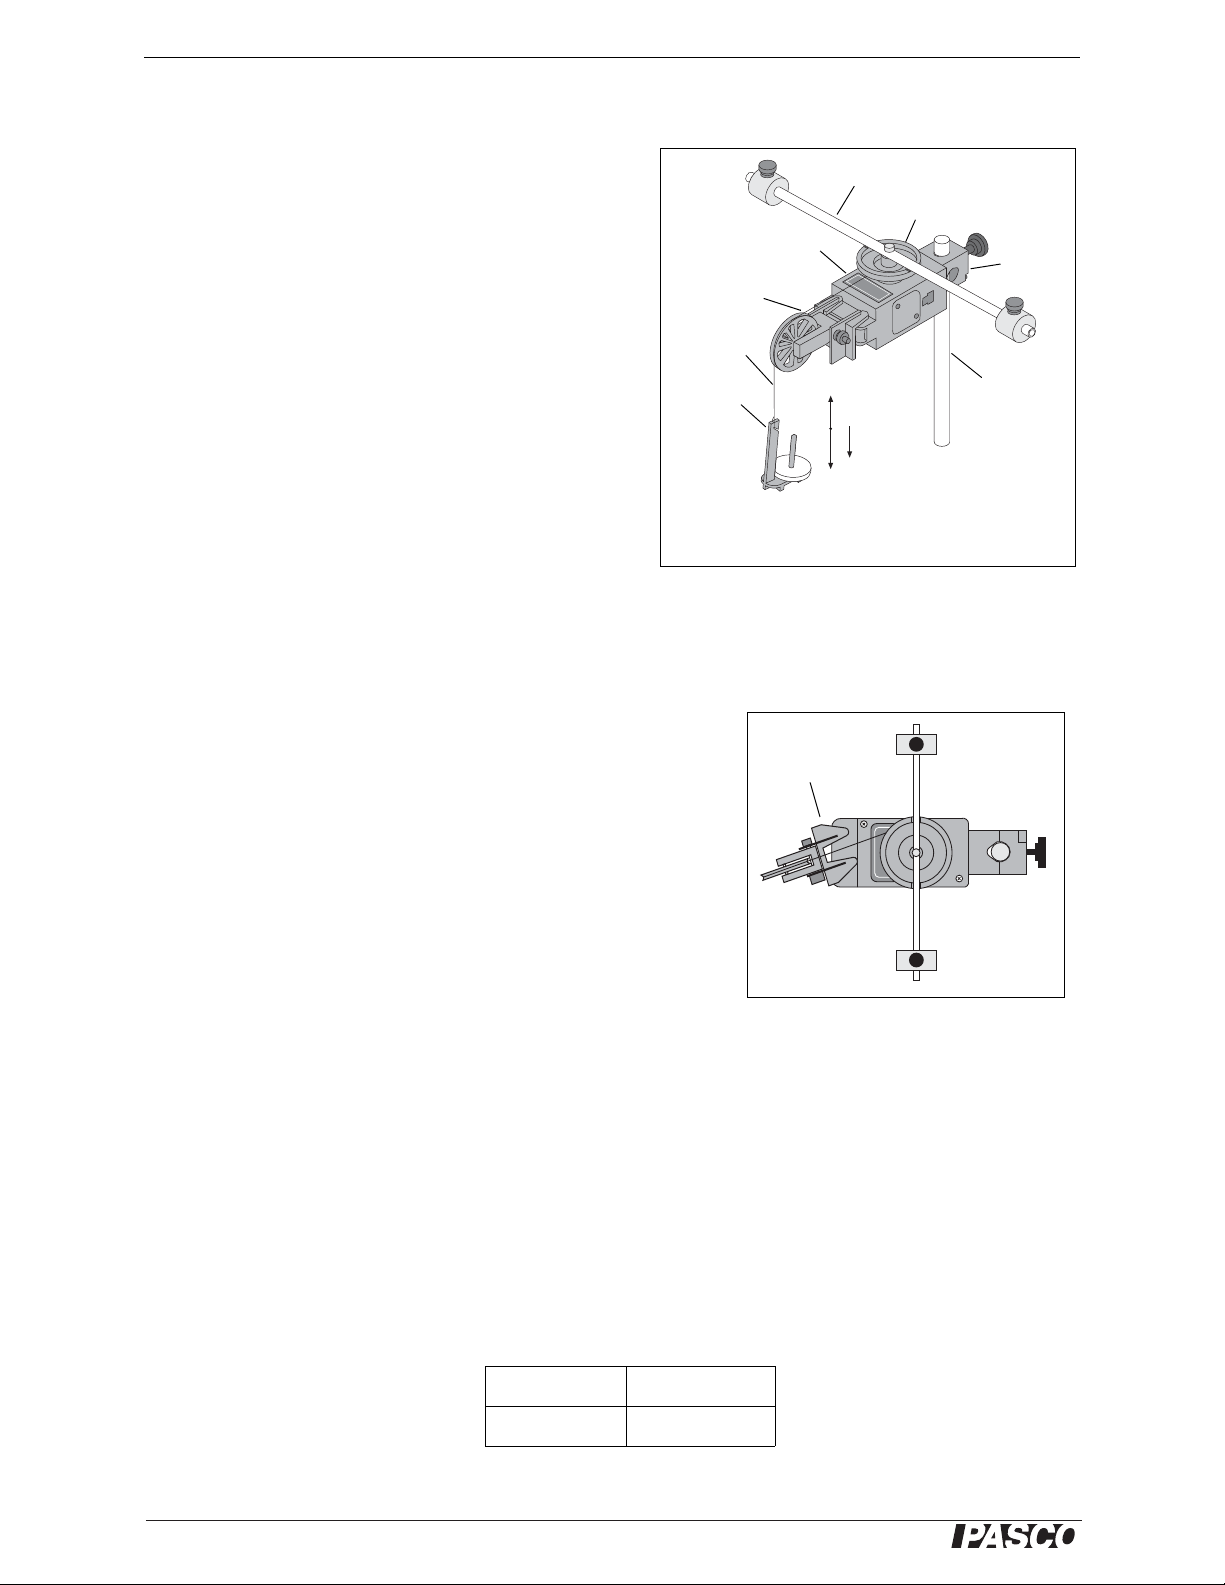
Rod and Masses
3-Step Pulley
Rotary Motion
Sensor
Super Pulley with
Clamp
Hanger
and Mass
Thread
Support
Rod
Rod
Clamp
Figure 1.1: Rotary Motion Sensor and
Free Body Diagram
Super
Pulley
Figure 1.2: Super Pulley Position
Equipment Setup
1. Attach a mass on each end of the rod (part of the
Mini-Rotational Accessory) equidistant from the rod
center. You may choose any radius you wish.
2. Tie one end of a thread to a Mass Hanger and tie the
other end to one of the levels of the 3-step Pulley on
the Rotary Motion Sensor (RMS).
3. Mount the rod and masses to the pulley on the Rotary
Motion Sensor. Please note the orientation of the
3-step Pulley.
4. Mount the RMS on a support rod and connect it to a
PASPORT-compatible interface. Make sure that the
support rod does not interfere with the rotation of the
rod and masses. See Figure 1.1.
5. Mount the Super Pulley wish Clamp on the end of the
Rotary Motion Sensor.
6. Drape the thread over the Super Pulley such that the thread is in the groove of the pulley and the Mass
Hanger hangs freely (see Figure 1.1).
Note: The Super Pulley with Clamp must be adjusted at an angle,
so that the thread runs in a line tangent to the point where it leaves
the 3-step Pulley and straight down the middle of the groove on the
clamp-on Super Pulley (Figure 1.2).
7. Adjust the Super Pulley height so that the thread is level with
the 3-step pulley.
8. Connect the Rotary Motion Sensor to the interface and turn the
interface on.
Procedure
Part 1: Measurements for the Theoretical Rotational Inertia
1. Weigh the two ma sses from the ends of the thin rod to find the total mass M
Table 1.
2. Measure the distance from the axis of rotation to the center of the masses and record this radius in Data
Table 1
Data Table 1: Theoretical Rotational Inertia
Total Mass
Radius
and record the value in Data
total
6
Experiment Guide
Page 7

®
PS-2120A Experiment 1: Rotational Inertia of a Point Mass
Select Size of 3-step Pulley
Select “Linear” as the Curve Fit
Part 2: Measurement for the Experimenta l Method
A. Finding the Acceleration of the Point Masses and Apparatus
1. In the data acquisition software, create an experiment to measure the angular velocity (in radians per sec-
ond) versus time (in seconds) of the point masses and apparatus.
• In PASCO Capstone, for example, drag th e Graph icon from th e Display s pal ette to the workbook. Select
“Angular Velocity (rad/s)” for the vertical axis, and “Time (s)” for the horizontal axis.
• Click the Hardware Setup icon in the Tools palette to open the “Hardware Setup” panel. In the panel, click
the properties button (it looks like a gear wheel in the lower right corner).
• In the Properties window for Linear Accessory , select
the size of the 3-step Pulley you are using. The
default setting is “Large Pulley (Groove)”. Click OK.
2. Put a 50-g mass on the Mass Hanger and turn the
3-step Pulley to wind up the thread so the hanger is
just below the Super Pulley. Hold the 3-step Pulley.
3. Click Record to begin recording data, and release the
3-step Pulley, allowing the hanger to fall.
4. Caution! Click Stop to end data recording BEFORE
the hanger reaches the floor or the thread completely
unwinds from the 3-step Pulley.
5. In the Graph display, select the region of the data that
represents when the Point Masses and Apparatus
were accelerating.
6. In the display, select “Linear” from the curve fit
menu.
The slope, m, of the linear fit represents the angular acceleration () for the Point Mass and Apparatus
7. Record the value of the slope, m, as the angular accel-
eration in Data Table 2.
8. Using calipers, measure the diameter of the pulley
about which the thread is wrapped and calculate the
radius. Record the radius in Data Table 2.
In the previous procedure, the apparatus is rotating and
contributing to the total rotational inertia. The next step is
to find the rotational inertia of the apparatus by itself so
that this rotational inertia can be subtracted from the total.
Experiment Guide
7
Page 8

®
Rotary Motion Sensor Experiment 1: Rotational Inertia of a Point Mass
B. Finding the Acceleration of the Apparatus Alone
1. Take the point masses off the ends of the rod.
2. Repeat the procedure from Part A for finding the angular acceleration of the apparatus alone.
• You may need to decrease the amount of hanging mass so that the apparatus does not accelerate too fast for
smooth data collection.
• Remember that the value of the slope, m, is the angular acceleration.
3. Record the data in Data Table 2.
Data Table 2: Experimental Rotational Inertia Data
Point Mass and
Apparatus Alon e
Apparatus
Hanging Mass
Slope, m
Radius
Calculations
1. Calculate the experimental value of the rotational inertia of the point masses and apparatus together and
record the calculation in Data Table 3.
2. Calculate the experimental value of the rotational inertia of the apparatus alone and record the calculation in
Data Table 3.
3. Subtract the rotational inertia of the apparatus from the total rotational inertia of the point masses and appa-
ratus together. Record this in Data Table 3 as the rotational inertia of the point masses alone.
4. Calculate the theoretical value of the rotational inertia of the point masses and record the calculation in Data
Table 3.
5. Calculate the percent difference to compare the experimental value to the theoretical value, and record the
percent difference in Data Table 3.
Component Rotational Inertia
Point Masses and Apparatus Combined
Apparatus Alone
Point Masses (experimental value)
Point Masses (theoretical value)
Percent Difference
8
Data Table 3: Results
Experiment Guide
Page 9
®
PS-2120A Experiment 2: Rotational Inertia of Disk and Ring
Figure 2.1: Ring
I
1
2
-- -
MR
1
2
R
2
2
+=
I
1
2
-- -
MR
2
=
Figure 2.2: Disk about
center of mass
I
---
=
rT=
FmgT– ma==
Tmga–=
Experiment 2: Rotational Inertia of Disk and Ring
Equipment Required* Equipment Required*
PASPORT-Compatible Interface Rotary Motion Sensor (PS-2120A)
Mini-Rotational Accessory (CI-6691) Mass and Hanger Set (ME-8979)
Base and Support Rod (ME-9355) Triple Beam Balance (SE-8723)
Paper clips (for masses <1 g) Calipers (SF-8711)
*Click the equipment item to go to the PASCO web site.
Purpose
The purpose of this experiment is to experimentally find the rotational inertia of a ring and a disk and verify that
these values correspond to the calculated theoretical values.
Theory
Theoretically, the rotational inertia, I, of a ring about its center of mass is given by:
where M is the mass of the ring, R
is the inner radius of the ring, and R2 is the outer
1
radius of the ring. See Figure 2.1.
The rotational inertia of a disk about its center of mass is given by:
where M is the mass of the disk and R is the radius of the disk. See Figure 2.2. To find
the rotational inertia experimentally, a known torque is applied to the object and the
resulting angular acceleration is measured, Since
= I,
where is the angular acceleration, which is equal to a/r (a = acceleration), and is the
torque caused by the weight hanging from the thread that is wrapped about the 3-step
Pulley on the Rotary Motion Sensor. The torque is given by:
where r is the radius of the pulley step about which the thread is wound, and T is the tension in the thread when
the apparatus is rotating.
Applying Newton’s Second Law for the hanging mass, m, gives:
See Figure 2.3. Solving for the tension in the thread gives:
Once the angular acceleration is measured, the radius and the linear acceleration, a, can be obtained for the calculation of the torque.
Experiment Guide
9
Page 10

®
Rotary Motion Sensor Experiment 2: Rotational Inertia of Disk and Ring
T
mg
a
Figure 2.3: Rotary Motion Sensor
Setup and Free Body Diagram
Mass Hanger
and mass
Support
rod
Thread
Disk
Hole for
Ring Pin
Figure 2.4: Super Pulley Position
Super Pulley
with Clamp
3-step Pulley
Figure 2.5: Setup for Disk and Ring
Rotary Motion
Sensor
Super Pulley
with Clamp
Ring
Setup
1. Mount the Rotary Motion Sensor (RMS) on a
support rod and connect the sensor to the interface.
2. Mount the Super Pulley with Clamp to the end of
the RMS.
3. Tie one end of a thread to a Mass Hanger and the
other end of the thread to one of the levels of the
3-step Pulley on the RMS.
4. Drape the thread over the Super Pulley such that
the thread is in the groove of the Super Pulley
and the Mass Hanger hangs freely.
5. Adjust the Super Pulley with Clamp to an angle
so that the thread runs in a line tangent to the
point where it leaves the 3-step Pulley and is
straight down the middle of the groove on the
Super Pulley. See Figure 2.4.
6. Place the disk directly on the 3-step Pulley as shown in
Figure 2.3.
7. Place the ring on the disk, inserting the ring pins on the
bottom edge into the holes in the top of the disk as
shown in figure 2.5.
10
Experiment Guide
Page 11

®
PS-2120A Experiment 2: Rotational Inertia of Disk and Ring
Select Size of 3-step Pulley
Procedure
Measurements for the Theoretical Rotational Inertia
1. Weigh the ring and the disk to find their masses and record these masses in Data Table 1.
2. Measure the inside and outside diameters of the ring and calculate the radii, R
and R2. Record in Data Table
1
1.
3. Measure the diameter of the disk and calculate the radius, R, and record into Data Table 1
Data Table 1: Theoretical Rotational Inertia.
Mass of ring
Mass of disk
Inner radius of ring
Outer radius of ring
Radius of disk
Measurements for the Experimental Method
A. Finding the Acceleration of the Ring and Disk
1. In the data acquisition software, create an experiment to measure the angular velocity (in radians per sec-
ond) versus time (in second) of the ring and disk.
• In PASCO Capstone, for example, drag th e Graph icon from th e Display s pal ette to the workbook. Select
“Angular Velocity (rad/s)” for the vertical axis, and “Time (s)” for the horizontal axis.
• Click the Hardware Setup icon in the Tools palette to open the “Hardware Setup” panel. In the panel, click
the properties button (it looks like a gear wheel in the lower right corner).
• In the Properties window for Linear Accessory , select
the size of the 3-step Pulley you are using. The
default setting is “Large Pulley (Groove)”. Click OK.
2. Put a 50-g mass on the Mass Hanger and turn the
3-step Pulley to wind up the thread so the hanger is
just below the Super Pulley. Hold the 3-step Pulley.
3. Click Record to begin recording data, and release the
3-step Pulley, allowing the hanger to fall.
4. Caution! Click Stop to end data recording BEFORE
the hanger reaches the floor or the thread completely
unwinds from the 3-step Pulley.
5. In the Graph display, select the region of the data that
represents when the ring and disk were accelerating.
Experiment Guide
11
Page 12

®
Rotary Motion Sensor Experiment 2: Rotational Inertia of Disk and Ring
Select “Linear” from the Curve Fit Menu
6. In the Graph display, select “Linear” from the curve
fit menu.
The slope, m, of the linear fit represents the angular acceleration () for the Point Mass and Apparatus
7. Record the value of the slope, m, as the angular acceleration in Data Table 2.
B. Measure the Radius
• Using calipers, measure the diameter of the pulley
about which the thread is wrapped and calculate the
radius. Record the radius in Data Table 2.
Data Table 2: Experimental Rotational Inertia Data
Ring and Disk
Disk Alone
Combined
Hanging Mass
Slope, m
Radius
C. Finding the Acceleration of the Disk Alone
1. In "Finding the Acceleration of Ring and Disk," both the disk and the ring are rotating; therefore, it is necessary to determine the acceleration and the rotational inertia of the disk by itself so this rotational inertia can
be subtracted from the total, leaving only the rotational inertia of the ring.
2. Take the ring off the apparatus and repeat the steps under “Finding the Acceleration of the Ring and Disk”
for the disk alone. Record the results in Data Table 2.
Calculations
1. Calculate the experimental value of the rotational inertia of the ring and disk together, and record the value
in Data Table 3.
2. Calculate the experimental value of the rotational inertia of the disk alone and record the value in Data T able
3.
3. Subtract the rotational inertia of the disk from the total rotational inertia of the ring and disk, and record this
as the rotational inertia of the ring alone.
4. Use a percent difference to compare the experimental values to the theoretical values.
12
Experiment Guide
Page 13

®
PS-2120A Experiment 2: Rotational Inertia of Disk and Ring
Data Table 3: Results
Item Rotational Inertia
Ring and Disk
Disk alone
Ring alone
Percent difference for the disk
Percent difference for the ring
Experiment Guide
13
Page 14

®
Rotary Motion Sensor Experiment 2: Rotational Inertia of Disk and Ring
14
Experiment Guide
Page 15

®
PS-2120A Experiment 3: Conservation of Angular Momentum
LIiiIf
f
==
I
i
1
2
-- -
M
1
R
2
=
I
f
1
2
-- -
M
1
R
2
1
2
-- -
M
2r1
2
r
2
2
++=
f
M1R
2
M1R2M2r
1
2
r
2
2
++
------------------------------------------------------ -
i
=
Experiment 3: Conservation of Angular Momentum
Equipment Required* Equipment Required*
PASPORT-Compatible Interface Rotary Motion Sensor (PS-2120A)
Mini-Rotational Accessory (CI-6691) Mass and Hanger Set (ME-8979)
Base and Support Rod (ME-9355) Triple Beam Balance (SE-8723)
Paper clips (for masses <1 g) Calipers (SF-8711)
*Click the equipment item to go to the PASCO web site.
Purpose
A non-rotating ring is dropped onto a rotating disk, and the final angular speed of the system is compared with
the value predicted using the principle of the conservation of angular momentum.
Theory
When the ring is dropped onto the rotating disk, there is no net torque on the system since the torque on the ring
is equal and opposite to the torque on the disk. Therefore, there is no change in angular momentum; angular
momentum (L) is conserved.
where I
inertia and
is the initial rotational inertia and i is the initial angular speed of the disk and If is the final rotational
i
is the final angular speed of the disk and the ring together.
f
The rotational inertia of a disk is given as:
and the final rotational inertia of a disk and ring together is:
where M
is the mass of the disk, M2 is the mass of the ring, R is the radius of the disk, and r1 and r2 are the inner
1
and outer radii of the ring.
Based on this, the final rotational speed is given by:
Experiment Guide
15
Page 16
®
Rotary Motion Sensor Experiment 3: Conservation of Angular Momentum
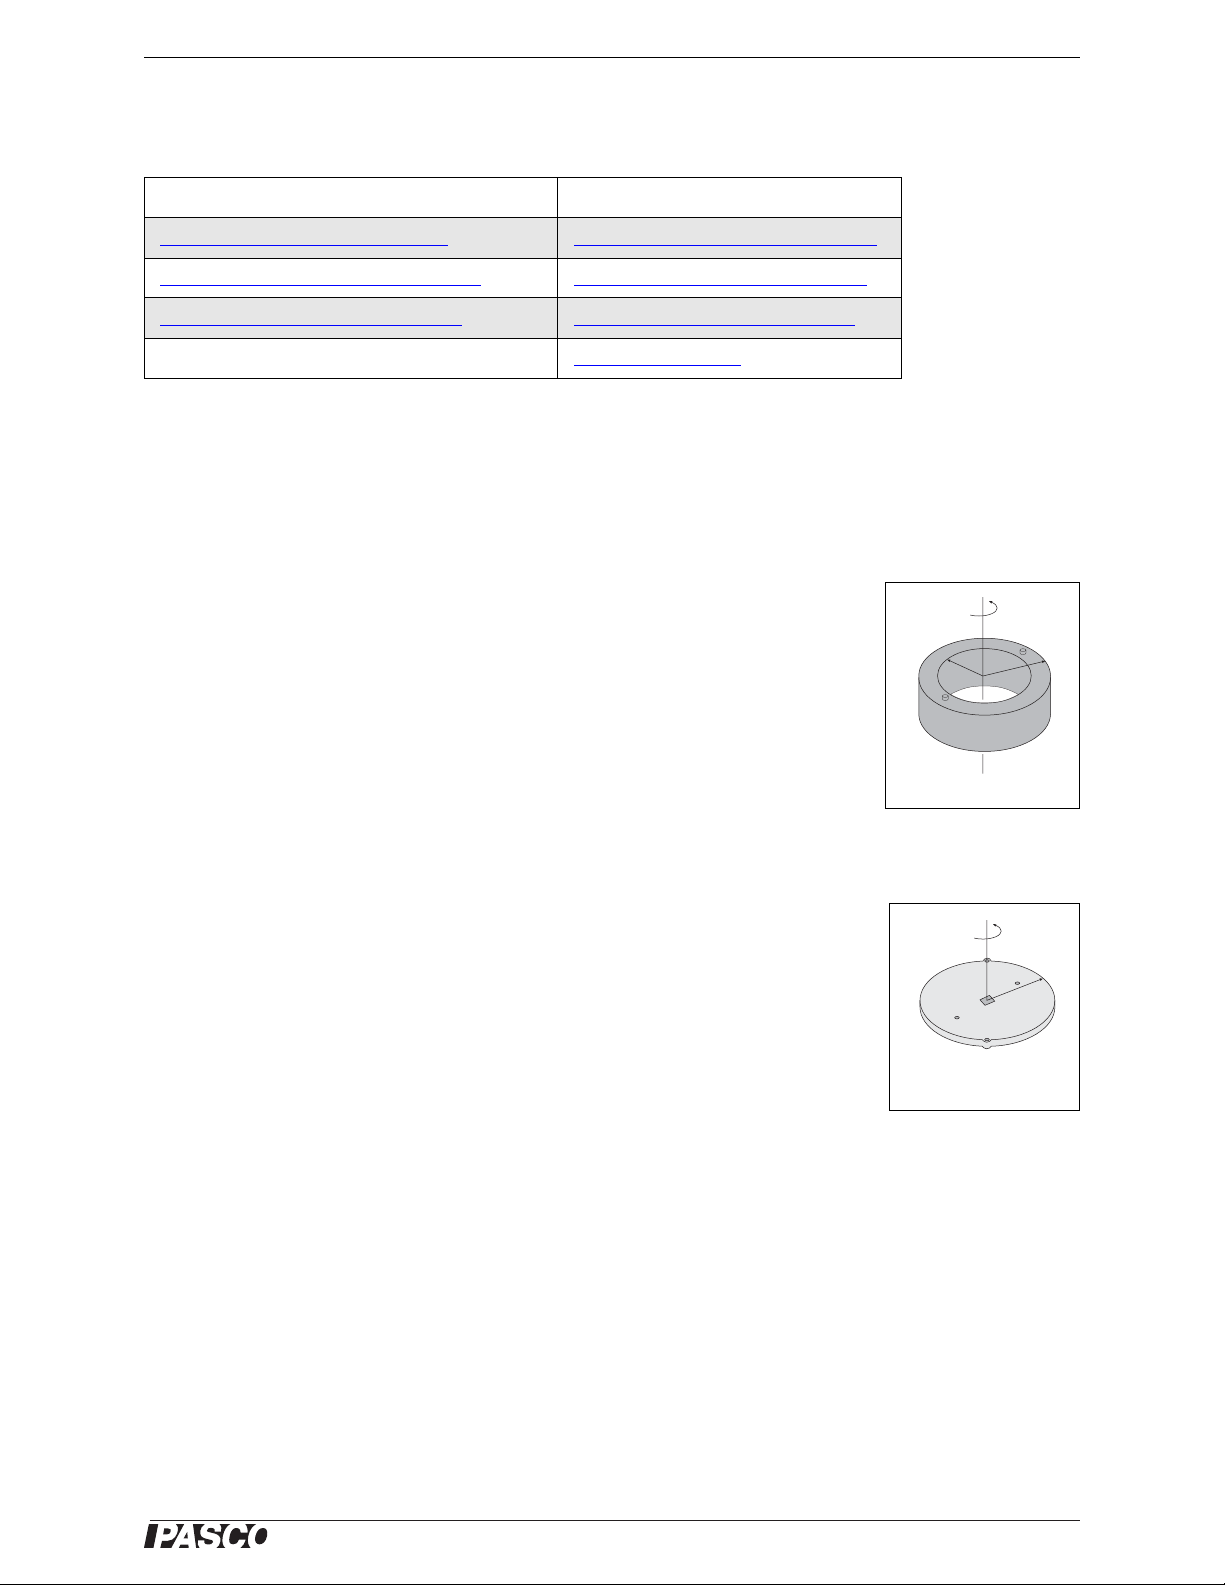
Figure 3.1: Setup for Dropping Ring onto Disk
Disk
Support
Rod
RMS with
3-step Pulley
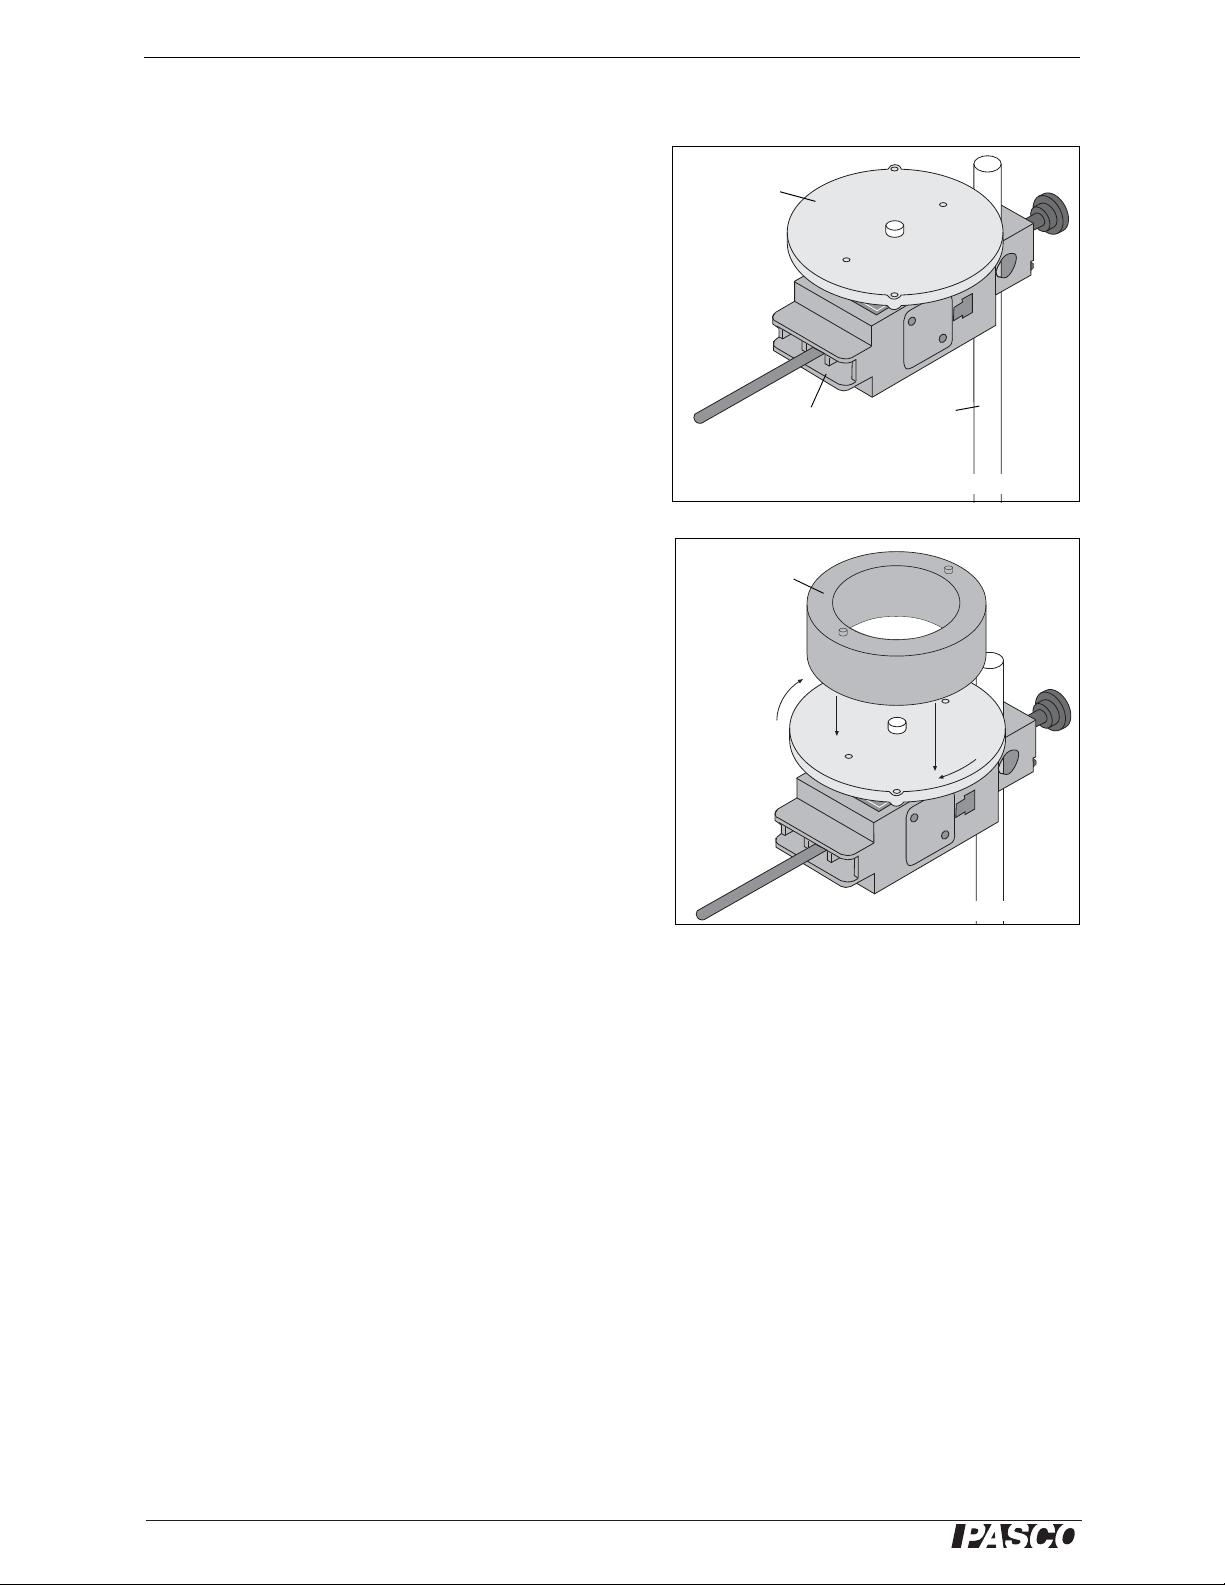
Figure 3.2: Drop Ring onto Disk
Ring
Setup
1. Mount the Rotary Motion Sensor to a support rod and
connect it to the interface. Place the disk directly on the
pulley as shown in Figure 3.1.
2. In the data acquisition software, create an experiment to
measure the angular velocity (in radians per second)
versus time (in second) of the disk before and after the
ring is dropped on top of it.
• In PASCO Capstone, for example, drag the Graph icon
from the Displays palette to the workbook. Select
“Angular Velocity (rad/s)” for the vertical axis, and
“Time (s)” for the horizontal axis.
Procedure
1. Hold the ring with the pins facing up just above the center of the disk.
2. Give the disk a spin with your hand and click Record to
begin recording data.
3. After about 25 data points have been recorded, drop the
ring on the spinning disk. See Figure 3.2.
4. Click Stop to end data recording after the disk and ring
have made a few rotations..
5. In the Graph display, select the region of the data that
represents when the ring was dropped onto the disk.
6. In the Graph display, select the data analysis tool that
shows the coordinates of any point in the plot of data
and move the cursor to the data point that is immediately before the collision. Record the Angular Velocity
at this point as the initial angular velocity in Data Table 1.
7. Move the cursor to the data point immediately after the collision. Record the Angular Velocity at this point
as the final angular velocity in Data Table 1.
8. W eigh the ring and disk and record their masses. Measure the inner and outer radii of the ring, and the radius
of the disk. Record these values in Data Table 1.
Analysis
1. Calculate the theoretical value for the final angular velocity and record this value in the Data Table.
2. Calculate the percent difference between the experimental and theoretical values of the final angular veloc-
ity and record it in the Data Table.
Questions
1. How does the experimental result for the final angular velocity compare with the theoretical value for the
final angular velocity?
16
Experiment Guide
Page 17

®
PS-2120A Experiment 3: Conservation of Angular Momentum
% KE lost =
1
2
-- -
I
ii
2
1
2
-- -
I
ff
2
+
1
2
-- -
I
i
2
i
2
------------------------------------- -
2. What percentage of the rotational kinetic energy was “lost” during the collision? Calculate the energy lost
and record the results in the Data Table.
.Data Table 1: Data and Results
Initial angular velocity
Final angular velocity
(experimental value)
Mass of disk (M1)
Mass of ring (M2)
Inner radius of ring (r1)
Outer radius of ring (r2)
Radius of disk (R)
Final angular velocity
(theoretical value)
Percent difference between
experimental and theoretical values
Percent of kinetic energy lost
Experiment Guide
17
 Loading...