

Page 1

Important Note
Update your Xplorer GLX
before connecting the GLX Power Amplifier.
The Power Amplifier requires firmware version 1.44 (or later)
to be installed on your Xplorer GLX. Follow these steps to
update your Xplorer GLX.
1. Go to www.pasco.com/glx.
2. Click GLX Firmware Update.
3. Download the latest version of DataStudio.
4. Install DataStudio on your computer.
5. Run DataStudio.
6. Turn on the GLX and connect it to the computer.
Result: DataStudio installs the latest firmware on the GLX.
Questions?
Contact PASCO Technical Support.
Phone: 916-786-3800 (worldwide)
800-772-8700 (U.S.)
Fax: (916) 786-7565
Web: www.pasco.com
Email: support@pasco.com
®
Page 2

Page 3
Instruction Manual
GLX Power Amplifier
PS-2006
012-09937A
®
Page 4

GLX Power Amplifier Table of Contents
Introduction. . . . . . . . . . . . . . . . . . . . . . . . . . . . . . . . . . . . . . . . . . . . . . . . . . . . . . . . . . . . 3
Parts of the Power Amplifier . . . . . . . . . . . . . . . . . . . . . . . . . . . . . . . . . . . . . . . . . . . . . 4
Set-up . . . . . . . . . . . . . . . . . . . . . . . . . . . . . . . . . . . . . . . . . . . . . . . . . . . . . . . . . . . . . . . .4
Output Screen. . . . . . . . . . . . . . . . . . . . . . . . . . . . . . . . . . . . . . . . . . . . . . . . . . . . . . . . . .5
About the Output Settings . . . . . . . . . . . . . . . . . . . . . . . . . . . . . . . . . . . . . . . . . . .5
To Turn the Output On or Off . . . . . . . . . . . . . . . . . . . . . . . . . . . . . . . . . . . . . . . .6
To Change an Output Setting . . . . . . . . . . . . . . . . . . . . . . . . . . . . . . . . . . . . . . . .6
To Change the Step Size . . . . . . . . . . . . . . . . . . . . . . . . . . . . . . . . . . . . . . . . . . .6
Graph Screen with Power Amp Config Panel . . . . . . . . . . . . . . . . . . . . . . . . . . . . . . . .7
To open the Graph Screen with Power Amp Config Panel . . . . . . . . . . . . . . . . . .7
To Switch Activity between Config Panel and Graph . . . . . . . . . . . . . . . . . . . . . .7
To Turn Output On or Off . . . . . . . . . . . . . . . . . . . . . . . . . . . . . . . . . . . . . . . . . . . 7
To Change a Setting . . . . . . . . . . . . . . . . . . . . . . . . . . . . . . . . . . . . . . . . . . . . . . .7
To Return to the Output Screen . . . . . . . . . . . . . . . . . . . . . . . . . . . . . . . . . . . . . . 8
Output-control Calculations . . . . . . . . . . . . . . . . . . . . . . . . . . . . . . . . . . . . . . . . . . . . . .8
Using Power Amplifier Measurements. . . . . . . . . . . . . . . . . . . . . . . . . . . . . . . . . . . . . .8
About the Measurements . . . . . . . . . . . . . . . . . . . . . . . . . . . . . . . . . . . . . . . . . . .8
To Record Measurements. . . . . . . . . . . . . . . . . . . . . . . . . . . . . . . . . . . . . . . . . . . 9
To Display a Measurement . . . . . . . . . . . . . . . . . . . . . . . . . . . . . . . . . . . . . . . . . .9
To Change the Sampling Rate . . . . . . . . . . . . . . . . . . . . . . . . . . . . . . . . . . . . . . . 9
Special Output Examples . . . . . . . . . . . . . . . . . . . . . . . . . . . . . . . . . . . . . . . . . . . . . . . 10
Positive Square Wave . . . . . . . . . . . . . . . . . . . . . . . . . . . . . . . . . . . . . . . . . . . . .10
Single Positive Ramp . . . . . . . . . . . . . . . . . . . . . . . . . . . . . . . . . . . . . . . . . . . . .10
Heat Pulse . . . . . . . . . . . . . . . . . . . . . . . . . . . . . . . . . . . . . . . . . . . . . . . . . . . . . . 10
Automatic On. . . . . . . . . . . . . . . . . . . . . . . . . . . . . . . . . . . . . . . . . . . . . . . . . . . .10
Automatic Off. . . . . . . . . . . . . . . . . . . . . . . . . . . . . . . . . . . . . . . . . . . . . . . . . . . .11
Frequency Sweep . . . . . . . . . . . . . . . . . . . . . . . . . . . . . . . . . . . . . . . . . . . . . . . . 11
Voltage Controlled by Force . . . . . . . . . . . . . . . . . . . . . . . . . . . . . . . . . . . . . . . .11
Thermostat . . . . . . . . . . . . . . . . . . . . . . . . . . . . . . . . . . . . . . . . . . . . . . . . . . . . .12
Proportional Thermostat . . . . . . . . . . . . . . . . . . . . . . . . . . . . . . . . . . . . . . . . . . .12
Sample Experiments . . . . . . . . . . . . . . . . . . . . . . . . . . . . . . . . . . . . . . . . . . . . . . . . . . .13
I-V Curves . . . . . . . . . . . . . . . . . . . . . . . . . . . . . . . . . . . . . . . . . . . . . . . . . . . . . .13
RLC Circuit . . . . . . . . . . . . . . . . . . . . . . . . . . . . . . . . . . . . . . . . . . . . . . . . . . . . . 14
Ohm’s Law and Resistivity . . . . . . . . . . . . . . . . . . . . . . . . . . . . . . . . . . . . . . . . .16
Standing Wave on a String . . . . . . . . . . . . . . . . . . . . . . . . . . . . . . . . . . . . . . . . . 18
Electrical Equivalent of Heat . . . . . . . . . . . . . . . . . . . . . . . . . . . . . . . . . . . . . . . .21
Specifications . . . . . . . . . . . . . . . . . . . . . . . . . . . . . . . . . . . . . . . . . . . . . . . . . . . . . . . . . 23
Technical Support . . . . . . . . . . . . . . . . . . . . . . . . . . . . . . . . . . . . . . . . . . . . . . . . . . . . . 23
®
Page 5
GLX Power Amplifier
PS-2006
Included Equipment Part Number
GLX Power Amplifier PS-2006
AC Adapter 540-057
Required Equipment Part Number
Xplorer GLX PS-2002
Introduction
The GLX Power Amplifier adds the capabilities of a programmable power supply and high-power function generator to your Xplorer GLX. With an output up to ±10 V at 1 A, the Power Amplifier is well suited for driving
circuits, light bulbs, speakers, string vibrators, motors, and more. Because it is connected to a GLX, the Power
Amplifier also functions like a sensor, allowing the GLX to record output voltage, frequency, current and peak
current amplitude.
This manual includes general instructions on using the Power Amplifier (pages 4–9), examples of special output
formulas (10–12), and sample experiments that illustrate a variety of uses (13–22). For general instruction on
using the Xplorer GLX, see the Users’ Guide included with the GLX.
®
3
Page 6
PS-2006 GLX Power Amplifier Parts of the Power Amplifier
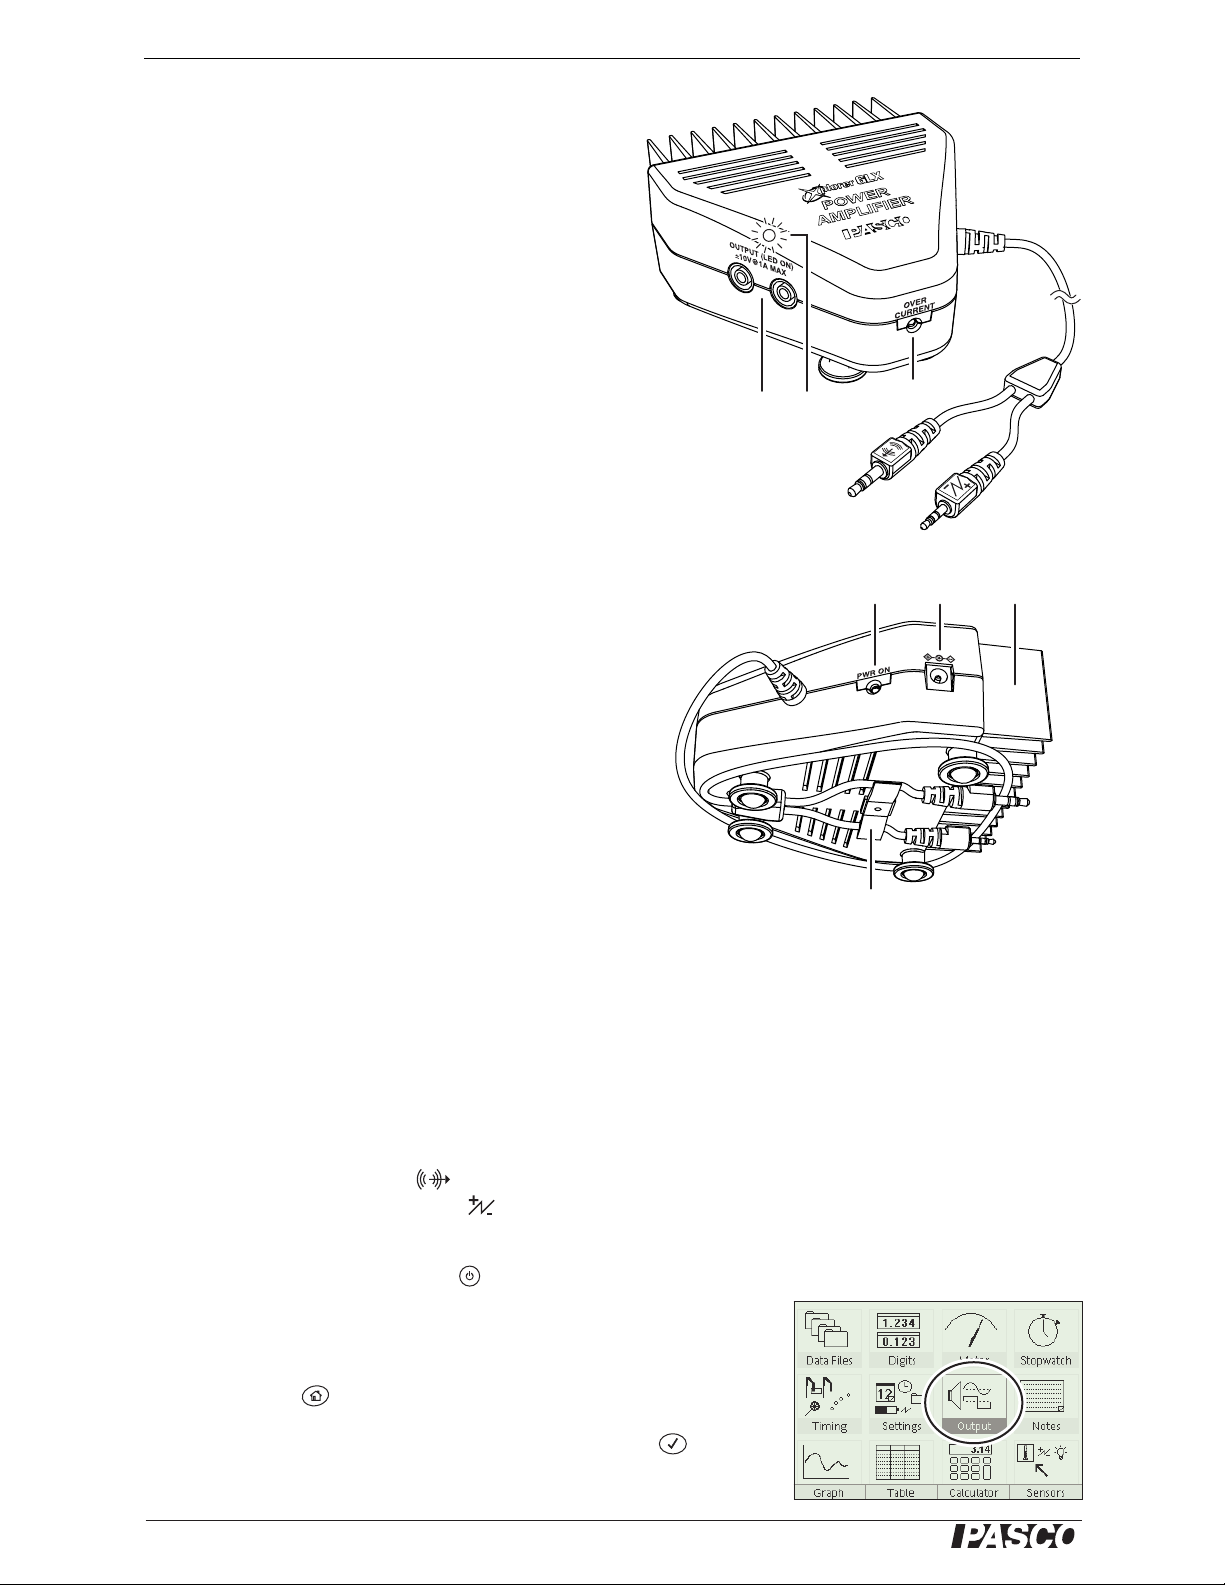
Parts of the Power Amplifier
1. Output jacks: Accept 4 mm banana plugs
(shielded or unshielded) to connect a device to the
Power Amplifier.
2. Output-on indicator: Lights to indicate that the
output is switched on.
3. Over-current indicator: Lights to indicate that
the output voltage may be clipped or distorted.
4. Signal leads: Connect to the Xplorer GLX.
They transmit the signal from the GLX to be amplified
and return information about the output current to the
GLX.
5. Power indicator: Lights when the Power
Amplifier is connected to and powered by the AC
adapter.
6. AC adapter port: Connects to the included AC
Adapter
7. Heat sink: Dissipates waste heat. The heat sink
may get hot (up to about 60° C). Ensure that the fins are
vertical and that the flow of air around the Power Amplifier is not impeded.
8. Cord clip: Holds the signal leads for storage.
Set-up
Before using your Power Amplifier for the first time, make sure that
your GLX is running firmware version 1.44 or later. The version number appears at the bottom of the splash screen that appears briefly when
you turn on the GLX. To download the most up-to-date GLX firmware,
visit www.pasco.com/glx and follow the instructions on that web page.
132
4
5
8
76
1. Connect the AC adapter to a wall outlet and to the power input port
of the Power Amplifier
2. Connect the Power Amplifier's signal leads to the GLX. Connect
the larger plug (with the icon) to the GLX's Signal Output
port; connect the smaller plug ( ) to the Voltage Port on the side
of the GLX.
3. Turn on the GLX by pressing or plugging in the GLX's AC
adapter.
4. Go to the Output screen and set Output Device to Power Amplifier:
a. Press to go to the Home Screen.
b. Use the arrow keys to highlight Output and press . The
Output screen opens.
4
®
Page 7
PS-2006 GLX Power Amplifier Output Screen
c. With Output Device highlighted, press . A menu opens.
d. Press to highlight Power Amplifier and press .
Result: The Power Amplifier Calibrating bar appears for a few
seconds, after which the Power Amplifier is ready to use.
5. Connect a device to the red and black Output jacks of the Power
Amplifier using two 4 mm banana plug leads.
Note that the maximum output of the Power Amplifier is ±10 V and
1 A. If your device may be damaged by this output, be careful to
keep the voltage at a safe level.
F1
F3F2
F4
Output Screen
The Output screen is the primary control panel of the Power Amplifier.
(It can also be controlled from the Graph screen and Calculator.)
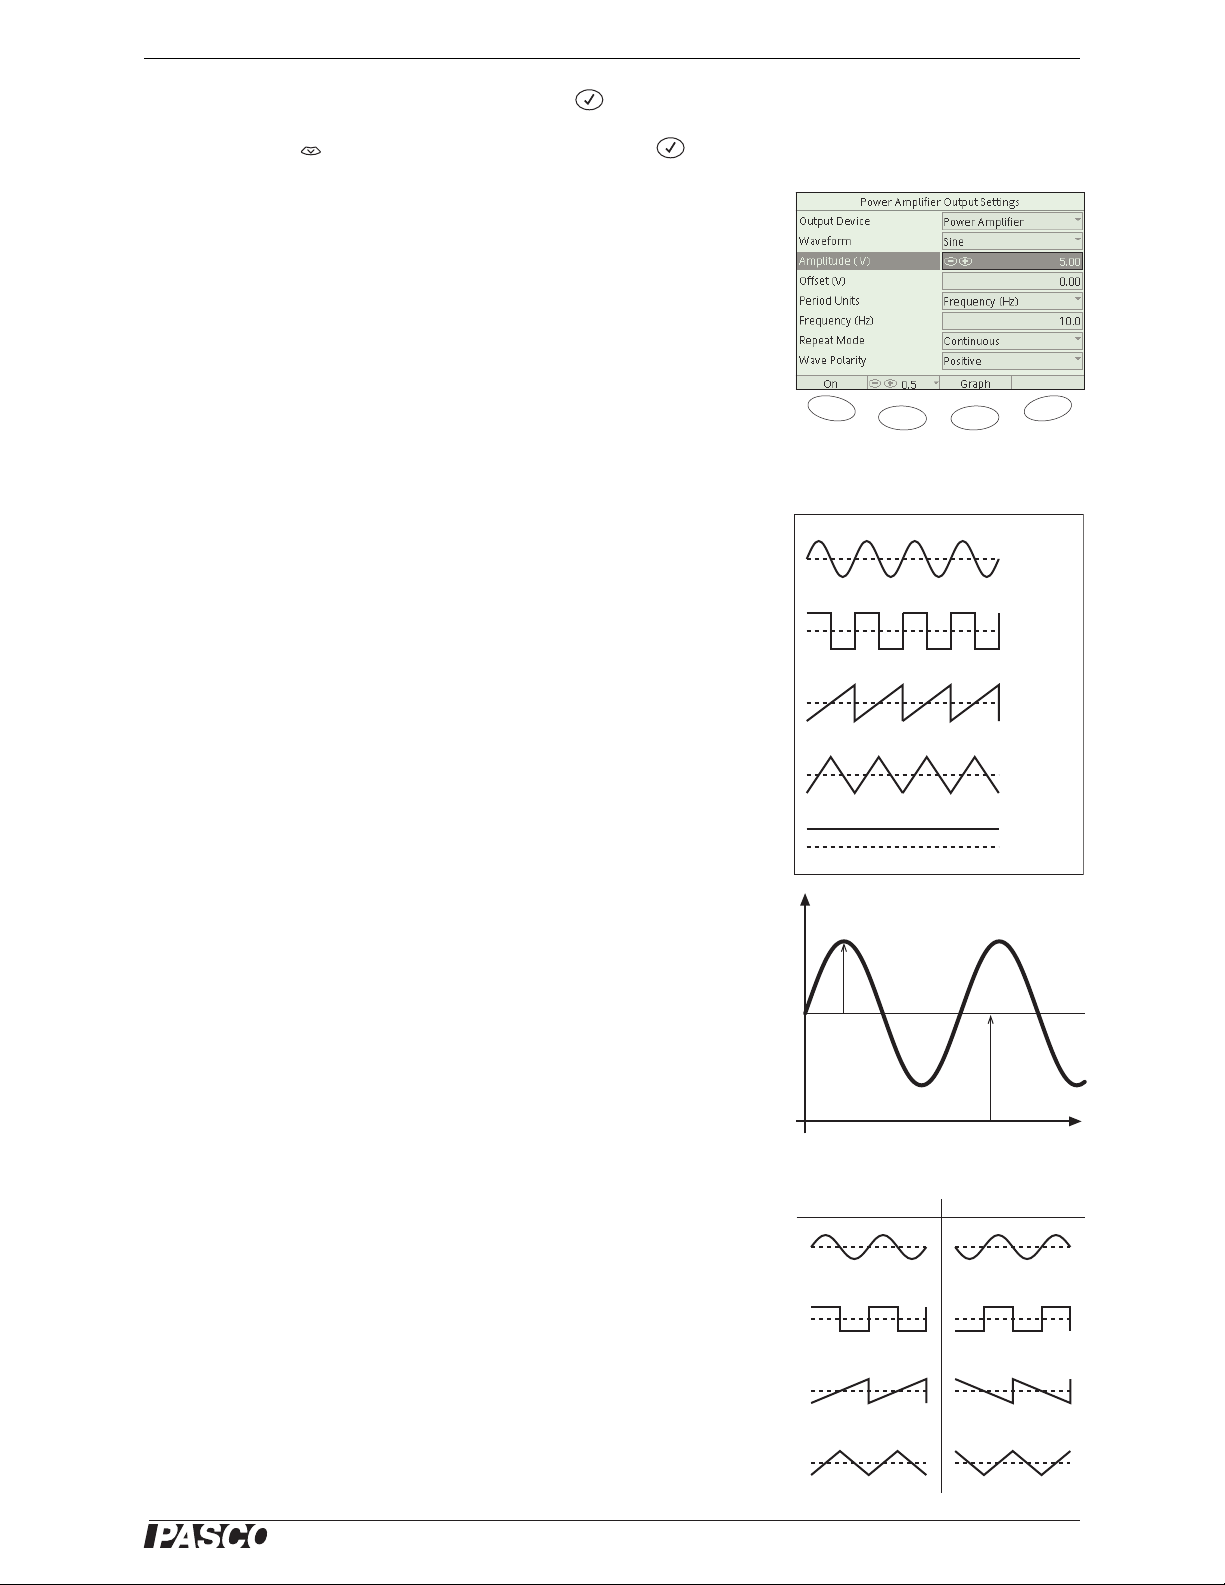
In the Output screen, the Power Amplifier output is determined by the
settings described below. All of the settings can be set before the output
is turned on, or changed while the output is on. Be certain that the voltage is set to a safe level for your device before turning on the output.
Sine
Square
About the Output Settings
Output Device This setting should be set to Power Amplifier.
Waveform This setting determines the shape of the output function
as illustrated.
Voltage This setting appears only when Waveform is set to DC Volt-
age. Its value determines the output voltage. The range is from −10 V to
+10 V.
Amplitude This setting determines magnitude of the output. It equals
half of the peak-to-peak difference between maximum and minimum
voltage. Note that Amplitude is not necessarily equal to the maximum
output voltage.
Offset This setting shifts the output function up or down by the specified voltage.
Note: If the sum of amplitude and the absolute value of the offset exceeds 10 V,
the output signal will be clipped at ±10V.
Period Units This setting has two options: Frequency and Period. It
determines whether the cycle rate of the function will be set by the Fre-
quency or Period setting below.
Ramp
Trianlge
DC
Voltage
V
Amplitude
Offset
t
Wave Polarity
Positive Negative
Frequency or Period This setting determines the frequency (in Hz)
or the period (in s) of the function. The frequency range is from 0.1 to
5000 Hz. The period range is from 0.10 s to 3600 s (1 hour).
Repeat Mode This setting has two options: Continuous and One
Shot. In Continuous mode, the function repeats indefinitely. In One Shot
mode, the output turns off after the function has completed one cycle.
®
5
Page 8
PS-2006 GLX Power Amplifier Output Screen
Wave Polarity This setting has two options: Positive and Negative,
which affect the output functions as illustrated.
To Turn the Output On or Off
•Press .
F1
To Change an Output Setting
Use the arrow keys to highlight a setting in the Output screen. Use one
of the following methods to change the value of the setting.
Method 1 (for Output Device, or Waveform):
1. Press . A menu opens.
2. Use the arrow keys to highlight a menu option and press
Method 2 (for Amplitude, Voltage, Offset, Frequency, or
Period):
• Press or to increase or decrease the value.
Method 3 (for Frequency or Period):
• Press or to increase or decrease the value.
Note: The increment or factor by which the value changes is determined by the
Step Size setting (see below).
+
X
Method 4 (for Amplitude, Voltage, Offset, Frequency, or
Period):
1. Press .
2. Type the desired value and press .
Method 5 (for Period Units, Repeat Mode, or Wave Polarity):
• Press . The setting switches to the other option.
To Change the Step Size
1. Use the arrow keys to highlight Vol t ag e, Amplitude, Offset, Frequency or Period.
2. Press . A menu opens.
3. Use the arrow keys to:
• Highlight a standard step size and press .
or
F2
a. Highlight Custom Step and press .
b. Type a step value and press .
6
®
Page 9

PS-2006 GLX Power Amplifier Graph Screen with Power Amp Config Panel
Graph Screen with Power Amp Config Panel
If you want to look at live data while adjusting the output, you can do so
in the Graph Screen with Power Amp Config Panel.
The Power Amp Config Panel is like an abbreviated version of the Output screen. It allows you to turn the output on or off and to change some
output settings.
To open the Graph Screen with Power Amp Config Panel
• If the Output screen is open, press .
F3
• If the Output screen is not open:
a. Press + . The Graph screen opens.
b. Press . The Tools menu opens.
F1
F3
c. Use the arrow keys to highlight Power Amp Config and press
.
To Switch Activity between Config Panel and Graph
When the Config Panel is active, one of its four fields is highlighted;
pressing or the arrow keys will affect the Config Panel rather than
the Graph. When the Config Panel is not active, those keys can be used
for their normal graph functions (accessing graph fields, moving tools,
etc.).
• Press to switch activity to the Graph.
• Press again to switch activity back to the Config Panel.
Esc
Esc
To Turn Output On or Off
1. Use the arrow keys to highlight Output.
2. Press
To Change a Setting
Use the arrow keys to highlight a setting in the Config Panel and use one
of the following methods.
Method 1:
• Press or to increase or decrease the value.
Method 2:
1. Press .
2. Type the desired value and press .
+
®
7
Page 10

PS-2006 GLX Power Amplifier Output-control Calculations
To Return to the Output Screen
1. Press and hold .
2. Press (once or several times) until the Output Screen Appears.
3. Release .
Output-control Calculations
The GLX's Calculator screen provides three special functions for controlling the signal output. In the Calculator's third Functions menu
(press three times), the functions are abbreviated to outswitch,
outfreq, and outvolume. Parameters of the output that are not affected by
a calculation are set by the values in the Output screen.
For more information on using these functions and the GLX calculator, see the
GLX Users' Guide.
F1
outputswitch(1,
off the Power Amplifier output. The first argument should equal 1. The
second argument, state, can equal any number and determines whether
the output is OFF or ON.
• If state = 0, then the output is OFF.
• If state ≠ 0, then the output is ON.
outputfreq(1,
frequency of the Power Amplifier output. The first argument should
equal 1. The second argument, frequency, sets the frequency, in Hz, of
the output signal. The frequency can be set between 0.1 Hz and 5000
Hz.
outputvolume(
periodic function, or the DC voltage. The argument of the function can
be set between −10 V and 10 V.
state
) Use the outputswitch function to turn on or
frequency
voltage
) Use this function to set the amplitude of a
) Use the outputfreq function to set the
Using Power Amplifier Measurements
In addition to functioning as an output device, the Power Amplifier also
acts like a sensor, sending information about its voltage and current output back to the GLX. The GLX can record these measurements along
with measurements for other sensors. You can select the measurements
for display (in a Graph, Table, Digits, or Meters screens), use them in
calculations (in the Calculator screen), and change their sampling rates
and other settings (in the Sensors screen). In most ways, Power Amplifier measurements are the same as other sensor measurements.
Note: The measurements may not be valid when the over-current indicator
on the Power Amplifier is lit.
About the Measurements
Voltage: The instantaneous output of the Power Amplifier.
8
®
Page 11

PS-2006 GLX Power Amplifier Using Power Amplifier Measurements
Output Frequency: The frequency setting or the inverse of the
period setting.
Current: The instantaneous output current.
Peak Current: The amplitude of the output current signal. The GLX
computes Current by taking half of the difference between the maximum and minimum currents measured over the previous cycle of oscillation. Note that Peak Current is not necessarily equal to maximum
output current. This measurement is not meaningful when the waveform
is set to DC. The sampling rate of the Current measurement must be at
least 1 Hz for the Peak Current measurement to work.
To Record Measurements
1. Press . The GLX starts recording data at the specified sampling
rate for each measurement.
2. Press again to stop recording.
To Display a Measurement
1. Open the Graph, Table, Digits, or Meter screen.
1 / Frequency
Voltage
Current
Peak
Current
Note: If you are operating in the Graph screen with the Power Amp panel visible,
you may need to press to switch activity to the Graph before proceeding.
Esc
2. Press to light up the active fields.
3. Use the arrow keys to navigate to measurement name field on the
axis, column, or segment where the measurement is to be displayed.
4. Press . A menu opens.
5. Use the arrow keys to highlight the desired measurement and press
.
To Change the Sampling Rate
As with other sensors, the Power Amplifier’s measurements are configured in the Sensors screen. The four measurements appear there as four
separate virtual sensors. The sampling rate of each virtual sensor is set
separately.
1. Press + to open the Sensors screen.
2. Use the left and right arrow keys to select a virtual sensor.
3. Press to change the Sample Rate Unit setting to samples/s (for
rates faster than once per second) or to seconds, minutes or hours
(for slower rates).
F4
Virtual sensors
4. Press the down arrow key to highlight Sample Rate.
5. Press or to increase or decrease the rate or time between
+
samples.
®
9
Page 12

PS-2006 GLX Power Amplifier Special Output Examples
Special Output Examples
This section gives some formulas for generating outputs that may be useful in experiments and demonstrations.
Positive Square Wave
Output alternates between zero
and a positive voltage.
The maximum voltage is twice
the amplitude value. The offset
value is equal to amplitude.
Single Positive Ramp
Output starts at zero, increases
to a maximum value, and turns
off.
The maximum voltage is twice
the amplitude value. The offset
value is equal to amplitude.
Heat Pulse
Output is a single pulse of a
specific voltage and duration.
The duration of the pulse is
half of the period value. The
voltage is twice the amplitude
value. The offset value is equal
to amplitude.
This output formula is useful
when using the Power Amplifier with a heating resistor for
adding a predetermined quantity of heat to a calorimeter.
Automatic On
This calculation turns the output on just after you press
to start data recording. Waveform, amplitude, frequency,
and other properties of the output are determined in the Output screen.
10
®
Page 13

PS-2006 GLX Power Amplifier Special Output Examples
Automatic Off
This calculation turns the output off 10 s after the start of
data recording.
Frequency Sweep
This calculation causes the output frequency to start at 20 Hz
and increase at a rate of 10
Hz/s.
It is useful for driving an oscillating system such as an RLC
circuit or resonance tube. As
the driving signal frequency
changes, resonant frequencies
can be detected.
Voltage Controlled by Force
This calculation causes the output voltage to be controlled by
a force sensor connected to the
GLX.
®
11
Page 14

PS-2006 GLX Power Amplifier Special Output Examples
Thermostat
This calculation causes the output to turn on and off in
response to the temperature
measured by a temperature
probe connected to the GLX.
A small light bulb is connected
to the Power Amplifier. The
light bulb and temperature
probe are enclosed together
under a paper cone.
If the temperature is below
24° C, the light bulb turns on to
heat the enclosure. If the temperature is above 24° C, the
light bulb turns off to let the
enclosure cool.
Note that the GLX does not
turn off the output when you
stop data recording. If the
heater happens to be on when
you press to stop, it will
stay on until you manually turn
off the output, or start recording another data run.
Proportional Thermostat
This calculation adjusts the
output voltage (rather than simply turning it on and off) in
response to temperature. As the
temperature approaches the target of 24° C, the voltage
decreases.
The limit function prevents the
output from exceeding 5 V, and
it makes the voltage stay at
zero if the measured temperature exceeds the target.
Note that the final temperature
settles slightly below the target
temperature.
12
®
Page 15

PS-2006 GLX Power Amplifier Sample Experiments: I-V Curves
Sample Experiments
This section presents some examples of how the Power Amplifier can be used in student labs and classroom
demonstrations.
I-V Curves
Additional Equipment Part Number
RLC Circuit Board CI-6512
Patch Cords (2) SE-9750 or SE-9751
In this experiment, the Power Amplifier outputs a slow voltage ramp,
and the GLX plots current versus voltage for a resistor and a light bulb.
Set-up
1. Configure the Output and Graph screens as illustrated (Figure 1).
2. In the Sensors screen ( + ), set the sampling rates of the
F4
Voltage and Current measurements to 10 samples/s.
3. Use two patch cords to connect one of the resistors on the circuit
board to the GLX Power Amplifier.
Procedure
1. Press to start data recording.
2. Turn the output on.
3. Wait until the output turns itself off (after 20 s).
4. Press to stop data recording.
5. Connect a light bulb to the Power Amplifier in place of the resistor.
6. Repeat steps 1 and 4.
Analysis
Compare the current versus voltage curves for the resistor and light
bulb. The curve for the resistor is linear. The inverse of the slope of the
curve is equal to the resistance.
Figure 1: Setup
Light bulb
Resistor
The light bulb curve is not linear because the resistance changes as current increases and the filament becomes hotter. Notice the part of the
curve where the current decreases as the voltage increases.
Further Study
• Generate an I-V curve for a diode or LED. (It may be necessary to
reduce the maximum voltage of the output ramp.)
®
Diode
LED
Figure 2: Typical Data
13
Page 16

PS-2006 GLX Power Amplifier Sample Experiments: RLC Circuit
RLC Circuit
Additional Equipment Part Number
RLC Circuit Board CI-6512
Patch Cords (2) SE-9750 or SE-9751
In this experiment, the Power Amplifier drives an RLC circuit with a
variable-frequency sine wave.
Part I: Current versus Frequency
Set-up
1. Configure the Output, Calculator, and Graph screens as illustrated
(Figure 3).
2. Use two patch cords and the
RLC circuit board to create
the illustrated circuit.
Procedure
1. Turn the output on.
Powe r
Amplifier
C = 330 µF
L = 8.2 mH
R = 10 Ω
2. Press to start data recording.
3. Watch the Graph screen as the Peak Current versus Frequency is
plotted.
4. Press to stop data recording.
Analysis
Identify the resonant frequency where the maximum current amplitude
occurred.
Part II: Phase versus Frequency
Set-up
1. Delete the calculation in the Calculator screen. (This will allow you
to set the frequency manually.)
2. Configure the Graph screen as follows:
a. Open the Graph screen.
b. From the Graphs menu ( ), select New Graph Page. The
F4
GLX creates a voltage versus time graph.
Figure 3: Part I Set-up
Air core
Metal core
Figure 4: Typical Data
14
c. From the Graph menu, select Two Measurements. The GLX
adds a second measurement to the graph.
d. Change the second measurement (on the right side of the
graph) to Current.
Figure 5: Part II Set-up
®
Page 17

PS-2006 GLX Power Amplifier Sample Experiments: RLC Circuit
e. From the Graphs menu, select Scope Mode.
f. Press to set the trigger for a rising edge at 0 V.
g. From the Tools menu ( ), select Power Amp Config.
F3
The Graph screen should now look similar to Figure 5.
Procedure
1. Turn on the output (if it is not already on).
2. Press to start displaying live scope traces.
3. In the Power Amp Config panel, set the output frequency to the cir-
cuit’s resonant frequency (which you found in Part I).
4. Adjust the scale ( , or ) to display a few full cycles.
F2
5. Write down the approximate phase relationship between voltage
and current.
6. Change the output frequency to 1/4 of the resonant frequency.
Repeat steps 4 and 5.
7. Change the output frequency to 4 times the resonant frequency.
Repeat steps 4 and 5 again.
Analysis
When are voltage and current in phase? When does current lead voltage? When does current lag voltage?
Further Study
• Repeat the experiment with a different value of R, C, or L.
• While watching voltage and current in the scope-mode graph,
change L by moving the metal core in the coil. Observe the effect
on the current amplitude and phase.
• Repeat the experiment with a parallel RLC circuit.
• Create an RLC circuit with as little resistance as possible and low
capacitance (about 10 µF). Drive the circuit with a square wave to
observe the circuit “ringing.” Vary L or C to change the frequency.
Va r y R to change the damping.
Figure 6: Typical Data
Figure 7: Parallel RLC Data
Voltage Current
Figure 8: Ringing
®
15
Page 18

PS-2006 GLX Power Amplifier Sample Experiments: Ohm’s Law and Resistivity
Ohm’s Law and Resistivity
Additional Equipment Part Number
Resistance Apparatus
EM-8812
or
a length of wire and four alligator
clip adapters
Galvanometer Sensor PS-2160
Patch Cords (2) SE-9750 or SE-9751
In this experiment, the GLX makes a four-wire resistance measurement
of a length of wire. The Power Amplifier measures the current through
the wire, and a galvanometer sensor measures the voltage drop across it.
The galvanometer sensor is used (rather than the Power Amplifier’s
built-in voltage measurement) because is measures the voltage only
over the selected length of wire. The Power Amplifier, on the other
hand, registers the voltage at its output terminals. These quantities are
not equal, especially at high current when the voltage drop across the
output leads can be significant.
While a single measurement of voltage and current is sufficient to determine resistance using Ohm’s Law, a more precise method is to vary the
voltage and measure the changing current. On a plot of voltage versus
current, the slope of the best-fit line is equal to resistance.
Set-up
1. Set up a resistance apparatus or a simple length of wire as follows.
• Resistance apparatus:
a. Select a wire and install it in the apparatus.
b. Place the reference probe at 0 cm.
c. Place the slider probe at any point along the wire.
d. Use two patch cords to connect the power jacks of the
apparatus to the Power Amplifier.
e. Connect the galvanometer sensor to the reference and
slider probes of the apparatus.
• Length of wire
a. Use two alligator clips and two patch cords to connect the
Power Amplifier to the ends of the wire.
b. Use two other alligator clips to connect the galvanometer
sensor to two points along the length of the wire.
a
b
b
a
Figure 9: Resistance Apparatus (left)
or Length of Wire (right)
(a) to Power Amplifier
(b) to Galvanometer Sensor
a
b
b
a
2. Connect the galvanometer sensor to the GLX.
16
®
Page 19

PS-2006 GLX Power Amplifier Sample Experiments: Ohm’s Law and Resistivity
3. Configure the Output and Graph screens as illustrated (Figure 10).
Be certain that the voltage measurement selected for the vertical
axis of the graph is the measurement made by the galvanometer
sensor, recognizable by the icon, (not the Power Amplifier’s
measurement with the icon).
4. In the Output screen, set the voltage step size to 0.01 V:
c. Use the arrow keys to highlight Volt ag e.
d. Press , and select Custom Step.
F2
e. Type 0.01 and press .
5. In the Sensors screen ( + ), set the sampling rates of all
F4
sensors to 10 Hz.
Procedure
1. Open the Graph screen.
2. Make sure that the output voltage (the Amplitude setting in the
Output Config Panel) is set to 0 V.
3. Turn the output on.
4. Use the arrow keys to highlight the Amplitude setting.
5. Press to start recording data.
6. Press and hold . The output voltage starts increasing.
+
7. Watch the increasing current measurement on the graph. Before it
reaches 1 A, release .
+
Figure 10: GLX Set-up
8. Press to stop recording data.
9. Turn off the output.
Analysis
Use the Linear Fit tool (from the Tools menu) to find the best-fit
F3
line. The slope of the line equals the resistance, R.
Measure the cross-sectional area, A, of the wire. Measure the length, ,
across which the resistance was measured.
The resistivity, ρ, of the wire material is given by
(eq. 1)
RA
ρ
-------=
Further Study
• Measure the resistance of different lengths of the same wire. Make
a plot of R versus . The slope is equal to ρ/A.
®
Figure 11: Data
20 cm
10 cm
Figure 12: Two different lengths of the
same wire
17
Page 20

PS-2006 GLX Power Amplifier Sample Experiments: Standing Wave on a String
Standing Wave on a String
Additional Equipment Part Number
String Vibrator WA-9857
Patch Cords (2) SE-9750 or SE-9751
Super Pulley ME-9450
String (about 2 m) ME-9876
Hanging Mass (about 400 g)
Rods and clamps (as pictured)
In this experiment, the Power Amplifier outputs a variable-frequency
sine wave to drive a vibrating string.
Theory
For any wave with wavelength λ and frequency f, the speed
(eq. 2)
V λf=
V is
The speed of the wave is also given by
(eq. 3)
F
V
---=
µ
where F is the tension in the string, and µ is the linear density
(mass/length) of the string.
In this experiment, the string vibrator drives a string. At certain driving
frequencies, a standing wave occurs with an integer number of vibrating
segments. The wavelength is equal to the length of 2 segments. If the
length of the string is L , then
Mass
~400g
String
1–2 m
String
Vibrator
(eq. 4)
2L
λ
------= n 123…,,,=
n
Combining equations 2, 3, and 4 yields
n
F
(eq. 5)
------
f
2L
---=
µ
If F, L and µ are constant, then the slope of the f versus n graph is equal
to .
F µ⁄ 2L()⁄
Set-up
1. Set up the equipment as illustrated (Figure 13).
2. Use two patch cords to connect the Power Amplifier to the string
vibrator.
3. Configure the Output screen as illustrated (Figure 14).
18
Figure 13: Equipment Set-up
Figure 14: Output Setup
®
Page 21

PS-2006 GLX Power Amplifier Sample Experiments: Standing Wave on a String
4. Setup the GLX for manual sampling:
a. Press + to open the Sensors screen.
b. Press to open the Mode menu.
F4
F1
c. Press the down arrow key to highlight Manual and press .
The Data Properties box opens.
d. With Measurement Name highlighted, press , type n, and
press .
The Data Properties box should now look like Figure 15.
e. Press (OK) to close the Data Properties box.
F1
5. Hold and press to return to the Output screen.
Procedure
1. Press . The flashing icon appears to indicate that the GLX is
ready to record manually triggered points.
2. Turn the output on ( ).
F1
3. Use the up or down arrow key to highlight the Frequency setting.
4. Press (or press and hold) to increase driving frequency until it
+
gets close to a resonant frequency. (See sidebar, “How to find a
Resonant Frequency.”)
5. Change the frequency step size to 0.1 Hz (press ).
6. Press and to adjust the frequency up and down until you
+
F2
have found the resonant frequency (to the nearest 0.1 Hz).
Figure 15: Data Properties Box for
Manual Sampling
How to find a Resonant Frequency
At the string's resonant frequency, there
should be a node (a point of minimum
movement) where the string is attached
to the string vibrator (Figure 16a). Maximum amplitude does not necessarily
indicate the resonant frequency, especially at lower frequencies.
If the tongue of the string vibrator is moving excessively (Figure 16b), increase
the frequency until tongue movement is
almost imperceptible.
If a node occurs on the string close to
the tongue, but not at the attachment
point (Figure 16c), decrease the frequency to move the node toward the
tongue.
7. Press . The GLX records the frequency and prompts you to
enter the number of segments.
8. Enter the number of segments and press .
9. Set the step size back to 1 Hz.
10. Repeat steps 4 through 9 for all harmonics up to 5 or 6 segments.
Adjust the output amplitude as needed.
11. When you have finished collecting all data, press to end the
data run.
12. Turn the output off ( ).
F1
Analysis
1. Open the Graph screen and configure it as with Output Frequency
on the vertical axis and n on the horizontal axis (Figure 17).
2. From the Tools menu ( ), select Linear Fit.
®
F3
a
b
c
Figure 16: (a) Node at tongue
(b) & (c) Node not at tongue
Figure 17: f versus n
19
Page 22

PS-2006 GLX Power Amplifier Sample Experiments: Standing Wave on a String
3. If necessary, use the arrow keys to select the entire data set, or the
part of the data set that you want the fit applied to.
According to equation 5, the slope of the best-fit line is equal to
F µ⁄ 2L()⁄
. Measure the length of the string (from the string vibrator
to the pulley), the mass of one meter of string, and the hanging mass.
Calculate and compare it to the actual slope.
F µ⁄ 2L()⁄
Further Study: Force versus Frequency
1. Start a file on the GLX. (Go to the Data Files screen, press
F4
and select New File.)
2. Connect a force sensor to the GLX.
3. Hang the force sensor in place of the hanging mass. Let the force
sensor hang freely with just its own weight (Figure 18).
4. Set up the GLX for manual sampling without hand-entered data:
a. Press + to open the Sensors screen.
b. Press to open the Mode menu.
F4
F1
c. Press the down arrow key to highlight Manual and press .
The Data Properties box opens.
d. Press (No Data).
F2
5. In the Output Screen, adjust the output frequency and amplitude to
produce a second-harmonic standing wave (two segments).
6. Set the frequency step size to 10 Hz.
Figure 18: Force Sensor
7. Press . The flashing icon appears to indicate that the GLX is
ready to record manually triggered points.
8. Press to record a data point.
9. Increase the output frequency by 10 Hz (press ).
+
10. Pull the force sensor to increase the tension of the string until it res-
onates in the second harmonic again.
11. Press to record another data point.
12. Repeat steps 9 through 11 for up to 5 or 6 data points. Adjust the
output amplitude as needed.
13. When you have finished collecting all data, press to end the
data run.
14. In the Calculator screen, create a calculation to give the square root
of force (Figure 19a).
15. Compare the graphs of f versus F and f versus . Which one
F
shows a linear relationship?
a
b
c
Figure 19: (a) calculation
(b) f vs. F (c) f vs.
F
F
20
®
Page 23

PS-2006 GLX Power Amplifier Sample Experiments: Electrical Equivalent of Heat
Electrical Equivalent of Heat
Additional Equipment Part Number
Energy Transfer Calorimeter ET-8499
Fast Response Temperature Probe PS-2135 (included with GLX)
Mass Balance SE-8757A
Cool water (about 500 g)
In this experiment, the Power Amplifier delivers a known quantity of
energy into the calorimeter, and the resulting temperature change is
measured.
Theory
The relationship between the heat (Q) added to a solid or liquid and the
resulting change in temperature (∆T) is given by
(eq. 6)
Qmc∆T=
Where c is specific heat and m is mass.
There are two things changing temperature in this experiment: the water
and the inner aluminum cup of the calorimeter. The water and cup have
different masses and different specific heats, but they both experience
the same temperature change.
Heat is added to the calorimeter by the use of a heating resistor. The
Power Amplifier supplies power to the heating resistor.
Electrical power is determined by the output voltage (V) and current (I):
(eq. 7)
PIV=
Power is the rate of energy, thus energy is the area under a Power versus
time graph.
Pre-lab
specific heat
-1 K-1
(J g
water 4.2
aluminum 0.9
)
1. Measure the mass of the inner calorimeter cup.
2. Add about 50 g of cool water to the inner cup. The water should ini-
tially be about 5° C below room temperature. After the cup and
water have come to equilibrium and you are ready to start the
experiment, it should be about 3° C below room temperature.
3. Measure the mass of the cup plus water, and calculate the mass of
the water.
Setup
1. Insert the fast response temperature probe into the calorimeter lid as
illustrated (Figure 20). The tip of the probe should be about 1 cm
from the heating resistor. Put the tip of a pencil into the rubber stopper to hold the temperature probe in place.
®
a
b
Figure 20: Equipment Setup
(a) calorimeter lid (b) heating resistor
(c) temperature probe
c
21
Page 24

PS-2006 GLX Power Amplifier Sample Experiments: Electrical Equivalent of Heat
2. Assemble the calorimeter using the plastic spacer to suspend the
inner cup (containing water) in the outer cup.
3. Place the lid on the calorimeter. Ensure that the probe is underwater
but does not touch the cup.
4. Make sure that the output of the Power Amplifier is turned off.
5. Connect the calorimeter’s heating resistor leads to the Power
Amplifier.
6. Connect the temperature probe to one of the temperature ports on
the side of the GLX.
7. Configure the Output, Calculator, and Graph screens as illustrated
(Figure 21). The output settings will produce a single 10 V pulse
with a duration of 200 s.
8. In the Sensors screen ( + ), set the sampling rates of all
F4
sensors to 1 Hz.
Procedure
Before you start, make sure that the output is turned off.
1. Press to start recording data.
2. Look at the graph to confirm that the starting temperature is about
3° C below room temperature and relatively constant.
3. After about 10 s, turn the output on.
4. Gently swirl the calorimeter every 15 seconds as power is supplied
to the heater.
5. When the heater turns off (after 200 s), start swirling the calorime-
ter continuously. Continue to swirl until the temperature begins to
decrease.
6. Press to stop data recording.
Analysis
Figure 21: GLX Set-up
1. Determine the temperature change, ∆T, from the graph.
2. Use Equation 6 to calculate the total amount of heat added to the
water and to the inner aluminum cup. Remember that the water and
cup each have their own values of mass and specific heat.
3. In the Graph screen, make a graph of Power versus time. The area
under the power curve is the electrical energy delivered to the calorimeter.
4. Compare the electrical energy to the total added heat.
22
Figure 22: Data
®
Page 25

PS-2006 GLX Power Amplifier Specifications
Specifications
Output Range ±1 A @ 10 V
Output Current Limit ±1.5 A
Over-current Indicator 1 A
DC Offset ± 10 V (with total output limited to ±10 V)
Output Step Size 0.01 V
Waveform Maximum Frequency 5000 Hz
Waveform Maximum Period 1 hour
Waveforms DC, Sine, Square, Triangle, Ramp
Current Measurement Range ±1 A
Current Measurement Resolution 0.5 mA
Current Measurement Accuracy 3%
Current Measurement Maximum Sample Rate 25000 samples/s
Load Regulation 1%
Output Noise 20 mV p-p, typical
Output Connectors Shock proof 4 mm “banana” jacks, 0.75 inch spacing (19 mm).
Black connector common with earth ground.
Technical Support
For assistance with any PASCO product, contact PASCO at:
Address: PASCO scientific
10101 Foothills Blvd.
Roseville, CA 95747-7100
Phone: 916-786-3800 (worldwide)
800-772-8700 (U.S.)
Fax: (916) 786-7565
Web: www.pasco.com
Email: support@pasco.com
Limited Warranty
For a description of the product warranty, see the PASCO catalog.
Copyright
The PASCO scientific 012-09937A
granted to non-profit educational institutions for reproduction of any part of this manual, providing the reproductions are used only in
their laboratories and classrooms, and are not sold for profit. Reproduction under any other circumstances, without the written consent of PASCO scientific, is prohibited.
GLX Power Amplifier Instruction Manual
is copyrighted with all rights reserved. Permission is
Trademarks
PASCO, PASCO scientific, DataStudio, PASPORT, Xplorer, and Xplorer GLX are trademarks or registered trademarks of PASCO scientific, in the United States and/or in other countries. All other brands, products, or service names are or may be trademar ks or service marks of, and are used to identify, products or services of, their respective owners. For more information visit
www.pasco.com/legal.
Author: Alec Ogston
®
23
 Loading...