

Page 1

Instructions
Experiments
Sample Data
Instruction Manual
No. 012-08745A
Energy Tr ansfer–
Thermoelectric
ET-8782
Page 2

Energy Transfer–Thermoelectric Model No. ET-8782
Table of Conte nts
Introduction. . . . . . . . . . . . . . . . . . . . . . . . . . . . . . . . . . . . . . . . . . . . . . . . . . . . . . . . . . . . . . . .4
Experiment 1:
Conservation of Energy and the First Law of Thermodynamics . . . . . . . . . . . . . . . . . . . . . 9
Experiment 1:
Teachers’ Notes–Conservation of Energy and the First Law of Thermodynamics . . . . . 15
Experiment 2:
Load Resistance and Efficiency . . . . . . . . . . . . . . . . . . . . . . . . . . . . . . . . . . . . . . . . . . . . . . 17
Experiment 2:
Teachers’ Notes–Load Resistance and Efficiency . . . . . . . . . . . . . . . . . . . . . . . . . . . . . . . 23
Experiment 3:
A Model Refrigerator . . . . . . . . . . . . . . . . . . . . . . . . . . . . . . . . . . . . . . . . . . . . . . . . . . . . . . . 25
Experiment 3:
Teachers’ Notes–A Model Refrigerator . . . . . . . . . . . . . . . . . . . . . . . . . . . . . . . . . . . . . . . . 29
Experiment 4:
Coefficient of Performance . . . . . . . . . . . . . . . . . . . . . . . . . . . . . . . . . . . . . . . . . . . . . . . . . . 31
Experiment 4:
Teachers’ Notes–Coefficient of Performance . . . . . . . . . . . . . . . . . . . . . . . . . . . . . . . . . . .37
Experiment 5:
Teachers’ Notes–Carnot Efficiency . . . . . . . . . . . . . . . . . . . . . . . . . . . . . . . . . . . . . . . . . . . 39
Safety. . . . . . . . . . . . . . . . . . . . . . . . . . . . . . . . . . . . . . . . . . . . . . . . . . . . . . . . . . . . . . . . . . . . 41
Technical Support . . . . . . . . . . . . . . . . . . . . . . . . . . . . . . . . . . . . . . . . . . . . . . . . . . . . . . . . . 41
Copyright and Warranty Information . . . . . . . . . . . . . . . . . . . . . . . . . . . . . . . . . . . . . . . . . . 41
Page 3

Model No. ET-8782 Energy Transfer –T her m oelectri c
®
Energy Transfer–Thermoelectric
Model No. ET-8782
11
6
5
2
3
4
Included Equipme nt Replace m ent P art N um ber
1. Thermoelectric circuit board
2. Foam insulators (qty. 2)
3. Heat sink
4. Thumbscrew
5. Temperature cables (qty. 2)
6. Banana patch cords (qty. 8)
ET-8782
648-08724
624-013
617-01 8 an d 615-031
PS-2515
SE-7123
7. CD-ROM containing editable experiment instructions
and DataStudio
®
files (not pictured)
Contact Tech Support
3
Page 4
Energy Transfer–T herm o el ectri c Introduction
®
Additional Equipment Required Model Number
DC Power Supply (10 V , 1 A minimum)
Temperature Sen sor(s), compatible with 10 kΩ thermistors
Voltage and Current Sensor(s)
PASCO Computer Interface
DataStudio software
Optional Equipment Model Number
Fast Response Temperature Probes
Decade Resistance Box
SE-972 0A or equivalent
Various, see note below
Various, see note below
Various, see note below
See PASCO catalog
PS-2135 (3-pack)
SE-712 2 or equivalent
Note
The most convenient combination of interface and sensors for use with the Thermoelectric circuit
board is:
• PS-2001 PowerLink interface
• PS-2143 Quad Te mperature Sensor
• PS-2115 Voltage/Current Sensor
• PS-2135 Fast Response Temperature Probes (3-pack), optional
This is the equipment ca lled for by the experime nts in this manual and on the C D-ROM. There are
other options for PASPORT™ and ScienceWorkshop® sensors and interfaces, and stand-alone
multimeters. Please contact Tech Support, or see the PASCO catalog or website for details.
Introduction
The Energy T ransfer–Thermoelectric circuit board provides students with a hands-on example of
a thermoelectric heat engine. Using measurements from temperature, voltage and current sensors,
students will quantitatively study the energy, work and heat flow associated with heat engines,
heat pumps and refrigerators.
This manual includes instructions for five e xperime nts with sample data and teachers’ notes. You
can photocopy the student instructions or print them from the editable copy of this manual
included on the CD-ROM. Experiment #5 is a DataStudio workbook, which contains the student
instructions within the DataStudio file.
In addition to the experiments detailed here, the Thermoelectric board is well-suited for selfguided exploration. The following sections will familiarize you with the components of the
experimental set-up.
4
Page 5

Model No. ET-8782 Introduction
®
5
4
2
6
1
3
1. Peltier Device with Hot and Cold Reservoirs
The Peltier Device is constructed of two ceramic plates with p and n semiconductors in between.
As DC current passes through the device, it pumps heat from one side to the other. Aluminum
blocks are fastened to each side of the peltier in thermal contact with the ceramic plates. These
blocks add thermal mass to the system and act as the traditional Hot and Cold Reservoirs. When
there is a temperature difference across the peltier, it can be s witched to Heat Engine Mode, in
which spontaneous heat flow through the device generates an electric current. Do not touch the
hot aluminum block when it is running in Heat Pump Mode. The temperature of this block can
reach 90 °C or higher.
Do not allow the peltier device to reach temperatures above 100 ºC. Always monitor the
temperature of the hot side whe n the peltier is oper ating in Heat Pump Mode. Operation between
80 °C and 100 °C will shorten the life of the device; if you operate the device in that temperature
range, do so for the briefest possible time. You can operate the peltier device without damage at
temperatures below 80 °C.
5
Page 6

Energy Transfer–T herm o el ectri c Introduction
®
2. Input Power
Input Power for the board must be supplied from an external DC power supply capable of 1 amp
at 10 volts. Connect the power supply via the red and black banana jacks on the right-hand side of
the board. Note the polarity: red must be positive. Do not input more than 10 volts.
3. Load Resistors
In Heat Engine Mode, a jumper cable must be connected from the bottom banana jack terminal to
one of the terminals labeled A through D. The load resistance depends on how you connect the
jumper cables. If, for example, the jumper is connected to terminal A, then all of the resistors ar e
in series in the circuit, and the total load resistance is 20 Ω + 7 Ω + 3 Ω = 30 Ω. If the jumper is
connected to terminal C, the load resistance is 3 Ω. A second jumper can also be used across a
resistor to remove it from the circuit. For example, if the mai n jumpe r from th e bottom connector
is plugged into terminal A, and a second jumper is connected between B and D, the total load
resistance is 20 Ω; the 7 Ω and 3 Ω resistors are bypassed.
The possible combinations are 3 Ω, 7 Ω, 10 Ω, 20 Ω, 23 Ω, 27 Ω and 30 Ω. If you use a decade
resistance box instead of the on-board resistors, you can supply any value you want. You can also
connect the jumper from the bottom terminal directly to terminal D, which reduces the load
resistance to a few tenths of an ohm (due to the internal resistance of the circuit).
4. Knife Switch
The single pole double throw Knife Switch on the right side of the board is used to select the
mode of operation. In Heat Pump Mode, external power is applied to the peltier device, and heat
is pumped from the aluminum block on the cold side to the block on the hot side. In Heat Engine
Mode, the external power is disconnected, and heat flows back through the peltier, generating
electric current through the load resistor.
5. Voltage and Current
Voltage and current sensors connected to the banana jacks at the top of the board will measure
voltage across and current through the peltier. Note the polarity when you connect the sensors. A
single PASPORT Voltage/Current sensor can be used for both measurements. If you plan to run
the peltier without a current sensor, you must connect a jumper between the current terminals to
complete the circuit.
From the measured voltage and current, DataStudio will calculate the power supplied to the
peltier (in Heat Pump mode ) or power genera ted by the pelti er (in Heat Engine mode). DataS tudio
will plot a graph of power versus time, which it will use to calculate input or output energy.
6. Temperature Ports
Each aluminum block has a 10 kΩ thermistor embedded in it. Use the provided Temperature
Cables to connect temperature sensors to the thermistors through the hot-side and cold-side
6
Page 7

Model No. ET-8782 Introduction
®
Temperature Ports. The temperature sensor measures the resistance of the thermistor and
translates it into a temperature reading. If you are using a PASPORT Quad Te mper ature sensor,
you will connect both temperature ports (and up to two additional probes) to a single sensor.
From the measured temperature change, DataStudio will calculate the heat flow into or out of the
aluminum blocks.
7
8
9
7. Foam Insulators and Heat Sink
The Foam Insulators are used to insulate one side or both sides of the peltier. For conservation of
energy studies, use both insulators to minimize heat exchange with the environment. If needed,
you can put a rubber band around them to hold them tightly together .
The Heat Sink, which helps to dissipate heat, fastens to the hot-side aluminum block with the
provided thumb screw. For more efficient cooling, the fins of the heat sink should be ver tical. Be
careful when removing the heat sink because it can get very hot.
In some experiments, you will have an insulator on the cold side, and the heat sink on the hot side.
8. Cooling Fan
The Cooling Fan and heat sink act together t o dissipate heat from the hot r eservoir . T he fan is used
when demonstrating a refrigerator. You can also use it to cool the aluminum blocks back to room
temperature, which is a required initial condition in some experiments.
The fan is operated through a switch in the center of the board and it is powered by the same
external power supply that powers the peltier. The fan has a built-in regulator, so it will run at a
constant speed when the input voltage is 6 volts or higher. Do not use the fan when the input
voltage is below 4 volts.
7
Page 8

Energy Transfer–T herm o el ectri c Introduction
®
9. Temperature Sensor Clamps
When modeling a refrigerator it is useful to observe the heat flow around the heat sink. Two
Temper ature Sensor Clamps (one high, one low) are provided to position Fast Response
Temper ature Probes (not included) in the air stream from the fan before and after the air has
passed through the heat sink.
8
Page 9

Model No. ET-8782 Energy Transfer –T her m oelectri c
®
Experim ent 1:
Conservation of Energy and the First Law of Thermodynamics
Equipment Required Part Number
Thermoelectric circuit board
Foam insulators (qty. 2)
Banana patch cords (qty. 5)
Temperature cables (qty. 2)
DC Power Supply (10 V, 1 A minimum)
PASPORT Voltage/Current Sensor
PASPORT Quad Temperature Sensor
PASPORT interface(s)
DataStu d io software
“Conservation of Energy” configuration file for DataStudio
part of ET -8782
part of ET -8782
part of ET -8782
part of ET -8782
SE-972 0A or eq uiv a le nt
PS-2115
PS-2143
PS-2001 or equivalent
See PASCO catalog
part of ET -8782
Introduction
In this activity you will study the flow of energy in the experimental set-up as you run it through a
cycle.
First you will operate the apparatus in Heat Pump mode, in which energy is supplied to the peltier,
and the peltier pumps heat from one aluminum block to the other. After a temperature difference
has been established between the blocks, you will switch the peltier into Heat Engine mode, in
which heat flows from the hot block, through the peltier, and into the cold block. The peltier will
convert some of the heat that flows out of the hot block to electrical energy, which it will supply to
the load resistor.
During this cycle you will follow the energy as in moves in different forms from the power supply
to the peltier (electrical energy), in and out of the aluminum blocks (heat or thermal energy), and
into the load resistor (electrical energy). As you do the experiment, bear in mind the law of
conservation of energy and the first law of thermodynamics. How do they relate to the transfer of
energy within the system?
Set-Up
1. Input Power: Set the Heat Pump/Heat Engine switch to the neutral position (straight up).
Connect the power supply using banana patch cords to the input power terminals on the
circuit board as shown in picture below. Note the polarity.
9
Page 10
Energy Transfer–T hermo el ectric Conservation of Energy and the First Law of Thermo dyn ami cs
®
2. Load Resistance: Connect a jumper from
the terminal at the bottom of the board to
Terminal B. This makes the load resistance
3 Ω + 7 Ω = 10 Ω.
3. Insulators: Place both foam insulators on
the aluminum blocks.
4. Temperature: Connect the cables from the
temperature ports to the Quad Temperature
Sensor . Connect the Cold Side to Channel 1
of the sensor and the Hot Side to Channel 2.
5. Voltage: Connect the voltage leads of the
Voltage/Current Sensor to the Voltage Ports
on the board. Note the polarity.
6. Current: Connect separate red and
black banana patch cords from the
current input of the Voltage/Current
sensor to the Current Ports on the
board. Note the polarity.
Ch 2
Temperature
Sensor
Ch 1
Voltage/Current
Sensor
Power Supply
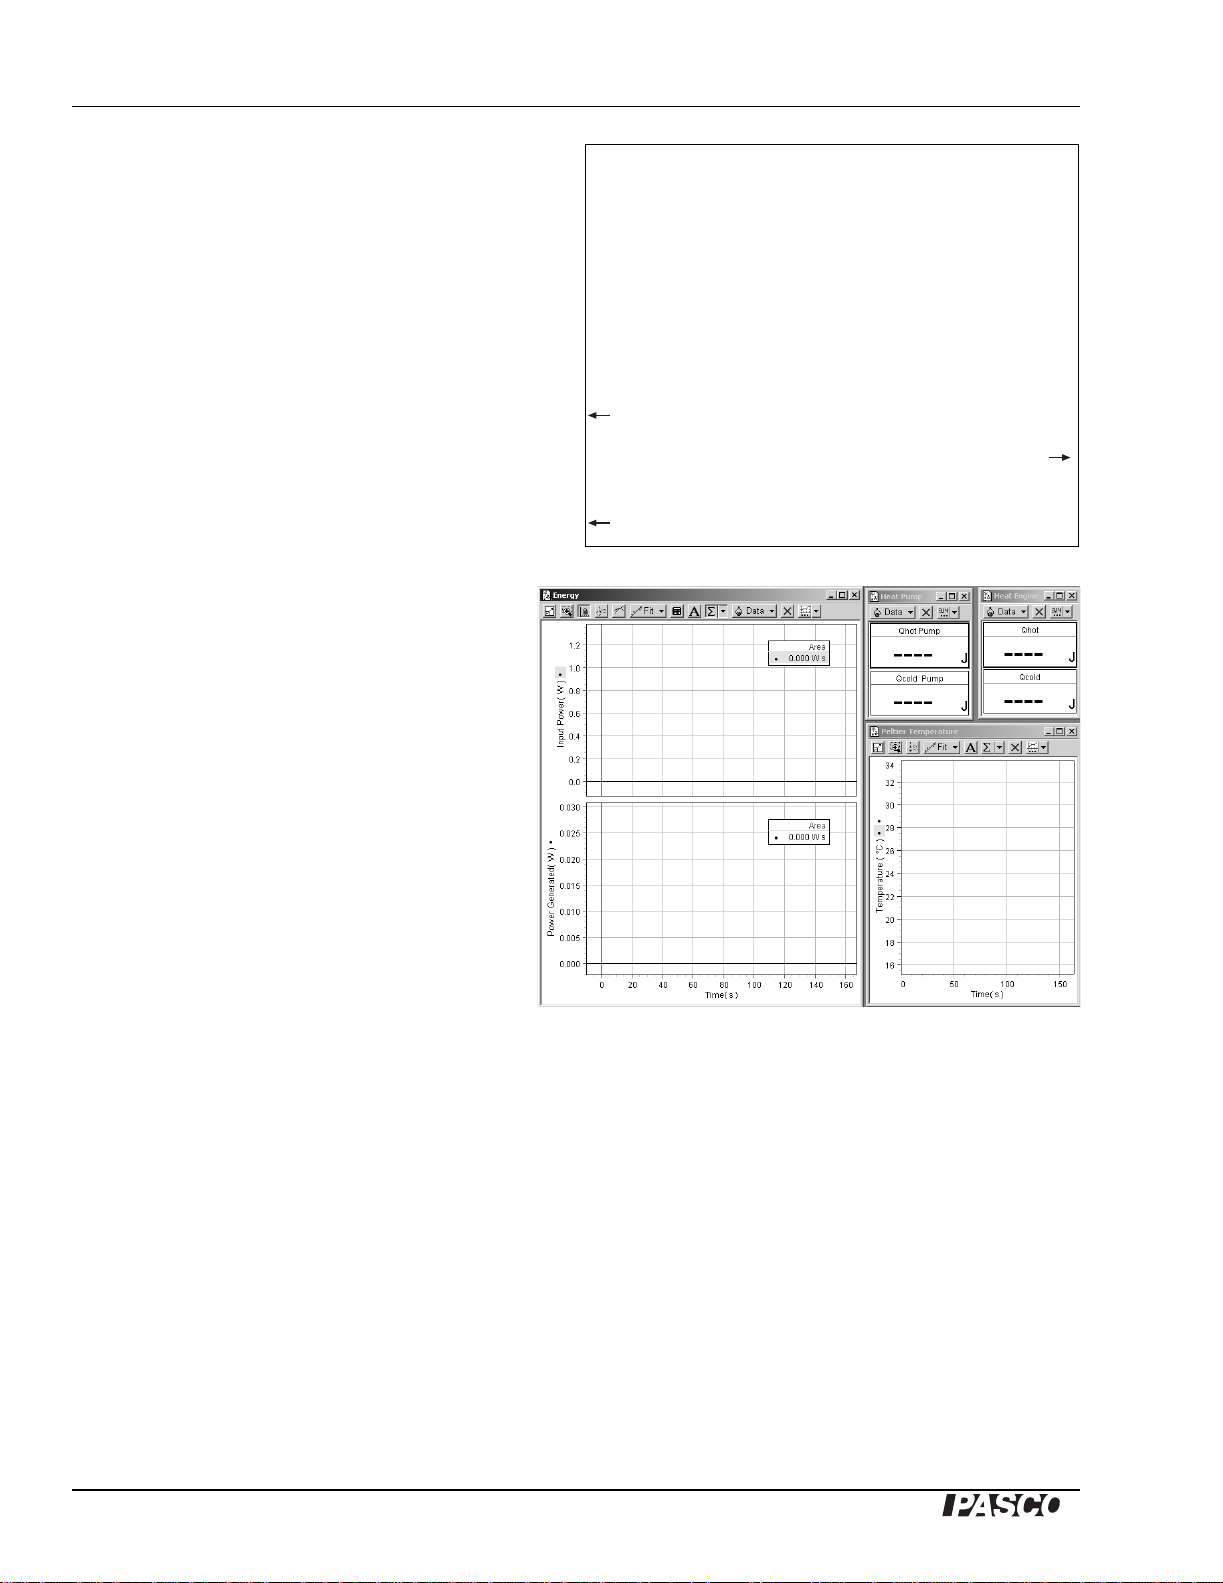
7. Computer: Connect the sensors to the
computer through the PASPORT
interface. Open the pre-configured
DataStudio file “Conservation of
Energy”. The display should look as
shown here.
Background
DataStudio has been configured to measure and record the temperature of both aluminum blocks,
the voltage and current applied to the peltier during Heat Pump mode, a nd the voltage and current
generated by the peltier during Heat Engine mode. From these measured quantities, DataStudio
will calculate and display heat flow, power and work. The following sections explain how
DataStudio makes those calculations.
Heat vs. Temperature
Each digits display shows the heat ( Q
either the hot or cold side of the peltier. The relationship between heat flow and temperature
change is given by
hot
or Q
) that flows into or out of the aluminum block on
cold
10
Q = mc∆T
where:
Page 11

Model No. ET-8782 Experiment 1: Conservation of Energy and the First Law of Thermo dyn ami cs
®
Q = heat transferred,
m = mass of the aluminum block,
c = specific heat of aluminum = 0.90 J/(g·°C),
∆T = change in temperature.
A positive value of Q may represent heat transferred into or out of the aluminum block,
depending on whether the block is on the hot side or the cold side of the peltier, and whether the
peltier is operating as a heat pump or a heat engine.
The temperature of each block is measured by the embedded thermistor. DataStudio calculates the
heat flow from the measured temperature change, and pre-entered values of m and c. Click on the
calculator icon in the tool bar and look at the equations used; note the constants, m and c, in the
bottom section of the calculator window. (The mass of each block is about 19 g. If you would like
to enter your own value for the mass, measure the blocks with calipers and use the density of
aluminum, 2.7 g/cc, to calculate the mass, then enter it in the calculator.)
Input Power and Work Done by the Peltier Heat Pump
In Heat Pump mode, Input Power from the power supply equals the rate at which the peltier does
work to pump heat out of the cold reservoir and into the hot reservoir . The Voltage/Current Sensor
measures the voltage applied to the peltier, and the current that flows through it. DataStudio
calculates the Input Power using the equation: Power = Voltage × Current.
The area under the plot of Input Power versus ti me equals the ener gy supplied to the peltier , which
equals the work done by the peltier.
Power Generated and Work Done by the Peltier Heat Engine
In Heat Engine mode, Power Generated is the rate at which the peltier does work on the load
resistor . The Voltage/Current sensor measures the voltage across the resistor and the current
through it. From these measurements, DataStudio calculates the power supplied to the load
resistor . The area under the plot of Power Generated versus time equals the work that the peltier
has done on the resistor.
Procedure
Before you start, the aluminum blocks should both be at room temperature. The knife switch
should be in neutral position ( s traight up) and the fan should be switched off.
Set the DC Voltage to between 3 and 4 volts.
Start data recording, then set the knife switch to Heat Pump.
You will see Input Power data appear in the top section of graph. The area under the graph equals
the energy supplied to the peltier, which equals the work done by the heat pump. The Heat Pump
digits display shows the heat pumped out of cold reservoir (Q
hot reservoir (Q
hot
).
) and the heat deposited into the
cold
11
Page 12
Energy Transfer–T hermo el ectric Conservation of Energy and the First Law of Thermo dyn ami cs
®
Observe how the temperatures of the aluminum blocks change.
Run the peltier in Heat Pump mode for about a minute (or until the cold side appears to reach a
minimum temperature), then switch to Heat Engine mode.
Again, observe how the temperatures of the aluminum blocks change.
Power Generated data now appears in the bottom section of the graph display . The area under the
graph equals the energy generated by the heat engine and supplied to the load resistor. The Heat
Engine digits display shows the heat that has flowed out of the hot reservoir (Q
that has flowed into the cold reservoir (Q
cold
).
) and the heat
hot
Continue to record until the aluminum blocks are close to the same temperature.
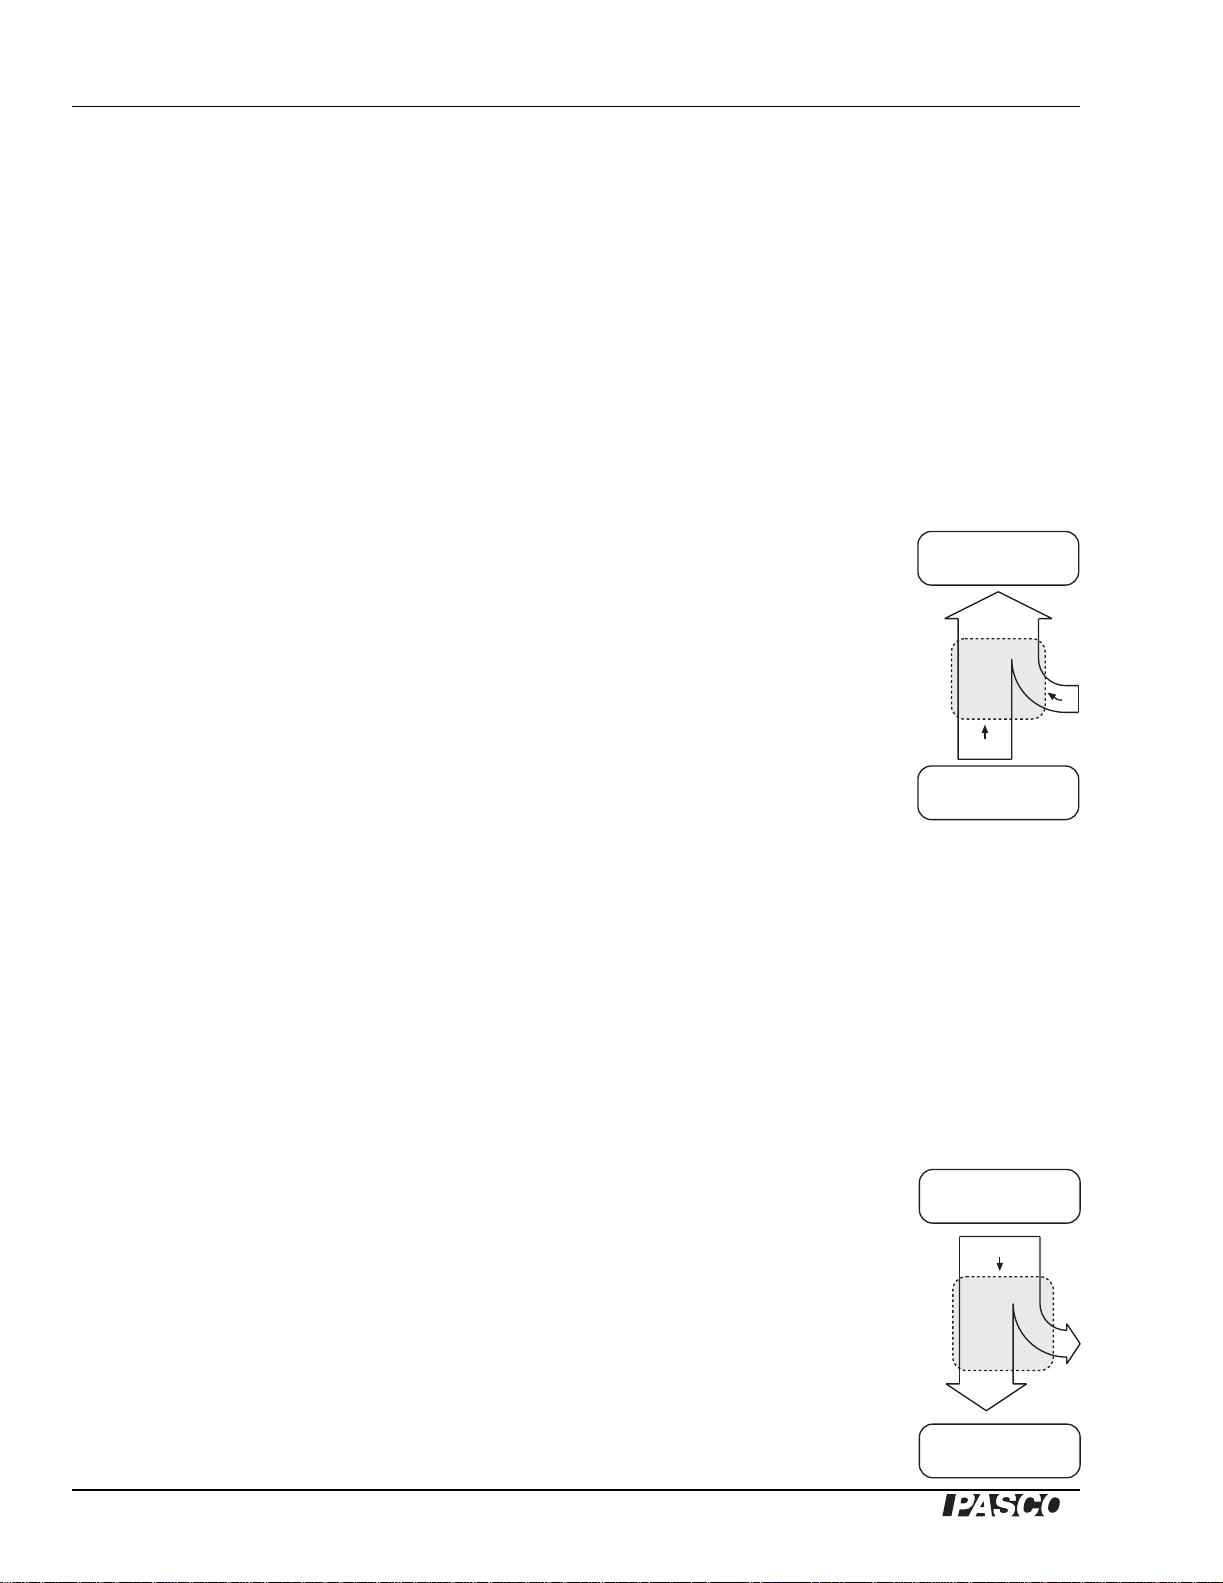
Analysis
Hot Reservoir
Heat Pump Mode
In Heat Pump mode the peltier does work to pump heat out of the cold reservoir
and into the hot reservoir.
W = work done by the peltier (equal to the area under the Input Power curve),
Q
= heat pumped into the hot reservoir,
hot
Q
= heat pumped out of the cold reservoir.
cold
Cold Reservoir
By the first law of thermodynamics,
Q
hot
= Q
cold
+ W
1) Where did the heat pumped out of the cold reservoir go? Where did the heat pumped into the
hot reserv oir come from? Why was more heat pumped into the hot reservoir than was pumped
out of the cold reservoir?
2) Compare your observed values of (Q
+ W) and Q
cold
. If they are not equal, where did the
hot
“lost energy” go?
Q
hot
Heat Pump
Q
cold
W
3) Write an equation in terms of the “lost energy”, E
Q
.
cold
, and your observed data, W, Q
lost
Heat Engine Mode
In a heat engine, heat flows out of the hot reservoir, some of the heat is
converted to work, and the rest of the heat flows into the cold reservoir.
W = work done by the heat engine,
Q
= heat flow out of the hot reservoir,
hot
Q
= heat flow into the cold reservoir.
cold
By the first law of thermodynamics,
12
and
hot
Hot Reservoir
Q
hot
Heat Engine
Q
cold
Cold Reservoir
W
Page 13

Model No. ET-8782 Experiment 1: Conservation of Energy and the First Law of Thermo dyn ami cs
®
W = Q
4) Compare your observed value of work, W
plot) to the quantity Q
hot
– Q
. Are they equal?
cold
– Q
hot
observed
cold
(which is the area under the Power vs. Time
5) In a real heat engine, only part of the heat that flows out of the two-reservoir system
(Q
hot
– Q
) is converted to useful work. In this experiment, the work that you observed (the
cold
useful work) was the work done on the load resistor. Can you account for all of the energy
that flowed out of the hot reservoir with your values of W
observed
, Q
and Q
hot
? If not, where
cold
did the “lost energy” go?
6) Calculate the proportion of net heat flow from the aluminum blocks that was converted to
useful work;
W
observed
% of useful work
7) Write an equation in terms of the “lost energy”, E
and Q
cold
.
----------------------------
Q
Q
–
hot
cold
, and your observed data, W
lost
100 %×=
, Q
observed
hot
8) In this experiment the “useful work” was the work done on the load resistor. What was the
result of doing work on the resistor? How could you modify the circuit in order to make better
use of the work done by the heat engine?
Conservation of Energy
In the Heat Pump phase of the cycle the power supply put energy into the system. Then, in the
Heat Engine phase heat flowed out of the hot reservoir and part of it was converted into electrical
energy, which was supplied to the load resistor.
9) Calculate the percentage of energy put in during the Heat Pump phase that was recovered as
useful work during the Heat Engine phase;
energy generated
% recovere d
---------------------------------------- energy put in
100 %×=
10) Is this a good way to store energy?
Conduction and Heat Flow Through the Insulators
One of the losses of energy in this experiment has to do with heat f low by conduction thr ough the
polyethylene foam insulators. The rate of heat flow through the insulator is
T∆
Qit⁄ kA
------ -
=
x
where:
13
Page 14

Energy Transfer–T hermo el ectric Conservation of Energy and the First Law of Thermo dyn ami cs
®
Qi/t = heat flow rate through the insulator,
k = thermal conductivity of the polyethylene foam = 0.036 W/(m·°C),
A = area through which the heat flows,
∆T = temperature difference across the insulator,
x = thickness of the insulating material.
You will estimate the amount of heat that flowed through the foam in contact with the front face
of the cold block.
Measure the height and width of the cavity in the insulator that surrounds the aluminum
block. Calculate the cross-sectional area, A in m2.
Measure the thickness, x, of the foam that covers the front face of the block. Do not include the
sides of the foam (you are only calculating the heat flow through the front face). Record your
measurement in meters.
From the temperature graph, determine the difference, ∆T, between the temperature of the cold
block and room temperature. This value changed during the experiment, so record the maximum
difference, when the cold block was at its coldest. This will give yo u a n es tima te of the maximum
heat flow rate through the insulator.
11) Calculate the heat flow rate through the foam, Qi/t. This is the heat flow rate in joules/second .
To find the total amount of heat in joules, multiply this number by the total time in seconds
that the experiment ran; Qi = (heat flow rate) × (time).
12) How does your estimate of Qi compare to the heat, Q
, that was pumped out of the cold
cold
block in the Heat Pump phase? Is it much larger, much smaller , or similar?
13) Is your estimate of heat flow through the insulator too high or too low? Remember that you
ignored the sides in your estimate, and that you used the maximum temperature difference for
∆T.
14) How would the flow of heat through the insulator on the hot side compare to heat flow
through the insulator on the cold side? Consider both the magnitude and direction of heat
flow.
15) Is heat flow through the insulators (on the hot and cold sides) a significant factor in this
experiment? Could the heat flow through the insulators account for the discrepancy between
your observed results and the first law of thermodynamics?
16) How would your results have differ ed if you had not used the insulators?
Further Investigation
What are some factors that you could vary in the experimental apparatus and procedure? Predict
how changing those factors would affect the results. Do an experiment to test one of your
predictions.
14
Page 15

Model No. ET-8782 Energy Transfer –T her m oelectri c
®
Experim ent 1:
Teachers’ Notes–Conservation of Energy
and the First Law of Thermodynamics
This sample data is in the file “Conservation of Energy Data”.
Heat Pump Mode
Q
= 172.8 J
hot
Q
+ W = 233.1 J
cold
1) Most of the heat pumped out of the cold reservoir went into the hot reservoir . The heat
pumped into the hot reservoir is greater than the heat pumped out of the cold reservoir
because Q
2) Q
hot
< Q
also includes the work done by the peltier.
hot
+ W. Some energy was lost. Part of it flowed through the insulator to the
cold
environment. Part of it was dissipated in other parts of the circuit.
3) Q
hot
= Q
+ W – E
cold
lost
Heat Engine Mode
W
observed
= 0.572 J
4) W
Q
hot
observed
– Q
< Q
= 3.3 J
cold
hot
– Q
cold
15
Page 16

Energy Transfer–Thermoelectric Teachers’ Notes–Conservation of Energy
®
5) Most of the heat that flowed out of the two-reservoir system was lost. Some of it flowed
through the foam insulators to the environment. Some of it was dissipated in other parts of the
circuit.
0.572 J()
6)
% of useful work
----------------------
3.3 J()
100 %× 17 %==
7) W
observed
= Q
hot
– Q
cold
– E
lost
8) The result of doing work on the resistor was that the resistor dissipated heat to the
environment. For a more practical use of the useful work, the resistor could have been
replaced with a light bulb, an electric motor, or some other electrical device.
Conservation of Energy
0.572 J
9)
% recovere d
-----------------
60.3 J
100 %× 0.9 %==
10) This is not a good way to store energy.
Conduction and Heat Flow Through Insulator
7 °C()
11)
Qit⁄ 0.36 W/(m·°C)[]0.033 m()0.037 m()×[]
---------------------
×× 0.031 J/s==
0.01 m()
Qi = (0.031 J/s) × (150 s) = 4.6 J
12) Qi is small compared to Q
cold
.
13) This is an estimate of the heat that flowed from the outside air , thr ough the ins ulator, and into
the front face of the aluminum block on the cold side. Some more heat flowed in through the
sides that we ignored. Qi is likely an overestimate because the actual temperature difference
was not always as large as the ∆T that was used in the calculation, and the surface area of the
front face is larger than that of the sides.
14) Heat flow through the insulator on the hot side would be larger in magnitude because there
was a greater temperature difference between the block and the outside air. Since the block
was hotter than the air, heat would have flowed out to the environment.
15) The amounts of “lost energy” in the Heat Pump and Heat Engine phases were 12.5 J and 2.7 J.
The estimate of Qi suggests that heat flow through the insulators was a significant
contribution to this unaccounted-for energy. Another possible contribution to the lost energy
is heat dissipated by other components of the circuit, especially the material inside the peltier.
16) Without the insulators, it is likely that the net heat flow to the environment would have been
greater, thus increasing the amount of lost energy.
16
Page 17

Model No. ET-8782 Energy Transfer –T her m oelectri c
®
Experim ent 2:
Load Resi stance and Effi ciency
Equipment Required Part Number
Thermoelectric circuit board
Foam insulators (qty. 2)
Heat sink and thumbscrew
Banana patch cords (qty. 6)
Temperature cables (qty. 2)
DC Power Supply (10 V, 1 A minimum)
PASPORT Voltage/Current Sensor
PASPORT Quad Temperature Sensor
PASPORT interface(s)
DataStu d io software
“Load Efficiency” configuration file for DataStudio
part of ET -8782
part of ET -8782
part of ET -8782
part of ET -8782
part of ET -8782
SE-972 0A or eq uiv a le nt
PS-2115
PS-2143
PS-2001 or equivalent
See PASCO catalog
part of ET -8782
Introduction
In this experiment you will examine the relationship between output load resistance and the
power generated by the peltier when it is operating in heat engine mode.
You will observe the output power as you vary the load resistance while keeping everything else
constant (the temperature difference between the blocks, for instance). Since it is not possible to
hold the blocks at a steady temperature difference, you will take the peltier through several
identical cycles of heating and cooling, and measure the power each time a certain temperature
difference occurs. You will repeat the cycle for each value of load resistance that you test, ranging
from slightly over 0 Ω to 30 Ω.
Before you start, predict what you will discover about the relationship between output power and
load resistance. Record your prediction using words, numbers and a graph. Explain your
reasoning.
Set-Up
1. Input Power: Set the Heat Pump/Heat Engine switch to the neutral position (straight up).
Connect the power supply using banana patch cords to the input power terminals on the
circuit board as shown in picture. Note the polarity.
17
Page 18

Energy Transfer–T hermo el ectric Load Resistance and Efficiency
®
2. Temperature:
Connect the
cables from the
Voltage/Current
Sensor
temperature ports
to the Quad
Temperature
Sensor . Connect
the Cold Side to
Channel 1 of the
sensor and the Hot
Side to Channel 2.
3. Voltage: Connect
Ch 2
the voltage leads
of the Voltage/
Current Sensor to
Temperature
Sensor
Power
Supply
the Voltage Ports
on the board. Note
the polarity .
Ch 1
4. Current: Connect
separate red and black banana patch cords from the current input of the Voltage/Current
sensor to the Current Ports on the board. Note the polarity.
5. Computer: Connect the sensors to the computer through the PASPORT interface. Open the
pre-configured DataStudio file “Load Eff iciency”. The display should look as shown below.
18
Page 19

Model No. ET-8782 Experiment 2: Load Resistance and Efficiency
®
Background
This section explains some of the details of the DataStudio configuration file.
Calculations: DataStudio will measure the temperature of both blocks (T
and T
hot
), the voltage
cold
across the load resistor , and the cur rent t hrough t he load r esistor. From these measurements it will
make two calculations, temperature difference (∆T) and output power (P), using the following
equations:
∆T = T
hot
– T
cold
P = current × voltage
Start and Stop Conditions: DataStudio has been configured with start and stop conditions, which
control when it records data. The start condition is that ∆T must drop below 35 °C. Before the
beginning of each cycle (when ∆T < 35 °C) you will click the S tart button; DataStudio will display
live data, but it will not start recording. Data recording will not start until the ∆T has incr eased
above 35 °C and then dropped back below that level. The start condition will enable you to view
the temperature measurements without recording them. The stop condition will cause data
recording to stop when ∆T drops below 5 °C.
Changing the Name of a Data Run: DataStudio will record a separate data run for each load
resistance. In order to keep track of them, you will rename each data run. By default, the runs are
named Run #1, Run #2, etc. In order to rename a run, find it in the Summary window (on the left
side of the screen ), clic k on it once to select it, then clic k on it again to edit it (be careful to singleclick twice, and not to double-click). Enter the new name (for instance, “7 ohms”). When
DataStudio asks if you would like to rename all the data from this run, select Yes.
Procedure
1. Click the Start button. DataStudio will show live temperature readings in the Digits display,
but it won’t start recording yet.
2. Observe the temperature of both sides of the peltier; both should be close to room
temperature. During the experiment, you will take the peltier through several cycles of
heating and cooling. You must ensure that both sides of the peltier are close to room
temperature before each cycle starts. Note the room temper ature for futur e reference.
3. Set the voltage on power supply to about 6 volts. Set the switch to Heat Pump mode for about
2 seconds, then return it to the neutral position. If the voltage/current sensor beeps, then the
current is too high (over 1 amp) and you should decrease the voltage (then close the s witch
again to test it).
4. Set the switch to the Heat Engine position and allow the blocks to cool. Wait until both sides
are within a few degrees of room temperature. (To cool faster, install the heat sink on the hot
block and turn on the cooling fan. It also helps to put a metal object in contact with both
blocks.)
19
Page 20

Energy Transfer–T hermo el ectric Load Resistance and Efficiency
®
5. Connect the output load jumper to terminal D. This bypasses all of the resistors and reduces
the load resistance to almost zer o. Note that th e resis tance i s not exactly zero because t he
wires and traces on the board have some resistance.
6. Place both insulators on the blocks.
7. Set the switch to Heat Pump mode. W atc h the difference in temperature between the two
blocks (∆T). You are waiting for ∆T to reach 35 °C, which will take about one minute.
8. When ∆T reaches 35 °C, change the switch to Heat Engine Mode. The temperature difference
will start to decrease. When ∆T drops below 35 °C, DataStudio will automatically start
recording. You will see data appear on the graph of Power Generated vs. ∆T.
9. When ∆T drops below 5 °C, data recording will stop automatically.
10. Change the name of the data run to indicate the load resistance.
11. Click Start. DataStudio will display temperature data, but it won’t start recording yet.
12. Remove the insulators and use the fan and heat sink to cool the blocks to within a few degrees
of room temperature.
13. Change the output load to 3 Ω (connect the jumper to terminal C).
14. Replace the insulators and repeat the cycle of heating and cooling. (Go back to step 7.)
15. Repeat the cycle again for the following values of output load:
•7 Ω (Connect the jumper to B, but also connect a shorting jumper from C to D.)
• 10 Ω (Connect the jumper to B.)
• 20 Ω (Connect the jumper to A, but also connect a shorting jumper from B to D.)
• 30 Ω (Connect the jumper to A.)
When you are finished, you will have acquired power and temperature data for six different
values of output load resistance.
Analysis
From the data that has been recorded you will extract the data needed to plot a graph of Power
Generated (P) vers us Load Res i stance (RL) at ∆T = 30 °C.
On the graph of P vs. ∆T use the smart cursor to read the power generated at ∆T = 30 °C for each
value of load resistance. (Use the zoom select tool to change the scale of the graph and enlarge the
area around the data at 30 °C in order to read the data precisely. )
Enter the values in the Power vs. Load table. As you enter data into the table, they will be plotted
on the Power vs. Load Resistance graph.
1) At what value of RL is the maximum power generated?
20
Page 21

Model No. ET-8782 Experiment 2: Load Resistance and Efficiency
®
2) For output loads less than and greater than the optimal value, why does the peltier generate
less power?
All real electrical power supplies (including the peltier heat engine) have an internal resistance,
Ri. They can be modeled as an ideal voltage source in s eries with a r e sistor, as shown below (with
an output load connected).
+
R
Peltier
Heat Engine
i
V
+
NL
V
out
R
L
The voltage of the ideal voltage source, VNL, is called the no-load voltage. For a peltier heat
engine VNL depends only on ∆T.
3) Under what condition does the output voltage (V
) equal VNL?
out
4) How would you directly measure VNL at ∆T = 30 °C?
5) Write a theoretical equation for output power, P, in terms of VNL, Ri and RL. Make a graph of
P vs. RL (choose some arbitrary values for VNL and Ri). Based on your equation and graphs,
under what condition is P at its maximum?
6) In this experiment, one of the data points was taken with RL = 0. According to your equation,
what is the theoretical power generated when RL = 0? Was this the case in your experiment?
There is another source of resistance that we haven’t considered yet, which is the resistance of the
traces, leads and sensors in the circuit. Let’s call it RT. If we add in RT, the circuit can be modeled
thus:
R
Peltier
Heat Engine
+
R
i
V
+
NL
V
out
T
R
L
7) Rewrite the theoretical equation for P taking RT into account.
8) Fit this equation to your experimental data. What is the no-load voltage at ∆T = 30 °C? What
is the internal resistance of the peltier? What is RT?
Further Investigation
1. Make a direct measurement of the no-load voltage at ∆T = 30 °C.
2. Make a direct measurement of RT (or measure as much of it as possible).
21
Page 22

Energy Transfer–T hermo el ectric Load Resistance and Efficiency
®
3. Predict how your results would differ if you repeated your analysis for a different value of
∆T? Test your prediction.
4. For your graph of Power vs. Load Resistance, what did you do to ensure that only RL and P
varied, and that all other experimental parameters stayed constant? Evaluate how successful
these measures were. Discuss how you could improve them.
5. In the analysis we assumed that V
was constant for all values of ∆T = 30 °C. Do an
out
experiment to test that assumption.
6. For any given output load, quantitatively describe the relationship between P and ∆T.
22
Page 23

Model No. ET-8782 Energy Transfer –T her m oelectri c
®
Experim ent 2:
Teachers’ Notes–Load Resistance and Efficiency
This sample data is in the file “Load Efficiency Data”.
For instructions on using the Smart Tool and Zoom Select in the graph display, click on the
DataStudio Help menu, select Search and look up those terms in the Index.
1) Power generated was greatest for RL = 7 Ω.
2) For other values of RL, the peltier generated less power because the load resistance did not
match the internal resistance.
3) V
= VNL when there is no load connected (or when RL = ∞).
out
4) To measure VNL, run the cycle with all of the load r esis tors disconnected, (or leave the knife
switch open for the cooling phase).
2
V
R
NL
5) P
-------------------------=
RiRL+()
L
2
23
Page 24

Energy Transfer–Thermoelectric Teachers’ Notes–Load Resistance and Efficiency
®
Theoretical P vs.
(with arbitrary values)
V
= 10 V
NL
R
= 5 Ω
i
Max P when
R
P (W)
= R
L
i
RL (W)
6) Theoretically P = 0 when RL = 0. Experimentally this was not the case.
2
V
RLRT+()
7)
P
NL
--------------------------------------=
RiRLR
++()
2
T
8) Experimental data with curve fit:
R
L
24
P (W)
RL (W)
V
= 1.49 ± 0.1 V
NL
R
= 7.4 ± 0.1 Ω
i
R
= 0.90 ± 0.04 Ω
T
Root MSE = 0.011 W
Page 25

Model No. ET-8782 Energy Transfer –T her m oelectri c
®
Experim ent 3:
A Model Refrigerator
Equipment Required Part Number
Thermoelectric circuit board
Foam insula t or
Heat sink and thumbscrew
Banana patch cords (qty. 4)
Temperature cables (qty. 2)
Fast Response Temperature Probes (qty. 2)
DC Power Supply (10 V, 1 A minimum)
PASPORT Voltage/Current Sensor
PASPORT Quad Temperature Sensor
PASPORT interface(s)
DataStu d io software
“Refrigerator” configuration file for DataStudio
Introduction
part of ET -8782
part of ET -8782
part of ET -8782
part of ET -8782
part of ET -8782
PS-2135 (3-pack)
SE-972 0A or eq uiv a le nt
PS-2115
PS-2143
PS-2001 or equivalent
See PASCO catalog
part of ET -8782
In this activity you will use the peltier device to model a refrigerator. As you run your model
refrigerator, DataSt udio will display the voltage and current supplied to the peltier, the
temperature of both blocks, and the temperature of the air flowing past the heat sink. Y ou will use
these measurements to investigate som e of the factors t hat affect the temperatur e of a refrigerator
Set-Up
1. Input Power: Set the Heat Pump/Heat Engine switch to the neutral position (straight up).
Connect the power supply using banana patch cords to the input power terminals on the
circuit board. Note the polarity.
2. Insulator: Place a foam insulator on the aluminum block on the Cold Side of the peltier.
3. Block Temperature: Connect the cables from the temperature ports on the circuit boa r d to the
Quad T emperature Sensor. Connect the Cold Side to Channel 1 of the sensor and the Hot Side
to Channel 2.
4. Air Temperature: Set up two Fast Response Temperature Probes to measure the temperature of
the air before and after it flows through the heat sink. Use the temperature clamps to position the
probes below and above the heat sink (as shown in the picture). The probes should not touch the
25
Page 26

Energy Transfer–T hermo el ectric A Model Refrigerator
®
heat sink or the aluminum block. Connect the probe below the heat sink to Channel 3 of the Quad
Temperature Sensor; connect the other probe to Channel 4.
5. Voltage: Connect the voltage leads of the Voltage/Current Sensor to the Voltage Ports on the
board. Note the polarity.
6. Current: Connect separate red and black banana patch cords from the current input of the
Voltage /Current sensor to the Current Ports on the board. Note the polarity.
7. Computer: Connect the sensors to the computer through the PASPORT interface. Open the
pre-configured DataStudio file “Refrigerator”. The display should look as shown below.
26
Page 27

Model No. ET-8 782 Experiment 3: A Model Refrig erator
®
Procedure
As you follow this procedure take notes of your observations and write down the answers to the
questions.
1. Put the knife switch in the neutral position (straight up). Set the DC Voltage to about 6 volts.
2. Turn on the fan.
3. Start data recording. Set switch to Heat Pump mode. (Che ck that the current is not more than
1 amp; if it is, the sensor will beep and you should open the switch, decrease the applied
voltage, then close the switch again.)
4. Observe the temperatures of the hot and cold sides of the peltier device. Which side has the
bigger temperature difference from room temperature? Why are they not the same?
5. Let the refrigerator run in this mode for at least 5 minutes while the temperatures reach
equilibrium. Meanwhile, continue on to the next section.
Air Flow and Heat Transfer
6. Observe the air temperatures below and above the heat sink. By how much does the air
temperature increase when it passes through the heat sink? This increase in temperature is
caused by the heat flowing from the heat sink to the air.
You will now estimate the rate of heat transfer from the heat sink to the air . For a gas, we can write
Q = nc∆T
where, in this experiment:
Q = heat transferred from the heat sink to the air (in joules),
n = number of moles of air (not the mass),
∆T = change in temperature of the air,
c = specific heat of air.
The specific heat of a gas depends on whether it is heated at constant volume or constant pressure.
In this case the air is heated at constant pressure, so the specific heat is c
= 29.1 J/(mol·°C).
air
The manufacturer's specification for the air flow generated by the fan is about 2 liters per second.
At room temperature, one mole of gas occupies about 24.3 liters, so in one second the quantity of
gas is
n
0.082 mol==
2 L
---------------------------
24.3 L/mol
7. After the temperatures of the hot and cold blocks have stabilized, calculate the heat, Q,
transferred to the air every second. Is your estimate likely too high or too low? Explain your
reasoning.
The power supplied to the heat pump is
27
Page 28

Energy Transfer–T hermo el ectric A Model Refrigerator
®
P = IV
where:
P = power (in watts = joules/second),
I = current (in amps),
V = voltage (in volts).
8. From the measured values of applied voltage and current, calculate the energy used to run the
heat pump for one second. How does the energy supplied to the peltier every second compare
to your estimate of the heat transferred from the heat sink to the air every second? Which is
bigger? Explain your observations in terms of conservation of energy .
Insula tor, Fan and Heat Sink
9. When the hot and cold blocks have reached equilibrium, write down the temperatures. Did
you make a good refrigerator?
10. Remove the foam insulator (continue recording data). Can you see a change in the cold
temperature? Put the foam insulator back on. Why did the temperature change?
11. Turn off the fan (continue recording data). Observe the effect on the temperatures for a few
minutes. How have the temperatures of both sides changed? How has the temperature
difference between the hot and cold sides changed? Can you explain why?
12. Observe the air temperatures. Have they changed from when the fan was on? Do you think
that the rate of heat transferred from the heat sink to the air has increased, decreased, or
stayed the same? Explain your reasoning.
13. If the blocks were allowed to reach equilibrium with the fan off, what do you think the final
temperature of the “cold” block would be? Would that represent a good refrigerator?
14. Before the hot side reaches 80 °C open the knife switch or turn the fan back on.
15. What part of a real refrigerator is represented by the cold block on your model?
16. In general terms, what does a refrigerator do to make the inside cold? Why does it need
insulation? Why does it need a heat sink?
Further Investigation
1. Let the refrig era to r run for se ve ra l min ute s w ith the insula tor re moved and the fan switched
on. What is the equilibrium temperature of the cold block in this mode?
2. Without increasing the power supplied to the peltier, can you make the cold side colder?
Propose a modification to your model refrigerator and do an experiment to tes t it.
28
Page 29

Model No. ET-8782 Energy Transfer –T her m oelectri c
®
Experim ent 3:
Teachers’ Notes–
A Model Refrigerator
This sample data is in the file “Refrigerator Data”.
The data shown in the digits displays occurred at Time = 5 minutes.
Answ ers to Questions
(Step 4) T he hot side of the peltier has a lar ger temperature difference from room t emperature than
the cold side. Once equilibrium is reached, the heat being pumped out of the cold block is equal to
the heat flowing into it from its surroundings. The heat flowing out of hot block is equal to the
heat pumped out of the cold block plus the work done by the peltier. Since the heat flow rate out
of the hot block is higher than the heat flow rate into the cold block, and heat flow rate is
proportional to temperature difference, the hot block must have a higher temperature difference.
29
Page 30

Energy Transfer–Therm o electri c Teachers’ Notes–A Model Refrigerator
®
Air Flow and Heat Transfer
∆T = 2.6 °C
Q = (0.082 mol) [29.1 J/(mol·°C)] (2.6 °C) = 6.2 J (every second)
(Step 7) This estimate is likely to be high because we are measuring the air that goes straight
through the heat sink. Much of the air from the fan misses the heat sink, so the average
temperature rise for all of the air from the fan would be less than 2.6 °C.
P = (0.60 A) (7.1 V) = 4.3 J/s
(Step 8) The energy supplied to the peltier every second is less than the estimate of energy
transferred to the air by the heat sink. According to conservation of energy, they would be the
same if all of the heat lost by the system were transferred to the air through the heat sink. In fact,
some heat is lost through radiation, and through other parts of the system. It is likely that most of
the discrepancy between Q and P is due to error in the estimate of Q.
Insula tor, Fan and Heat Sink
(Step 9) With the cold block at 5 °C (or 18 °C below room temperature) the model represents an
effective refrigerator.
(Step 10) W ith the ins ulator removed, the temperatur e of the cold block increases due to increased
heat flow from the air to the block.
(Step 11) With the fan turned off, the temperature of the hot block increases because the rate of
heat transfer to the air decreases. The temperature of the cold block increas es at a similar rate.
The temperature difference between the blocks increases f rom 41 °C t o 47 °C within 3 minutes of
the fan switching off, after which the difference decreases slowly.
As the hot block gets hotter and the temperature difference between the blocks increases, the
tendency for heat to flow from the hot block to the cold block by conduction increases, canceling
the heat-pumping effect of the peltier.
(Step 12) When the fan is turned off the temperature change of the air flowing through the heat
sink increases to about 10 °C. Since the hot block gets hotter, it is evident that the rate of heat
transfer to the air has decreased. The increased temperatur e change is due to the decreased air
flow.
(Step 13) With the fan turned off, the “cold” block would stabilize at about 40 °C. That is higher
than room temperature, so it would not be a good refrigerator.
(Step 15) The cold block corresponds to the interior of a real refrigerator.
(Step 16) A refrigerator makes the interior cold by pumping heat out of it. It needs insulation to
reduce the rate of heat flow back into it from the surrounding air. It needs a heat sink to transfer
away the heat that it has pumped out of the interior, and the heat resulting from the work that it
does.
30
Page 31

Model No. ET-8782 Energy Transfer –T her m oelectri c
®
Experim ent 4:
Coefficient of Performance
Equipment Required Part Number
Thermoelectric circuit board
Foam insula t or
Heat sink and thumbscrew
Banana patch cords (qty. 4)
Temperature cables (qty. 2)
DC Power Supply (10 V, 1 A minimum)
PASPORT Voltage/Current Sensor
PASPORT Quad Temperature Sensor
PASPORT interface(s)
DataStu d io software
“Coeff of Performance” configuration file for DataStudio
part of ET -8782
part of ET -8782
part of ET -8782
part of ET -8782
part of ET -8782
SE-972 0A or eq uiv a le nt
PS-2115
PS-2143
PS-2001 or equivalent
See PASCO catalog
part of ET -8782
Introduction
Some heat pumps, such as refrigerators and air conditioners, are used for their cooling effe ct.
They pump heat out of a container or a building, making the interior cooler than the surrounding
environment. But a heat pump can also be used to pump heat into a building, making the interior
warmer than the surrounding environment.
An important property of a heat pump is how much energy it uses to move a certain amount of
heat. In this activity you will measure the Coefficient of Performance of a heat pump wor king in
both modes, and discover how a heat pump can be more efficient at heating a building than
conventional methods.
Set-Up
1. Input Power: Set the Heat Pump/Heat Engine switch to the neutral position (straight up).
Connect the power supply using banana patch cords to the input power terminals on the
circuit board as shown in picture. Note the polarity.
2. Heat Sink and Insulator: Attach the heat sink to the aluminum block on the Hot Side of the
peltier . Place a foam insulator on the other block.
31
Page 32

Energy Transfer–Thermoelectric Coefficient of Performance
®
Voltage/Current
Sensor
Ch 2
Temperature
Sensor
Ch 1
Power
Supply
3. Temperature: Connect the cables from the temperature ports on the circuit board to the Quad
Temperature Sensor . Connect the Cold Side to Channel 1 of the sensor and the Hot Side to
Channel 2.
4. Voltage: Connect the voltage leads of the Voltage/Current Sensor to the Voltage Ports on the
board. Note the polarity.
5. Current: Connect separate red and black banana patch cords from the current input of the
Voltage /Current sensor to the Current Ports on the board. Note the polarity.
6. Computer: Connect the sensors to the computer through the PASPORT interface. Open the
pre-configured DataStudio file “Coeff of Performance”. The display should look as shown
below.
32
Page 33

Model No. ET-8782 Experiment 4: Coefficient of Performance
®
Background
DataStudio has been configured to measure and record the temperature of both aluminum blocks,
and the voltage and curre nt applie d to the peltie r . F rom these mea sured quantities, Data Studio will
calculate and display heat flow, power and work. The following sections explain how DataStudio
makes these measurements and calculations.
Heat vs. Temperature
The digits displays show the heat that flows into the hot block (Q
(Q
). The relationship between heat flow and temperature change is given by
cold
) and out of the cold block
hot
Q = mc∆T
where:
Q = heat transferred,
m = mass of the aluminum block,
c = specific heat of aluminum = 0.90 J/(g·°C),
∆T = change in temperature.
A positive value of Q
represents heat flowing into the hot block, but a positive value of Q
hot
cold
represents heat transferred out of the cold block.
The temperature of each block is measured by the embedded thermistor. DataStudio calculates the
heat flow from the measured temperature change, and pre-entered values of m and c. Click on the
calculator icon in the tool bar and look at the equations used; note the constants, m and c, in the
bottom section of the calculator window. (The mass of each block is about 19 g. If you would like
to enter your own value for the mass, measure the blocks with calipers and use the density of
aluminum, 2.7 g/cc, to calculate the mass, then enter it in the calculator.)
Input Power and Work Done by the Peltier
Input Power from the power supply equals the rate at which the peltier does work to pump heat
out of the cold reservoir and into the hot reservoir. The Voltage/Current Sensor measures the
voltage applied to the peltier, and the current that flows through it. DataStudio calculates the Input
Power using the equation: Power = Voltage × Current.
The area under the plot of Input Power versus ti me equals the ener gy supplied to the peltier , which
equals the work, W, done by the peltier.
Start Condition
The configuration file contains a start condition; when you click the Start button (with the knife
switch open) DataStudio will display live data, but it will not start recording until you close the
knife switch. This will allow you to monitor the measurements and confirm that both blocks are at
the same temperature before data recording starts.
33
Page 34

Energy Transfer–Thermoelectric Coefficient of Performance
®
Procedure
Refrigerator
Before you start, the knife switch should be in the neutral position (straight up) and the fan should
be switched off. Make sure that the foam insulator is on the cold block, and that the heat sink is on
the hot block.
Set the DC Voltage to about 5 volts.
Click the Start button.
Observe the temperatures of the hot and cold blocks; they should be within 0.1 °C of each other.
(If they are not, turn on the fan and wait until the temperatures have equalized. Then turn the fan
off and proceed.)
Set the knife switch to Heat Pump mode. Allow the heat pump to run for 10 to 15 se conds, then
open the switch. W atch the temperature graphs; once the temperatures have peaked out, stop data
recording. You need to give the blocks a few seconds to r each a maximum or minimum before
you stop recording.
Heat pumps are rated by the Coefficient of Performance, k. In the case of a heat pump used for
cooling (such as a refrigerator) the Coefficient of Performance is
Q
cold
------------
k
=
(for cooling)
W
The Coefficient of Performance expresses how much heat the heat pump removes from the cold
side compared to how much energy it uses to move the heat.
1) Use your values for the heat pumped out of the cold block (Q
) and the area under the
cold
Power versus time curve (W) to calculate the Coefficient of Performance, k, for your model
refrigerator.
2) For real heat pumps k is usually expected to be greater than 1. Is this the case for your model?
3) Your heat pump can also be thought of as a model air conditioner, a device used to keep the
inside of a building cooler than the outside air. In terms of moving heat, what does an air
conditioner do to keep a building cool? (Keep in mind that an air conditioner does not
necessarily move air into or out of the building.)
4) Compare your model to a building being cooled by an air conditioner. What does the peltier
represent? What does the cold block represent? What does the hot block represent?
5) If you were selecting an air conditioner to keep your home cool, would you choose one with a
high or low coefficient of performance? Explain why.
34
Page 35

Model No. ET-8782 Experiment 4: Coefficient of Performance
®
Reversible Heat Pump
A certain kind of air conditioner, known as a reversible heat pump, can also be used to heat a
building. You will now use the peltier to model a reversible heat pump being used to keep a
building warmer than the surrounding air.
Place the heat sink on the cold block, and the foam insulator on the hot block.
Delete the data that you have previously recorded. (Click on the Experiment menu and select
Delete All Data Runs.)
Click the Start button. Make sure that the hot and cold blocks are within 0.1 °C of each other
before proceeding. (If they are not, remove the insulator, turn on the fan and wait for the
temperatures to equalize. Then turn off the fan, replace the insulator and proceed.)
Set the switch to Heat Pump mode. Allow the heat pump to run for 10 to 15 seconds, then open
the switch. Watch the temperature graphs; once the temperatures have peaked out, stop data
recording.
For a reversible heat pump heating a buildi ng, we are interested in the heat pumped into the
building, Q
. (This is opposed to the previous case where we were interested in the heat pumped
hot
out of the building.) Thus the Coefficient of Performance is
Q
hot
--------- -
k
=
(for heating)
W
6) Use your values for the heat delivered to the hot block (Q
) and the area under the Power
hot
versus time curve (W) to calculate the Coefficient of Performance, k.
7) If you had used a simple resistor (rather than the peltier) to heat the aluminum block, and used
the same amount of energy (W), what would have been the maximum amount of heat
transferred to the block?
8) Compare your model to a building being heated by a reversible heat pump. What does the
peltier represent? What does the cold block represent? What does the hot block represent?
9) Why is it important for k to be greater than 1 for a reversible heat pump? Compare this to a
simple electrical heater. How much heat is delivered to a building using a simple heater
supplied with 100 J of electrical energy? How much heat is delivered to a building using a
heat pump, with k = 2, that uses 100 J of electrical energy to pump heat from outside to inside
the building?
Further Investigation
Think of a factor that you can vary in the experimental set-up. Predict how varying that factor
would affect the coefficient of performance in heating or cooling mode. Do an experiment to test
your prediction.
35
Page 36

Energy Transfer–Thermoelectric Coefficient of Performance
®
36
Page 37

Model No. ET-8782 Energy Transfer –T her m oelectri c
®
Experim ent 4:
Teachers’ Notes–
Refrigerator
Coefficient of Performance
This sample data is in the file “Coeff of Performance Data Refrig”.
76.0 J
1)
--------------
k
1.59==
47.8 J
2) This coefficient of performance is similar to that of real heat pumps.
3) An air conditioner pumps heat out of the building and into the outside air.
4) The peltier represents the heat pump, the cold block represents the interior of the building,
and the hot block represents the outside air.
5) You would choose an air conditioner with a high coefficient of performance because it would
use less energy to remove heat from the building (and cost less to run).
37
Page 38

Energy Transfer–Thermo el ectric Teachers’ Notes–Coefficient of Performance
®
Reversible Heat Pump
This sample data is in the file “Coeff of Performance Data Heat Pump”.
116.6 J
6)
k
-----------------
2.41==
48.4 J
7) If you used a simple resistor to heat the block with the same amount of work, the maximum
heat transferred to the block would be W = 48.4 J.
8) The peltier represents the heat pump, the cold block represents the outside air, and the hot
block represents the interior of the building.
9) The coefficient of performance must be greater than 1 in order for the heat pump to be more
efficient than a simple heater. A simple heater supplied with 100 J of electrical energy would
transfer 100 J of heat to the building. A heat pump with k = 2 supplied with 100 J of electrical
energy would transfer 200 J to the building.
Q
= kW
hot
38
Page 39

Model No. ET-8782 Energy Transfer –T her m oelectri c
®
Experim ent 5:
Teachers’ Notes–
Equipment Required Part Number
Thermoelectric circuit board
Foam insulators (qty. 2)
Banana patch cords (qty. 5)
Temperature cables (qty. 2)
DC Power Supply (10 V, 1 A minimum)
PASPORT Voltage/Current Sensor
PASPORT Quad Temperature Sensor
PASPORT interface(s)
DataStu d io software
“Carnot Efficiency Workbook” file for DataStudio
Carnot Efficiency
With the electronic workbook
contained on the CD-ROM,
students will study the efficiency
of the peltier heat engine. They
will record data for ∆T, power
generated and heat flow, calculate
efficiency, and discover the
relationship between efficiency
and ∆T. Finally they will compare
the actual efficiency of the heat
engine to the Carnot efficiency.
part of ET -8782
part of ET -8782
part of ET -8782
part of ET -8782
SE-972 0A or eq uiv a le nt
PS-2115
PS-2143
PS-2001 or equivalent
See PASCO catalog
part of ET -8782
Temperature (°C)
Power Generated (mW)
Have your students open the
DataStudio file “Carnot Efficiency
Workbook” and follow the onscreen instructions. As they go
through the electronic workbook
they should take notes and record
their answers to questions on paper.
You can find sample data in the file
“Carnot Efficiency W orkbook with
Data”.
Time (s)
efficiency (%)
Carnot efficiency (%)
DT (°C)
39
Page 40

Energy Transfer–Thermoelectric Teachers’ Notes–Carno t Efficiency
®
40
Page 41

Model No. ET-8782 Energy Transfer –T her m oelectri c
Safety
Read the instructions before using this
product. Students should be supervised by
their instructors. When using this product,
follow the instructions in this ma nual a nd all
local safety guidelines that apply to you.
Technical Support
For assistance with any P ASC O product,
contact PASCO at:
Address: P ASCO scientif ic
10101 Foothills Blvd.
Roseville, CA 95747-7100
Phone: (916) 786-3800
(800) 772-8700
Fax: (916) 786-3292
Web: www.pasco.com
Copyright and Warranty Information
Copyright Notice
The PASCO scientific 012-08745A Energy
Tr ansfer–Thermoelectric Instruction
Manual is copyrighted and all rights
reserved. However, permission is granted to
non-profit educational institutions for
reproduction of any part of this manual,
providing the reproductions are used only for
their laboratories and are not sold for profit.
Reproduction under any other
circumstances, without the written consent
of PASCO scientific, is prohibited.
Limited Warranty
Email: techsupp@pasco.com
For a description of the product warranty , see
the PASCO catalog.
Page 42

 Loading...