

Page 1
®
Instruction Manual with
Experiment Guide and
Teachers’ Notes
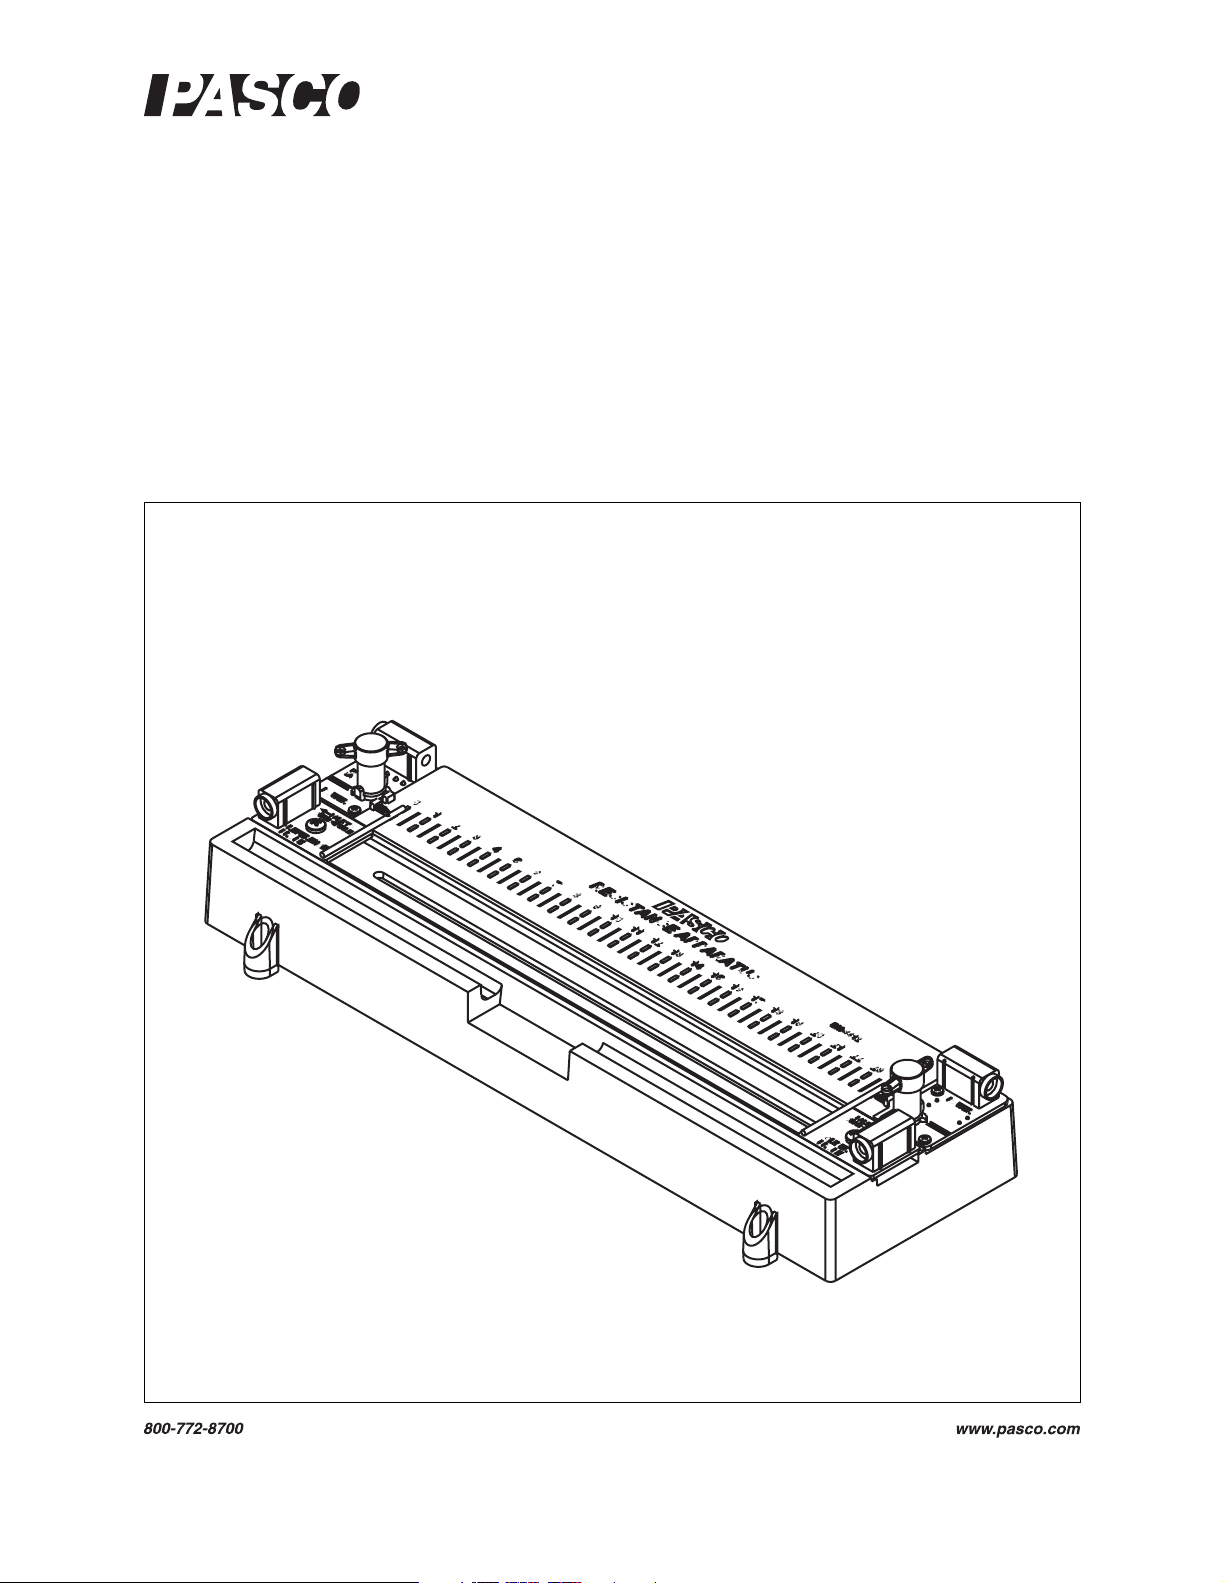
Resistance Apparatus
EM-8812
012-09573A
Page 2

Resistance Apparatus Table of Contents
Contents
Introduction . . . . . . . . . . . . . . . . . . . . . . . . . . . . . . . . . . . . . . . . . . . . . . . . . . . . . . . . . . . 3
Wires . . . . . . . . . . . . . . . . . . . . . . . . . . . . . . . . . . . . . . . . . . . . . . . . . . . . . . . . . . . . . . . . 4
Voltage Measurement . . . . . . . . . . . . . . . . . . . . . . . . . . . . . . . . . . . . . . . . . . . . . . . . . . . 4
Current Supply and Measurement. . . . . . . . . . . . . . . . . . . . . . . . . . . . . . . . . . . . . . . . . . 4
Four-wire Measurement. . . . . . . . . . . . . . . . . . . . . . . . . . . . . . . . . . . . . . . . . . . . . . . . . . 4
Apparatus Setup . . . . . . . . . . . . . . . . . . . . . . . . . . . . . . . . . . . . . . . . . . . . . . . . . . . . . . . 5
Measurement Procedure . . . . . . . . . . . . . . . . . . . . . . . . . . . . . . . . . . . . . . . . . . . . . . . . . 6
Fuse . . . . . . . . . . . . . . . . . . . . . . . . . . . . . . . . . . . . . . . . . . . . . . . . . . . . . . . . . . . . . . . . 6
Stacking . . . . . . . . . . . . . . . . . . . . . . . . . . . . . . . . . . . . . . . . . . . . . . . . . . . . . . . . . . . . . 6
About the Experiments. . . . . . . . . . . . . . . . . . . . . . . . . . . . . . . . . . . . . . . . . . . . . . . . . . . 6
Experiment 1: Exploratory Study of Resistance. . . . . . . . . . . . . . . . . . . . . . . . . . . . . . . . 7
Experiment 2: Resistance versus Length . . . . . . . . . . . . . . . . . . . . . . . . . . . . . . . . . . . . 9
Experiment 3: Voltage versus Length . . . . . . . . . . . . . . . . . . . . . . . . . . . . . . . . . . . . . . 12
Teachers’ Notes and Typical Data. . . . . . . . . . . . . . . . . . . . . . . . . . . . . . . . . . . . . . . . . 15
Technical Support . . . . . . . . . . . . . . . . . . . . . . . . . . . . . . . . . . . . . . . . . . . . . . . . . . . . . 18
Page 3
Resistance Apparatus
EM-8812
Included Equipment Part Number
Resistance Apparatus EM-8812
Two sets of wire (8 wires per set) in storage tube EM-8813
Fuses (one installed and one spare), 2 A mini-blade 530-045
Other Equipment Recommended
Voltage measurement:
Galvanometer Sensor
or
Multimeter SE-9786A
1
PS-2160
or similar
Current measurement:
Galvanometer Sensor
or
Multimeter SE-9786A
current meter of power supply
or
1, 2
Power Supply (capable of at least 1 A) PI-9877
PS-2160
or similar
or
SE-9720A
Patch Cords (4mm banana plug) SE-7123
1
Sensor requires a PASPORT interface such as Xplorer GLX (PS-2002).
2
Two Galvanometer sensors can be used simultaneously to measure voltage and current. Second sensor
requires a multi-port interface or two single-por t interfaces.
Introduction
In the Resistance Apparatus, a current is established in a wire of known diameter, and the voltage drop across a
section of the wire is measured. Students can calculate the resistance of the wire and the resistivity of the material.
®
3
Page 4
Resistance Apparatus Wires
Wires
The set of wires included with the apparatus contains two of each sample. Place one
of each sample in the storage trough on the apparatus for immediate use and set the
others aside as spares to replace lost or damaged wires. Order part EM-8813 for a new
set of replacements with two of each wire.
The set includes wires of five different materials with the same diameter, and four different diameters of the same material (brass). Refer to the table to identify the wires.
Approximate
Attracted
Material Color
Copper Red No 1.8 ± 0.1 0.040 2
Aluminum Light gray No 4.9 ± 0.1 0.040 2
Brass Yellow No 7.0 ± 0.5 0.020, 0.032, 0.040, and 0.050 2
Nichrome Dark gray No 105 ± 5 0.040 0.5
Stainless Steel Dark gray Yes 79 ± 1 0.040 1
1
All samples are alloys. The actual resistivity of a sample depends on its composition.
2
Excess constant current will cause wires to heat up, changing their resistivities. Current up to 2 A can be applied briefly to
all wires.
to magnet?
Resistivity
(µΩ·cm)
1
Diameter(s)
(inches)
Maximum
Voltage Measurement
Measure the voltage drop along the wire with a model PS-2160 Galvanometer Sensor
or a multimeter with a resolution of 0.1 mV or better. The maximum voltage measured will be less than 1 V.
Current Supply and Measurement
2
Constant
Current
(A)
Current is established in the wire by an external power supply. Select a power supply
capable of at least 1 A at 1 V. The apparatus contains a 2 A fuse to protect against
excessive current (see page 6 for fuse replacement instructions). If you are using a
current-regulated power supply capable of more than 2 A (such as model SE-9720A),
set the current regulation to 2 A before connecting it to the apparatus. The apparatus
contains a series resistance of 0.5 Ω, which makes it easier to tune the current through
the wire by changing the applied voltage.
To measure current you can use a model PS-2115 V/I Sensor or a multimeter. If you
are using a power supply with an accurate built-in current meter (such as model
PI-9877), a separate meter is not necessary.
Four-wire Measurement
In the apparatus, the resistance of a length of wire is determined by applying a known
current and measuring the voltage. This technique is known as a four-wire measurement. (The “four wires” are the two leads through which current is applied and the
two leads of the voltmeter.) The voltage is measured only across the part of the wire
under test (excluding the power supply leads), and virtually no current flows through
the voltmeter leads (so there is no voltage drop in them). This technique allows a very
4
®
Page 5
Model No. EM-8812 Apparatus Setup
RESIST
ANCE
APP
ARA
TUS
RESIST
ANCE
APP
ARA
TUS
small resistance to be measured even if the resistances of the four measurement wires
are much higher, unknown, or variable.
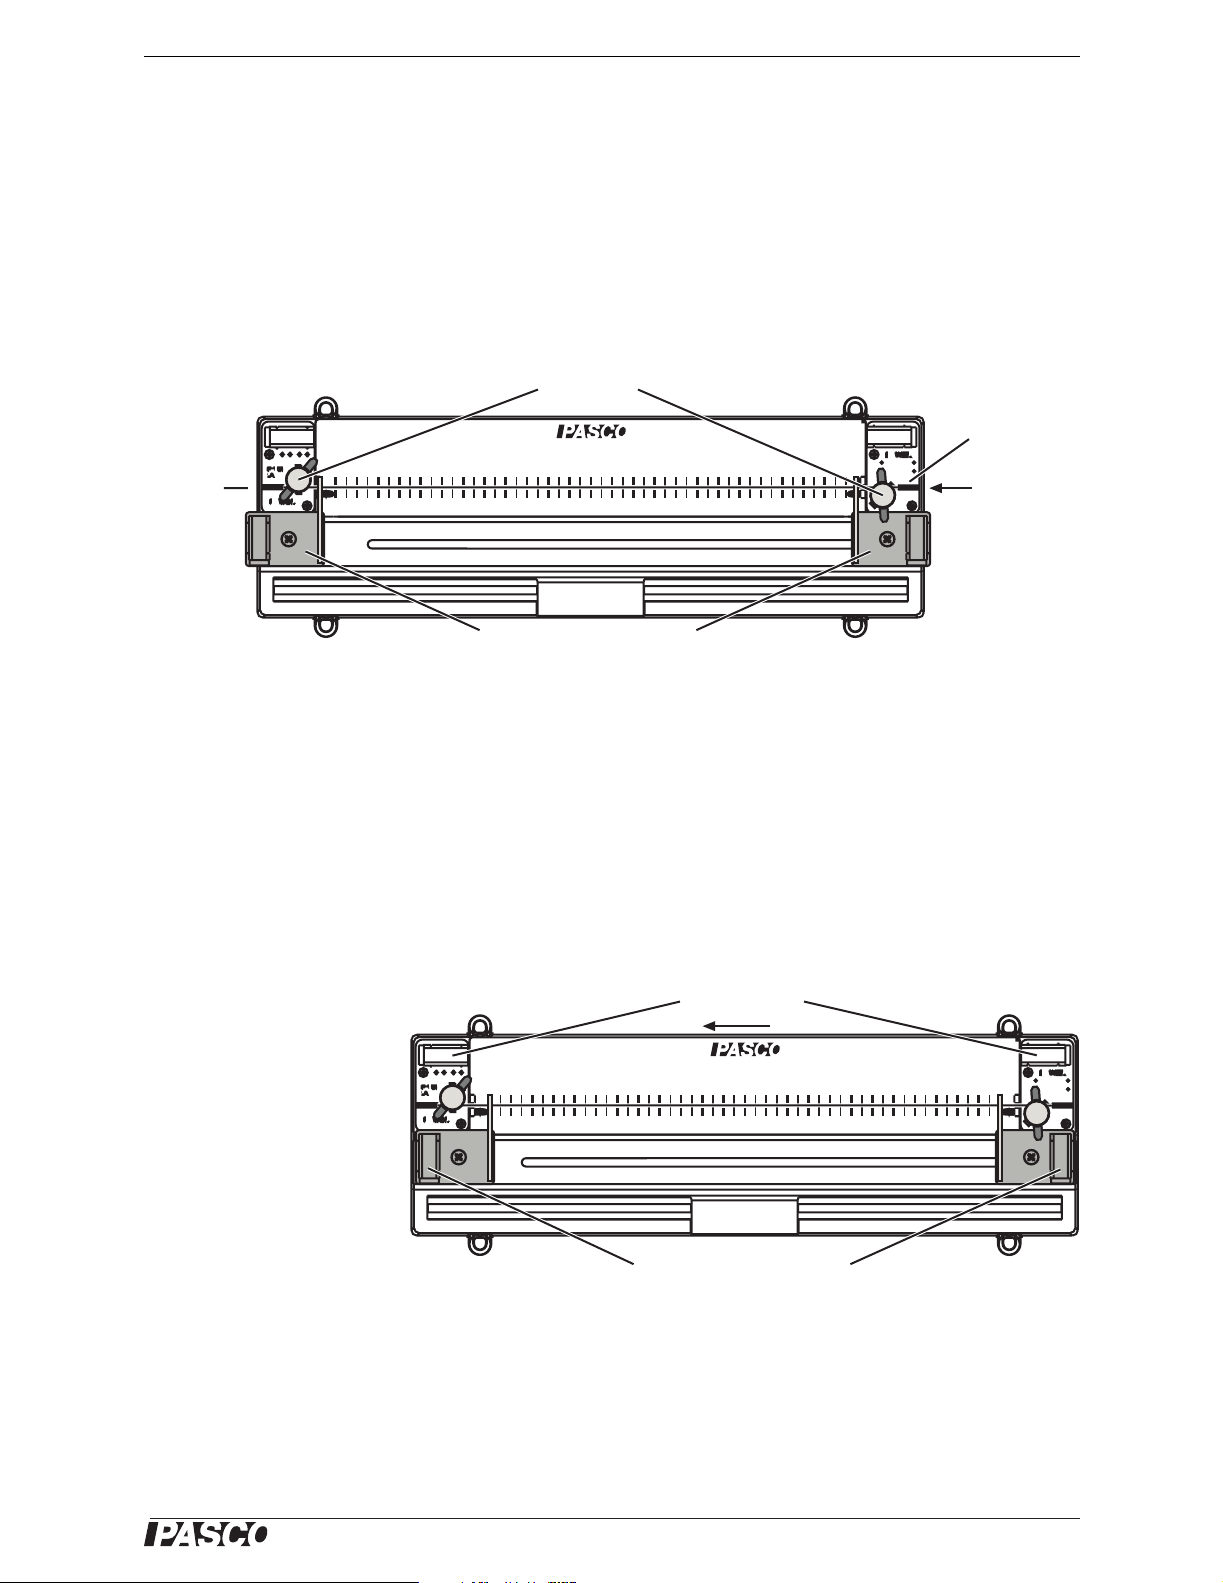
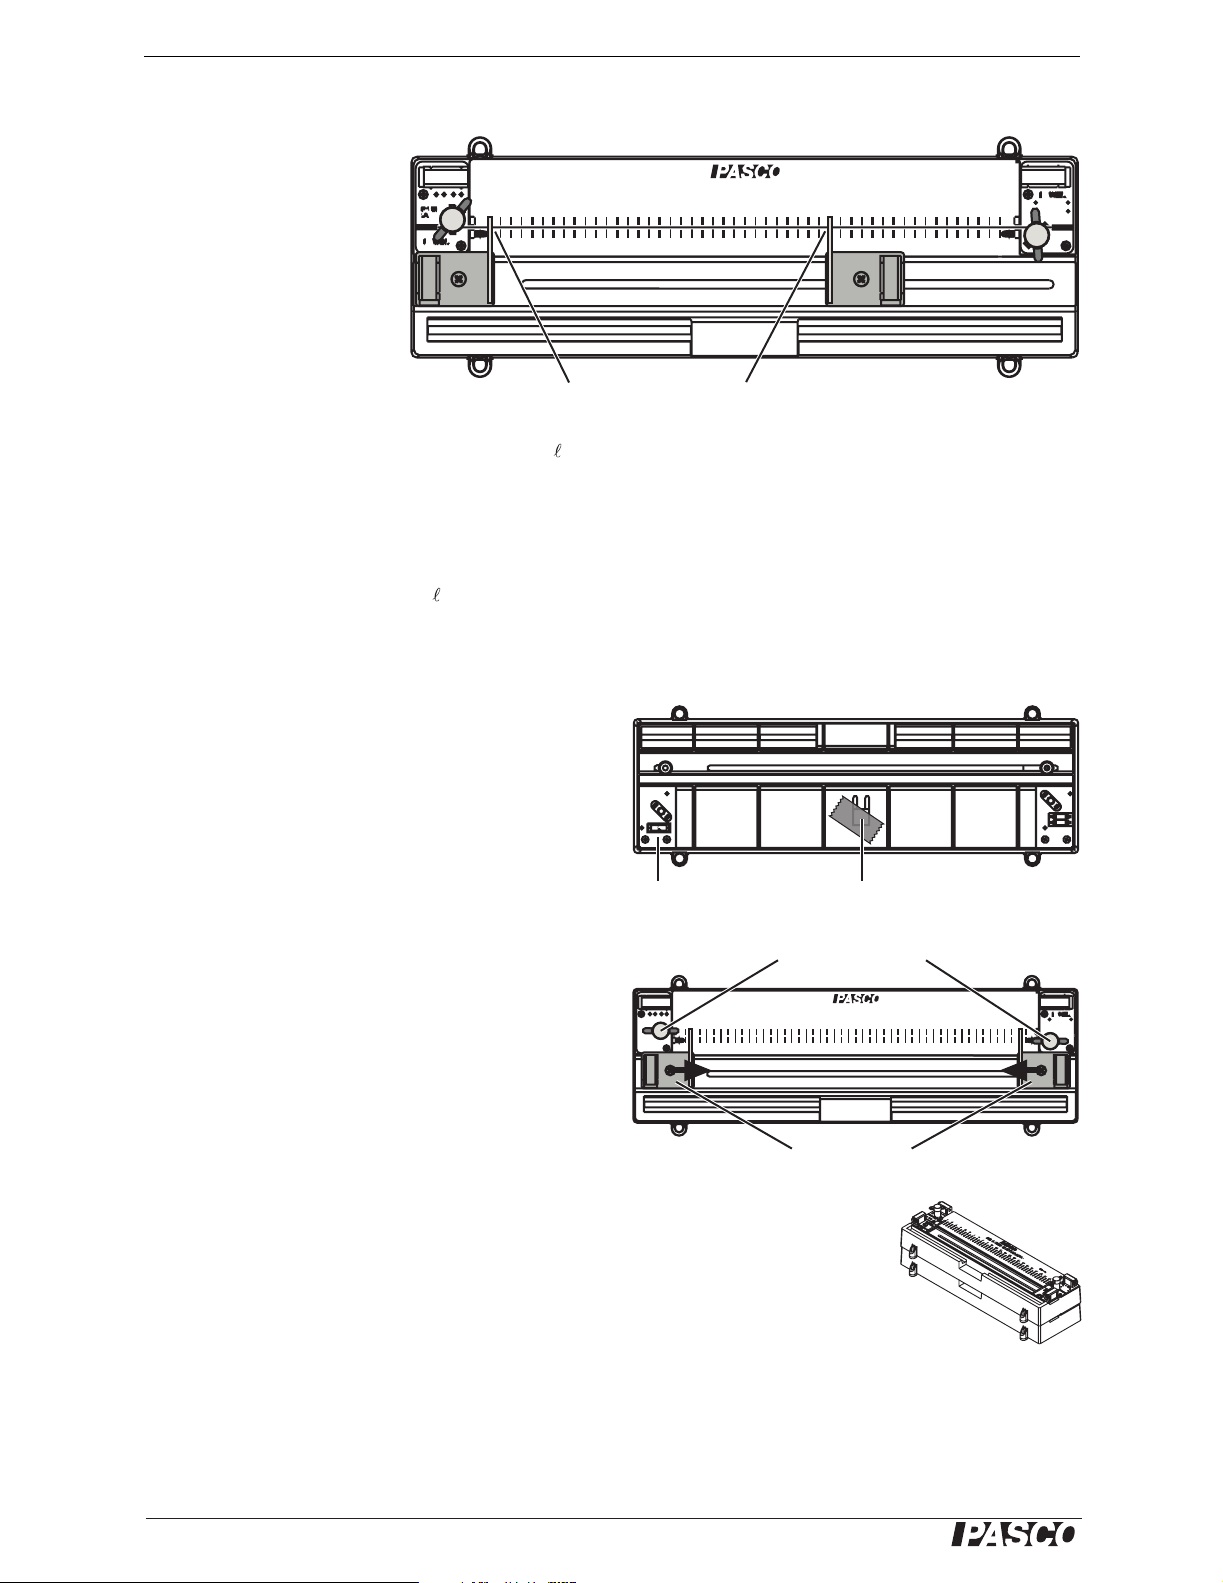
Apparatus Setup
Wire Installation
1. Move the reference and slider probes to the extreme left and right positions so
they are parked on the ramps that will hold them out off the wire.
Wire clamps
Alignment
lines
Insert wire here
Alignment
lines
RESIST
ANCE
APP
ARA
04 24123 567 98 101112131415161718192021 23
TUS
22
cm
Sliders in parked possitions
2. Loosen the wire clamps.
3. Insert the wire through the clamps and under the probes, as shown in the dia-
gram. Observe the alignment lines marked near the wire clamps and note that the
wire goes through the front of the left-hand clamp and through the back of the
right-hand clamp. (This configuration causes the wire to be pulled tight when the
clamps are closed.)
4. Tighten both clamps enough to secure the wire in place.
5. To remove the wire, park the probes and loosen the clamps.
External Device Connections
To power supply
Current
1. Power Supply: Set
the voltage of the
power supply to zero.
04 24123 567 98 101112131415161718192021 23
RESIST
ANCE
Connect it to the
power jacks of the
apparatus (see diagram) so that the current will flow from
right to left through
the wire.
To voltmeter or galvanometer
APP
ARA
TUS
22
cm
2. Current Measurement: If you plan to use a current sensor or meter, connect it
in series with the apparatus.
3. Voltage Measurement: Connect Galvanometer Sensor or voltmeter to the jacks
on the reference probe (-) and slider probe (+).
®
5
Page 6
Resistance Apparatus Measurement Procedure
RESIST
ANCE
APP
ARA
TUS
RESIST
ANCE
APP
ARA
TUS
Measurement Procedure
1. Turn on the power
supply and adjust the
applied voltage to
04 24123 567 98 101112131415161718192021 23
established the
desired current (I)
through the wire.
2. Place the reference
probe on the “0 cm”
mark.
3. Move the slider probe
Reference probe
on 0 cm mark
to any point on the wire. Read the length ( ) in centimeters from the scale on the
apparatus. This is the length of wire over which the voltage is measured.
4. Read the voltage (V).
In a typical experiment, you would make several measurements of V while varying
one other parameter (such as I, , the wire diameter, or the wire material).
RESIST
ANCE
APP
Slider probe
ARA
TUS
22
cm
Fuse
If current greater than 2 A is applied to the apparatus,
the fuse will open and require replacement. The fuse is
located on the underside of the apparatus. To remove
it, pull it straight out. The apparatus includes a spare
fuse taped to the underside.
The fuse is an 2 A mini-blade fuse, which can be purchased at automotive supply stores.
Fuse
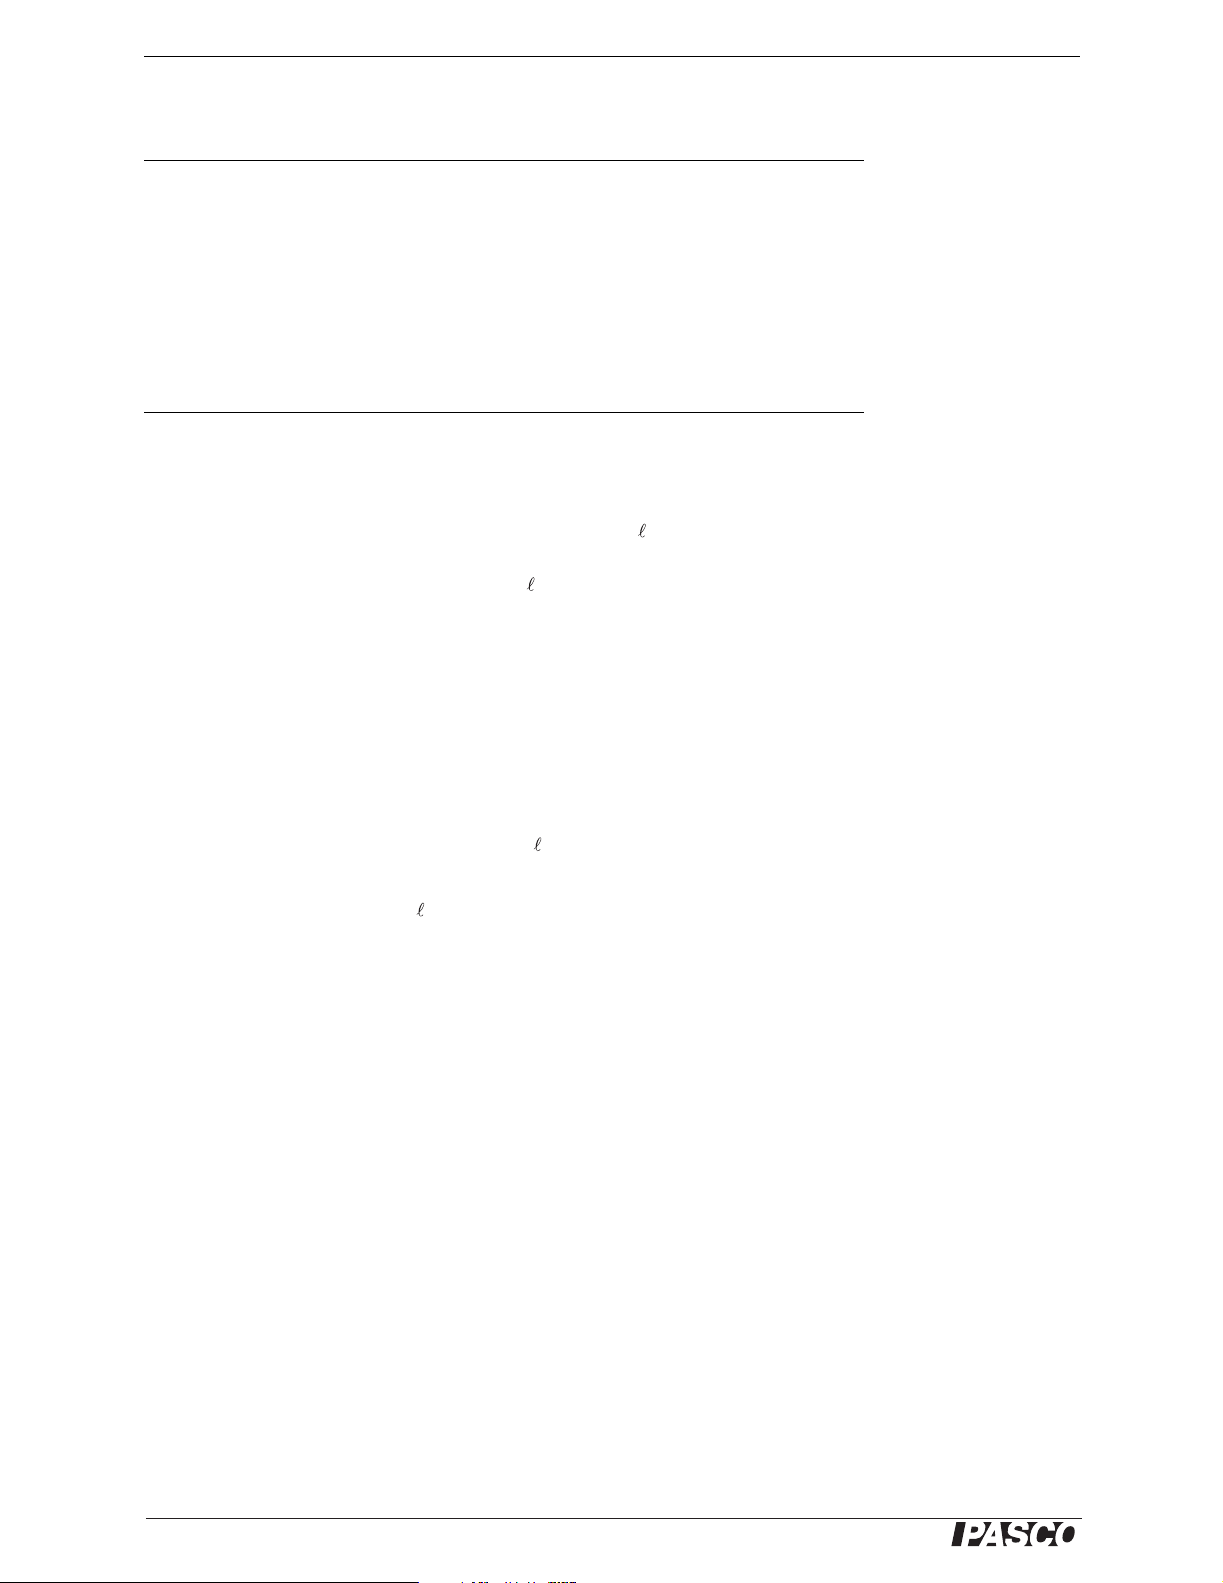
Stacking
To stack two or more apparatuses for storage, turn the
clamp screws to be “horizontal” (as illustrated). Push
the reference probe to the right as far as it will go (a little to the right of the “0 cm” mark) and push the slider
probe to anywhere left of the “24 cm” mark.
04123 567 98 1011121314151617181920212223
About the Experiments
The experiments in the manual represent three examples of how the apparatus can be
used, ranging from a simple exploratory lab (Experiment 1) to more advanced
(Experiment 3). Teachers’ notes and sample data for all three experiments appear on
page 15–17.
Experiments 2 and 3 refer to specific power supplies, sensors, and software; however
variations of these experiments can be done with equipment available in most physics
teaching labs.
Spare fuse
Screws horizontal
for stacking
RESIST
ANCE
APP
ARA
TUS
Probes pushed
toward center
24
cm
6
®
Page 7

Model No. EM-8812 Experiment 1: Exploratory Study of Resistance
Experiment 1: Exploratory Study of Resistance
Equipment Required Part Number
Resistance Apparatus with wire set EM-8812
Power Supply PI-9877
Patch Cords (4mm banana plug) SE-7123
Galvanometer Sensor or voltmeter (to measure voltage) PS-2160, SE-9786A
Current Meter (may be built into the power supply) SE-9786A or similar
Micrometer (optional) SE-7337
or similar
or similar
Theory
Ohm’s Law describes the relationship between the resistance (R) of a wire, the voltage drop across it (V), and current through it (I):
(eq. 1-1)
RVI⁄=
In this experiment, you will apply a known current and measure V to determine R for
wires of various lengths, diameters, and materials.
Setup
1. Select the next-to-smallest brass wire (about 0.081 cm diameter). If you have a
micrometer, measure the diameter precisely.
2. Install the wire in the apparatus (see “Wire Installation” on page 5).
3. Connect the galvanometer sensor or voltmeter to the reference (-) and slider (+)
probes of the apparatus.
4. Position the reference probe at the 0 cm mark and the slider probe at the 24 cm
mark.
5. Connect the power supply to the power jacks of the apparatus so that current will
flow from right to left through the wire.
6. If you are using a separate current meter, connect it in series with the power sup-
ply and apparatus.
7. Turn up the power supply’s voltage until the current is about 1 A.
Part A: Resistance Versus Length
1. Measure V and I. Use Equation 1-1 to calculate R.
2. In a table, record R and , the length of the wire (or the distance between the
probes).
3. Repeat steps 1 and 2 for equal to 20, 16, 12, 8, and 4 cm.
Make a graph of R versus . Is the relationship linear? Does the best-fit line pass
(approximately) through the origin? What does this tell you about the relationship
between R and ?
®
7
Page 8

Resistance Apparatus Experiment 1: Exploratory Study of Resistance
Part B: Resistance Versus Diameter
Repeat step 1 above for the other diameters* of brass wires with = 24 cm.
Make a graph of R versus diameter (D). Is the relationship linear? Try an inverse
curve fit. Try and inverse-square curve fit. Which fits better? What does this tell you
about how R is related to D?
Part C: Resistivity of Brass
The resistance of any wire is given by:
(eq. 1-2)
ρ
R
------=
A
where A is the cross-sectional area of the wire, and ρ is the resistivity of the material.
Resistance depends on and A, but ρ is a function of the material only.
Calculate A for each brass wire. Use Equation 1-2 and the values of R and from Part
B to calculate ρ for each brass wire. Do you get about the same value for each? What
is the uncertainty of the calculated values? Compare your results to the accepted
value.
Part D: Resistivity of Other Metals
Test the copper, aluminum, nichrome, and stainless steel wires. For each wire, measure D, , V and I . Calculate R, A, and ρ. Compare your values of resistivity to the
accepted values.
*If you have a
micrometer, measure the
diameters; otherwise,
use these values:
0.13 cm
0.10 cm
0.081 cm
0.051 cm
8
®
Page 9

Model No. EM-8812 Experiment 2: Resistance versus Length
Experiment 2: Resistance versus Length
Equipment Required Part Number
Resistance Apparatus with wire set EM-8812
DC Power Supply PI-9877
Patch Cords (4mm banana plug) SE-7123
Two Galvanometer Sensors PS-2160
Resistor, 0.1 Ω, 3 W (included with Galvanometer)
BNC-to-banana jack adapter (included with Galvanometer)
PASPORT Interface (or interfaces) See PASCO catalog
Micrometer (optional) SE-7337
Theory
If a current (I) is flowing through a wire, the voltage drop (V) across a certain length
of wire with resistance R is given by Ohm's Law:
(eq. 2-1)
VIR=
On a graph of V versus I, the slope is equal to R. In this experiment, you will plot V
versus I to measure R for various lengths of wire. You will then make a graph of R
versus length (
The resistance of a wire depends on
).
, the cross-sectional area (A), and
the resistivity
(ρ) of the material:
(eq. 2-2)
R ρ
=
---
A
Thus the slope of the R versus graph is equal to ρ/A.
Setup
1. Measure* diameter of the four brass wires and calculate their cross sectional
areas.
2. Install the largest brass wire in the apparatus (see “Wire Installation” on page 5).
3. Position the reference probe at the 0 cm mark and the slider probe at the 24 cm
mark.
*If you do not have a
micrometer, use these
values of diameter:
0.13 cm
0.10 cm
0.081 cm
0.051 cm
4. Connect the power supply to the power jacks of the apparatus so that current will
flow from right to left through the wire.
5. Connect both galvanometers to your PASPORT interface (or interfaces). If you
are using a computer, connect the interfaces to it and start DataStudio.
6. Set up one of the galvanometers to measure voltage (V): Connect it to the refer-
ence (-) and slider (+) probes of the apparatus.
®
9
Page 10

Resistance Apparatus Experiment 2: Resistance versus Length
7. Set up the other galvanometer to measure current (I):
a. Use the BNC-to-banana jack adapter to connect the 0.1 Ω resistor across the
terminals of the galvanometer.
b. Press the tare button on the galvanometer.
c. Insert the resistor into the circuit in series with the power supply and appara-
tus.
d. Turn the power supply’s function knob to Constant DC ( ).
e. On the power supply, press to display current. Turn the
Fine knob slowly to set the current to about 1 A. Note the exact
current on the display.
f. Collect a few seconds’ worth of test data. Note the average
voltage measured by the galvanometer (make sure you are
looking at the current-sensing galvanometer, it should read
about 100 mV).
g. Use
the current (displayed on the power supply), the voltage
(measured by the galvanometer), and Ohm’s law to calculate
the resistance of the resistor (it will be close to 100 mΩ).
h. Enter this calculation in the DataStudio or GLX calculator:
current = voltage/100.0
with your calculated resistance (in mΩ) in place of the
“100.0”. Define “voltage” as the voltage (in mV) measured by
the galvanometer (again, make sure it is the current-sensing
galvanometer). In this way, current is measured in amps.
8. Program the power supply for a 0 to 1 A ramp:
a. Turn the power supply’s function knob to Constant DC ( ).
b. Press to display current (if it is not already displayed). Turn the Fine
knob slowly to set the current to about 1 A.
c. Press again to display voltage and note this voltage.
d. Turn the function knob to Ramp ( ). Turn the Coarse and Fine knobs to
set the height of the ramp (shown on the display) to the voltage that you
noted in step c.
Current calculation in DataStudio (top)
and on the GLX (bottom)
Note that the voltage measured by the galvanometer (V) is the voltage between the
reference and slider probes, not the voltage output of the power supply. Also, the
length (
) is the distance between the pro
bes, not th
e end-to-end length of the wire.
10
®
Page 11

Model No. EM-8812 Experiment 2: Resistance versus Length
How to Measure Resistance
In this experiment, you will make several resistance measurements for various
lengths and diameters of wire. Use this method to measure R:
Note: These instructions assume that you have set up the galvanometers and power supply as
detailed above.
1. Set the reference and slider probes for the desired value of
2. On the power supply, press to start the applied voltage ramp. At the same
time, click Start in DataStudio (or press on the GLX) to start data collection.
3. Watch the voltage reading on the power supply. Just before it reaches its maxi-
mum value (which you set in setup step 8), click Stop in DataStudio (or press
on the GLX) to stop data collection.
4. On the power supply, press and hold to turn off the applied voltage ramp.
5. In DataStudio (or on the GLX), open a Graph display. For the vertical axis, select
Voltage in units of mV. (Make sure that this is the voltage measured by the galva-
nometer connected to the reference and slider probes, not the current-sensing galvanometer.) For the horizontal axis, select current (the calculation you defined
in setup step 7).
6. Apply a linear fit to the V versus I data. The slope equals R measured in mΩ.
To make another measurement of R (for a different length or a different wire, for
instance), repeat the steps above. However, you do not need to repeat step 5 because
the new data will appear on the graph that you set up previously.
.
Procedure
1. With largest brass wire, measure the resistance for lengths of
16 cm, 12 cm, 8 cm, and 4 cm
2. Make a graph of R versus
3. Apply a linear fit to the graph.
4. Use the slope of the line, the cross-sectional area of the wire, and Equation 2-2 to
calculate ρ.
5. Repeat steps 1 through 4 for the other three diameters of brass wire.
. (See “How to Measure Resistance” above.)
.
24 cm, 20 cm,
Questions
How do the values of ρ for the four brass wires compare to each other? How does
your average value of ρ compare to the accepted value?
Further Study
Repeat the procedure to find the resistivities of the copper, aluminum, nichrome, and
stainless steel wires.
®
11
Page 12
Resistance Apparatus Experiment 3: Voltage versus Length
Experiment 3: Voltage versus Length
Equipment Required Part Number
Resistance Apparatus with wire set EM-8812
Current-regulated Power Supply SE-9720A
Patch Cords (4mm banana plug) SE-7123
Galvanometer Sensor PS-2160
PASPORT Interface See PASCO catalog
Multimeter (to measure current) SE-9786A
Micrometer (optional) SE-7337
Theory
The resistance (R) of a wire depends on its dimensions and the resistivity (ρ) of the
material. For a wire of cross-section area (A) and length ( ),
(eq. 3-1)
R ρ
=
---
A
If a current (I) is flowing through the wire, the voltage drop (across the measured
length) is given by Ohm’s law:
(eq. 3-2)
VIR=
Combining these two equations yields
(eq. 3-3)
Thus, the slope of a V versus
graph is
ρI
V
-----=
A
.
ρIA⁄
Setup
1. Measure* diameter of the four brass wires and calculate their cross sectional
areas.
2. Install the smallest brass wire in the apparatus (see “Wire Installation” on
page 5).
3. Position the reference probe at the 0 cm mark and the slider probe at the 24 cm
mark.
4. Connect the power supply to the power jacks of the apparatus so that current will
flow from right to left through the wire. Put the multimeter in series with the
power supply to measure the current. Adjust the regulated current to about 1 A.
(The current-regulated power supply ensures that the current will remain constant.)
*If you do not have a
micrometer, use these
values of diameter:
0.13 cm
0.10 cm
0.081 cm
0.051 cm
5. Connect the galvanometer to the reference (-) and slider (+) probes of the apparatus.
6. Connect the galvanometer to your PASPORT interface. If you are using a computer, start DataStudio.
12
®
Page 13

Model No. EM-8812 Experiment 3: Voltage versus Length
7. Set up DataStudio (or the GLX) in Manual Sampling mode to graph V (measured
by the galvanometer) versus
pling Mode” below for detailed instructions.
Note that the voltage measured by the galvanometer (V) is the voltage between the
reference and slider probes, not the voltage output of the power supply. Also, the
length ( ) is the distance between the probes, not the end-to-end length of the wire.
(entered manually). See “Appendix: Manual Sam-
Procedure
1. Note the current. Check it occasionally to ensure that it stays constant.
2. Click Start in DataStudio (or press or press on the GLX) to start data moni-
toring.
3. Set the probes for the desired value of
4. Click Keep in DataStudio (or press or press on the GLX) to record a data
point.
5. When prompted, manually enter the value of
6. Repeat steps 3 through 5 for lengths of
7. When you have finished collecting data, click Stop ( ) in DataStudio (or press
or press on the GLX).
8. Apply a linear fit to the V versus
9. Use the slope of the line, the cross-sectional area of the wire, the current, and
Equation 3-3 to calculate ρ.
10. Repeat this procedure for the other diameters of brass wire. It is not necessary for
the current to be the same for each wire. Higher current (up to, but not over, 2 A)
will give you better data, especially for the largest diameter.
(24 cm for the first point).
.
20 cm, 16 cm, 12 cm, 8 cm, and 4 cm
graph.
Questions
How do the values of ρ for the four wires compare to each other? How does your
average value of ρ compare to the accepted value?
.
Further Study
Repeat the procedure with the copper, aluminum, nichrome, and stainless steel wires
to find their resistivities. Do not use a current over 1 A for the stainless steel wire, or
over 0.5 A for the nichrome wire. Higher current in these wires will cause them to
heat up, which will change their resistivities.
Appendix: Manual Sampling Mode
This experiment calls for manual sampling mode, in which the software or interface
records a single voltage value when commanded by the user and prompts the user to
type in the corresponding length measurement. After connecting the galvanometer to
the interface, follow the instructions below to put DataStudio software or the Xplorer
GLX (used without a computer) into manual sampling mode and setup a voltage versus length graph.
®
13
Page 14

Resistance Apparatus Experiment 3: Voltage versus Length
DataStudio
1. Click the Setup button (near the top of the screen) to open the Experiment Setup
window.
2. In that window, click the Sampling Options button to open
the Sampling Options window.
3. Click the check box to select Keep data values only when
commanded.
4. Under the Name field, type “Length”.
5. Under the Units field, type “cm”.
6. The window on your computer should now appear as illus-
trated (right). If it does, click OK.
7. In the Displays list (on the left side of the screen), dou-
ble-click Graph to open a graph display. (If prompted to
select data, select Voltage (mV)).
8. The graph display typically appears with Volt a g e ( m V) on the vertical axis. If it
does not, click the vertical axis label and select Volt a ge (m V ) from the pop-up
menu.
9. Click the horizontal axis label. Select Length from the pop-up menu.
Xplorer GLX (Without a Computer)
1. Press , to open the Sensors screen.
2. Press to open the Mode menu. Select Manual (press the down arrow to
F4
F1
highlight it, then press ). The Data Properties dialog box will open.
3. With Measurement Name highlighted, press to edit it. Type
“length”. Press .
4. Press the down arrow to highlight Measurement Unit. Press to
edit it. Type “cm”. Press .
5. The GLX screen should now appear as illustrated (right). If it does,
press (OK).
6. Press + to open the Graph screen.
F1
F1
7. Press to light up the graph fields. Press again to open the vertical axis
data menu.
8. In the menu, use the arrow keys to highlight Voltage. Press .
9. Press to light up the graph fields again. Press the down arrow to highlight
the horizontal axis data label. Press again to open the horizontal axis data
menu.
10. In the menu, use the arrow keys to highlight length. Press .
14
®
Page 15

Model No. EM-8812 Teachers’ Notes and Typical Data
Teachers’ Notes and Typical Data
Experiment 1: Exploratory Study of Resistance
Part A
V
(cm)
24 33.3 0.992 33.6
20 27.7 0.988 28.0
16 22.3 0.990 22.5
12 16.7 0.990 16.9
8 11.1 0.990 11.2
45.50.9915.7
(mV)
The relationship between R and
I
(A)
R
(mΩ)
is linear,
and the line passes through the origin.
This means that R is proportional to .
Part B
D
(cm)
0.13 13.7 0.992 13.8
0.10 21.3 0.990 21.5
V
(mV)
I
(A)
R
(mΩ)
0.081 33.3 0.992 33.6
0.051 86.9 0.998 87.1
The inverse-square curve fits best. This
means that R is proportional to 1/D
2
, or
that R is proportional to 1/A.
Part C
The table below shows resistivities calculated using data from Part B and the formula .
D (cm)
0.13 7.29
0.10 7.27
0.081 7.26
0.051 7.35
Average: 7.29
ρ
(µΩ·cm)
RA
ρ
-------=
These data show that the resistivity is about equal (approximately 7.3 µΩ·cm) for all four brass samples.
®
15
Page 16

Resistance Apparatus Teachers’ Notes and Typical Data
Part D
This table shows data for wires of other materials with
D (cm)
Copper 0.10 5.19 0.997 5.21 1.76
Aluminum 0.10 14.5 0.994 14.6 4.93
Brass 0.10 21.3 0.990 21.5 7.27
Nichrome 0.10 161 0.504 319 108
Stainless Steel 0.10 232 0.994 233 78.8
V (mV) I (A) R (mΩ)
=24 cm.
Experiment 2: Resistance versus Length
This graph shows V versus I for the largest brass
wire (A = 0.0127 cm
16 cm, 12 cm, 8 cm, and 4 cm. The slope of
each line equals R.
2
) with
=24cm, 20cm,
ρ
(µΩ·cm)
This graph shows R versus for the largest brass
wire (where R was taken from the slopes in the
first graph). The slope equals
ρ/A; thus,
ρ =7.11µΩ·cm.
The table below shows ρ determined in this way for all wires.
For the four brass samples, the average value of ρ
is 7.21 µΩ·cm with a standard deviation of about 0.1 µΩ·cm (1.4%).
2
(cm
)
A
0.0127 0.561 7.11
0.00811 0.886 7.18
Brass
0.00519 1.39 7.21
0.00203 3.62 7.34
Copper 0.00811 0.222 1.80
slope = ρ/A (mΩ/cm)
ρ
(µΩ·cm)
16
Aluminum 0.00811 0.595 4.82
Nichrome 0.00811 13.2 107
Stainless Steel 0.00811 9.70 78.6
®
Page 17

Model No. EM-8812 Teachers’ Notes and Typical Data
The following refinements to the experiment setup can be used to improve the data and make the experiment easier:
• Increase the sample rate of both sensors (from the default of 10 Hz) to reduce the uncertainty of the slope of
the V versus I graph.
• Set a stop condition in DataStudio (or on the GLX) to automatically stop data after slightly less than 10 s
(the length of the applied voltage ramp).
• Set the DC Power supply to automatically stop after a single ramp.
Experiment 3: Voltage versus Length
The graph shows V versus
data for the smallest brass wire (A = 0.00203 cm
2
) with I = 1.00 A. The slope equals
ρI/A; thus ρ =7.46µΩ·cm. The table below shows ρ determined in this way for all wires.
Ι
A
2
)
(cm
0.0127 2.00 1.15 7.28
Brass
Copper 0.00811 2.00 0.439 1.78
Aluminum 0.00811 2.00 1.23 4.99
Nichrome 0.00811 0.500 6.63 108
Stainless Steel 0.00811 1.00 9.78 79.3
0.00811 2.00 1.80 7.30
0.00519 1.00 1.42 7.37
0.00203 1.00 3.68 7.46
I
(A)
slope = ρ
(mV/cm)
/A
ρ
(µΩ·cm)
For the four brass samples, the average value of ρ is 7.35 µΩ·cm with a standard deviation of about 0.08 µΩ·cm
(1.1%).
®
17
Page 18

Resistance Apparatus Technical Support
Technical Support
For assistance with any PASCO product, contact PASCO at:
Address: PASCO scientific
10101 Foothills Blvd.
Roseville, CA 95747-7100
Phone: 916-786-3800 (worldwide)
800-772-8700 (U.S.)
Fax: (916) 786-3292
Web: www.pasco.com
Email: support@pasco.com
Limited Warranty
For a description of the product warranty, see the PASCO catalog.
Copyright
The PASCO scientific 012-09573A
granted to non-profit educational institutions for reproduction of any part of this manual, providing the reproductions are used only in
their laboratories and classrooms, and are not sold for profit. Reproduction under any other circumstances, without the written consent of PAS CO scientific, is prohibited.
Resistance Apparatus Instruction Manual
is copyrighted with all rights reserved. Permission is
Trademarks
PASCO, PASCO scientific, DataStudio, PASPORT, Xplorer, and Xplorer GLX are trademarks or registered trademarks of PASCO scientific, in the United States and/or in other countries. All other brands, products, or ser vice names are or may be trademarks or service marks of, and are used to identify, products or services of, their respective owners. For more information visit
www.pasco.com/legal.
Authors: Jon Hanks
Alec Ogston
18
®
 Loading...