

Page 1
Includes
Teacher's Notes
and
Typical
Experiment Results
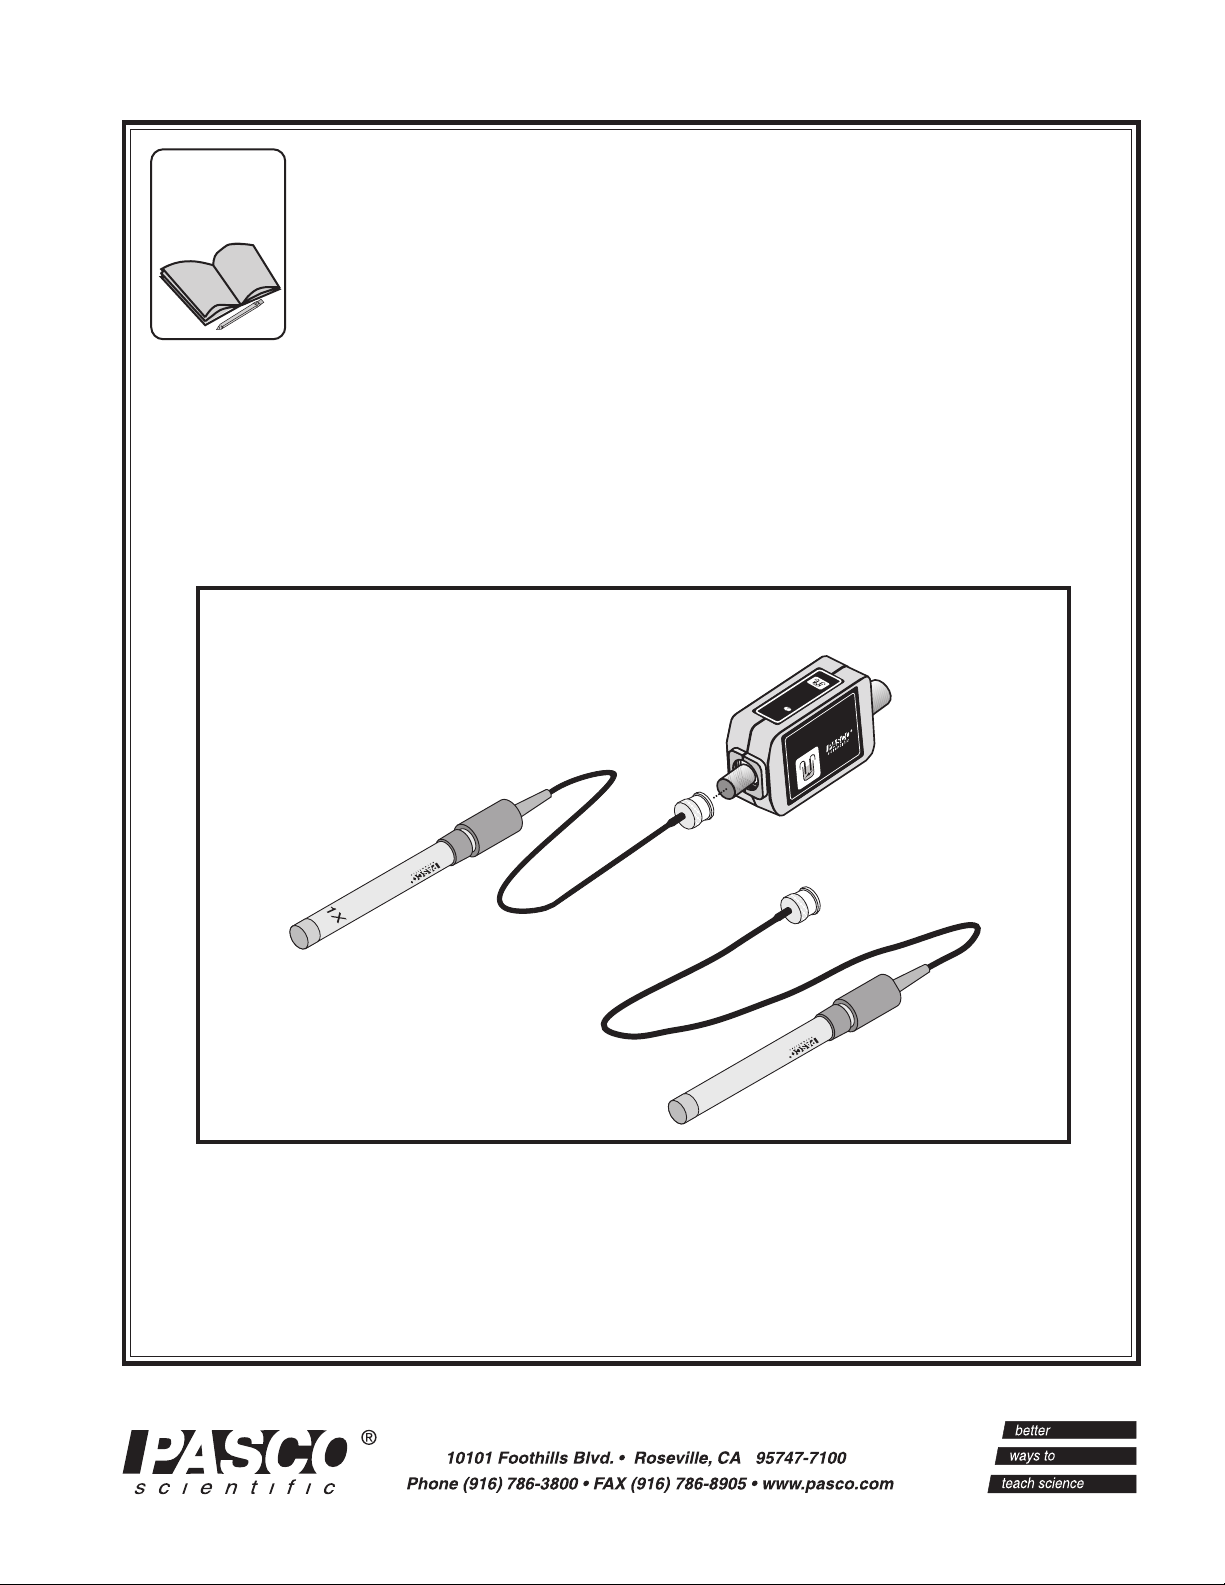
CONDUCTIVITY SENSOR
Instruction Manual and
Experiment Guide for the
PASCO scientific
Model CI-6729 (1X) and
Model CI-6739A (10X)
012-06485B
12/97
R
S
A
E
N
2
L
G
0
E
E
K
C
2
K
T
2
0
0
CONDUCTIVITY
SENSOR
CI-6729
CI-6739A
CONDUCTIVITY
699-06620
CONDUCTIVITY
699-06621
10X
© 1997 PASCO scientific $7.50
Page 2
Conductivity Sensor 012–06485B
Always use eye protection,
gloves, and an apron when
working with chemicals.
Caution: Follow all local
regulations for the safe handling,
use, storage, and disposal of the
chemicals used in the experiments
described in this manual.
Page 3

012–06485B Conductivity Sensor
Table of Contents
Section Page
Copyright, Warranty, and Equipment Return ................................................................ ii
Introduction ...................................................................................................................1
Equipment .....................................................................................................................1
Maintenance
Cleaning ...................................................................................................................2
Storage .....................................................................................................................2
Specifications ...........................................................................................................2
Theory—Principles of Operation of the Conductivity Sensor .....................................3–6
Setup and Calibration
Set up Science Workshop
®
..................................................................................................................................... 7
Calibration ...............................................................................................................7
Single-Point Calibration ...........................................................................................8
Experiments
Experiment 1: Introduction to the Operation of the Conductivity Sensor ................. 9–10
Experiment 2: Concentration Dependence of Conductivity in Aqueous Solutions . 11–12
Experiment 3: Temperature Dependence of Conductivity in Dilute
Aqueous Solutions ......................................................................... 13–15
Experiment 4: Acid-Base Titration with the Conductivity Sensor ..........................17–18
Teacher’s Notes ................................................................................................... 19–22
Appendix
Table 1: Conductivity of Various Water Samples at 25°C ...........................................23
Table 2: Table of Conductivity vs. Concentration for Common Solutions ................... 24
Table 3: Table of Conductivity vs. Concentration for Common Solutions ................... 25
Table 4: Conversion Chart to Estimate TDS of Aqueous Solutions .............................26
Table 5: Table of High Accuracy Reference Solution for Calibration ..........................26
Table 6: Sample Illustrating the Application of Conductivity to Agriculture ................27
Technical Support ..................................................................................... Back Cover
i
Page 4
Conductivity Sensor 012–06485B
Copyright, Warranty, and Equipment Return
Please—Feel free to duplicate this manual
subject to the copyright restrictions below.
Copyright Notice
The PASCO scientific Conductivity Sensor manual
(012-06485A) is copyrighted and all rights reserved.
However, permission is granted to nonprofit
educational institutions for reproduction of any part
of the Conductivity Sensor manual providing the
reproductions are used only for their laboratories
and are not sold for profit. Reproduction under any
other circumstances, without the written consent of
PASCO scientific, is prohibited.
Limited Warranty
PASCO scientific warrants the product to be free from
defects in materials and workmanship for a period of
one year from the date of shipment to the customer.
PASCO will repair or replace at its option any part
of the product which is deemed to be defective in
material or workmanship. The warranty does not
cover damage to the product caused by abuse or
improper use. Determination of whether a product
failure is the result of a manufacturing defect or
improper use by the customer shall be made solely by
PASCO scientific. Responsibility for the return of
equipment for warranty repair belongs to the
customer. Equipment must be properly packed to
prevent damage and shipped postage or freight
prepaid. (Damage caused by improper packing of the
equipment for return shipment will not be covered by
the warranty.) Shipping costs for returning the equipment after repair will be paid by PASCO scientific.
Equipment Return
Should the product have to be returned to PASCO
scientific for any reason, notify PASCO scientific by
letter, phone, or fax BEFORE returning the product.
Upon notification, the return authorization and
shipping instructions will be promptly issued.
➤➤
➤ NOTE: NO EQUIPMENT WILL BE
➤➤
ACCEPTED FOR RETURN WITHOUT AN
AUTHORIZATION FROM PASCO.
When returning equipment for repair, the units must
be packed properly. Carriers will not accept responsibility for damage caused by improper packing. To
be certain the unit will not be damaged in shipment,
observe the following rules:
➀ The packing carton must be strong enough for the
item shipped.
➁ Make certain there are at least two inches of packing
material between any point on the apparatus and the
inside walls of the carton.
➂ Make certain that the packing material cannot shift in
the box or become compressed, allowing the
instrument come in contact with the packing carton.
Address: PASCO scientific
10101 Foothills Blvd.
P.O. Box 619011
Roseville, CA 95678-9011
Credits
Authors: Dominic Calabrese and Steve Miller
Editor: Sunny Bishop
ii
Phone: (916) 786-3800
FAX: (916) 786-3292
email: techsupp@pasco.com
web: www.pasco.com
Page 5
012–06485B Conductivity Sensor
CONDUCTIVITY
SENSOR
CI-6729
CI-6739A
2K
20K
2
00
RANGE
SELEC
T
699-06620
C
O
N
D
U
C
TIV
ITY
699-06621
C
O
N
D
U
C
TIV
ITY
10X
Introduction
The PASCO CI-6729 and CI-6739A Conductivity Sensors are
used with a PASCO Science Workshop
®
computer interface to
investigate factors that influence the electrical conductivity of
liquids. The Conductivity Sensor consists of a signal conditioning
amplifier and either a 1X or 10X conductivity electrode. The
signal conditioning amplifier box is capable of working with
either electrode. Students can use this sensor to explore the
effects of temperature and concentration on the electrical
transport properties of aqueous solutions, especially in
applications relating to ecological systems.
The Conductivity Sensor is designed for use in aqueous solutions
at temperatures ranging from 0 °C to 80 °C. The 1X conductivity
electrode provided with the CI-6729 Conductivity Sensor has a
range of up to 20,000 microsiemens per centimeter. The 10X
conductivity electrode, provided with the CI-6739A, has a range
up to 200,000 microsiemens per centimeter. In order to achieve
maximum performance of the Conductivity Sensor, soak the
electrode in distilled water for 5 to 10 minutes before use to assure
complete wetting of the electrodes. The electrode may also be
calibrated at approximately the same temperature as the test solution
for concentration or total dissolved solids (TDS) measurements.
➤ Conductivity Sensors are used
in many practical applications
including:
• Environmental Monitoring
• Oceanography-Salinity
• Agriculture
• Waste Systems
• Beverage Industries
• Electroplating
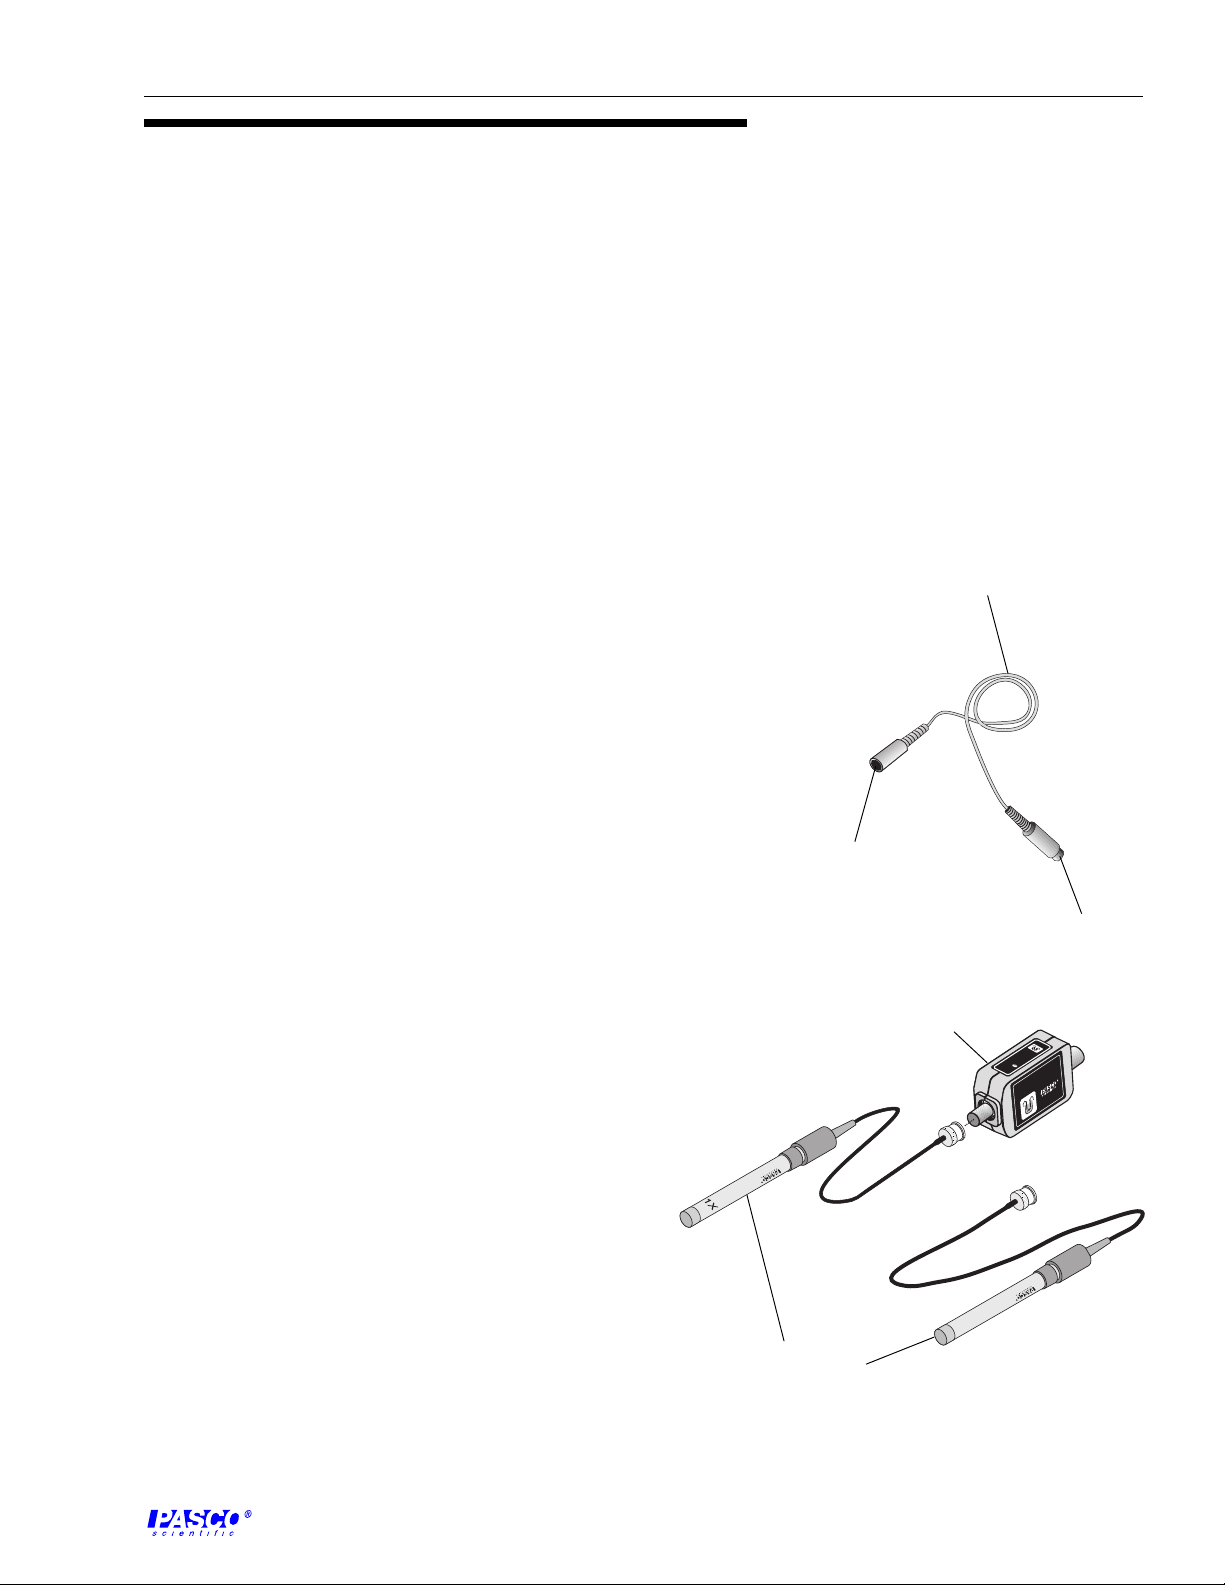
interface cable with 8-pin
DIN connectors
connector for
amplifier box
Equipment
connector for
computer
interface
Provided With CI-6729 (1X)
• 1X conductivity electrode with 3-foot BNC cable
• Conductivity Sensor Amplifier box with 8-pin DIN
connector and BNC connector
• interface cable with DIN connector
amplifier box
Provided With CI-6739A (10X)
• 10X conductivity electrode with 3-foot BNC cable
• Conductivity Sensor Amplifier box with 8-pin DIN
connector and BNC connector
• interface cable with DIN connector
Additional equipment required
• Any PASCO Science Workshop® computer interface
• computer
Replacement Electrodes
• 1X conductivity electrode: 699-06620
• 10X conductivity electrode: 699-06621
conductivity
electrodes
1
Page 6

Conductivity Sensor 012–06485B
Maintenance
Cleaning
To ensure accurate and reproducible results, the electrode cell must be clean.
A dirty cell will contaminate the solution and change the conductivity of the
liquid.
Cells can be cleaned with detergent and/or dilute nitric acid (1%) by dipping
or filling the cell with cleaning solution and stirring for three minutes.
Storage
Although the best method to store the electrode is by immersing it in deionized
water, the electrode can be stored dry in its container. If the cell is stored dry,
it should be soaked in distilled water for 5 to 10 minutes before use.
Specifications:
CI-6729 (1X conductivity electrode)
• Range: 20k scale: 0–20,000 µS/cm
2k scale: 0–2,000 µS/cm
200 scale: 0–200 µS/cm
• Conductivity electrode cell constant: 1.0 ± 0.1
• Accuracy: without calibration < 10%
after calibration < 1%
• Resolution: 20k scale, ± 10 µS
2k scale, ± 1.0 µS
200 scale, ± 0.1 µS
• Temperature range 0–80°C
• Electrode body: Epoxy
CI-6739A (10X conductivity electrode)
• Range: 20k scale: 0–200,000 µS/cm
2k scale: 0–20,000 µS/cm
200 scale: 0–2000 µS/cm
• Conductivity electrode cell constant: 10 ± 1.0
• Accuracy: without calibration < 10%
after calibration < 1%
• Resolution: 20k scale, ± 100 µS
2k scale, ± 10 µS
200 scale, ± 1.0 µS
• Temperature range: 0–80°C
• Electrode body: Epoxy
2
Page 7
012–06485B Conductivity Sensor
Theory—Principles of Operation
of the Conductivity Sensor
What is Conductivity?
Conductivity (or specifically, electrolytic conductivity) is defined as the ability
of a substance to conduct electric current. It is the reciprocal of the more
commonly encountered term, resistivity. All substances possess conductivity
to some degree, but the amount varies widely, ranging from extremely low
(insulators such as benzene and glass) to very high (silver, copper, and metals
in general). Most industrial interest is in the conductivity measurement of
liquids that generally consist of ionic compounds dissolved in water. These
solutions have conductivities approximately midway between insulators and
metallic conductors. This conductivity can be measured quite easily by
electronic means, allowing a simple test that can tell much about the quality
of the water or the makeup of the solution. A broad line of conductivity
equipment is available to measure liquids ranging from ultrapure water (low
conductivity) to concentrated chemical streams (high conductivity).
Units of Conductivity
The units of measurement used to describe conductivity and resistively are
quite fundamental and are frequently misused. Once the units are known,
various waters can be quantitatively described.
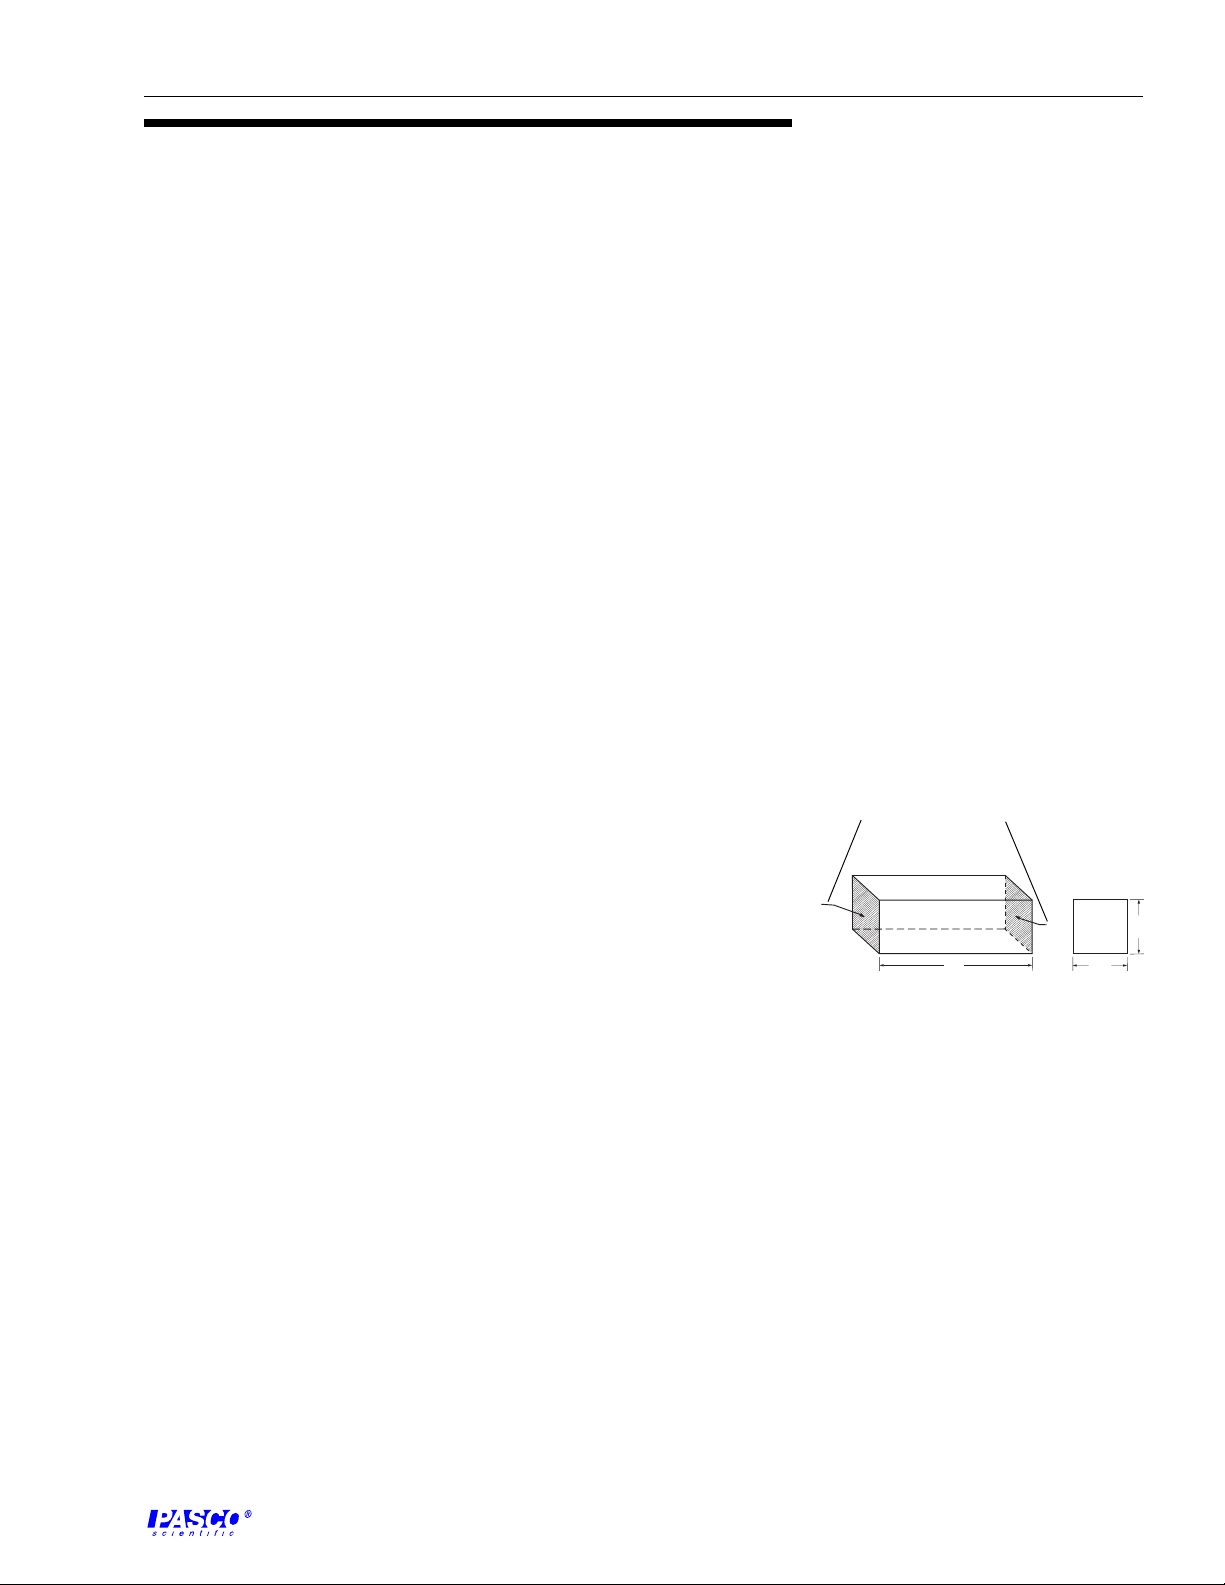
The basic unit of resistance is the familiar ohm. Conductance is the
reciprocal of resistance, and its basic unit is the siemens (S), formerly called
mho. In discussions of bulk material, it is convenient to talk of its specific
conduct-ance, now commonly called its conductivity. This is the conductance
as measured between the opposite faces of a 1 cm cube of the material
(Figure 1).
This measurement has units of siemens/centimeter (S/cm). The units
microsiemens/centimeter (µS/cm) and millisiemens/centimeter (mS/cm)
are most commonly used to describe the conductivity of aqueous solutions.
The corresponding terms for specific resistance (or resistivity) are
ohm - centimeter (Ω · cm), megaohm - centimeter (M Ω · cm) and
kiloohm - centimeter (k Ω · cm).
Users of ultra pure water prefer to use resistivity units of M
measurement in these units tends to spread the scale out in the range of
interest. These same users frequently use k
Ω
· cm when dealing with less
pure water such as tap water.
Ω
· cm, because
conducting surface
A
Pt
Figure 1
Conductivity Cube
B
Pt
L
L
H
A
A
W
3
Page 8

Conductivity Sensor 012–06485B
However when dealing with a chemical solution ranging from extremely
dilute to very concentrated chemical, use of conductivity units of µS/cm and
mS/cm are common. In these applications, conductivity has the advantage
of an almost direct relationship with impurities, especially at low
concentration. Hence, a rising conductivity reading shows increasing
impurities, or a generally increasing concentration in the case of a chemical
stream (with some exceptions in concentrated solutions). See Table 1 for a
comparison of resistance and conductivity.
Table 1. Conductivity Of Various Aqueous Solutions At 25 0C
Solution Conductivity Resistivity
Pure water 0.05 µS/cm 18 MΩ · cm
Power plant boiler water 0.05–1 µS/cm 1–18 MΩ · cm
Distilled water 0.5 µS/cm 2 MΩ · cm
Deionized water 0.1–10 µS/cm 0.1–10 MΩ · cm
Demineralized water 1–80 µS/cm 0.01–1 MΩ · cm
Mountain water 10 µS/cm 0.1 MΩ · cm
Drinking water 0.5 –1 mS/cm 1–2 kΩ · cm
Waste water 0.9–9 mS/cm 0.1–1 kΩ · cm
KCl solution (0.0l M) 1.4 mS/cm 0.7 Ω · cm
Potable water maximum 1.5 mS/cm 0.7 Ω · cm
Brackish water 1–80 mS/cm 0.01–1 Ω · cm
Industrial process water 7–140 mS/cm rarely stated
Ocean water 53 mS/cm rarely stated
10% NaOH 355 mS/cm rarely stated
100/0 H
2504
31% HNO
3
432 mS/cm rarely stated
865 mS/cm rarely stated
Conductivity Electrodes (Cells)
Simple conductivity sensors are constructed of an insulating material imbedded
with platinum, graphite, stainless steel or other metallic pieces. These metal
contacts serve as sensing elements and are placed at a fixed distance apart to
make contact with a solution whose conductivity is to be determined. The length
between the sensing elements, as well as the surface area of the metallic piece
determine the electrode cell constant, defined as length/area (Figure 1). The cell
constant is a critical parameter affecting the conductance value produced by the
cell and handled by the electronic circuitry.
A cell constant of 1.0 will produce a conductance reading approximately equal
to the solution conductivity. For solutions of low conductivity, the sensing
4
Page 9
012–06485B Conductivity Sensor
electrodes can be placed closer together, reducing the length between them
and producing cell constants of 0.1 or 0.01. This will raise the conductance
reading by a factor of 10 to 100 to offset the low solution conductivity and
give a better signal to the conductivity meter. On the other hand, the sensing
electrodes can be placed farther apart to create cell constants of 10 or 100
for use in highly conductive solutions. Table 2 lists the optimum conductivity
range for cells with different cell constants.
Table 2. Optimum Conductivity Range For Cells
With Different Cell Constants
Cell Constant Conductivity
0.01 0–20 µS/cm
0.1 0–200 µS/cm
1.0 0 –2000 µS/cm
10.0 0–200,000 µS/cm
to amplifier box
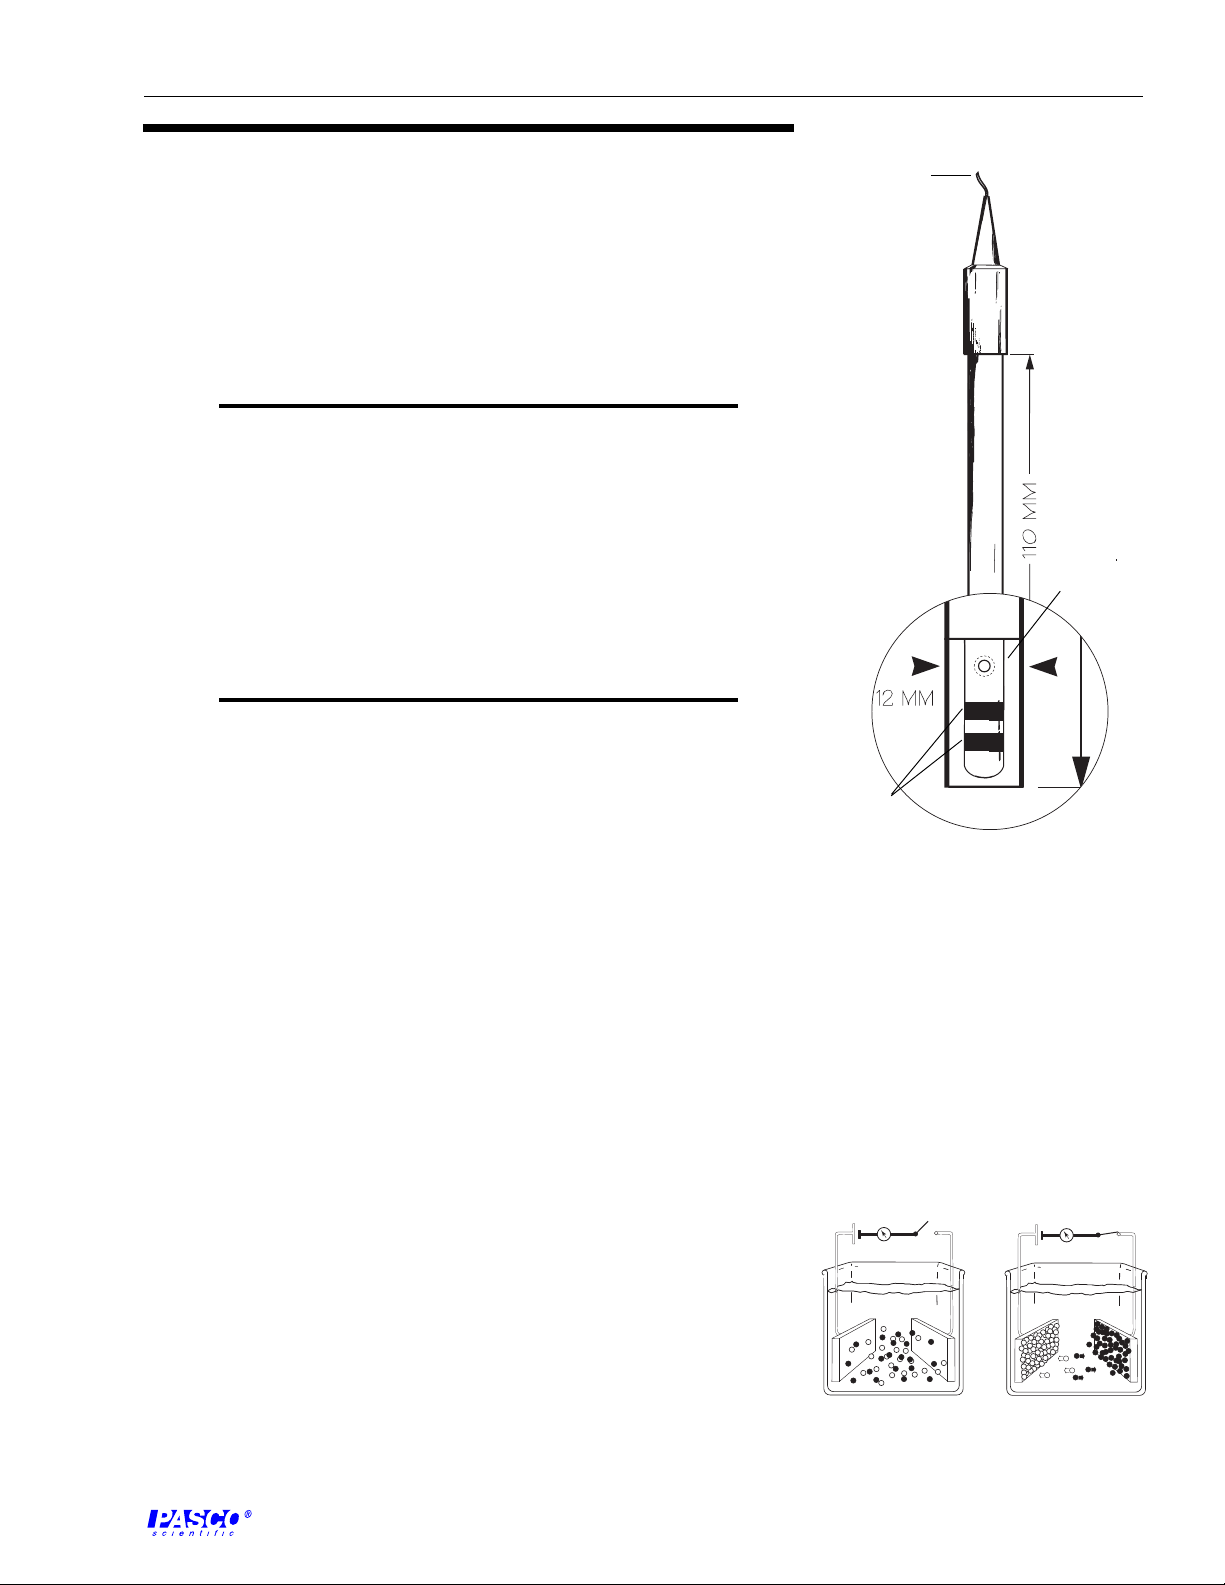
glass rod
The conductivity electrode provided with the CI- 6729 has a cell constant of
1.0 and is designed to achieve optimum performance over a range of 0 to
20,000 µS (Figure 2). This performance is achieved by using a cylindrical
cell geometry and platinized platinum conductors embedded on a glass rod.
For measurements of conductivity greater than 20,000 µS, the 10x electrode
should be used.
Conductivity Sensor Amplifier
The Conductivity Sensor amplifier has two distinct functions. First, it provides
a signal or voltage used to drive the conductivity electrode, and second, it
senses the electrical current the electrode passes when placed in the solution
to be tested.
If the voltage and current are known, then the resistance of the cell can be
determined. If the resistance of the cell is known, then the conductivity can
be determined by taking the inverse of the resistance and multiplying by the
conductivity cell constant. While it is instructional to know how the sensor
determines conductivity, Science Workshop handles the calculations and
reports conductivity for the 1x cell directly. If the 10x conductivity electrode
is used, the value reported by Science Workshop should be multiplied by ten.
platinized
platinum
conductors
Figure 2
Schematic view of the cell for the
CI-6729 Conductivity Electrode.
E
E
+
-
When a potential is a applied to the conductivity cell, the ions in solution are
influenced by the charge on the cell’s electrodes and begin to migrate toward
the electrodes (Figure 3).
Figure 3
Conductivity Cell in operation
5
Page 10

Conductivity Sensor 012–06485B
+
Figure 4
Polarized Electrode
➤ Approximate conductivities
°°
(at 25
°
C) and impurity
°°
concentrations (in ppm) of
various water samples are given
below.
-
Sample Conductivity
Pure H20 0.055 µS/cm (0.027 ppm)
Distilled H20 0.5 µS/cm (0.206 ppm)
City H20 50 µS/cm (25 ppm)
Ocean H20 53 mS/cm (35,000 ppm)
After a fairly short period of time most of the ions in solution will move
to the electrodes and the current flow through probe will begin to
decrease. This process is called polarization (Figure 4). Polarization
causes the conductivity probe’s output to be low if not corrected.
One method used to reduce the effects of polarization is to alternate the
polarity of the voltage applied to the electrode. Polarization of the
electrode and the associated build up of oxidation/reduction byproducts is prevented if the voltage is alternated quickly enough.
Conductivity Measurements
The conductivity of an electrolytic solution is dependent on several
factors, including the concentration of the solute, the degree of dissociation of the solute, the degree of dissociation of the molecules
present in the solution, the valiancy of the ion(s) present in the
solution, the mobilities of ions that are formed upon dissociation, and
the temperature of the solution. In general, ion mobilities remain
constant over a specific concentration range, depending on the solute
in solution. Within the specific concentration range, the conductivity
of a solution will increase in proportion to an increase in solute
concentration.
Since temperature is a measure of the average kinetic energy of an atom,
ion, or molecule, any change in temperature of a solution will strongly
affect the mobility of the species present in the electrolyte. Therefore,
the conductivity of the solution will also change. As a result, the
conductivity of a solution whose concentration is known is always
quoted for a specific temperature. Several tables in the Appendix
illustrate the temperature dependence of conductivity for specific
electrolytic solutions.
Concentration or total dissolved solid (TDS) measurements can also be
accurately determined by correlating the conductivity of a solution with
reference tables or graphs. TDS measurements are generally used to
estimate the salt content of water samples. A rule of thumb used to
estimate TDS in mg/L (ppm) is to divide the measured conductivity in
microsiemens per centimeter (µS/cm) by two. Table 4 in the Appendix
is a conversion chart for TDS measurements involving NaCl and
CaCO
Appendix.
. Additional references of conductivity data are also listed in the
3
6
Page 11
012–06485B Conductivity Sensor
Setup and Calibration
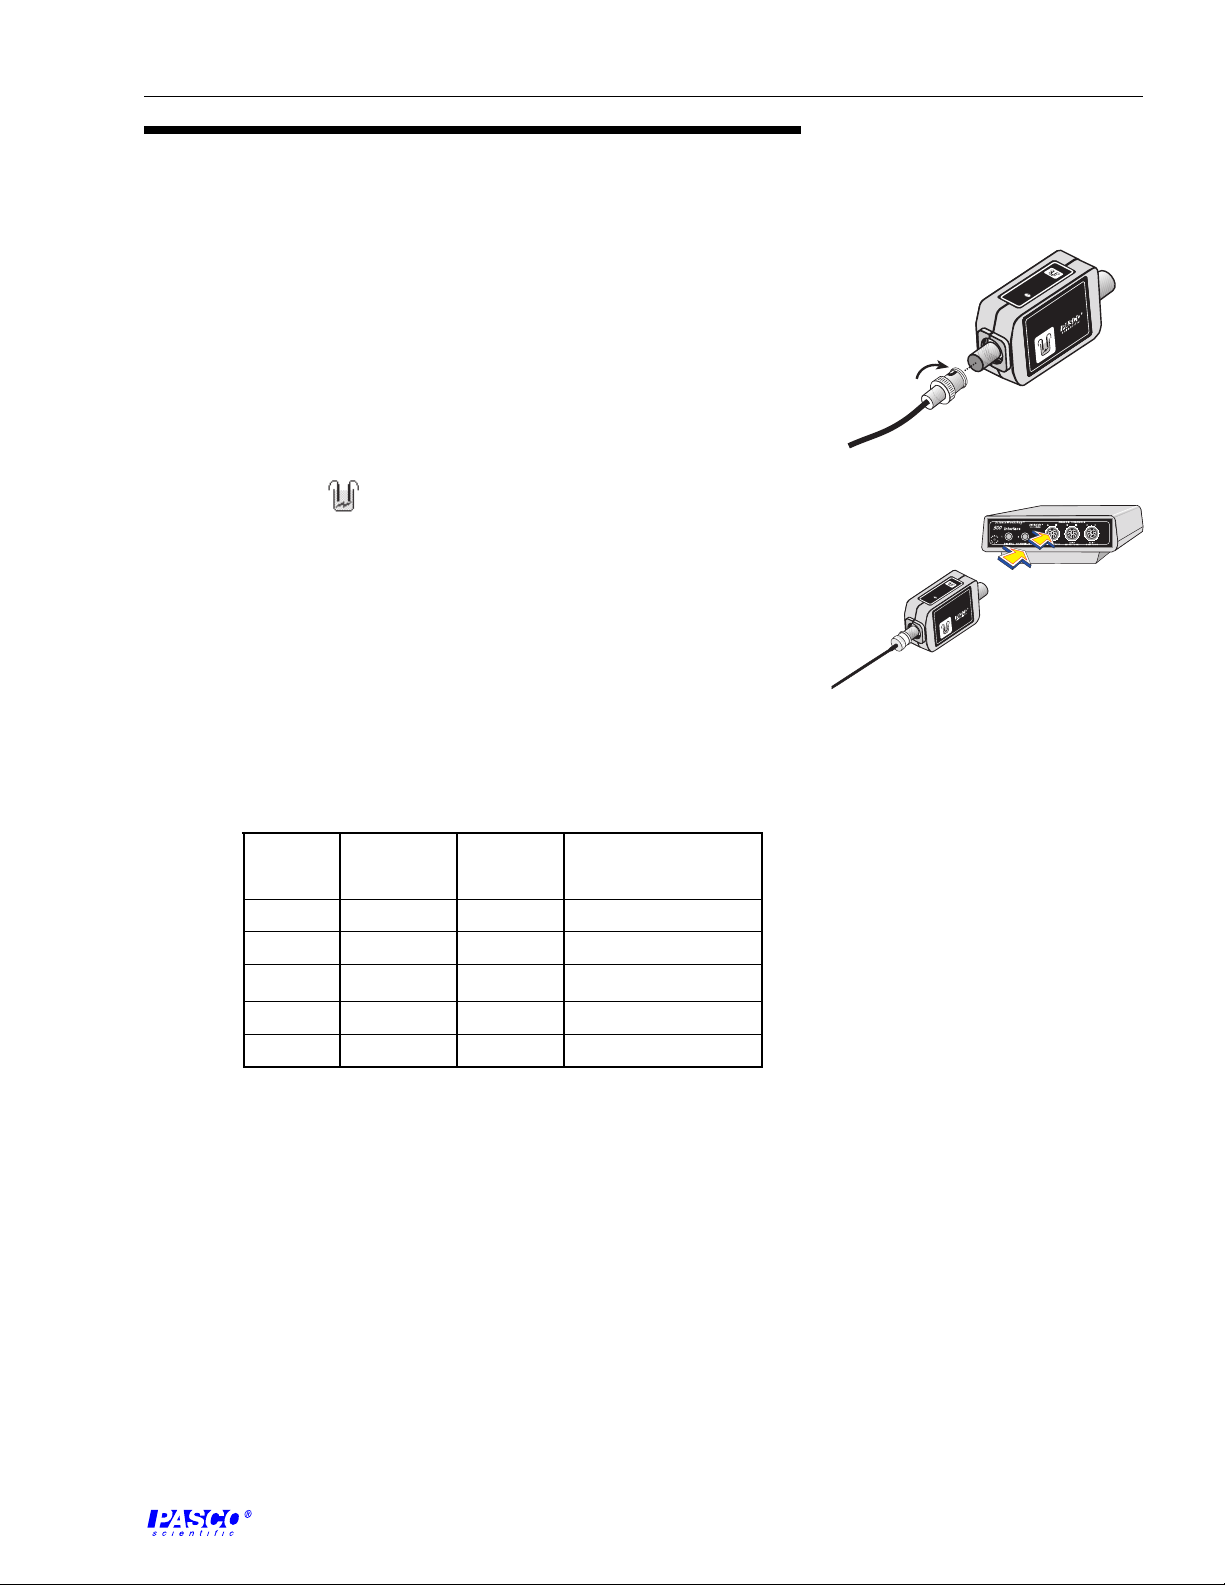
Set up
Science Workshop
1. Attach electrode to the amplifier box (Figure 5a).
2. Plug the 8-pin DIN connector of the amplifier box into any analog
channel on a PASCO computer interface (Figure 5b).
3. Launch Science Workshop, drag the analog plug icon to the analog
channel icon, and select Conductivity Sensor.
4. In the Experiment Setup window, drag a Graph display to the Conductivity
Sensor icon (
), and select the appropriate conductivity range to be
displayed. (The range setting selected on the amplifier box must match
the display range for the graph.)
➤➤
➤
A Digits display may also be used to display conductivity.
➤➤
Calibration
Prepare one of the weight percent NaCl solutions given in the table below
by weighing out in air the desired mass (mg) of NaCl in a 1-liter flask. Add
500 ml of deionized water and stir the solution to dissolve the salt. Add the
remaining 500 ml of deionized water and stir the solution.
RAN
SEL
20K
GE
ECT
2K
20
a
0
CONDUCTIVITY
CONDU
SENSOR
SENSOR
CTIVITY
I-6729
I-6729
C
C
I-6739A
C
b
R
S
A
E
N
2
L
G
0
E
E
K
C
2
K
T
2
0
0
CONDUCTIVITY
SENSOR
9
2
7
6
-
I
C
Figure 5
Plug the sensor into the computer
interface.
%Weight
(approx.)
0.001
0.01
0.1
1.0
10.0
➤➤
➤
For direct measurements of conductivity greater than 20,000
➤➤
Mass of
NaCl (mg)
10
100
1,000
10,000
100,000
TDS ppm
or mg/liter
10
100
1,000
10,000
100,000
Conductivity (µS/cm)
at 25 °C
21.4
210
1,990
17,600
140,000
µS the 10x electrode should be used. The 1x electrode may be
used if a 10:1 dilution of the solution to be measured is made. If
the 10:1 dilution method is used remember to multiply the value
indicated by 10.
➤➤
➤
For measurements that require very high accuracy, a KCl
➤➤
standard should be used (see Table 5 in the Appendix).
Other calibration solutions can be prepared using the tables and graphs in the
Appendix.
7
Page 12

Conductivity Sensor 012–06485B
Single-Point Calibration
➤ Always calibrate the
electrode before measuring
absolute (rather than relative)
concentrations.
1. Open the Conductivity Sensor calibration dialog box by double-
clicking the Conductivity Sensor icon in the Experiment Setup
window.
2. Make sure that the low value is set at 0.000 µS/cm and 0.000 volts
(default values). If these values are not set at zero, enter 0.000 in
the dialog boxes for Low Value of µS/cm and Volts.
3. Place the Conductivity Sensor into the calibration solution. In the
High Value box type a value in µS/cm that corresponds to the
known weight percent solution. As soon as the voltage reading
stabilizes, click Read to enter the HighValue.
➤ Note: This manual has been written with the assumption that the
user has a basic familiarity with Science Workshop and has access to
the User’s Guide for Science Workshop. Users can gain basic skills by
viewing the training video and by doing the tutorial within Science
Workshop. Another useful resource is the Quick Reference Card for
Science Workshop.
8
Page 13

012–06485B Conductivity Sensor
Experiment 1: Introduction to the Operation of the
Conductivity Sensor
Purpose
The purpose of this experiment is to learn the basic operation of the Conductivity Sensor.
Materials and Equipment Needed
• Conductivity Sensor • 150 ml distilled or deionized H2O
• Science Workshop version 2.2.5 or higher • 150 ml tap H
• PASCO computer interface • 150 ml mineral H
• computer • 150 ml bottled drinking H
• 250 ml beaker (5) • wash bottle of distilled or deionized H
• Conductivity Sensor manual
O
2
O
2
O
2
O
2
Procedure
1. Soak the Conductivity Electrode in distilled or deionized H2O for 5–10 minutes.
2. Set up the Conductivity Sensor according to the procedure detailed in the Conductivity
3. Make sure all water samples are at room temperature. Define a labeling scheme to identify
4. Insert the Conductivity Electrode into the first 150 ml water sample. Wait until the display
5. Remove the electrode and rinse it with the wash bottle.
6. Repeat steps 4 and 5 with the remaining samples. Note that you might need to switch to the
κ(distilled or deionized H
Sensor manual (select Digits display only). Select the 200 scale on the amplifier box.
➤ Note: Calibration is not needed for this experiment.
the water samples.
stabilizes, and record the conductivity value below.
2k scale for one or more of samples.
O) =__________ µS/cm κ(tap H2O) =___________ µS/cm
2
κ(bottled H
Data Analysis
O) = __________ µS/cm κ(mineral H2O) =__________ µS/cm
2
9
Page 14

Conductivity Sensor 012–06485B
Some vendors of drinking and mineral water list the total dissolved solids (TDS) in parts per million. Using the rule of
thumb described in the Theory section of the Conductivity Sensor manual and calculate the TDS of the drinking water
and the mineral water.
TDS drinking H
Compare your results with those listed on the bottles.
Questions
1. Which sample has the highest level of impurities?
2. Why is it important to have all the water samples at the same temperature?
O = __________ ppm TDS mineral H2O = __________ ppm
2
10
Page 15

012–06485B Conductivity Sensor
Experiment 2: Concentration Dependence of Conductivity in
Aqueous Solutions
Purpose
The purpose of this experiment is to explore the relationship between concentration and conductivity
in aqueous solutions.
Materials and Equipment Needed
• Conductivity Sensor • 150 ml distilled or deionized H2O
• Science Workshop version 2.2.5 or higher • citric acid crystalline powder
• PASCO computer interface • stirring rod
• computer • 150 ml bottled drinking H
• 250 ml beaker (5) • wash bottle of distilled or deionized H
• Conductivity Sensor manual
Procedure
O
2
O
2
1. Soak the Conductivity Electrode in distilled or deionized H2O for 5–10 minutes.
2. Set up the Conductivity Sensor according to the procedure detailed on pages 6–7 of the
manual (select Digits display only). Select the 20k scale on the amplifier box. Calibration
is not needed for this experiment.
3. Make sure all water samples are at room temperature (i.e. same temperature).
4. In the Experiment Setup window, click Sampling Options, and select the Keyboard
check box. In the Parameter box, type Mass, and in the Units box, type grams.
5. Click the Graph display to make it active. Click the Horizontal Axis Input button
(
6. Add 0.25 grams of citric acid into the distilled/deionized water. Stir the solution until the
crystals have dissolved.
7. Click REC to begin recording data. (The Keyboard Sampling window will open. Move the
window so you can see the other displays.) In the Keyboard Input box, type the number of
grams added (0.25 grams) to the solution for Entry #1 and click Enter.
), and select Mass (grams).
8. Add citric acid in 0.25 gram increments for the first 2.0 grams. in the Keyboard Input box,
type in the total mass of citric acid added to the solution for each increment. (Make sure the
reading on the Digits display stabilizes first.)
9. After two grams have been added, increase the increments to 0.5 grams until 5.0 grams of
citric acid have been added to the solution. Then increase the increments to 1.0 gram until
11
Page 16

Conductivity Sensor 012–06485B
15.0 grams of citric acid have been added. In the Keyboard Input box continue to type the
total mass of citric acid added to the solution for each increment. Note that as more acid is
added to the solution, additional time will be needed to dissolve the crystals.
10. When the 15.0 grams have been added increase the increments to 5.0 grams. Click Stop
Sampling after 60 grams of citric acid have been added to the solution.
11. Remove the electrode and rinse it with the wash bottle.
Questions
1. Describe your results.
2. Explain the behavior of the conductivity vs. mass graph at high concentrations.
12
Page 17

012–06485B Conductivity Sensor
Experiment 3: Temperature Dependence of Conductivity in
Dilute Aqueous Solutions
Purpose
The purpose of this experiment is to explore the relationship between temperature and conductivity
in aqueous solutions.
Materials and Equipment Needed
• Conductivity Sensor • sodium chloride (NaCl)
• Temperature Sensor • 200 ml 0.005 M sodium hydroxide (NaOH)
• Temperature Sensor Teflon FEP cover • 400 ml distilled or deionized H
• Science Workshop version 2.2.5 or higher • 250 ml Erlenmeyer flask or beaker (5)
• PASCO computer interface • hot plate with magnetic stirrer
• computer • base and support rod
• Conductivity Sensor manual • mass balance
• graduated cylinder • buret clamps (2)
• apron, gloves, and goggles
Procedure
O
2
1. Soak the Conductivity Electrode in distilled or deionized H2O for 5–10 minutes.
2. Prepare a 0.1% NaCl solution by dissolving 200 mg of NaCl in 200 ml of distilled or deionized
O. Prepare a 0.4% NaCl solution by dissolving 800
H
2
mg of NaCl in 200 ml of distilled or deionized H
O.
2
Prepare a 0.005 M NaOH solution by dissolving 200
mg of NaOH in 1000 ml of distilled or deionized H
O.
2
to computer
interface
A graduated cylinder should be used to measure 200
ml of H
O. Pour 150–200 ml of the solution into the
2
250 ml flask or beaker and place it on the hot plate.
The distilled H
O for the samples should be at room
2
temperature or below.
3. Insert the Temperature Sensor into the Teflon FEP
cover to isolate the grounded tip of the Temperature
Sensor from the conductive solution. Place the
Conductivity Electrode and Temperature Sensor into
the flask or beaker. Both electrodes should be supported
with buret clamps that are mounted on base and
support rods (see Figure 3.1).
Temperature
Sensor and
Teflon cover
conductivity
electrode
beaker &
spin bar
magnetic
stir-hot
plate
Figure 3.1
Experiment Setup
13
Page 18

Conductivity Sensor 012–06485B
4. Set up the Conductivity Sensor according to the procedure detailed in pages 6–7 of the
manual. Select the 20k scale on the amplifier box.
➤ Calibration is not needed for this experiment.
5. Plug the Temperature Sensor into analog channel B of the interface box. In the Experiment
Setup window of Science Workshop, drag the analog plug icon to the analog channel B
icon, and select Temperature Sensor.
6. Open a Digits display by dragging Digits icon to the Temperature Sensor icon.
7. Click the Horizontal Axis Input button, and select Analog B, Temp.
8. Define a labeling scheme to identify the solutions.
9. In the Experiment Setup window, click Sampling Options, select Slow under Periodic
Samples, and set the sampling rate to 1 per 5 seconds.
10. Insert the Conductivity Electrode into the first 200 ml water sample. Turn on the hot plate
and magnetic stirrer. The heat and the stirring controls should be set to a mid-range value.
Click the REC. Tap the Conductivity Electrode occasionally to avoid the formation of air
bubbles in the electrode’s cell. When the temperature of the solution reaches 60 °C, click
STOP.
11. Remove the temperature and conductivity electrodes, and rinse them with the wash bottle.
12. Repeat steps 9 and 10 with the other solutions.
Data Analysis
1. Click the Graph display to make it active. Click the Statistics button ( ) to open the
Statistics area on the right side of the graph.
2. On the Experiment menu, select Run 1.
3. Click the Autoscale button (
4. Click the Statistics Menu button (
5. Click on the Smart Cursor button (
the temperature is 25 °C. Divide the value of the slope by the conductivity reading at 25 °C
and multiply by 100% to determine percent change/°C at 25 °C. Record your results in the
Data Table. (The temperature dependence of the electrical conductivity is expressed usually
expressed in this manner.)
) to re-scale the Graph display to fit the data.
), and select Curve Fit ➤ Linear Fit.
). Move the cursor to the place in the graph where
14
Page 19

012–06485B Conductivity Sensor
Data Table
Solution percent/ °C at 25 °C
1000 ppm NaCl
4000 ppm NaCl
1000 ppm NaOH
Questions
1. Describe the effect of temperature change on the conductivity of the solutions.
2. Compare the experimentally determined values of the percent/ °C at 25 °C for the 4 samples.
3. What are some factors that affect the conductivity of a solution?
15
Page 20

Conductivity Sensor 012–06485B
16
Page 21

012–06485B Conductivity Sensor
Experiment 4: Acid-Base Titration with the Conductivity Senso
Purpose
The purpose of this experiment is to explore the electrical transport processes of an acid-base
titration. In addition, this experiment will explore the possibility of using a Conductivity Sensor
to find the equivalence point.
Materials and Equipment Needed
• Conductivity Sensor • 10 ml pipette
• Science Workshop version 2.2.5 or higher • distilled or deionized H
• Temperature Senor Teflon FEP cover • was bottle of distilled or deionized H
• PASCO computer interface • 250 ml beaker (2)
• computer • magnetic stirrer & spin bar
• 100 ml graduated cylinder • 0.03 M hydrochloric acid (HCl)
• buret and buret clamps (2) • 0.5 M sodium hydroxide (NaOH)
• Conductivity Sensor manual • buffer solutions: low pH (4) and high pH (10)
• apron, gloves, and goggles
O
2
O
2
Optional Materials
• 0.03 M acetic acid
Procedure
1. Soak the conductivity electrode in distilled or deionized H2O for 5–10 minutes.
2. Set up the Conductivity Sensor according to the procedure detailed in pages 6–7 of the
manual. Select the 20k scale on the amplifier box. (Calibration is not needed for this
experiment.)
3. In the Experiment Setup window, click Sampling Options , and select the Keyboard
check box In the Parameter box, type Volume, and in the Units box, type ml.
4. Click the Graph Display for the Conductivity Sensor. Click the Horizontal Axis Input
button, and select Volume (ml).
5. Use a graduated cylinder to measure 150 ml of 0.03 M HCl solution in a clean dry 250 ml
beaker.
6. Carefully put the spin bar into the beaker. Place the beaker with the 0.03 M HCl solution
and spin bar on the magnetic stirrer. Add a few drops of indicator into the 0.03 M HCl
solution.
7. Use a buret clamp and the base and support rod to position the conductivity electrode so the
cell is in the 0.03 M HCl solution, but will not interfere with the spin bar.
17
Page 22

Conductivity Sensor 012–06485B
8. Rinse the 50 ml buret with a few ml of the 0.5 M sodium
hydroxide (NaOH) solution. Dispose of the rinse solution as
directed.
9. Use a second buret clamp to attach the buret to the support
rod. Arrange the buret above the beaker so that you can use
rod, support
stand, and
buret clamps
the buret to add precise amounts of solutions to the beaker
(Figure 4.1).
10. Fill the buret with 0.5 M NaOH solution to the 0 mark on the
buret. Be sure to start the titration with the buret filled with
0.5 M NaOH solution and the volume used at exactly 0.00
ml.
11. Turn on the magnetic stirrer.
12. Click REC. (The Keyboard Sampling window will open.
Move the window so you can see the other displays.) Do
magnetic
stir plate
not add any titrant for the first reading. In the Keyboard
Input box, type 0.00 for Entry #1 and click Enter.
13. Add 0.5 M NaOH to the 0.03 M HCl solution in increments
Figure 4.1
Experiment Setup
of 1 ml. In the Keyboard Input box, type the total volume of
titrant added to the HCl solution, and click Enter. (Make sure the reading on the Digits
display stabilizes first.)
buret
conductivity
electrode
beaker &
spin bar
14. Repeat step 13 until 5 ml of titrant is added.
15. After 5 ml of titrant has been added, add 3–10 drops of 0.5 M NaOH per increment.
16. After approximately 5 ml of 0.5 M NaOH is added past the equivalence point, increase
17. When the conductivity reaches 15,000–20,000 µs/cm, click Stop Sampling and turn off the
(Optional) Repeat the experiment using 150 ml 0.03 M acetic acid.
Questions
1. Based on your observations, how can the Conductivity Sensor be used to determine the
Decrease your increments as you approach the equivalence point. Note that 3 drops is
approximately the smallest increment that will yield a noticeable change in the volume of
titrant added to the solution. As you approach the equivalence point, you will see patches of
pink in the solution for each drop of titrant added. Continue to type in the total volume of 0.5
M NaOH added after each increment. Observe the values of the conductivity near the
equivalence point.
your increments to 1 ml larger, and continue typing the total volume of titrant added.
magnetic stirrer. Rinse the sensor with the wash bottle.
equivalence point?
18
2. How much 0.5 M NaOH titrant was required to reach the equivalence point?
Page 23

012–06485B Conductivity Sensor
Teacher’s Notes
These experiments are designed to familiarize the student with the operation of the Conductivity
Sensor. In addition, these experiments illustrate various factors that affect sensor readings. We
recommend that the experiments are performed in order, with the student building on the
information from previous experiments.
Notes on Experiment 1
1. This experiment is designed to familiarize students with the basic operations of the
Conductivity Sensor, and the effects of impurities on water samples. In addition to the
water samples listed in this experiment, students can carry out ecological investigations by
measuring the conductivity of water samples taken from streams, ponds, lakes or the ocean.
The student can calibrate the sensor (as described on page 6 and 7) if very accurate
measurements are desirable.
ä
Students will need access to pages 6–7 of the manual.
Below are some sample data. The bottled water was Crystal Geyser and the mineral water was
Perrier.
κ(distilled or deionized H
κ(bottled H
O) = ________ µS/cm κ(mineral H2O) = ________ µS/cm
2
Data Analysis
TDS distilled or deionized H2O = __________ ppm TDS tap H2O = __________ ppm
TDS bottled =__________ ppm TDS mineral = __________ ppm
Answers to questions
1. The mineral water should have the highest levels of impurities in it.
2. Since temperature is related to the velocity of the ions in the solutions, change in temperature
will affect the transport of electric charges in the solution, resulting in a change in the
conductivity of the solution.
O) = ________ µS/cm κ(tap H2O) = ________ µS/cm
2
470
148 747
2
74
374
35
Notes on Experiment 2
It is assumed that the student has completed experiment 1 before carrying out this experiment.
Students must keep stirring the solution until all crystals have been dissolved before each
conductivity measurement. As the concentration increases the amount of time required to stir
19
Page 24

Conductivity Sensor 012–06485B
the solution will increase. Students can use a magnetic stirrer, if
available. An example of the data is shown in Figure TG-1.
Answers to Questions
1. Students should find that at low concentrations the
conductivity increases linearly with added mass of the citric
acid. At higher concentrations the conductivity will begin
to deviate from linearity and eventually decrease when the
concentration is very high.
2. As the concentration increases, the electrolytes are more
likely to collide. Therefore, their mobility decreases.
Furthermore, the degree of dissociation of the solvent
decreases as the solution approaches saturation. As the
solution approaches saturation, the concentration dependence of conductivity deviates from
linearity. At low concentrations the mobility of the ions and the degree of dissociation of the
molecules remain constant, thus the dependence is linear.
Figure TG-1
Notes on Experiment 3
It is assumed that the student has completed experiments 1 and 2 before carrying out this
experiment.
1. If bubbles form inside the conductivity cell, the conductivity reading will be reduced, since
the they will form an insulating layer on one or both of the cell electrodes. This is more
likely to occur at higher temperatures. One can eliminate the bubbles by increasing the
setting on the magnetic stirrer to allow the solution to flow through the cell. This effect can
also be eliminated by tapping/shaking the electrode.
2. If time is limited, the solutions could be prepared before the laboratory period begins.
Data Analysis
The table below lists typical experimental results. In general, ionic salts at low to moderate
concentrations have a temperature dependence of 2% / °C at 25 °C. Acids, bases, and
concentrated salt solutions have somewhat lower values, typically 1.5% / °C. On the other
hand, ultra pure water has by far the largest slope, 5.2% / °C.
Answers to Questions
Solution percent/ °C at 25 °C
1000 ppm NaCl
2.1
20
4000 ppm NaCl
1000 ppm NaOH
2.0
1.9
Page 25
012–06485B Conductivity Sensor
1. The conductivity increases linearly with temperature over
the observed temperature region.
2. The slopes are approximately equal for all the solutions.
3. Temperature, concentration, and solubility will effect the
conductivity of a solution.
Figure TG-2
Typical experimental results
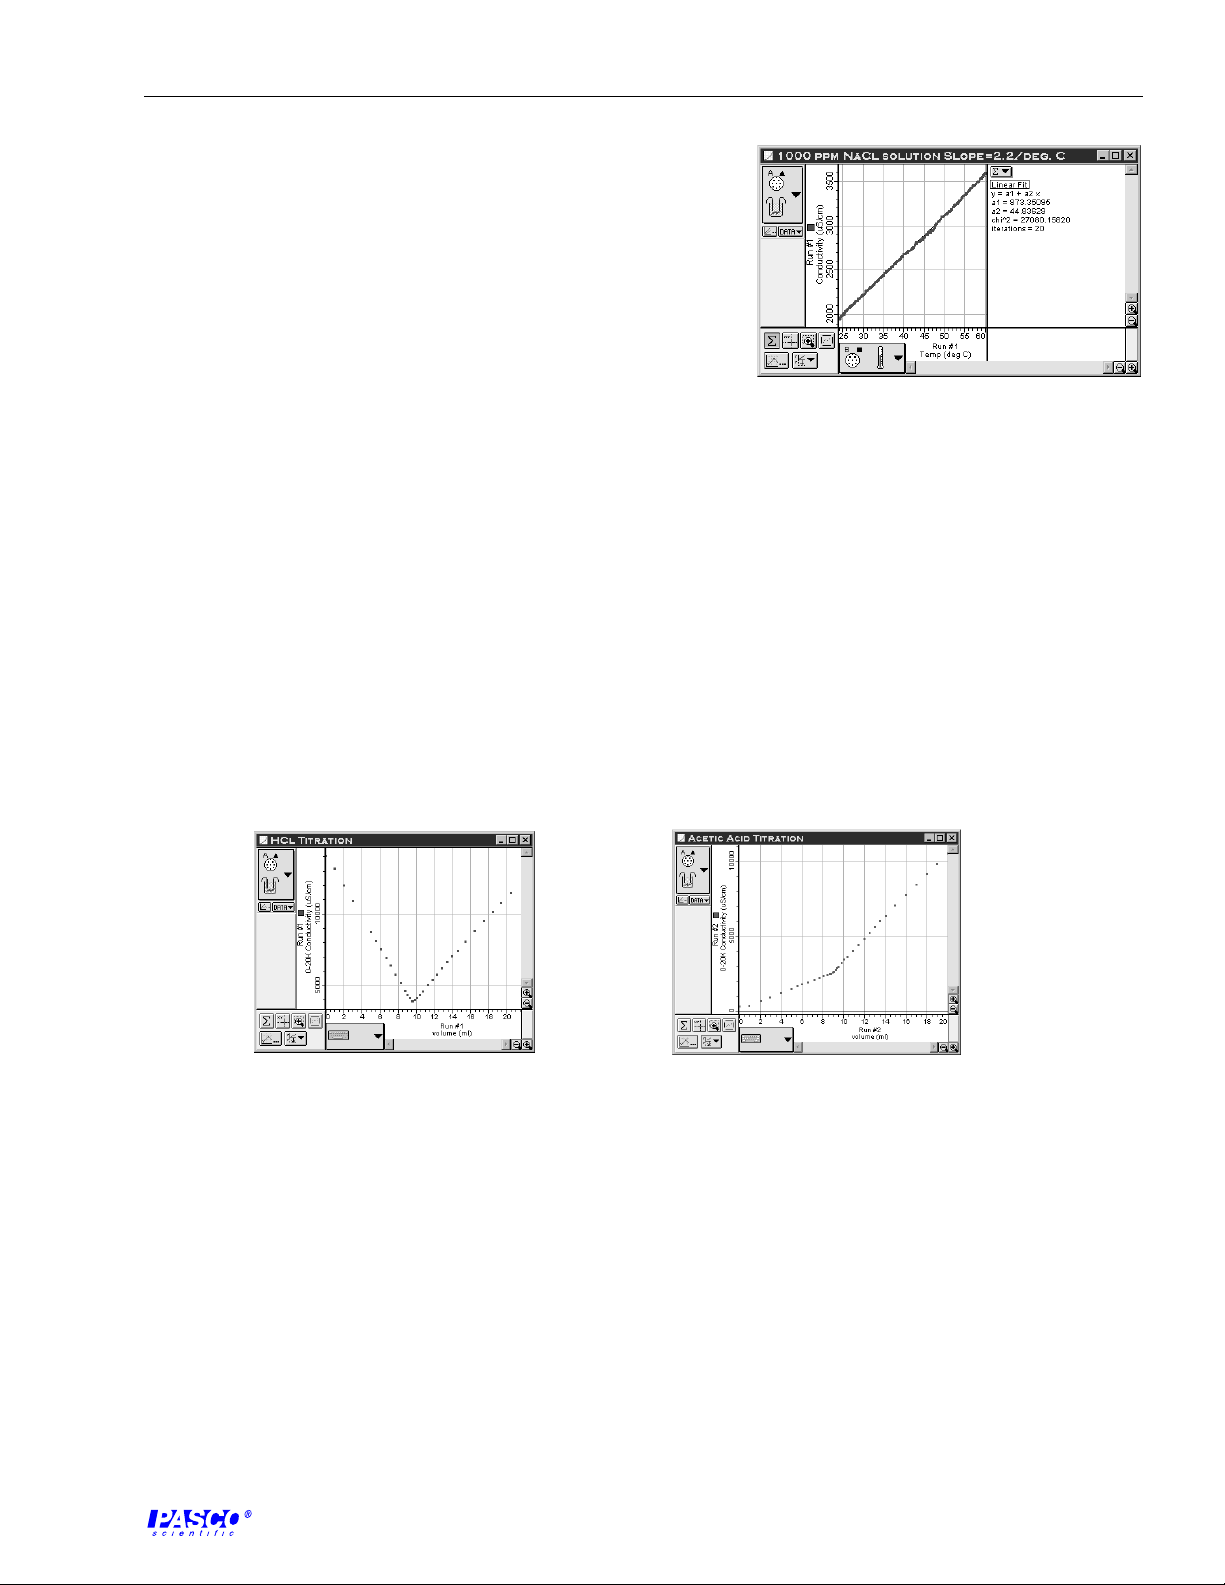
Notes on Experiment 4
1. It is important that the student take great care in titrating
the solution near the equivalence point. Then students will easily see the discontinuity in the
conductivity (κ) vs. Volume of titrant added graph. Typical data sets are shown in Figure
TG-3.
2. In more advanced courses the teacher can modify this experiment so that the student can
calculate the molarity of an HCl solution whose concentration is unknown.
3. As usual, the teacher should instruct students on the dangers of acids and bases, and their
Figure TG-3
Typcial experimental results
proper disposal.
Answers to Questions
1. The equivalence point is easily determined by observing the point where the slope of the line
of Concentration vs. Volume of added titrant changes.
2. Students should find that about 9 ml of titrant must be added to the acid solution to reach the
equivalence point.
21
Page 26

Conductivity Sensor 012–06485B
22
Page 27

012–06485B Conductivity Sensor
6
6
9
9
6
6
6
8
3
3
6
0
3
3
6
Appendix
Table 1—Conductivity of Various Water Samples at 25 °C
Resistivity in ohm-cm 100M 10M 1M .1M 10K 1K 100 10 1
Conductivity in
microsiemens/cm .01 .1 1 10 100 1000 10K 100K 1000K
2345
Ultra pure Water
Demineralized Water
Condensate
Natural Waters
Cooling Tower Coolants
% Level of Acids, Bases & Salt
5% Salinity
2% NaOH
20% HCL
Contacting Electrodes
Electrode-less Systems
2345
2345678
2345678
23456789012345
23456789012345
23456789012345
234567890123456789012345
23456789012345678901234567890121234567
2
2
234567890123456789012345678901212345678901234567890123456789
234567890123456789012345678901212345
2
2
Typical Values
23
Page 28

Conductivity Sensor 012–06485B
Table 2—Table of Conductivity vs. Concentration for Common Solutions
Conductivity (G) in microsiemens/cm (micromhos/cm) at 25 °C (77 °F)
Wt. % ppm NaCl NaOH HCI H2SO
mg/liter
000.0001
000.0003
000.001
000.003
000.01
000.03
000.1
000.3
001.0
003.0
005.0
010.0
020.0
030.0
040.0
050.0
075.0
100.00
Point of
Maximum
Solubility
0.0001
0.0003
0.0010
0.0030
0.0100
0.0300
0.1,000
0.3,000
110,000
Rarely Used
▲▲
▲
▲▲
00002.2
00006.5
00021.1
000064
000210
000617
01,990
05,690
17,600
48,600
78,300
140,000
226,000
sat
sat
sat
sat
sat
Point of
Maximum
26%
00006.2
00018.4
00061.1
000182
000603
0 1,780
0 5,820
16,900
53,200
144,000
223,000
358,000
414,000
292,000
191,000
150,000
sat
sat
Point of
Maximun
Abt. 50%
00011.7
00035.0
000116
000340
001,140
003,390
011,100
032,200
103,000
283,000
432,000
709,000
850,000
732,000
sat
sat
sat
sat
Point of
Maximun
37%
00008.8
00026.1
00085.6
000251
000805
002,180
006,350
015,800
103,000
048,500
141,000
237,000
427,000
709,000
828,000
770,000
182,000
010,000
Point of
Maximun
—
4
HNO
3
00006.8
000220
000867
000199
000657
001,950
006,380
018,900
060,000
172,000
275,000
498,000
763,000
861,000
820,000
717,000
340,000
050,000
Point of
Maximun
—
HF Acetic*
Acid
000010
000230
000899
000290
000630
001,490
002,420
005,100
011,700
034,700
062,000
118,000
232,300
390,000
NA
NA
7.8 (0 °C)
0 4 (0
Point of
Maximun
—
00004.2
00007.4
00015.5
00030.6
000063
000114
000209
000368
000640
01,120
01,230
01,530
01,600
01,405
01,080
00740
00168
°C)
Point of
Maximun
< 1
—
Point(s) of
Maximum
Conductivity
Maximum
Conductivity
*HAc data at 18 °C
Point(s) of
Maximum
26%
Maximum
244,000
Point(s) of
Maximum
16%
aximum
412,000
Point(s) of
Maximum
18.5%
aximum
852,000
Point(s) of
31%
92.5%
830,000
139,000
Point(s) of
Maximum
31%
aximum
862,000
Point(s) of
Maximum
Abt. 35%
aximum
NA
Point(s) of
Maximum
19%
aximum
1,600
24
Page 29

012–06485B Conductivity Sensor
Table 3—Table of Conductivity vs. Concentration for Common Solutions
Conductivity (G) in microsiemens/cm (micromhos/cm) at 25 °C (77 °F) Except Where Noted
Wt . % ppm H3PO4 NH4OH N H3 CaCl2 KNO3 CuSO4 CO2 SO2
000.0001
000.0003
000.001
000.003
000.01
000.03
000.1
000.3
001.0
003.0
005.0
010.0
020.0
030.0
040.0
050.0
075.0
100.00
Point of
Maximum
Solubility
mg/liter
0 1
0.0003
0.0010
0.0030
0.0100
0.0300
0.1,000
0.3,000
110,000
Rarely Used
▲▲
▲
▲▲
00003.9
00011.5
00036.5
0107
0342
0890
2,250
4,820
10,500
23,000
35,000
60,700
123,000
182,000
223,000
231,000
135,000
48,000*
Poin
Maximun
—
00004.1
00018.3
0017
0031
0058
0102
0189
0329
0490
0790
0958
1,115
0968
0725
0460
0285
sat
—
Point of
13.6%
(1 atm)
00006.6
0014
0027
0049
0084
0150
0275
0465
0810
1,110
1,115
1,120
0435
sat
sat
sat
sat
< 1
Point of
28%
(1 atm)
00002.4
00026.7
00 24
00 71
0 230
0 670
2,080
5,900
18,000
50,000
74,000
130,000
195,000
190,000
120,000
sat
sat
sat
Point of
Maximun
46%
00001.3
0004
0013
0139
0130
0390
1,300
3,700
11,500
32,000
52,000
95,000
171,000
sat
sat
sat
sat
sat
Point of
Maximun
22%
00000.6
00001.8
0016
0118
0158
0160
500
1,450
4,600
13,000
21,500
36,500
sat
sat
sat
sat
sat
sat
Point of
Maximun
17.5%
00001.2
00001.9
00013.9
00036.8
0012
0020
0039
sat
sat
sat
sat
sat
sat
sat
sat
sat
sat
< 1
Point of
.15%
(1 atm)
00006.4
0018
0054
0150
0450
1,200
3,600
7,900
17,200
32,700
42,000
61,000
sat
sat
sat
sat
sat
< 1
Point of
11.7%
(1 atm)
Point(s) of
Maximum
Conductivity
Maximum
Conductivity
*Estimated
Point(s) of
Maximum
47%
aximum
234,000
Point(s) of
Maximum
2.67%
1,120
(18 °C)
Point(s) of
Maximum
5.5%
1,120
(18 °C)
Point(s) of
31%
24%
830,000
204,000
Point(s) of
Maximum
22%
aximum
185,000
Point(s) of
Maximum
17.5%
aximum
52,000
Point(s) of
Maximum
.15%
aximum
48
Point(s) of
Maximum
11.7%
aximum
66,000
25
Page 30

Conductivity Sensor 012–06485B
Table 4—Conversion Chart to Estimate TDS of Aqueous Solutions
Specific
conductance
micromhos/cm*
.055
.056
.063
.071
.083
.100
.125
.167
.250
.500
1.000
1.250
1.667
2.500
5.000
10.000
20.000
40.000
80.000
158.730
312.500
625.000
1,250.000
2,500.000
5,000.000
10,000.000
Specific
resistance
megohmos-cm*
18.240
18.000
16.000
14.000
12.000
10.000
8.000
6.000
4.000
2.000
1.000
.800
.600
.400
.200
.100
.050
.025
.0125
.0063
.0032
.0016
.0008
.0004
.0002
.0001
As Ion
none
.036
.041
.046
.054
.065
.081
.108
.163
.325
.650
.813
1.083
1.625
3.250
6.500
13.000
26.000
52.000
103.175
203.125
406.250
812.500
1,625.000
3,250.000
6,500.000
Parts Per Million
none
.028
.031
.036
.042
.050
.063
.083
.125
.250
.500
.625
.833
As NaCl**
3
1,000.000
2,000.000
4,000.000
As CaCO
1.250
2.500
5.000
10.000
20.000
40.000
79.635
156.250
312.500
625.000
1,250.000
2,500.000
5,000.000
none
.022
.025
.029
.033
.040
.050
.067
.100
.200
.400
.500
.667
1.000
2.000
4.000
8.000
16.000
32.000
63.492
125.000
250.000
500.000
Gr./Gal.
as
CaCO
none
.002
.002
.002
.002
.003
.004
.005
.007
.015
.029
.037
.049
.073
.146
.292
.585
1.170
2.340
4.641
9.137
18.273
36.550
73.099
146.199
292.398
3
*At 25 °C
**At 25 °C, given specific conductance values included in this table.
Table 5 —Table of High Accuracy Reference Solution for Calibration*
Reference
Solution
A
B
C
D
* Excluding the conductivity of the water used to prepare the solutions. These tabulated conductivity values are in international
units. When using measuring instruments calibrated in absolute units, multiply the tabular values by 0.999505
Approximation
Normality of
Solution
1
0.1
0.01
0.001
Method of Preparation
74.2480 g of KCI weighed in air per 1 L
of solution at 20 °C
7.4365 g of KCI weighed in air per 1 L
of solution at 20 °C
0.7440 g of KCI weighed in air per 1 L
of solution at 20 °C
Dilute 100 mL of solution C to 1 L at 20 °C
Temp., °C
0
18
25
0
18
25
0
18
25
0
18
25
Electrical
Conductivity,
µS/cm
65,176
97,838
111,342
7,138
11,167
12,856
773.6
1,220.5
1,408.6
77.69
127.54
148.93
26
Page 31

012–06485B Conductivity Sensor
Table 6 —Sample Illustrating the Application of Conductivity to Agriculture*
TDS (mg/l)
EC in Millimhos
500
1000
2000
3000
4000
5000
6000
per cm. at 25ûC
7000
8000
Beets
Spinach
Tomato
Broccoli
Cabbage
Potato
Corn
Sweetpotato
Lettuce
Bell pepper
The indicated salt tolerances
apply to the period of rapid plant
growth and maturation, from the
late seeding stage onward.
Crops in each category are
ranked in order of decreasing
salt tolerance. Width of the bar
next to each crop indicates the
effect of increasing salinity on
yield. Crosslines are placed at
10, 25, and 50% yield reductions.
Onion
Carrot
Beans
25%
*From:
10%
Environmental Chemistry: Air and Water Pollution (2nd ed.)
Foresman, and Company, Glenview, Illinois) p. 133, 1976.
50%
H. Stephen Stover and Spencer L. Seager (Scott,
Sources of Conductivity Data
1. International Critical Tables, Vol. VI, 230–258; McGraw Hill,
1929.
2. Handbook of Chemistry and Physics, 78th Edition; CRC Press,
1997.
3. Electrolyte Solutions, Robinson and Stokes: Butterworths, 1959.
27
Page 32

Conductivity Sensor 012–06485B
28
Page 33

012–06485B Conductivity Sensor
Technical Support
Feedback
If you have any comments about the product or manual,
please let us know. If you have any suggestions on
alternate experiments or find a problem in the manual,
please tell us. PASCO appreciates any customer feedback.
Your input helps us evaluate and improve our product.
To Reach PASCO
For technical support, call us at 1-800-772-8700 (tollfree within the U.S.) or (916) 786-3800.
fax: (916) 786-3292
e-mail: techsupp@pasco.com
web: www.pasco.com
Contacting Technical Support
Before you call the PASCO Technical Support staff, it
would be helpful to prepare the following information:
ä
If your problem is with the PASCO apparatus, note:
- Title and model number (usually listed on the
label);
- Approximate age of apparatus;
- A detailed description of the problem/sequence of
events (in case you can’t call PASCO right away,
you won’t lose valuable data);
- If possible, have the apparatus within reach when
calling to facilitate description of individual parts.
ä
If your problem relates to the instruction manual,
note:
- Part number and revision (listed by month and year
on the front cover);
- Have the manual at hand to discuss your
questions.
29
Page 34

 Loading...