

Page 1

®
Instruction Manual
012-09731B
Using
Ocean Optics Spectrometers
with the
PASCO Xplorer GLX
Introduction
This manual contains instructions for using an Ocean Optics spectrometer with the PASCO Xplorer GLX handheld datalogger. The combination of these two devices can be used to monitor and record a spectrum or to continuously record light intensity in a defined wavelength band. You can use the spectrometer to analyze light from
sources such as the sun or a fluorescent lamp, or you can use it with the Integrated Light Source and Cuvette
Holder to analyze light transmitted through a solution. In addition to light intensity, the GLX calculates absorbance, transmission and relative irradiance.
These instructions assume that you are familiar with the general operation of the Xplorer GLX. For complete
instructions on using the GLX, see the Xplorer GLX Users’ Guide (PASCO manual number 012-08950).
Compatible Spectrometer Models
The following spectrometers manufactured by Ocean Optics are compatible with the Xplorer GLX (license key
required):
• USB650 Red Tide
• USB2000
• USB4000
• HR4000
Important Note
An Ocean Optics spectrometer in some ways resembles other sensors used with the GLX; however, there are
some important differences:
• The GLX requires a special license to work with an Ocean Optics spectrometer. When you purchase a
license, you receive a USB flash drive that will install a license key on your GLX. A single flash drive may
contain more than one license key for licensing multiple GLXs.
• To collect data from a spectrometer, the GLX must be in standalone mode (not connected to a computer).
Once you have recorded data, you can analyze them on the GLX or transfer them to your computer.
• A spectrometer can not be used simultaneously with other sensors.
800-772-8700 www.pasco.com
Page 2
Ocean Optics with Xplorer GLX Setting Up the Spectrometer and GLX
Setting Up the Spectrometer and GLX
A. Update the GLX
Important note: If your GLX has firmware version lower than 1.3, upgrade the
firmware before
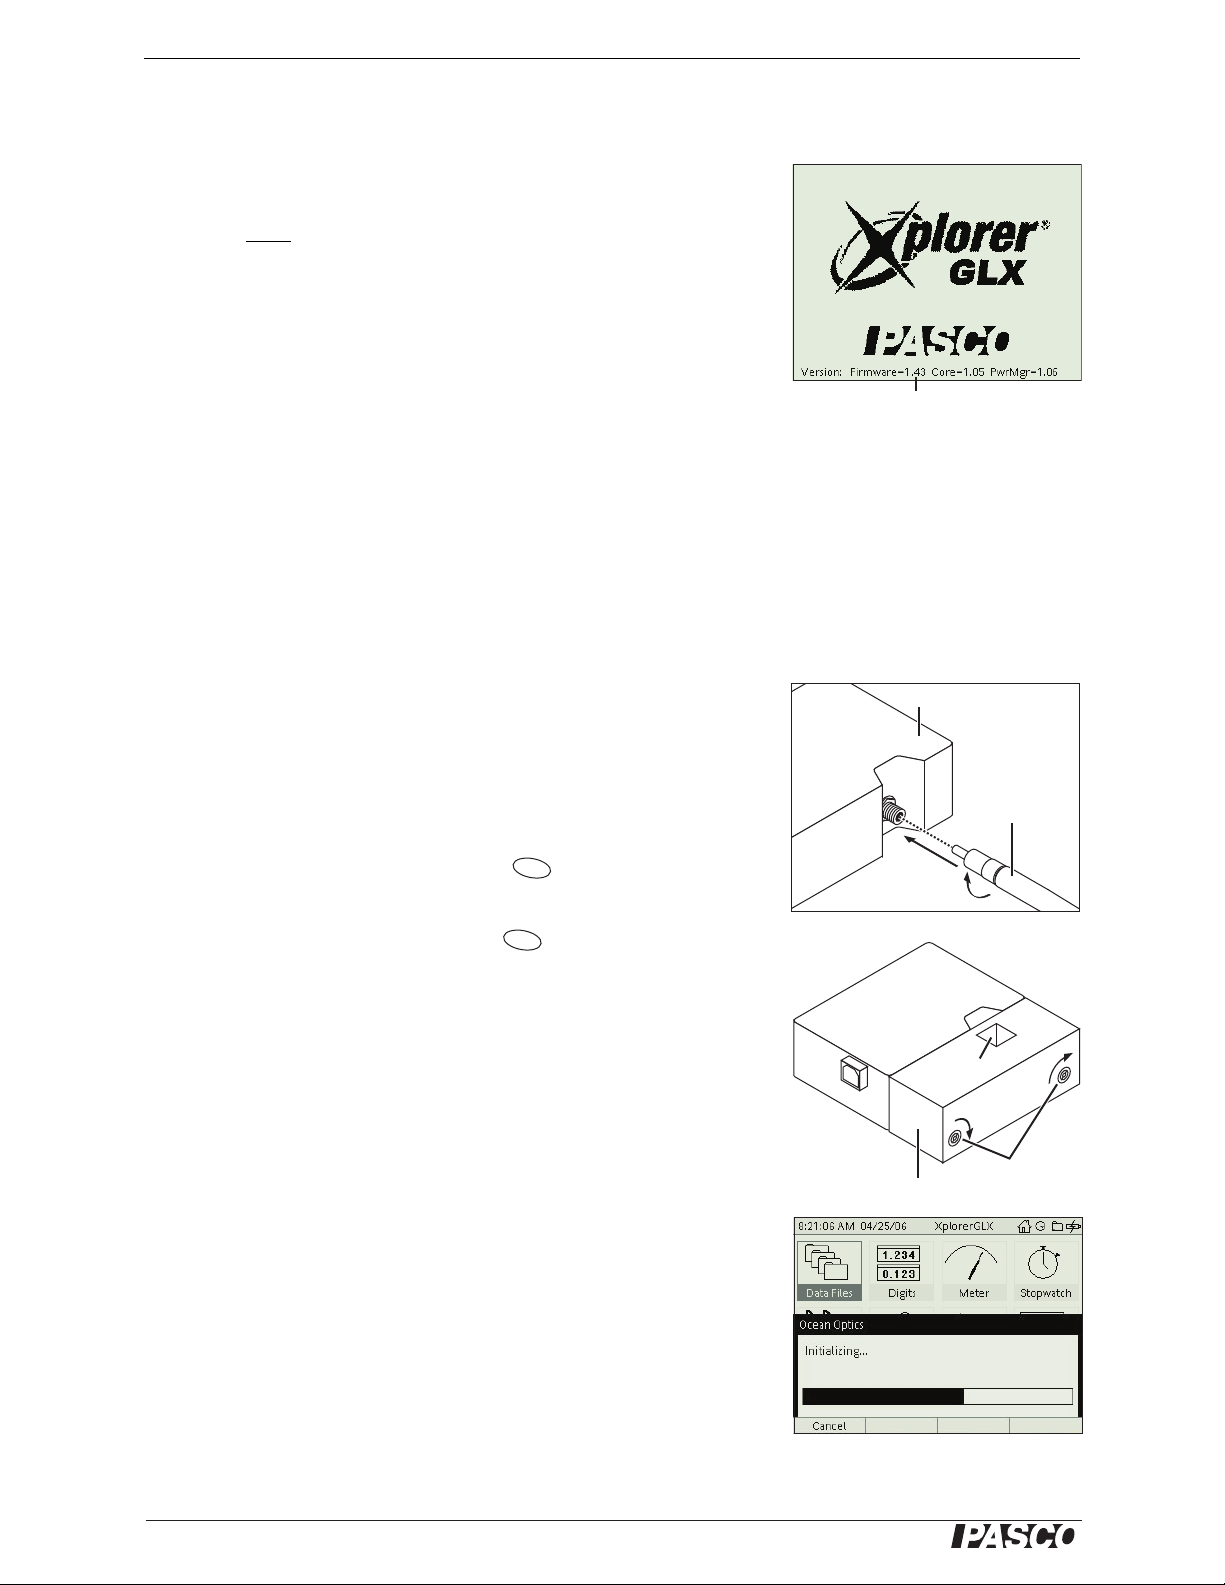
Check the firmware version number at the bottom of the splash screen
that appears briefly when you turn on your GLX. If it is lower than 1.4,
follow these steps:
1. Visit www.pasco.com/glx
2. Follow the instructions on that web page to download and install
the latest GLX firmware.
You can also update the GLX by connecting it to any computer that has
DataStudio version 1.8 (or later) installed on it.
B. Install the License Key
Important note: The license key is removed from the flash drive when it is copied
to the GLX. A single license key can not be moved from one GLX to another or
installed on more than one GLX. After the license key is installed, it will reside on
your GLX permanently.
1. If the GLX is connected to a computer, disconnect it.
you install the license key.
Firmware
version
Spectrometer
2. Plug the license key flash drive in the GLX's USB port.
3. On the GLX screen, you will see a message such as: “There is 1
license available for 'Ocean Optics Spectrometer'. Would you like
to add a license to this GLX?” Press for Yes.
F1
4. You will see a message such as: “Successfully added license for
Ocean Optics Spectrometer.” Press for OK.
F1
C. Connect Optional Hardware
• If you plan to use a fiber optic probe, insert one end of the probe
into the spectrometer's light input connector and turn the threaded
collar on the probe to secure it to the spectrometer.
• If you plan to use the Integrated Light Source and Cuvette Holder,
align it with the spectrometer, press the connectors together, and
tighten the captured screws.
D. Connect the Spectrometer to the GLX
1. Turn on the GLX.
2. Use the cable (included with the spectrometer) to connect the USB
port of the spectrometer to the USB port of the GLX.
Fiber
optic
probe
Spectrometer
Cuvette
Holder
Screws
Integrated Light Source
After a few seconds, you will see the Initializing screen, then the Spectrometer Analysis Configuration screen.
2
Initializing screen
(appears a few seconds after
connecting the spectrometer)
®
Page 3
Ocean Optics with Xplorer GLX Spectrometer Analysis Configuration Screen
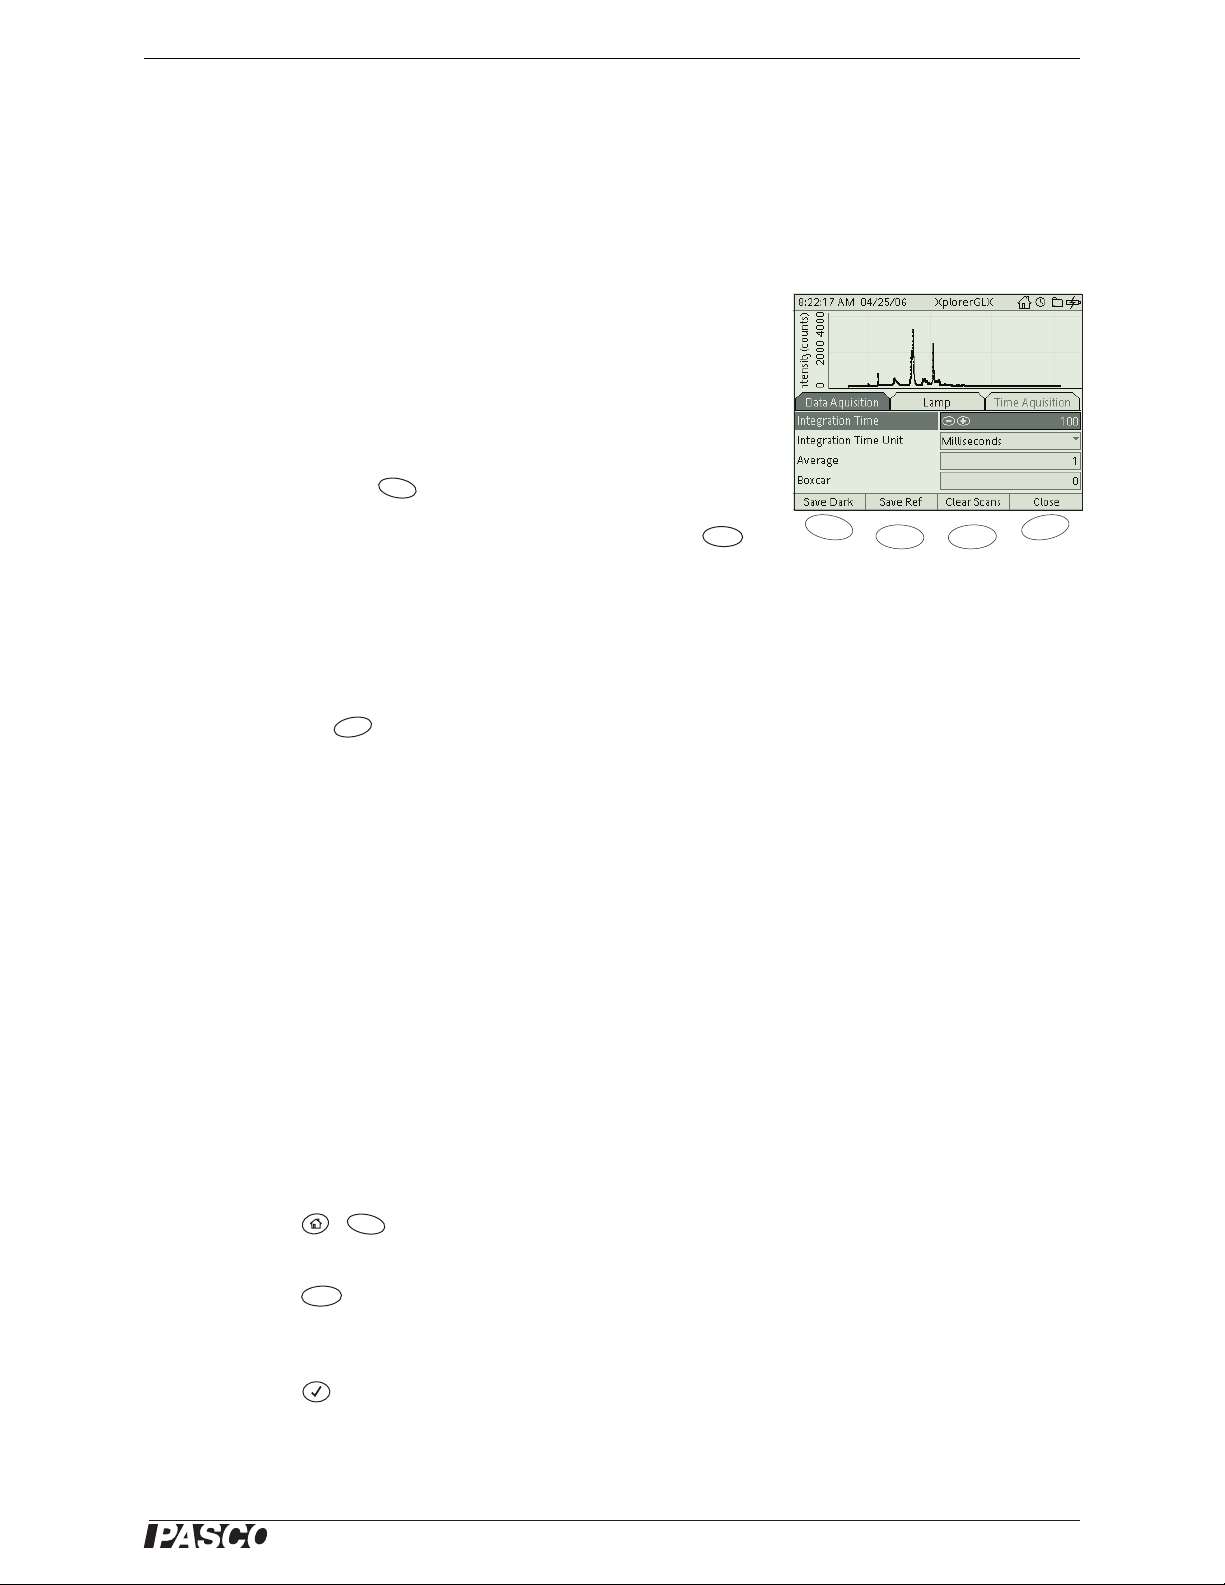
E. Configure the Spectrometer
In the Spectrometer Analysis Configuration screen, follow these general
steps. (For a detailed explanation of the parameters in the configuration
screen and how to change them, see pages 3–6.)
1. Set the parameters in the Data Acquisition tab as desired.
2. (This step is not always necessary.) Go to the Lamp tab and change
the parameters there if necessary.
3. (Do this step if you plan to use Time Acquisition or Beer’s Law
mode or the Minus Dark, Absorbance, Transmittance, or Relative
Irradiance measurements.)
a. Turn off the light source or block light from entering the spec-
trometer. Press to save the dark scan.
F1
b. Allow “reference light” to enter the spectrometer. Press
to save a reference scan.
1
F2
4. (Do this step only if you plan to use Time Acquisition or Beer’s Law
F1
Spectrometer Analysis
Configuration screen
(appears after the Initializing screen)
mode.) Go to the Time Acquisition tab. Set the scan mode and other
parameters as desired. (See page 6 for more information.)
5. After you have finished setting spectrometer parameters and
options, press to close the configuration screen.
See page 6 for instructions on recording and viewing data.
F4
1
What you use as the “reference light”
depends on what you plan to measure.
See see “F2 Save Ref” on page 4 for
details.
Spectrometer Analysis Configuration Screen
The Spectrometer Analysis Configuration screen is where you set the
parameters that control how the spectrometer and GLX collect and process data.
To Open the Configuration Screen
• If the spectrometer is not yet connected:
Connect the spectrometer to the GLX's USB port and wait for the
configuration screen to open automatically.
F3F2
F4
• If the spectrometer is already connected:
1. Press + to open the Graph screen (if it is not already
F1
open).
2. Press to open the To ol s menu.
F3
3. Use the arrow keys to highlight Spectrum Analysis Config.
4. Press .
®
3
Page 4
Ocean Optics with Xplorer GLX Spectrometer Analysis Configuration Screen
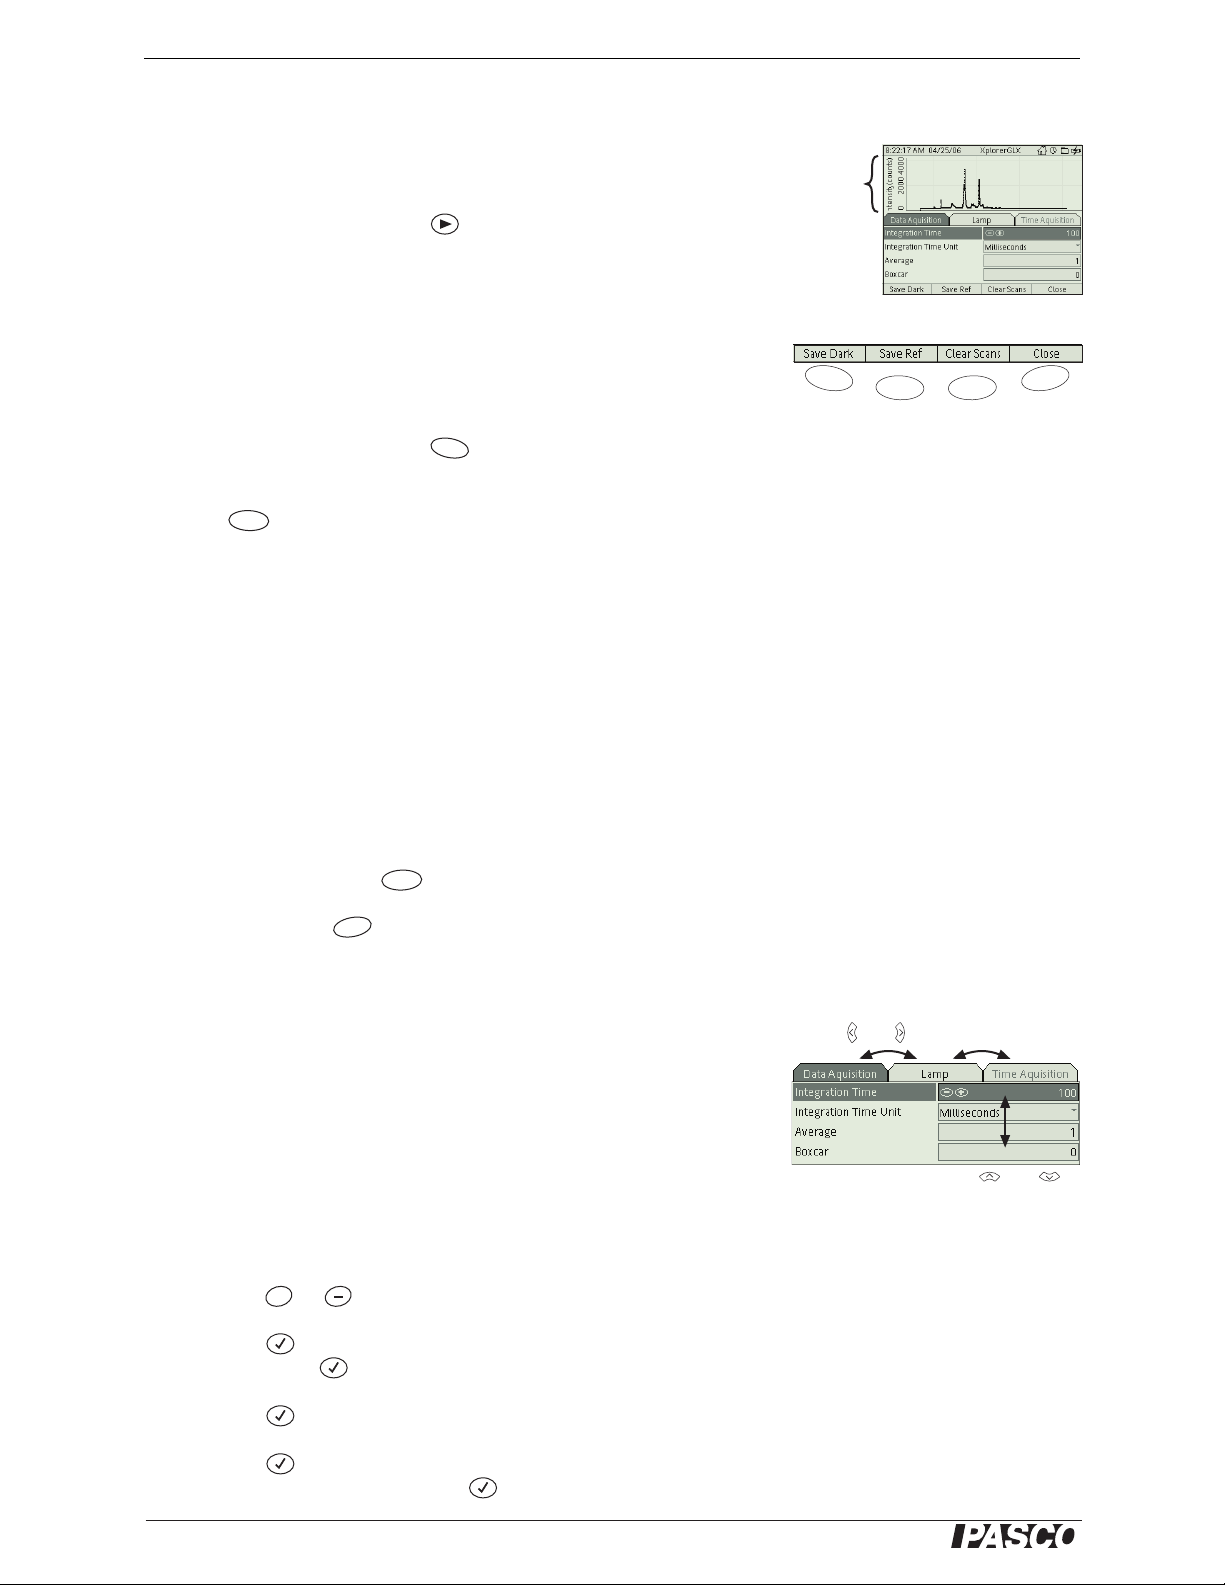
Spectrum Preview
When the configuration screen opens, the GLX automatically starts
monitoring and displaying spectrum data in the upper half of the screen.
With this preview, you can immediately see the effect of changes that
you make to parameters. Press to manually stop or re-start spectrum monitoring.
Function Keys
Use the function keys to save and clear dark and reference scans and to
close the configuration screen.
F1 Save Dark With the light source off or blocked (so that no light
enters the spectrometer), press to save the dark scan.
F2 Save Ref With “reference light” entering the spectrometer,
press to save the reference scan. Do this after setting the parame-
F2
ters in the Data Acquisition tab (see “Data Acquisition Tab” below).
Your “reference light” may be one of the follow (depending on what
type of measurement you plan to make):
• The Integrated Light Source with a reference cuvette
measuring absorbance and transmission of light through a solution).
F1
2
in place (for
Spectrum
preview
F1
Function keys
2
A reference cuvette represents 100%
transmission.
F3F2
F4
• A lamp with a known color temperature (for measuring the relative
irradiance of light sources).
• Any light source (if you plan to use only the Intensity and Minus
Dark measurements).
F3 Clear Scan Press to delete the dark and reference scans.
F4 Close Press to close the configuration screen.
F3
F4
Navigating in the Configuration Screen
The configuration parameters and options are contained in three tabs:
Data Acquisition, Lamp, and Time Acquisition.
To navigate between the tabs, press the left and right arrow keys. (Note
that the Time Acquisition tab will not be available until you have saved
dark and reference scans.)
Navigate within a tab by pressing the up and down arrow keys to highlight different parameter and options. To change the highlighted parameter or option, do one of the following:
• Press or to change the value of the parameter by 1.
+
Press and to move between tabs.
Press and to
move within a tab.
• Press to make the parameter editable. Type the desired
value. Press again.
• Press to toggle a two-choice option.
or
• Press to open a pop-up menu. Use the arrow keys to highlight
the desired menu option. Press again.
4
®
Page 5

Ocean Optics with Xplorer GLX Spectrometer Analysis Configuration Screen
Data Acquisition Tab
Integration Time Integration time is analogous to the shutter speed
of a camera. The higher the integration time, the longer the detector
monitors incoming light. Adjust the integration time so that the greatest
amount of light that you anticipate for your application causes a signal
of about 85% of the spectrometer's capability (3500 counts out of 4096
counts maximum, for example).
Integration Time Units Use this option to specify whether the integration time above is expressed in milliseconds or microseconds.
Average This parameter specifies the number of discrete spectral
acquisitions that the GLX collects and averages before displaying or
recording a spectrum. The higher the value, the better the
signal-to-noise ratio (S:N). The S:N will improve by the square root of
the number of scans averaged.
Boxcar This parameter sets the boxcar smoothing width. Boxcar
smoothing averages groups of adjacent pixels. For example, if the value
is 5, the GLX averages each pixel with 5 pixels to its left and 5 pixels to
its right (a total of 11 pixels). The greater this value, the smoother the
data and the higher the S:N. If the value is too high, a loss in spectral
resolution will result. The S:N will improve by the square root of the
number of pixels averaged.
Data Acquisition tab
Lamp Tab
Lamp Enable If you have the Integrated Light Source connected to
your spectrometer, use this option to turn it on and off. It is on by
default.
Elec. Dark Correction This option enables or disables the correction of the spectral data for the electrical dark signal. The effect is to
shift the entire spectrum vertically so it reads close to zero counts in the
absence of light.
Color Temperature (K) If you know the color temperature of the
lamp that you are using for the reference scan, enter it here in units of
kelvins. The GLX uses this value to calculate relative irradiance. (If you
do not plan to use the relative irradiance measurement, the value of this
parameter does not matter.)
Time Acquisition Tab
Note: To enter this tab, you must have saved dark and reference scans.
Scan Mode There are three choices: Scope (or “Spectral Scope”),
Time Acquisition, and Beer’s Law. See “Collecting Data” below for
descriptions of these modes. The other three parameters in this tab affect
Time Acquisition and Beer’s Law modes only.
Lamp tab
Time Acquisition tab
Wavelength This parameter specifies the wavelength (in nm) to be
monitored.
Bandwidth Use this parameter to set the wavelength range to be
monitored. The value of Bandwidth is equal to the number of pixels on
®
5
Page 6

Ocean Optics with Xplorer GLX Collecting Data
either side of the pixel specified by the Wavelength parameter. There-
fore, the total number of pixels equals Bandwidth ×2+1.
Sample Rate This parameter specifies the rate (in Hz or samples per
second) at which the GLX will record data.
Collecting Data
View and record data using Spectral Scope mode, Time Acquisition
mode, or Beer’s Law mode as described below.
Spectral Scope Mode
Collect data in Spectral Scope mode when you want to monitor or
record the whole spectrum. Each recorded spectrum represents light collected over a period of time determined by the Integration Time and
Aver age parameters (see pages 5 and 5).
Note: Spectral Scope scan mode is not the same as the regular GLX scope mode
used with other sensors.
Spectral Scope is the default mode. If you have switched to a different
mode, go to the Time Acquisition tab of the configuration screen (see
above) to switch back.
To monitor and record data in Spectral Scope mode:
1. If the configuration screen is open, press to close it.
F4
2. While viewing the Graph display, press to begin monitoring
data. A periodically updated spectrum appears on the display, and
the clock icon ( ) appears in the upper right corner of the screen.
Note: While viewing spectral data, you can use normal GLX Graph screen functions, such as Auto Scale ( ) and Scale/Move ( ). See the GLX Users'
Guide for more information.
F1
F2
3. To record the spectrum, press again. The graph freezes on the
most recently collected spectrum, and this spectrum is saved as a
data run (named “Run #1”, “Run #2”, etc.)
4. Press again to start monitoring again.
5. Repeat steps 3 and 4 to record additional spectra.
Time Acquisition Mode
Spectral Scope mode
Use Time Acquisition mode to collect data from a single channel (either
a single pixel or a block of adjacent pixels). The location and width of
the block is determined by the Wavelength and Bandwidth parameters.
The rate of data collection is determined by the Sample Rate parameter.
Go to the Time Acquisition tab of the configuration screen (see page 5)
to put the GLX into Time Acquisition mode and to set the parameters;
then follow these steps:
1. If the configuration screen is open, press to close it.
F4
6
Time Acquisition mode
®
Page 7

Ocean Optics with Xplorer GLX Measurements
2. Press to begin recording data.
3. Press again to stop recording. The data run is saved with a
name such as “Run #1 - 500.0 nm” to indicate the value of the
Wavelength parameter.
Note: See the GLX Users' Guide for general information about collecting, displaying and analyzing data on the GLX and uploading data to a computer.
Beer's Law Mode
Use Beer's Law mode to make a graph of Absorbance versus Concentration. To use this mode, you will need an integrated light source and
cuvette holder, cuvettes, and several different known concentrations of a
solution. Beer's Law mode is similar to Time Acquisition mode in that
data is collected from a single channel defined by the Wavelength and
Bandwidth parameters. Follow the procedure on page 9 to use Beer’s
Law mode.
Beer’s Law mode
Measurements
In addition to the simple Intensity measurement, the GLX records measurements derived from Intensity, the dark scan, and the reference scan.
(If you have not saved dark and reference scans, the GLX will not
record derived measurements.)
To select a measurement for display in the Graph screen:
1. Press to “light up” the Graph's active fields, with the “Y-axis”
measurement highlighted.
2. Press again to open the menu.
3. Use the arrow keys to highlight the desired measurement and
press to select it.
The measurements are described below.
Intensity
This is the straight measurement made by the spectrometer in units of
digital counts.
Minus Dark
Graph screen menu containing
measurements
The GLX calculates Minus Dark by subtracting the dark scan from the
Intensity measurement.
®
7
Page 8

Ocean Optics with Xplorer GLX Measurements
Absorbance
The GLX uses this equation to evaluate each pixel on the detector and
produce the absorbance spectrum:
S
–
λDλ
A
=
λ
Where:
S
= Sample intensity at wavelength λ
λ
D
= Dark intensity at wavelength λ
λ
R
= Reference intensity at wavelength λ (acquired with a blank
λ
cuvette in place)
-------------------
log10–
–
R
λDλ
Absorbance is not a valid quantity if either or is
S
–()RλDλ–()
λDλ
less than zero. This condition may occur if the test solution or the reference solution is very dark.
Transmission
The GLX calculates the transmission of a solution using this equation:
SλDλ–
λ
------------------–
R
λDλ
100%×=
%T
Rel. Irradiance
Relative irradiance is a comparison of the fraction of energy a sample
emits and the energy the spectrometer collects from a lamp with a blackbody energy distribution (normalized to 1 at the energy maximum).
To measure the relative irradiance of a sample, you must save the reference scan using a lamp of known color temperature and enter the color
temperature under the Lamp tab of the configuration screen.
The GLX calculates relative irradiance with this equation:
8
I
λ
λ
–
R
λDλ
SλDλ–
-------------------
B
=
Where:
B
= Relative energy of the reference (calculated from the color
λ
temperature) at wavelength λ
S
= Sample intensity at wavelength λ
λ
D
= Dark intensity at wavelength λ
λ
R
= Reference intensity at wavelength λ
λ
®
Page 9

Ocean Optics with Xplorer GLX Appendix: Beer's Law Procedure
Appendix: Beer's Law Procedure
Follow these steps to obtain an absorbance versus concentration graph
for aqueous solutions of copper(II) sulfate (CuSO
Equipment
You will need the following items:
Xplorer GLX (with Ocean Optics license key installed)
Ocean Optics Spectrometer
Integrated Light Source and Cuvette Holder
Cuvettes (included with above item)
).
4
Various aqueous solutions of CuSO
of known concentrations
4
ranging between 0 and 0.5 M. About 3 mL of each sample
needed.
Set-up
1. Turn on the GLX.
2. Connect the spectrometer to the GLX.
Result: The Initializing screen appears, followed by the
Configuration screen.
3. Attach the Integrated Light Source and Cuvette Holder to the spec-
trometer.
4. Fill a cuvette with your weakest solution sample (this would typi-
cally be just water).
5. Place the cuvette in the cuvette holder oriented (as illustrated) so
that light travels through the cuvette by the shorter path.
6. In the Data Acquisition tab of the Configuration screen, set
Integration Time to 25 ms.
Cuvette
7. Check the spectrum preview in the upper part of the screen; it
should not be clipped, especially in the region of 800 nm. If it is,
reduce the integration time.
8. Press to switch to the Lamp tab of the Configuration screen.
9. With the cuvette in place, and the lamp on (you should see light in
the cuvette), press (Save Ref).
F2
10. Press to switch the lamp off.
11. Press (Save Dark).
F1
12. Press to switch the lamp back on.
®
9
Page 10

Ocean Optics with Xplorer GLX Appendix: Beer's Law Procedure
13. Press to switch to the Time Acquisition tab.
14. Set Scan Mode to Beer's Law.
15. Set Wavelength to 800 nm.
16. Set Bandwidth to 15 pixels.
17. Press (Close).
F4
Result: The Graph screen opens with Absorbance on the vertical
axis and Concentration on the horizontal axis.
Procedure
1. Press . A flashing icon ( ) appears in the upper right-hand cor-
ner of the screen.
2. Press . The GLX records a single absorbance value and prompts
you to enter a concentration.
3. Type the concentration (in mol/L).
4. Replace the cuvette with one containing the next-higher concentra-
tion sample.
5. Repeat steps 2 and 3 for all of your samples.
6. Press to end the data run.
Analysis
Beer’s Law Set-up
Beer’s Law Data
The graph shows a linear relationship between absorbance and concentration in accordance to Beer's Law.
10
®
Page 11

Ocean Optics with Xplorer GLX Technical Support
Technical Support
For assistance with any PASCO product, contact PASCO at:
Address: PASCO scientific
10101 Foothills Blvd.
Roseville, CA 95747-7100
Phone: 916-786-3800 (worldwide)
800-772-8700 (U.S.)
Fax: (916) 786-7565
Web: www.pasco.com
Email: support@pasco.com
Limited Warranty
For a description of the product warranty, see the PASCO catalog.
Copyright
The PASCO scientific 012- 09731B
righted with all rights reserved. Permission is granted to non-profit educational institutions for reproduction of any part of this manual,
providing the reproductions are used only in their laboratories and classrooms, and are not sold for profit. Reproduction under any
other circumstances, without the written consent of PASCO scientific, is prohibited.
Using Ocean Optics Spectrometers with the PASCO Xplorer GLX Instruction Manual
is copy-
Trademarks
PASCO, PASCO scientific, DataStudio, Xplorer, and Xplorer GLX are trademarks or registered trademarks of PASCO scientific, in the
United States and/or in other countries. All other brands, products, or service names are or may be trademarks or service marks of,
and are used to identify, products or services of, their respective owners. For more information visit www.pasco.com/legal.
®
11
 Loading...