

Page 1
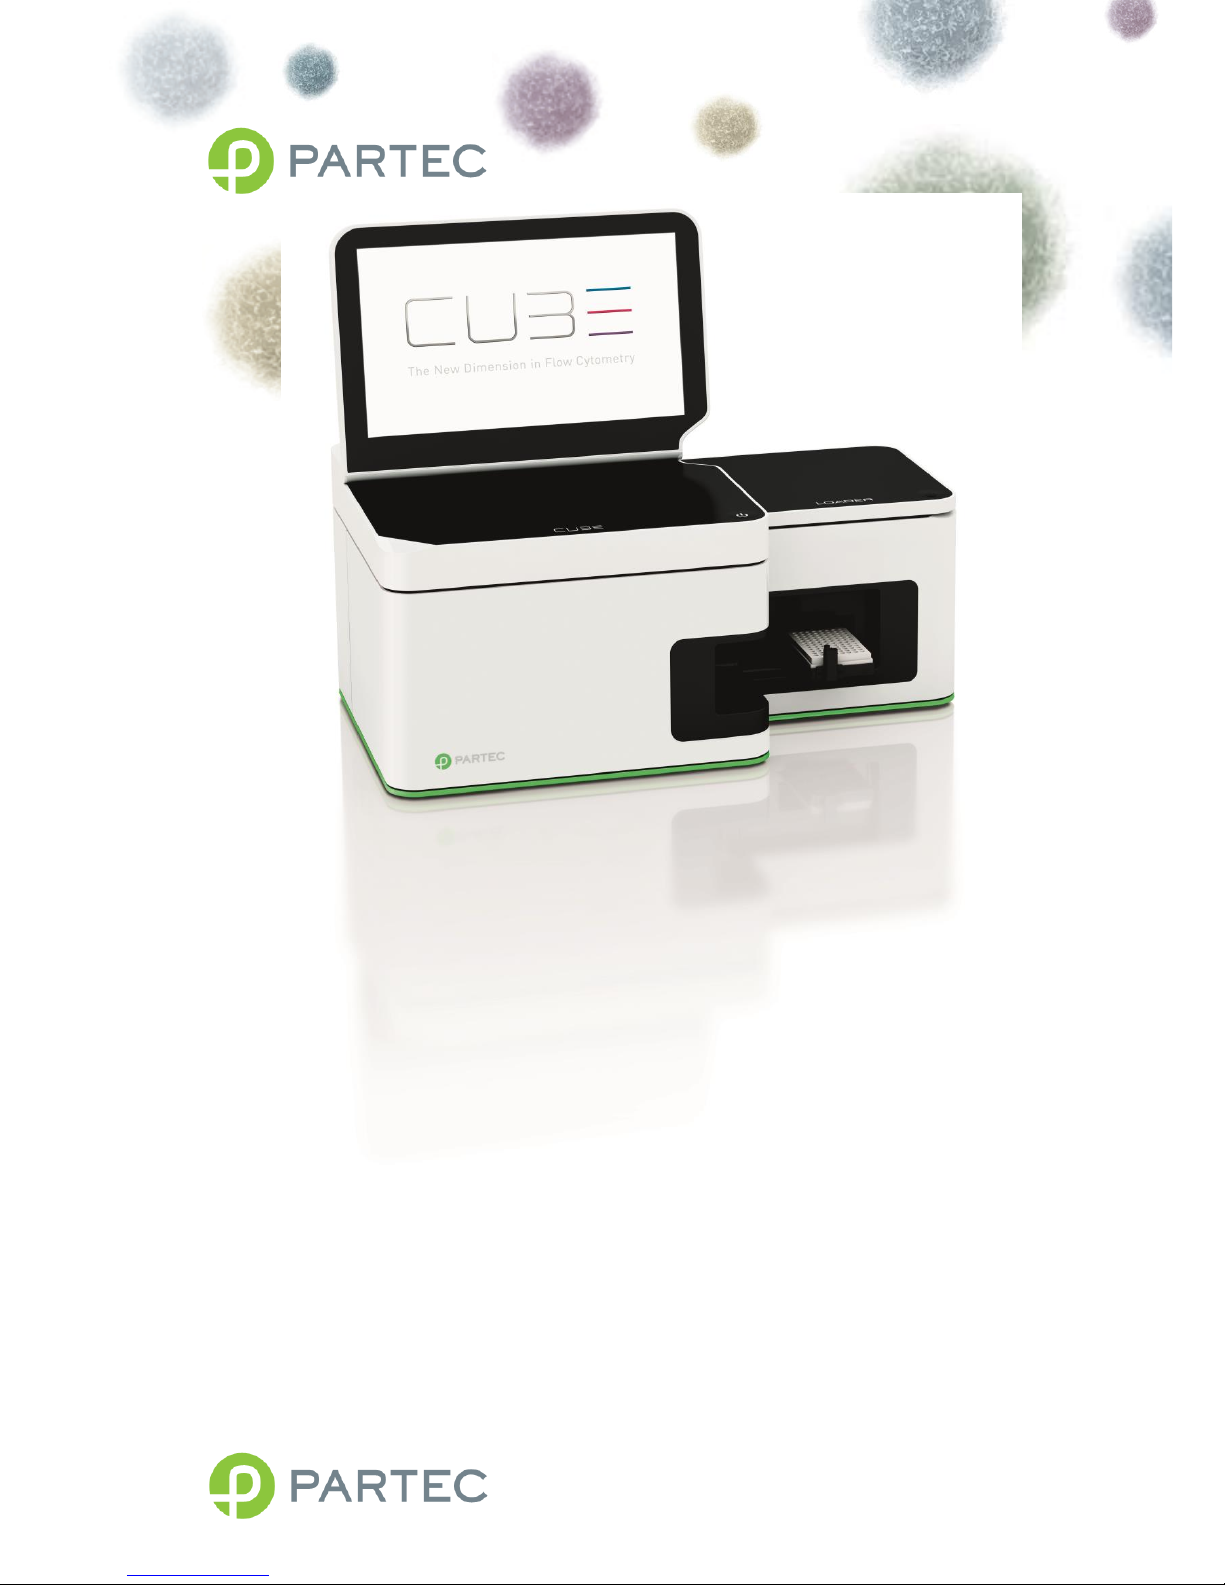
CyFlow®Cube 6
Instrument Operating Manual
CyFlow®Cube 6
Page 2
CyFlow® Cube 8 - Instrument Operating Manual
Rev-05_2014-01-31
2/40
For in vitro diagnostic use with Partec recommended IVD reagents.
The PartecCyFlow®Cube Flow Cytometer complies with the European IVD Directive 98/79/EC and is therefore CE marked.
IVD
Contact Information:
Partec GmbH • Otto-Hahn-Straß3 32 • D-48161 Münster • Germany
Tel +49 2534 8008 0 • Fax +49 2534 8008 90
E-mail: [email protected]
© 2012Partec GmbH
Page 3

CyFlow® Cube Instrument Operating Manual
Rev-05_2014-01-31
3/40
Table of content
FOREWORD ................................................................................................................... 5
PRESENTATION ............................................................................................................. 6
BASICS ........................................................................................................................................................................................... 6
What is the Partec CyFlow® Cube? ....................................................................................................................................... 6
What are the applications for which the CyFlow® Cube can be used? ................................................................. 6
What are topics covered by this manual? ......................................................................................................................... 6
What other manuals are available? ..................................................................................................................................... 6
What should I know before operating the CyFlow® Cube? ....................................................................................... 6
IN FLOW CYTOMETRY, WHAT IS... .............................................................................................................................................. 7
… a parameter? .............................................................................................................................................................................. 7
… a one-parameter histogram? ............................................................................................................................................. 7
… a histogram channel? ............................................................................................................................................................. 7
… the count in a histogram? .................................................................................................................................................... 7
… a peak? .......................................................................................................................................................................................... 7
… background in a histogram? ............................................................................................................................................... 7
Example of a histogram ............................................................................................................................................................. 8
Example of a dotplot ................................................................................................................................................................... 8
Histogram and dotplot in immunology .............................................................................................................................. 9
INSTRUMENT STARTING PROCEDURE ..................................................................................................................................... 10
Sheath fluid level control and/or refill ............................................................................................................................. 10
MAIN CYVIEW
™
LOGIN WINDOW ............................................................................................................................................. 11
USER LEVELS............................................................................................................................................................................... 12
CYVIEW™ MAIN PAGE – AFTER SUCCESSFUL LOG-IN .......................................................................................................... 13
CYVIEW™ CONTROLS ................................................................................................................................................................ 13
1D/2D PLOTS– display options ............................................................................................................................................ 14
RESULTS ......................................................................................................................................................................................... 15
REGIONS ......................................................................................................................................................................................... 16
GENERAL - properties of the instrument ......................................................................................................................... 16
ACQUISITION – instrument control ................................................................................................................................... 17
MEASURE – definition of measure modes ....................................................................................................................... 17
Measure modes ............................................................................................................................................................................ 18
Analyze all (default selection) .............................................................................................................................................. 18
Volumetric Counting with Volume ..................................................................................................................................... 18
Volumetric Counting with Electrodes ............................................................................................................................... 19
Cells in Region .............................................................................................................................................................................. 19
CYVIEW® INSTRUMENT/MEASUREMENT SETTINGS ......................................................................................................... 20
PRIME/WORK/CLEAN ............................................................................................................................................................. 20
Priming / Initialization process ........................................................................................................................................... 20
Work process ................................................................................................................................................................................ 22
Shut down process ...................................................................................................................................................................... 22
INTERMEDIATE CLEANING PROCESS ....................................................................................................................................... 23
SHEATH AND WASTE BOTTLE.................................................................................................................................................. 23
MEASUREMENT PARAMETERS ................................................................................................................................................. 24
Page 4

CyFlow® Cube 8 - Instrument Operating Manual
Rev-05_2014-01-31
4/40
Trigger properties (P) .............................................................................................................................................................. 24
Threshold settings (T) .............................................................................................................................................................. 24
Flow speed (S) .............................................................................................................................................................................. 24
Light source (L) ........................................................................................................................................................................... 24
1D/2D PLOT PROPERTIES ....................................................................................................................................................... 25
Plot name ........................................................................................................................................................................................ 25
X Log On/Y Log On ..................................................................................................................................................................... 25
Erosion levels ................................................................................................................................................................................ 25
X/Y Channel ................................................................................................................................................................................... 25
BitRange ......................................................................................................................................................................................... 25
CR-Mode .......................................................................................................................................................................................... 25
REGION/ROI PROPERTIES ....................................................................................................................................................... 26
Create a polygonal region ...................................................................................................................................................... 26
Region properties ....................................................................................................................................................................... 26
Region name ................................................................................................................................................................................. 26
Home Plot name .......................................................................................................................................................................... 26
Color RGB........................................................................................................................................................................................ 26
Max count ....................................................................................................................................................................................... 26
Sorter region ................................................................................................................................................................................. 26
Moving of regions within a histogram .............................................................................................................................. 26
Create a vertical or horizontal histogram splitter ...................................................................................................... 27
Create a quadrant assembly .................................................................................................................................................. 27
Change layout for regions....................................................................................................................................................... 27
Applying regions to other plots Gating Function ................................................................................................... 27
COMPENSATION ......................................................................................................................................................................... 28
TYPICAL SAMPLE ANALYSIS ..................................................................................................................................................... 29
KEYBOARD/MOUSE COMBINATIONS ....................................................................... 31
APPENDIX .................................................................................................................... 32
BIOHAZARDS ............................................................................................................................................................................... 32
MAINTENANCE ........................................................................................................................................................................... 33
Service .............................................................................................................................................................................................. 33
Transport and Storage ............................................................................................................................................................. 34
Disposal ........................................................................................................................................................................................... 34
LASER SAFETY ............................................................................................................................................................................ 35
TECHNICAL SPECIFICATIONS ................................................................................................................................................... 36
Optical Standard Setup ........................................................................................................................................................ 36
NOTES .......................................................................................................................... 39
Page 5

CyFlow® Cube Instrument Operating Manual
Rev-05_2014-01-31
5/40
Foreword
The CyFlow® Cube Instrument Operating Manual is aimed for a large spectrum of users, from beginner up
to the most skilled flower. The beginner or casual user will find the key functions and concepts to use the
Cube and its software. The confirmed flower will find an in-depth detail of the inner working and parameters
of the Cube to customize its use and obtain optimal performances.
CyView™ for Cube 6 is the instrument operation software for the CyFlow® Cube 6 (CY-S-3060). Partec is
continuously working on CyView™ to better fulfill your demands. If you have questions concerning this
manual or the software, find problems associated with CyView™ or you have a good suggestion to be
included in a new version, please let us know by sending an email or a note to Partec GmbH.
The present manual is valid as of CyView™ software version 1.5.
For more details about the reagent kits, suitable for use with the CyFlow® Cube, please refer to the
respective product data sheets. There are also several Application Notes available.
If you have questions, please contact your local distributor, one of the Partec subsidiaries, or Partec in
Germany ([email protected]).
Further details and addresses can be found on our website at:
www.partec.com/distributors
Please do not forget to add in your request the following information:
Serial number (serial No.) of the CyFlow®Cube
Your complete contact address
This manual contains references to names and products from Partec and other companies which
are registered trademarks or protected by copyright.
Partec GmbH, CyFlow® Cube6, CyView™ for Cube6, Robby®.
Microsoft® Corp.: Windows, Word, Excel, PowerPoint, Paint.
Hewlett Packard®: Deskjet Laserjet.
Page 6

CyFlow® Cube 8 - Instrument Operating Manual
Rev-05_2014-01-31
6/40
Presentation
Basics
What is the Partec CyFlow® Cube?
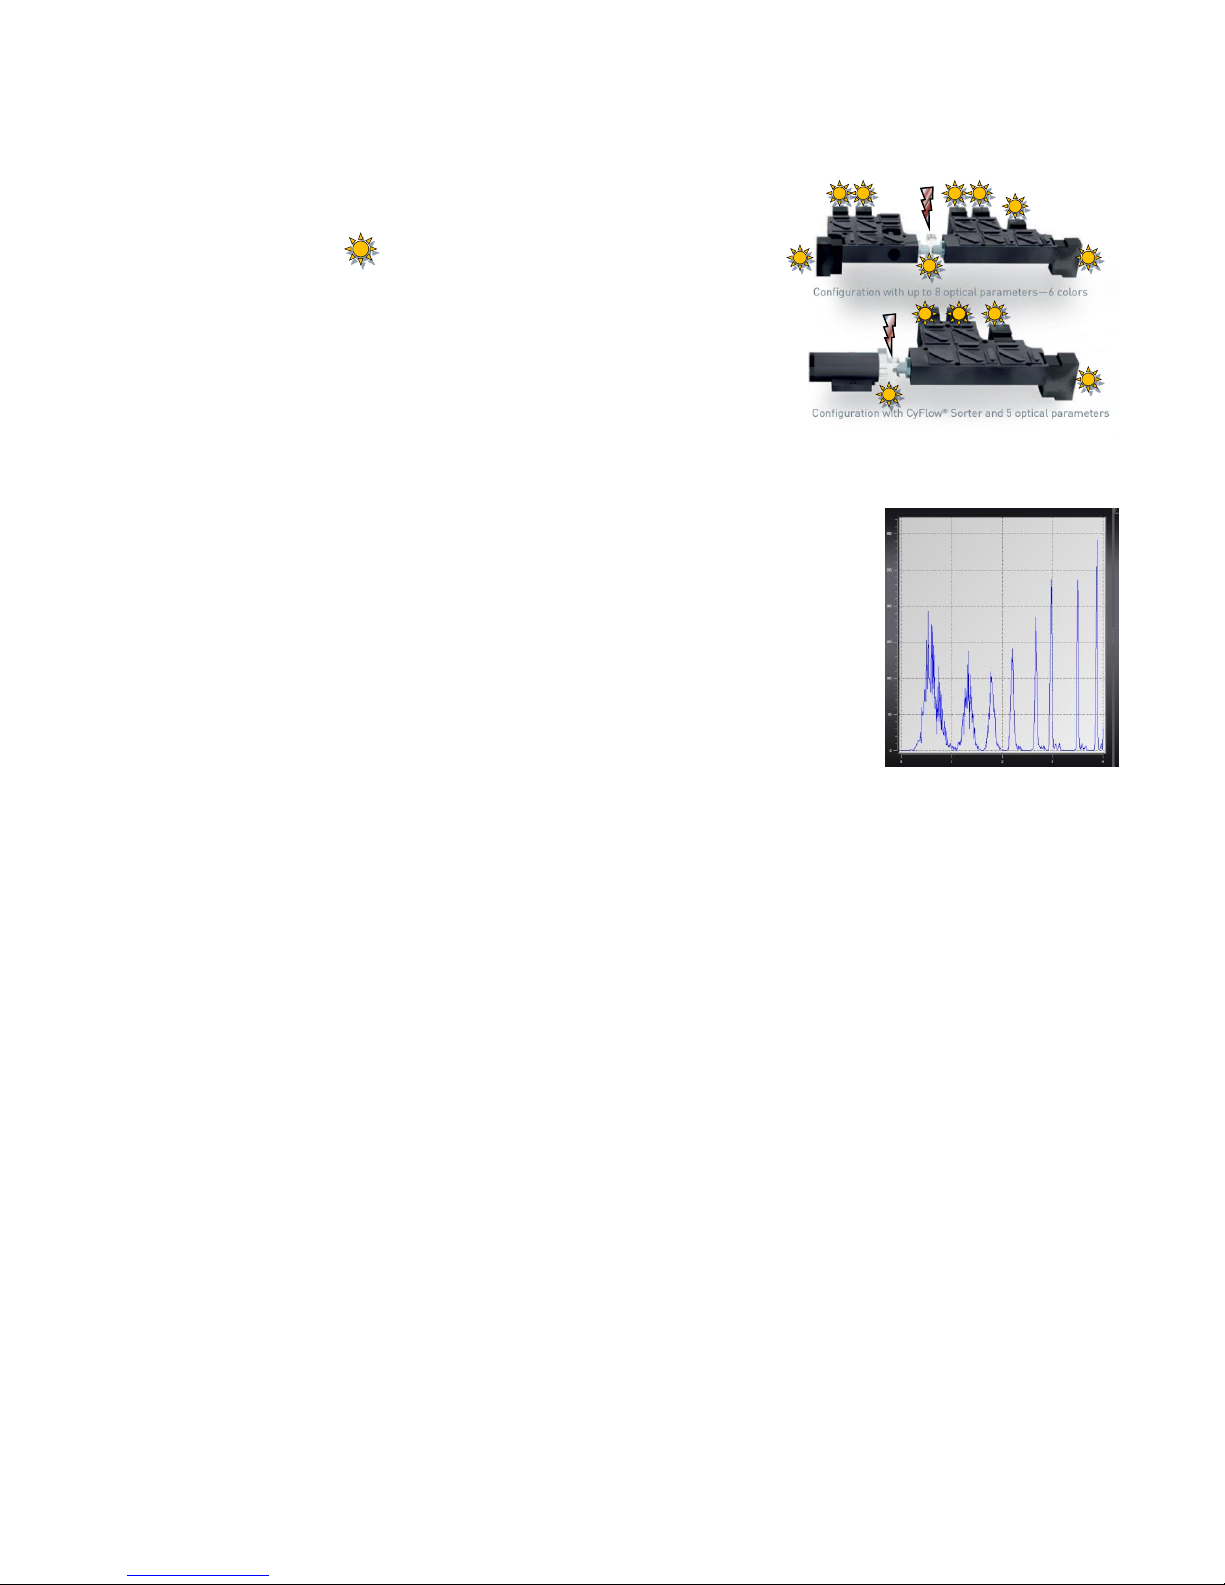
The PartecCyFlow® Cube is a fully equipped desktop Flow Cytometer (FCM). CyFlow® Cube features a
modular optical concept. This allows using different lasers as light sources and the detection of up to 8
(CyFlow® Cube 8) or of up to 6 (CyFlow® Cube 6) optical channels (parameters). The CyFlow® Cube allows
easy optimization of the optics for any application by simple exchange of optical filters and mirrors. The
CyFlow® Cube runs with an internal PC. Data acquisition, instrument control, and data analysis are
controlled and performed by the CyView™ software.
What are the applications for which the CyFlow® Cube can be used?
Together with the software, the CyFlow® Cube offers automation for routine use and flexibility for research
use for practically any flow cytometric application. The applications cover:
Routine multi-color-immuno-phenotyping
Blood Cell Analysis/HIV monitoring (e.g. CD4 cell count)
Leukocyte Counting/Rare Event Analysis
Microorganism Analysis
Fermentation Control
Particle Concentration Analysis
True Volumetric Absolute Counting
Particle Size and Fluorescence Distribution Analysis
What are topics covered by this manual?
The CyFlow® Cube Instrument Operating Manual covers the basic operation and maintenance of the
CyFlow® Cube instrument. This manual also covers details related to the software.
What other manuals are available?
Application Notes and Service Manuals are available to get started. They contain hints to achieve the
best results.
What should I know before operating the CyFlow® Cube?
This manual assumes that you have basic knowledge on flow cytometry. In the best case a well
experienced "flower" is around - so let her/him help you. Basic books are available about flow cytometry
which may help you as well (e.g. Howard M. Shapiro, Practical Flow Cytometry. Wiley 2002).
Page 7
CyFlow® Cube Instrument Operating Manual
Rev-05_2014-01-31
7/40
In flow cytometry, what is...
… a parameter?
In flow cytometry, parameter denotes a measured property of the
particles. Frequently, a parameter is synonymous to an optical channel.
E.g. an instrument with 6 parameters is equipped with 6 optical
detectors.
… a one-parameter histogram?
A one- parameter histogram displays the distribution of cells among a specific
property, e.g. how many cells contain a given quantity of DNA or bind a given
number of antibody molecules.
… a histogram channel?
The measured signal intensity is assigned to one of 65536 (16bit) quantity classes or channels. In a oneparameter histogram the channels are represented on the x-axis.
… the count in a histogram?
The number of cells being assigned to a given channel is referred to as channel content or simply count. In
a one-parameter histogram, the count is shown on the y-axis.
… a peak?
All cells having about equal characteristics among the analysed cell property (e.g. content of a specific
constituent like DNA) form a peak. In the case of a typical DNA histogram one peak represents the G1 and
another peak (with twice the channel value) represents the G2/M phase of the cell cycle.
In case of immunolabelled cells often one peak for unlabelled (negative) and one peak for labelled
(positive) cells can be detected. Peaks can be analysed by identifying them with region markers.
… background in a histogram?
Histograms sometimes show undesired signals in the lower channels, frequently called ´noise´ or
´background´. These signals may originate from cell fragments or other particles resulting from sample
preparation. In case of high signal amplification, background can also be caused by particle contaminated
sheath fluid.
The lower level (L-L) or threshold?
The lower level (L-L) threshold is a mean to suppress background signals. Signals below the lower level are
rejected from the signal acquisition. To exclude noise from a histogram already acquired, a region-gate can
be used.
Page 8
CyFlow® Cube 8 - Instrument Operating Manual
Rev-05_2014-01-31
8/40
Number of events
Threshold
of lower
Linear representation of SSC
Log representation
for fluorescence
Example of a histogram
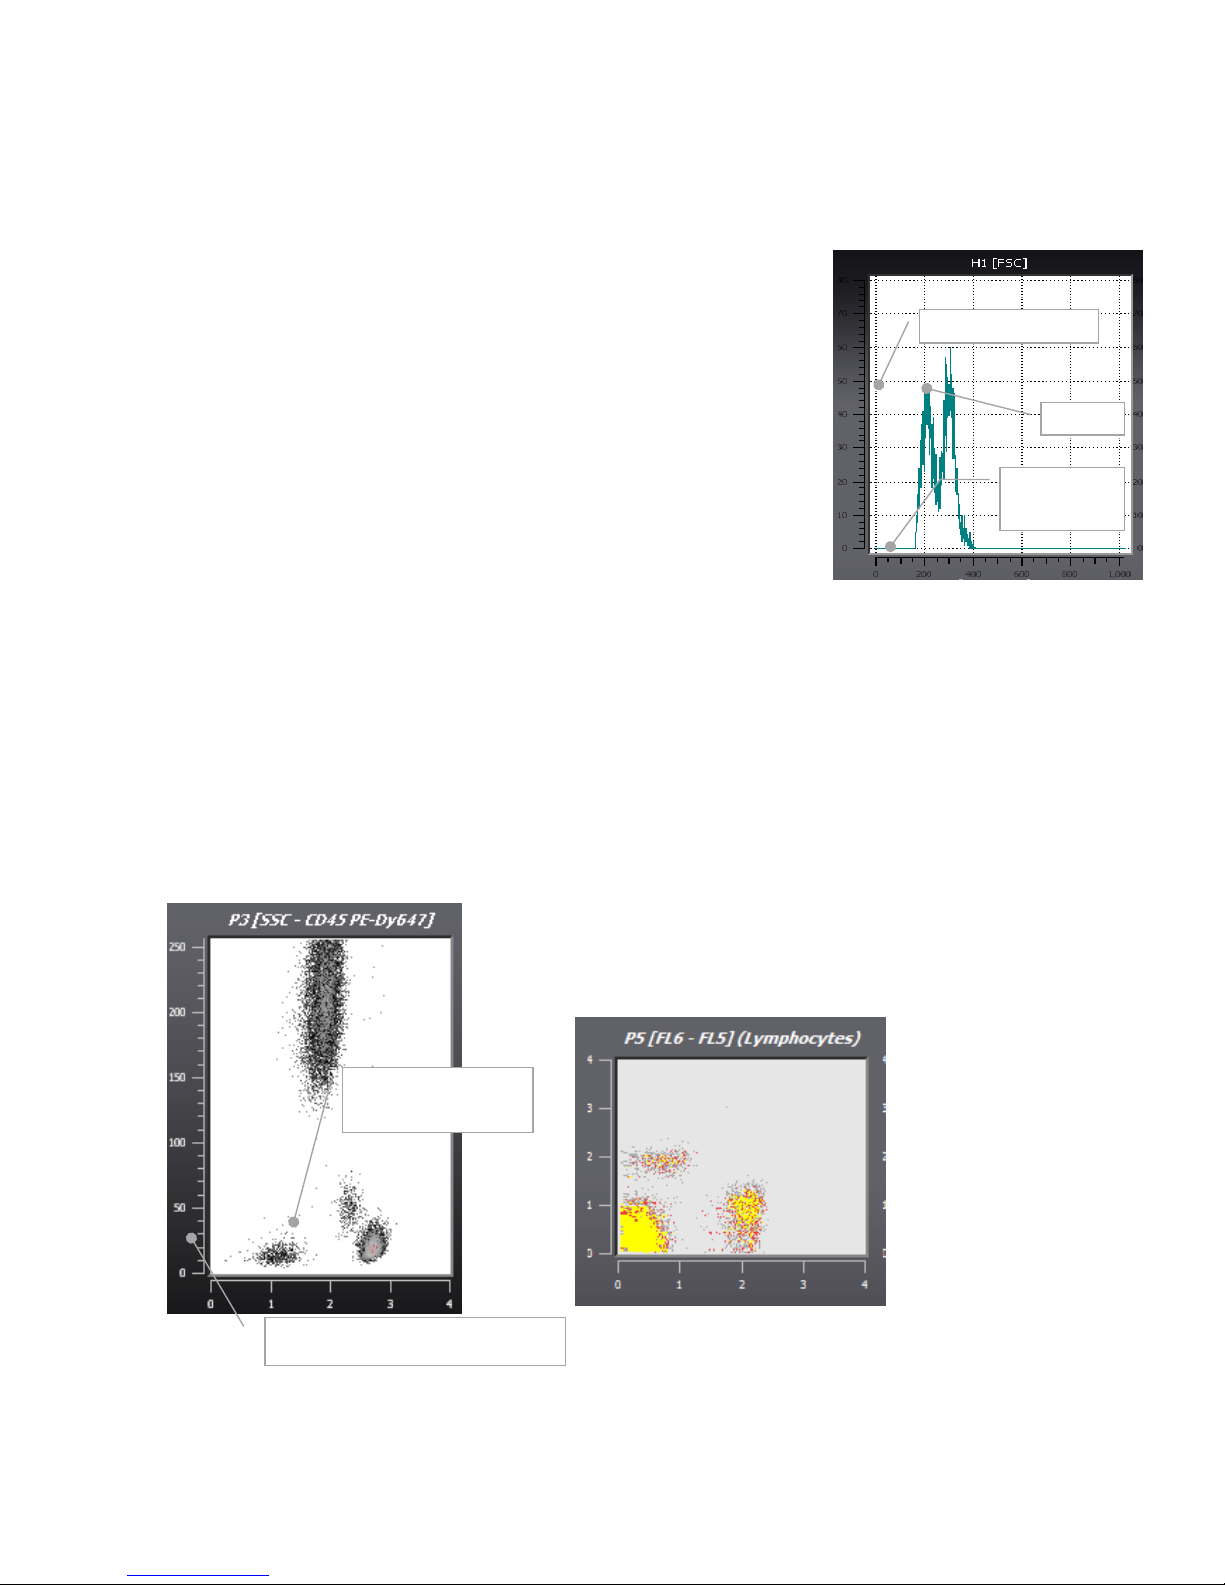
A histogram represents a distribution of measured signals (events) over 1
dimension. Data can be presented on the dimensions of relative particle size or
optical particle structure (Forward Scatter (FCS) or Side Scatter (SSC)), resp.
or on their relative fluorescence intensities in different light colors (fluorescence
parameters FL1 to FL6).
In this example, the dimension represented is the relative size (FSC) on a
logarithmic scale in X, and the number of events on a linear scale in Y. Two
peaks are visible.
Example of a dotplot
A 2D dotplot presents correlated data over 2 dimensions. In the image on the right a sample of leukocytes
(after lyse of the red blood cells) is plotted with their relative light scattering (SSC) property against the
intensity of the CD45 antigen.
The Z value represents the number of events that have the same coordinates. 1 event will be represented
by a black point; if 10 events have the same coordinates, the point representing them will be grey. It will be
yellow if more than 20 points are overlaying one another. The Z scale is dynamic and will adapt during the
measurement to a scale of 1 (black) to the maximum overlaying event coordinate color coded in red.
Page 9
CyFlow® Cube Instrument Operating Manual
Rev-05_2014-01-31
9/40
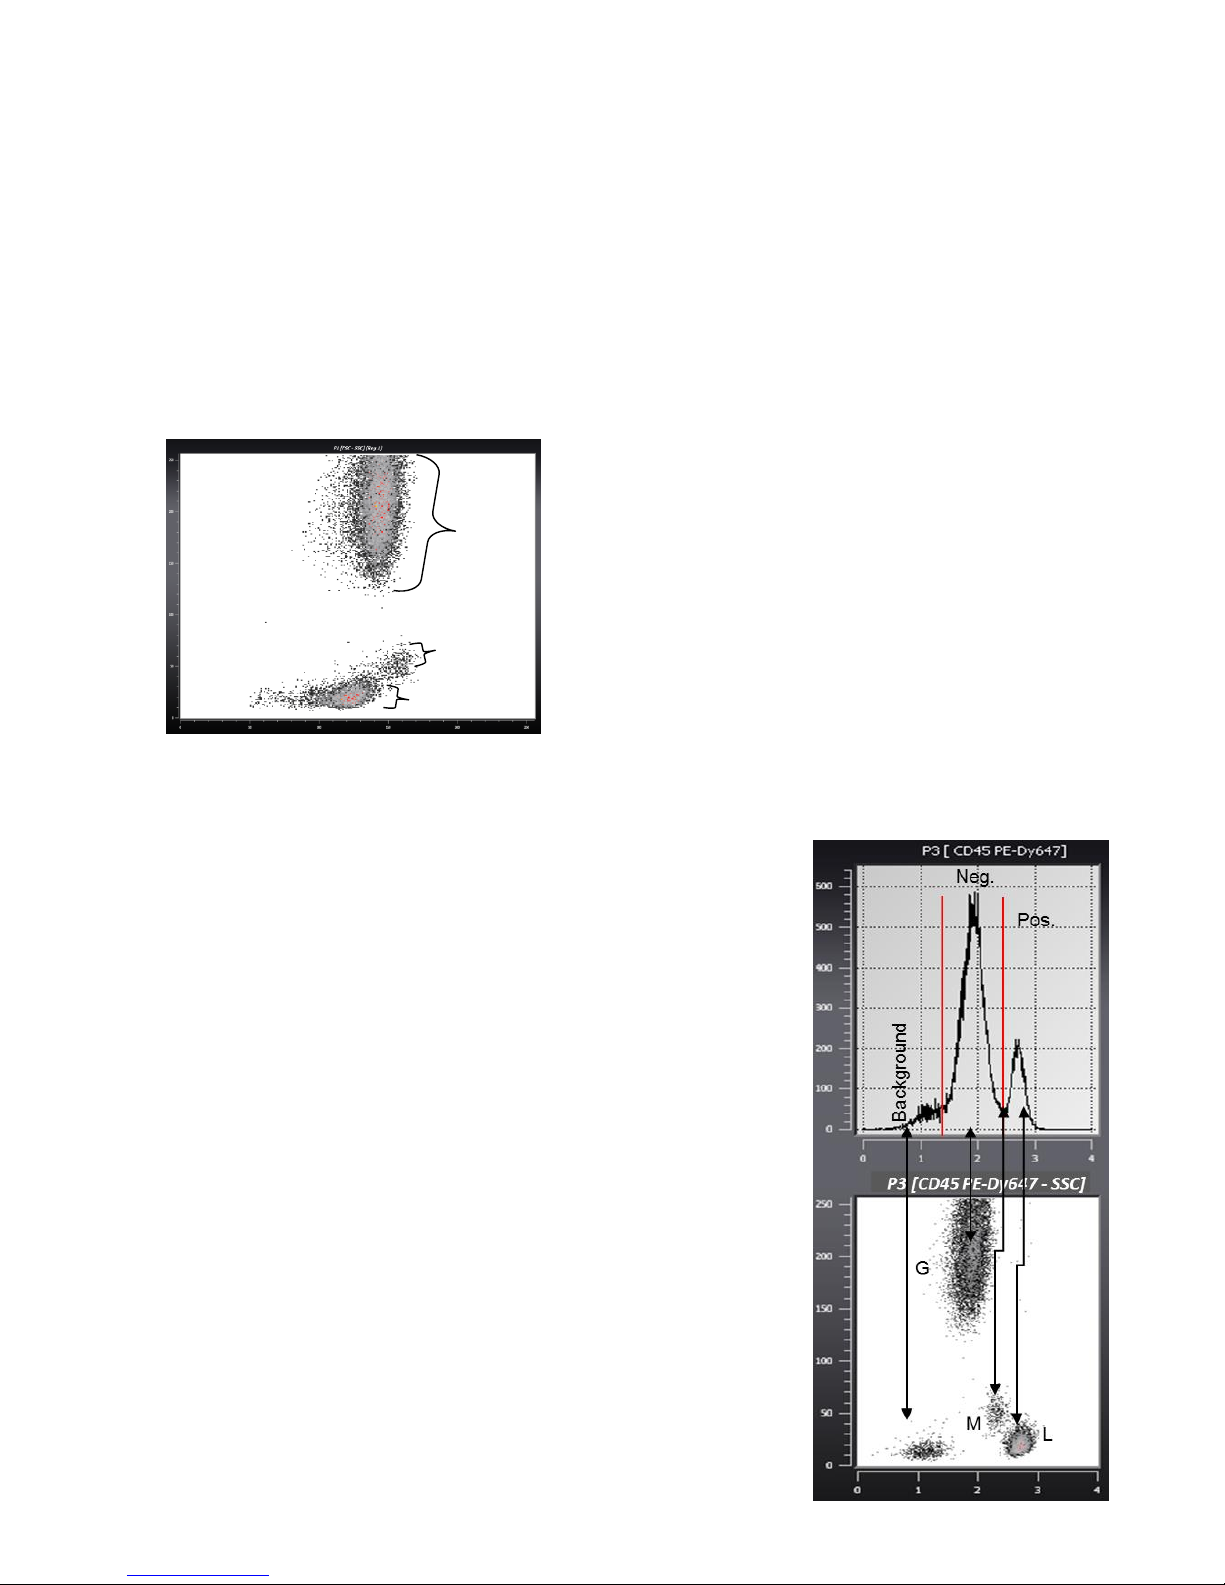
G M L
Histogram and dotplot in immunology
Lysed blood 2D dotplot
Lysed blood is represented in a dot plot presenting the FSC in X axis and SSC in Y axis. Both axes are in a
linear scale.
Three distinct groups are visible; they represent the granulocytes (G), monocytes (M) and lymphocytes (L).
Histogram and dotplot of immunological staining
This histogram represents the spectrum of the cells presented in the
previous dot plot stained with antibodies anti-CD45 conjugated to
PhycoErytrin (PE) Dy647. The X axis displays the fluorescence in a 4-dec
logarithmic scale and the Y axis displays the number of events in a linear
scale.
This dot plot presents the cells fluorescence in X on a logarithmic scale
(CD45 PE-Dy647) versus SSC in Y on a linear scale.
This data display allows an easier interpretation of 2 parametric data
compared to the histogram. Concluded from this example, the lymphocytes
are strongly stained with the anti-CD45 antibody, the monocytes are slightly
stained and the population of granulocytes is negative.
Page 10
CyFlow® Cube 8 - Instrument Operating Manual
Rev-05_2014-01-31
10/40
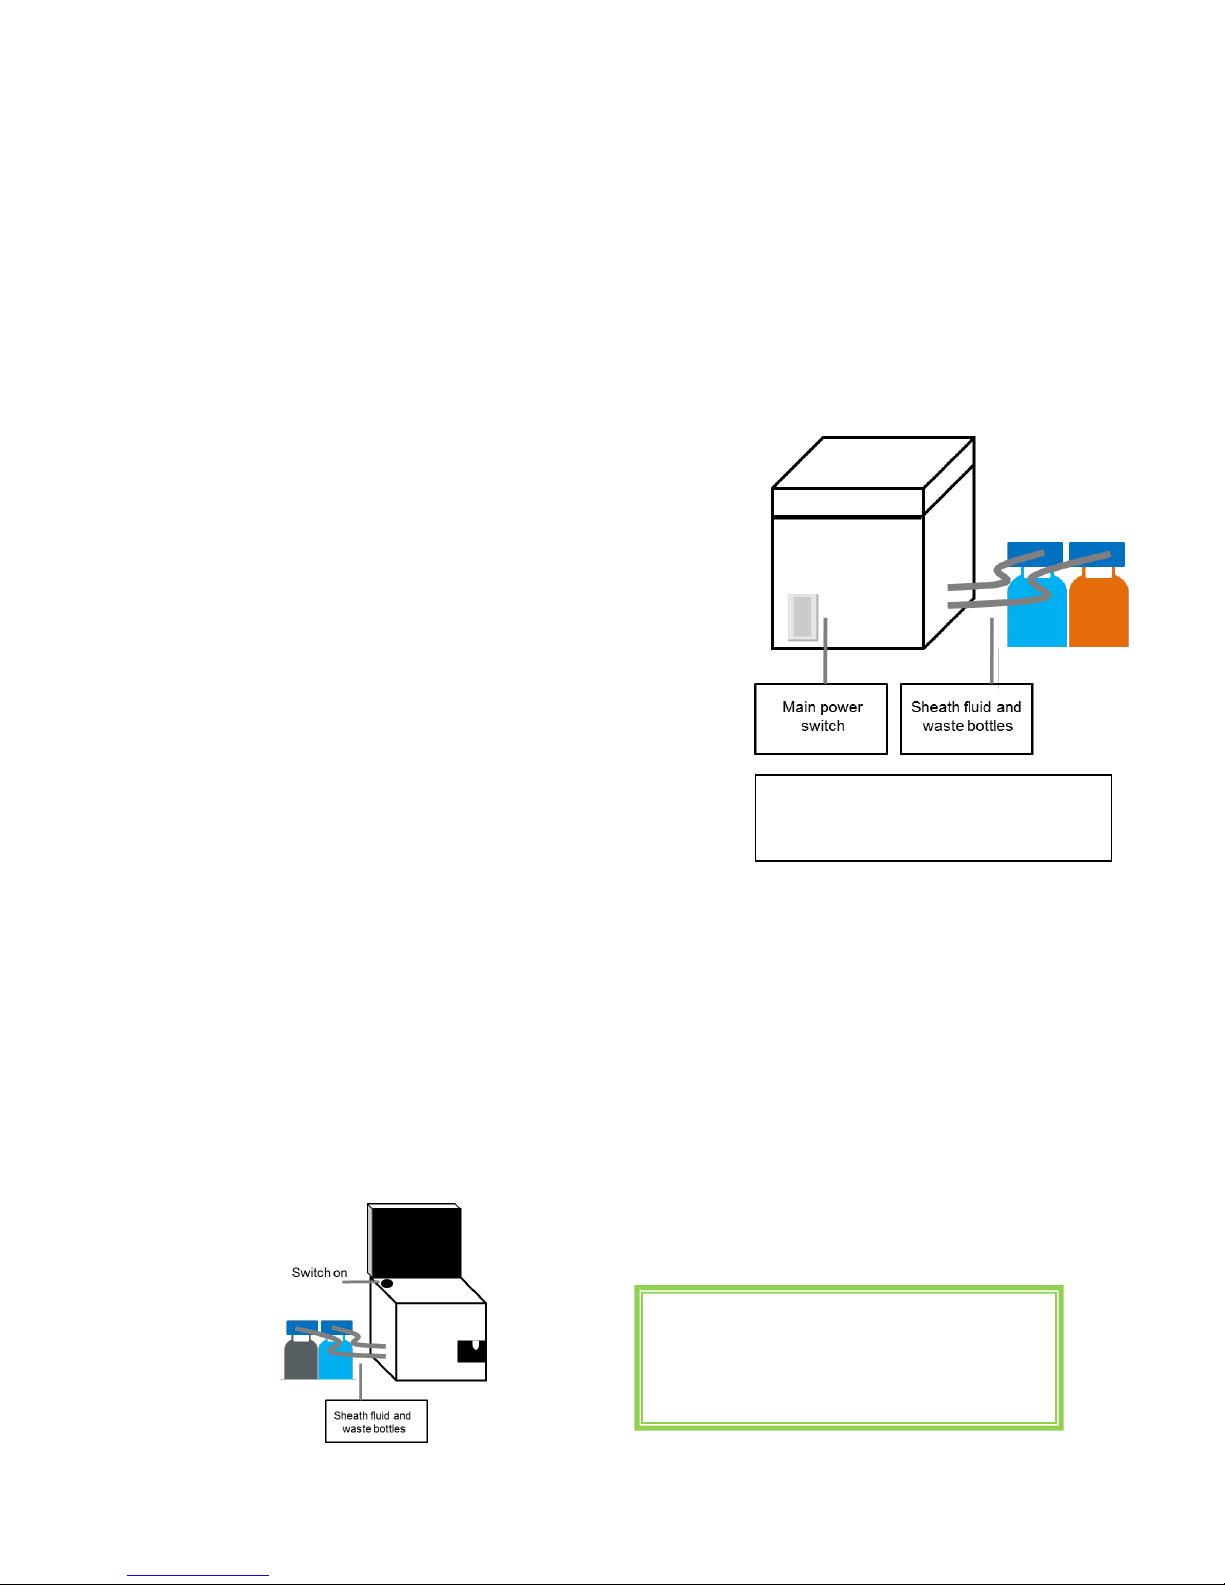
Rear side of CyFlow® Cube showing the
main power switch and the sheath fluid and
waste bottle compartment
Instrument starting procedure
Sheath fluid level control and/or refill
Before switching on the machine, it is recommended to check the levels of the sheath fluid and waste
bottles. They can be found at the back-left of the apparatus in a sliding compartment.
Make sure SHEATH bottle is filled with 700 ml of clean, filtered, and
degassed sheath fluid and is closed with the screw top.
Please notice: Higher level of sheath fluid could lead to unstable
sample flow.
In order to guarantee highest quality of the measurements we highly
recommend use Partec Sheath Fluid (order no. 04-4007).
It is recommended to replace the sheath fluid at least once a week or
before any daily use.
When filling up the sheath fluid bottle make sure no air bubbles are
trapped in the yellow filter unit inside the bottle!
Make sure WASTE bottle is empty and the screw top is tightly
closed.
The waste bottle must be emptied after and before each user
session. When using bio-hazardous samples, a volume of 50 ml of
hypochlorite 0.5% (Order No 04-4012) should be introduce into the
empty waste bottle for initial disinfection.
Switching on the CyFlow® Cube
The power supply switch is found at the back of the Cube next to the main supply cable. The Cube is, in
default, set in a stand-by mode. The full activation of the Cube requires pressing button on the top of the
machine. The display screen must be first lift up to access it.
This will start the embedded computer, automatically start the CyView™ software and load the last
employed configuration.
Casual/medium expertise user:
Once the Cube started no further steps are
necessary. You can directly start your
measurements!
Page 11
CyFlow® Cube Instrument Operating Manual
Rev-05_2014-01-31
11/40
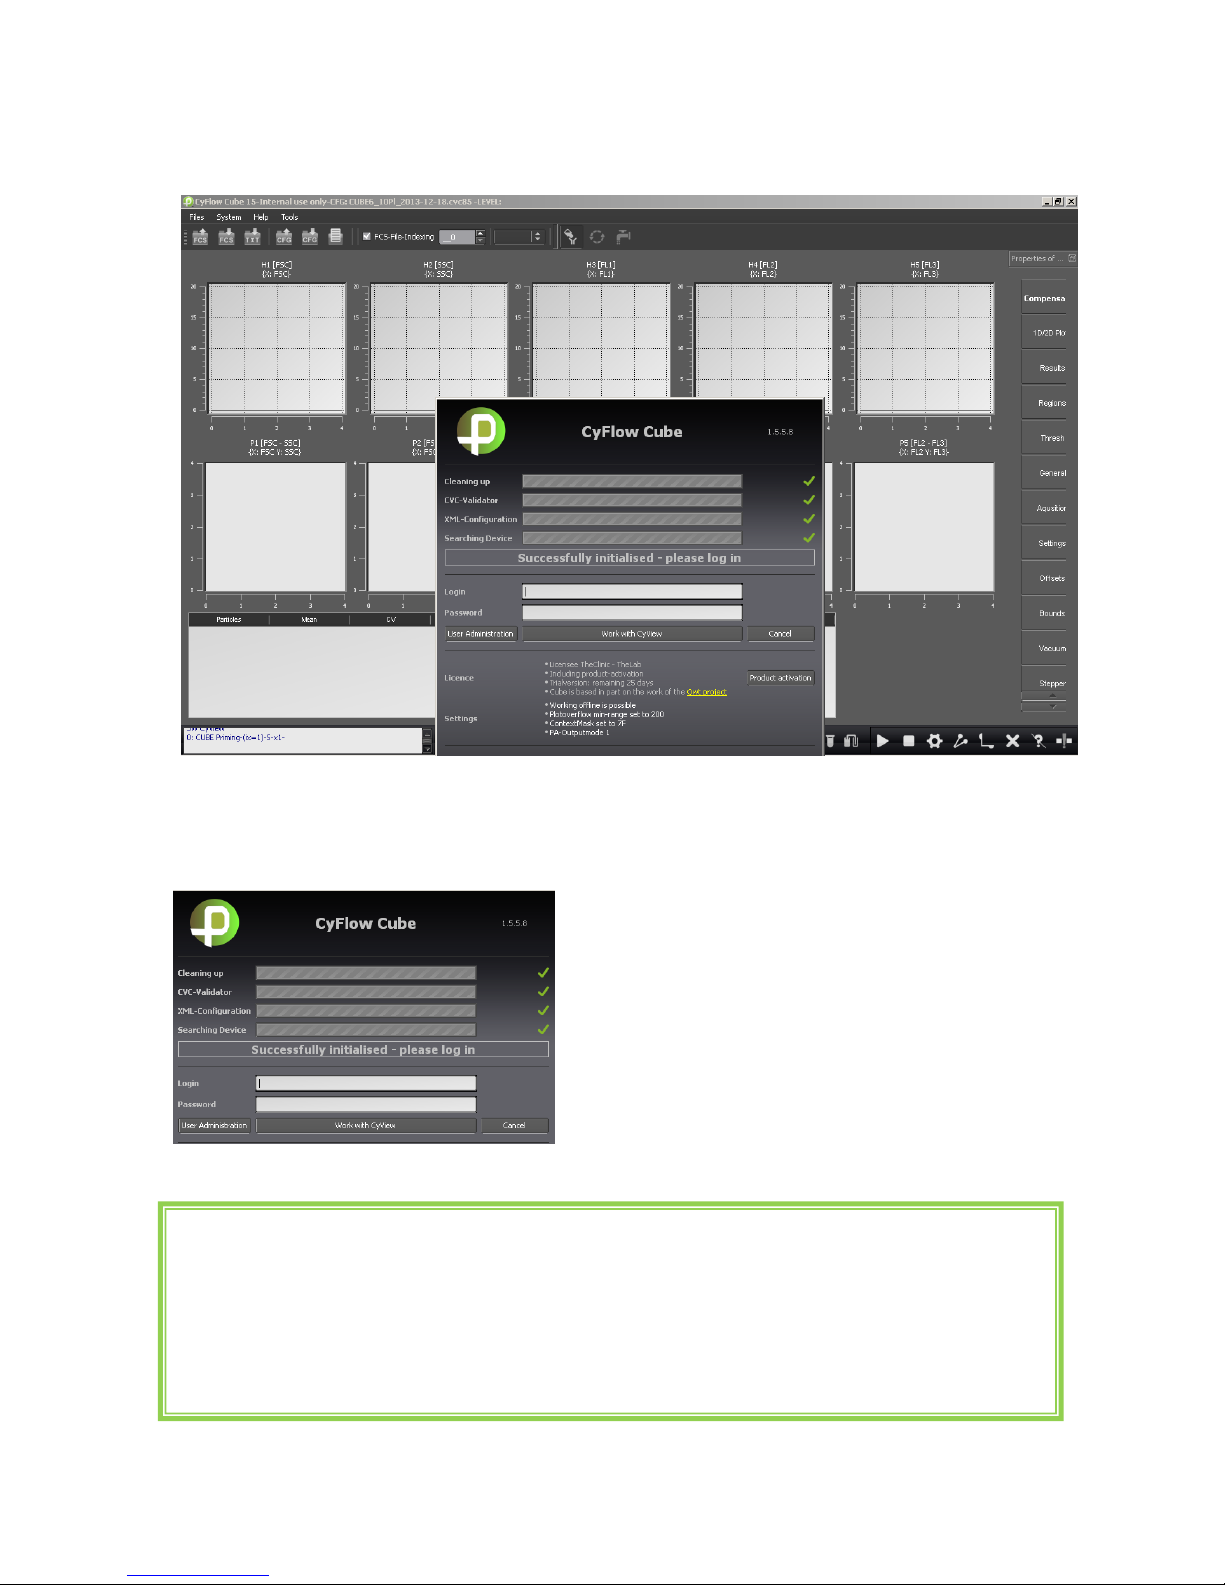
Main CyView™ login window
The log in window allows to start the software at the USER, MAIN USER or SERVICE level.
During start of the instrument the automated self-testing procedures are processed:
Cleaning up and XML-configuration: displays the
correct loading of the setting files
Searching Device: display of the correct recognition of
the connection between the computer and the embedded
electronics
Please verify that all operations are confirmed by a green tick.
Lost your login details?
Important: On each new instrument a Main User
login is already established
Login: USER (case sensitive)
Password: Cube1 (case sensitive)
Login as a standard USER:
The code will be given to you by the main
user(s) of the instrument. The main user has the
rights to define or delete users.
Page 12
CyFlow® Cube 8 - Instrument Operating Manual
Rev-05_2014-01-31
12/40
User levels
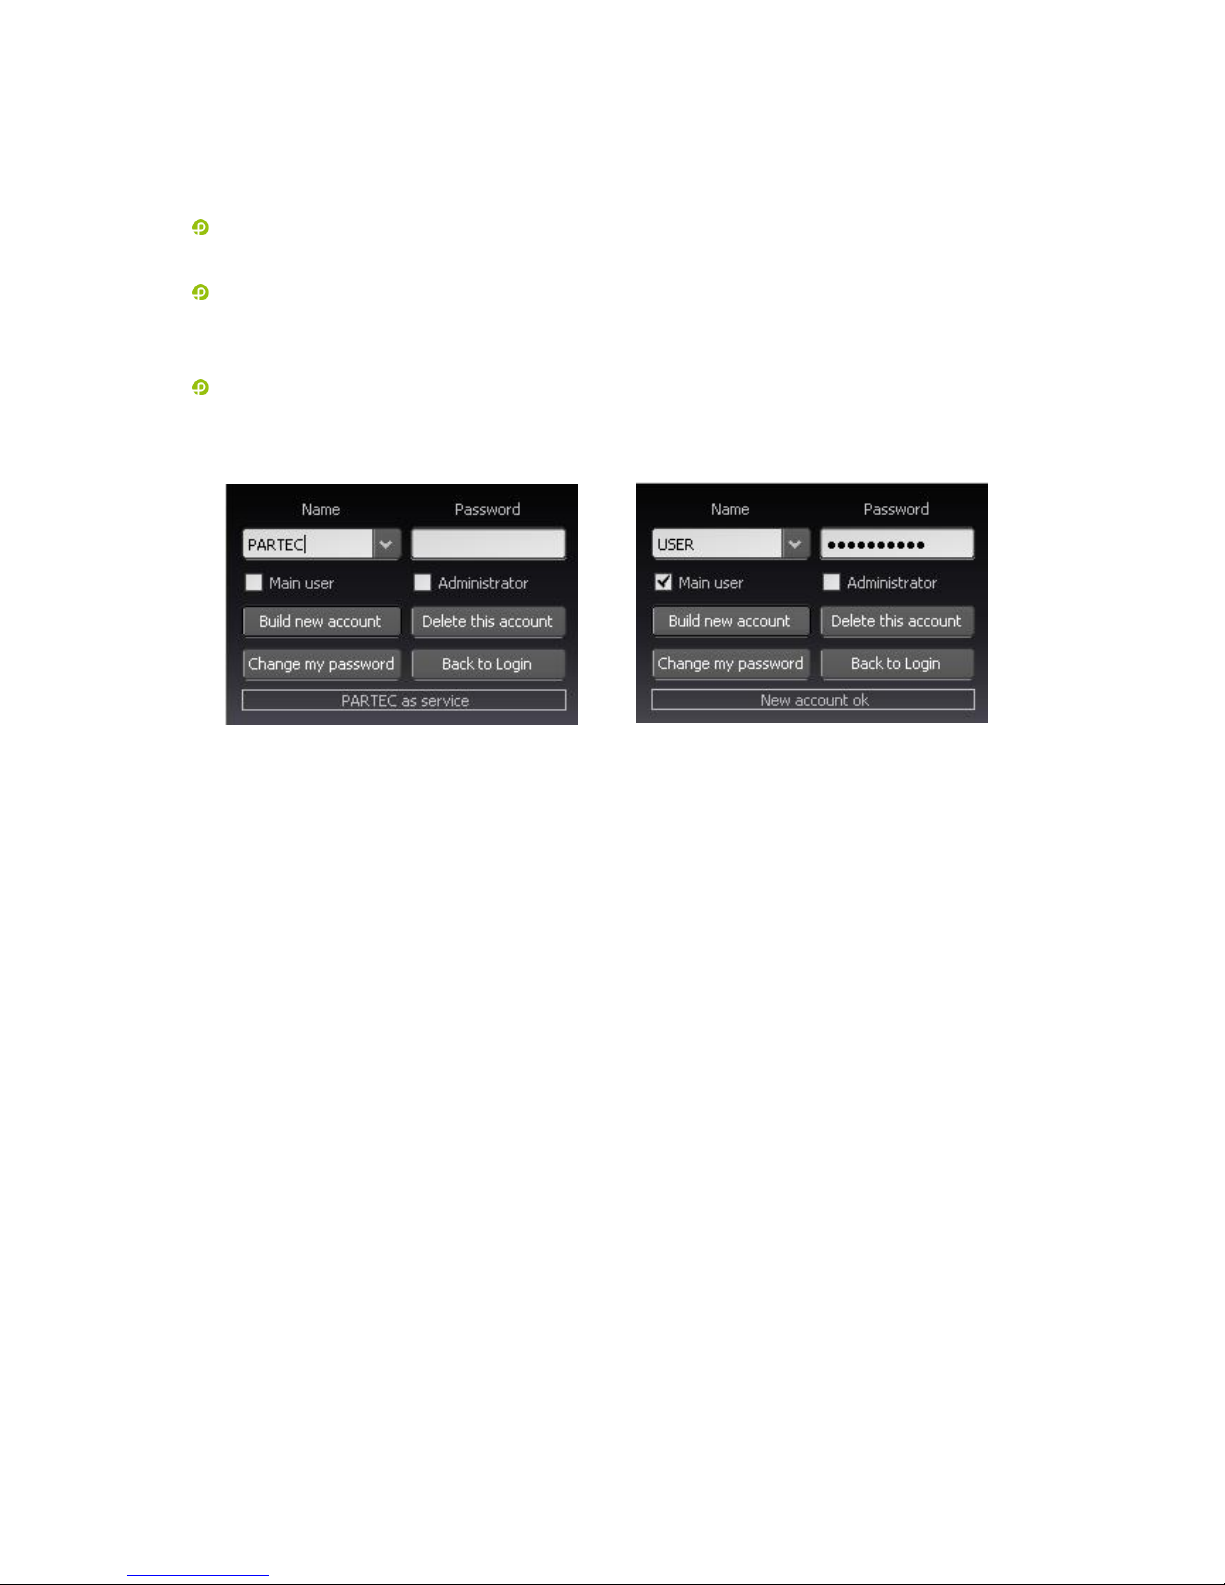
Three different user levels exist:
SERVICE/ADMINSTRATOR: Restricted to authorized Partec trained persons and for service
purposes only
MAIN USER: Complete functionality of the instrument, method development
Main users can create new accounts of the Main User and User level
USER: Applying standardized methods only
Users cannot create new accounts.
As a main user in order to create new accounts type in your Login name and password and select “User
Administration”.
To create a new MAIN USER account type in Name and Password and activate “Main user” followed by
“Build new account”.
To create a new USER account type in Name and Password followed by “Build new account”. (Main user
should be deactivated).
As User the own password can be changed by selecting the Name and placing a new Password followed
by “Change my password”.
As Main User the own password can be changed by selecting the Name and placing a new Password
followed by “Change my password”. As Main User any User account can be deleted by selecting the Name
followed by “Delete this account”. The Main User does not require the respective password to delete any
User account.
The default user account (Name: USER; Password: Cube1) can be deleted when logged in as Main User.
Please make sure at least one Main User remains in the user list in order to guarantee complete
functionality of the software.
To enter the CyView™ software from the user administration level select “Back to login”, login with your
personal Login name followed by “Work with CyView™.
Page 13
CyFlow® Cube Instrument Operating Manual
Rev-05_2014-01-31
13/40
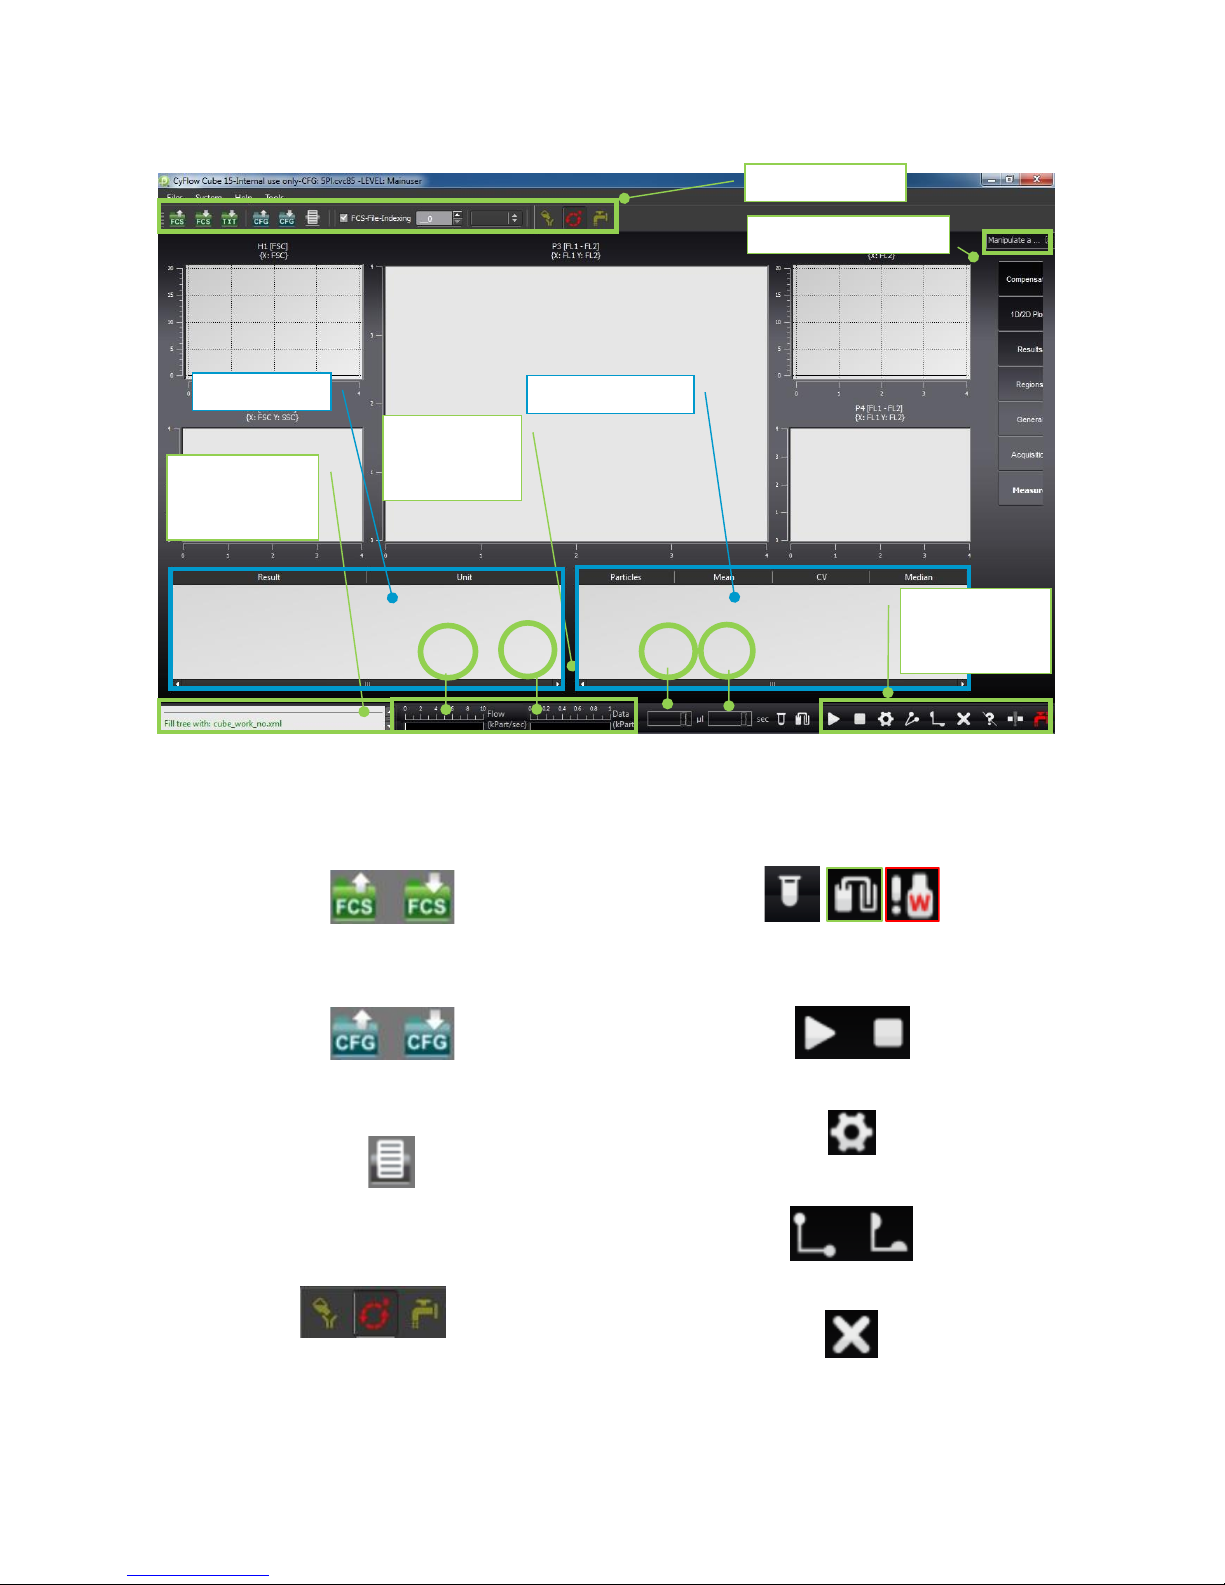
Buttons allowing to load and save data files
(.fcs data files).
Buttons dedicated to saving and retrieving
instrument settings (configuration files).
Button for the generation of a PDF report of
acquired data.
Buttons to select “Prime”, “Work” or “Clean” batch
CyView™ Main Page – after successful log-in
The main window will be your interface to acquire, save, re-load and analyse your data
Instrument real time display of workload (L), on-board memory status (M), analysis volume (V) and
analysis duration (D).
Console
PC/control
board link
File operations
Real time
instrument
work load
Region statistics
Results table
Instrument settings
L
M
Measurement
interface and
indicators
V
D
Status of sample (high, counting phase, empty)
and of waste and sheath fluid bottles levels.
Start and Stop measure buttons.
“Meas” button opens the PROCESS register
Compensation button and random bias button.
Clear button – deletes all data during a
measurement
Page 14
CyFlow® Cube 8 - Instrument Operating Manual
Rev-05_2014-01-31
14/40
CyView™ Controls
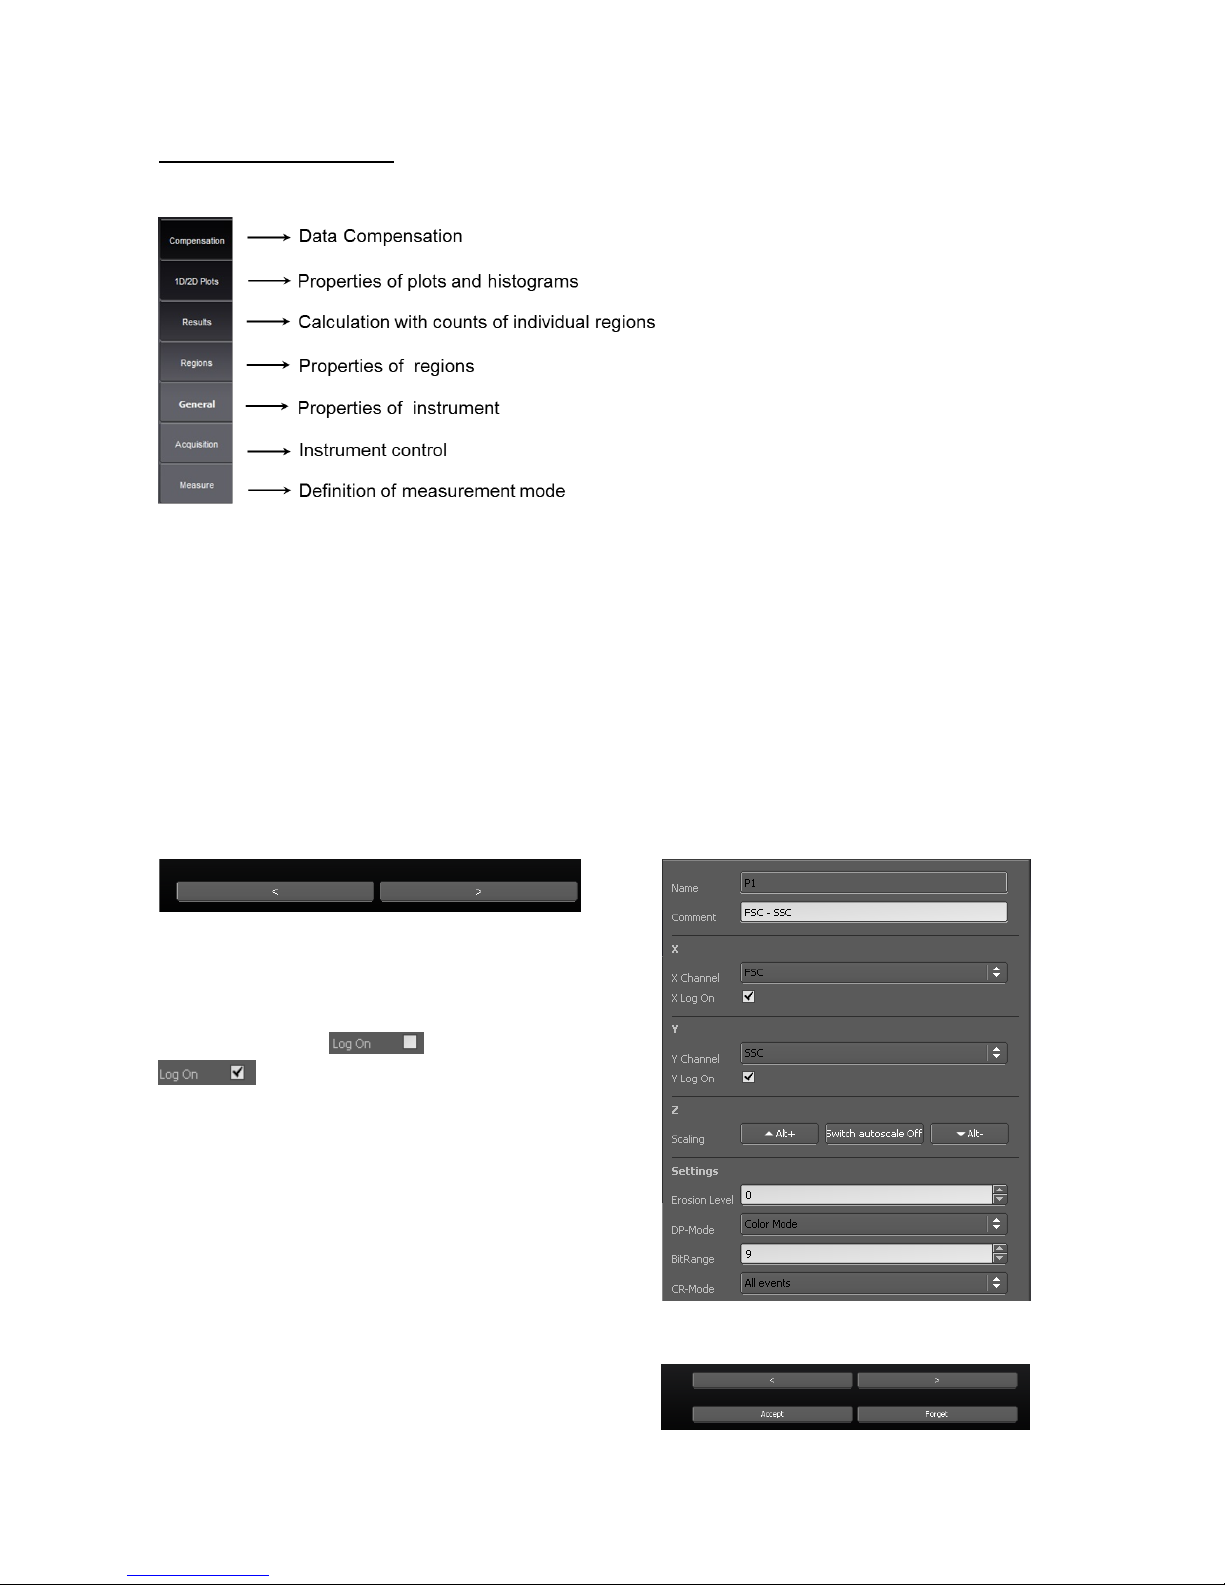
Overview of instrument settings
1D/2D PLOTS– display options
The 1D/2D Plots register defines properties of the graphical plots. The basic layout in terms of number of
plots, type of plots (histograms, dot plots) and position of the plots is defined in the used Configuration
File.
As example: 12Pl → 6 Histograms + 6 Dotplots
Plots are named H1 – Hx for histograms and P1 – Px for dotplots. A specific plot is selected with the arrow
keys.
Define a Comment characterizing the plot e.g. FSC
Select X-axis channel and Y-axis channel in dot plots or
X-axis channel only for histograms
Switch between Lin and Log scale
for X and Y axis and change the Z axis
(scaling)
Define an Erosion level for dots to be displayed (z-axis
level), e.g. an Erosion level of 2 shows only dots
representing 3 and more signals
Select Dotplot (DP)-Mode
(Color Mode, Contour Mode or Color + Contour Mode)
Select histogram resolution as BitRange, (values 6bit to 12bit)
Select CR – Mode to show “All events” or “Regions only”
Confirm all modifications by pressing Accept
Page 15
CyFlow® Cube Instrument Operating Manual
Rev-05_2014-01-31
15/40
RESULTS
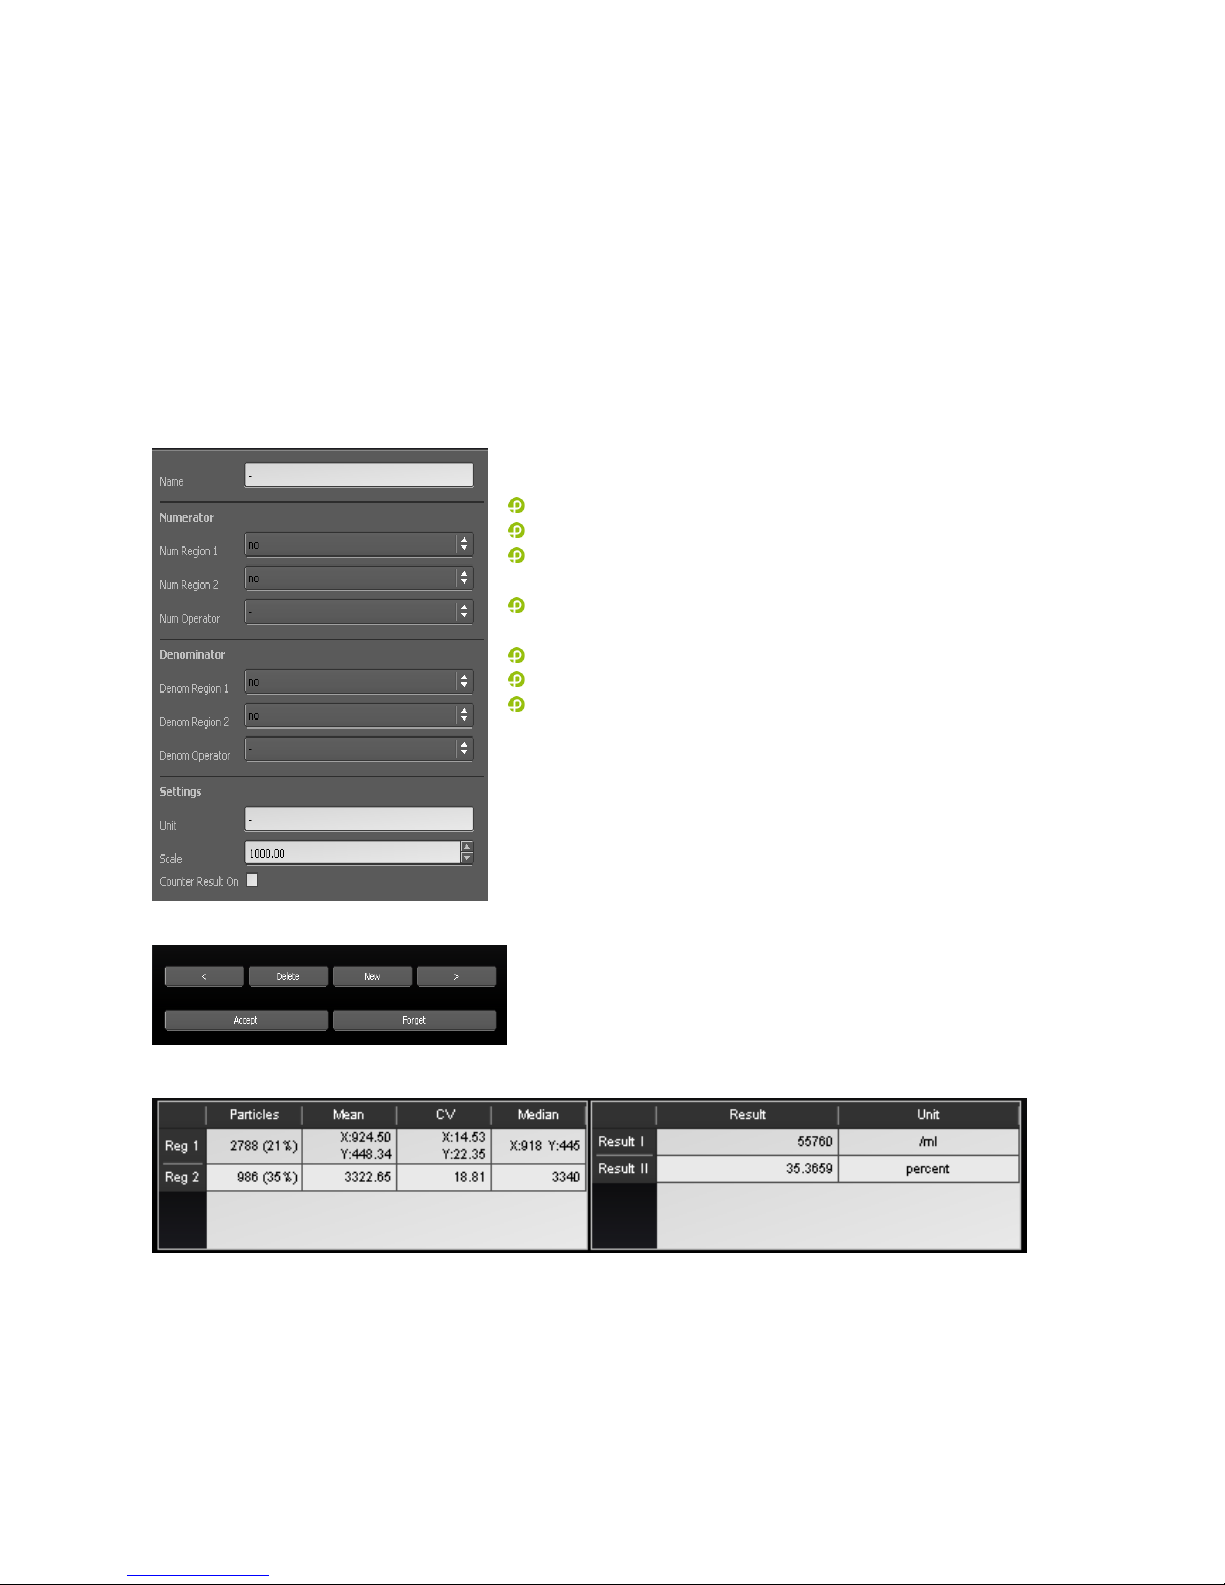
The RESULTS register defines properties of calculated results displayed in the RESULTS table.
Properties of result calculations
It is possible to set up calculations with the COUNT of individual regions according to the specified formula:
NumReg1 (+ - x / ) NumReg2
--------------------------------------------------x Scale
DenomReg1 (+ - x / ) DenomReg2
NumRegion1/2 defines numerators
DenomRegion1/2 defines denominators
NumOperator defines operator between 2 numerators
„+“, „-“, „x“ or „/“
DenomOperator defines operator between 2
denominators „+“, „-“, „x“ or „/“
Unit allows to add text to the result table
Scale introduces a factor to the formula
Counter results on refers to the result of a volumetric
counting
Create a result by pressing “New” or delete a result by pressing
“Delete”
Confirm all modifications by pressing Accept
Result will be display in the “Results table” next to the “Region statistics”
Page 16
CyFlow® Cube 8 - Instrument Operating Manual
Rev-05_2014-01-31
16/40
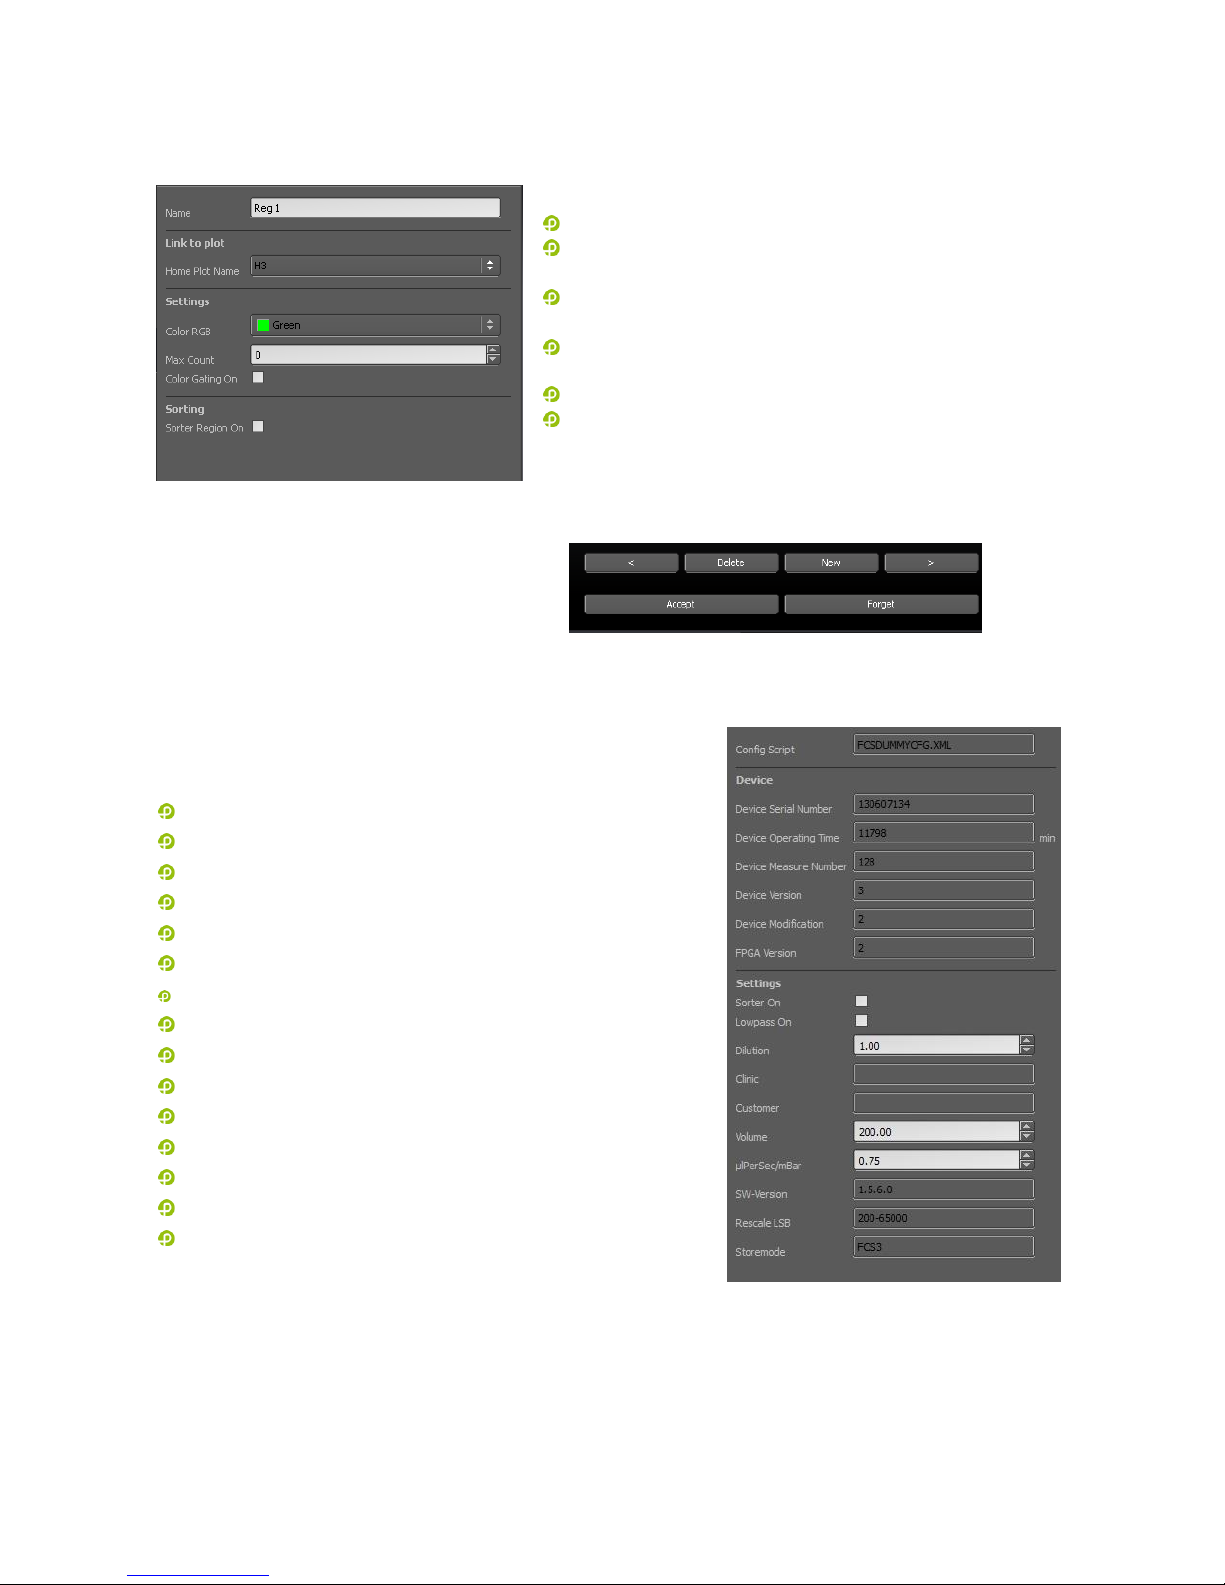
REGIONS
Home Plot Name defines the plot the region refers to
Color RGB defines the region´s color and its color in
color gating
Max Count defines a maximum count for an “Cells
in Region” particle limit (see also Pages 17-19)
Sorter Region On activates region as sorter region
(only in CyFlow
®
Cube Sorter)
Color Gating On activates/deactivates the region
Use Delete and New to delete and create new
regions
Use arrow keys to switch between regions
Confirm all modifications by pressing Accept
GENERAL - properties of the instrument
The active Configuration File
The instruments Serial Number
Total Operating Time of the instrument
Measure Number shows total number of measurements
Version of the instrument
Modification of the instrument
Activates Sorter function (only in CyFlow® Sorter)
Activates Lowpasses
Defines a factor for sample Dilution
Clinic/Customer display specific User information
Defines sample port electrode Volume in µl
µlPerSec/mBar defines a sheath fluid flow parameter
SW-Version specifies current software version
Rescale LSB shows area of automatic scaling
Storemode defines FCS file format
Page 17
CyFlow® Cube Instrument Operating Manual
Rev-05_2014-01-31
17/40
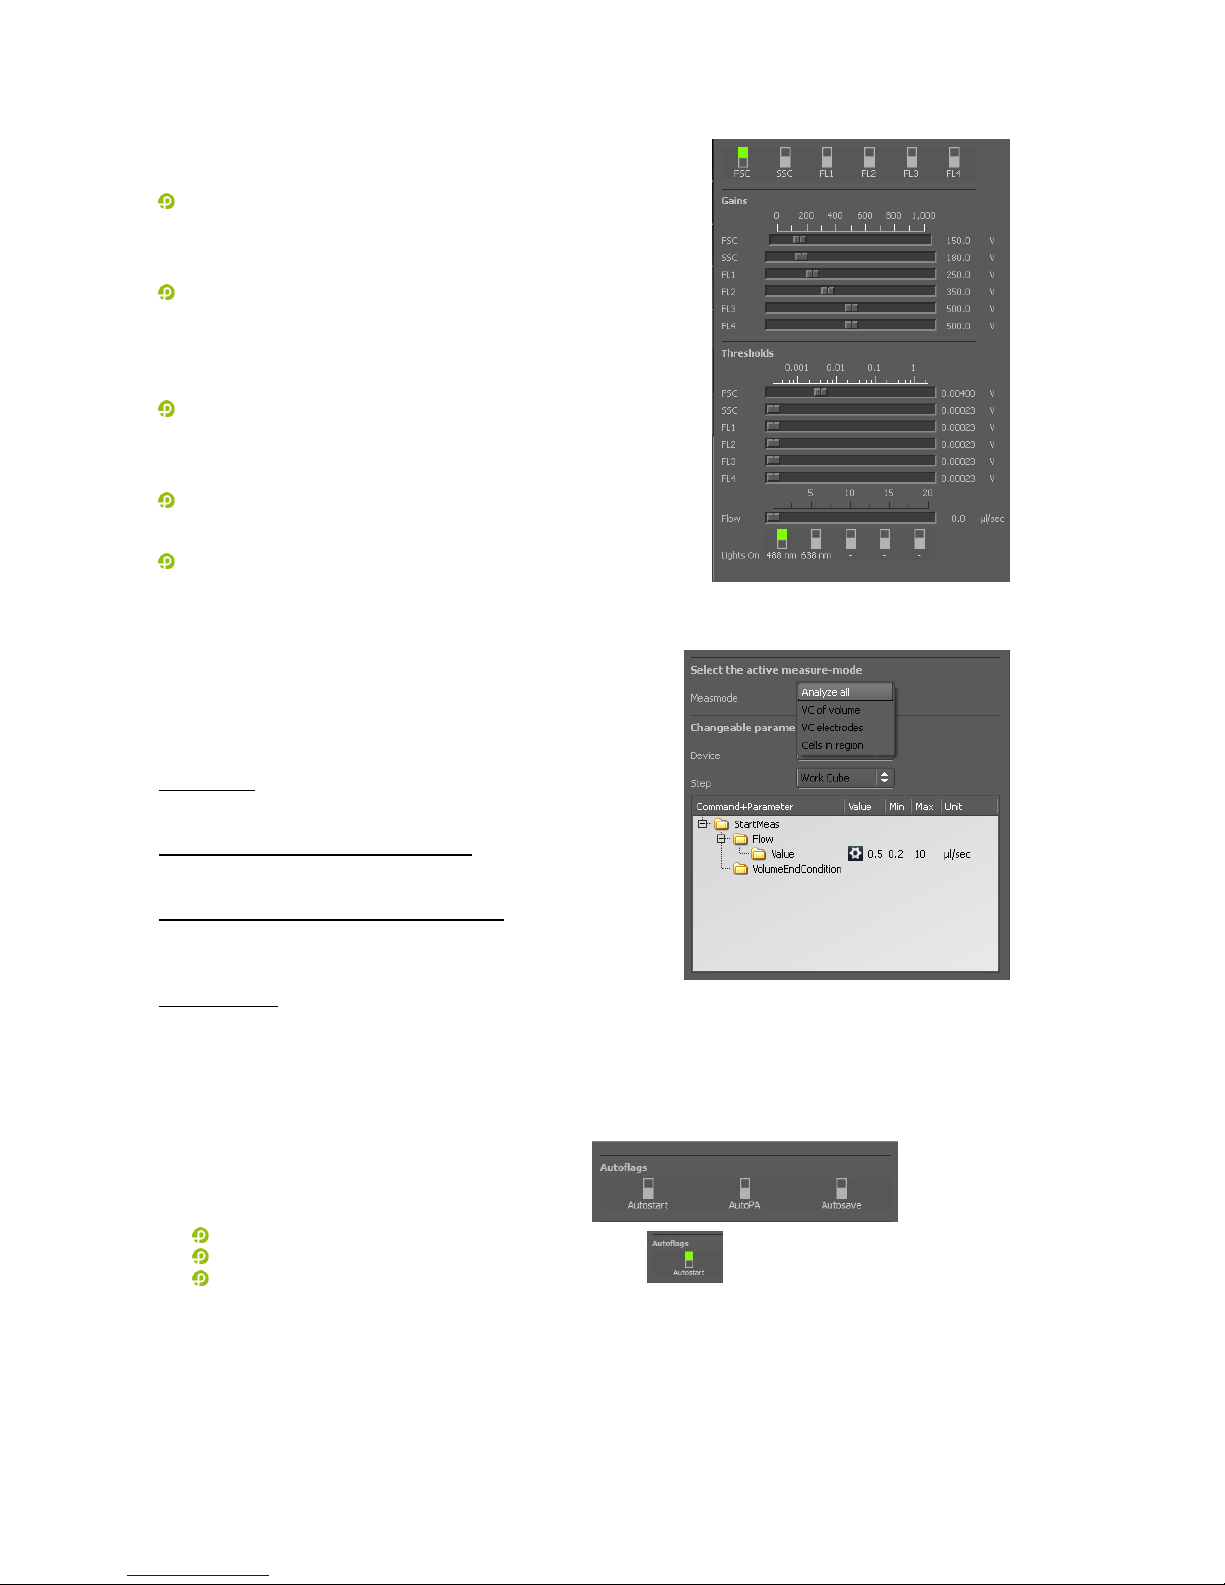
ACQUISITION – instrument control
Select the trigger parameter
multiple trigger parameters are logical “or” connections
Gain values to change the voltage of the individual optical
parameters
(0 volt - 999 volts) defines PMT signal amplification
Threshold defines the trigger signals cut-off level
(on 4 dec log scale)
Flow defines the speed of sample injection in µl/s
Lights on switches light sources on / off
MEASURE – definition of measure modes
Measmode allows selection of:
Analyze all:
run sample until its levels reached the stop electrode
Volumetric counting (VC) with volume
a volume can be pre-selected
Volumetric counting (VC) with electrodes:
START and STOP electrodes of the sample port were
used to define a fixed sample volume of 200µl
Cells in region
a particle number can be pre-selected
Speed values and Volume values can be edited and will be stored upon saving a confirmation file.
Autoflags allows activation of specific functions:
Autostart: automatic start of the measurement
Activate the AutoStart flag
Press start (only ones to confirm the processes)
Connect a sample tube
With each new connection a sample tube the next measurement will be initialled until the button is
pressed.
AutoPA: automatic peak analyse, at the end of the measurement → only for Ploidy
Autosave: automatic storage at the end of the measurement.
Autosave does not function when the measurement is finished by the “end” button.
Page 18
CyFlow® Cube 8 - Instrument Operating Manual
Rev-05_2014-01-31
18/40
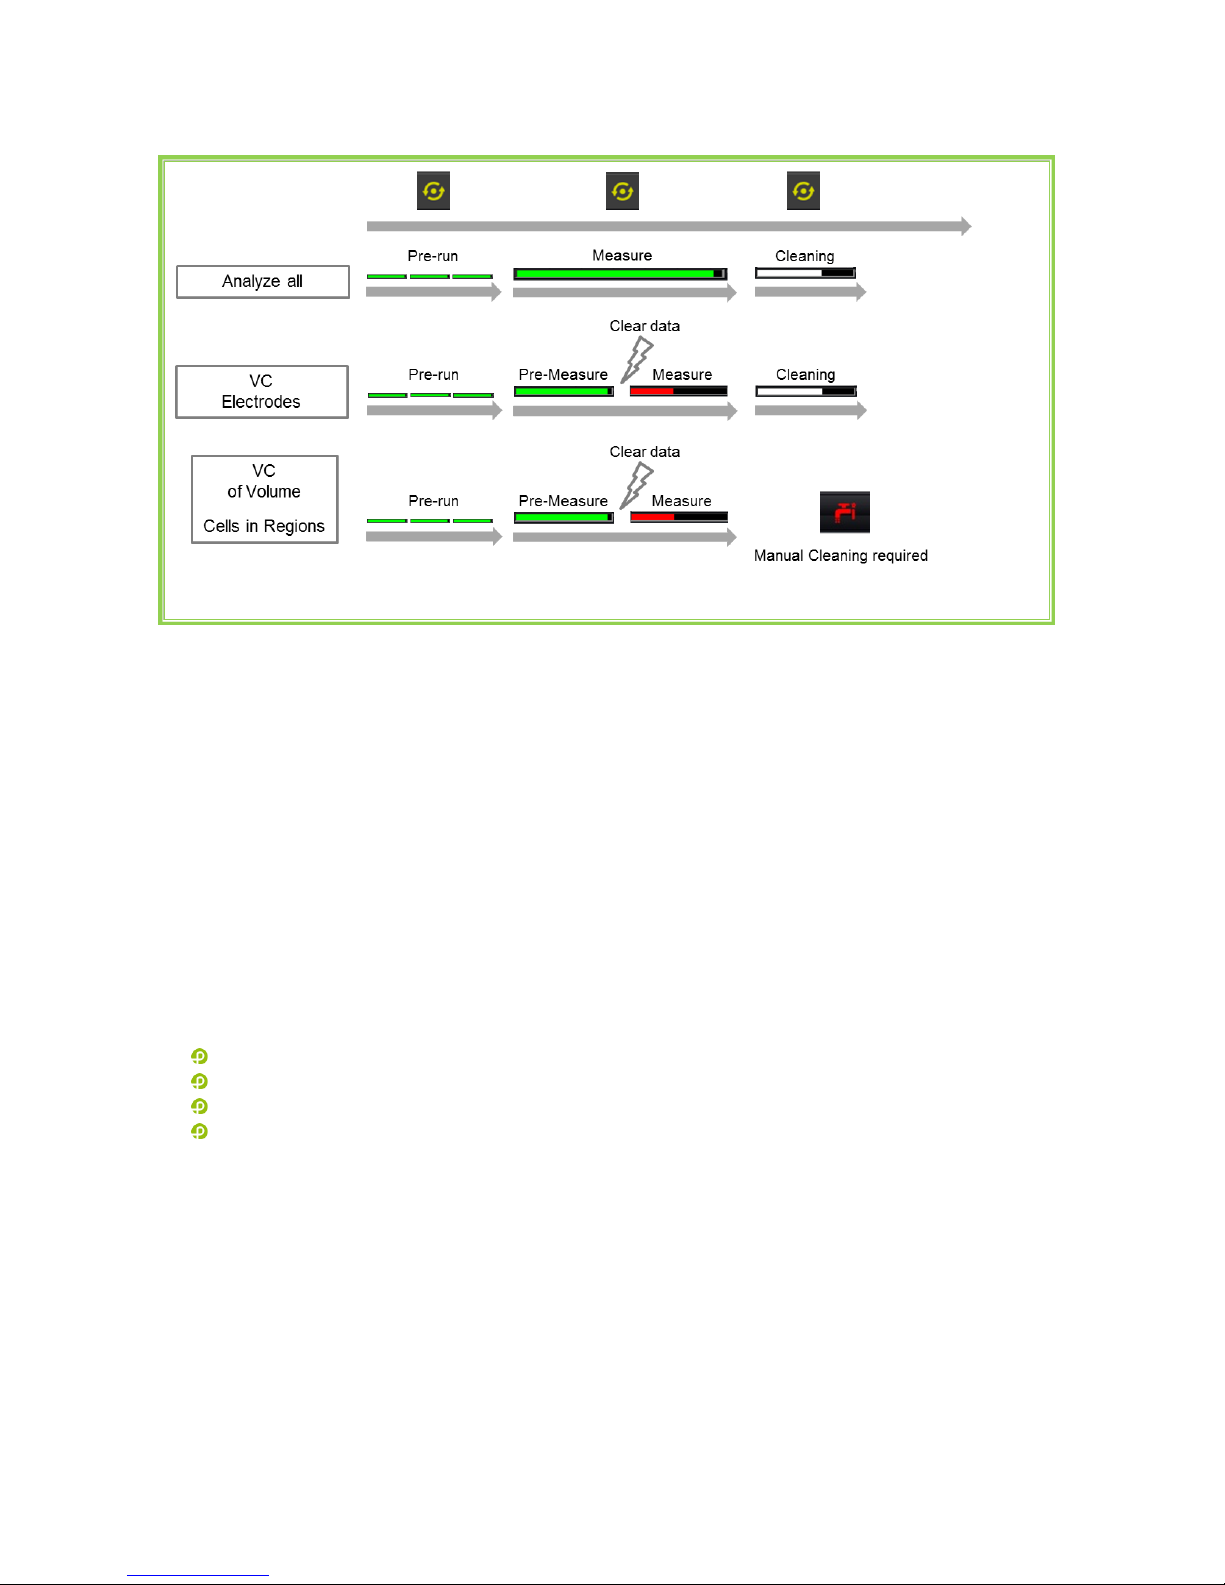
Schematic overview of the acquisition process for all measure modes
Green and red colored bars refer to particle count indicator of CyView.
Please note: In the measure mode “VC of Volume” or “Cells in Regions” there is no cleaning cycle.
Subsequently the data can be stored. In the measure modes “VC electrodes” and “Analyze all” the cleaning
cycle will occur automatically as soon as the sample is finished.
No cleaning cycle will be started if the measurement is terminated by the “end” button.
Beware: for all measure modes the sample analysis automatically stops when the sample is empty (the
stop electrode is reached) even if the selected end criteria is not yet realized.
Measure modes
The following measure modes can be selected prior to start of an analysis:
Analyze all
Volumetric counting (VC) of volume
Volumetric counting (VC) electrodes
Cells in region
Analyze all (default selection)
This default mode will allow you to run your sample until its levels reached the stop electrode.
Volumetric Counting with Volume
In the measure mode volumetric counting with volume the counting volume is flexible and can be preselected by the user. In a first analysis phase the sample is acquired normally as in continuous acquisition
mode. Reaching the pre-selected volume the data are cleared and the volumetric counting phase starts and
the pre-selected volume will be analyzed. The volume can be used as the basis for concentration
determination.
Page 19
CyFlow® Cube Instrument Operating Manual
Rev-05_2014-01-31
19/40
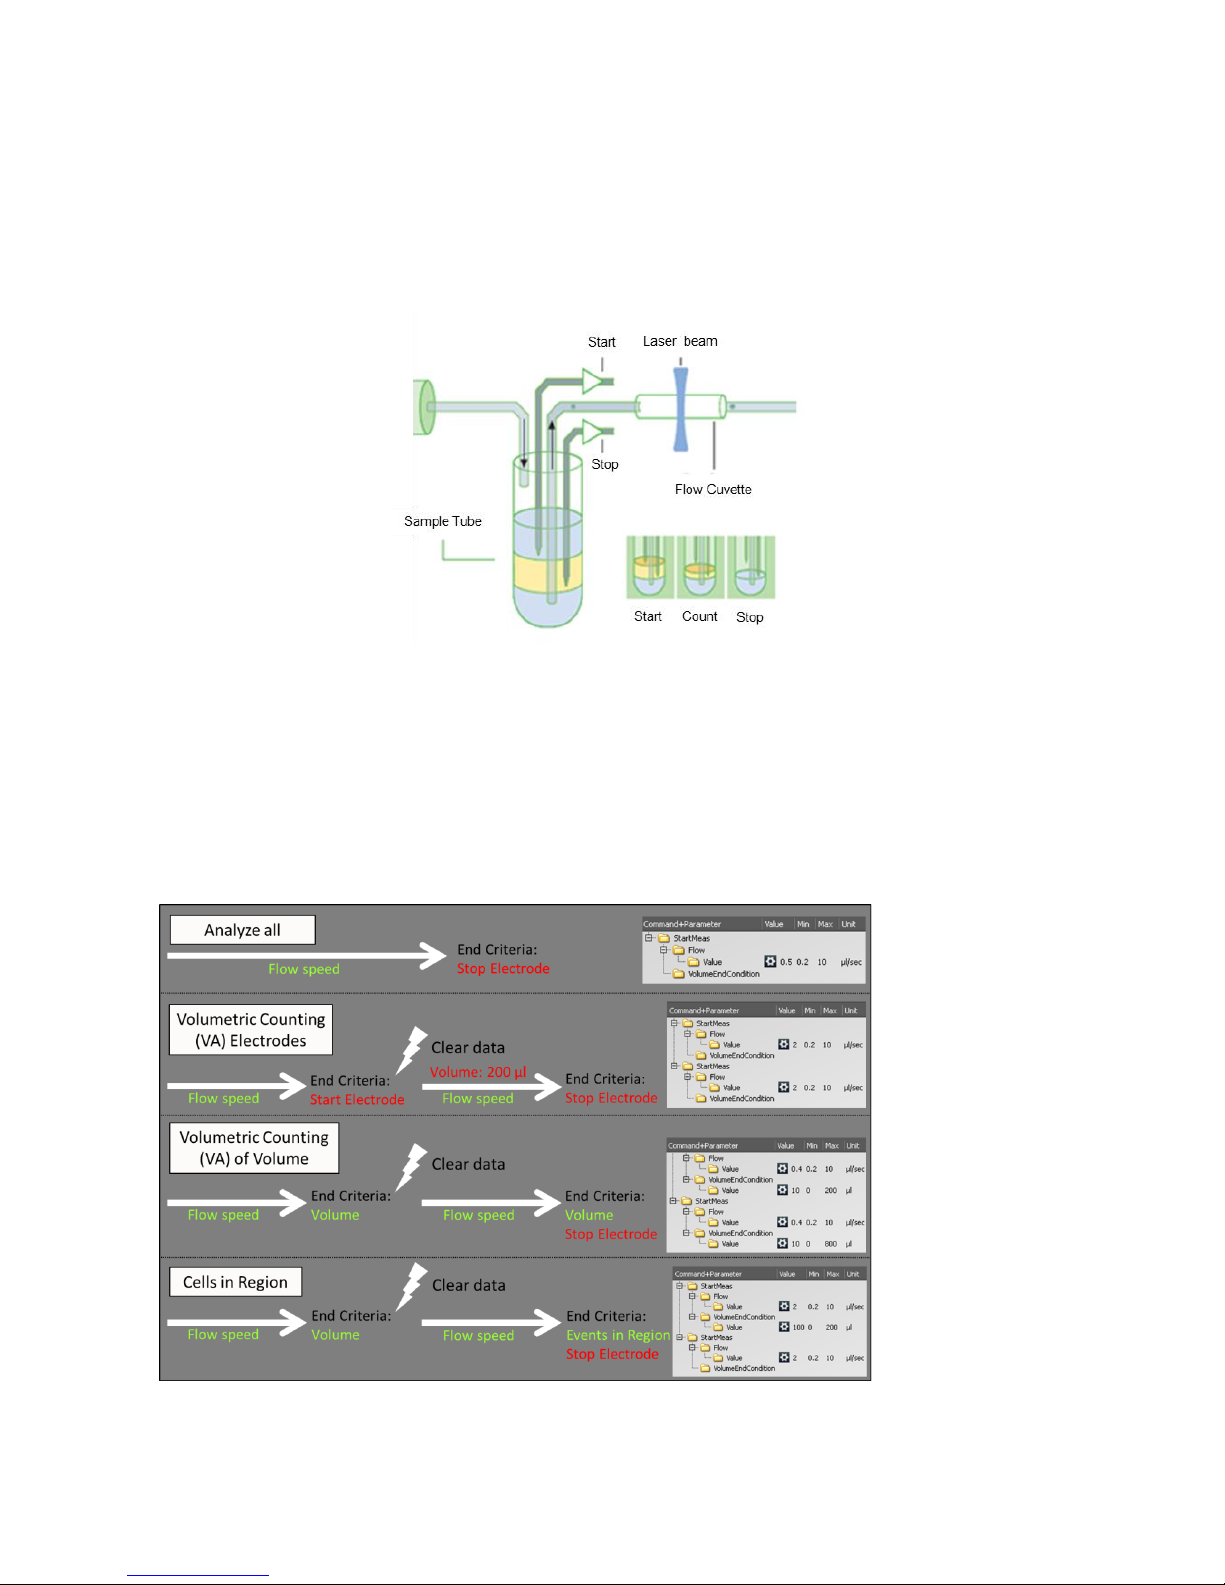
Volumetric Counting with Electrodes
This measuring mode uses the START and STOP electrodes of the sample port to define a fixed sample
volume. In a standard sample port this “counting volume” is 200 µl. In a pre-counting phase the sample is
acquired normally as in continuous acquisition mode. Reaching the START electrode the data are
cleared and the volumetric counting phase starts. Reaching the STOP electrode the counting procedure will
be terminated and a system cleaning cycle will be initiated automatically.
Cells in Region
The Events in Region measure mode allows to define a number of particles within a specified region to
operate as STOP condition (select the respective MaxCount function in the REGIONS register).
Schematic overview of the measure modes with a flash indicates clearing of the data. User selectable
criteria in green, software-defined values in red
Working principle of the Absolute Volumetric Counting with Electrodes
Page 20
CyFlow® Cube 8 - Instrument Operating Manual
Rev-05_2014-01-31
20/40
CyView® Instrument/Measurement Settings
Prime/Work/Clean
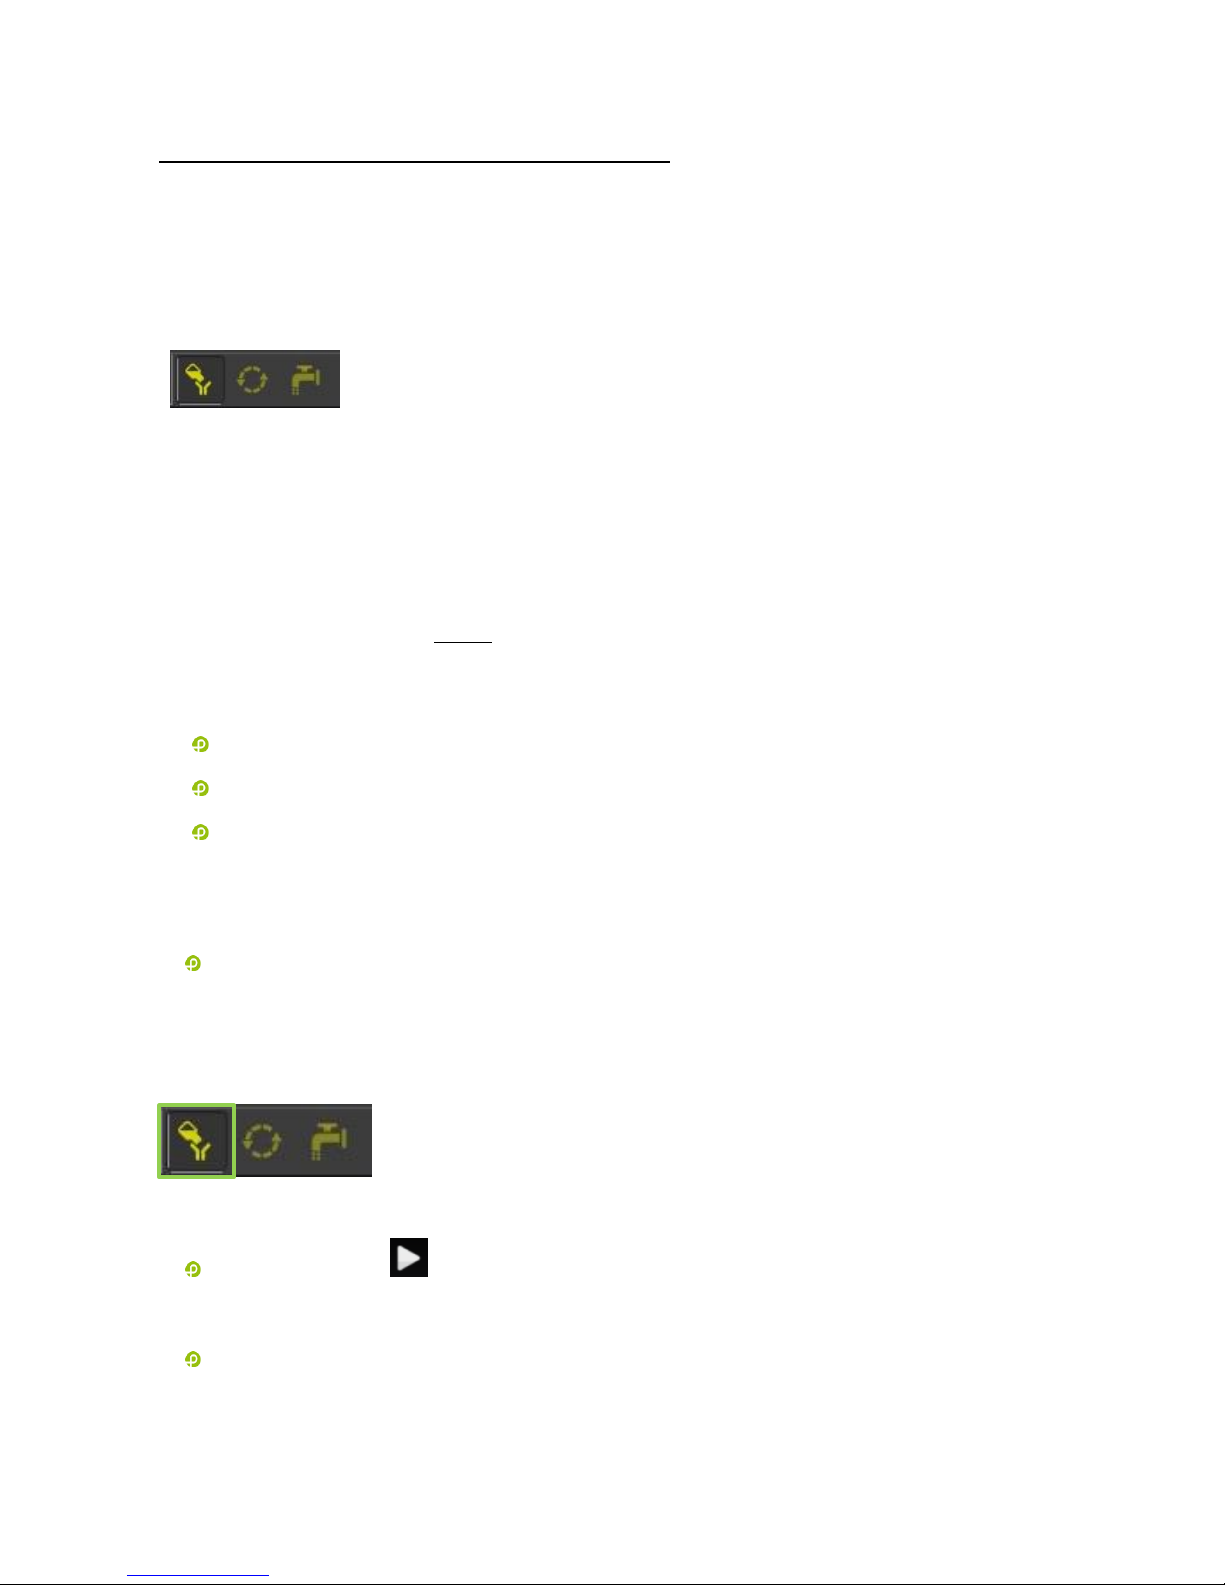
There are 3 different possible modes available: The “PRIME” mode for a priming/initialization process, the
“WORK” mode for measurements and the “CLEAN” mode for cleaning of the system.
Prime, Work and Clean mode
Priming / Initialization process
There is a PRIME mode available as a Start Up process for the CUBE instrument. This process includes
cleaning, filling the tubes with sheath fluid and control of the instrument set up. If a new original CFG-file will
be loaded the PRIME mode is always selected. User defined configuration files can start in PRIME or
WORK mode, depend on the status during saving.
In the following cases the PRIME mode should be performed:
Starting the instrument for the first time → Daily initialization
After the Sheath-fluid bottle was filled
As Trouble-Shooting procedure (no/bad signals, blocking, etc.)
To start the priming/initialization process, please follow the instructions below:
Open a configuration file and select the initialization modus by clicking on the Initialization batch
symbol (Partec Master Cfg-file: Prime mode is preset).
If you will perform the daily check-up please select the “Calibration Beads” configuration-file. Only in
this configuration file you will find the correct settings for the calibration beads. These settings are
crucial for a correct verification of the instrument performance.
Initialization batch, Work batch and Clean batch
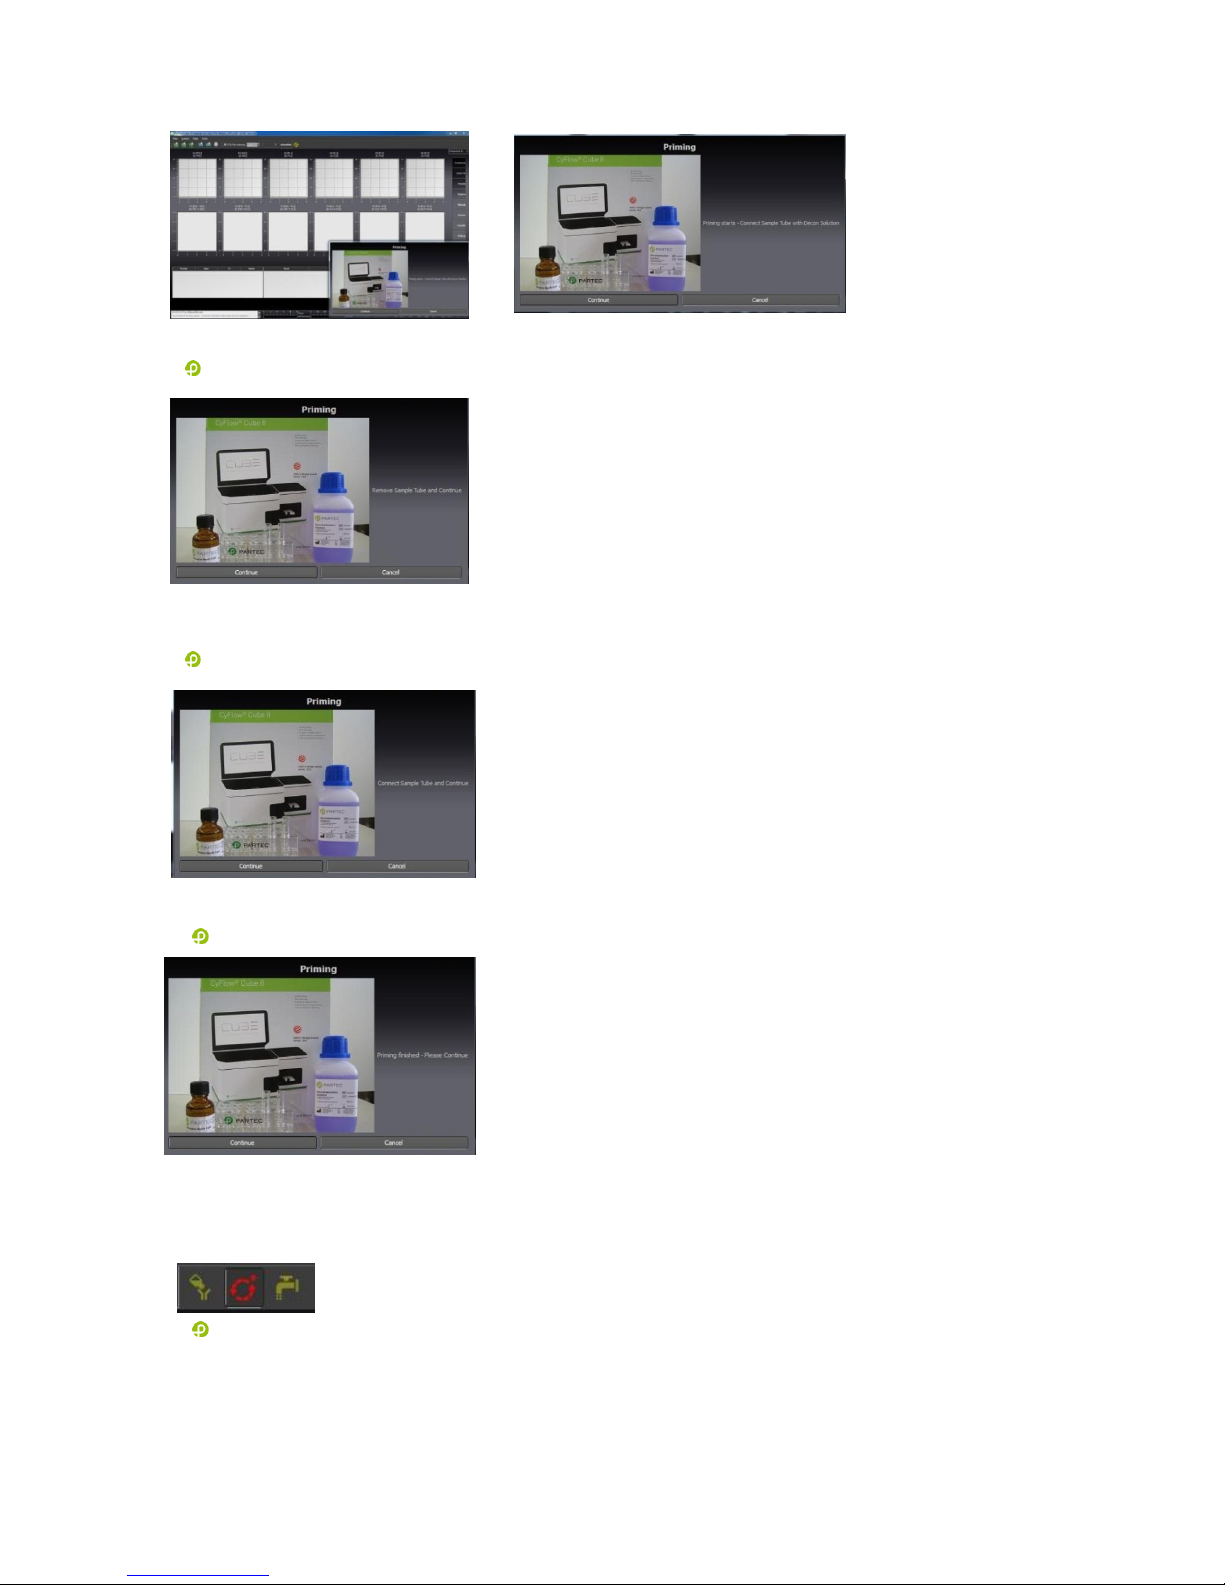
After pressing Start the system will start the priming process automatically and guide through
the program.
Connect a sample tube with Decontamination Solution (violet solution, Order No. 04-4010), press
“Continue” and wait until the system finished.
Page 21
CyFlow® Cube Instrument Operating Manual
Rev-05_2014-01-31
21/40
Remove the Sample tube, press “Continue” and wait until the system has finished.
Connect the Sample tube again, press “Continue” and wait until the system has finished
At the end press “Continue”. The instrument will be cleaned and the Priming process ends.
Switch to “WORK” batch
Page 22
CyFlow® Cube 8 - Instrument Operating Manual
Rev-05_2014-01-31
22/40
Work process
Choose the work batch for measure and acquire of data.
Shut down process
For the Cleaning of the Sample port a separate cleaning mode is available. The detail procedure would be
the following.
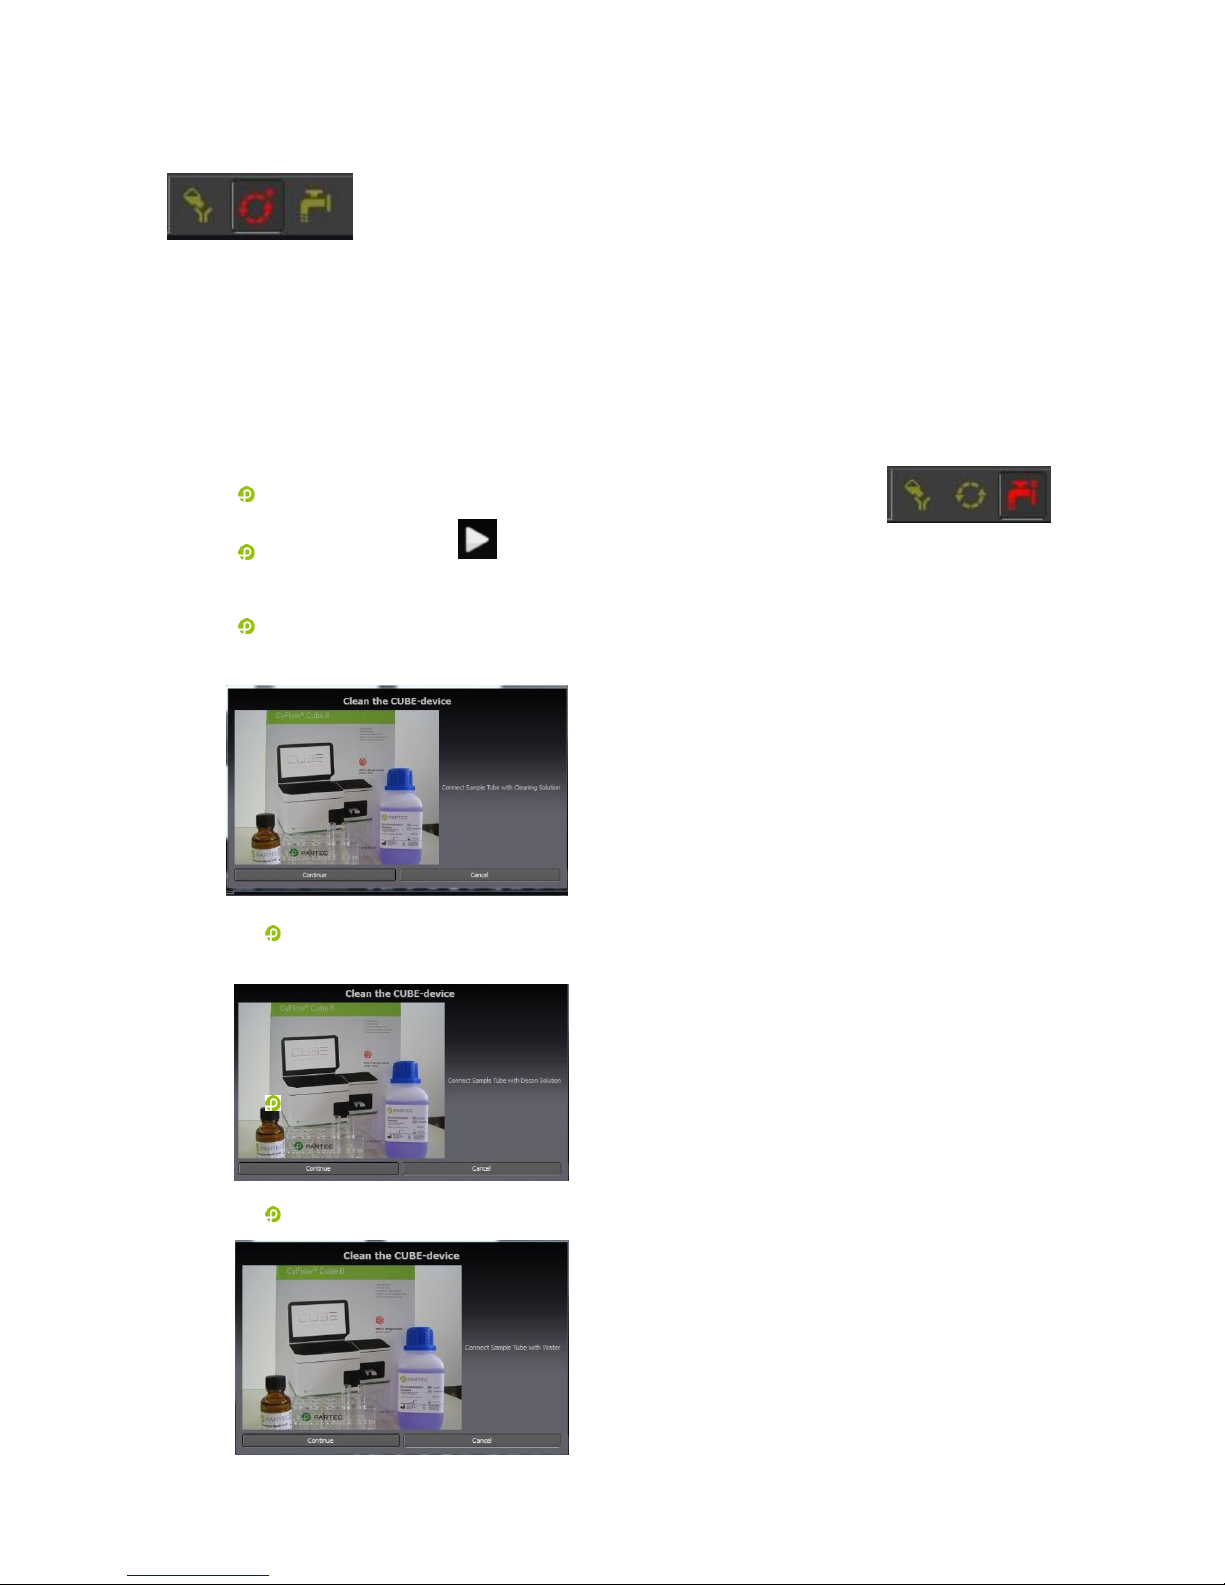
Select the “CLEAN” batch by clicking on the “CLEAN” batch symbol
After pressing Start the system will start the priming process
automatically and guide through the program.
Connect a sample tube with cleaning solution (green solution, Order No. 04-4009 ) and press
“Continue”
Connect a sample tube with decontamination solution (violet solution, Order No. 04-4010) and
press “Continue”
Connect a sample tube with sheath fluid (Order No.04-4007) and press “Continue”
Page 23
CyFlow® Cube Instrument Operating Manual
Rev-05_2014-01-31
23/40
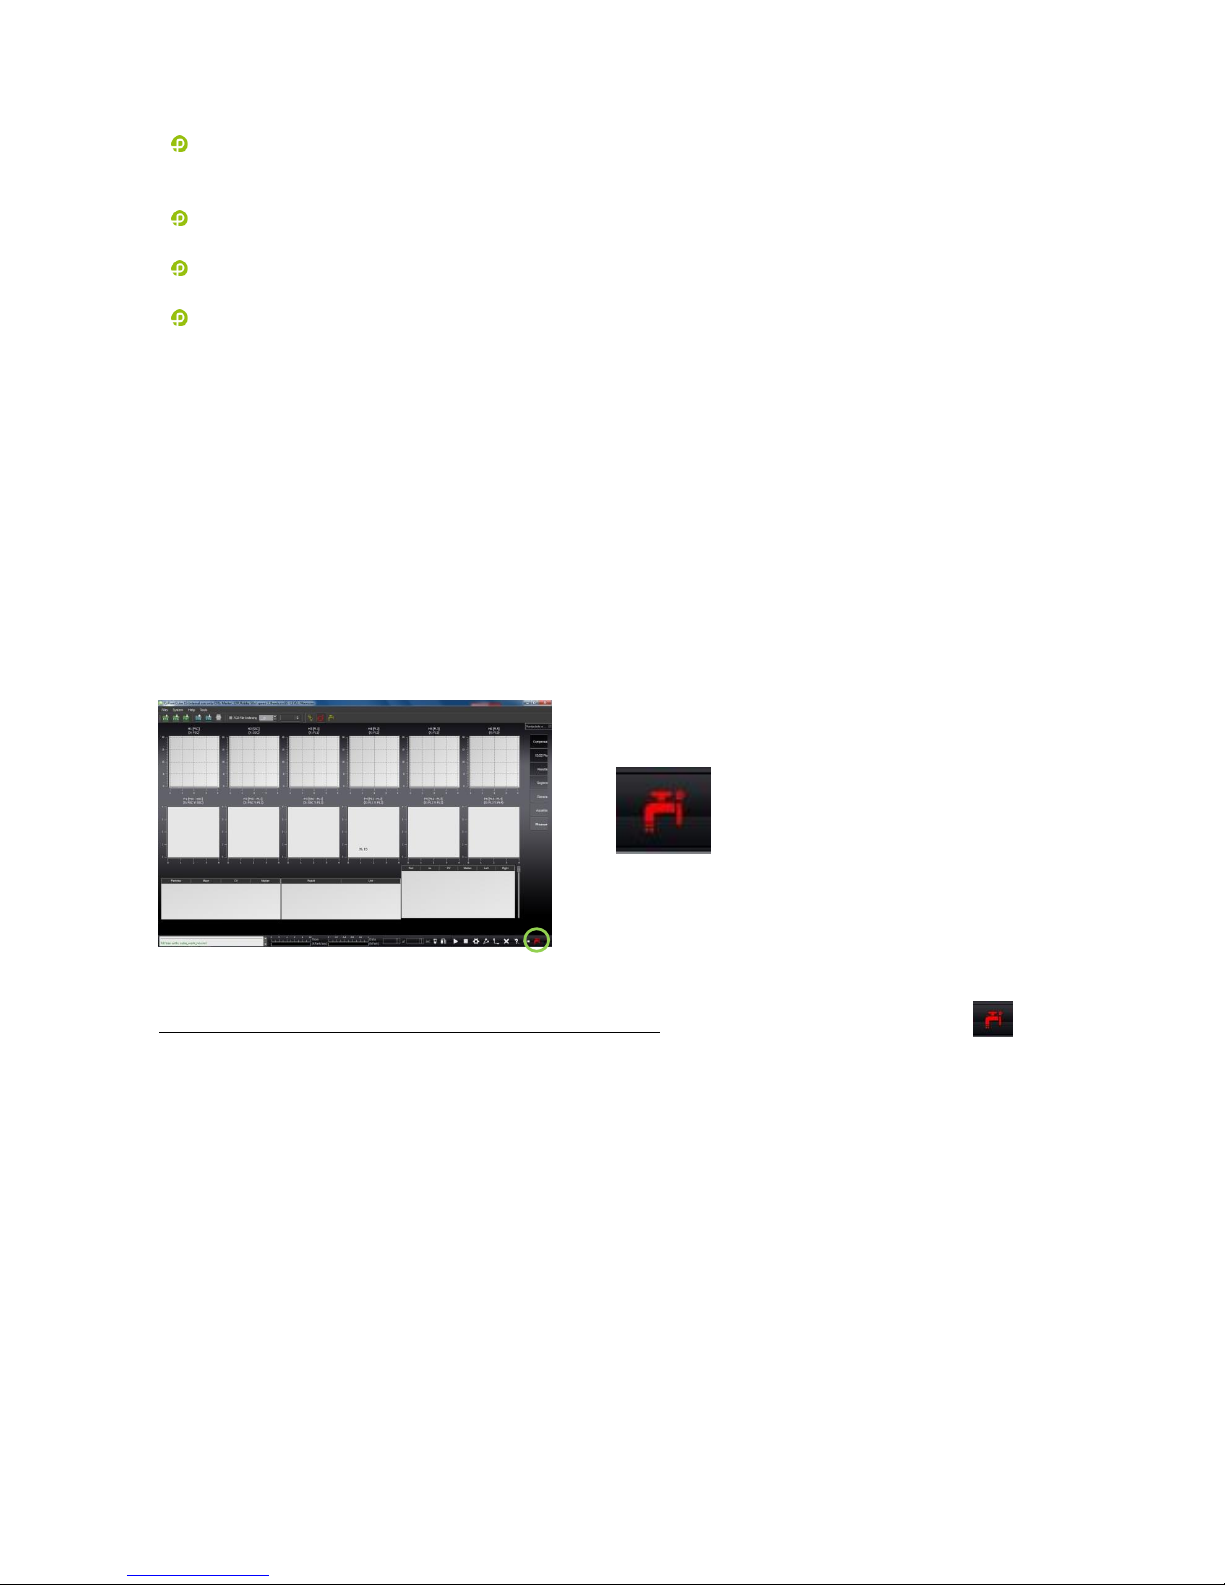
After finishing the cleaning process CyViewTM will be shut down automatically.
Laser sources will also be switched off.
Switch off the PC
Close Windows (Start – Exit- Switch Computer Off)
To power off completely, use the main power switch at the back panel
Intermediate cleaning process
The Cube can be cleaned between sets of samples using cleaning solution (green solution, Order No 04-
4009) followed by a sample tube with sheath fluid. This procedures will allow you to reduce significantly the
cross contamination and reduce the background.
For this procedure, connect a sample tube with cleaning solution and clean the instrument by clicking on
the “Clean” symbol.
The instrument will perform one cleaning cycle. Repeat the procedure with a sample tube filled with sheath
fluid.
Please notice the differences between the clean-modes. If you choose the Clean-symbol
display at right lower corner, the system performs one cleaning cycle. In contrast to the Clean-symbol
display in the upper part, if this symbol will be select the complete shutdown process will be performed.
Sheath and Waste bottle
The waste bottle content must be discarded accordingly to the relevant biohazard regulations.
A regular thorough cleaning of the sheath fluid bottle and exchange of the yellow filter will keep the
background in the measurements to a minimum level.
Sheath bottle can be cleaned with Sheath fluid or hypochlorite solution 0.5% (Order No. 04-4012)
Page 24
CyFlow® Cube 8 - Instrument Operating Manual
Rev-05_2014-01-31
24/40
Measurement parameters
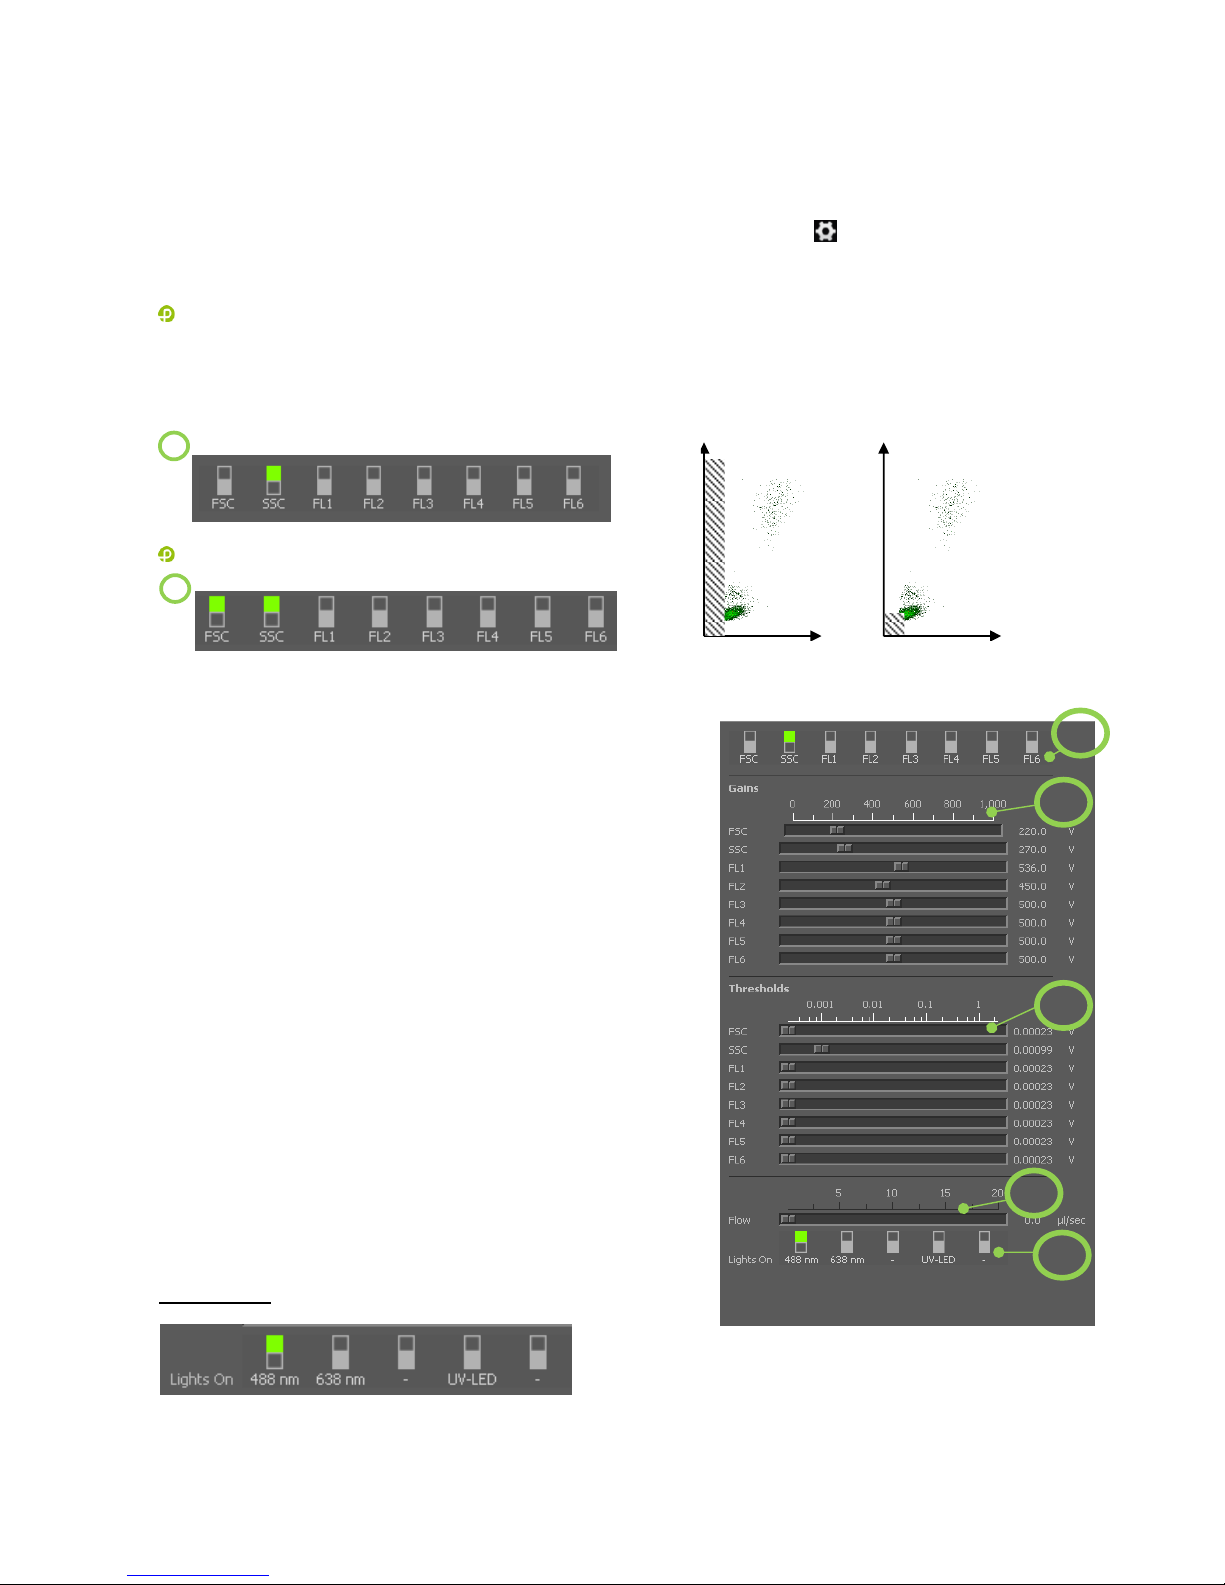
The Acquisition register can be opened by clicking on the button Meas ( ) Gains settings
Trigger properties (P)
Single trigger:
The trigger is the parameter defining if a signal gets recorded. Only if the trigger parameter detects a
signal, other parameters of the system will record signals. In other words, if a trigger is set in FSC to
record only bigger particles (e.g. threshold set at 0.3871V with a gain value of 170V), e.g. only intact
mammalian cells will be acquired. Cell debris and smaller particles will be excluded as long as their
FSC signal remains below the trigger threshold.
Multiple trigger:
The option allows to use multiple trigger parameters
Example of single (1) and multiple
trigger (2) in SSC, and FSC+SSC.
The GAIN (G) and THRESHOLD (T) sliders must be adjusted to
obtain the optimal gain (maximum signal and minimum
background). Typically, the Forward Scatter (FSC) will be the first
gain tuned to adjust the size of the studied particles.
To move a slider, click mouse left on the slider, keep mouse
button down and move mouse left –right or use the scroll wheel
to adjust the value.
Threshold settings (T)
The threshold allows cutting off background by setting a lower
limit of the acquired data in the trigger parameter. This tool allows
to increase the accuracy and precision of the acquired data.
Flow speed (S)
This slider allows to change the sample injection speed into the
flow cuvette. Low speed values result in a better precision and
accuracy. A higher speed can be used when the particle
concentration is measured and accuracy is of lower relevance
Light source (L)
This option allows to switch on/off the light sources.
Please notice Laser needs a few minutes before active.
1
2
Page 25
CyFlow® Cube Instrument Operating Manual
Rev-05_2014-01-31
25/40
1D/2D Plot properties
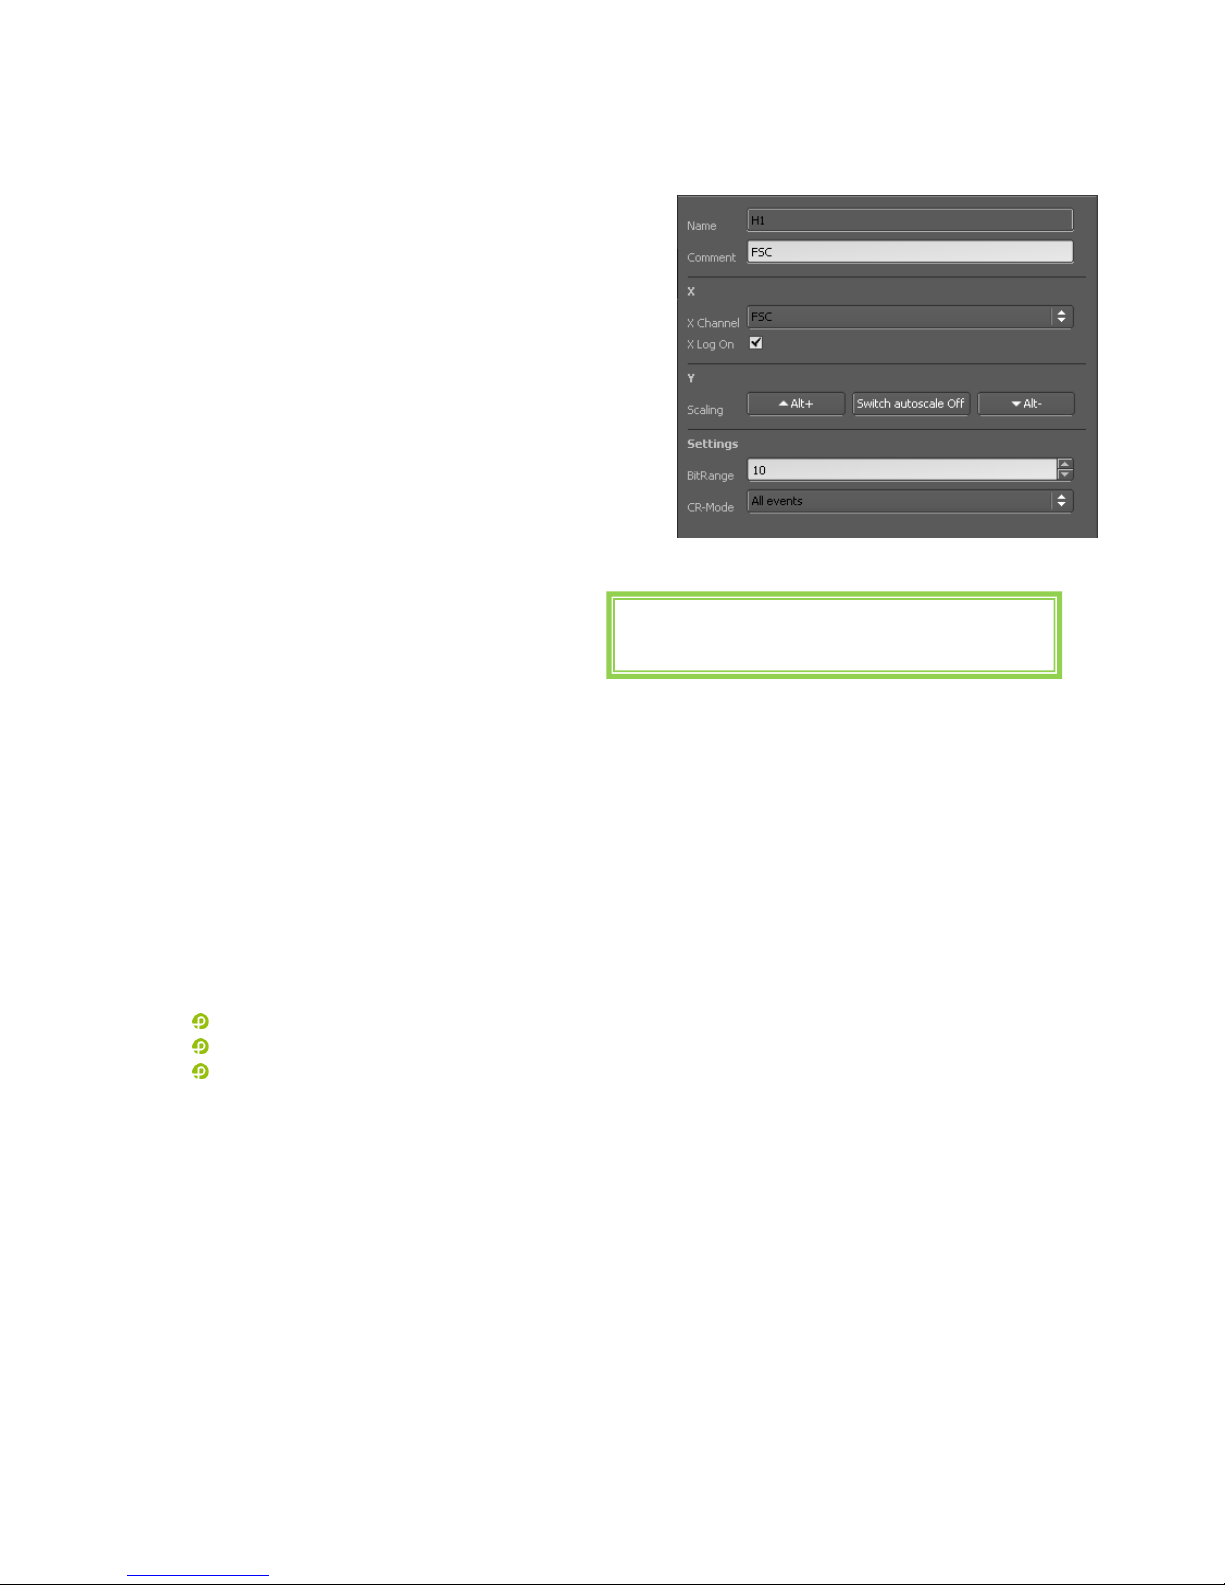
Plot name
A default plot name (Hx, Px) is defined in the file. Default
names of the Parameters will be displayed. The user can
modify for each plot the parameter name (line comment)
enter a name better matching the experiment.
X Log On/Y Log On
This option will allow the user to change the plot’s scaling.
Note that changing the scale will require you to adapt the
gains of the PMTs!
Erosion levels
The erosion level will set a threshold on the data displayed
(not the acquired data). Some of the low frequency points
will not be displayed allowing a better visual discrimination of the higher frequency data (signal against
background).
To obtain the properties of a plot area, press the
Ctrl + right click on the plot.
X/Y Channel
The displayed parameters can be chosen from the drop down menu; giving the user the list of the activated
parameters.
BitRange
The values are ranging from 6 to 12. It sets the channel resolution from 6bit (64channels) up to 12bit
(4096channels).
CR-Mode
This option allows selecting the part of the data wants to be displayed:
All events
Region only
Color gating
Page 26
CyFlow® Cube 8 - Instrument Operating Manual
Rev-05_2014-01-31
26/40
Region/ROI properties
Create a polygonal region
Double left click on the plot where the gate/region is required, a first point will be
set; a second click will set a further point, and so on. Label as many points as
required with the left mouse button. To close the gate surface, click mouse right.
Region properties
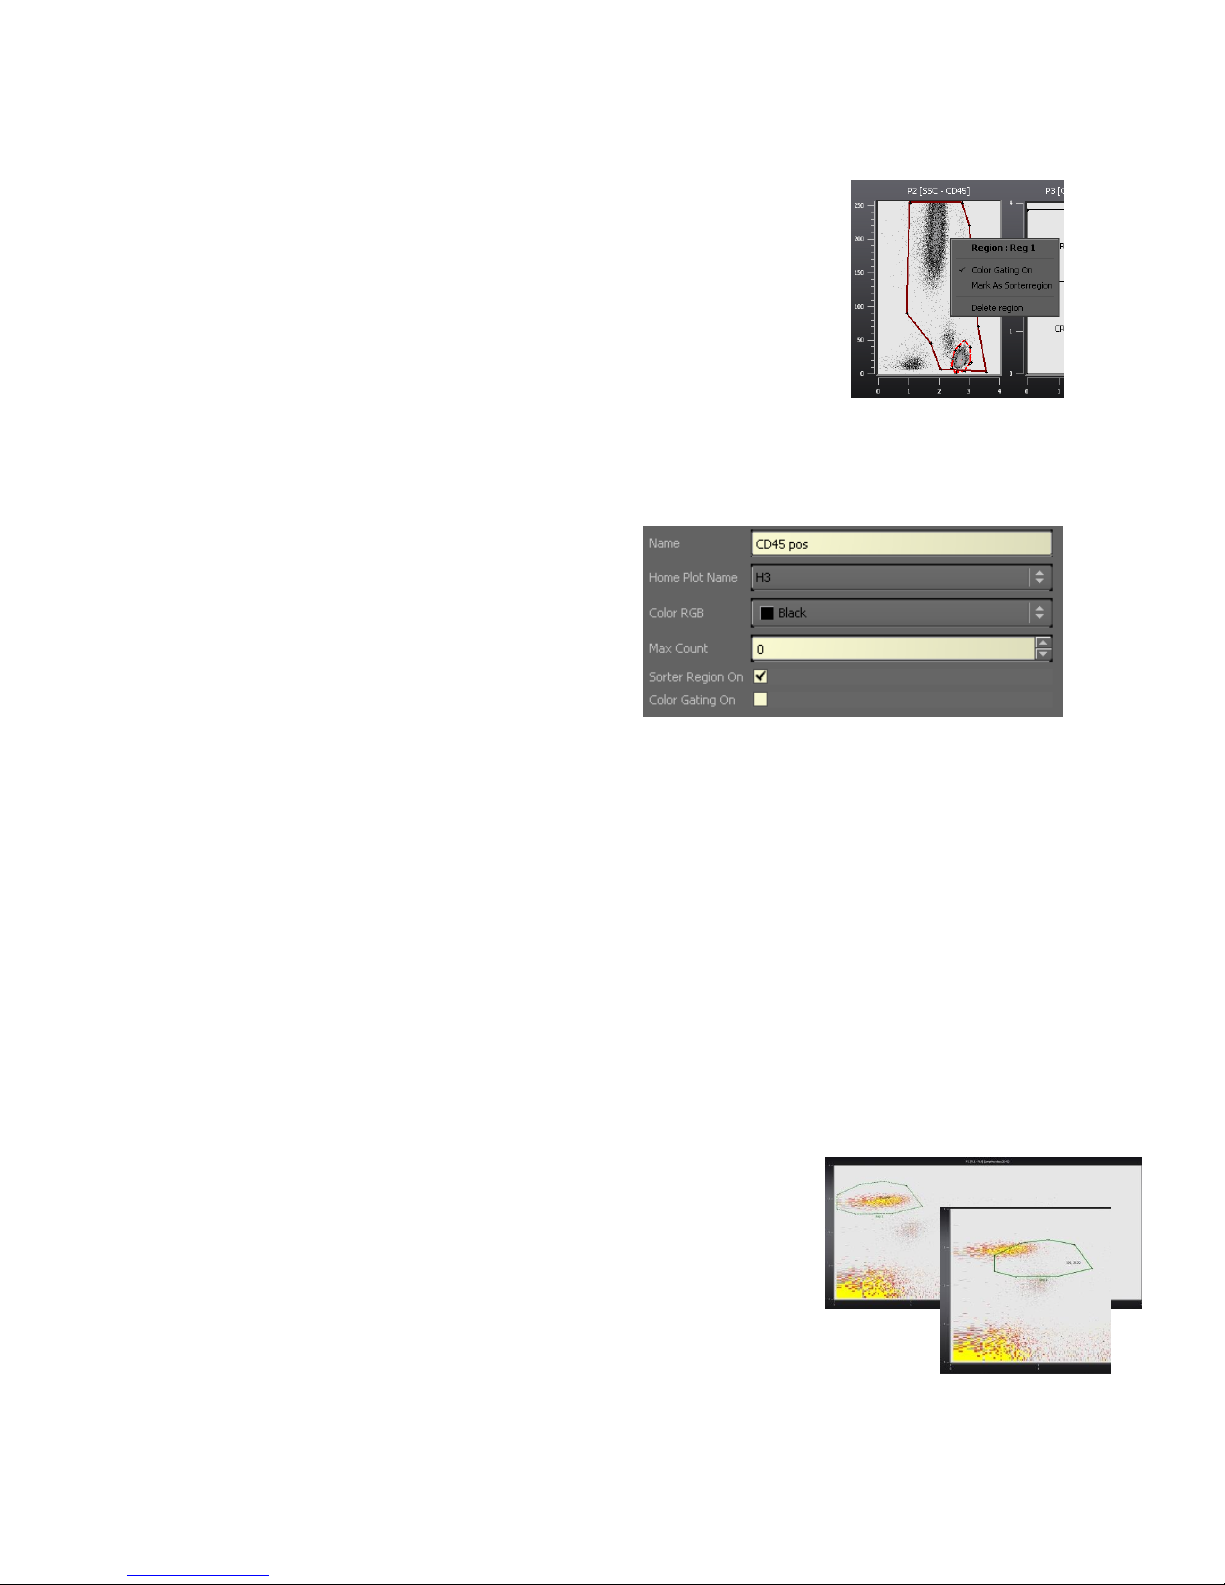
To access the region property, Alt+right-click on the gate to edited. On the PLOTS register on the right of
the screen a selection of region options is displayed.
Region name
As default, the gate will be named: region nx,
successive region: region nx+1
The user can also define a name. Remember to
validate by Accept before to move to another region.
Home Plot name
This defines the physical plot where the region is
located.
Color RGB
Allows to choose the color of the region. This color will be reported to each plot selected as color gating
only.
Max count
This option allows fixing the maximum number of events from a particular ROI (Region Of Interest) to be
analysed (see CyView™ 8 FILE register).
Sorter region
To set the ROI/region as a sorting gate, just by selecting the box.
(This option is only available on the Cube equipped with Sorter flow cuvette).
Moving of regions within a histogram
Move the cursor into the region and keep the left mouse button pressed while
moving the position. Individual points of a region can be changed by
approaching with the cursor to the point and keep the left mouse button
pressed during movement. Regions within a dotplot can be changed in size
by selecting the region with the cursor and pressing the “Shift” button during
cursor movement
Each region can be selected with the right mouse button for deletion.
Page 27
CyFlow® Cube Instrument Operating Manual
Rev-05_2014-01-31
27/40
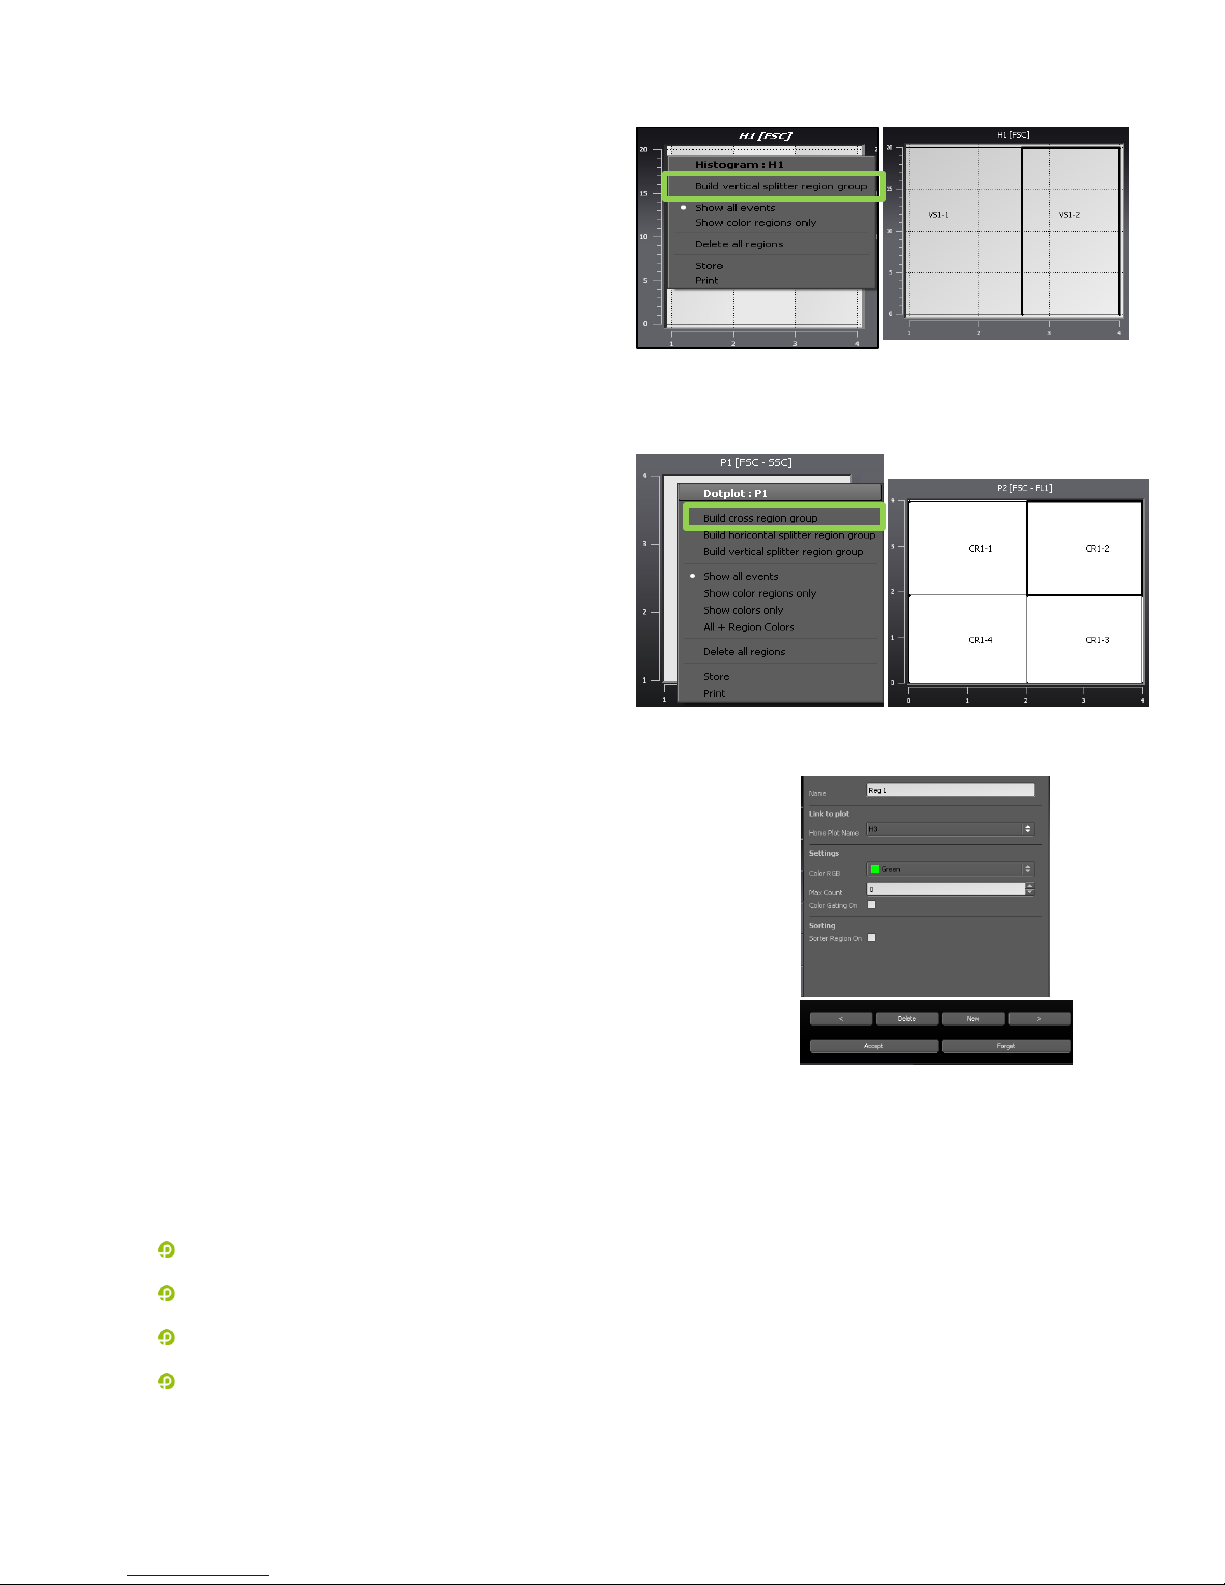
Create a vertical or horizontal histogram splitter
To create a vertical or horizontal histogram splitter
please move the cursor into the histogram and press
the right mouse button. Select “Built vertical splitter
region group” / “Built horizontal splitter region
group” to divide the histogram into two sections (VS1-
1 and VS1-2). The intersection can be modified by
moving the cursor into the plot and keeping the left
mouse button pressed.
Create a quadrant assembly
To create a quadrant assembly within a dotplot, move
the cursor into the dotplot and press the right mouse
button. Select “Built cross region group” to divide
the dotplot into four sections (CR1-1, CR1-2, CR1-3
and CR1-4). To change the quadrants move the cursor
into the dotplot and keep the left mouse button
pressed. To create asymmetric quadrants please
approach individual points (at the border of the dotplot
or at the intersection point of the quadrants) with the
left mouse button and keep the left mouse button
pressed.
Change layout for regions
In the register chart file select “Regions”. Individual regions can be
selected with the <> arrows. Regions can be transferred to other plots by
the function “Home plot name” or modified in their color with “Color RGB”.
To activate changes press “Accept”.
Applying regions to other plots Gating Function
Clicking into any histogram or plot with the right mouse button (outside a region area) allows to select any
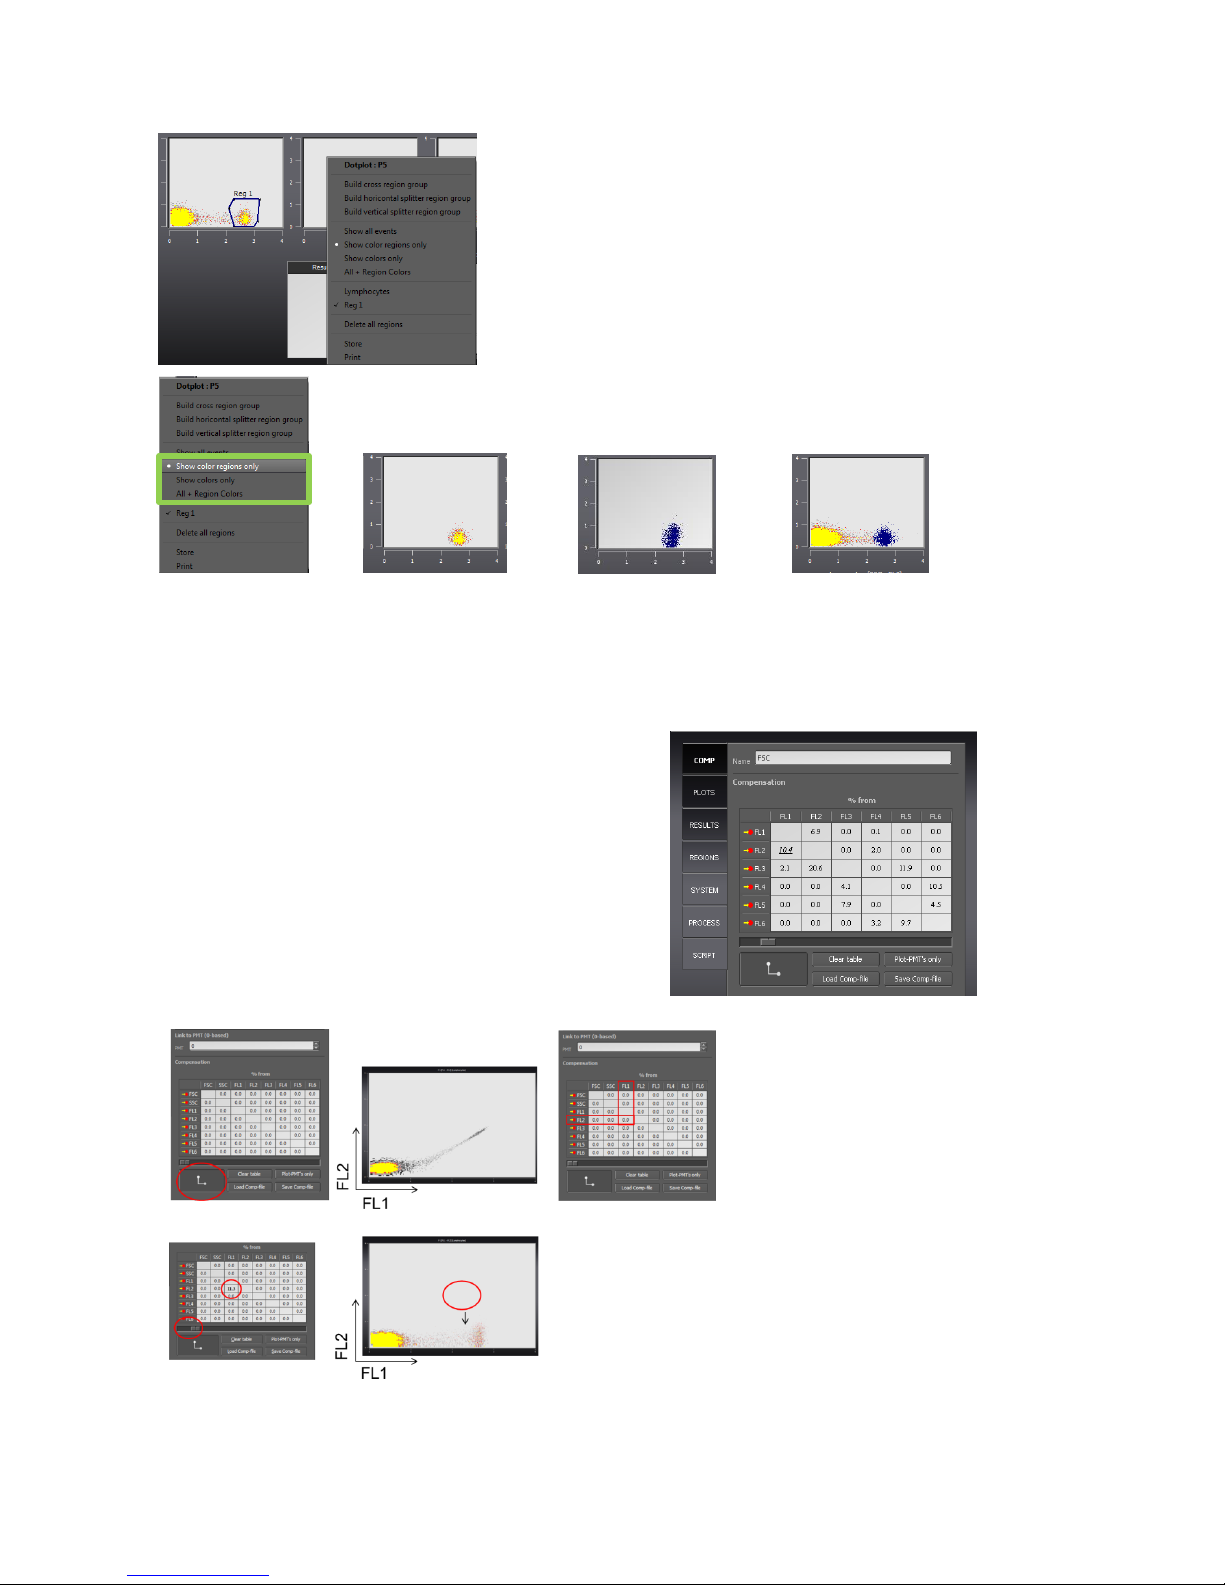
existing region (Reg1-Regx) which is labeled with “Color gating on”. Display options are:
Show all events shows all events in pseudo 3D color
Show color regions only shows the events in the selected region(s) in pseudo 3D color
Show colors only shows the events in the selected region(s) in the region color
All + Region colors shows the events in the selected region(s) in color together with all events in
pseudo 3D color
Page 28
CyFlow® Cube 8 - Instrument Operating Manual
Rev-05_2014-01-31
28/40
Show colors regions only Show colors only All + Region Colors
Compensation
Press Compensation button to open the compensation
Compensation:
Select a parameter combination to compensate.
Use the slide bar to set the compensation.
Clear/Save and Load Compensation
Confirm by clicking Accept
Example of a color-crosstalk compensation of FL1 into FL2.
Page 29
CyFlow® Cube Instrument Operating Manual
Rev-05_2014-01-31
29/40
Typical Sample Analysis
A step by step procedure and what are the important steps in the data acquisition.
Starting a measurement
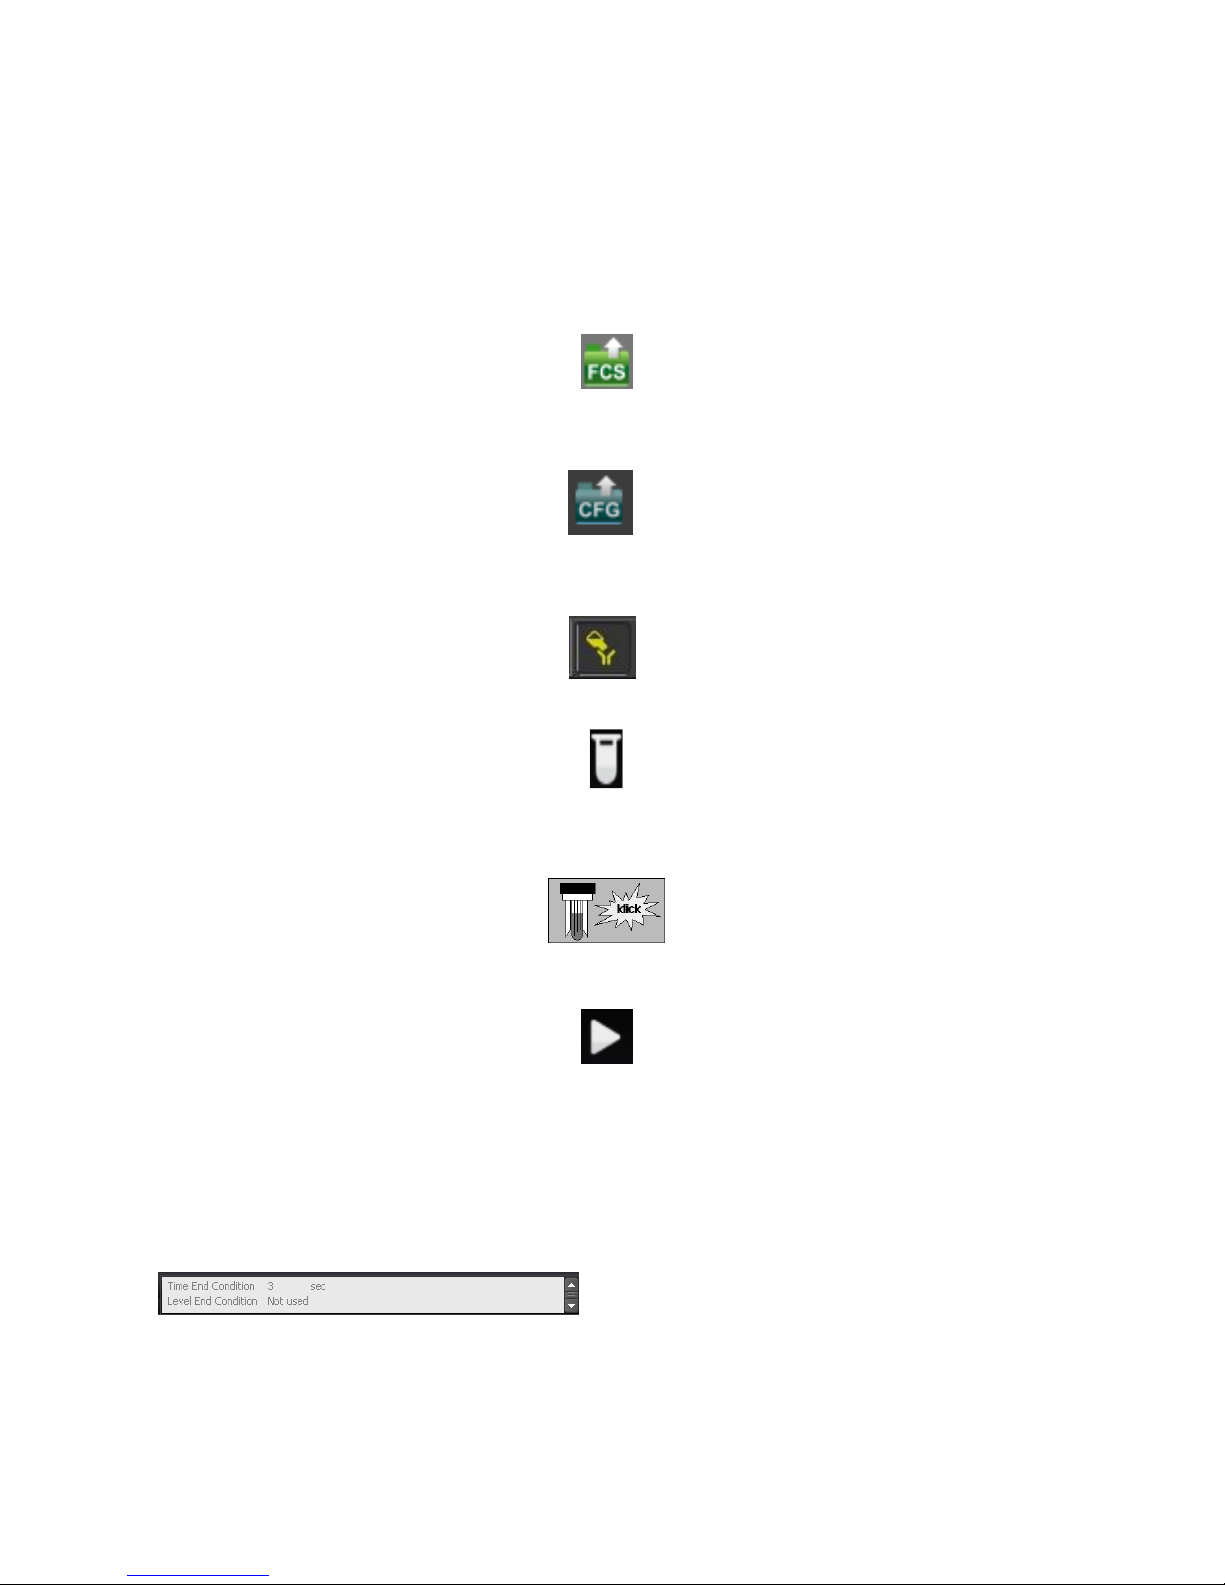
Load a sample demo file (data files can be selected from the folder:
The respective instrument settings are automatically loaded.
Or
Load a CFG-file, saved instrument settings will be load.
Perform PRIME process
Fill a sample tube with 1.2 ml of your sample. Check the tube for eventual imperfection or contaminants
(cracks, aggregates, hair) and replace or remove, resp. if necessary.
Insert the tube into the sample port, push it up until a distinct click is heard
Press the start button. In the console window, information on the status of the measurement is displayed.
The following work is proceeding step by step.
CyView™StartPrerun
Prerun and stabilization of sample flow
Start Measure
Data acquisition
Console displaying control board status
Page 30
CyFlow® Cube 8 - Instrument Operating Manual
Rev-05_2014-01-31
30/40
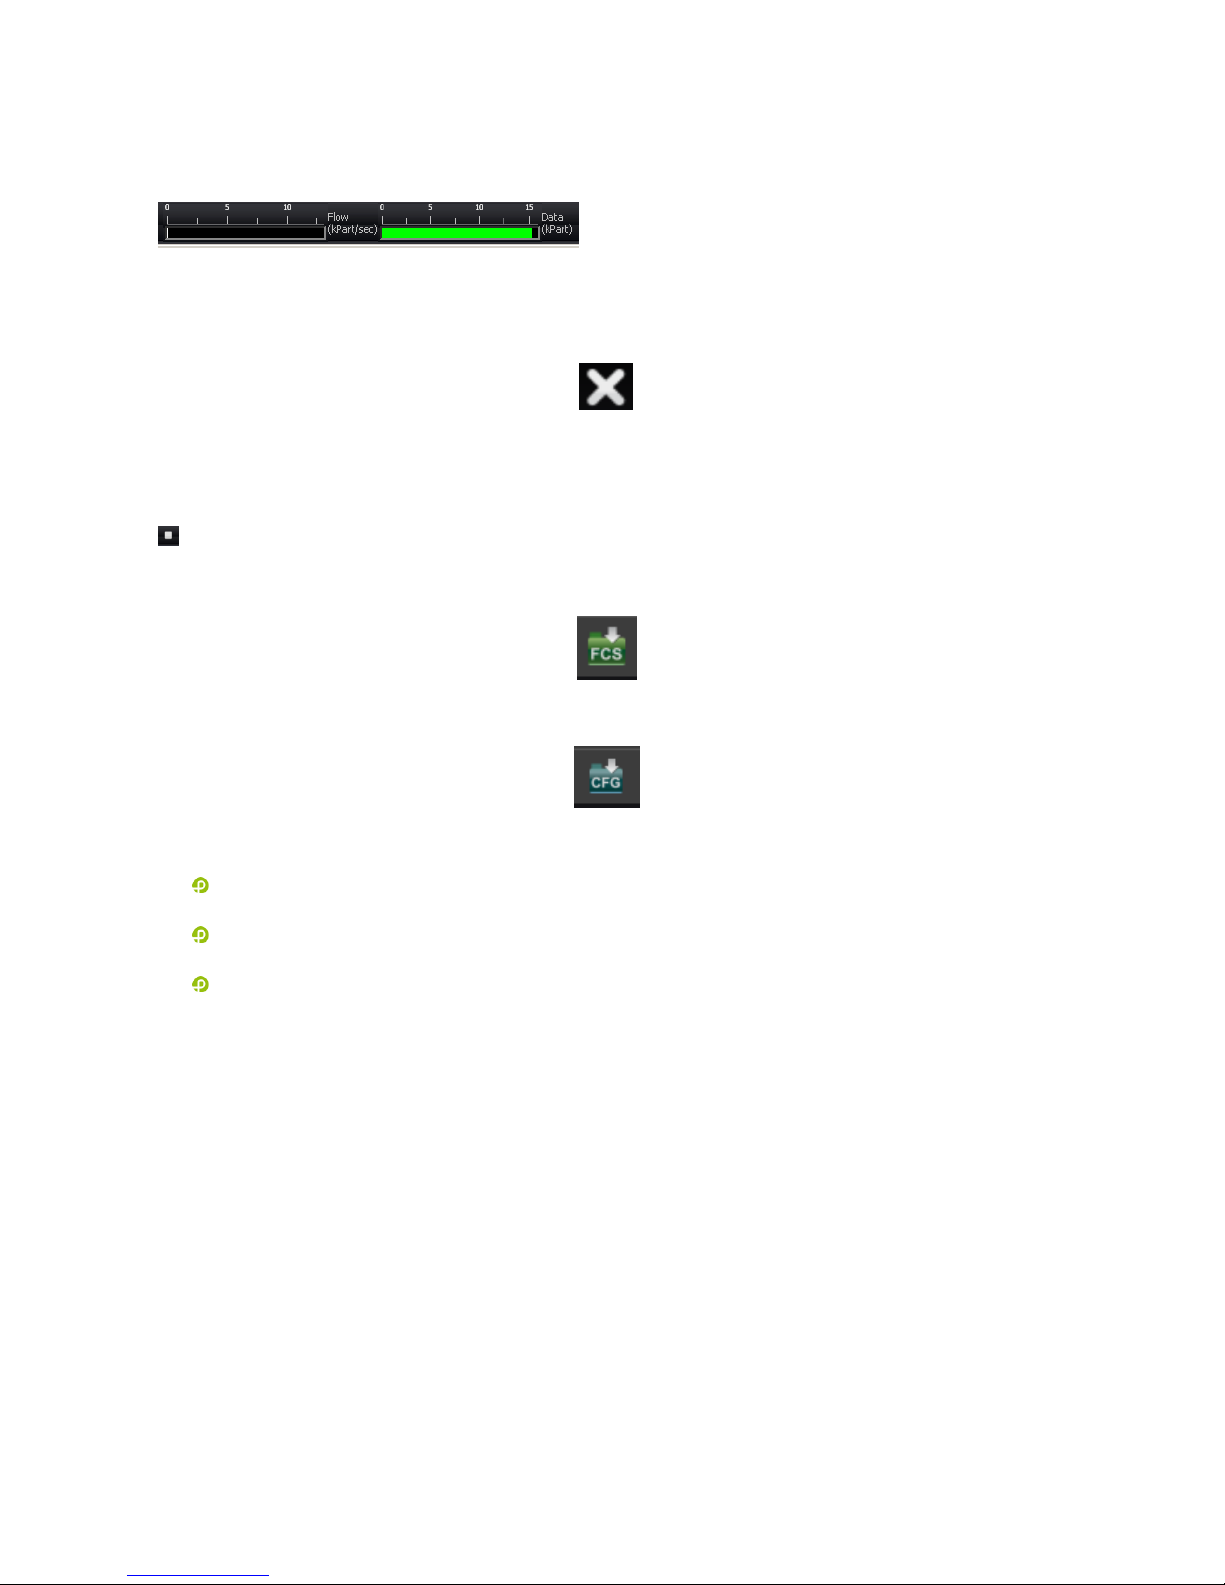
During the data acquisition the total particle count and the analysis rate is indicated on the real-time count
meters
During the acquisition (Pre-Measure) phase it is possible to manipulate the instruments set-up e.g. by
changing samples speed, PMT voltage and threshold levels. Use CLEAR button to erase data after
manipulations of the instruments set-up or “Space” at the keyboard
.
By default, the continuous measure mode is pre-selected. In this case the measurement will only stop
automatically when the sample is consumed. An earlier stop can be realized by pressing the STOP button
.
Data can be saved with
The configuration file can be saved with
Besides the Analyze all measure mode other measure modes can be selected:
Volumetric counting with electrodes
The volumetric counting is based on the electrode status
Volumetric counting with volume
A volume can be pre-selected
Cells in region
A particle number can be pre-selected
Page 31
CyFlow® Cube Instrument Operating Manual
Rev-05_2014-01-31
31/40
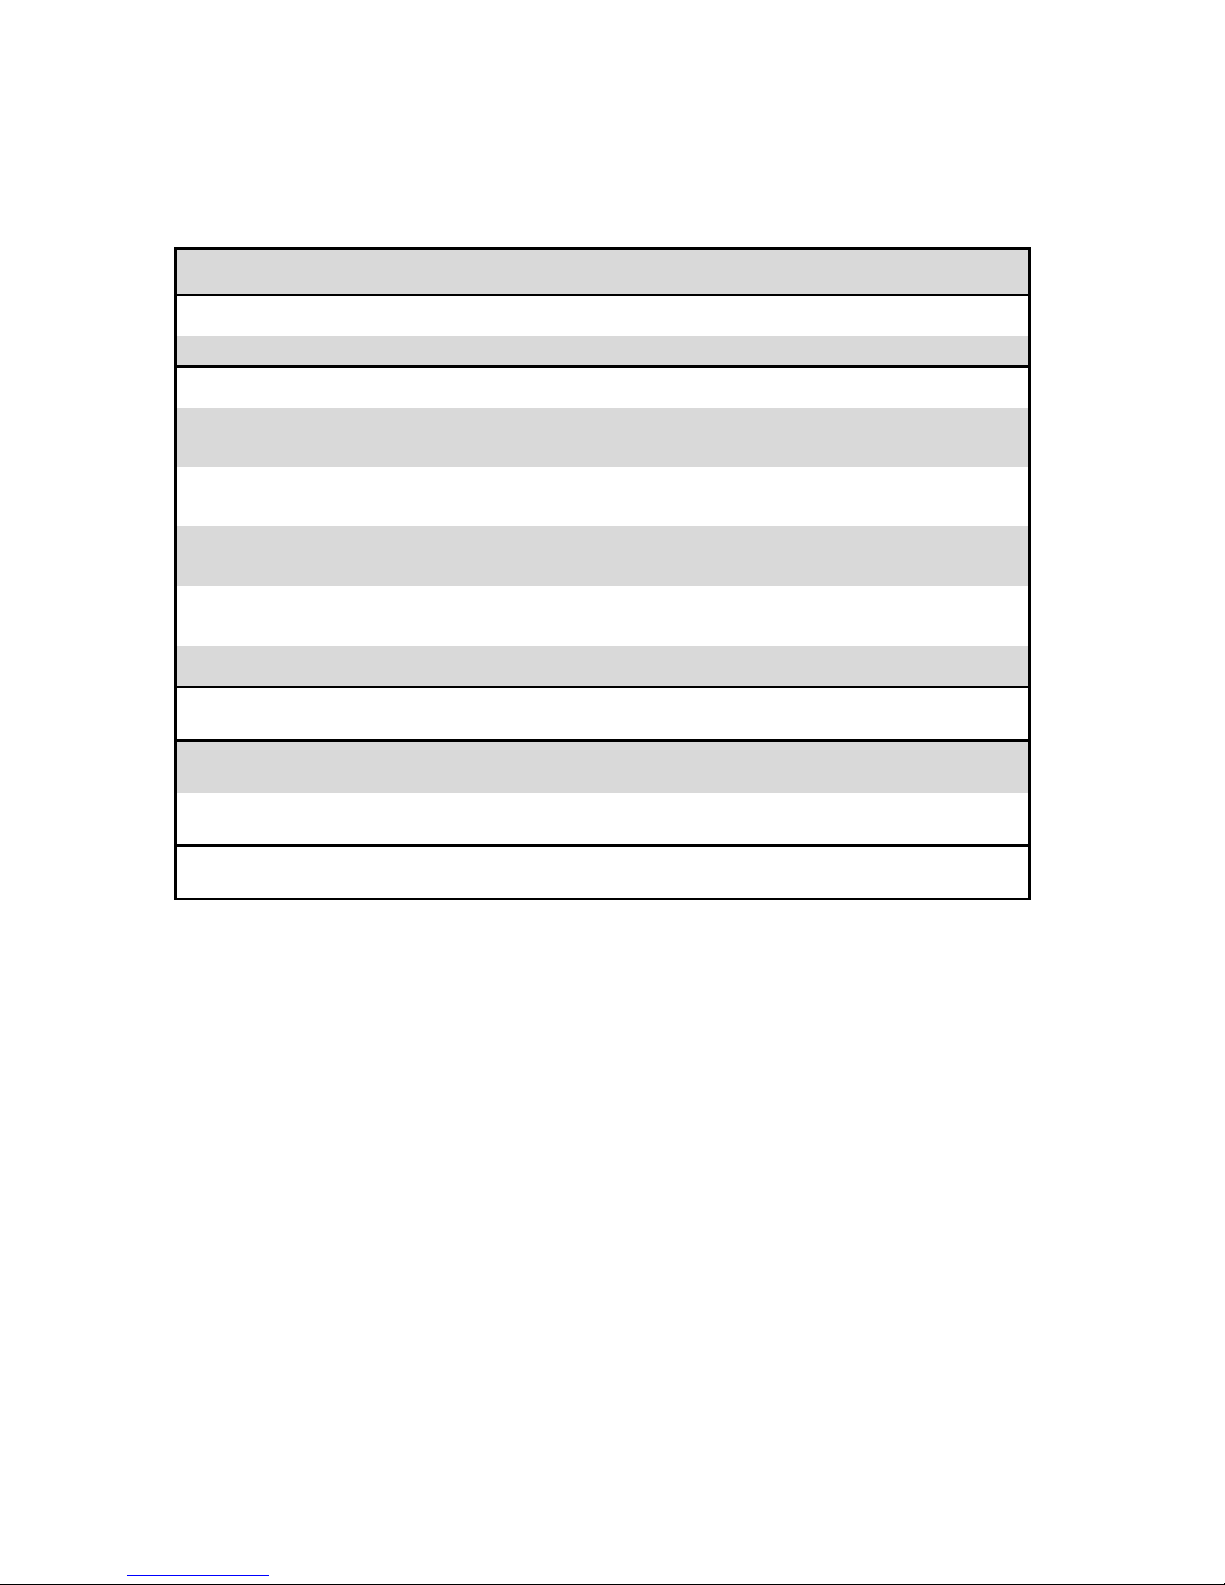
Keyboard/Mouse combinations
Context
Action
Effect
Graphic
Plot/Histogram
Alt + Mouse left-click
Opens Plot/Histogram (big) or close (small)
Create Region
Right Mouse-click
Ends creation of a region
Left Mouse-click
Sets dot of a region
click and hold left mouse
Moves a region in standard steps
Ctrl+
Moves a region in small steps
click and hold left mouse
Region
Shift+
Moves a region to the original position
click and hold left mouse
+Shift+Ctrl
Moves the region by addition of an interval to the
original position in very small steps
click and hold left mouse
click and hold left mouse
Move the regions name over 5 positions
(N,E,S,W,central)
+M
Right mouse +Alt
Opens mouse menu
Axis of a plot
Right mouse +Alt
Opens the Channel register
Plot
Right mouse +Alt
Opens Plot register
Left mouse +Alt
increased/decreased Plot
Region
Central mouse
Marks the region and moves it in all regionplots in
the visual area
Page 32
CyFlow® Cube 8 - Instrument Operating Manual
Rev-05_2014-01-31
32/40
Appendix
Biohazards
Please note: Strict guidelines, international, as well as national regulatory standards such as
PPE (personal protection equipment) must be met for all users. Therefore, the system is
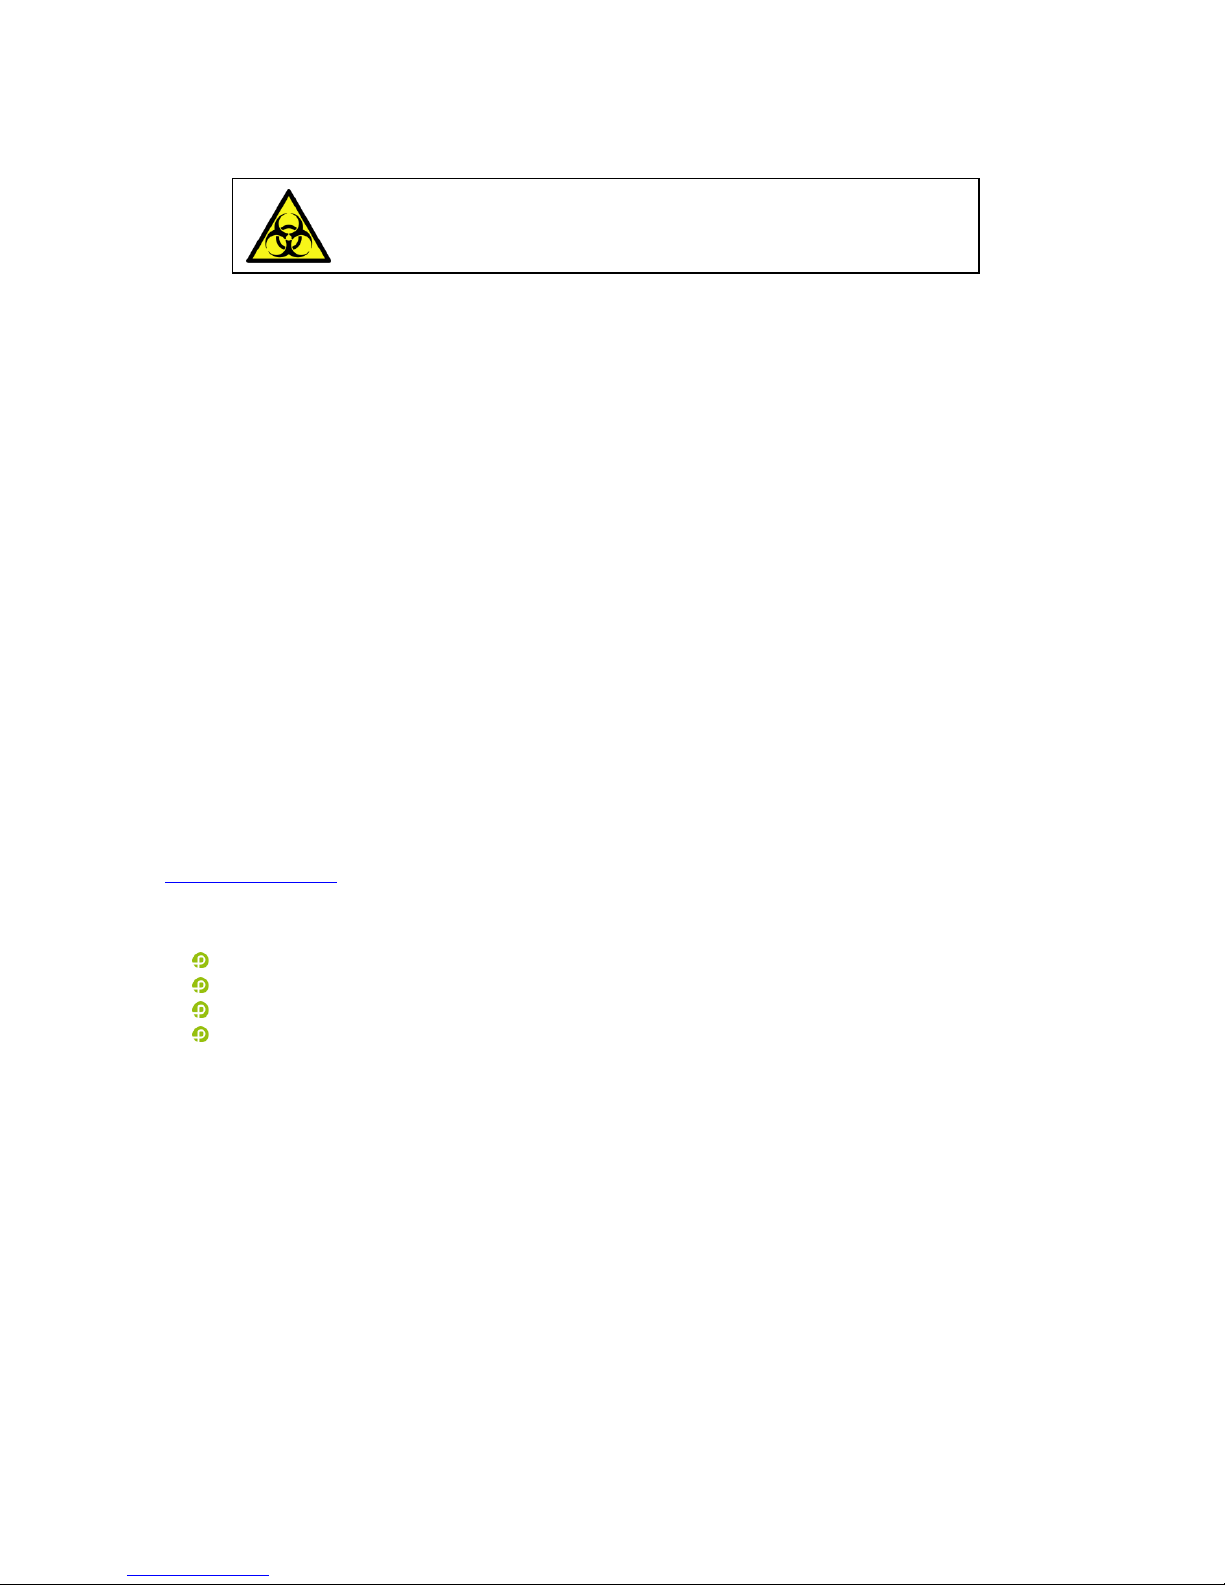
marked with the following biohazardlabel:
Warning: The Waste may contain biohazardous and carcinogenic
material from the samples (infectious material, dyes).
Warning: biohazards
Page 33
CyFlow® Cube Instrument Operating Manual
Rev-05_2014-01-31
33/40
Maintenance
Clean the CyFlow® Cube casing on a regular base carefully with soft cloth. Water must not enter the
CyFlow® Cube or peripheral devices or come into contact with electric connections and switches. For
cleaning the screen, always use special screen cleaner and soft cloth.
Do not use any organic solvents, nitro thinner, benzol, alcohol, highly concentrated bleach etc!
For cleaning of the flow cuvette, refer to the described cleaning procedure. Do not use tools to clean the
flow cuvette. In case the flow cuvette is blocked, enquire Partec for rapid exchange.
Regularly empty the waste bottle and clean with warm detergent solution and a brush.
Clean sheath reservoir with distilled water and a clean brush and flush with clean distilled water several
times.
Remember: a clean sheath fluid reservoir is critical for proper operation.
If the CyFlow® Cube will not be used for longer periods, clean flow system by using distilled water. Put a
sample tube half-way filled with distilled water at the sample port. Clean waste and sheath reservoir, wipe
top dry.
Service
All service is to be made from an authorized service engineer. Please contact your local supplier or Partec
([email protected]).
For further information, please consult our web site:
Products
Application tips
Instrument and software support
News and events
And much more ...
www.partec.com
Warning: The Waste may contain biohazardous and carcinogenic
material from the samples (infectious material, dyes).
Page 34
CyFlow® Cube 8 - Instrument Operating Manual
Rev-05_2014-01-31
34/40
Transport and Storage
For the transport of the system to a different location it will be necessary to disconnect all external data and
supply connections. In case of use with potentially bio-hazardous material, please see Partec standard
operating procedure (SOP) for decontamination. The system should be carried in upright position. During
transport or storage please take care that the system will be stored under the following conditions:
Temperature 5-50 C
Humidity 20-85 % relative (non-condensing)
Room Clean environment, no direct sun light
Disposal
In case of product disposal, please proceed according to the Partec standard operating procedure (SOP)
for decontamination.
After decontamination, the system has to be disposed according to the local regulations and laws.
For further information, please contact your local distributor or Partec.
Warning: The Waste may contain biohazardous and carcinogenic
material from the samples (infectious material, dyes).
Page 35
CyFlow® Cube Instrument Operating Manual
Rev-05_2014-01-31
35/40
Laser Safety
The CyFlow®Cube is a class I laser product according to the EN 60825-1:2007.
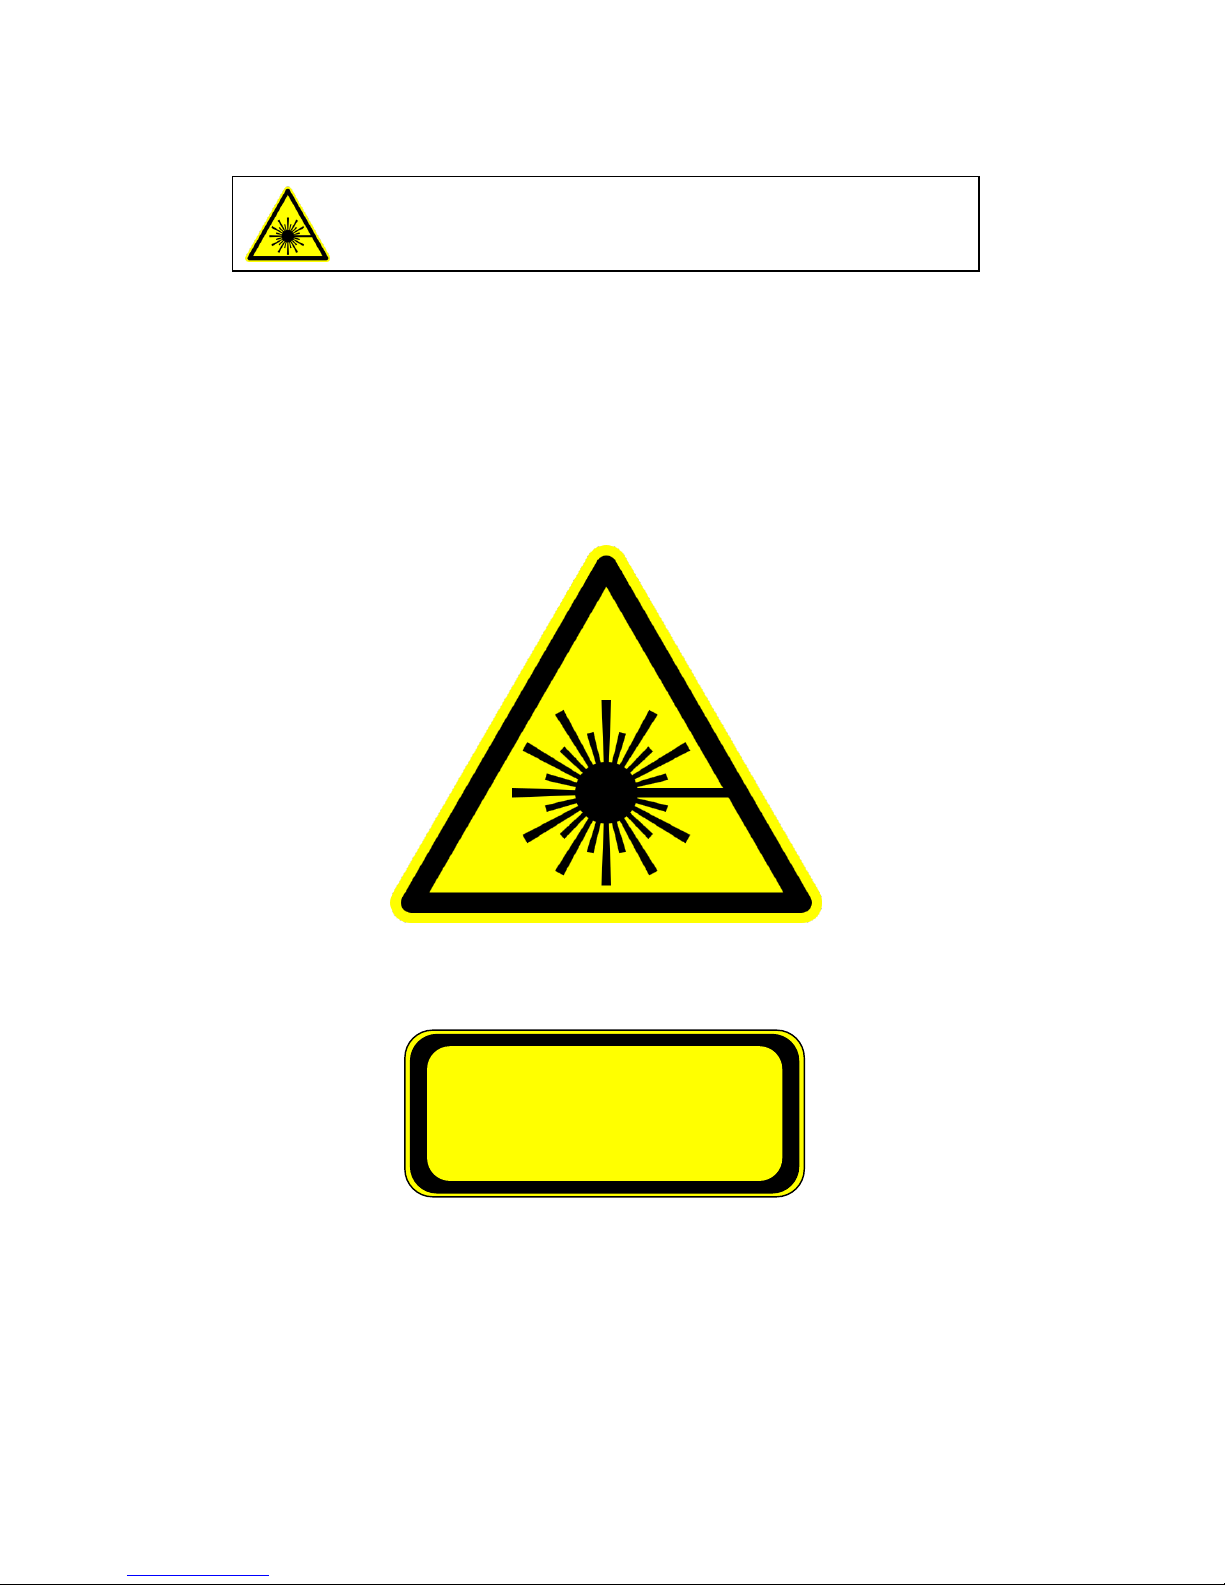
Please note: Laser light can be emitted if the housing of the device is damaged and the
protection cover for the laser beam is removed. Therefore, the system is marked
with the following laser safety labels:
Warning: It is prohibited to open the instrument as it is equipped
with a class 3b laser unit.
Warning: laser radiation
Attention
Laser radiation Class IIIb, if cover is
removed and shutter is opened
Additional Explanation
Page 36
CyFlow® Cube 8 - Instrument Operating Manual
Rev-05_2014-01-31
36/40
638 nm
488 nm
D6
FSC
D8
SSC
FL4
FL3
FL1
FL2
Technical Specifications
Note: Due to fast technological improvements, specifications herein are subject to change. For details,
please inquire information from your local supplier.
Optical Standard Setup
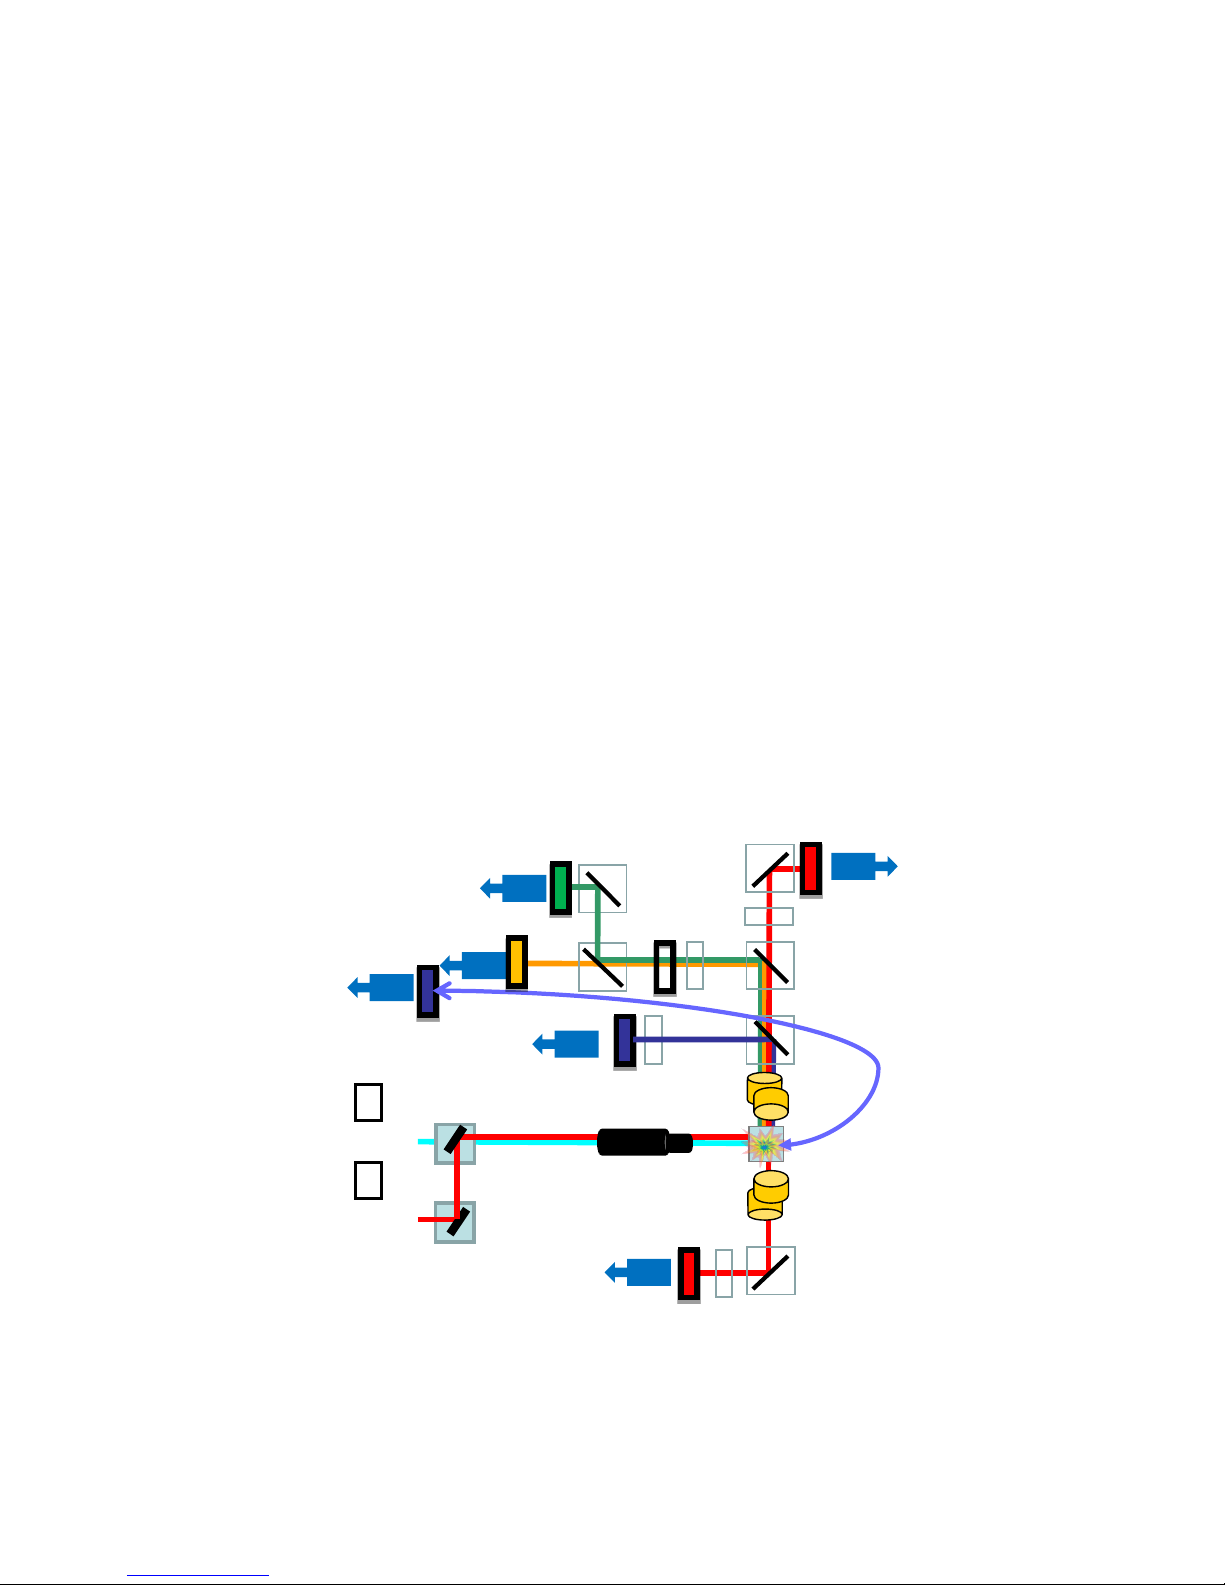
Optical bench of a CyFlow® Cube with 2 lasers and 6 parameters.
The Parameters
FSC: forward scatter
SSC: side scatter
FL1: green fluorescence
fluorescence origin: 488 nm laser (GFP)
FL2: orange fluorescence
fluorescence origin: 488 nm laser (PE)
FL3: blue fluorescence
fluorescence origin: UV-LED (DAPI)
FL4: red fluorescence
fluorescence origin: 638 nm laser (APC)
If required by a specific application, the optical
standard setup can be optimized by exchanging
preassembled removable mirror/filter blocks. This
is a matter of seconds and does not require any
re-adjustment.
The CyFlow® Cube flow cytometer can be
equipped with various light sources and up to
eight optical parameters. Depending on the
number of light sources and optical parameters
different optical benches are available.
Due to its modular concept the optical
configuration can be adopted to many different
clinical and scientific purposes. Standard
configurations are presented below:
Example: This instrument is equipped with a blue
diode pumped solid-state Laser (20 mW) at 488 nm,
a red laser diode (25mW) at 638 nm.
Page 37

CyFlow® Cube Instrument Operating Manual
Rev-05_2014-01-31
37/40
1. CyFlow®Cube System
Size Dimensions: 385 mm L x 282 mm D x 287 mm H ( 530 mm with
open display )
Weight appr.18 kg
Maximum sound <70 dBA
Power level 200 VA
Installation/overvoltage category 2/II
Degree of protection IP 20
Operating Environment Temperature: 15-30 C
Humidity: 20-85 % relative (non-condensing)
Room: Clean environment. Direct sun light should be avoided.
Applications Immunophenotyping, DNA Analysis, Ploidy Analysis, Apoptosis,
Microbiology, Industrial applications, 3 to 6 Color Analysis. True
volumetric absolute counts = counting per volume
True Volumetric Based on precise counting and mechanical fluid volume measurement
Absolute Counting No need for reference sample or beads
Instrument Check Partec Count Check Beads (Order No. 05-4010)
Partec Calibration Beads 1 µm (Order No. 05-4007)
Partec Calibration Beads 3 µm (Order No. 05-40018)
Partec DNA Control PI (Order No. 05-7303)
Partec DNA Control UV (Order No. 05-7302)
Set-up Time Max. 5 minutes
Parameters Up to 6 optical parameters: FSC, SSC, FL1, FL2, FL3, FL4
Particle Size Range 0.1 µm – 200 µm (standard cuvette)
Maximum Data 25,000 events/sec
Acquisition Stop Time Event- or volume-based
Trigger On all parameters, on multiple parameters or on single trigger
parameter, selectable in software
Data Resolution 65,536 channels (16 bit)
Service 1-3 year service contracts
Warranty 12 months on all parts except filters, mirrors, other quartz or glass
parts, disposables and cuvettes
Page 38

CyFlow® Cube 8 - Instrument Operating Manual
Rev-05_2014-01-31
38/40
The CyFlow®Cube System is a completely closed system not producing any aerosols during cellular
analysis.
2. CyFlow®Cube Optics
Laser / Output Red Diode Laser: 25 mW at 635 nm / 40 mW at 640 nm
Blue solid-state Laser: 20 mW at 488 nm
Detectors 1 to 6 (FSC, SSC, FL1, FL2, FL3, FL4)
Filters Standard setup and filters for all parameters according to laser configuration
Optical Coupling Standard objective mount with high numerical aperture objective, high numerical
aperture immersion gel coupling, e.g. for detection of weak cytokines (option)
Excitation Optics Elliptical 15 µm x 100 µm at 488 nm
Other beam geometries upon request
3. CyFlow®Cube Fluidics
Fluidic System Completely closed system for sheath water and sample volumes; no fluid droplets
or aerosols generated nor released from the instrument.
Flow Cuvette Synthetic quartz flow cuvette (350x 200 µm) for laminar sample transport with
sheath fluid fluorescence, forward and side scatter light detection
Sample Delivery Computer controlled precision syringe pump for contamination-free sample
transport.
Built-in vacuum pump for waste container. Vacuum pressure is adjustable
(Computer controlled).
Sampling Volume Continuous up to 1200 ml.
200 µl for electrode based precision absolute counting, Other counting volumes
upon request
5 –1000 µl for syringe based precision absolute counting
Flow Rates 1) Sample volume speed adjustable continuously between 0.1 and 20 µl/s
2) Sheath fluid flow continuously adjustable in expert mode
Fluidics Volume 2x 1-litre integrated reservoirs for sheath fluid and waste
BioSafety System Avoids sample droplets and sample cross contamination (computer controlled)
Page 39

CyFlow® Cube Instrument Operating Manual
Rev-05_2014-01-31
39/40
Notes
Page 40
Excellence in Flow Cytometry and Cell Analysis
 Loading...