

Page 1

Nortel Ethernet Switch 460/470
Configuration — System
Monitoring
ATTENTION
Clicking on a PDF hyperlink takes you to the appropriate page. If necessary,
scroll up or down the page to see the beginning of the referenced section.
NN47210-503 (217107-B)
.
Page 2

Document status: Standard
Document version: 01.01
Document date: 22 February 2007
Copyright © 2005-2007, Nortel Networks
All Rights Reserved.
The information in this document is subject to change without notice. The statements, configurations, technical
data, and recommendations in this document are believed to be accurate and reliable, but are presented without
express or implied warranty. Users must take full responsibility for their applications of any products specified in this
document. The information in this document is proprietary to Nortel Networks.
The software described in this document is furnished under a license agreement and may be used only in accordance
with the terms of that license. The software license agreement is included in this document.
Trademarks
*Nortel, Nortel Networks, the Nortel logo, and the Globemark are trademarks of Nortel Networks.
All other products or services may be trademarks, registered trademarks, service marks, or registered service marks
of their respective owners. The asterisk after a name denotes a trademarked item.
Restricted rights legend
Use, duplication, or disclosure by the United States Government is subject to restrictions as set forth in subparagraph
(c)(1)(ii) of the Rights in Technical Data and Computer Software clause at DFARS 252.227-7013.
Notwithstanding any other license agreement that may pertain to, or accompany the delivery of, this computer
software, the rights of the United States Government regarding its use, reproduction, and disclosure are as set forth
in the Commercial Computer Software-Restricted Rights clause at FAR 52.227-19.
Statement of conditions
In the interest of improving internal design, operational function, and/or reliability, Nortel Networks reserves the right
to make changes to the products described in this document without notice.
Nortel Networks does not assume any liability that may occur due to the use or application of the product(s) or
circuit layout(s) described herein.
Portions of the code in this software product may be Copyright © 1988, Regents of the University of California. All
rights reserved. Redistribution and use in source and binary forms of such portions are permitted, provided that the
above copyright notice and this paragraph are duplicated in all such forms and that any documentation, advertising
materials, and other materials related to such distribution and use acknowledge that such portions of the software
were developed by the University of California, Berkeley. The name of the University may not be used to endorse or
promote products derived from such portions of the software without specific prior written permission.
SUCH PORTIONS OF THE SOFTWARE ARE PROVIDED "AS IS" AND WITHOUT ANY EXPRESS OR IMPLIED
WARRANTIES, INCLUDING, WITHOUT LIMITATION, THE IMPLIED WARRANTIES OF MERCHANTABILITY AND
FITNESS FOR A PARTICULAR PURPOSE.
In addition, the program and information contained herein are licensed only pursuant to a license agreement that
contains restrictions on use and disclosure (that may incorporate by reference certain limitations and notices
imposed by third parties).
Nortel Networks software license agreement
This Software License Agreement ("License Agreement") is between you, the end-user ("Customer") and Nortel
Networks Corporation and its subsidiaries and affiliates ("Nortel Networks"). PLEASE READ THE FOLLOWING
CAREFULLY. YOU MUST ACCEPT THESE LICENSE TERMS IN ORDER TO DOWNLOAD AND/OR USE THE
SOFTWARE. USE OF THE SOFTWARE CONSTITUTES YOUR ACCEPTANCE OF THIS LICENSE AGREEMENT.
If you do not accept these terms and conditions, return the Software, unused and in the original shipping container,
within 30 days of purchase to obtain a credit for the full purchase price.
Page 3

"Software" is owned or licensed by Nortel Networks, its parent or one of its subsidiaries or affiliates, and is
copyrighted and licensed, not sold. Software consists of machine-readable instructions, its components, data,
audio-visual content (such as images, text, recordings or pictures) and related licensed materials including all whole
or partial copies. Nortel Networks grants you a license to use the Software only in the country where you acquired the
Software. You obtain no rights other than those granted to you under this License Agreement. Youare responsible for
the selection of the Software and for the installation of, use of, and results obtained from the Software.
Licensed Use of Software. Nortel Networks grants Customer a nonexclusive license to use a copy of the
1.
Software on only one machine at any one time or to the extent of the activation or authorized usage level,
whichever is applicable. To the extent Software is furnished for use with designated hardware or Customer
furnished equipment ("CFE"), Customer is granted a nonexclusive license to use Software only on such
hardware or CFE, as applicable. Software contains trade secrets and Customer agrees to treat Software as
confidential information using the same care and discretion Customer uses with its own similar information that it
does not wish to disclose, publish or disseminate. Customer will ensure that anyone who uses the Software
does so only in compliance with the terms of this Agreement. Customer shall not a) use, copy, modify, transfer or
distribute the Software except as expressly authorized; b) reverse assemble, reverse compile, reverse engineer
or otherwise translate the Software; c) create derivative works or modifications unless expressly authorized; or d)
sublicense, rent or lease the Software. Licensors of intellectual property to Nortel Networks are beneficiaries of
this provision. Upon termination or breach of the license by Customer or in the event designated hardware or
CFE is no longer in use, Customer will promptly return the Software to Nortel Networks or certify its destruction.
Nortel Networks may audit by remote polling or other reasonable means to determine Customer’s Software
activation or usage levels. If suppliers of third party software included in Software require Nortel Networks to
include additional or different terms, Customer agrees to abide by such terms provided by Nortel Networks
with respect to such third party software.
2. Warranty. Except as may be otherwise expressly agreed to in writing between Nortel Networks and Customer,
Software is provided "AS IS" without any warranties (conditions) of any kind. NORTEL NETWORKS DISCLAIMS
ALL WARRANTIES (CONDITIONS) FOR THE SOFTWARE, EITHER EXPRESS OR IMPLIED, INCLUDING,
BUT NOT LIMITED TO THE IMPLIED WARRANTIES OF MERCHANTABLITITY AND FITNESS FOR A
PARTICULAR PURPOSE AND ANY WARRANTY OF NON-INFRINGEMENT. Nortel Networks is not obligated
to provide support of any kind for the Software. Some jurisdictions do not allow exclusion of implied warranties,
and, in such event, the above exclusions may not apply.
3. Limitation of Remedies. IN NO EVENT SHALL NORTEL NETWORKS OR ITS AGENTS OR SUPPLIERS BE
LIABLE FOR ANY OF THE FOLLOWING: a) DAMAGES BASED ON ANY THIRD PARTY CLAIM; b) LOSS
OF, OR DAMAGE TO, CUSTOMER’S RECORDS, FILES OR DATA; OR c) DIRECT, INDIRECT, SPECIAL,
INCIDENTAL, PUNITIVE, OR CONSEQUENTIAL DAMAGES (INCLUDING LOST PROFITS OR SAVINGS),
WHETHER IN CONTRACT, TORT OR OTHERWISE (INCLUDING NEGLIGENCE) ARISING OUT OF YOUR
USE OF THE SOFTWARE, EVEN IF NORTEL NETWORKS, ITS AGENTS OR SUPPLIERS HAVE BEEN
ADVISED OF THEIR POSSIBILITY. The forgoing limitations of remedies also apply to any developer and/or
supplier of the Software. Such developer and/or supplier is an intended beneficiary of this Section. Some
jurisdictions do not allow these limitations or exclusions and, in such event, they may not apply.
4. General
a. If Customer is the United States Government, the following paragraph shall apply: All Nortel Networks
Software available under this License Agreement is commercial computer software and commercial
computer software documentation and, in the eventSoftware is licensed for or on behalf of the United States
Government, the respective rights to the software and software documentation are governed by Nortel
Networks standard commercial license in accordance with U.S. Federal Regulations at 48 C.F.R. Sections
12.212 (for non-Odd entities) and 48 C.F.R. 227.7202 (for Odd entities).
b. Customer may terminate the license at any time. Nortel Networks may terminate the license if Customer
fails to comply with the terms and conditions of this license. In either event, upon termination, Customer
must either return the Software to Nortel Networks or certify its destruction.
c. Customer is responsible for payment of any taxes, including personal property taxes, resulting from
Customer’s use of the Software. Customer agrees to comply with all applicable laws including all applicable
export and import laws and regulations.
d. Neither party may bring an action, regardless of form, more than two years after the cause of the action
arose.
e. The terms and conditions of this License Agreement form the complete and exclusive agreement between
Customer and Nortel Networks.
Page 4

f. This License Agreement is governed by the laws of the country in which Customer acquires the Software.
If the Software is acquired in the United States, then this License Agreement is governed by the laws of
the state of New York.
Page 5

Revision History
Version Reason for revision
01.01
Updated software and document references for Release 3.7 software.
5
Nortel Ethernet Switch 460/470
Configuration — System Monitoring
NN47210-503 01.01 Standard
Copyright © 2005-2007, Nortel Networks Nortel Networks Confidential
.
3.7 22 February 2007
Page 6

6 Revision History
Nortel Ethernet Switch 460/470
Configuration — System Monitoring
NN47210-503 01.01 Standard
Copyright © 2005-2007, Nortel Networks Nortel Networks Confidential
.
3.7 22 February 2007
Page 7

Contents
Preface 11
About this guide 11
Network management tools and interfaces 11
Before you begin 12
Text conventions 12
Related publications 13
Obtaining technical assistance 14
Chapter 1 Network monitoring 15
System Log 15
Port mirroring 17
Port Statistics screen 25
7
System Log screen 15
Displaying most recent log entry first 16
Port-based mirroring configuration 18
Address-based mirroring configuration 19
Port mirroring configuration rules 21
Port Mirroring Configuration screen 22
Chapter 2 Configuring network monitoring using CLI 31
Setting the system event log 31
31
Enabling remote logging 35
show logging 35
logging remote enable command 36
no logging remote enable command 37
logging remote address command 37
no logging remote address command 37
logging remote level command 38
no logging remote level command 38
default logging remote level command 39
Using port mirroring 39
show port-mirroring command 39
port-mirroring command 40
no port-mirroring command 41
Nortel Ethernet Switch 460/470
Configuration — System Monitoring
NN47210-503 01.01 Standard
Copyright © 2005-2007, Nortel Networks Nortel Networks Confidential
.
3.7 22 February 2007
Page 8

8 Contents
Displaying port statistics 41
show port-statistics command 42
clear-stats command 43
Chapter 3 Configuring network monitoring using Device
Manager 45
System Log Settings tab 45
Remote System Log tab 47
Graphing chassis statistics 49
IP tab 49
ICMP In tab 53
ICMP Out tab 54
Graphing port statistics 56
Interface tab for graphing ports 57
Ethernet Errors tab for graphing ports 59
Bridge tab for graphing ports 62
Chapter 4 Configuring network monitoring using Web-based
management 65
Viewing the system log 65
Configuring port mirroring 67
Viewing system statistics 71
Viewing port statistics 71
Viewing all port errors 74
Viewing interface statistics 76
Viewing Ethernet error statistics 77
Viewing transparent bridging statistics 79
Monitoring MLT traffic 81
Chapter 5 Configuring RMON using the CLI 83
show rmon alarm 83
show rmon event 84
show rmon history 84
show rmon stats 85
rmon alarm 86
no rmon alarm 87
rmon event 88
no rmon event 88
rmon history 88
no rmon history 89
rmon stats 89
no rmon stats 90
Chapter 6 Configuring RMON using Device Manager 91
Working with RMON information 91
RMON history 92
Nortel Ethernet Switch 460/470
Configuration — System Monitoring
NN47210-503 01.01 Standard
Copyright © 2005-2007, Nortel Networks Nortel Networks Confidential
.
3.7 22 February 2007
Page 9

Contents 9
Creating a history 92
Disabling history 94
Viewing RMON history statistics 94
Enabling Ethernet statistics gathering 96
Disabling Ethernet statistics gathering 98
RMON Alarms 98
How RMON alarms work 98
Creating alarms 100
Alarm Manager example 100
Viewing RMON statistics 103
RMON events 106
How events work 106
Viewing an event 106
Creating an event 108
Deleting an event 109
RMON Log information 109
RMON tab for graphing ports 110
Chapter 7 Configuring RMON using Web-based management113
Configuring RMON fault threshold parameters 113
Creating an RMON fault threshold 113
Deleting an RMON threshold configuration 116
Viewing the RMON fault event log 117
Viewing RMON Ethernet statistics 118
Viewing RMON history 120
Appendix A Quick steps for port mirroring 123
Configuring port mirroring 123
Index 126
Nortel Ethernet Switch 460/470
Configuration — System Monitoring
NN47210-503 01.01 Standard
Copyright © 2005-2007, Nortel Networks Nortel Networks Confidential
.
3.7 22 February 2007
Page 10

10 Contents
Nortel Ethernet Switch 460/470
Configuration — System Monitoring
NN47210-503 01.01 Standard
Copyright © 2005-2007, Nortel Networks Nortel Networks Confidential
.
3.7 22 February 2007
Page 11

Preface
About this guide
This guide provides information about system logging, displaying system
statistics, and configuring network monitoring on the Nortel Ethernet Switch
460 and Nortel Ethernet Switch 470.
Network management tools and interfaces
The following are the management tools and interfaces available with the
switch (for basic instructions on these tools, refer to the Nortel Ethernet
Switch 460/470 Overview — System Configuration (NN47210-501)):
•
Console interface
The console interface (CI) allows you to configure and manage the
switch locally or remotely. Access the CI menu and screens locally
through a console terminal attached to your Ethernet Switch, remotely
through a dial-up modem connection, or in-band through a Telnet
session.
11
•
Web-based management
You can manage the network from the World Wide Web and can access
the Web-based Graphical User Interface (GUI) through the HTML-based
browser located on your network. The GUI allows you to configure,
monitor, and maintain your network through web browsers. You can also
download software using the web.
•
Java-based Device Manager
The Device Manager is a set of Java-based graphical network
management applications that is used to configure and manage
Ethernet Switches 460 and 470.
• Command Line Interface (CLI)
The CLI is used to automate general management and configuration
of the Ethernet Switches 460 and 470. Use the CLI through a Telnet
connection or through the serial port on the console.
•
Any generic SNMP-based network management software
Nortel Ethernet Switch 460/470
Configuration — System Monitoring
NN47210-503 01.01 Standard
Copyright © 2005-2007, Nortel Networks Nortel Networks Confidential
.
3.7 22 February 2007
Page 12

12 Preface
You can use any generic SNMP-based network management software
to configure and manage Ethernet Switches 460 and 470.
•
Telnet
Telnet allows you to access the CLI and CI menu and screens locally
using an in-band Telnet session.
•
SSH
Secure Shell (SSH) is a client/server protocol that can provide a secure
remote login with encryption of data, user name, and password. For
details on SSH connections, refer to Nortel Ethernet Switch 460/470
Security — Configuration (NN47210-500).
• Nortel Enterprise Policy Manager
The Nortel Enterprise Policy Manager (formerly Optivity Policy Services)
allows you to configure the Ethernet Switches 460 and 470 with a single
system.
Before you begin
This guide is intended for network administrators with the following
background:
•
Basic knowledge of networks, bridging, and IP
•
Familiarity with networking concepts and terminology
•
Basic knowledge of network topologies
Before using this guide, you must complete the installation procedures
discussed in Nortel Ethernet Switch 460-24T-PWR — Installation
(NN47210-300) or Nortel Ethernet Switch 470 — Installation (NN47210-301)
.
Text conventions
angle brackets (< >) Indicate that you choose the text to enter based on
braces ({}) Indicate required elements in syntax descriptions
the description inside the brackets. Do not type the
brackets when entering the command.
Example: If the command syntax is
ip default-gateway <XXX.XXX.XXX.XXX>,
you enter
ip default-gateway 192.32.10.12
where there is more than one option. You must choose
only one of the options. Do not type the braces when
entering the command.
Nortel Ethernet Switch 460/470
Configuration — System Monitoring
NN47210-503 01.01 Standard
Copyright © 2005-2007, Nortel Networks Nortel Networks Confidential
.
3.7 22 February 2007
Page 13

Related publications 13
Example: If the command syntax is
http-server {enable | disable}
the options are enable or disable.
brackets ([ ]) Indicate optional elements in syntax descriptions. Do
not type the brackets when entering the command.
Example: If the command syntax is
show ip [bootp],
you can enter either
show ip or show ip bootp.
plain Courier
text
Indicates command syntax and system output.
Example:
TFTP Server IP Address: 192.168.100.15
vertical line | Separates choices for command keywords and
H.H.H. Enter a MAC address in this format
Related publications
For more information about managing or using the switches, refer to the
following publications:
•
Release Notes — Software Release 3.7 (NN47210-400)
•
Nortel Ethernet Switch 460-24T-PWR — Installation (NN47210-300)
•
Nortel Ethernet Switch 470 — Installation (NN47210-301)
•
Nortel Ethernet Switch 460/470 Overview — System Configuration
(NN47210-501)
arguments. Enter only one of the choices. Do not type
the vertical line when entering the command.
Example: If the command syntax is
cli password <serial | telnet>, you must
enter either cli password serial or cli
password telnet, but not both.
(XXXX.XXXX.XXXX).
• Nortel Ethernet Switch 460/470 Security — Configuration
(NN47210-500)
Nortel Ethernet Switch 460/470
Configuration — System Monitoring
NN47210-503 01.01 Standard
Copyright © 2005-2007, Nortel Networks Nortel Networks Confidential
.
3.7 22 February 2007
Page 14

14 Preface
•
Nortel Ethernet Switch 460/470 Configuration — Quality of Service and
IP Filtering (NN47210-502)
•
Nortel Ethernet Switch 460/470 Configuration — IP Multicast Routing
Protocols (NN47210-504)
• Nortel Ethernet Switch 460/470 Configuration — VLANs, Spanning Tree,
and Multilink Trunking (NN47210-505)
•
Installing Gigabit Interface Converters and Small Form Factor Pluggable
Interface Converters (312865-B)
You can print selected technical manuals and release notes free, directly
from the Internet. Go to w
you need documentation. Then locate the specific category and model or
version for your hardware or software product. Use Adobe* Acrobat Reader*
to open the manuals and release notes, search for the sections you need,
and print them on most standard printers. Go to the Adobe Systems web
site to download a free copy of the Adobe Acrobat Reader.
Obtaining technical assistance
If you purchased a service contract for your Nortel product from a distributor
or authorized reseller, contact the technical support staff for that distributor
or reseller for assistance.
ww.nortel.com/support. Find the product for which
If you purchased a Nortel service program, contact one of the following
Nortel Technical Solutions Centers:
Technical Solutions Center
Europe, Middle East, and Africa (33) (4) 92-966-968
North America (800) 4NORTEL or (800) 466-7835
Asia Pacific (61) (2) 9927-8800
China (800) 810-5000
Telephone
Additional information about the Nortel Technical Solutions Centers is
available from www.nortel.com/callus.
An Express Routing Code (ERC) is available for many Nortel products and
services. When you use an ERC, your call is routed to a technical support
person who specializes in supporting that product or service. To locate an
ERC for your product or service, go to w
ww.nortel.com/erc.
Nortel Ethernet Switch 460/470
Configuration — System Monitoring
NN47210-503 01.01 Standard
Copyright © 2005-2007, Nortel Networks Nortel Networks Confidential
.
3.7 22 February 2007
Page 15

Chapter 1
Network monitoring
The Ethernet Switches 460 and 470 provide features that allow you to
monitor your network, display switch statistics, and log system events.
This chapter discusses the following topics:
•
"System Log" (page 15)
• "Port mirroring" (page 17)
•
"Port Statistics screen" (page 25)
System Log
System Log messages operate as follows:
•
Non-volatile memory messages are retrievable after a system reset.
• Messages can be viewed while the system is operational.
15
•
All non-volatile and dynamic memory messages are time stamped.
•
When you restart your system after a reset, the dynamic memory
messages are deleted.
•
After a reset, all messages stored in non-volatile memory are copied to
dynamic memory. The messages copied to dynamic memory are time
stamped to zero (0).
•
Starting with Release 3.6 software, Ethernet Switches460 and 470 save
the last 100 commands entered to a command history log in NVRAM.
This history is periodically copied from NVRAM to the remote syslog
server. For details, refer to Nortel Ethernet Switch 460/470 Security
— Configuration (NN47210-500).
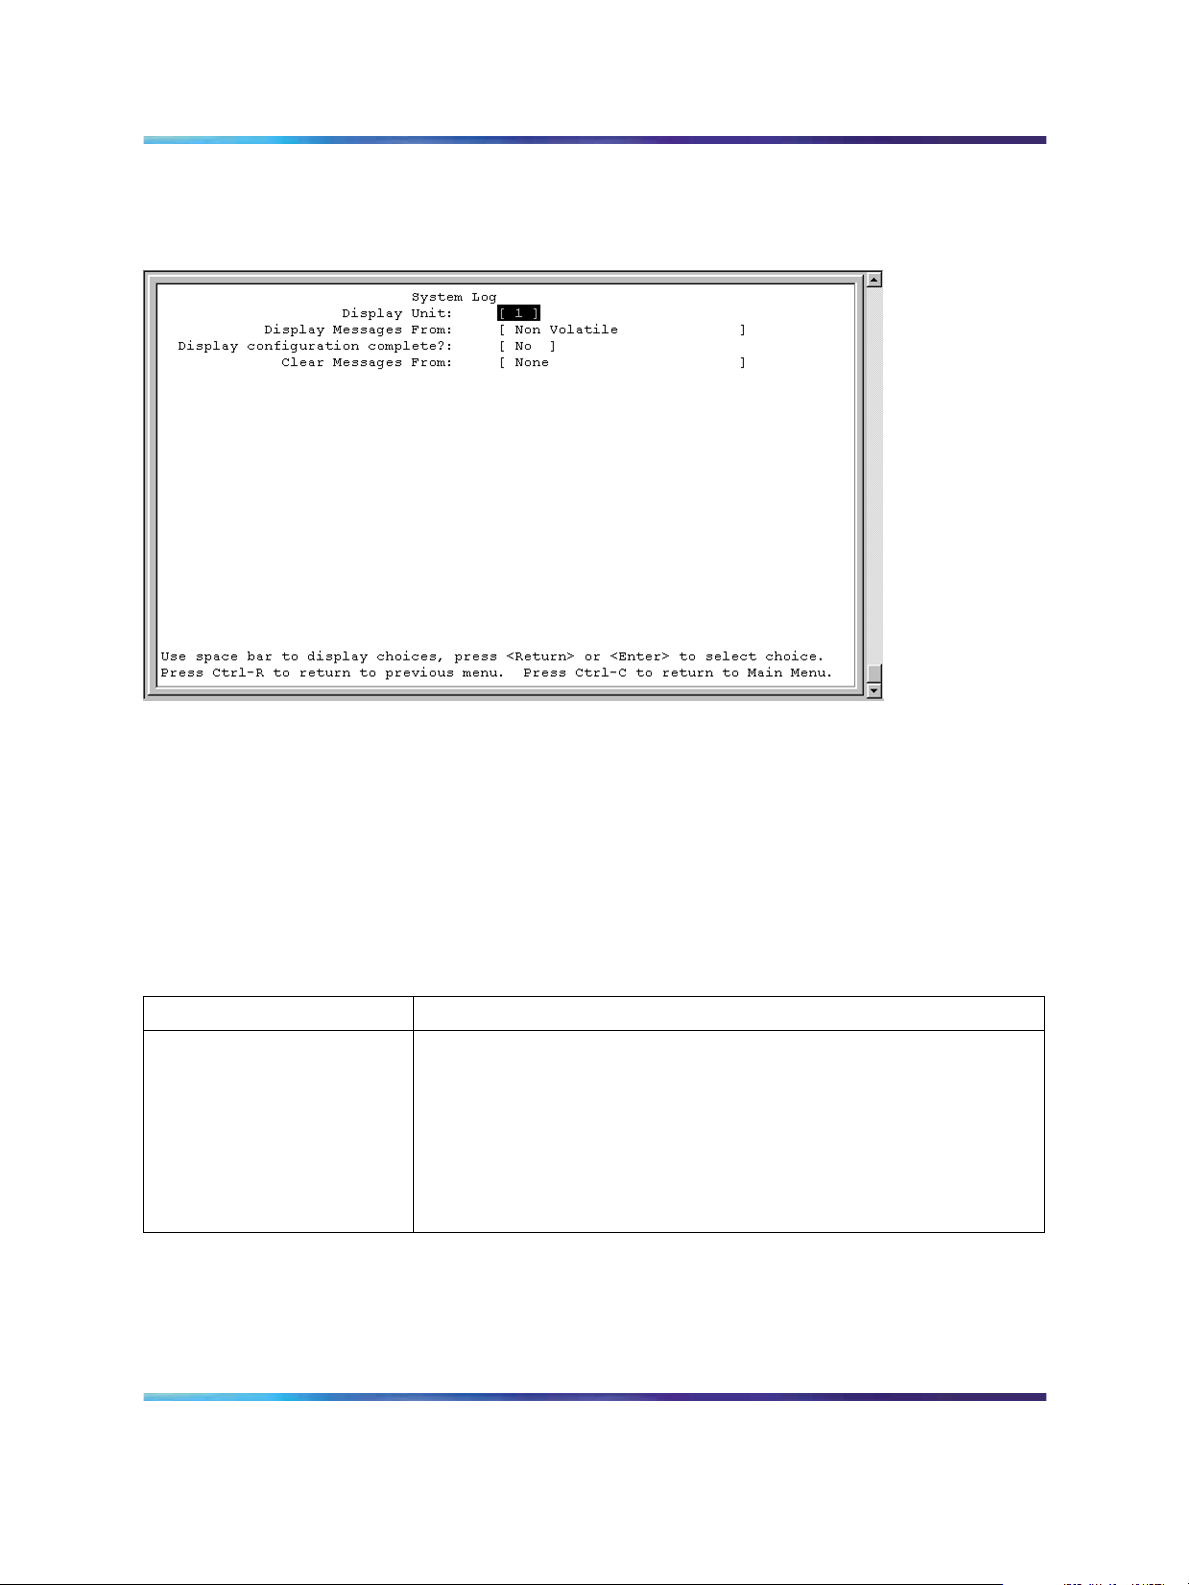
System Log screen
In the Console Interface, the System Log screen (Figure 1 "System Log
screen" (page 16)) displays or clears messages obtained from system
non-volatile memory or dynamic memory.
To open the System Log screen:
Nortel Ethernet Switch 460/470
Configuration — System Monitoring
NN47210-503 01.01 Standard
Copyright © 2005-2007, Nortel Networks Nortel Networks Confidential
.
3.7 22 February 2007
Page 16
16 Chapter 1 Network monitoring
è Choose Display System Log (or type y) from the main menu.
Figure 1 System Log screen
Displaying most recent log entry first
This option allows you to view the system log with the most recent entry
displayed first; the rest of the log entries are listed in reverse chronological
order.
Table 1 "System Log screen fields" (page 16) describes the System Log
screen fields.
Table 1
System Log screen fields
Field Description
Display Messages From This field allows you to select the memory source your messages
are obtained from. Choose Non Volatile, Volatile, or Volatile + Non
Volatile. Use the spacebar to toggle between the options.
Default Non Volatile
Range Non Volatile, Volatile + Non Volatile
Nortel Ethernet Switch 460/470
Configuration — System Monitoring
NN47210-503 01.01 Standard
Copyright © 2005-2007, Nortel Networks Nortel Networks Confidential
.
3.7 22 February 2007
Page 17

Field Description
Port mirroring 17
Display configuration
complete?
Clear Messages From This field allows you to clear the information messages from dynamic
This field allows you to determine whether the configuration
information received from non-volatile or dynamic memory
(depending on what is selected in the Display Messages From field)
is complete. Use the spacebar to toggle between the options.
Default No
Range No, Yes
or non-volatile memory or both. If you clear dynamic messages,
existing non-volatile messages are copied into dynamic memory.
After a system reset, all existing non-volatile messages are copied to
dynamic memory. Use the spacebar to toggle between the options.
Default None
Range None, Non Volatile, Volatile + Non Volatile
Port mirroring
You can designate one of your switch ports to monitor traffic on any two
specified switch ports (port-based) or to monitor traffic to or from any two
specified addresses that the switch has learned (address-based).
The following sections provide sample configurations using the Console
Interface for both monitoring modes available with the port mirroring feature:
•
Port-based mirroring
•
Address-based mirroring
A sample Port Mirroring Configuration screen accompanies each network
configuration example. Notethat the examples do not show all of the screen
prompts that precede some actions.
Note: Use the CI menus, the CLI, or the Web-based management
system to configure port mirroring.
For example, when you configure a switch for port mirroring or when you
modify an existing port mirroring configuration, the new configuration does
not take effect until you respond [Yes] to the following screen prompt:
Nortel Ethernet Switch 460/470
Configuration — System Monitoring
NN47210-503 01.01 Standard
Copyright © 2005-2007, Nortel Networks Nortel Networks Confidential
.
3.7 22 February 2007
Page 18
18 Chapter 1 Network monitoring
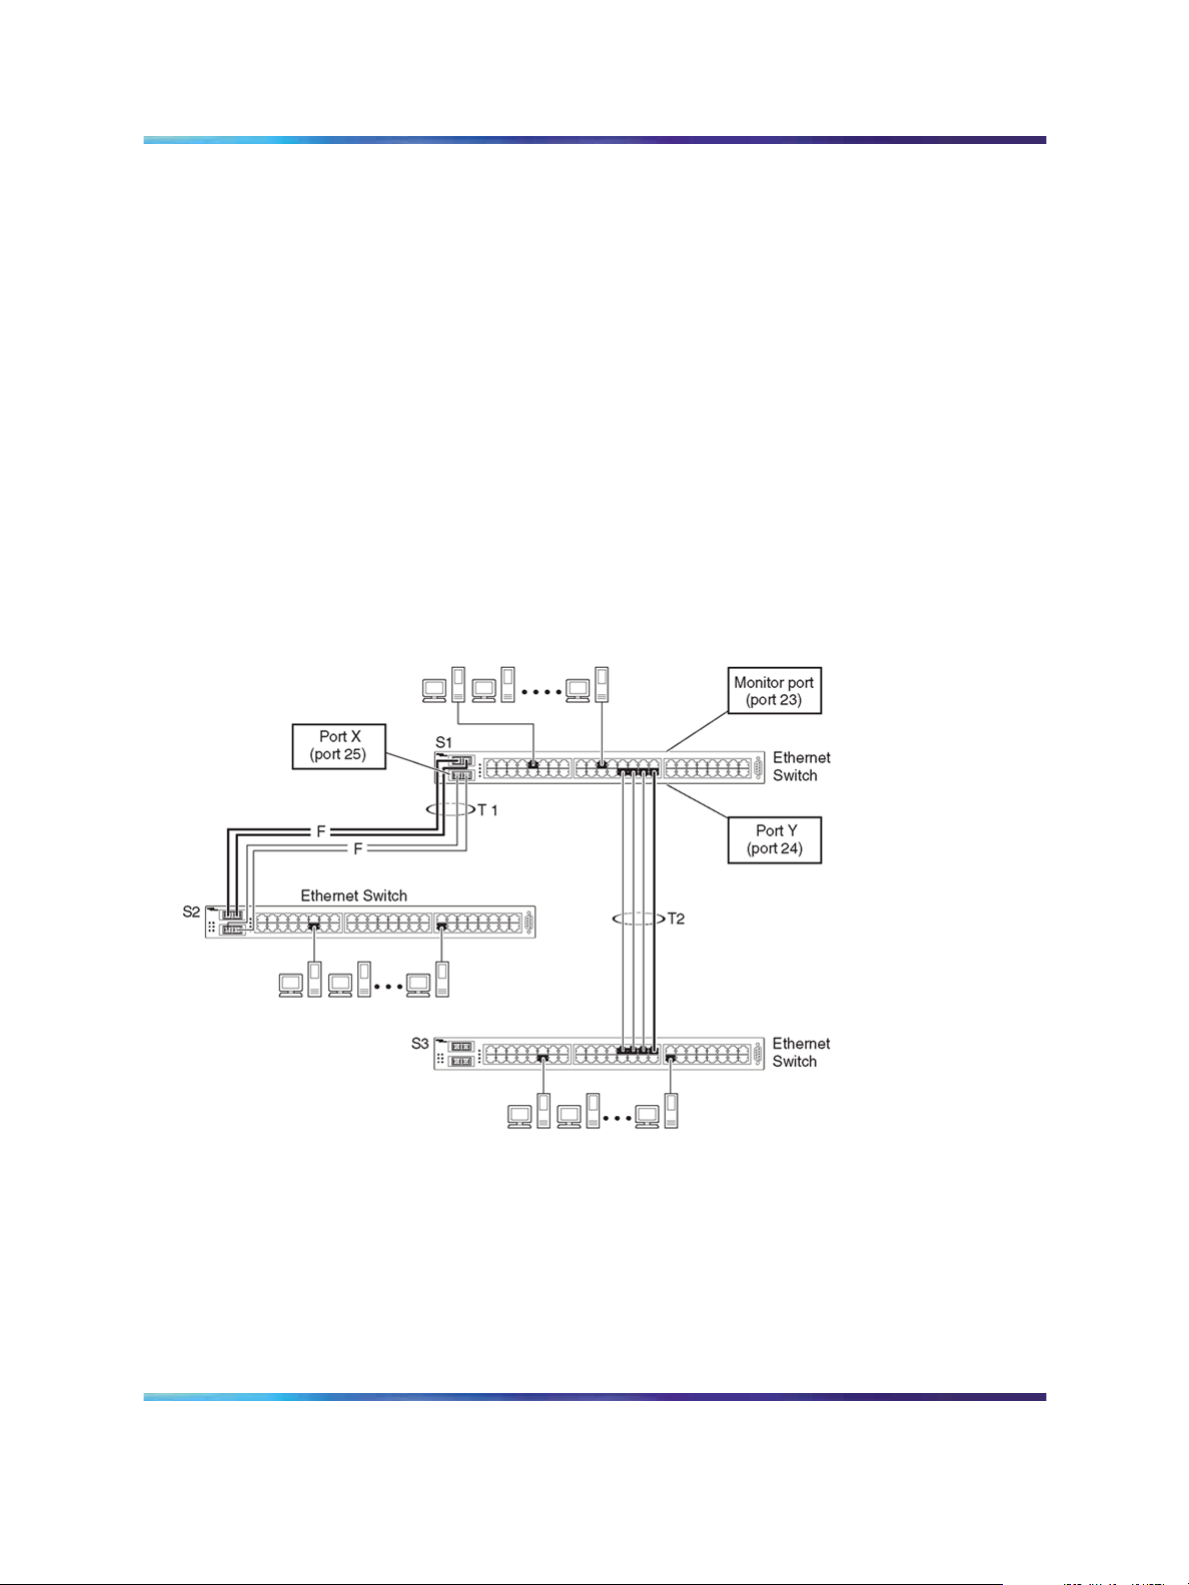
Port-based mirroring configuration
Figure 2 "Port-based mirroring configuration example" (page 18) shows an
example of a port-based mirroring configuration where port 23 is designated
as the monitor port for ports 24 and 25 of Switch S1. Although this example
shows ports 24 and 25 monitored by the monitor port (port 23), any of the
trunk members of T1 and T2 can also be monitored.
In this example, port X and port Y are members of Trunk T1 and Trunk
T2. Port X and port Y are not required to always be members of Trunk
T1 and Trunk T2.
Note: Trunks cannot be monitored and trunk members cannot be
configured as monitor ports (see Nortel Ethernet Switch 460/470
Configuration — VLANs, Spanning Tree, and Multilink Trunking
(NN47210-505) for details).
Figure 2 "Port-based mirroring configuration example" (page 18) shows the
Port Mirroring Configuration screen setup for this example.
Figure 2
Port-based mirroring configuration example
In the configuration example shown in Figure 2 "Port-based mirroring
configuration example" (page 18), the designated monitor port (port 23) can
be set to monitor traffic in any of the following modes:
•
Monitor all traffic received by port X.
•
Monitor all traffic transmitted by port X.
•
Monitor all traffic received and transmitted by port X.
Nortel Ethernet Switch 460/470
Configuration — System Monitoring
NN47210-503 01.01 Standard
Copyright © 2005-2007, Nortel Networks Nortel Networks Confidential
.
3.7 22 February 2007
Page 19
Port mirroring 19
•
Monitor all traffic received by port X or transmitted by port Y.
•
Monitor all traffic received by port X (destined to port Y) and then
transmitted by port Y.
•
Monitor all traffic received/transmitted by port X and transmitted/received
by port Y (conversations between port X and port Y).
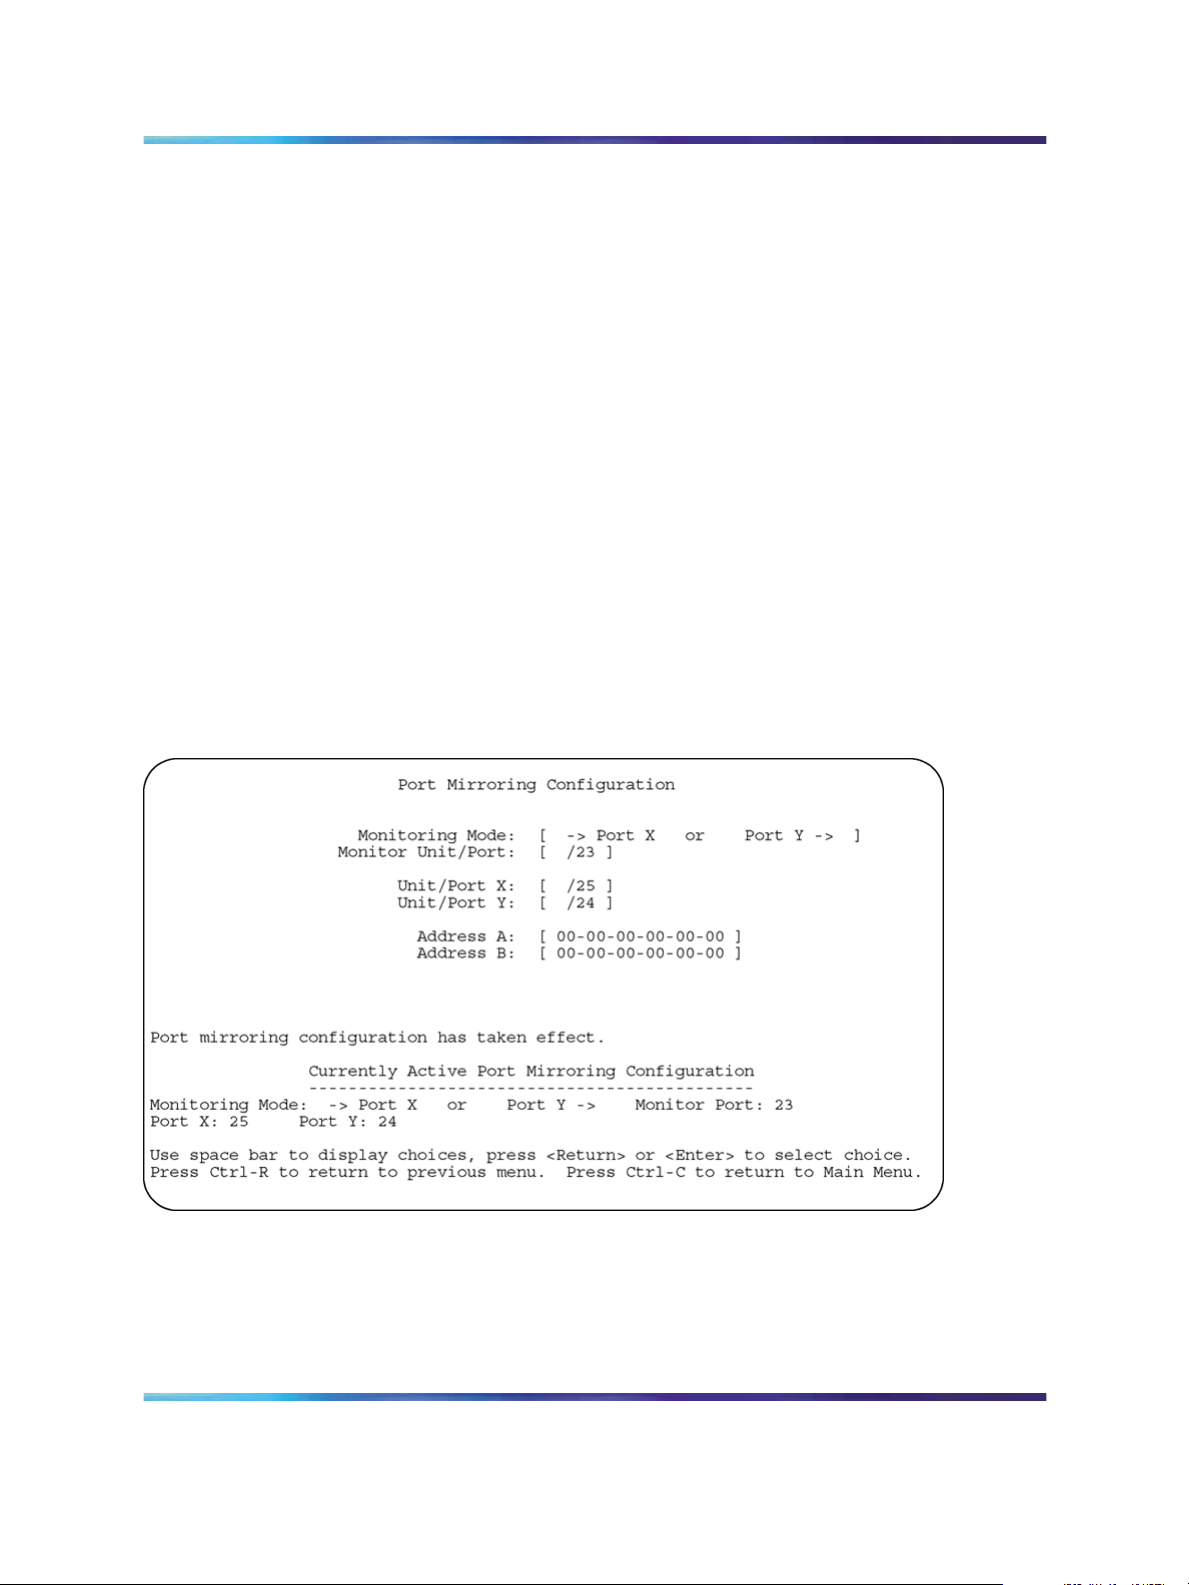
As shown in the Port Mirroring Configuration screen example (Figure 3 "Port
Mirroring Configuration port-based screen example" (page 19)), port 23 is
designated as the Monitor Port for ports 24 and 25 in Switch S1.
Note: The Unit value (in the Unit/Port field) is not configurable when the
switch is operating.
The Monitoring Mode field [ - > Port X or Port Y - > ] indicates that all traffic
received by port X
or all traffic transmitted by port Y is currently being
monitored by the StackProbe attached to Monitor Port 23.
The screen data displayed at the bottom of the screen shows the currently
active port mirroring configuration.
Figure 3
Port Mirroring Configuration port-based screen example
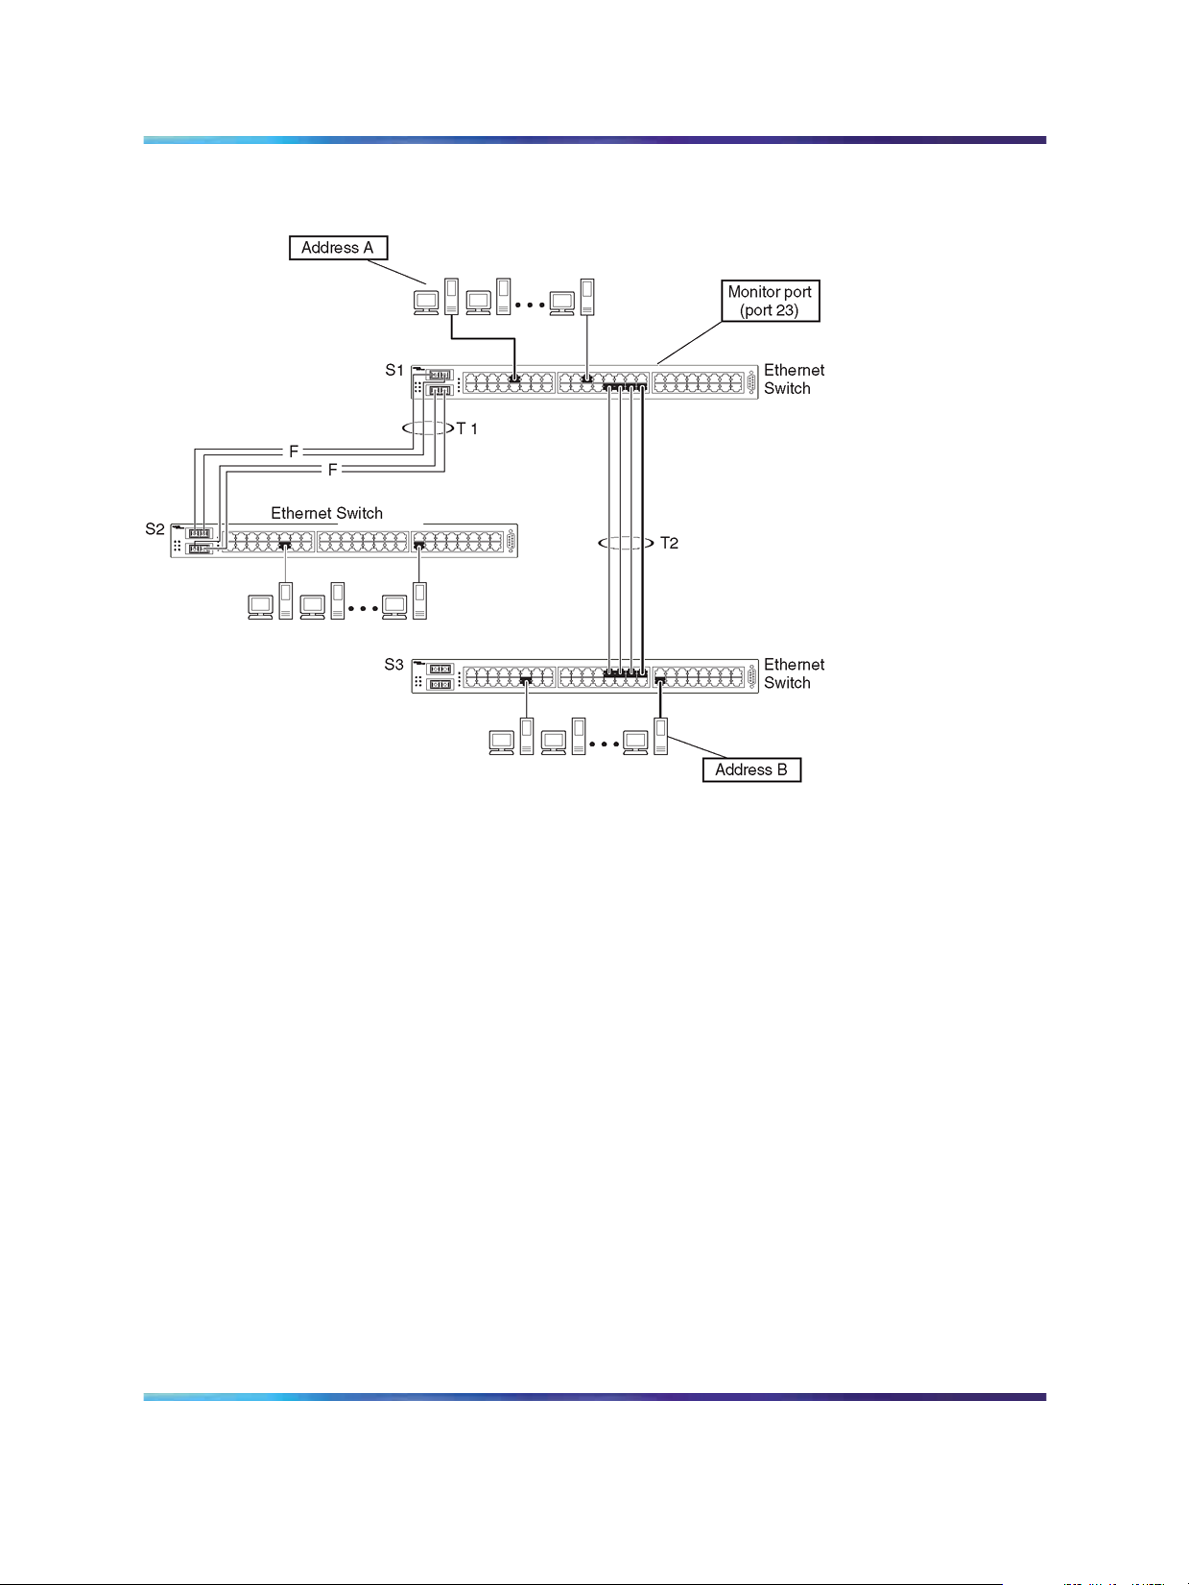
Address-based mirroring configuration
Figure 4 "Address-based mirroring configuration example" (page 20) shows
an example of an address-based mirroring configuration where port 23,
the designated monitor port for Switch S1, is monitoring traffic occurring
between address A and address B.
Nortel Ethernet Switch 460/470
Configuration — System Monitoring
NN47210-503 01.01 Standard
Copyright © 2005-2007, Nortel Networks Nortel Networks Confidential
.
3.7 22 February 2007
Page 20
20 Chapter 1 Network monitoring
Figure 4
Address-based mirroring configuration example
In this configuration, the designated monitor port (port 23) can be set to
monitor traffic in any of the following modes:
•
Monitor all traffic transmitted from address A to any address.
•
Monitor all traffic received by address A from any address.
•
Monitor all traffic received by or transmitted by address A.
•
Monitor all traffic transmitted by address A to address B.
• Monitor all traffic between address A and address B (conversation
between the two stations).
Figure 5 "Port Mirroring Configuration address-based screen example"
(page 21) shows the Port Mirroring Configuration screen setup for this
example.
In this example, port 23 becomes the designated Monitor Port for Switch S1
when you press Enter in response to the [Yes] screen prompt.
Nortel Ethernet Switch 460/470
Configuration — System Monitoring
NN47210-503 01.01 Standard
Copyright © 2005-2007, Nortel Networks Nortel Networks Confidential
.
3.7 22 February 2007
Page 21
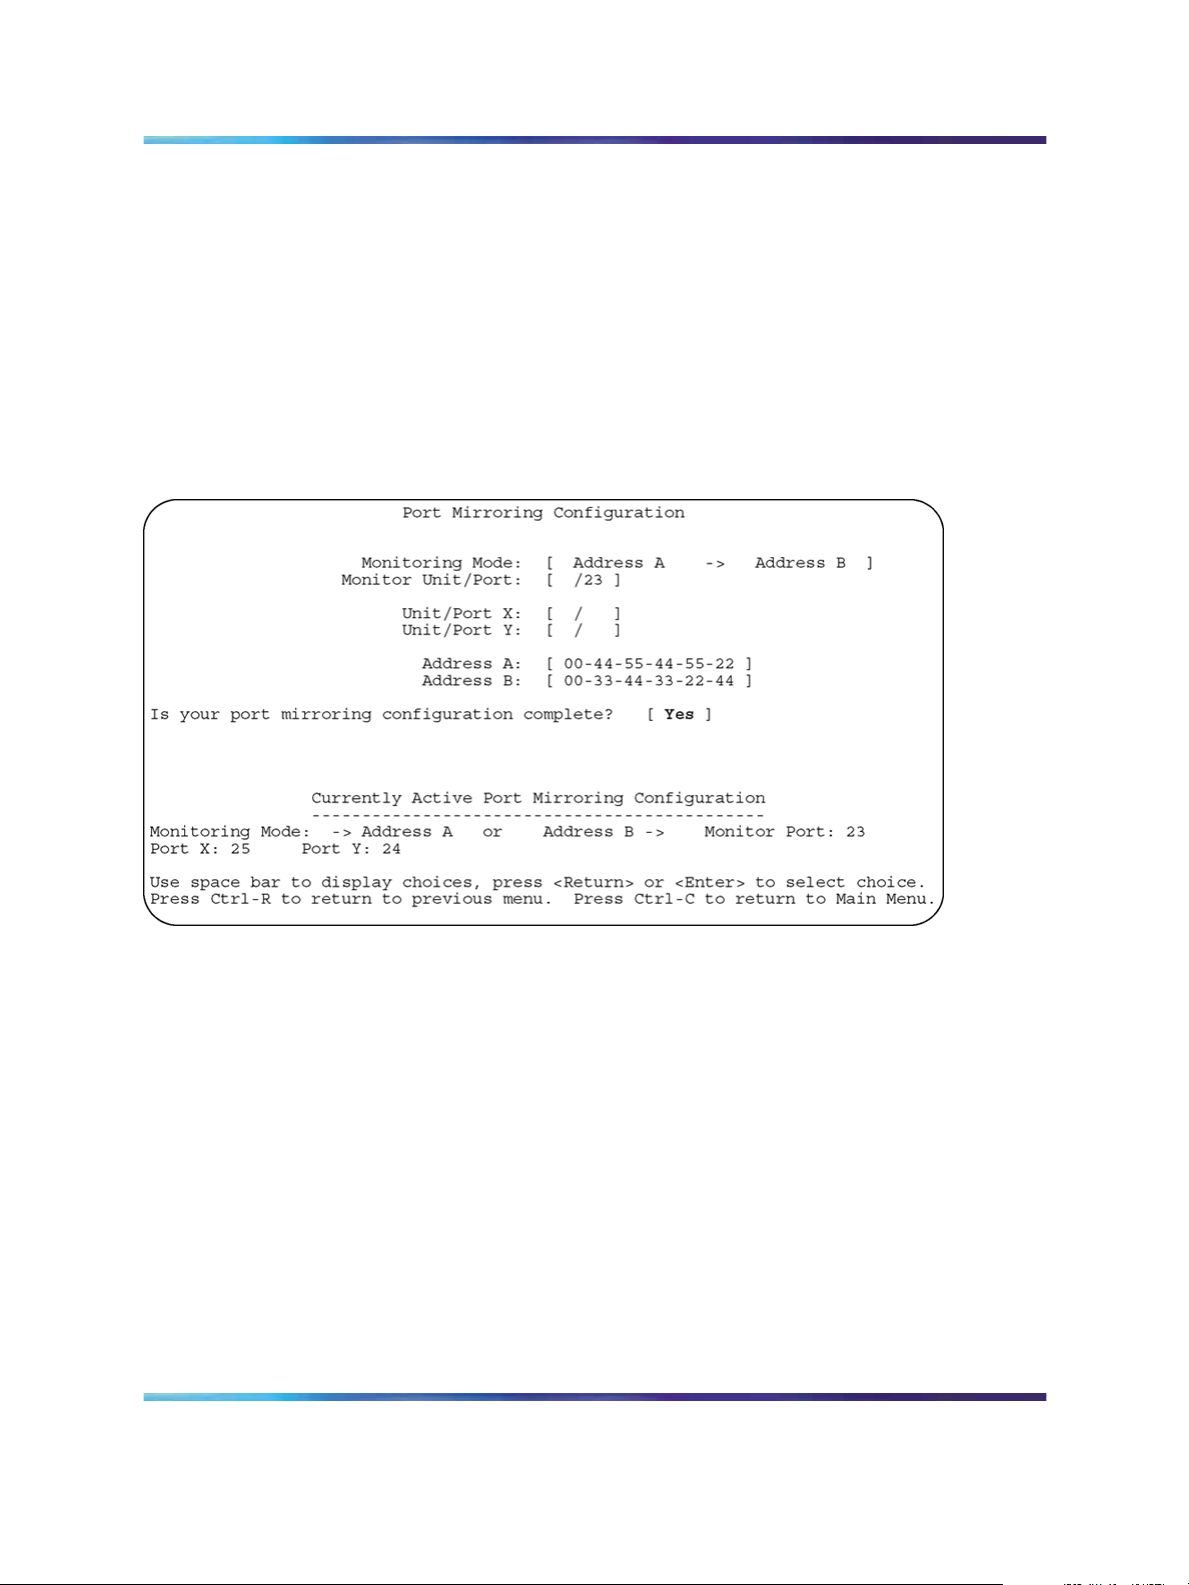
Note: The screen data displayed at the bottom of the screen changes
to show the new currently active port mirroring configuration after you
press Enter.
The Monitoring Mode field [ Address A - > Address B ] indicates that all
traffic transmitted by address A to address B is monitored by the StackProbe
attached to Monitor Port 23.
Note: When you enter MAC addresses in this screen, they are also
displayed in the MAC Address Table screen EAPOL.
Figure 5
Port Mirroring Configuration address-based screen example
Port mirroring 21
Port mirroring configuration rules
The following configuration rules apply to any port mirroring configuration:
•
You cannot configure a monitor port as a trunk member or IGMP
member.
•
A monitor port cannot be used for normal switch functions.
•
When you configure a port as a monitor port, the port is automatically
disabled from participating in the spanning tree. When you reconfigure
the port as a standard switch port (no longer a monitor port), the port is
enabled for spanning tree participation.
•
When you create a port-based port mirroring configuration, be sure
that the monitor port and both of the mirrored ports, port X and port Y,
have the same configuration. Use the VLAN Configuration screen to
configure the VLAN EAPOL.
Nortel Ethernet Switch 460/470
Configuration — System Monitoring
NN47210-503 01.01 Standard
Copyright © 2005-2007, Nortel Networks Nortel Networks Confidential
.
3.7 22 February 2007
Page 22
22 Chapter 1 Network monitoring
•
VLAN configuration settings for any ports configured for port-based
mirroring cannot be changed. Use the Port Mirroring Configuration
screen to disable port mirroring (or reconfigure the port mirroring ports),
then change the VLAN configuration settings.
•
For port-based monitoring of traffic, use one of the following modes for
monitoring broadcast, IP Multicast, or unknown DA frames:
— Monitor all traffic received by port X.
— Monitor all traffic transmitted by port X.
— Monitor all traffic received and transmitted by port X.
Appendix "Quick steps for port mirroring" (page 123) also provides
configuration flowcharts that can help you use this feature.
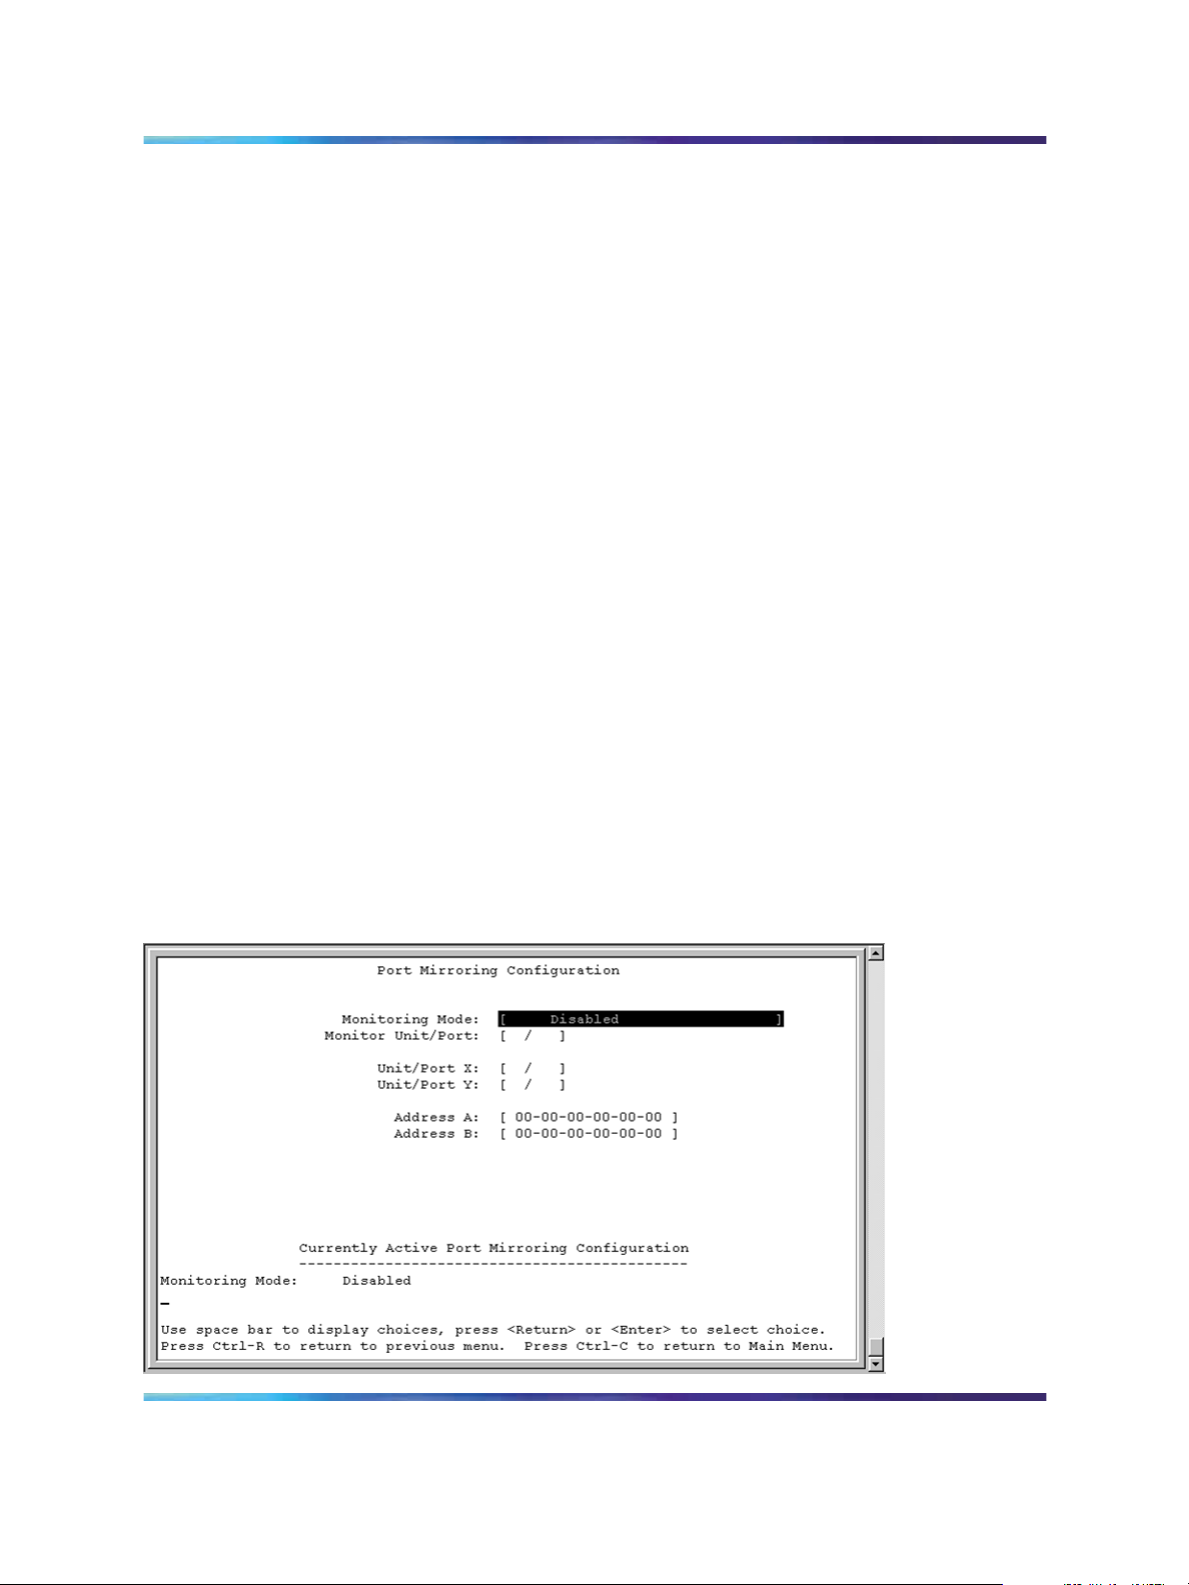
Port Mirroring Configuration screen
The Port Mirroring Configuration screen allows you to configure a specific
switch port to monitor up to two specified ports or two MAC addresses. You
can specify port-based monitoring or address-based monitoring.
Figure 6 "Port Mirror Configuration screen" (page 22) shows an example of
a Port Mirroring Configuration screen.
To open the Port Mirroring Configuration screen:
è Choose Port Mirroring Configuration (or type i) from the Switch
Configuration Menu screen.
Figure 6
Port Mirror Configuration screen
Nortel Ethernet Switch 460/470
Configuration — System Monitoring
NN47210-503 01.01 Standard
Copyright © 2005-2007, Nortel Networks Nortel Networks Confidential
.
3.7 22 February 2007
Page 23

Table 2 "Port Mirroring Configuration screen fields" (page 23) describes the
Port Mirroring Configuration screen fields.
Table 2
Port Mirroring Configuration screen fields
Field Description
Port mirroring 23
Monitoring Mode
Monitor Unit/Port
Unit/Port X
Allows a user to select any one of six port-based monitoring modes
or any one of five address-based monitoring modes (see Table
3 "Monitoring modes" (page 24)). Selecting any one of the six
port-based modes activates the port X and port Y screen fields,
where a user can choose up to two ports to monitor. Selecting any
one of the five address-based modes activates the Address A and
Address B screen fields, where a user can specify MAC addresses
to monitor.
Default Value: Disabled
Range: See Table 3 "Monitoring modes" (page 24)
Indicates the port number (of the specified unit) that is designated
as the monitor port.
Default Value: Zero-length string
Range: 1 to 8 or 1 to 26 (depending on model type)
Indicates one of the ports (of the specified unit) that is monitored by
the designated port monitor when one of the port-based monitoring
modes is selected.
This port is monitored according to the value of Port X in the
Monitoring Mode field (see Table 3 "Monitoring modes" (page 24)).
Default Value: Zero-length string
Range: 1 to 8 or 1 to 26 (depending on model type)
Unit/Port Y
Indicates one of the ports (of the specified unit) that is monitored by
the designated port monitor when one of the port-based monitoring
modes is selected. When installed as a stand-alone switch, the
screen does not display the (Unit/) field designation. This port is
monitored according to the value of Port Y in the Monitoring Mode
field (see Table 3 "Monitoring modes" (page 24)).
Default Value: Zero-length string
Range: 1 to 8 or 1 to 26 (depending on model type)
Nortel Ethernet Switch 460/470
Configuration — System Monitoring
NN47210-503 01.01 Standard
Copyright © 2005-2007, Nortel Networks Nortel Networks Confidential
.
3.7 22 February 2007
Page 24

24 Chapter 1 Network monitoring
Field Description
Address A
Indicates the MAC addresses that is monitored by the designated
port monitor when one of the address-based monitoring modes is
selected. This port is monitored according to the value of Address
A in the selected Monitoring Mode field (see Table 3 "Monitoring
modes" (page 24)).
Default Value: 00-00-00-00-00-00 (no MAC address assigned)
Range: 00-00-00-00-00-00 to FF-FF-FF-FF-FF-FF
Address B
Indicates the MAC addresses that is monitored by the designated
port monitor when one of the address-based monitoring modes is
selected. This port is monitored according to the value of Address
B in the selected Monitoring Mode field (see Table 3 "Monitoring
modes" (page 24)).
Default Value: 00-00-00-00-00-00 (no MAC address assigned)
Range: 00-00-00-00-00-00 to FF-FF-FF-FF-FF-FF
Table 3 "Monitoring modes" (page 24) describes the various monitoring
modes available from the Port Mirroring Configuration screen.
Table 3 Monitoring modes
Field Description
Port-based:
Disabled Default value for this feature.
-> Port X Monitor all traffic received by Port X.
Port X -> Monitor all traffic transmitted by Port X.
<-> Port X Monitor all traffic received and transmitted by Port X.
-> Port X or Port Y -> Monitor all traffic received by Port X or transmitted by
Port Y.
Note: Do not use this mode for broadcast or multicast
traffic.
-> Port X and Port Y -> Monitor all traffic received by Port X (destined to Port Y)
and then transmitted by Port Y.
Note: Do not use this mode for broadcast or multicast
traffic
Nortel Ethernet Switch 460/470
Configuration — System Monitoring
NN47210-503 01.01 Standard
Copyright © 2005-2007, Nortel Networks Nortel Networks Confidential
.
3.7 22 February 2007
Page 25

Port Statistics screen 25
Field Description
<-> Port X and Port Y <-> Monitor all traffic received/transmitted by Port X and
received/transmitted by Port Y.
Note: Do not use this mode for broadcast or multicast
traffic
Address-based:
Disabled Default value for this feature.
Address A -> any Address Monitor all traffic transmitted from Address A to any
address.
any Address -> Address A Monitor all traffic received by Address A from any address.
<-> Address A Monitor all traffic received by or transmitted by Address A.
Address A -> Address B Monitor all traffic transmitted by Address A to Address B.
Address A <-> Address B Monitor all traffic between Address A and Address B
(conversation between the two stations).
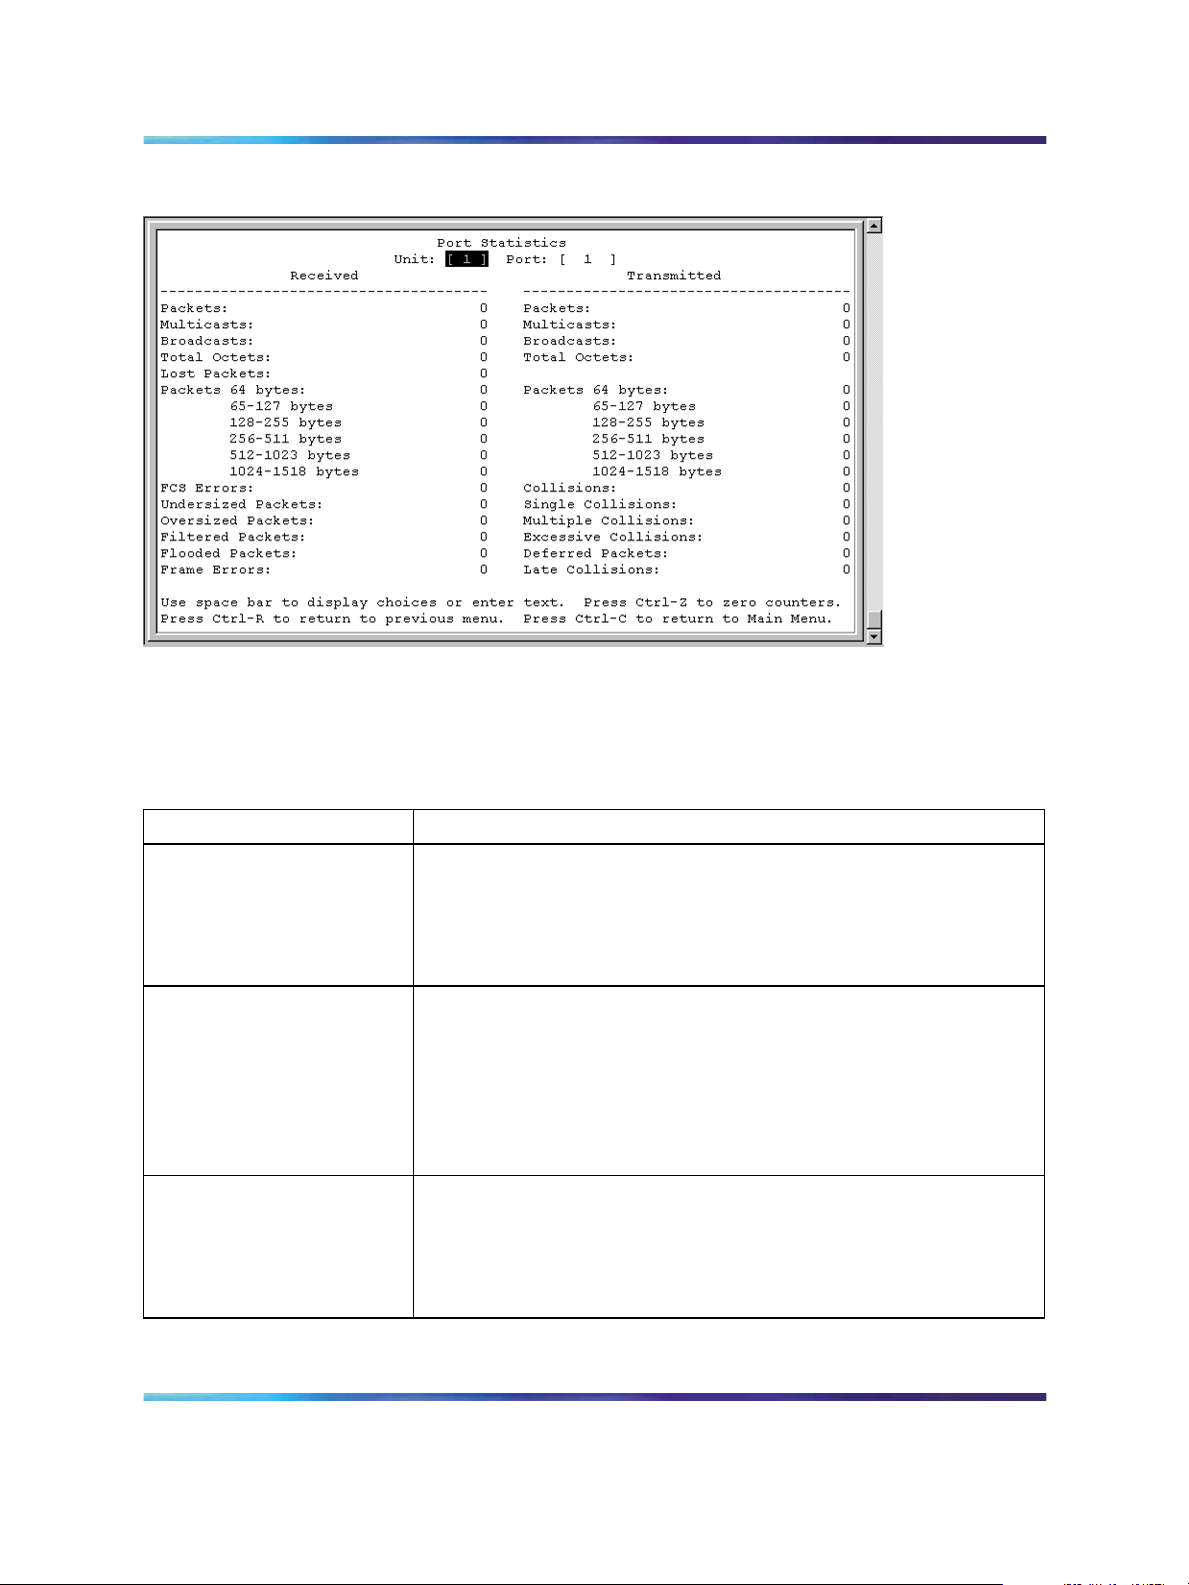
Port Statistics screen
The Port Statistics screen, as displayed in Figure 7 "Port statistics screen"
(page 26), allows you to view detailed information about any switch or port
in a configuration. The screen is divided into two sections (Received and
Transmitted) so that you can compare and evaluate throughput or other port
parameters. All screen data is updated approximately every 2 seconds.
You can use the Port Statistics screen to clear (reset to zero) port counters
for a specific switch or port. Alternatively, you can use the Clear All Port
Statistics option to clear port counters for all switches or ports.
To open the Port Statistics screen:
Choose Display Port Statistics (or type d) from the Switch Configuration
Menu screen.
Nortel Ethernet Switch 460/470
Configuration — System Monitoring
NN47210-503 01.01 Standard
Copyright © 2005-2007, Nortel Networks Nortel Networks Confidential
.
3.7 22 February 2007
Page 26
26 Chapter 1 Network monitoring
Figure 7 Port statistics screen
Table 4 "Port Statistics screen fields" (page 26) describes the Port Statistics
screen fields.
Table 4
Port Statistics screen fields
Field Description
Port Allows you to select the number of the port you want to view or reset
to zero.
To view another port, enter its port number and press Enter, or press
the spacebar on your keyboard to toggle the port numbers.
Packets Received column: Indicates the total number of packets received on
this port, including bad packets, broadcast packets, and multicast
packets.
Transmitted column: Indicates the total number of packets
transmitted successfully on this port, including broadcast packets
and multicast packets.
Multicasts Received column: Indicates the total number of good multicast
packets received on this port, excluding broadcast packets.
Transmitted column: Indicates the total number of multicast packets
transmitted successfully on this port, excluding broadcast packets.
Nortel Ethernet Switch 460/470
Configuration — System Monitoring
NN47210-503 01.01 Standard
Copyright © 2005-2007, Nortel Networks Nortel Networks Confidential
.
3.7 22 February 2007
Page 27

Port Statistics screen 27
Field Description
Broadcasts Received column: Indicates the total number of good broadcast
packets received on this port.
Transmitted column: Indicates the total number of broadcast
packets transmitted successfully on this port.
Total Octets Received column: Indicates the total number of octets of data
(including data in bad packets) received on this port, excluding
framing bits but including FCS octets.
Transmitted column: Indicates the total number of octets of data
transmitted successfully on this port, including FCS octets.
Lost Packets Received column: Indicates the total number of packets lost
(discarded) when the capacity of the port receive buffer was
exceeded.
Transmitted column: Indicates the total number of packets lost
(discarded) when the capacity of the port transmit buffer was
exceeded.
Packets 64 bytes Received column: Indicates the total number of 64-byte packets
received on this port.
Transmitted column: Indicates the total number of 64-byte packets
transmitted successfully on this port.
65-127 bytes Received column: Indicates the total number of 65-byte to 127-byte
packets received on this port.
Transmitted column: Indicates the total number of 65-byte to
127-byte packets transmitted successfully on this port.
128-255 bytes Received column: Indicatesthe total number of 128-byte to 255-byte
packets received on this port.
Transmitted column: Indicates the total number of 128-byte to
255-byte packets transmitted successfully on this port.
256-511 bytes Received column: Indicatesthe total number of 256-byte to 511-byte
packets received on this port.
Transmitted column: Indicates the total number of 256-byte to
511-byte packets transmitted successfully on this port.
Nortel Ethernet Switch 460/470
Configuration — System Monitoring
NN47210-503 01.01 Standard
Copyright © 2005-2007, Nortel Networks Nortel Networks Confidential
.
3.7 22 February 2007
Page 28

28 Chapter 1 Network monitoring
Field Description
512-1023 bytes Received column: Indicates the total number of 512-byte to
1023-byte packets received on this port.
Transmitted column: Indicates the total number of 512-byte to
1023-byte packets transmitted successfully on this port.
1024-1518 bytes Received column: Indicates the total number of 1024-byte to
1518-byte packets received on this port.
Transmitted column: Indicates the total number of 1024-byte to
1518-byte packets transmitted successfully on this port.
Frame Errors Indicates the total number of valid-size packets received but
discarded because of CRC errors and improper framing.
Undersized Packets Indicates the total number of packets received on this port with
fewer than 64 bytes and with proper CRC and framing (also known
as short frames or runts).
Oversized Packets Indicates the total number of packets received on this port with more
than 1518 bytes and with proper CRC and framing (also known as
oversized frames).
Filtered Packets Indicates the number of packets filtered (not forwarded) by this port.
Flooded Packets Indicates the total number of packets flooded (forwarded) through
this port because the destination address was not in the address
database.
FCS Errors Indicates the total number of valid-size packets received with proper
framing but discarded because of cyclic redundancy check (CRC)
errors.
Collisions Indicates the total number of collisions detected on this port.
Single Collisions Indicates the total number of packets transmitted successfully on
this port after a single collision.
Multiple Collisions Indicates the total number of packets transmitted successfully on
this port after more than one collision.
Excessive Collisions Indicates the total number of packets lost on this port due to
excessive collisions.
Deferred Packets Indicates the total number of frames delayed on the first transmission
attempt, but that never incurred a collision.
Late Collisions Indicates the total number of packet collisions that occurred
after a total length of time that exceeded 512 bit-times of packet
transmission.
Nortel Ethernet Switch 460/470
Configuration — System Monitoring
NN47210-503 01.01 Standard
Copyright © 2005-2007, Nortel Networks Nortel Networks Confidential
.
3.7 22 February 2007
Page 29

Port Statistics screen 29
Field Description
The following field values appear only when the port selected in the Unit/Port field is configured
with a GBIC.
Pause Frames Transmitted column: Indicates the total number of pause frames
transmitted on this port. Pause frames cause the transmitting port
to temporarily suspend the transmission of packets when the frame
buffer of the receiving port is full (Gigabit ports only).
Received column: Indicates the total number of pause frames
received on this port. Pause frames cause the transmitting port to
temporarily suspend the transmission of packets when the frame
buffer of the receiving port is full (Gigabit ports only).
Nortel Ethernet Switch 460/470
Configuration — System Monitoring
NN47210-503 01.01 Standard
Copyright © 2005-2007, Nortel Networks Nortel Networks Confidential
.
3.7 22 February 2007
Page 30

30 Chapter 1 Network monitoring
Nortel Ethernet Switch 460/470
Configuration — System Monitoring
NN47210-503 01.01 Standard
Copyright © 2005-2007, Nortel Networks Nortel Networks Confidential
.
3.7 22 February 2007
Page 31

Chapter 2
Configuring network monitoring using
CLI
You can configure network monitoring features and display switch statistics
using the CLI. This chapter contains information on the following topics:
• "Setting the system event log" (page 31)
•
"Enabling remote logging" (page 35)
•
"Using port mirroring" (page 39)
• "Displaying port statistics" (page 41)
Setting the system event log
You can set the system event log to log different levels of events. This
section covers:
•
"show logging" (page 31)
31
•
"logging" (page 32)
•
"no logging" (page 33)
•
"set logging" (page 33)
•
"no set logging" (page 34)
•
"default logging" (page 34)
•
"default set logging" (page 34)
•
"clear logging command" (page 34)
show logging
The show logging command displays the current contents of the system
event log. The default value displays all levels in chronological order. The
syntax for the show logging command is:
show logging [config | critical | serious | informational]
The show logging command is in the privExec command mode.
Nortel Ethernet Switch 460/470
Configuration — System Monitoring
NN47210-503 01.01 Standard
Copyright © 2005-2007, Nortel Networks Nortel Networks Confidential
.
3.7 22 February 2007
Page 32

32 Chapter 2 Configuring network monitoring using CLI
Table 5 "show logging command parameters and variables" (page 32)
describes the parameters and variables for show logging command.
Table 5 show logging command parameters and variables
Parameters and
Description
variables
config
Displays configuration log messages. (This command
parameter is only available with the Ethernet Switch
470-24T.)
critical
serious
informational
Displays critical log messages.
Displays serious log messages.
Displays informational log messages.
Figure 8 "show logging sort-reverse command output" (page 32) shows the
output of the show logging sort-reverse command.
Figure 8 show logging sort-reverse command output
logging
The logging command configures the system settings for the system
event log of the Ethernet Switch 470-24T. The syntax for the logging
command is:
logging [enable | disable]
[level critical | serious | informational]
[nv-level critical | serious | informational | none]
The logging command is in the config command mode.
Nortel Ethernet Switch 460/470
Configuration — System Monitoring
NN47210-503 01.01 Standard
Copyright © 2005-2007, Nortel Networks Nortel Networks Confidential
.
3.7 22 February 2007
Page 33

Setting the system event log 33
Table 6 "logging command parameters and variables" (page 33) describes
the parameters and variables for the logging command.
Table 6 logging command parameters and variables
Parameters and variables Description
enable | disable
level critical | serious |
informational
nv-level
critical | serious |
informational | none
Enables or disables the event log
(default is enabled).
Specifies the level of logging stored
in DRAM.
Specifies the level of logging stored in
non-volatile memory (NVRAM).
no logging
The no logging command disables the system event log on the Ethernet
Switch 470-24T. The syntax for the no logging command is:
no logging
The no logging command is in the config command mode.
The no logging command has no parameters or variables.
set logging
The set logging command configures the system settings of the system
event log for the Ethernet Switch 470-48T or the Ethernet Switch 460-24T.
The syntax for the set logging command is:
set logging [enable | disable] [level
critical | serious | informational] [nv-level
critical | serious | informational | none]
The set logging command is in the config command mode.
Table 7 "set logging command parameters and variables" (page 33)
describes the parameters and variables for the set logging command.
Table 7 set logging command parameters and variables
Parameters and variables Description
enable | disable
Enables or disables the event log
(default is enabled).
Nortel Ethernet Switch 460/470
Configuration — System Monitoring
NN47210-503 01.01 Standard
Copyright © 2005-2007, Nortel Networks Nortel Networks Confidential
.
3.7 22 February 2007
Page 34

34 Chapter 2 Configuring network monitoring using CLI
Parameters and variables Description
level critical | serious |
informational
nv-level
critical | serious |
informational | none
no set logging
The no set logging command disables the system event log for the
Ethernet Switch 470-48T or the Ethernet Switch 460-24T. The syntax for
the no set logging command is:
no set logging
The no set logging command is in the config command mode.
The no set logging command has no parameters or variables.
default logging
The default logging command configures the system settings as the
factory default settings for the system event log on the Ethernet Switch
470-24T. The syntax for the default logging command is:
Specifies the level of logging stored
in DRAM.
Specifies the level of logging stored
in NVRAM.
default logging
The default logging command is in the config command mode.
The default logging command has no parameters or variables.
default set logging
The default set logging command configures the system settings as
the factory default settings for the system event log on the Ethernet Switch
470-48T or the Ethernet Switch 460-24T. The syntax for the default set
logging command is:
default set logging
The default set logging command is in the config command mode.
The default set logging command has no parameters or variables.
clear logging command
The clear logging command clears all log messages in DRAM. The
syntax for the clear logging command is:
clear logging [nv]
The clear logging command is in the privExec command mode.
Nortel Ethernet Switch 460/470
Configuration — System Monitoring
NN47210-503 01.01 Standard
Copyright © 2005-2007, Nortel Networks Nortel Networks Confidential
.
3.7 22 February 2007
Page 35

Table 8 "clear logging command parameters and values" (page 35) shows
the parameters and values for the clear logging command.
Table 8 clear logging command parameters and values
Parameters and values Description
nv
Enabling remote logging
This feature provides an enhanced level of logging by replicating system
messages onto a syslog server. System log messages from several
switches can be collected at a central location, which alleviates the network
manager querying each switch individually to interrogate the log files. This
section covers the following commands:
•
"show logging" (page 35)
•
"logging remote enable command" (page 36)
•
"no logging remote enable command" (page 37)
Enabling remote logging 35
Clears all log messages in both DRAM and
non-volatile memory (NVRAM).
•
"logging remote address command" (page 37)
•
"no logging remote address command" (page 37)
•
"logging remote level command" (page 38)
•
"no logging remote level command" (page 38)
•
"default logging remote level command" (page 39)
show logging
The show logging command displays the configuration and the current
contents of the system event log. The syntax for the show logging
command is:
show logging [config] [critical] [informational] [serious]
[sort-reverse]
The show logging command is in the privExec command mode.
Nortel Ethernet Switch 460/470
Configuration — System Monitoring
NN47210-503 01.01 Standard
Copyright © 2005-2007, Nortel Networks Nortel Networks Confidential
.
3.7 22 February 2007
Page 36

36 Chapter 2 Configuring network monitoring using CLI
Table 9 "show logging command parameters and variables" (page 36)
describes the parameters and variables for the show logging command.
Table 9 show logging command parameters and variables
Parameters and
variables
config Displays the configuration of event logging.
critical Displays critical log messages.
informational Displays informational log messages.
serious Displays serious log messages.
sort-reverse
Description
Displays log messages in reverse chronological order
(beginning with most recent).
Figure 9 "show logging config command output" (page 36) shows the output
of the show logging config command.
Figure 9 show logging config command output
logging remote enable command
Note: The default value for remote logging is disabled.
The logging remote enable command enables logging syslog
messages to a remote server. The syntax for the remote logging
enable command is:
logging remote enable
The logging remote enable command is in the config command mode.
The logging remote enable command has no parameters or variables.
Nortel Ethernet Switch 460/470
Configuration — System Monitoring
NN47210-503 01.01 Standard
Copyright © 2005-2007, Nortel Networks Nortel Networks Confidential
.
3.7 22 February 2007
Page 37

no logging remote enable command
The no logging remote enable command disables sending syslog
messages to a remote server. The syntax for the no logging remote
enable command is:
no logging remote enable
The no remote logging enable command is in the config command
mode.
The no remote logging enable command has no parameters or
variables.
logging remote address command
The logging remote address command sets the remote server for
receiving the syslog messages; you enter the IP address of the server you
want. The syntax for the logging remote address command is:
logging remote address <A.B.C.D>
The logging remote address command is in the config command
mode.
Enabling remote logging 37
Table 10 "logging remote address command parameters and variables"
(page 37) describes the parameters and variables for the logging
remote address command.
Table 10 logging remote address command parameters and variables
Parameters and
variables
<A.B.C.D> Specifies the IP address of the remote server in
Description
dotted-decimal notation.
The default address is 0.0.0.0.
no logging remote address command
The no logging remote address command clears the IP address of
the remote server. The syntax for the no logging remote address
command is:
no logging remote address
The no logging remote address command is in the config command
mode.
Nortel Ethernet Switch 460/470
Configuration — System Monitoring
NN47210-503 01.01 Standard
Copyright © 2005-2007, Nortel Networks Nortel Networks Confidential
.
3.7 22 February 2007
Page 38

38 Chapter 2 Configuring network monitoring using CLI
The no logging remote address command has no parameters or
variables.
logging remote level command
The logging remote level command sets the severity level of the
logs you send to the remote server. The syntax for the logging remote
level command is:
logging remote level {critical | informational | serious}
The logging remote level command is in the config command mode.
Table 11 "logging remote level command parameters and variables" (page
38) describes the parameters and variables for the logging remote
level command.
Table 11 logging remote level command parameters and variables
Parameters and
variables
{critical | serious |
informational}
Description
Specifies the severity level of the log messages sent
to the remote server:
•
critical
•
informational
•
serious
There is no default value for this command.
no logging remote level command
The no logging remote level command removes any severity level of
the log messages that you send to the remote server; it reverts to None.
The syntax for the no logging remote level command is:
no logging remote level
The no logging remote level command is in the config command
mode.
The no logging remote level command has no parameters or
variables.
Nortel Ethernet Switch 460/470
Configuration — System Monitoring
NN47210-503 01.01 Standard
Copyright © 2005-2007, Nortel Networks Nortel Networks Confidential
.
3.7 22 February 2007
Page 39

default logging remote level command
The default logging remote level command sets the severity level
of the logs you send to the remote server to the default value, which is None.
The syntax for the default logging remote level command is:
default logging remote level
The default logging remote level command is in the config
command mode.
The default logging remote level command has no parameters
or variables.
Using port mirroring
Note: For guidelines to port mirroring, refer to "Port mirroring" (page 17).
You use port mirroring to monitor traffic. This section covers the following
commands:
•
"show port-mirroring command" (page 39)
Using port mirroring 39
•
"port-mirroring command" (page 40)
• "no port-mirroring command" (page 41)
show port-mirroring command
The show port-mirroring command displays the port mirroring
configuration. The syntax for the show port-mirroring command is:
show port-mirroring
The show port-mirroring command is in the privExec command mode.
The show port-mirroring command has no parameters or variables.
Figure 10 "show port-mirroring command output" (page 39) displays sample
output from the show port-mirroring command.
Figure 10 show port-mirroring command output
Nortel Ethernet Switch 460/470
Configuration — System Monitoring
NN47210-503 01.01 Standard
Copyright © 2005-2007, Nortel Networks Nortel Networks Confidential
.
3.7 22 February 2007
Page 40

40 Chapter 2 Configuring network monitoring using CLI
port-mirroring command
The port-mirroring command sets the port mirroring configuration. The
syntax of the port-mirroring command is:
port-mirroring mode
{disable |
Xrx monitor-port <portlist> mirror-port-X <portlist> |
Xtx monitor-port <portlist> mirror-port-X <portlist> |
XrxOrXtx monitor-port <portlist>
mirror-port-X <portlist> mirror-port-Y <portlist> |
XrxOrYtx monitor-port <portlist>
mirror-port-X <portlist> mirror-port-Y <portlist> |
XrxYtx monitor-port <portlist>
mirror-port-X <portlist> mirror-port-Y <portlist> |
XrxYtxOrYrxXtx monitor-port <portlist>
mirror-port-X <portlist> mirror-port-Y <portlist> |
Asrc monitor-port <portlist> mirror-MAC-A <macaddr> |
Adst monitor-port <portlist> mirror-MAC-A <macaddr> |
AsrcOrAdst monitor-port <portlist>
mirror-MAC-A <macaddr> |
AsrcBdst monitor-port <portlist>
mirror-MAC-A <macaddr> mirror-MAC-B <macaddr> |
AsrcBdstOrBsrcAdst monitor-port <portlist>
mirror-MAC-A <macaddr> mirror-MAC-B <macaddr>}
Note: In this command, portlist must specify only a single port.
The port-mirroring command is in the config command mode.
Table 12 "port-mirroring command parameters and variables" (page
40) describes the parameters and variables for the port-mirroring
command.
Table 12 port-mirroring command parameters and variables
Parameters and
variables
disable
monitor-port
mirror-port-X
mirror-port-Y
mirror-MAC-A
mirror-MAC-B
portlist
Xrx
Description
Disables port mirroring.
Specifies the monitor port.
Specifies the mirroring port X.
Specifies the mirroring port Y.
Specifies the mirroring MAC address A.
Specifies the mirroring MAC address B.
Enter the port number.
Mirror packets received on port X.
Nortel Ethernet Switch 460/470
Configuration — System Monitoring
NN47210-503 01.01 Standard
Copyright © 2005-2007, Nortel Networks Nortel Networks Confidential
.
3.7 22 February 2007
Page 41

Displaying port statistics 41
Parameters and
variables
Xtx
XrxOrXtx
XrxYtx
XrxYtxOrXtxYrx
macaddr
Asrc
Adst
AsrcOrAdst
AsrcBdst
AsrcBdstOrBsrcAdst
Description
Mirror packets transmitted on port X.
Mirror packets received or transmitted on port X.
Mirror packets received on port X and transmitted on port Y.
Note: Do not use this mode for mirroring broadcast and multicast
traffic.
Mirror packets received on port X and transmitted on port Y or
packets received on port Y and transmitted on port X.
Note: Do not use this mode for mirroring broadcast and multicast
traffic.
Enter the MAC address in format H.H.H.
Mirror packets with source MAC address A.
Mirror packets with destination MAC address A.
Mirror packets with source or destination MAC address A.
Mirror packets with source MAC address A and destination MAC
address B.
Mirror packets with source MAC address A and destination MAC
address B or packets with source MAC address B and destination
MAC address A.
no port-mirroring command
The no port-mirroring command disables port mirroring. The syntax
of the no port-mirroring command is:
no port-mirroring
The no port-mirroring command is in the config command mode.
The no port-mirroring command has no parameters or variables.
Displaying port statistics
You can display the statistics for a port for both received and transmitted
traffic. This section covers:
•
"show port-statistics command" (page 42)
•
"clear-stats command" (page 43)
Nortel Ethernet Switch 460/470
Configuration — System Monitoring
NN47210-503 01.01 Standard
Copyright © 2005-2007, Nortel Networks Nortel Networks Confidential
.
3.7 22 February 2007
Page 42

42 Chapter 2 Configuring network monitoring using CLI
show port-statistics command
The show port-statistics command displays the statistics for the
port on both received and transmitted traffic. The syntax for the show
port-statistics command is:
show port-statistics [port <portlist>]
The show port-statistics command is in the config-if command
mode.
Table 13 "show port-statistics command parameters and variables"
(page 42) describes the parameters and variables for the show
port-statistics command.
Table 13 show port-statistics command parameters and variables
Parameters and
variables
port <portlist>
Description
Specifies the port numbers for which to display
statistics.
Note: If you omit this parameter, the system uses the
port number specified with the interface command.
Figure 11 "show port-statistics command output" (page 43) displays sample
output from the show port-statistics command.
Nortel Ethernet Switch 460/470
Configuration — System Monitoring
NN47210-503 01.01 Standard
Copyright © 2005-2007, Nortel Networks Nortel Networks Confidential
.
3.7 22 February 2007
Page 43

Figure 11 show port-statistics command output
Displaying port statistics 43
clear-stats command
The clear-stats command clears all statistical information for the
specified port. All counters are set to zero (0). The syntax for the
clear-stats command is:
clear-stats [port <portlist>]
The clear-stats command is in the config-if command mode.
Nortel Ethernet Switch 460/470
Configuration — System Monitoring
NN47210-503 01.01 Standard
Copyright © 2005-2007, Nortel Networks Nortel Networks Confidential
.
3.7 22 February 2007
Page 44

44 Chapter 2 Configuring network monitoring using CLI
Table 14 "clear-stats command parameters and variables" (page 44)
describes the parameters and variables for the clear-stats command.
Table 14 clear-stats command parameters and variables
Parameters and
variables
port <portlist>
Description
Specifies the port numbers to clear of statistical
information; enter the port numbers.
Note: If you omit this parameter, the system uses the
port number specified with the interface command.
Nortel Ethernet Switch 460/470
Configuration — System Monitoring
NN47210-503 01.01 Standard
Copyright © 2005-2007, Nortel Networks Nortel Networks Confidential
.
3.7 22 February 2007
Page 45

Chapter 3
Configuring network monitoring using
Device Manager
You can use the Device Manager to configure system logging and to display
chassis and port statistics for the Ethernet Switches 460 and 470.
This section contains the following topics:
•
"System Log Settings tab" (page 45)
•
"Remote System Log tab" (page 47)
•
"Graphing chassis statistics" (page 49)
•
"Graphing port statistics" (page 56)
System Log Settings tab
To view System Log Settings information:
45
Step Action
1
Copyright © 2005-2007, Nortel Networks Nortel Networks Confidential
.
From the Device Manager menu bar, select Edit > Diagnostics >
System Log.
The SysLog dialog box opens with the System Log Settings tab
displayed. (Figure 12 "System Log Settings tab" (page 46)).
Nortel Ethernet Switch 460/470
Configuration — System Monitoring
NN47210-503 01.01 Standard
3.7 22 February 2007
Page 46

46 Chapter 3 Configuring network monitoring using Device Manager
Figure 12 System Log Settings tab
—End—
Table 15 "System Log Settings tab items" (page 46) describes the System
Log Settings tab items.
Table 15 System Log Settings tab items
Items Description
Operation Specifies the storing or discarding of generated log
messages. Specifying On causes log messages to be
stored in the log message buffer facility. Specifying Off
discontinues the storing of log messages. Previously
collected log messages remain stored in the buffer
facility until they are manually cleared or the system
is reset. Resets do not clear log messages that have
been saved in non-volatile storage.
BufferFullAction Specifies overwriting of previous log messages, where
messages are overwritten based on FIFO, or specifies
that no more messages be saved until the setting is
changed to overwrite.
This applies only to messages that are maintained
in volatile storage. Messages saved in non-volatile
storage are never overwritten, and must be cleared
manually.
Nortel Ethernet Switch 460/470
Configuration — System Monitoring
NN47210-503 01.01 Standard
Copyright © 2005-2007, Nortel Networks Nortel Networks Confidential
.
3.7 22 February 2007
Page 47

Remote System Log tab 47
Items Description
Volatile CurrSize The current number of log messages in the volatile
portion of the system log message facility. Messages
that are classified as volatile are lost upon system
re-initialization.
Volatile Save Targets Specifies the type of log messages to be saved in the
log message buffer facilities. Messages are classified
based on their type:
•
Critical - Specifies that only critical messages be
saved to volatile storage.
•
Critical/Serious - Specifies that both critical and
serious messages be saved to volatile storage.
•
Critical/Serious/Informational - Causes all log
messages be saved when the log message is
entered into the system.
•
None - Specifies that no log messages will be
stored in volatile memory.
Non-Volatile CurrSize The current number of log messages in the non-volatile
Non-Volatile Save
Targets
Action ClearMessag
eBuffers
Remote System Log tab
To view Remote System Log information:
The Remote System Log tab opens.
portion of the system log message facility. Messages
that are classified as non-volatile are not lost upon
system re-initialization.
Specifies the type of log messages to be saved in the
log message buffer facilities. Messages are classified
based on their type:
•
Critical - Specifies that only critical messages be
saved to non-volatile storage.
•
Critical/Serious - Specifies that both critical and
serious messages be saved to non-volatile storage.
•
None - Specifies that no log messages will be
stored in non-volatile memory.
Specifies the type of log messages to clear.
Nortel Ethernet Switch 460/470
Configuration — System Monitoring
NN47210-503 01.01 Standard
Copyright © 2005-2007, Nortel Networks Nortel Networks Confidential
.
3.7 22 February 2007
Page 48

48 Chapter 3 Configuring network monitoring using Device Manager
Step Action
1
From the Device Manager menu bar, select Edit > Diagnostics >
System Log.
The SysLog dialog box opens with the System Log Settings tab
displayed.
2
Click the Remote System Log tab.
The Remote System Log tab opens (Figure 13 "Remote System
Log tab" (page 48)).
Figure 13 Remote System Log tab
—End—
Table 16 "Remote System Log tab items" (page 48) describes the Remote
System Log tab items.
Table 16 Remote System Log tab items
Items Description
Address The IP address where log messages are sent
using the remote syslog facility.
Enabled Specifies that the remote logging feature is
enabled.
SaveTargets Specifies the type of log messages to be sent to a
remote syslog server when they occur. Messages
are classified based on their type:
•
Critical - Specifies that only critical messages
are sent to the remote syslog server.
•
Critical/Serious - Specifies that both critical
and serious messages are sent to the remote
syslog server.
Nortel Ethernet Switch 460/470
Configuration — System Monitoring
NN47210-503 01.01 Standard
Copyright © 2005-2007, Nortel Networks Nortel Networks Confidential
.
3.7 22 February 2007
Page 49

Items Description
Graphing chassis statistics
To graph chassis statistics:
Step Action
Graphing chassis statistics 49
•
Critical/Serious/Informational - Causes all log
messages are sent to the remote syslog server
•
None - Specifies that no log messages are
sent to the remote syslog server.
1
2
Select the chassis.
Do one of the following:
•
From the shortcut menu, choose Graph.
•
From Device Manager main menu, choose Graph > Chassis.
•
On the toolbar, click Graph.
—End—
The following describe the Graph Chassis dialog box tabs with descriptions
of the statistics on each tab.
•
"IP tab" (page 49)
•
"ICMP In tab" (page 53)
•
"ICMP Out tab" (page 54)
Six columns provide the statistics for the counters that are listed on the tab.
IP tab
The IP tab shows IP information for the chassis.
To open the IP tab:
Step Action
1
Copyright © 2005-2007, Nortel Networks Nortel Networks Confidential
.
From the Main Menu, choose Graph > Chassis.
Nortel Ethernet Switch 460/470
Configuration — System Monitoring
NN47210-503 01.01 Standard
3.7 22 February 2007
Page 50

50 Chapter 3 Configuring network monitoring using Device Manager
The Graph Chassis dialog box opens with the SNMP tab displayed
(Figure 14 "Graph Chassis dialog box -- Chassis SNMP tab" (page
50)).
Figure 14 Graph Chassis dialog box -- Chassis SNMP tab
2
Click the IP tab.
The IP tab opens (Figure 15 "Graph Chassis dialog box -- IP tab"
(page 51)).
Nortel Ethernet Switch 460/470
Configuration — System Monitoring
NN47210-503 01.01 Standard
Copyright © 2005-2007, Nortel Networks Nortel Networks Confidential
.
3.7 22 February 2007
Page 51

Figure 15 Graph Chassis dialog box -- IP tab
Graphing chassis statistics 51
—End—
Table 17 "Chassis IP tab fields" (page 51) describes the Chassis IP tab
fields.
Table 17
Chassis IP tab fields
Field Description
InReceives The total number of input datagrams received from
interfaces, including those received in error.
InHdrErrors The number of input datagrams discarded due to errors
in their IP headers, including bad checksums, version
number mismatch, other format errors, time-to-live
exceeded, errors discovered in processing their IP
options.
InAddrErrors The number of input datagrams discarded because the
IP address in the IP header destination field was not a
valid address. This count includes invalid addresses
(for example, 0.0.0.0) and addresses of unsupported
Classes (for example, Class E). For addresses that
are not IP Gateways and therefore do not forward
datagrams, this counter includes datagrams discarded
because the destination address was not a local
address.
Nortel Ethernet Switch 460/470
Configuration — System Monitoring
NN47210-503 01.01 Standard
Copyright © 2005-2007, Nortel Networks Nortel Networks Confidential
.
3.7 22 February 2007
Page 52

52 Chapter 3 Configuring network monitoring using Device Manager
Field Description
ForwDatagrams The number of input datagrams for which this entity
was not their final IP destination, as a result of which
an attempt was made to find a route to forward them to
that final destination. For addresses that do not act as
IP Gateways, this counter includes only those packets
that are Source-Routed by way of this address and
have successful Source-Route option processing.
InUnknownProtos The number of locally addressed datagrams received
successfully but discarded because of an unknown or
unsupported protocol.
InDiscards The number of input IP datagrams for which no
problems were encountered to prevent their continued
processing but that were discarded (for example, for
lack of buffer space). Note that this counter does
not include any datagrams discarded while awaiting
reassembly.
InDelivers The total number of input datagrams successfully
delivered to IP user-protocols (including ICMP).
OutRequests The total number of IP datagrams that local IP
user-protocols (including ICMP) supplied to IP in
requests for transmission. Note that this counter
does not include any datagrams counted in
ipForwDatagrams.
OutDiscards The number of output IP datagrams for which
no problem was encountered to prevent their
transmission to their destination, but that were
discarded (for example, for lack of buffer space).
Note that this counter includes datagrams counted
in ipForwDatagrams if any such packets met this
(discretionary) discard criterion.
OutNoRoutes The number of IP datagrams discarded because
no route could be found to transmit them to their
destination. Notethatthis counter includes any packets
counted in ipForwDatagrams that meet this no-route
criterion. Note that this includes any datagrams a host
cannot route because all of its default gateways are
down.
FragOKs The number of IP datagrams successfully fragmented
at this entity.
FragFails The number of IP datagrams discarded because they
needed to be fragmented at this entity but could not
be; for example, because their Don’t Fragment flag
was set.
Nortel Ethernet Switch 460/470
Configuration — System Monitoring
NN47210-503 01.01 Standard
Copyright © 2005-2007, Nortel Networks Nortel Networks Confidential
.
3.7 22 February 2007
Page 53

Field Description
FragCreates The number of IP datagram fragments generated as a
ReasmReqds The number of IP fragments received that needed to
ReasmOKs Thenumber of IP datagrams successfully reassembled.
ReasmFails The number of failures detected by the IP reassembly
ICMP In tab
To open the ICMP In tab:
Step Action
Graphing chassis statistics 53
result of fragmentation at this entity.
be reassembled at this entity.
algorithm (for whatever reason, such as timed out,
errors.). Note that this is not necessarily a count of
discarded IP fragments because some algorithms
(notably the algorithm in RFC 815) can lose track of
the number of fragments by combining them as they
are received.
1
From the Main Menu, choose Graph > Chassis.
The Graph Chassis dialog box opens with the SNMP tab displayed
(Figure 14 "Graph Chassis dialog box -- Chassis SNMP tab" (page
50)).
2
Click the ICMP In tab.
The ICMP In tab opens (Figure 16 "Graph Chassis dialog box --
ICMP In tab" (page 53)).
Figure 16 Graph Chassis dialog box -- ICMP In tab
Nortel Ethernet Switch 460/470
Configuration — System Monitoring
NN47210-503 01.01 Standard
Copyright © 2005-2007, Nortel Networks Nortel Networks Confidential
.
3.7 22 February 2007
Page 54

54 Chapter 3 Configuring network monitoring using Device Manager
—End—
Table 18 "ICMP In tab fields" (page 54) describes the ICMP In tab fields.
Table 18
ICMP In tab fields
Field Description
SrcQuenchs The number of ICMP Source Quench messages
received.
Redirects The number of ICMP Redirect messages received.
Echos The number of ICMP Echo (request) messages
received.
EchoReps The number of ICMP Echo Reply messages received.
Timestamps The number of ICMP Timestamp (request) messages
received.
TimestampReps The number of ICMP Timestamp Reply messages
received.
AddrMasks The number of ICMP Address Mask Request
AddrMaskReps The number of ICMP Address Mask Reply messages
ParmProbs The number of ICMP Parameter Problem messages
DestUnreachs The number of ICMP Destination Unreachable
TimeExcds The number of ICMP Time Exceeded messages
ICMP Out tab
To open the ICMP Out tab:
Step Action
1 From the Main Menu, choose Graph > Chassis.
messages received.
received.
received.
messages received.
received.
The Graph Chassis dialog box opens with the SNMP tab displayed
(Figure 14 "Graph Chassis dialog box -- Chassis SNMP tab" (page
50)).
2
Copyright © 2005-2007, Nortel Networks Nortel Networks Confidential
.
Click the ICMP Out tab.
Nortel Ethernet Switch 460/470
Configuration — System Monitoring
NN47210-503 01.01 Standard
3.7 22 February 2007
Page 55

Graphing chassis statistics 55
The ICMP Out tab opens (Figure 17 "Graph Chassis dialog box --
ICMP Out tab" (page 55)).
Figure 17 Graph Chassis dialog box -- ICMP Out tab
—End—
Table 19 "ICMP Out tab fields" (page 55) describes the ICMP Out tab fields.
Table 19
ICMP Out tab fields
Field Description
SrcQuenchs The numberof ICMP Source Quenchmessages sent.
Redirects The number of ICMP Redirect messages received. For
a host, this object is always zero, because hosts do
not send redirects.
Echos The number of ICMP Echo (request) messages sent.
EchoReps The number of ICMP Echo Reply messages sent.
Timestamps The number of ICMP Timestamp (request) messages
sent.
TimestampReps The number of ICMP Timestamp Reply messages sent.
AddrMasks The number of ICMP Address Mask Request
messages sent.
AddrMaskReps The number of ICMP Address Mask Reply messages
sent.
ParmProbs The number of ICMP Parameter Problem messages
sent.
Nortel Ethernet Switch 460/470
Configuration — System Monitoring
NN47210-503 01.01 Standard
Copyright © 2005-2007, Nortel Networks Nortel Networks Confidential
.
3.7 22 February 2007
Page 56

56 Chapter 3 Configuring network monitoring using Device Manager
Field Description
DestUnreachs The number of ICMP Destination Unreachable
messages sent.
TimeExcds The number of ICMP Time Exceeded messages sent.
Graphing port statistics
You can graph statistics for either a single port or multiple ports from the
graphPort dialog box. The displays for both single and multiple ports show
the identical statistical items. The only difference is that the display for the
single windows displays the following values simultaneously, while you
select which of the following to display in the multiple port graph dialog box:
• AbsoluteValue
•
Cumulative
•
Average/sec
•
Minimum/sec
•
Maximum/sec
•
LastVal/sec
The illustrations in this section show graphs for multiple ports.
To open the graphPort dialog box for graphing:
Step Action
1
Select the port or ports you want to graph.
To select multiple ports, [Ctrl] + left-click the ports that you want to
configure. A yellow outline appears around the selected ports.
2
Do one of the following:
•
From the Device Manager main menu, choose Graph > Port.
• From the shortcut menu, choose Graph.
•
On the toolbar, click Graph.
—End—
Nortel Ethernet Switch 460/470
Configuration — System Monitoring
NN47210-503 01.01 Standard
Copyright © 2005-2007, Nortel Networks Nortel Networks Confidential
.
3.7 22 February 2007
Page 57

The graphPort dialog box for a single port or for multiple ports opens with
the Interface tab displayed.
Note: Some statistics are available only when you graph a single port.
Interface tab for graphing ports
The Interface tab shows interface parameters for graphing a port or ports.
To open the Interface tab for graphing:
Step Action
1 Select the port or ports you want to graph.
To select multiple ports, [Ctrl] + left-click the ports that you want to
configure. A yellow outline appears around the selected ports.
Graphing port statistics 57
2
Do one of the following:
•
From the Device Manager main menu, choose Graph > Port.
•
From the shortcut menu, choose Graph.
•
On the toolbar, click Graph.
The Port dialog box for a single port or for multiple ports ( Figure 18
"Interface tab for graphing ports" (page 57)) opens with the Interface
tab displayed.
Figure 18 Interface tab for graphing ports
—End—
Nortel Ethernet Switch 460/470
Configuration — System Monitoring
NN47210-503 01.01 Standard
Copyright © 2005-2007, Nortel Networks Nortel Networks Confidential
.
3.7 22 February 2007
Page 58

58 Chapter 3 Configuring network monitoring using Device Manager
Table 20 "Port Interface tab fields for multiple ports" (page 58) describes the
Interface tab fields for graphing ports.
Table 20
Port Interface tab fields for multiple ports
Field Description
InOctets The total number of octets received on the interface,
including framing characters.
OutOctets The total number of octets transmitted out of the
interface, including framing characters.
InUcastPkts The number of packets delivered by this sublayer to a
higher sublayer that were not addressed to a multicast
or broadcast address at this sublayer.
OutUcastPkts The number of packets that higher-level protocols
requested be transmitted that were not addressed to a
multicast address at this sublayer. This total number
includes those packets discarded or unsent.
InNUcastPkts The number of packets delivered by this sublayer to a
higher (sub)layer that were addressed to amulticast or
broadcast address at this sublayer.
OutNUcastPkts The total number of packets that higher-level protocols
requested be transmitted, and that were addressed
to a multicast or broadcast address at this sublayer,
including those that were discarded or not sent.
InDiscards The number of inbound packets that were chosen to
be discarded even though no errors had been detected
to prevent their being deliverable to a higher-layer
protocol. One possible reason for discarding such a
packet is to free up buffer space.
OutDiscards The number of outbound packets which were chosen to
be discarded even though no errors had been detected
to prevent their being transmitted. One possible reason
for discarding such a packetis to free up buffer space.
InErrors For packet-oriented interfaces, the number of inbound
packets that contained errors preventing them from
being deliverable to a higher-layer protocol. For
character-oriented or fixed-length interfaces, the
number of inbound transmission units that contained
errors preventing them from being deliverable to a
higher-layer protocol.
Nortel Ethernet Switch 460/470
Configuration — System Monitoring
NN47210-503 01.01 Standard
Copyright © 2005-2007, Nortel Networks Nortel Networks Confidential
.
3.7 22 February 2007
Page 59

Field Description
OutErrors For packet-oriented interfaces, the number of outbound
packets that were not transmitted because of errors.
For character-oriented or fixed-length interfaces, the
number of outbound transmission units that could not
be transmitted because of errors.
InUnknownProtos For packet-oriented interfaces, the number of packets
received through the interface that were discarded
because of an unknown or unsupported protocol.
For character-oriented or fixed-length interfaces
that support protocol multiplexing, the number of
transmission units received through the interface
that were discarded because of an unknown or
unsupported protocol. For any interface that does not
support protocol multiplexing, this counter is always 0.
Ethernet Errors tab for graphing ports
The port Ethernet Errors tab shows port Ethernet Errors statistics.
To open the Ethernet Errors tab for graphing:
Graphing port statistics 59
Step Action
1
Select the port or ports you want to graph.
To select multiple ports, [Ctrl] + left-click the ports that you want to
configure. A yellow outline appears around the selected ports.
2
Do one of the following:
• From the Device Manager main menu, choose Graph > Port.
•
From the shortcut menu, choose Graph.
•
On the toolbar, click Graph.
The Port dialog box for a single port or for multiple ports opens with
the Interface tab displayed.
3
Click the Ethernet Errors tab.
The Port Ethernet Errors tab (Figure 19 "Graph Port dialog box --
Port Ethernet Errors tab" (page 60)) opens.
Nortel Ethernet Switch 460/470
Configuration — System Monitoring
NN47210-503 01.01 Standard
Copyright © 2005-2007, Nortel Networks Nortel Networks Confidential
.
3.7 22 February 2007
Page 60

60 Chapter 3 Configuring network monitoring using Device Manager
Figure 19 Graph Port dialog box -- Port Ethernet Errors tab
—End—
Table 21 "Ethernet Errors tab fields" (page 60) describes the Port Ethernet
Errors tab fields.
Table 21
Ethernet Errors tab fields
Field Description
AlignmentErrors A count of frames received on a particular
interface that are not an integral number of octets
in length and do not pass the FCS check. The
count represented by an instance of this object
is incremented when the alignmentError status
is returned by the MAC service to the LLC (or
other MAC user). Received frames for which
multiple error conditions occur are, according to
the conventions of IEEE 802.3 Layer Management,
counted exclusively according to the error status
presented to the LLC.
FCSErrors A count of frames received on a particular interface
that are an integral number of octets in length but
do not pass the FCS check. Thecount represented
by an instance of this object is incremented when
the Frame Check Error status is returned by the
MAC service to the LLC (or other MAC user).
Received frames for which multiple error conditions
occur are, according to the conventions of IEEE
802.3 Layer Management, counted exclusively
according to the error status presented to the LLC.
InternalMacTransmitErrorsA count of frames for which transmission on a
particular interface fails due to an internal MAC
sublayer transmit error. A frame is only counted by
an instance of this object if it is not counted by the
corresponding instance of either the LateCollisions
object, the ExcessiveCollisions object, or the
CarrierSenseErrors object.
Nortel Ethernet Switch 460/470
Configuration — System Monitoring
NN47210-503 01.01 Standard
Copyright © 2005-2007, Nortel Networks Nortel Networks Confidential
.
3.7 22 February 2007
Page 61

Field Description
Graphing port statistics 61
InternalMacReceiveErro
rs
A count of frames for which reception on a
particular interface fails due to an internal MAC
sublayer receive error. A frame is only counted
by an instance of this object if it is not counted
by the corresponding instance of either the
FrameTooLongs object, the AlignmentErrors
object, or the FCSErrors object.
The precise meaning of the count represented
by an instance of this object is implementation
specific. Inparticular, an instance of this object can
represent a count of receive errors on a particular
interface that are not otherwise counted.
CarrierSenseErrors The number of times that the carrier sense
condition was lost or never asserted when
attempting to transmit a frame on a particular
interface. The count represented by an instance
of this object is incremented at most once per
transmission attempt, even if the carrier sense
condition fluctuates during a transmission attempt.
FrameTooLongs A count of frames received on a particular interface
that exceed the maximum permitted frame size.
The count represented by an instance of this
object is incremented when the frameTooLong
status is returned by the MAC service to the LLC
(or other MAC user). Received frames for which
multiple error conditions occur are, according to
the conventions of IEEE 802.3 Layer Management,
counted exclusively according to the error status
presented to the LLC.
SQETestErrors A count of times that the SQE TEST ERROR
message is generated by the PLS sublayer for
a particular interface. The SQE TEST ERROR
message is defined in section 7.2.2.2.4 of
ANSI/IEEE 802.3-1985 and its generation is
described in section 7.2.4.6 of the same document.
DeferredTransmissions A count of frames for which the first transmission
attempt ona particular interface is delayed because
the medium is busy. The count represented by an
instance of this object does not include frames
involved in collisions.
Nortel Ethernet Switch 460/470
Configuration — System Monitoring
NN47210-503 01.01 Standard
Copyright © 2005-2007, Nortel Networks Nortel Networks Confidential
.
3.7 22 February 2007
Page 62

62 Chapter 3 Configuring network monitoring using Device Manager
Field Description
SingleCollisionFrames A count of successfully transmitted frames on
a particular interface for which transmission
is inhibited by exactly one collision. A
frame that is counted by an instance of this
object is also counted by the corresponding
instance of either the ifOutUcastPkts,
ifOutMulticastPkts, or ifOutBroadcastPkts, and is
not counted by the corresponding instance of the
MultipleCollisionFrames object.
MultipleCollisionFrames A count of successfully transmitted frames on
a particular interface for which transmission
is inhibited by more than one collision. A
frame that is counted by an instance of this
object is also counted by the corresponding
instance of either the ifOutUcastPkts,
ifOutMulticastPkts, or ifOutBroadcastPkts, and is
not counted by the corresponding instance of the
SingleCollisionFrames object.
LateCollisions The number of times that a collision is detected on
a particular interface later than 512 bit-times into
the transmission of a packet. Five hundred and
twelve bit-times corresponds to 51.2 microseconds
on a 10 Mb/s system. A (late) collision included in
a count represented by an instance of this object
is also considered as a (generic) collision for
purposes of other collision-related statistics.
ExcessiveCollisions A count of frames for which transmission on a
particular interface fails due to excessive collisions.
Poll Interval Statistics are updated based on the poll interval.
Default: 10s
Range: None, 2s, 5s, 10s, 30s, 1m, 5m, 30m 1h
Bridge tab for graphing ports
The Bridge tab displays port frame statistics.
To open the Bridge tab for graphing:
Step Action
1
Copyright © 2005-2007, Nortel Networks Nortel Networks Confidential
.
Select the port or ports you want to graph.
To select multiple ports, [Ctrl] + left-click the ports that you want to
configure. A yellow outline appears around the selected ports.
Nortel Ethernet Switch 460/470
Configuration — System Monitoring
NN47210-503 01.01 Standard
3.7 22 February 2007
Page 63

Graphing port statistics 63
2
Do one of the following:
•
From the Device Manager main menu, choose Graph > Port.
•
From the shortcut menu, choose Graph.
•
On the toolbar, click Graph.
The Port dialog box for a single port or for multiple ports opens with
the Interface tab displayed.
3
Click the Bridge tab.
The Bridge tab for graphing ports opens (Figure 20 "Graph Port
dialog box -- Bridge tab" (page 63)).
Figure 20 Graph Port dialog box -- Bridge tab
—End—
Table 22 "Bridge tab fields" (page 63) describes the Bridge tab fields.
Table 22
Bridge tab fields
Field Description
DelayExceededDiscards Number of frames discarded by the port due to
excessive transit delays through the bridge. It is
incremented by both transparent and source route
bridges.
MtuExceededDiscards Number of frames discarded by the port due
to an excessive size. It is incremented by both
transparent and source route bridges.
InFrames The number of frames received by this port from
its segment.
Nortel Ethernet Switch 460/470
Configuration — System Monitoring
NN47210-503 01.01 Standard
Copyright © 2005-2007, Nortel Networks Nortel Networks Confidential
.
3.7 22 February 2007
Page 64

64 Chapter 3 Configuring network monitoring using Device Manager
Field Description
OutFrames The number of frames received by this port from
its segment.
InDiscards Count of valid frames received that were discarded
(filtered) by the Forwarding Process.
Nortel Ethernet Switch 460/470
Configuration — System Monitoring
NN47210-503 01.01 Standard
Copyright © 2005-2007, Nortel Networks Nortel Networks Confidential
.
3.7 22 February 2007
Page 65

Chapter 4
Configuring network monitoring using
Web-based management
You can configure network monitoring features using Web-based
management.
This chapter contains information on the following topics:
•
"Viewing the system log" (page 65)
•
"Configuring port mirroring" (page 67)
•
"Viewing system statistics" (page 71)
•
"Monitoring MLT traffic" (page 81)
Viewing the system log
You can view a display of messages contained in Non-Volatile Memory or
Dynamic Random Access Memory (DRAM).
65
To open the System Log page:
Step Action
1
Copyright © 2005-2007, Nortel Networks Nortel Networks Confidential
.
From the main menu, choose Fault > System Log.
The System Log page opens (Figure 21 "System Log page" (page
66)).
Nortel Ethernet Switch 460/470
Configuration — System Monitoring
NN47210-503 01.01 Standard
3.7 22 February 2007
Page 66

66 Chapter 4 Configuring network monitoring using Web-based management
Figure 21 System Log page
Table 23 "System Log page fields" (page 66) describes the fields
on the System Log page.
Table 23
System Log page fields
Section
System Log
(View By)
Item Range Description
Display Unit
1..8
Choose the unit on which to
display messages or clear
messages.
Display Messag
es From
(1) Non Volatile
(2) Volatile + Non
Volatile
Choose to display messages
from Non Volatile Memory
or Volatile (DRAM) and Non
Volatile memory.
The default setting is Non
Volatile.
Clear Messages
From
(1) Volatile
(2) Volatile + Non
Volatile
Choose to clear messages from
Volatile memory or Volatile and
Non Volatile memory.
(3) None
The default setting is None (do
not clear messages).
Nortel Ethernet Switch 460/470
Configuration — System Monitoring
NN47210-503 01.01 Standard
Copyright © 2005-2007, Nortel Networks Nortel Networks Confidential
.
3.7 22 February 2007
Page 67

Configuring port mirroring 67
Section
System Log
Item Range Description
Index The number of the event.
Time Stamp The time, in hundreths of
a second, between system
initialization and the time the log
messages entered the system.
Message Type The type of message. The
options are (1) Critical, (2)
Serious, and (3) Informational.
Message A character string that identifies
the origin of the message and
the reason why the message
was generated.
2
In the System Log (View By)section do one or more of the following:
•
Choose the number of the unit from which to display messages.
•
Choose to display messages from both volatile and non-volatile
memory or from non-volatile memory only.
• Choose to clear messages from both volatile and non-volatile
memory, from non-volatile memory only, or from neither.
3
Click Submit.
The results of your request are displayed in the System Log section
(Figure 21 "System Log page" (page 66)).
Configuring port mirroring
The Ethernet Switches support port mirroring to analyze traffic. You can
view existing port mirroring activity, and you can configure a specific switch
port to mirror up to two specified ports or two MAC addresses. When you
configure port mirroring, you have the option to specify either port-based
monitoring or address-based monitoring.
In a stack configuration, you can monitor ports that reside on different units
within the stack.
To configure port mirroring:
Step Action
1
From the main menu, choose Application > Port Mirroring.
—End—
Nortel Ethernet Switch 460/470
Configuration — System Monitoring
NN47210-503 01.01 Standard
Copyright © 2005-2007, Nortel Networks Nortel Networks Confidential
.
3.7 22 February 2007
Page 68

68 Chapter 4 Configuring network monitoring using Web-based management
The Port Mirroring page opens (Figure 22 "Port Mirroring page"
(page 68)).
Figure 22 Port Mirroring page
Note: The Port Mirroring Active section of Figure 22 "Port
Mirroring page" (page 68) displays only the port mirroring
configurations you set. If you set no port mirroring configurations,
the section does not display any rows.
Table 24 "Port Mirroring page items" (page 68) describes the items
on the Port Mirroring page.
Table 24 Port Mirroring page items
Item Range Description
Monitoring Mode (1) Disabled
(2) --> Port X
(3) Port X -->
(4)<-- --> Port X
(5) -->Port X or Port Y -->
(6) -->Port X and Port Y -->
(7) <-- --> Port X and <-- --> Port
Y
(8) Address A --> any Address
(9) any Address --> Address A
(10) <-- --> Address A
(11) Address A --> Address B
(12) Address A <-- --> Address
B
Choose any one of the six port-based
monitoring modes or any one of the five
address-based monitoring modes.
For more information on selecting one of
the six port-based modes that activates the
port X and port Y screen fields, where you
can choose up to two ports to monitor, see
Table 25 "Port-based monitoring modes"
(page 70).
For more information on selecting one
of the five address-based modes that
activates the Address A and Address
B screen fields, where you can specify
Nortel Ethernet Switch 460/470
Configuration — System Monitoring
NN47210-503 01.01 Standard
Copyright © 2005-2007, Nortel Networks Nortel Networks Confidential
.
3.7 22 February 2007
Page 69

Item Range Description
MAC addresses to monitor, see Table 26
"Address-based monitoring modes" (page
71).
The default setting is Disabled.
Port-based
monitoring
Configuring port mirroring 69
Monitor Port
1..24
Choose the switch port to designate as the
monitor port.
Port X
1..24
Choose the first switch port to be monitored
by the designated monitor port. This port
is monitored according to the value "X" in
the Monitoring Mode field.
Port Y
1..24
Choose the second switch port to be
monitored by the designated monitor port.
This port is monitored according to the
value "Y" in the Monitoring Mode field.
Address-based
monitoring
Address A XX-XX-XX-XX-XX-XX Type the MAC address to be monitored by
the designated monitor port. This address
is monitored according to the value
"Address A" in the MonitoringMode field.
Address B XX-XX-XX-XX-XX-XX Type the MAC address to be monitored by
the designated monitor port. This address
is monitored according to the value
"Address B" in the MonitoringMode field.
2
Type information in the text boxes, or select from a list.
3
Click Submit.
Selecting one of the port-based monitoring modes activates the port
X or the port Y screen fields or both, where you can choose up to
two ports to monitor.
Nortel Ethernet Switch 460/470
Configuration — System Monitoring
NN47210-503 01.01 Standard
Copyright © 2005-2007, Nortel Networks Nortel Networks Confidential
.
3.7 22 February 2007
Page 70

70 Chapter 4 Configuring network monitoring using Web-based management
Table 25 "Port-based monitoring modes" (page 70) describes the
port-based monitoring modes.
Table 25 Port-based monitoring modes
Item Description
Disabled Choose this option to disable port-based monitoring.
The default setting is Disabled.
--> Port X Choose this option to monitor all traffic received by port X.
Port X --> Choose this option to monitor all traffic transmitted by
port X.
<-- --> Port X Choose this option to monitor all traffic received and
transmitted by port X.
--> Port X or Port Y --> Choose this option to monitor all traffic received by port
X or transmitted by port Y.
Note: Do not use this mode for multicast and broadcast
traffic.
--> Port X and Port Y --> Choose this option to monitor all traffic received by port X
(destined to port Y) and then transmitted by port Y (one
way conversation steering).
Note: Do not use this mode for multicast and broadcast
traffic
<-- --> Port X and Port Y <-- --> Choose this option to monitor all traffic received by port
X and then transmitted by port Y or transmitted by port X
and received by port Y (two way conversation steering).
Note: Do not use this mode for multicast and broadcast
traffic
Selecting any one of the address-based monitoring modes activates
the Address A and Address B screen fields, where you can specify
MAC addresses to monitor.
Nortel Ethernet Switch 460/470
Configuration — System Monitoring
NN47210-503 01.01 Standard
Copyright © 2005-2007, Nortel Networks Nortel Networks Confidential
.
3.7 22 February 2007
Page 71

Viewing system statistics 71
Table 26 "Address-based monitoring modes" (page 71) describes
the address-based monitoring modes.
Table 26 Address-based monitoring modes
Item Description
Disabled Choose this option to disable port-based monitoring.
The default setting is Disabled.
Address A --> any Address Choose this option to monitor all traffic transmitted from
Address A to any address.
any Address --> Address A Choose this option to monitor all traffic received by Address A
from any address.
<-- --> Address A Choose this option to monitor all traffic received by or
transmitted by Address A.
Address A --> Address B Choose this option to monitor all traffic transmitted by Address
A that goes to Address (one way conversation steering).
Address A <-- --> Address B Choose this option to monitor all traffic received by Address A
and then transmitted by Address B or transmitted by Address A
and received by Address B (two way conversation steering).
Viewing system statistics
The options available to monitor system statistical data are:
•
"Viewing port statistics" (page 71)
•
"Viewing all port errors" (page 74)
•
"Viewing interface statistics" (page 76)
•
"Viewing Ethernet error statistics" (page 77)
•
"Viewing transparent bridging statistics" (page 79)
Viewing port statistics
You can view detailed statistics about a selected switch port in a stacked
or stand-alone configuration. Both received and transmitted statistics are
displayed so that you can compare throughput or other port parameters.
To view statistical data about a selected switch port:
—End—
Nortel Ethernet Switch 460/470
Configuration — System Monitoring
NN47210-503 01.01 Standard
Copyright © 2005-2007, Nortel Networks Nortel Networks Confidential
.
3.7 22 February 2007
Page 72

72 Chapter 4 Configuring network monitoring using Web-based management
Step Action
1
From the main menu, choose Statistics > Port.
The Port page opens (Figure 23 "Port page" (page 72)).
Figure 23 Port page
Table 27 "Port page items" (page 72) describes the items on the
Port page.
Table 27 Port page items
Section
Item Description
Unit The number of the switch to monitor.Port Statistics
(View By)
Port The switch port number to monitor.
Packets The number of packets received/transmitted on this
Port Statistics
Table
port, including bad packets, broadcast packets, and
multicast packets.
Multicast The number of good multicast packets
received/transmitted on this port, excluding
broadcast packets.
Broadcasts The number of good broadcast packets
received/transmitted on this port.
Total Octets The number of octets of data received/transmitted on
this port, including data in bad packets and Frame
Check Sequence (FCS) octets, and framing bits.
Nortel Ethernet Switch 460/470
Configuration — System Monitoring
NN47210-503 01.01 Standard
Copyright © 2005-2007, Nortel Networks Nortel Networks Confidential
.
3.7 22 February 2007
Page 73

Viewing system statistics 73
Section
Item Description
Lost Packets The number of packets discarded on this port when
the capacity of the port transmit buffer was exceeded.
Packets = 64 bytes The number of packets this size received/transmitted
successfully on this port.
Packets 65-127 bytes The number of packets this size received/transmitted
successfully on this port.
Packets 128-255
bytes
Packets 256-511
bytes
Packets 512-1023
bytes
Packets 1024-1518
bytes
The number of packets this size received/transmitted
successfully on this port.
The number of packets this size received/transmitted
successfully on this port.
The number of packets this size received/transmitted
successfully on this port.
The number of packets this size received/transmitted
successfully on this port.
FCS Errors The number of valid-size packets received on this
port with proper framing but discarded because of
cyclic redundancy check (CRC) errors.
Undersized Packets The number of packets received on this port with
fewer than 64 bytes and with proper CRC and
framing (also known as short frames or runts).
Oversized Packets The number of packets received on this port with
proper CRC and framing that meet the following
requirements:
•
1518 bytes if no VLAN tag exists
•
1522 bytes if a VLAN tag exists
Filtered Packets The number of packets filtered, but not forwarded
on this port.
Flooded Packets The number of packets flooded (forwarded) through
this port because the destination address was not
recognized in the address database.
Frame Errors The number of valid-size packets received on this
port but discarded because of CRC errors and
improper framing.
Collisions The number of collisions detected on this port.
Single Collisions The number of packets transmitted successfully on
this port after a single collision.
Nortel Ethernet Switch 460/470
Configuration — System Monitoring
NN47210-503 01.01 Standard
Copyright © 2005-2007, Nortel Networks Nortel Networks Confidential
.
3.7 22 February 2007
Page 74

74 Chapter 4 Configuring network monitoring using Web-based management
Section
Item Description
Multiple Collisions The number of packets transmitted successfully on
this port after more than one collision.
Excessive Collisions The number of packets lost on this port due to
excessive collisions.
Deferred Packets The number of frames delayed on the first
transmission attempt, but that never incurred a
collision.
Late Collisions The number of packet collisions that occurred after a
total length of time exceeding 512 bit-times of packet
transmission.
2
In the Port Statistics section, choose the unit number and its port
number.
3
Click Submit.
The Port Statistics Table is updated with information about the
selected device and port (Figure 23 "Port page" (page 72)).
4
To update the statistical information, click Update.
—End—
Zeroing ports
To clear the statistical information for the currently displayed port:
è Click Zero Port.
To clear the statistical information for all ports in a switch or stack
configuration:
è Click Zero All Ports.
Viewing all port errors
You can view all ports in the entire stack that have an error. If a particular
port has no errors, it is not displayed.
To view a summary of the port errors for the Ethernet Switch:
Step Action
1 From the main menu, choose Statistics > Port Error Summary.
The Port Error Summary page opens (Figure 24 "Port Error
Summary page" (page 75)).
Nortel Ethernet Switch 460/470
Configuration — System Monitoring
NN47210-503 01.01 Standard
Copyright © 2005-2007, Nortel Networks Nortel Networks Confidential
.
3.7 22 February 2007
Page 75

Viewing system statistics 75
Figure 24 Port Error Summary page
Table 28 "Port Error Summary Table fields" (page 75) describes the
read-only information displayed in the Port Error Summary Table.
Table 28
Port Error Summary Table fields
Item Description
Unit Displays the unit number in the stack.
Port Displays the port number of the unit.
Status Displays the status of the port
(Enabled/Disabled).
Link Displays the link status of the port
(Up/Down).
Speed/Duplex Displays the speed at which the port
is operating, as well as whether it is in
half- or full-duplex mode.
Frame Errors Displays the number of frame errors
received on this port.
FCS Errors Displays the number of frame check
sequence (FCS) errors received on
this port.
Late Collisions Displays the number of late collisions
errors received on this port.
Multiple Collisions Displays the number of multiple
collisions errors received on this port.
Excessive Collisions Displays the number of excessive
collisions errors received on this port.
2
To view the latest port statistics, click the Update button at the
bottom of the page.
—End—
Nortel Ethernet Switch 460/470
Configuration — System Monitoring
NN47210-503 01.01 Standard
Copyright © 2005-2007, Nortel Networks Nortel Networks Confidential
.
3.7 22 February 2007
Page 76

76 Chapter 4 Configuring network monitoring using Web-based management
Viewing interface statistics
You can view selected switch interface statistics.
To view statistical information for an interface:
Step Action
1
From the main menu, choose Statistics > Interface.
The Interface page opens (Figure 25 "Interface page" (page 76)).
Figure 25 Interface page
Table 29 "Interface page items" (page 76) describes the items on
the Interface page.
Table 29 Interface page items
Item Description
Port The port number corresponding to the selected switch.
In Octets The number of octets received on the interface, including framing
characters.
Out Octets The number of octets transmitted out of the interface, including framing
characters.
In Unicast The number of subnetwork-unicast packets delivered to a higher-layer
protocol.
Out Unicast The number of packets that higher-layer protocols requested be
transmitted to a subnetwork-unicast address, including those discarded
or not sent.
In Non-Unicast The number of non-unicast packets, for example, subnetwork-broadcast
or subnetwork-multicast packets, delivered to a higher protocol.
Nortel Ethernet Switch 460/470
Configuration — System Monitoring
NN47210-503 01.01 Standard
Copyright © 2005-2007, Nortel Networks Nortel Networks Confidential
.
3.7 22 February 2007
Page 77

Viewing system statistics 77
Item Description
Out Non-Unicast The number of packets that higher-level protocols requested
be transmitted to a non-unicast address. For example, a
subnetwork-broadcast or a subnetwork multicast address, including those
discarded or not sent.
In Discards The number of inbound packets selected to be discarded even though no
errors were detected to prevent their delivery to a higher-layer protocol.
Packet discarding is not arbitrary. One reason for discarding packets is
to free buffer space.
Out Discards The number of outbound packets selected to be discarded even though
no errors were detected to prevent their being transmitted. Packet
discarding is not arbitrary. One reason for discarding packets is to free
buffer space.
In Errors The number of inbound packets that contained errors preventing them
from being deliverable to a higher-layer protocol.
Out Errors The number of outbound packets not transmitted because of errors.
In Unknown Protos The number of packets received through the interface that were discarded
because of an unknown or unsupported protocol.
2
In the upper-left hand corner, click on the unit number of the device
to monitor.
The page is updated with the information for the selected device
(Figure 25 "Interface page" (page 76)).
3
4
To update the statistical information, click Update.
To update the statistical information, click Update, or click Back to
return to the Interface page.
Viewing Ethernet error statistics
You can view Ethernet error statistics for each monitored interface linked to
the Ethernet Switches 460 and 470.
To view Ethernet error statistics:
Step Action
1
From the main menu, choose Statistics > Ethernet Errors.
The Ethernet Errors page opens (Figure 26 "Ethernet Errors page"
(page 78)).
—End—
Nortel Ethernet Switch 460/470
Configuration — System Monitoring
NN47210-503 01.01 Standard
Copyright © 2005-2007, Nortel Networks Nortel Networks Confidential
.
3.7 22 February 2007
Page 78

78 Chapter 4 Configuring network monitoring using Web-based management
Figure 26 Ethernet Errors page
Table 30 "Ethernet Errors page items" (page 78) describes the items
on the Ethernet Errors page.
Table 30 Ethernet Errors page items
Item Description
Port The port number corresponding to the selected switch.
Alignment Errors The number of frames received on a particular interface that are not an
integral number of octets in length and do not pass the FCS check.
FCS Errors The number of frames received on a particular interface that are an
integral number of octets in length, but do not pass the FCS check.
Internal MAC
Transmit Errors
The number of frames for which transmission on a particular interface
fails due to an internal MAC sublayer transmit error. A frame is added
to this counter only if it is not counted as a late collision error, excessive
collisions error, or as a carrier sense error.
Internal MAC Receive
Errors
The number of frames for which reception on a particular interface fails
due to an internal MAC sublayer transmit error. A frame is added to
this counter only if it is not counted as a late collision error, excessive
collisions error, or as a carrier sense error.
Carrier Sense Errors The number of times that the carrier sense conditions were lost or never
asserted when attempting to transmit a frame on a particular interface.
Frame Too Long The number of frames received on a particular interface that exceed
the maximum permitted frame size.
Nortel Ethernet Switch 460/470
Configuration — System Monitoring
NN47210-503 01.01 Standard
Copyright © 2005-2007, Nortel Networks Nortel Networks Confidential
.
3.7 22 February 2007
Page 79

Viewing system statistics 79
Item Description
SQE Test Errors The number of times that the SQE TEST ERROR message is generated
by the PLS sublayer for a particular interface. The SQE TEST ERROR is
defined in section 7.2.2.2.4 of ANSI/IEEE 802.3-1985, and its generation
is described in section 7.2.4.6 of the same document.
Deferred TransmissionsThe number of frames for which the first transmission attempt on a
particular interface is delayed because the medium is busy.
Single Collision
Frames
Multiple Collision
Frames
Late Collisions The number of times a collision is detected on a particular interface later
Excessive Collisions The number of frames for which transmission on a particular interface
2
The number of successfully transmitted frames on a particular interface
for which transmission is inhibited by more than one collision.
The number of successfully transmitted frames on a particular interface
for which transmission is inhibited by a single collision.
than 512 bit-times into the transmission of a packet.
fails due to excessive collisions.
In the upper-left hand corner, click on the unit number of the device
to monitor.
The table is updated with the information for the selected device.
3
4
To refresh the statistical information, click Update.
To update the statistical information, click Update, or click Back to
return to the Ethernet Errors page
—End—
Viewing transparent bridging statistics
You can view the transparent bridging statistics measured for each
monitored interface on the device.
To view transparent bridging statistics:
Step Action
1
From the main menu, choose Statistics > Transparent Bridging.
The Transparent Bridging page opens (Figure 27 "Transparent
Bridging page" (page 80)).
Nortel Ethernet Switch 460/470
Configuration — System Monitoring
NN47210-503 01.01 Standard
Copyright © 2005-2007, Nortel Networks Nortel Networks Confidential
.
3.7 22 February 2007
Page 80

80 Chapter 4 Configuring network monitoring using Web-based management
Figure 27 Transparent Bridging page
Table 31 "Transparent Bridging page items" (page 80) describes the
items on the Transparent Bridging page.
Table 31 Transparent Bridging page items
Item Description
Port The port number that corresponds to the selected switch.
In Frames The number of frames that have been received by this port from its
segment. A frame received on the interface corresponding to this
port is counted only if it is for a protocol being processed by the local
bridging function, including bridge management errors.
Out Frames The number of frames that have been transmitted by this port from
its segment. A frame received on the interface corresponding to this
port is counted only if it is for a protocol being processed by the local
bridging function, including bridge management errors.
In Discards The number of valid frames received which were discarded by the
forwarding process.
2
In the upper-left hand corner, click the unit number of the device
to monitor.
The page is updated with statistics about the selected device and
its corresponding port number.
3
Copyright © 2005-2007, Nortel Networks Nortel Networks Confidential
.
To refresh the statistical information, click Update.
Nortel Ethernet Switch 460/470
Configuration — System Monitoring
NN47210-503 01.01 Standard
3.7 22 February 2007
Page 81

Monitoring MLT traffic
You can monitor the bandwidth usage for the MultiLink Trunk member ports
within each trunk in your configuration by selecting the traffic type to monitor.
To monitor MultiLink Trunk traffic:
Step Action
Monitoring MLT traffic 81
—End—
1
Table 32 Utilization page items
Section
From the main menu, choose Application > MultiLink Trunk >
Utilization.
The Utilization page opens (Figure 28 "Utilization page" (page 81)).
Figure 28 Utilization page
Table 32 "Utilization page items" (page 81) describes the items on
the Utilization page.
Item Range Description
Trunk
Utilization
Selection (View
By)
Copyright © 2005-2007, Nortel Networks Nortel Networks Confidential
.
Traffic Type (1) RX and TX
Configuration — System Monitoring
NN47210-503 01.01 Standard
1..6
(2) RX
(3) TX
Nortel Ethernet Switch 460/470
3.7 22 February 2007
Choose the trunk to be monitored.MultiLink Trunk
Choose the traffic type to be
monitored for percentage of
bandwidth utilization.
Page 82

82 Chapter 4 Configuring network monitoring using Web-based management
Section
MultiLink Trunk
Utilization Table
Item Range Description
Unit/Port A list of the trunk member switch
ports that correspond to the trunk
specified in the Trunk column.
Last 5 Minutes% The percentage of packets (of the
type specified in the Traffic Type
field) used by the port in the last five
minutes. Thisfield provides a running
average of network activity, and is
updated every 15 seconds.
Last 30
Minutes%
The percentage of packets (of the
type specified in the Traffic Type
field) used by the port in the last 30
minutes. Thisfield provides a running
average of network activity, and is
updated every 15 seconds.
Last Hour% The percentage of packets (of the
type specified in the Traffic Type
field) used by the port in the last 60
minutes. Thisfield provides a running
average of network activity, and is
updated every 15 seconds.
2
In the MultiLink Trunk Utilization Selection section, type the Trunk
number and traffic type to be monitored.
3
Click Submit.
The results of your request are displayed in the MultiLink Trunk
Utilization Table ( Figure 28 "Utilization page" (page 81)).
—End—
Nortel Ethernet Switch 460/470
Configuration — System Monitoring
NN47210-503 01.01 Standard
Copyright © 2005-2007, Nortel Networks Nortel Networks Confidential
.
3.7 22 February 2007
Page 83

Chapter 5
Configuring RMON using the CLI
The remote network monitoring (RMON) management information base
(MIB) is an interface between the RMON agent on an Ethernet Switch and
the RMON management applications. It defines objects that are suitable
for the management of any type of network. Some groups are specifically
targeted for Ethernet networks.
The RMON agent continuously collects statistics and proactively monitors
the switch.
This chapter covers the RMON commands available in the CLI and includes
the following topics:
•
"show rmon alarm" (page 83)
•
"show rmon event" (page 84)
•
"show rmon history" (page 84)
83
•
"show rmon stats" (page 85)
•
"rmon alarm" (page 86)
• "no rmon alarm" (page 87)
•
"rmon event" (page 88)
•
"no rmon event" (page 88)
• "rmon history" (page 88)
•
"no rmon history" (page 89)
•
"rmon stats" (page 89)
• "no rmon stats" (page 90)
show rmon alarm
The show rmon alarm command displays information for RMON alarms.
The syntax for the show rmon alarm command is:
show rmon alarm
Nortel Ethernet Switch 460/470
Configuration — System Monitoring
NN47210-503 01.01 Standard
Copyright © 2005-2007, Nortel Networks Nortel Networks Confidential
.
3.7 22 February 2007
Page 84

84 Chapter 5 Configuring RMON using the CLI
The show rmon alarm command is in the privExec mode.
The show rmon alarm command has no parameters or variables.
Figure 29 "show rmon alarm command output" (page 84) displays a sample
output of the show rmon alarm command.
Figure 29 show rmon alarm command output
show rmon event
The show rmon event command displays information regarding RMON
events. The syntax for the show rmon event command is:
show rmon event
The show rmon event command is in the privExec mode.
The show rmon event command has no parameters or variables.
Figure 30 "show rmon event command output" (page 84) displays a sample
output of the show rmon event command.
Figure 30 show rmon event command output
show rmon history
The show rmon history command displays information regarding
RMON history. The syntax for the show rmon history command is:
show rmon history
The show rmon history command is in the privExec mode.
The show rmon history command has no parameters or variables.
Nortel Ethernet Switch 460/470
Configuration — System Monitoring
NN47210-503 01.01 Standard
Copyright © 2005-2007, Nortel Networks Nortel Networks Confidential
.
3.7 22 February 2007
Page 85

Figure 31 "show rmon history command output" (page 85) displays a
sample output of the show rmon history command.
Figure 31 show rmon history command output
show rmon stats 85
show rmon stats
The show rmon stats command displays information regarding RMON
statistics. The syntax for the show rmon stats command is:
show rmon stats
The show rmon stats command is in the privExec mode.
The show rmon stats command has no parameters or variables.
Figure 32 "show rmon stats command output" (page 86) displays a sample
output of the show rmon stats command.
Nortel Ethernet Switch 460/470
Configuration — System Monitoring
NN47210-503 01.01 Standard
Copyright © 2005-2007, Nortel Networks Nortel Networks Confidential
.
3.7 22 February 2007
Page 86

86 Chapter 5 Configuring RMON using the CLI
Figure 32 show rmon stats command output
rmon alarm
The rmon alarm command allows you to set RMON alarms and
thresholds. The syntax for the rmon alarm command is:
rmon alarm <1-65535> <WORD> <1-2147483647> {absolute | delta}
rising threshold <-2147483648-2147483647> [<1-65535>]
falling-threshold <-2147483648-2147483647> [<1-65535>]
[owner <LINE>]
The rmon alarm command is in the config command mode.
Table 33 "rmon alarm command parameters and variables" (page 86)
describes the parameters and variables for the rmon alarm command.
Table 33 rmon alarm command parameters and variables
Parameters and variables Description
<1-65535>
<WORD>
Unique index for the alarm entry.
The MIB object to be monitored. This
is an object identifier (OID) and, for
most available objects, an English
name can be used.
Nortel Ethernet Switch 460/470
Configuration — System Monitoring
NN47210-503 01.01 Standard
Copyright © 2005-2007, Nortel Networks Nortel Networks Confidential
.
3.7 22 February 2007
Page 87

Parameters and variables Description
<1-2147483647>
absolute
The sampling interval in seconds.
Use absolute values (value of the
MIB object is compared directly with
thresholds).
delta
Use delta values (change in value of
the MIB object between samples is
compared with thresholds).
rising-threshold
<-2147483648-2147483647>
[<1-65535>]
The first integer value is the rising
threshold value. The optional second
integer specifies the event entry
triggered when the rising threshold
is crossed. If omitted, or if an invalid
event entry is referenced, no event is
triggered.
no rmon alarm 87
no rmon alarm
The no rmon alarm command deletes RMON alarm table entries. When
the variable is omitted, all entries in the table are cleared. The syntax for
the no rmon alarm command is:
no rmon alarm [<1-65535>]
The no rmon alarm command is in the config command mode.
Table 34 "no rmon alarm command parameters and variables" (page 87)
describes the parameters and variables for the no rmon alarm command.
Table 34 no rmon alarm command parameters and variables
falling-threshold
<-2147483648-2147483647>
[<1-65535>]
[owner <LINE>]
The first integer value is the falling
threshold value. The optional second
integer specifies the event entry
triggered when the falling threshold
is crossed. If omitted, or if an invalid
event entry is referenced, no event is
triggered.
Specifies an owner string to identify
alarm entry.
Parameters and variables Description
<1-65535>
Nortel Ethernet Switch 460/470
Configuration — System Monitoring
NN47210-503 01.01 Standard
Copyright © 2005-2007, Nortel Networks Nortel Networks Confidential
.
3.7 22 February 2007
Unique index for the alarm entry.
Page 88

88 Chapter 5 Configuring RMON using the CLI
rmon event
The rmon event command allows you to configure RMON event log and
trap settings. The syntax for the rmon event command is:
rmon event <1-65535> [log] [trap] [description <LINE>] [owner
<LINE>]
The rmon event command is in the config command mode.
Table 35 "rmon event command parameters and variables" (page 88)
describes the parameters and variables for the rmon event command.
Table 35 rmon event command parameters and variables
Parameters and variables Description
<1-65535>
[log]
[trap]
[description <LINE>]
[owner <LINE>]
Unique index for the event entry.
Record events in the log table.
Generate SNMP trap messages for events.
Specify a textual description for the event.
Specify an owner string to identify the event
entry
no rmon event
The no rmon event command deletes RMON event table entries. When
the variable is omitted, all entries in the table are cleared. The syntax for
the no rmon event command is:
no rmon event [<1-65535>]
The no rmon event command is in the config command mode.
Table 36 "no rmon event command parameters and variables" (page 88)
describes the parameters and variables for the no rmon event command.
Table 36 no rmon event command parameters and variables
rmon history
The rmon history command allows you to configure RMON history
settings. The syntax for the rmon history command is:
Parameters and variables Description
<1-65535>
Unique index for the event entry.
Nortel Ethernet Switch 460/470
Configuration — System Monitoring
NN47210-503 01.01 Standard
Copyright © 2005-2007, Nortel Networks Nortel Networks Confidential
.
3.7 22 February 2007
Page 89

rmon stats 89
rmon history <1-65535> <LINE> <1-65535> <1-3600> [owner
<LINE>]
The rmon history command is in the config command mode.
Table 37 "rmon history command parameters and variables" (page 89)
describes the parameters and variables for the rmon history command.
Table 37 rmon history command parameters and variables
Parameters and variables Description
<1-65535>
Unique index for the history entry.
<LINE>
<1-65535>
<1-3600>
[owner <LINE>]
no rmon history
The no rmon history command deletes RMON history table entries.
When the variable is omitted, all entries in the table are cleared. The syntax
for the no rmon history command is:
no rmon history [<1-65535>]
The no rmon history command is in the config command mode.
Table 38 "no rmon history command parameters and variables" (page
89) describes the parameters and variables for the no rmon history
command.
Table 38 no rmon history command parameters and variables
Specify the port number to be monitored.
Number of history buckets (records) to keep.
Sampling rate (how often a history sample is
collected).
Specify an owner string to identify the history
entry.
Parameters and variables Description
<1-65535>
Unique index for the history entry.
rmon stats
The rmon stats command allows you to configure RMON statistic
settings. The syntax for the rmon stats command is:
rmon stats <1-65535> <port> [owner <LINE>]
The rmon stats command is in the config command mode.
Nortel Ethernet Switch 460/470
Configuration — System Monitoring
NN47210-503 01.01 Standard
Copyright © 2005-2007, Nortel Networks Nortel Networks Confidential
.
3.7 22 February 2007
Page 90

90 Chapter 5 Configuring RMON using the CLI
Table 39 "rmon stats command parameters and variables" (page 90)
describes the parameters and variables for the rmon stats command.
Table 39 rmon stats command parameters and variables
Parameters and variables Description
<1-65535>
<port>
[owner <LINE>]
no rmon stats
The no rmon stats turns off RMON statistics. When the variable is
omitted, all table entries are cleared. The syntax for the no rmon stats
command is:
no rmon stats [<1-65535>]
The no rmon stats command is in the config command mode.
Unique index for the stats entry.
Specifies a port for the stats.
Specifies an owner string to identify the stats
entry.
Table 40 "no rmon stats command parameters and variables" (page 90)
describes the parameters and variables for the no rmon stats command.
Table 40 no rmon stats command parameters and variables
Parameters and variables Description
<1-65535>
Unique index for the stats entry.
Nortel Ethernet Switch 460/470
Configuration — System Monitoring
NN47210-503 01.01 Standard
Copyright © 2005-2007, Nortel Networks Nortel Networks Confidential
.
3.7 22 February 2007
Page 91

Chapter 6
Configuring RMON using Device
Manager
The Remote Network Monitoring (RMON) MIB is an interface between
the RMON agent on an Ethernet Switch and an RMON management
application, such as the Device Manager.
The RMON MIB defines objects that are suitable for the management of
any type of network, but some groups are targeted for Ethernet networks
in particular.
The RMON agent continuously collects statistics and proactively monitors
switch performance. You can view this data through the Device Manager.
RMON has three major functions:
•
Creating and displaying alarms for user-defined events
•
Gathering cumulative statistics for Ethernet interfaces
91
•
Tracking a history of statistics for Ethernet interfaces
This chapter contains the following topics:
•
"Working with RMON information" (page 91)
•
"RMON Alarms" (page 98)
• "RMON events" (page 106)
•
"RMON Log information" (page 109)
Working with RMON information
You can view RMON information by looking at the Graph information
associated with the port or chassis.
Nortel Ethernet Switch 460/470
Configuration — System Monitoring
NN47210-503 01.01 Standard
Copyright © 2005-2007, Nortel Networks Nortel Networks Confidential
.
3.7 22 February 2007
Page 92

92 Chapter 6 Configuring RMON using Device Manager
RMON history
Ethernet history records periodic statistical samples from a network. A
sample is called a history and is gathered in time intervals referred to as
buckets. Histories establish a time-dependent method for gathering RMON
statistics on a port. The default values for history are:
•
Buckets are gathered at 30-minute intervals.
• Number of buckets gathered is 50.
Both the time interval and the number of buckets is configurable. However,
when the last bucket is reached, bucket 1 is dumped and "recycled" to hold
a new bucket of statistics. Then bucket 2 is dumped, and so forth.
Creating a history
You can use RMON to collect statistics at intervals. For example, if you
want RMON statistics to be gathered over the weekend, you require
enough buckets to cover two days. To do this, set the history to gather one
bucket each hour, thus covering a 48-hour period. After you set history
characteristics, you cannot modify them; you must delete the history and
create another one.
To establish a history for a port and set the bucket interval:
Step Action
1
From the Device Manager main menu, choose Rmon > Control.
The RmonControl dialog box opens with the History tab displayed
Figure 33 "History tab" (page 92).
Figure 33 History tab
2
Click Insert.
The RmonControl, Insert History dialog box opens (Figure 34
"RmonControl, Insert History dialog box" (page 93)).
Nortel Ethernet Switch 460/470
Configuration — System Monitoring
NN47210-503 01.01 Standard
Copyright © 2005-2007, Nortel Networks Nortel Networks Confidential
.
3.7 22 February 2007
Page 93

Working with RMON information 93
Figure 34 RmonControl, Insert History dialog box
3
4
Select the port from the port list or type the port number.
Set the number of buckets.
The default is 50.
5
Set the interval.
The default is 1800 seconds.
6
Type the owner (the network management system that created this
entry).
Click Insert.
—End—
Table 41 "History tab fields" (page 93) describes the History tab of the
RmonControl dialog box.
Table 41
History tab fields
Field Description
Index A unique value assigned to each interface. An index
identifies an entry in a table.
Port Any Ethernet interface on the device.
BucketsRequested The requested number of discrete time intervals
over which data is to be saved in the part of the
media-specific table associated with this entry.
BucketsGranted The number of discrete sampling intervals over which
data is saved in the part of the media-specific table
associated with this entry. There are instances when
the actual number of buckets associated with this entry
is less than the value of this object. In this case, at the
end of each sampling interval, a new bucket is added
to the media-specific table.
Nortel Ethernet Switch 460/470
Configuration — System Monitoring
NN47210-503 01.01 Standard
Copyright © 2005-2007, Nortel Networks Nortel Networks Confidential
.
3.7 22 February 2007
Page 94

94 Chapter 6 Configuring RMON using Device Manager
Field Description
Interval The interval in seconds over which the data is sampled
for each bucket in the part of the media-specific table
associated with this entry. You can set this interval to
any number of seconds between 1 and 3600 (1 hour).
Because the counters in a bucket can overflow at their
maximum value with no indication, note the possibility
of overflow in any of the associated counters. It is
important to consider the minimum time in which any
counter can overflow on a particular media type; set the
historyControlInterval object to a value less than this
interval. This is typically most important for the octets
counter in any media-specific table. For example, on
an Ethernet network, the etherHistoryOctets counter
can overflow in about one hour at the Ethernet
maximum utilization.
Owner The network management system that created this
entry.
Disabling history
To disable RMON history on a port:
Step Action
1
From the Device Manager main menu, choose Rmon > Control.
The RmonControl dialog box opens with the History tab displayed
(Figure 33 "History tab" (page 92)).
2
Highlight the row that contains the port ID you want to delete.
3 Click Delete.
The entry is removed from the table.
Viewing RMON history statistics
To display RMON history statistics:
è In the Rmon History tab, highlight an entry and click on the Graph button.
The Rmon History statistics dialog box opens (Figure 35 "Rmon History
statistics" (page 95)).
—End—
Nortel Ethernet Switch 460/470
Configuration — System Monitoring
NN47210-503 01.01 Standard
Copyright © 2005-2007, Nortel Networks Nortel Networks Confidential
.
3.7 22 February 2007
Page 95

Working with RMON information 95
Figure 35 Rmon History statistics
Table 42 "Rmon History statistics tab fields" (page 95) describes the Rmon
History statistics tab fields.
Table 42
Rmon History statistics tab fields
Field Description
SampleIndex Indicates the sample number. As history samples are taken,
they are assigned greater sample numbers.
Utilization Estimates the percentage of link capacity used during the
sampling interval.
Octets The number of octets received on the link during the sampling
period.
Pkts The number of packets received on the link during the sampling
period.
BroadcastPktsThe number of packets received on the link during the sampling
interval that are destined for the packet address.
MulticastPkt
s
The number of packets received on the link during the sampling
interval that are destined for the multicast address. This doe
not include the broadcast packets.
DropEvents The number of received packets dropped due to system
resource constraints.
CRCAlignErr
ors
The number of packets received during a sampling interval that
were between 64 and 1518 octets long that had a bad FCS with
either an integral number of octets (FCS Error) or a non-integral
number of octets(Alignment Error). The packet length includes
Frame Check Sequence (FCS) octets but not framing bits.
Nortel Ethernet Switch 460/470
Configuration — System Monitoring
NN47210-503 01.01 Standard
Copyright © 2005-2007, Nortel Networks Nortel Networks Confidential
.
3.7 22 February 2007
Page 96

96 Chapter 6 Configuring RMON using Device Manager
Field Description
UndersizePktsThe number of packets received during the sampling interval
that were less than 64 octets long (including FCS octets, but
not framing bits).
OversizePkt
s
Fragments The number of packets received during the sampling interval
Collisions The best estimate of the number of collisions on an Ethernet
The number of packets received during the sampling interval
that were longer than 1518 octets (including FCS octets, but
not framing bits) and were otherwise well-formed.
that were less than 64 octets long (including FCS octets, but
not framing bits) that had a bad FCS with either an integral
number of octets (FCS Error) or a non-integral number of octets
(Alignment Error).
segment during a sampling interval.
Enabling Ethernet statistics gathering
You can use RMON to gather Ethernet statistics.
To gather Ethernet statistics:
Step Action
1
2
From the Device Manager main menu, choose RMon > Control.
The RmonControl dialog box opens with the History tab displayed.
Click the Ether Stats tab.
The Ether Stats tab opens (Figure 36 "RmonControl dialog box --
Ether Stats tab" (page 96)).
Figure 36 RmonControl dialog box -- Ether Stats tab
3
Copyright © 2005-2007, Nortel Networks Nortel Networks Confidential
.
Click Insert.
Nortel Ethernet Switch 460/470
Configuration — System Monitoring
NN47210-503 01.01 Standard
3.7 22 February 2007
Page 97

Working with RMON information 97
The RmonControl, Insert Ether Stats dialog box opens (Figure 37
"RmonControl, Insert Ether Stats dialog box" (page 97)).
Figure 37 RmonControl, Insert Ether Stats dialog box
4
Select the ports.
Enter the port number you want or select the port from the list menu
(Figure 38 "RmonControl, Insert Ether Stats dialog box port list"
(page 97)).
Figure 38 RmonControl, Insert Ether Stats dialog box port list
Device Manager assigns the index.
5
Click Insert.
The new Ethernet Statistics entry is shown in the Ether Stats tab.
—End—
Table 43 "Ether Stats tab fields" (page 97) describes the Ether Stats tab
fields.
Table 43
Ether Stats tab fields
Field Description
Index A unique value assigned to each interface. An index identifies an
entry in a table.
Port Any Ethernet interface on the device.
Owner The network management system that created this entry.
Nortel Ethernet Switch 460/470
Configuration — System Monitoring
NN47210-503 01.01 Standard
Copyright © 2005-2007, Nortel Networks Nortel Networks Confidential
.
3.7 22 February 2007
Page 98

98 Chapter 6 Configuring RMON using Device Manager
Disabling Ethernet statistics gathering
To disable Ethernet statistics that you have set:
Step Action
1
2
3 Highlight the row that contains the port ID you want to delete.
4
RMON Alarms
Alarms are useful when you need to know when the values of a variable go
outside a specified range. You can define an RMON alarm for any MIB
variable that resolves to an integer value. You cannot use string variables
(such as system description) as alarm variables.
All alarms share the following characteristics:
From the Device Manager main menu, choose Rmon > Control.
The RmonControl dialog box opens with the History tab displayed.
Click the Ether Stats tab.
The Ether Stats tab opens (Figure 36 "RmonControl dialog box --
Ether Stats tab" (page 96)).
Click Delete.
The Ether Stats entry is removed from the table.
—End—
•
An upper and lower threshold value is defined.
•
A corresponding rising and falling event occurs.
•
An alarm interval or polling period is reached.
When alarms are activated, you can view the activity in a log or a trap log,
or you can create a script to notify you by beeping a console, sending
e-mail, or calling a pager.
How RMON alarms work
The alarm variable is polled and the result is compared against upper and
lower limit values you select when you create the alarm. If either limit is
reached or crossed during the polling period, then the alarm fires and
generates an event that you can view in the event log or the trap log.
The upper limit of the alarm is called the rising value, and its lower limit is
called the falling value. RMON periodically samples the data based upon
the alarm interval. During the first interval that the data passes above the
Nortel Ethernet Switch 460/470
Configuration — System Monitoring
NN47210-503 01.01 Standard
Copyright © 2005-2007, Nortel Networks Nortel Networks Confidential
.
3.7 22 February 2007
Page 99

RMON Alarms 99
rising value, the alarm fires as a rising event. During the first interval that
the data drops below the falling value, the alarm fires as a falling event
(Figure 39 "How alarms fire" (page 99)).
Figure 39
How alarms fire
It is important to note that the alarm fires during the first interval in which
the sample goes out of range. No additional events are generated for that
threshold until the opposite threshold is crossed. Therefore, you must
carefully define the rising and falling threshold values for alarms to work as
expected. Otherwise, incorrect thresholds cause an alarm to fire at every
alarm interval.
A general guideline is to define one of the threshold values to an expected,
baseline value, and then define the opposite threshold as the out-of-bounds
limit. Because of sample averaging, the value can be equal to ±1 of the
baseline units. For example, assume an alarm is defined on octets going
out of a port as the variable. The intent of the alarm is to provide notification
to the system administrator when excessive traffic occurs on that port. If
spanning tree is enabled, then 52 octets are transmitted out of the port
every 2 seconds, which is equivalent to baseline traffic of 260 octets every
10 seconds. This alarm provides the notification the system administrator
needs if the lower limit of octets going out is defined at 260 and the upper
limit is defined at 320 (or at any value greater than 260 + 52 = 312).
The first time outbound traffic other than spanning tree Bridge Protocol Data
Units (BPDUs) occurs, the rising alarm fires. When outbound traffic other
than spanning tree ceases, the falling alarm fires. This process provides the
system administrator with time intervalsof any non-baseline outbound traffic.
If the alarm is defined with a falling threshold less than 260 (assuming the
alarm polling interval is 10 seconds), say 250, then the rising alarm can fire
only once (Figure 40 "Alarm example -- threshold less than 260" (page
100)). The reason is that for the rising alarm to fire a second time, the falling
alarm (the opposite threshold) must fire. Unless the port becomes inactive
or spanning tree is disabled (which causes the value for outbound octets
Nortel Ethernet Switch 460/470
Configuration — System Monitoring
NN47210-503 01.01 Standard
Copyright © 2005-2007, Nortel Networks Nortel Networks Confidential
.
3.7 22 February 2007
Page 100

100 Chapter 6 Configuring RMON using Device Manager
to drop to zero), the falling alarm cannot fire, because the baseline traffic
is always greater than the value of the falling threshold. By definition, the
failure of the falling alarm to fire prevents the rising alarm from firing a
second time.
Figure 40 Alarm example -- threshold less than 260
Creating alarms
When you create an alarm, you select a variable from the variable list and a
port, or other switch component, to which it is connected. Some variables
require port IDs, card IDs, or other indices (for example, spanning tree group
IDs). You then select a rising and a falling threshold value. The rising and
falling values are compared against the actual value of the variable that you
choose. If the variable falls outside of the rising or falling value range, an
alarm is triggered, and an event is logged or trapped.
When you create an alarm, you also select a sample type, which can be
either absolute or delta. Absolute alarms are defined on the cumulative
value of the alarm variable. An example of an alarm defined with absolute
value is card operating status. Because this value is not cumulative, but
instead represents states, such as card up (value 1) and card down (value
2), you set it for absolute value. Therefore, you can create an alarm with
a rising value of 2 and a falling value of 1 to alert a user to whether the
card is up or down.
Most alarm variables related to Ethernet traffic are set to delta value. Delta
alarms are defined based on the difference in the value of the alarm variable
between the start of the polling period and the end of the polling period.
Delta alarms are sampled twice per polling period. For each sample, the
last two values are added together and compared to the threshold values.
This process increases precision and allows for the detection of threshold
crossings that span the sampling boundary. Therefore, if you track the
current values of a given delta-valued alarm and add them together, the
result is twice the actual value. (This result is not an error in the software.)
Alarm Manager example
Note: The example alarm described in the following procedure
generates at least one alarm every five minutes. The example is
Nortel Ethernet Switch 460/470
Configuration — System Monitoring
NN47210-503 01.01 Standard
Copyright © 2005-2007, Nortel Networks Nortel Networks Confidential
.
3.7 22 February 2007
 Loading...