

Page 1
Ins. No.
E-025-2-E
SMART COMMUNICATION UNIT
MODEL EL 2310-0BE
□□□
Applicable Flowmeter: OVAL Electromagnetic Flowmeters
MAG-OVAL Ⅲ
For the installation of application software "LinkTop" and the interface
driver, refer to Ins. No. E-020IMC "Smart Communication Unit MODEL :
EL2310 Software Installation Procedure Manual".
Page 2

E-025-2-E
CONTENTS
1. SMART COMMUNICATION UNIT .........................................................................................5
1.1 General .................................................................................................................................... 5
2. BEFORE YOU BEGIN .............................................................................................................5
2.1 Inspection upon Receipt ..........................................................................................................5
2.2 Hookup with Associated Equipment and Devices ................................................................... 6
2.3 Communication Interface .........................................................................................................7
3. LinkTop OPERATION .............................................................................................................. 8
3.1 LinkTop Screen ........................................................................................................................ 8
3.2 Starting LinkTop and Connecions ............................................................................................ 9
3.3 Terminating the Connection ................................................................................................... 11
3.4 Terminating LinkTop ............................................................................................................... 12
3.5 Menu: Process Variables (Processing values display) ........................................................... 13
3.5.1 Processing Value Measurements (View field device variables) .................................... 13
3.5.2 Chart Display and Logging (Chart and Recording) ....................................................... 14
3.5.3 Write Protect (Write protect).......................................................................................... 17
3.6 Menu: Setup (Settings) .......................................................................................................... 18
3.6.1 Flow Rate Parameter (Flow parameter) ........................................................................ 19
3.6.1.1 Nominal Diameter (Nominal diameter) ..................................................................... 19
3.6.1.2 Measuring Range (Flow range) ............................................................................... 20
3.6.2 Transmitter Variables (Field device variable) ................................................................ 21
3.6.3 Output Settings (Outputs) ............................................................................................. 22
3.6.3.1 Analog Output (Analog output) ............................................................................... 22
3.6.3.2 Pulse Output (Pulse output) ....................................................................................23
3.6.3.3 Status Output (Status output). ................................................................................. 25
3.6.3.4 Selecting Status Output Objects (Status select) .................................................... 26
3.6.3.5 Output at Error/Alarm (Error output) ....................................................................... 27
3.6.4 High/Low Alarm (H/L alarm) ......................................................................................... 29
3.6.5 Setting Self Diagnosis (Self diag) ..................................................................................30
3.6.6 Device Information (Device information) ....................................................................... 31
3.6.7 Other Settings (Other) ...................................................................................................32
3.6.7.1 Display Setting (Display setting) .............................................................................. 32
3.6.7.2 Security (Security) .................................................................................................. 33
3.6.7.3 Polling Address (Polling address) ........................................................................... 34
22
Page 3

E-025-2-E
3.7 Menu: Diag/Service (Checking and Adjustment) ................................................................... 35
3.7.1 Self-diagnosis (Self diag) ............................................................................................... 36
3.7.1.1 Circuit Voltage Self-diagnosis (Circuit voltage) ........................................................ 36
3.7.1.2 Coil and Exciting Circuit Diagnosis (Exciting coil/circuit) ......................................... 37
3.7.1.3 Diagnosing Measurement Signal (Measurement signal)..........................................38
3.7.1.4 Measurement Pipe Empty Detection Function (Empty pipe) .................................... 39
3.7.2 Loop Test (Loop test) ..................................................................................................... 40
3.7.2.1 Analog Output Loop Test (Fix Analog) .....................................................................40
3.7.2.2 Pulse Output Loop Test (Fix Pulse) ........................................................................ 41
3.7.2.3 Status Output Loop Test (Fix Status output) ........................................................... 42
3.7.3 Analog Output Adjustment (Trim Analog) ...................................................................... 43
3.7.4 Cumulative Total Display and Control (Totalizer Control) ............................................. 46
3.7.5 Setting Accumulated Total Flow (Total flow set) ............................................................ 46
3.8 Menu: Maintenance (Maintenance) ....................................................................................... 47
3.8.1 Maintaining Transmitter (Maintenance xmtr) ................................................................ 48
3.8.1.1 Error Log Display (Error log) ................................................................................... 48
3.8.1.2 Transmitter Internal Temperature Display (Xmtr temp) ............................................ 50
3.8.1.3 Displaying Operating Time (Operating time) .......................................................... 50
3.8.2 Maintenance Test (Maintenance test) .......................................................................... 50
3.8.3 Resetting Master (Master reset) .................................................................................. 51
3.9 Menu: Window (Window) . ..................................................................................................... 53
3.10 Menu: File (File) ...................................................................................................................55
3.10.1 Database ..................................................................................................................... 55
3.10.1.1 Opening Files ......................................................................................................... 55
3.10.1.2 Saving Files ...........................................................................................................56
3.10.1.3 Deleting Files ......................................................................................................... 57
3.10.1.4 Downloading .......................................................................................................... 57
3.10.2 Printing .......................................................................................................................59
3.11 Troubleshooting ....................................................................................................................62
3.11.1 If There is No Response ............................................................................................. 62
3.11.2 If It is Not Possible to Connect to the Flowmeter ......................................................... 62
3.11.3 Input Errors .................................................................................................................. 62
3.11.4 Error/Alarm, Status List ............................................................................................... 63
3.11.4.1 Error/Alarm ............................................................................................................ 63
3.11.4.2 Status ...................................................................................................................65
4. PRODUCT CODE EXPLANATION .....................................................................................66
5. GENERAL SPECIFICATIONS ............................................................................................. 67
Page 4
E-025-2-E
This manual uses the precaution words "NOTE", "CAUTION", and "WARNING" as explained
below:
NOTE: Notes are separated from the general text to bring the user's attention to
important information.
CAUTION: Caution statements inform the user of hazards or unsafe practices which
could result in minor personal injury or product /property damage.
WARNING: Warning statements inform the user of hazards or unsafe practices which
could result in severe personal injury or death.
Page 5
1. SMART COMMUNICATION UNIT
1
Ins. No.
E-020IMC-1-E
MODEL : EL2310
SMART COMMUNICATION UNIT
SOFTWARE INSTALLATION
PROCEDURE MANUAL
*OT/P
&&
MAG-OVAL Ⅲ
SMART COMMUNICATION UNIT
MODEL EL 2310-0BE
□□□
Applicable Flowmeter: OVAL Electromagnetic Flowmeters
For the installation of application software "LinkTop" and the interface
driver, refer to Ins. No. E-020IMC "Smart Communication Unit MODEL:
EL2310 Software Installation Procedure Manual".
E-025-2-E
1.1 Genera
l
Described in this manual are the operating instructions to use the application software LinkTop of the
Smart Communication Unit which operates in the Microsoft operating system Windows environment.
LinkTop is a communication terminal designed for use in combination with a personal computer
(hereinafter referred to as PC) and any one of the OVAL Electromagnetic flowmeters to set up, alter,
adjust, or read out parameters and variables, through interactive communications, either on-site or from
remote locations. Using a Windows PC at hand, you can monitor multiple windows on its screen.
It is necessary to install the application software LinkTop in your personal computer before connecting
the communication interface (*) between the PC and the flowmeter.
NOTE ※:The customer is requested to prepare the communication interface.
Communication style and communication interface differ with the communication
specification of the flowmeter. The communication specification for standard flowmeter
product is RS485. The flowmeter with Bell202 communication specification is supported
specifically.
- RS485 communication specification: RS485 communication specification is required.
- Bell202 communication specification: Bell202 communication interface for OVAL Smart
Communication Unit EL2310 is required.
2. BEFORE YOU BEGIN
2.1 Inspection upon Receipt
Be sure you have the following items.
Open the product package and make sure you have all the components required.
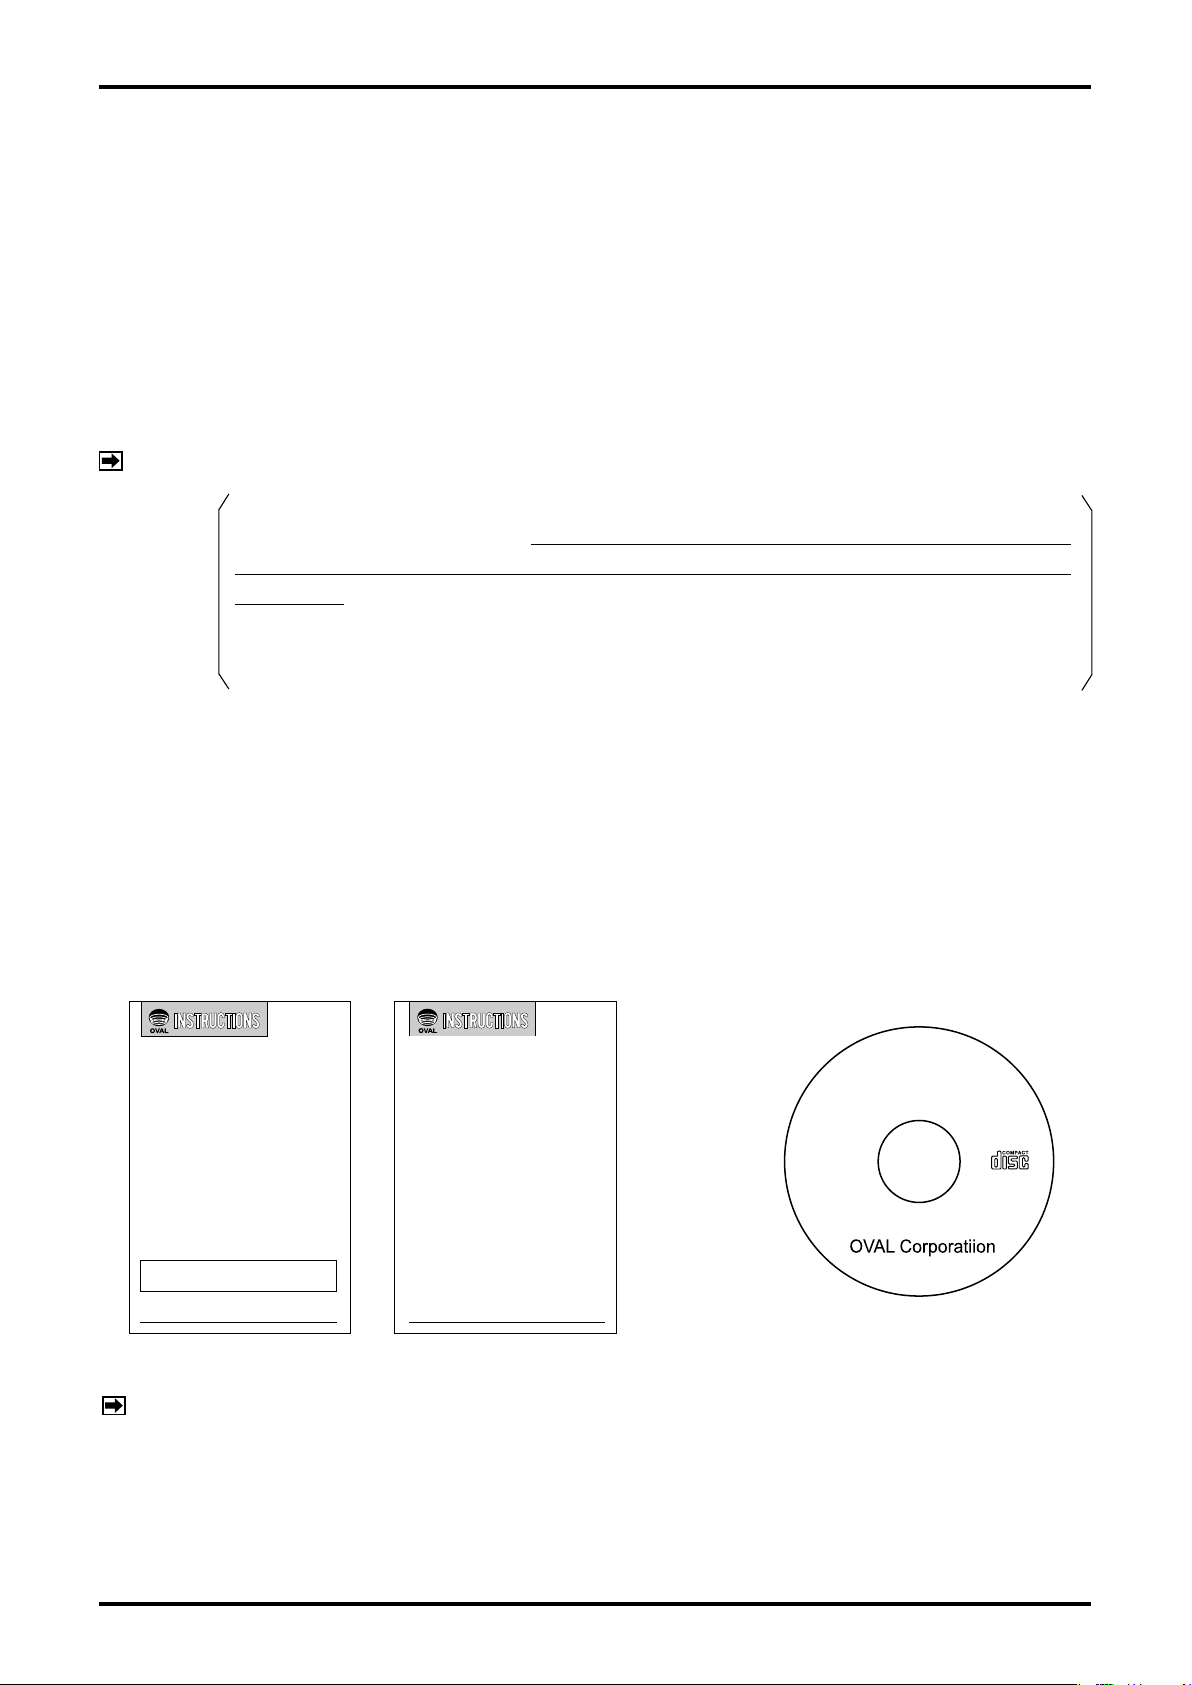
Instruction Manual 1
(This manual)
Instruction Manual 2
(Software Installation Procedure
Manual)
CD-ROM
(Application Software LinkTop)
LinkTop
®
for MAG-OVAL
NOTE:
Fig.1
For the installation of the application software "LinkTop" and the interface driver software (※),
refer to "Installation Procedure Manual".
※:The driver software in the CD-ROM is intended for an application of Bell202
Communication Interface for OVAL Smart Communication Unit EL2310. It is not necessary
to install this software when using RS485 communication.
5
Page 6
E-025-2-E
ERR.
ALM.
PCwithcommunication
softwareinstalled
RS-485
communication
Interface
MAG-OVALⅢ
OutputSignalTerminal
RS-485
+
+
−
−
2.2 Hookup with Associated Equipment and Devices
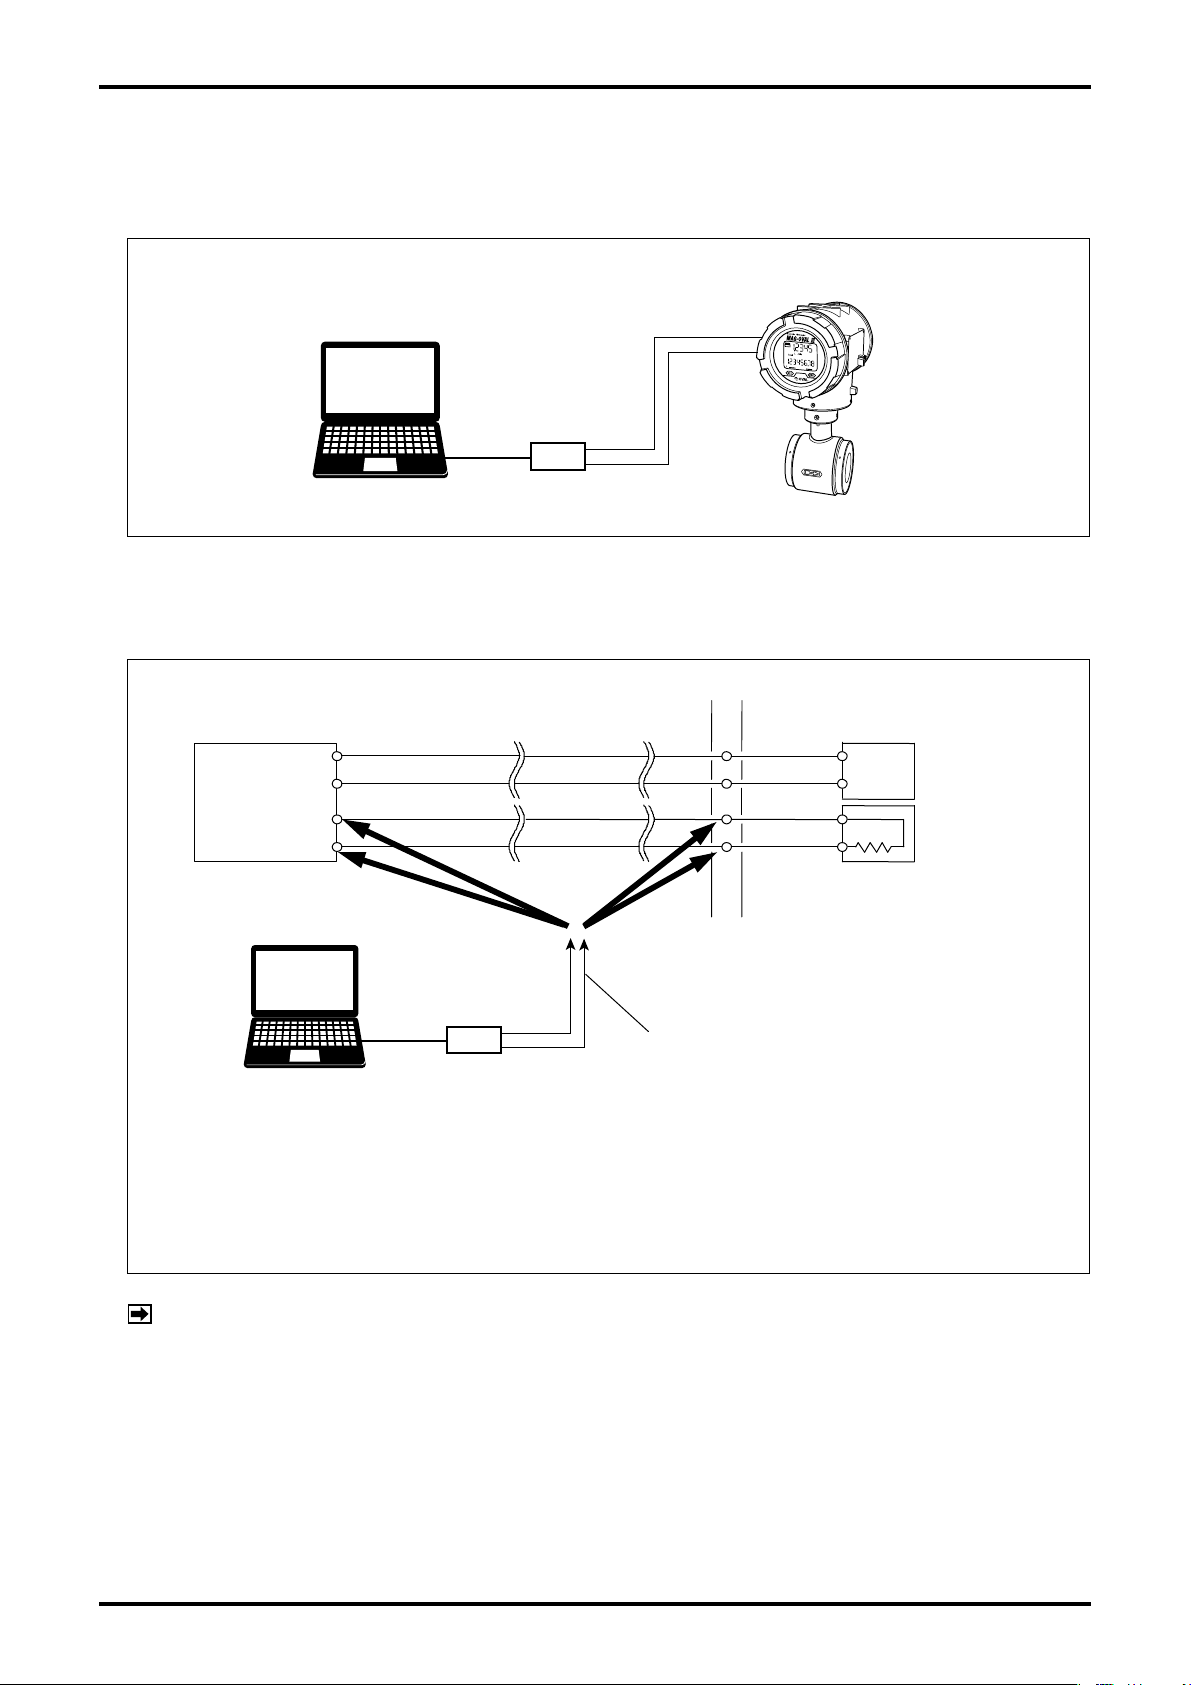
Equipment set-up with associated equipment and devices is shown in Fig. 2.
(1) In case of RS485 communication
Fig.2.1 In Case of RS-485 communication
The flowmeter has no built-in terminating resistor. The customer is required to install a terminating
resistor of 120Ω/0.5W at the terminal of the line.
(2) In case of Bell202 communication
Tie-point Terminal Block
OVAL Electromagnetic
Flowmeter
Flowmeter
Transmitter
PC with communication
software installed
The receiving instrument in this gure requires a load resistance 250Ω min. Its upper limit depends on
the specication of the transmitter in use.
If the receiving instrument does not have a built-in RL, an external RL needs to be connected in series.
LINE/+
NEUT/−
4 to 20mADC
+
−
Bell202 communication
Interface
LINE/+
NEUT/−
Connection
Points
Probes
Polarity observation is not required.
Connect the probes across + and – terminals
of analog output.
Power
+
RL
−
Receiving Instrument
(Load RL built-in)
Fig.2.2 In Case of Bell202 Communication
NOTE :
In Fig. 2, the customer is to supply a PC that meets the following requirements:
◇ Operating System: Windows XP, Windows Vista, or Windows 7 to 10
◇ RAM: 256MB or larger
◇ Hard disk: 10MB or larger
◇ Serial ports (COM ports) such as USB port or RS232C that are suitable for
connecting to the communication interface shall be provided.
A USB port is required when using Bell202 communication interface for OVAL Smart
Communication Unit EL2310.
Page 7
E-025-2-E
USB connector
Body
Cable length from probe
500 approx.
Cable length from connector
1000 approx.
50
Probe
(6
0)
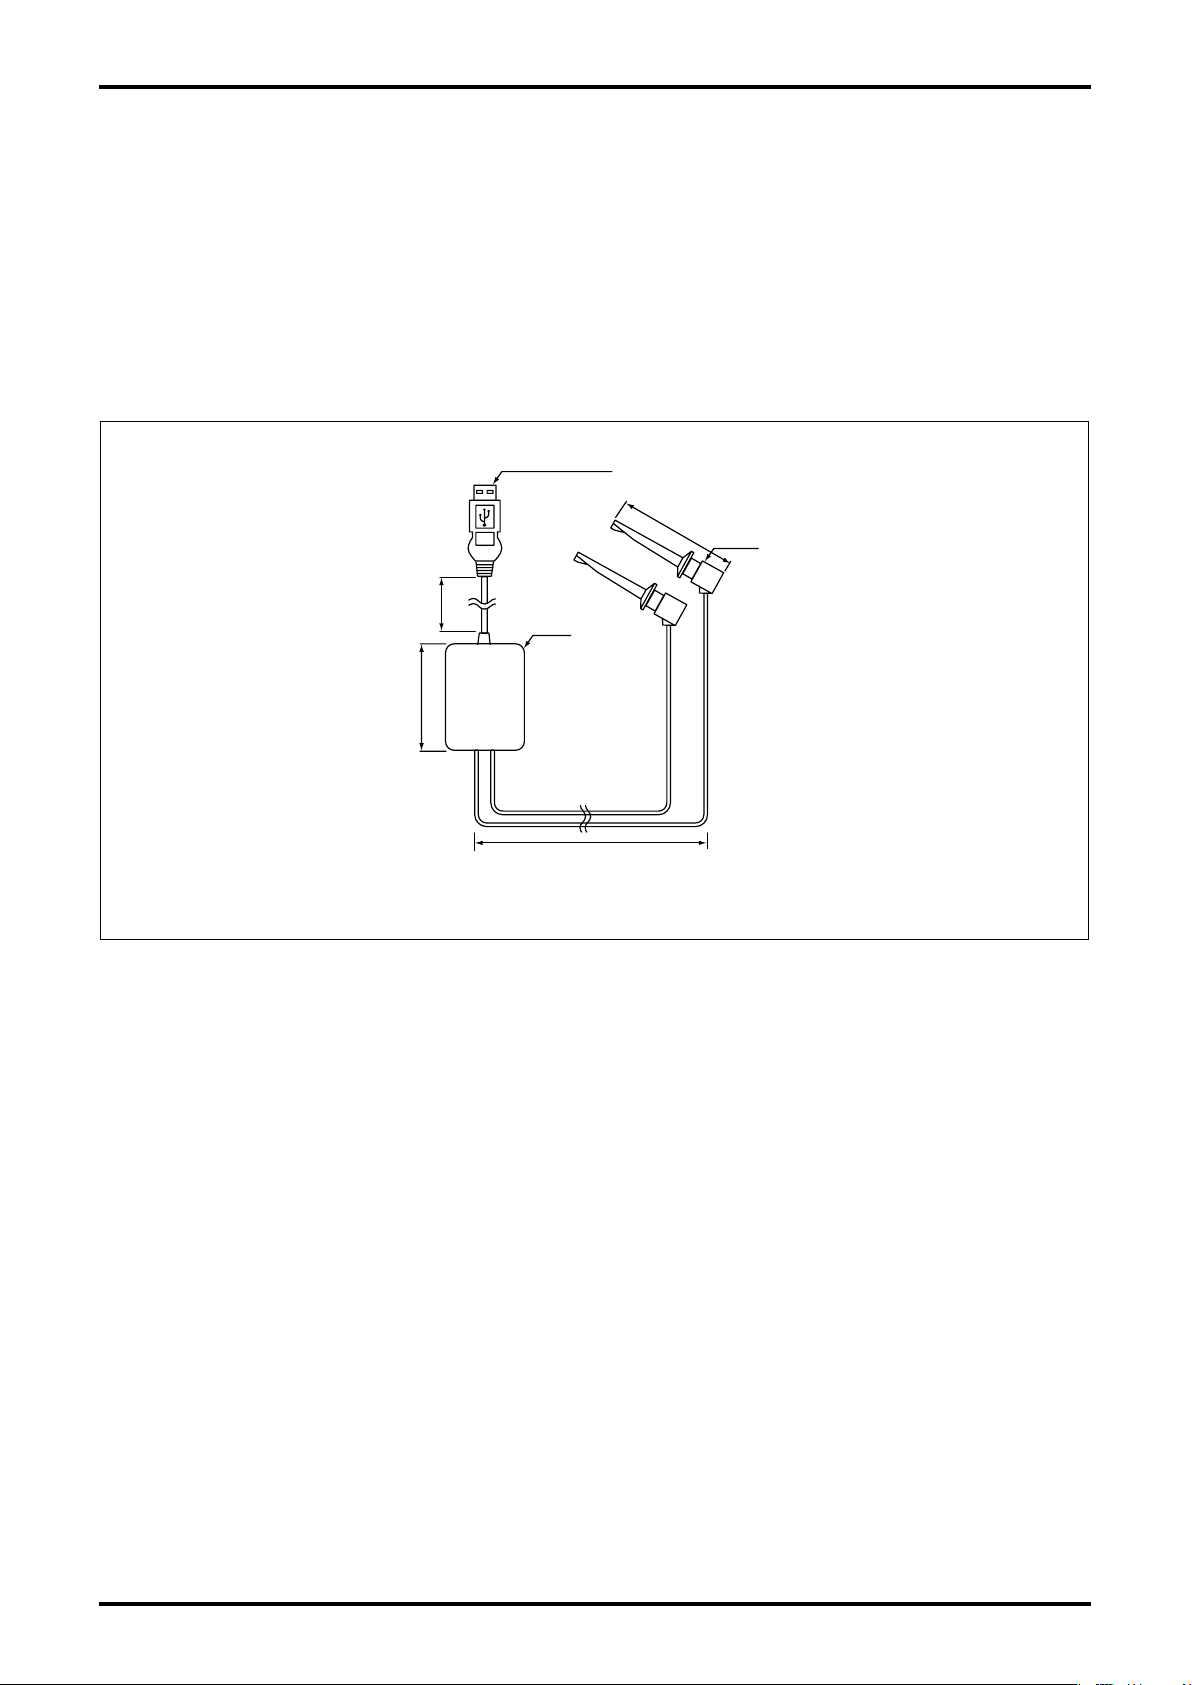
2.3 Communication Interface
A signal transmitter is provided for the communication signal conversion between the external serial
port (COM port) of the PC and the flowmeter.
When using RS485 communication, the RS485 communication interface available on the market shall
be used.
When using Bell202 communication, the Bell202 communication interface for OVAL Smart
Communication Unit EL2310 shall be used. The signal transmitter consists of the components shown in
Fig. 3.
Unit: mm
Fig.3
Page 8
E-025-2-E
3. LinkTop OPERATION
3.1 LinkTop Screen
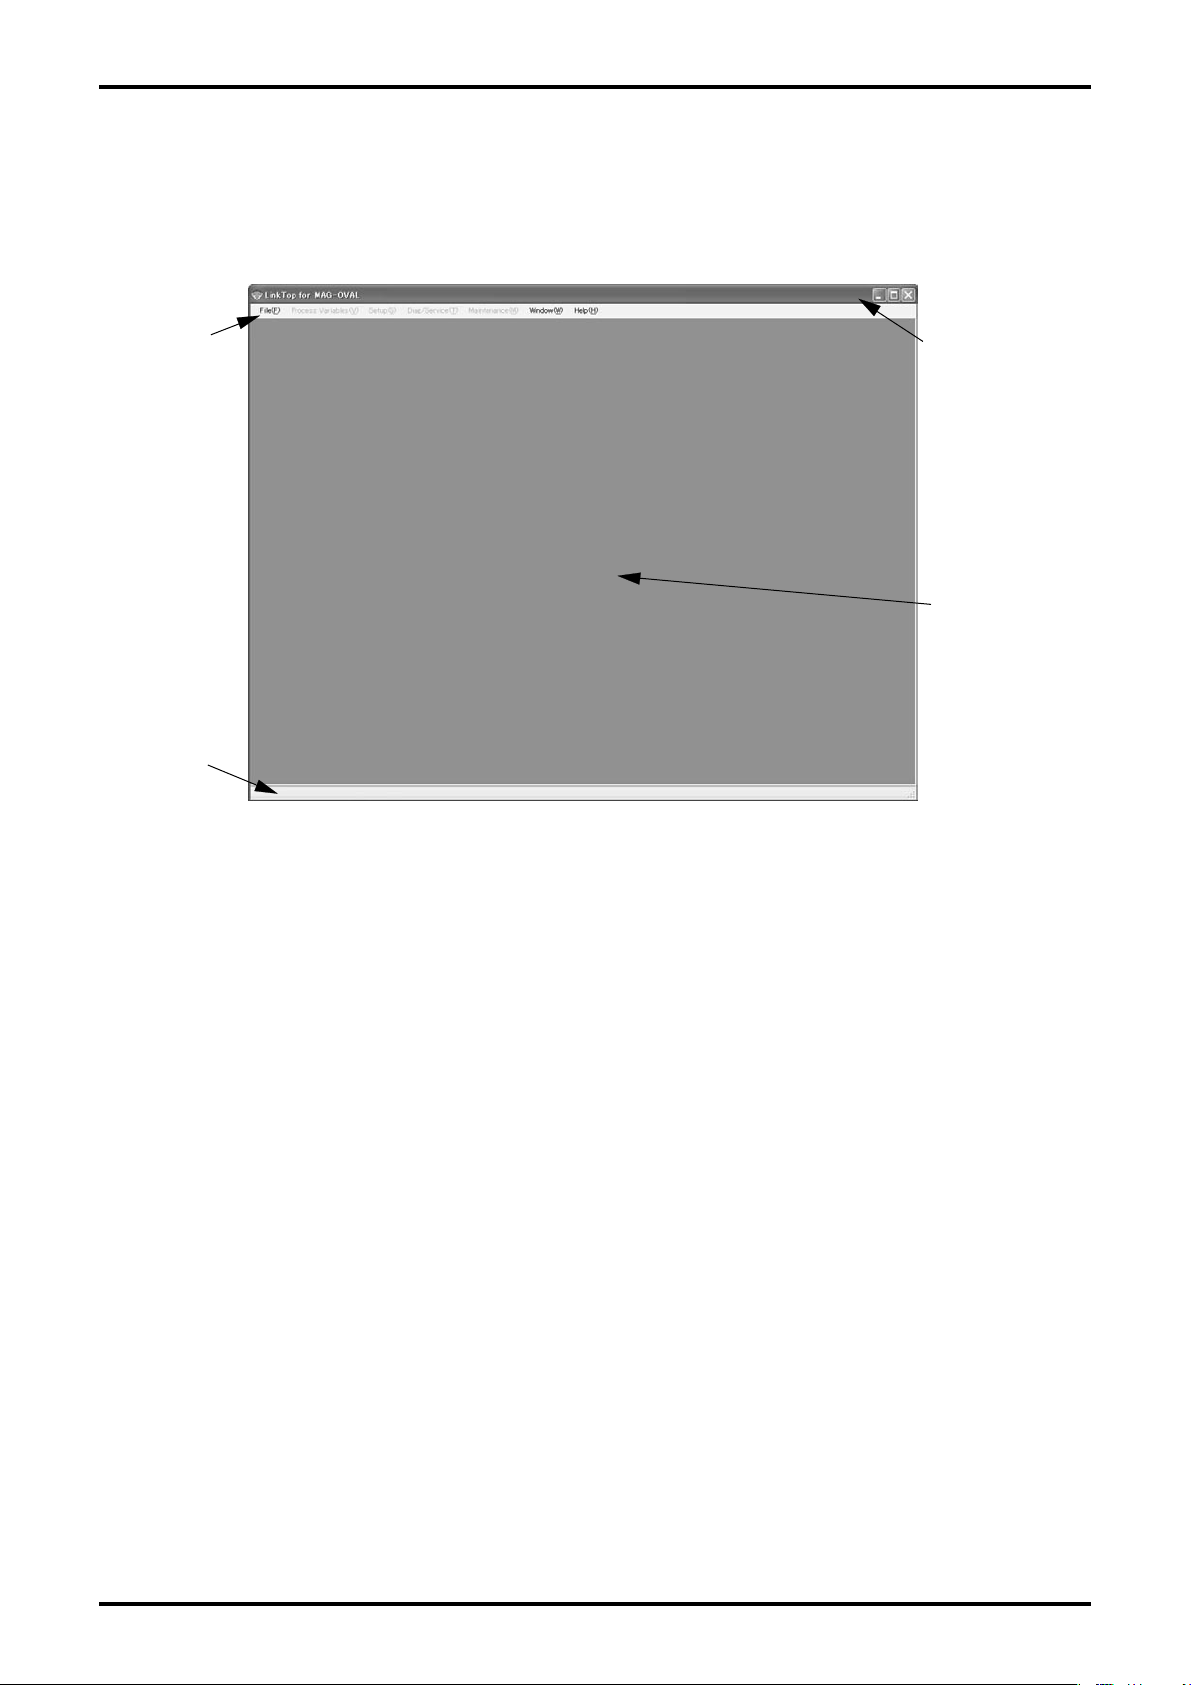
① Fig. 4 shows what the LinkTop window looks like.
Menu
PC-to-Flowmeter
Communications
Status
Title Bar
Message Box Field
Fig.4
The communication status is indicated at the bottom left of the screen as:
◇ During communications : SEND, RECEIVE WAIT
◇ Communications interrupted : IDLE
Page 9
E-025-2-E
3.2 Starting LinkTop and Connections
① Hook up the owmeter transmitter, communication interface, and "LinkTop" pre-installed PC as
shown in Fig. 2.
② To initiate LinkTop, click "Start" at the bottom left of the PC screen and click "LinkTop for
MAG-OVAL" from "Program".
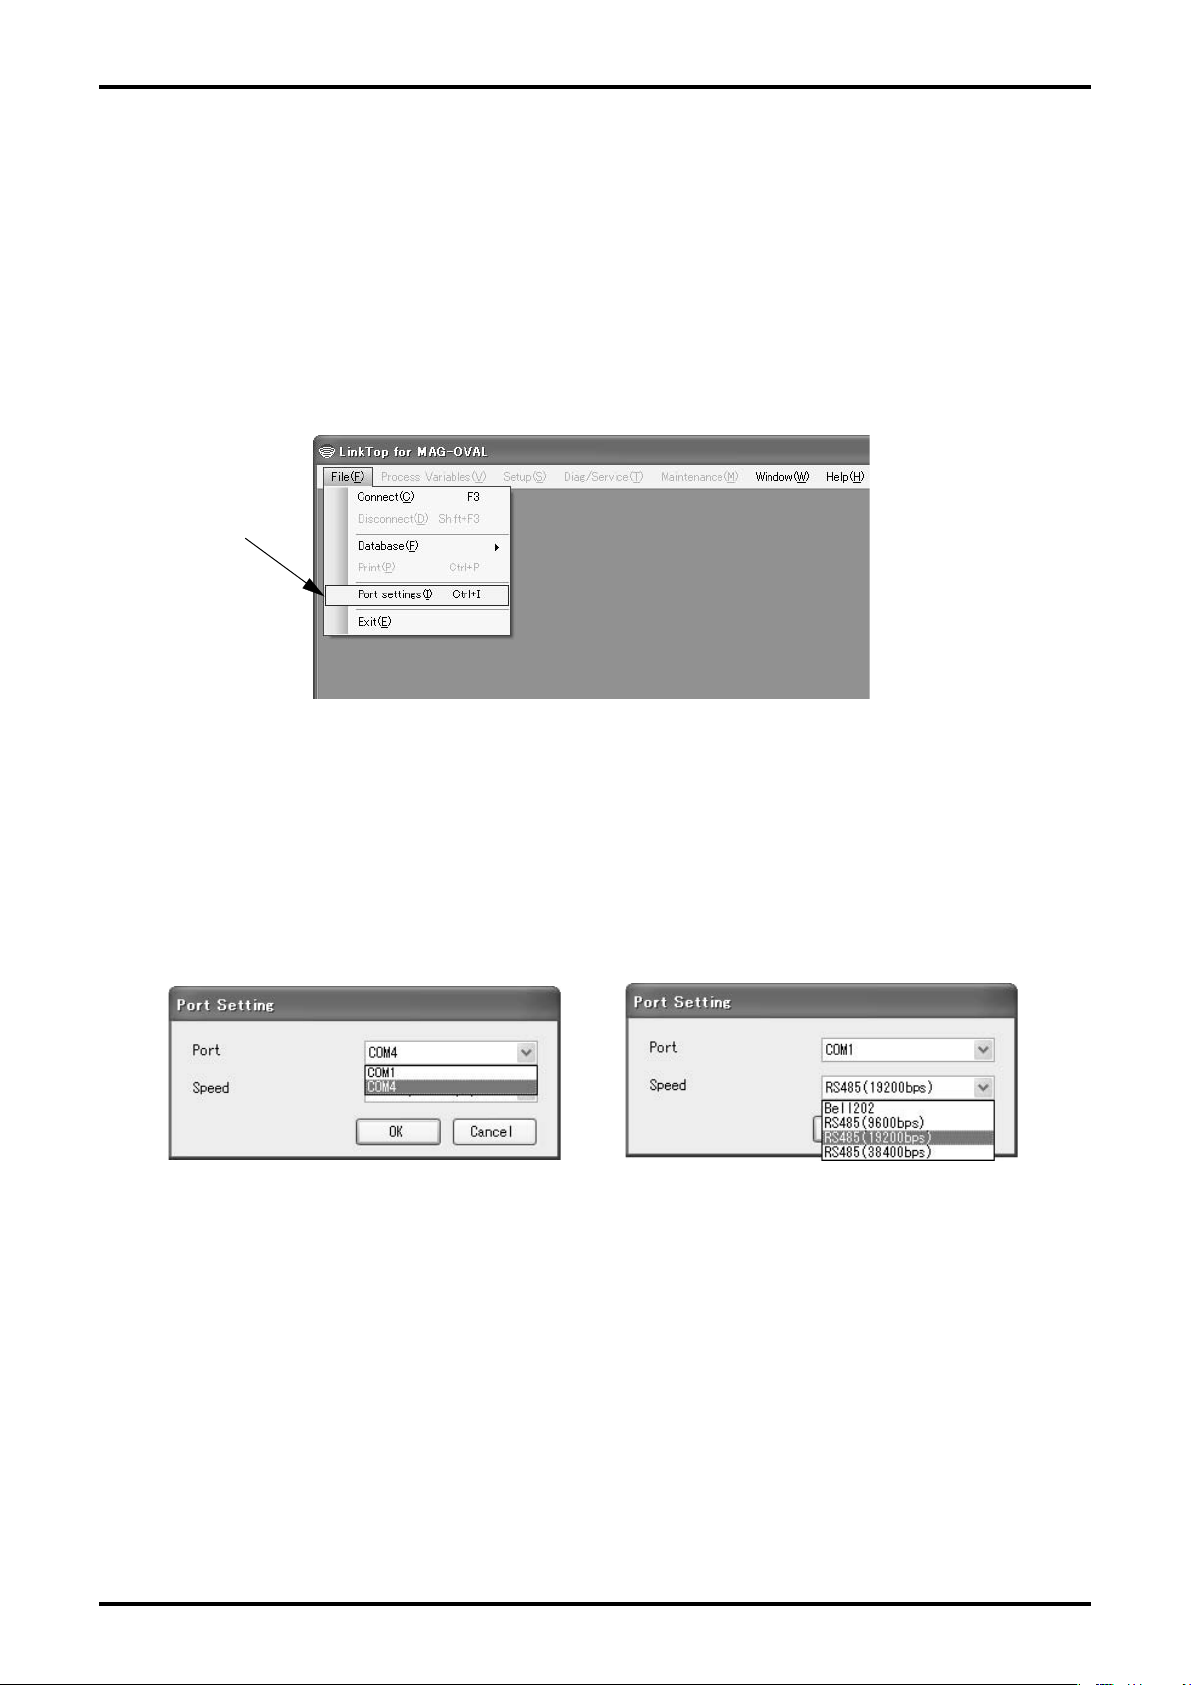
③ Click "Port setting (I) Ctrl + I" under "File (F)" from the menu.
Click here.
Fig.5
④ Set up the port.
Select the COM□ of the corresponding communication port from the "Port" drop-down list.
(□ shows the port number connected to the communication interface. If the corresponding
communication interface port number is unknown, open Windows Device Manager and nd the port
number from the list of "Port (COM and LPT)".)
Fig. 6.1
Fig. 6.2
Then, select the corresponding specication (baud rate) from the "Speed" list in accordance with
the communication specications of the owmeter.
- In case of RS485 communication: Select RS485.
Choose the baud rate from 9600bps, 19200bps or 38400bps to meet the baud rate set for the
owmeter. The standard baud rate set for the owmeter is 19200bps.
(For the setting method of baud rate (RS485 communication speed) for flowmeter, refer to
"Electromagnetic Flowmeter MAG-OVAL III Instruction Manual".)
- In case of Bell202 communication: Select Bell202 (The baud rate for Bell202 is xed.)
Finally, click "OK" .
Page 10
E-025-2-E
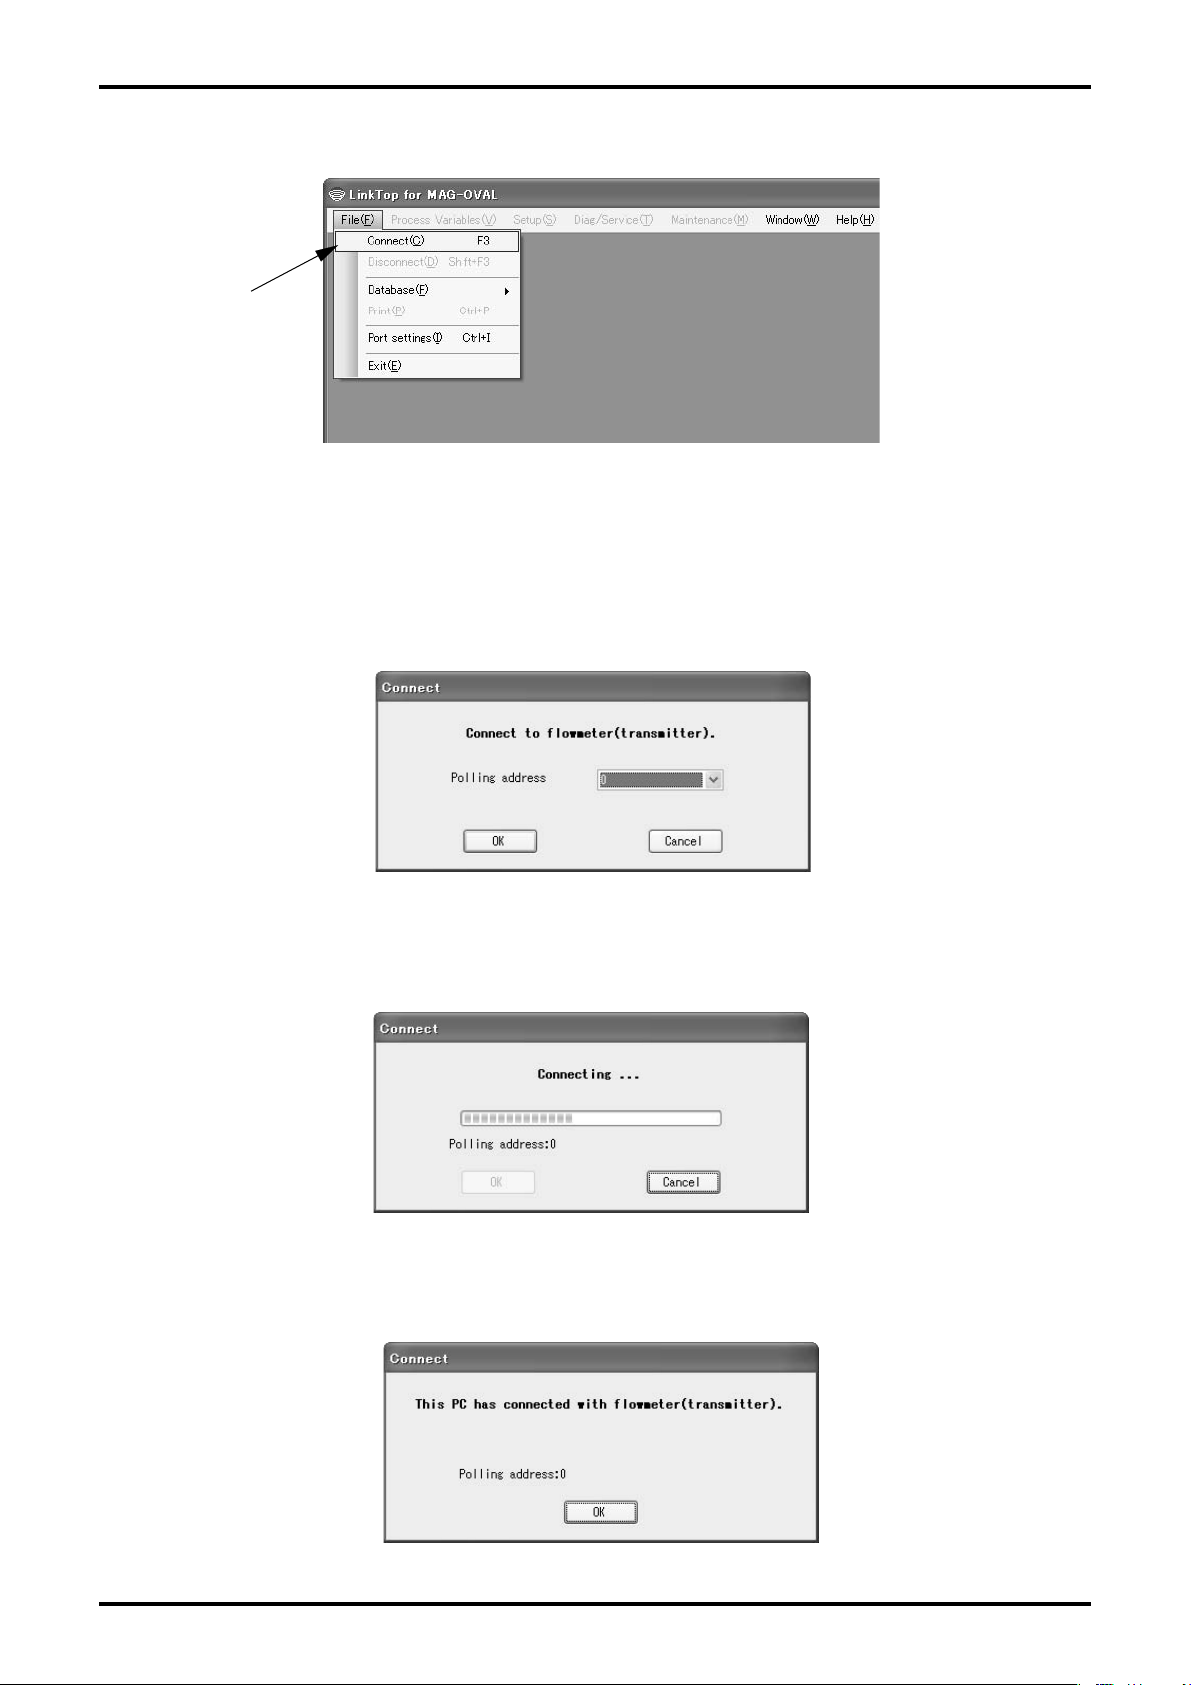
⑤ Click "Connect (C) F3" under "File (F)" from the menu.
Click here.
Fig.7
⑥ The "Polling address" setting screen appears. The standard "Polling address" of the owmeter is "0".
After you select "0", click "OK" to initiate the connection.
If "Polling address" of the owmeter is unknown, conrm "Polling address" by
the operation of the owmeter. ⇨ Reference: Flowmeter Instruction Manual
( )
(Communication Function)
Fig.8
⑦ A message box shown as Fig.9 appears as the connection process begins.
A bar graph in the middle of message box indicates progress of connection process.
Fig.9
⑧ Upon completion of connections, a message box shown as Fig. 10 appears. Click "OK" .
0
Fig.10
Page 11
E-025-2-E
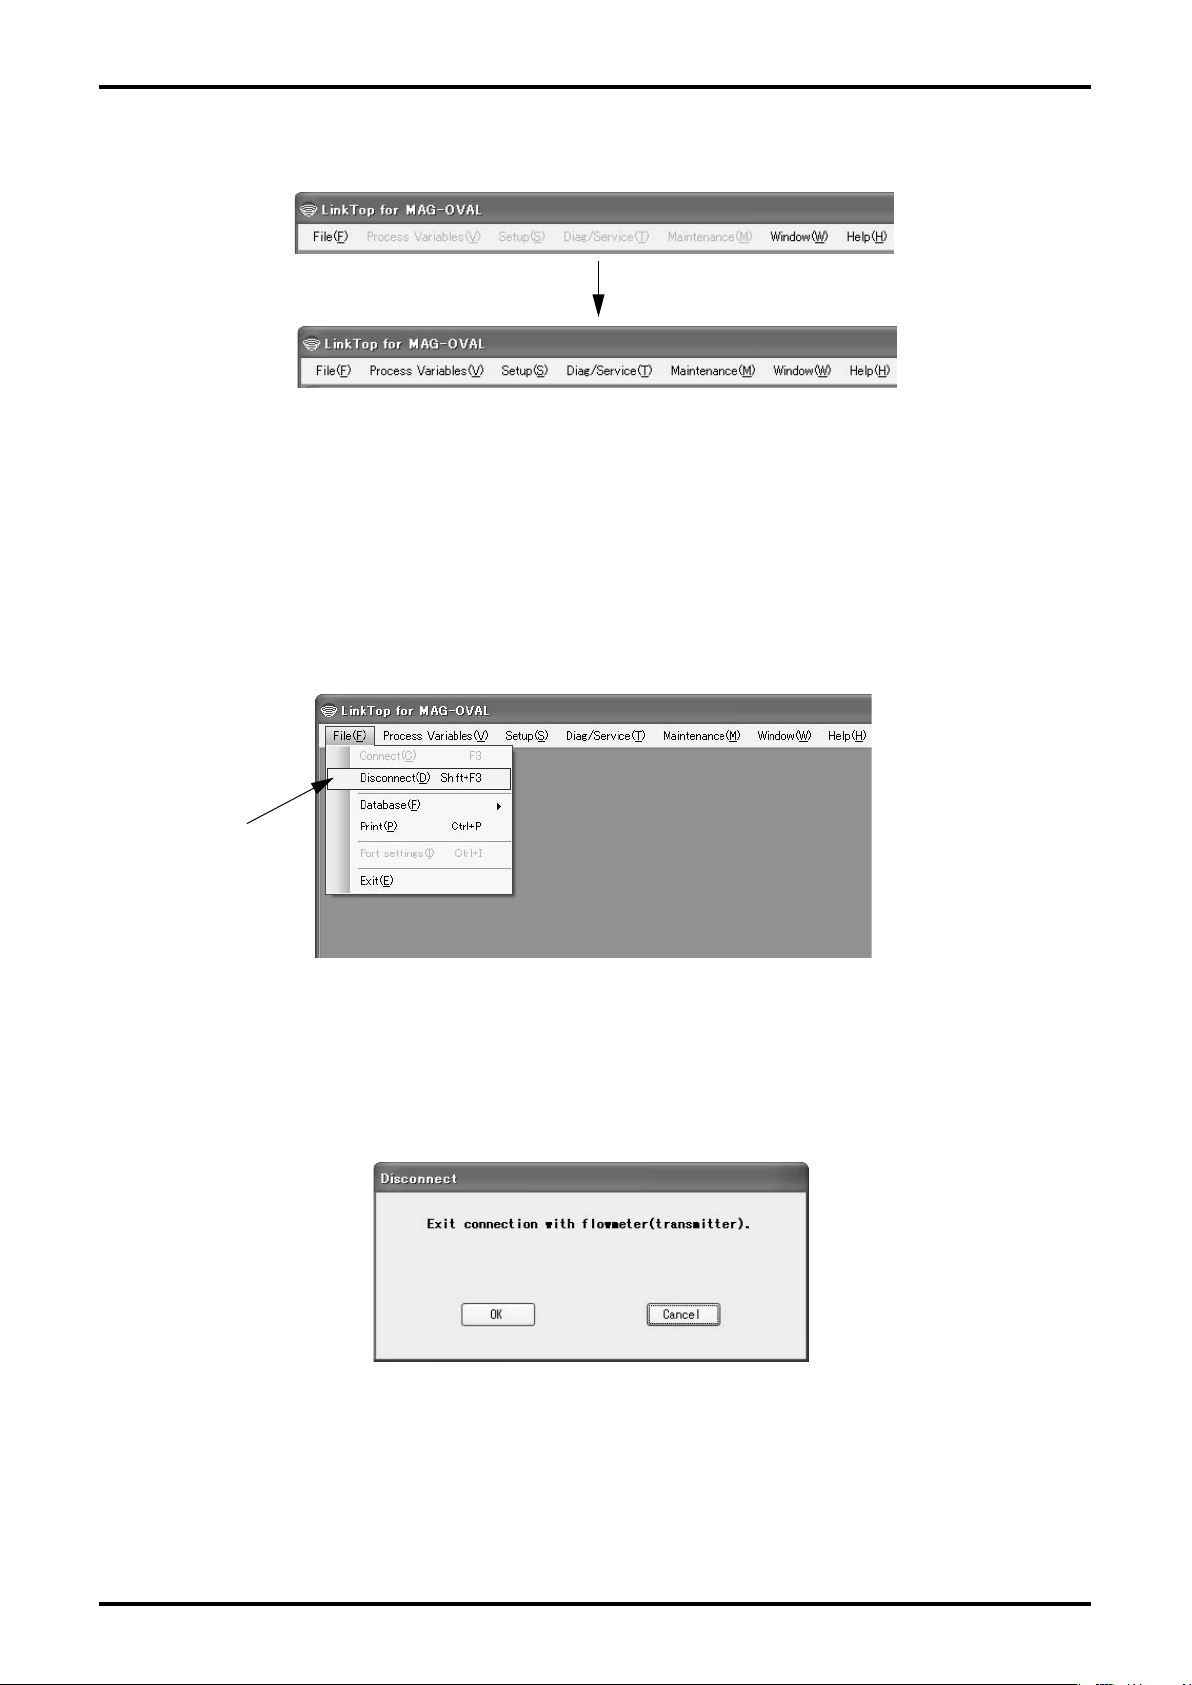
⑨ When connection is complete, all functions of the menu become selectable as shown below.
Fig.11
3.3 Terminating the Connection
To terminate connection between the owmeter transmitter and LinkTop, follow the procedure given
below:
① Click on "Disconnect (D) Shift + F3" as shown in Fig. 12.
Click here.
Fig.12
② At the message box as shown in Fig. 13, click "OK". This terminates the connection between the
owmeter and LinkTop.
Fig.13
Page 12
E-025-2-E
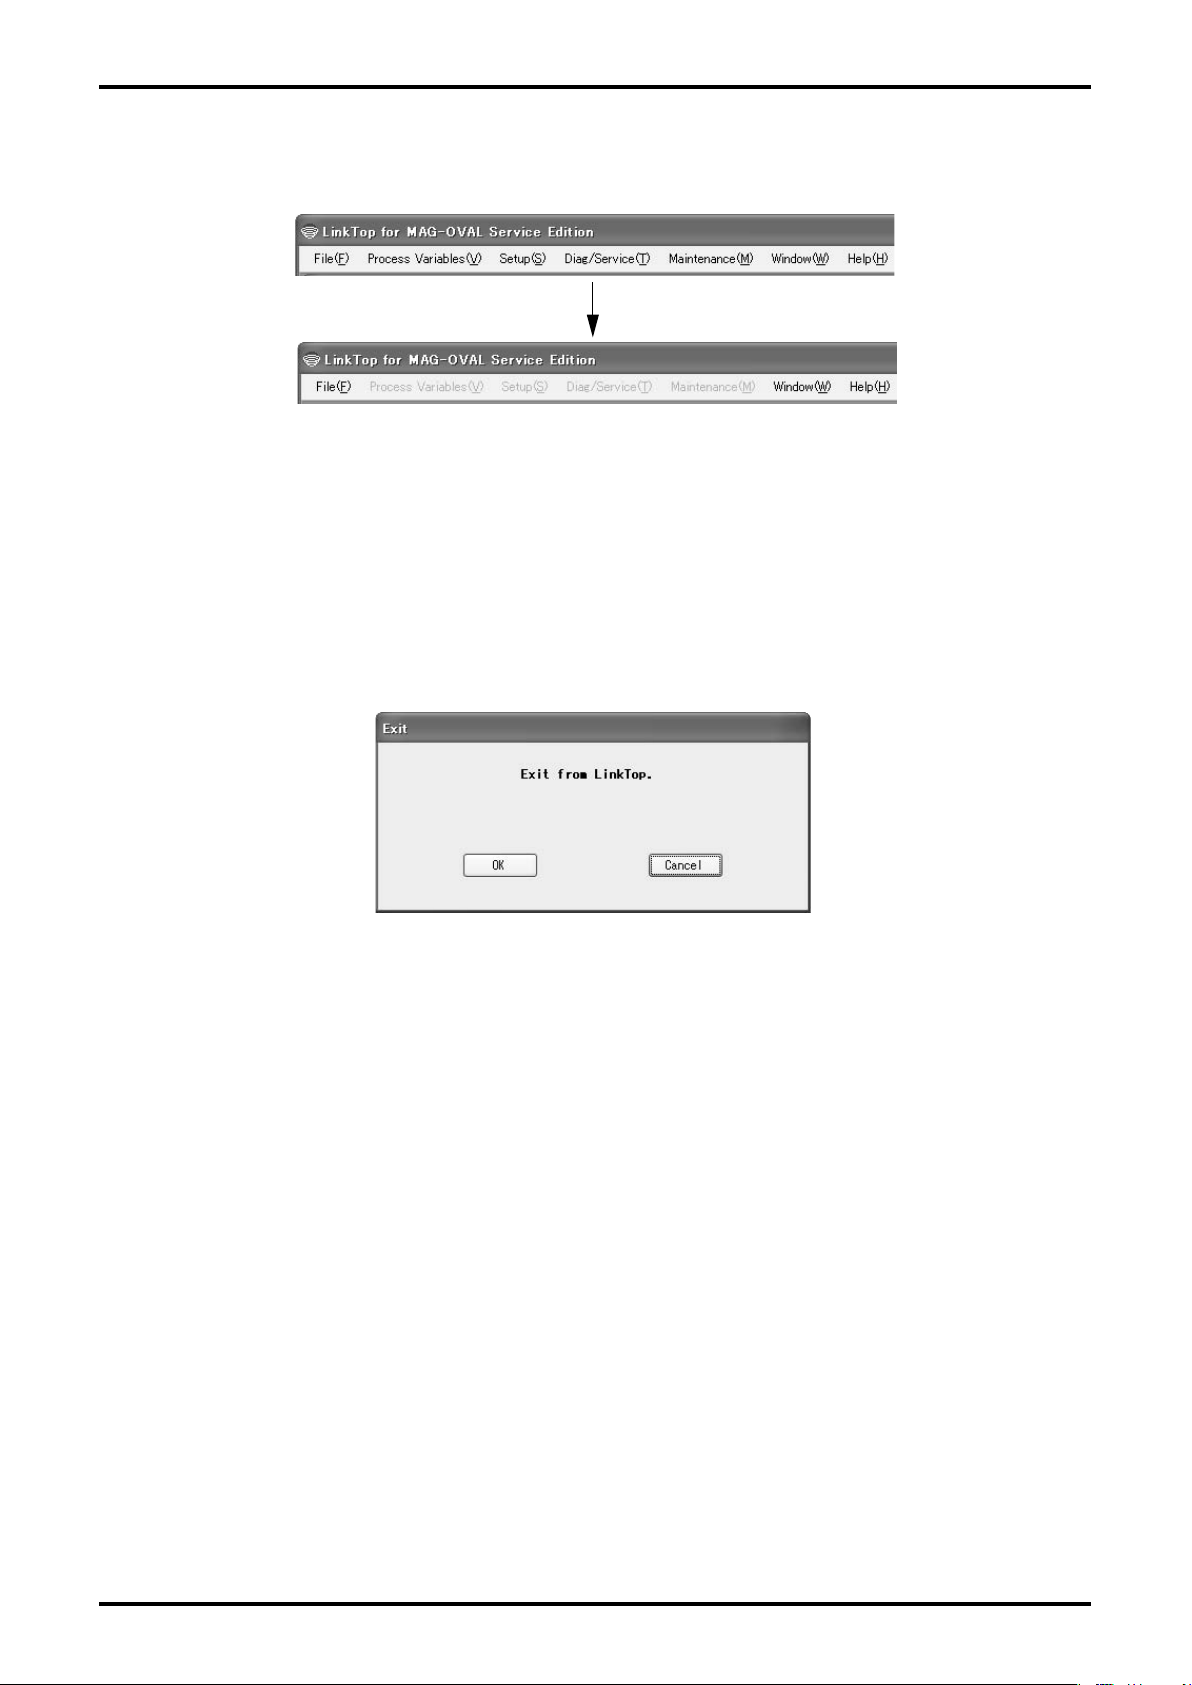
When connection is terminated, some functions of the menu become inactive as shown in
③
Fig. 14.
Fig.14
3.4 Terminating LinkTop
To exit LinkTop, click "File (F)" from the menu then select "Exit (E)". A message box as shown in
Fig. 15 appears. Click "OK" to conrm and the application software window will disappear from the
desktop.
To abort the terminating process, click on "Cancel".
Fig.15
2
Page 13
E-025-2-E
3.5 Menu: Process Variables (Processing values display)
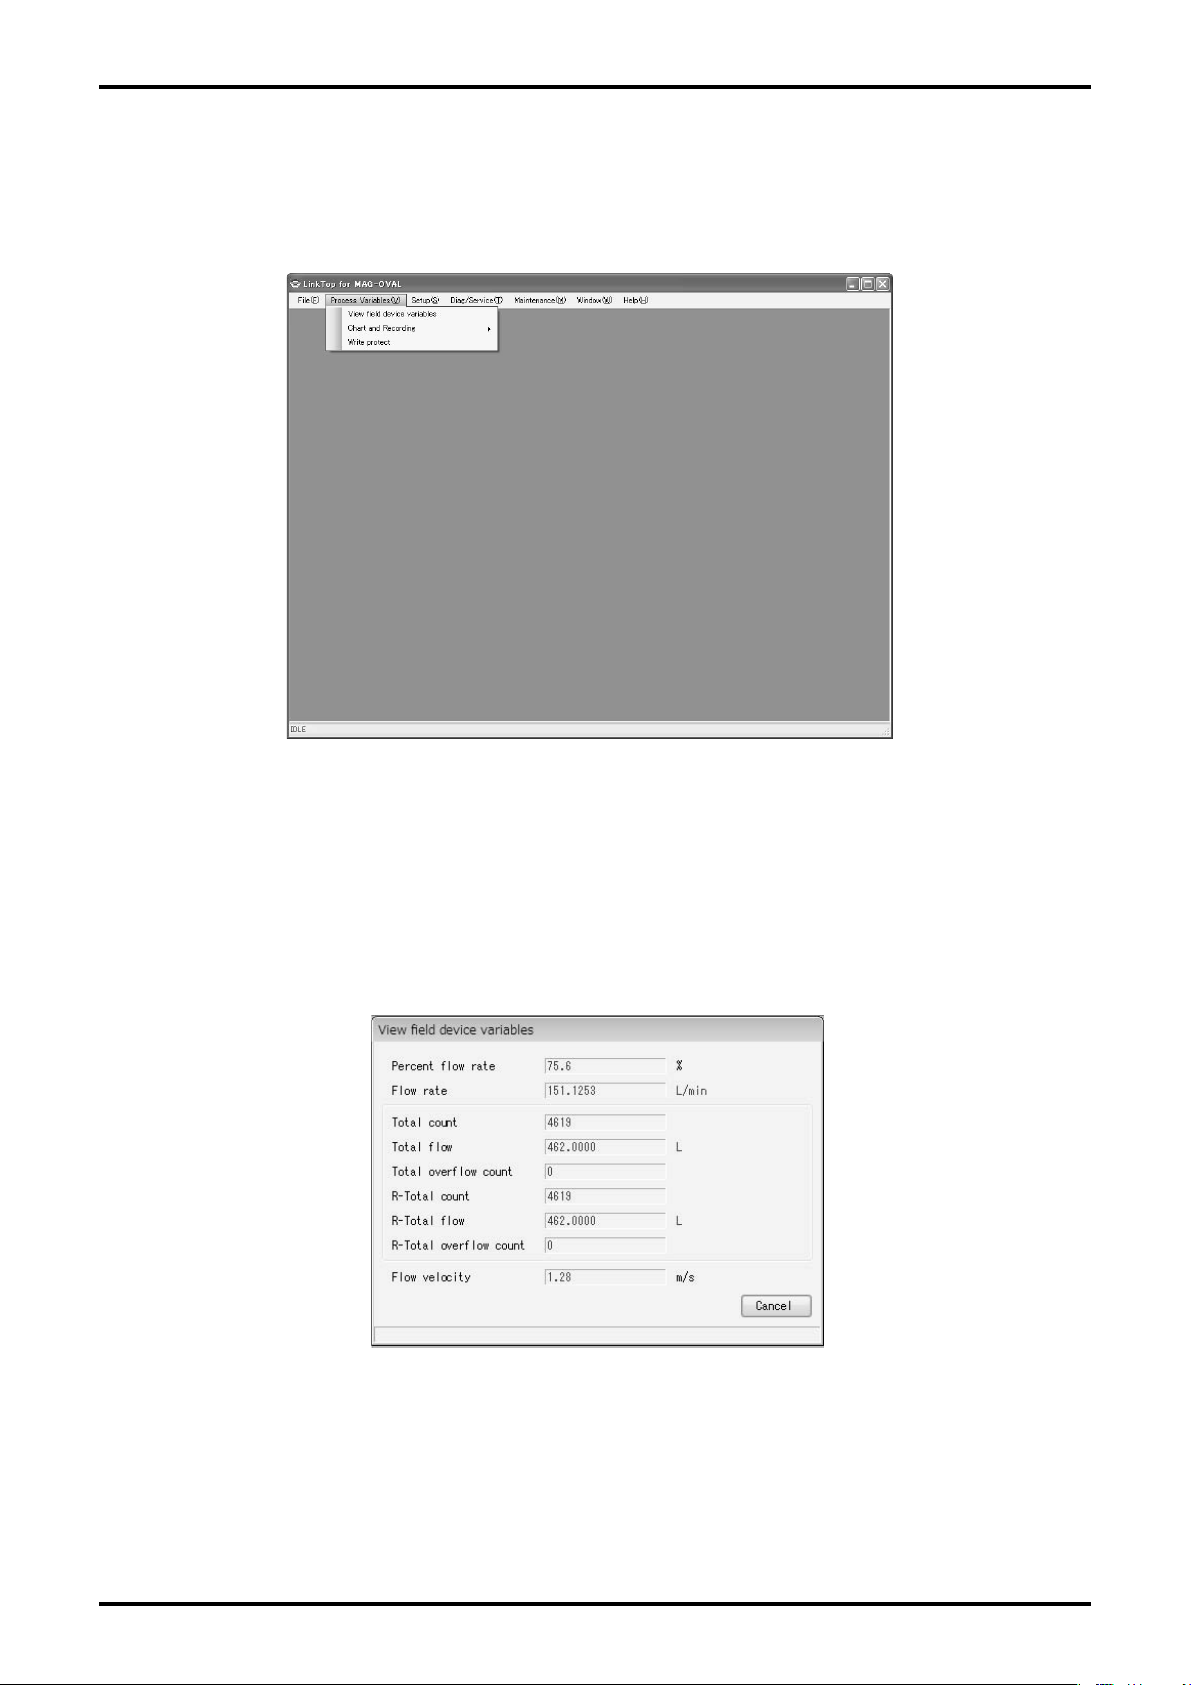
The "Process Variables" menu can be used to confirm the display of flowmeter's process values
(instantaneous ow rate, total ow, and ow velocity), chart display, logging, and Write Protect mode.
Fig.16
3.5.1 Processing Value Measurements (View eld device variables)
① Click "Process Variables (V)" from the menu, then select "View eld device variables" .
② The following window will be displayed (Fig. 17).
Fig.17
「Percent ow rate」…Percent ow rate (Instantaneous ow rate)
「Flow rate」…Actual ow rate (Instantaneous ow rate)
「Total count」…Accumulated total ow counter
「Total ow」…Accumulated total ow
Page 14
E-025-2-E
「Total overow count」…The number of times counted when accumulated total ow value
returns to "zero" by exceeding the maximum reading.
「R-Total count」…Resettable ow totalizing counter
「R-Total ow」…Resettable total ow
「R-Total overow count」…The number of times counted when resettable total ow returns
to "zero" by exceeding the maximum reading.
③ If there is a problem with the owmeter transmitter, then an error message will be displayed in the
window under the process value measurement window. For details, refer to section 3.11.4 "Error/
Alarm, Status List".
④ To exit, click "Cancel".
3.5.2 Chart Display and Logging (Chart and Recording)
Chart display of ow rate and ow velocity as well as data logging can be carried out.
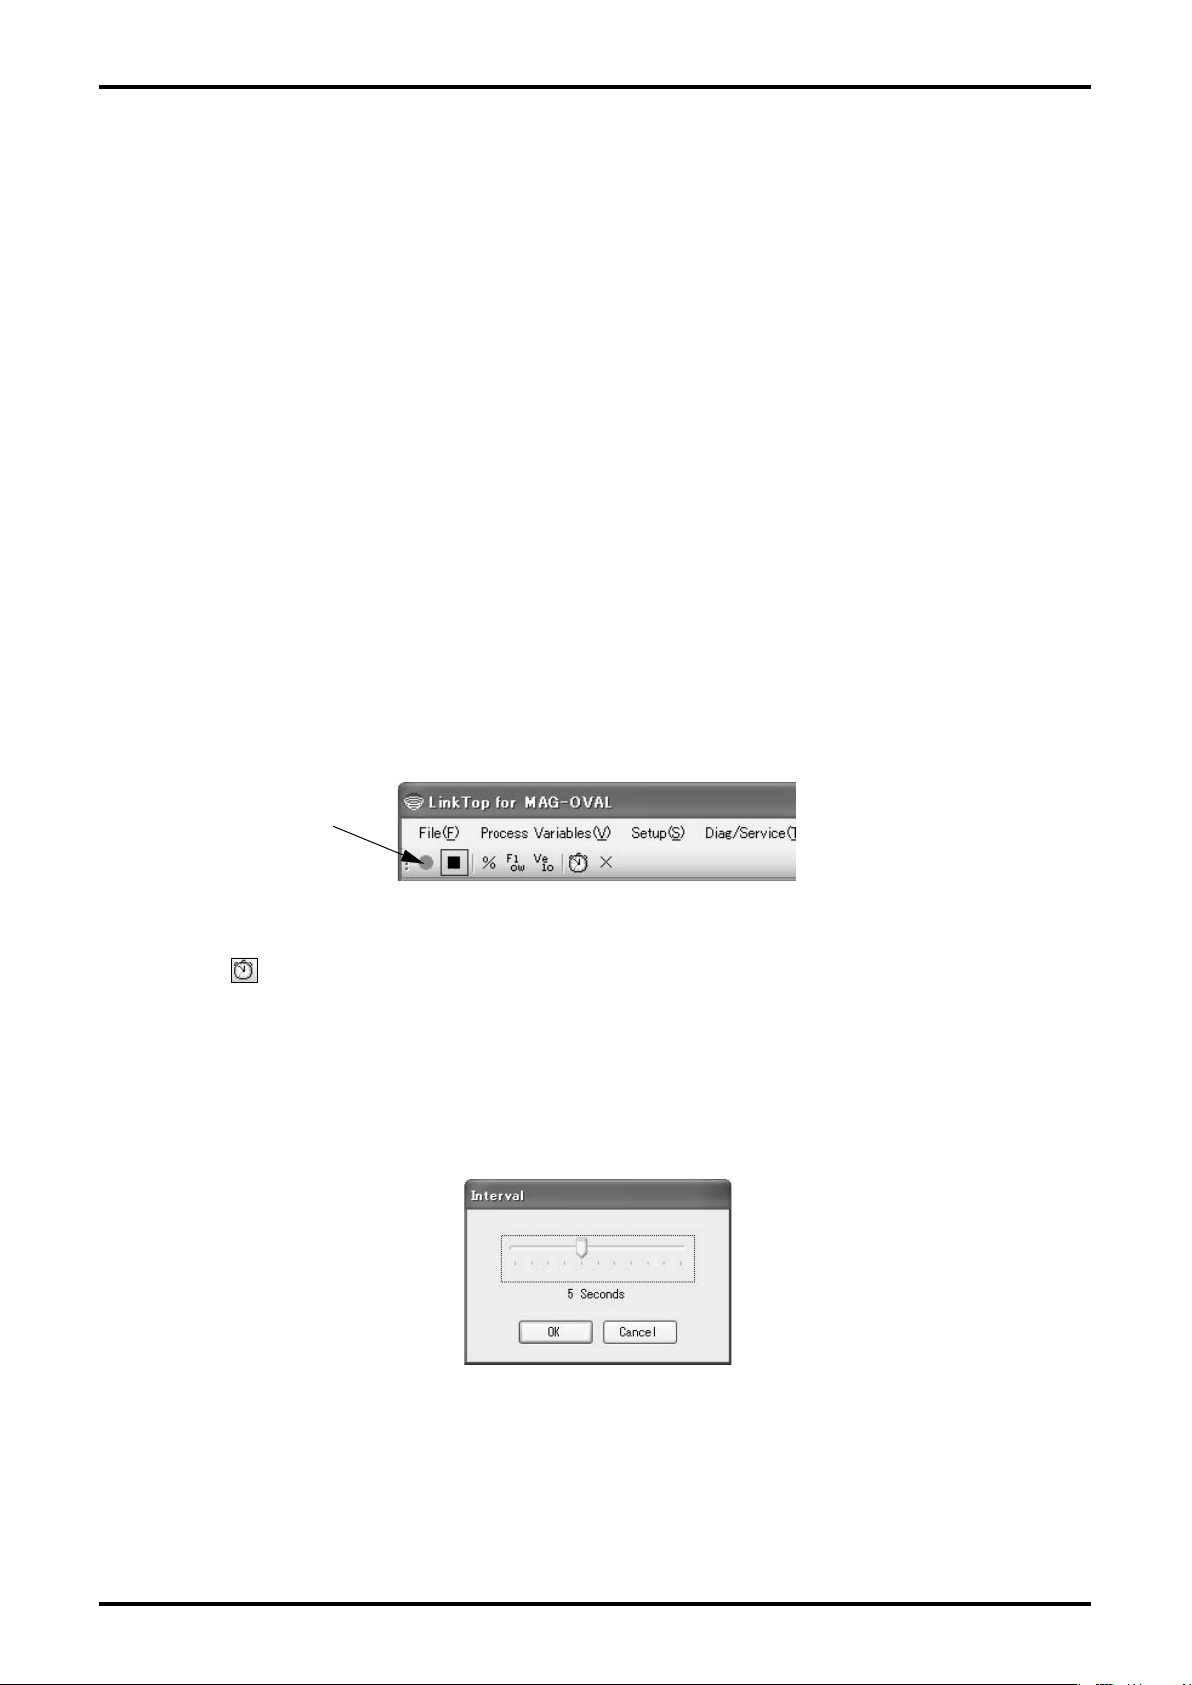
① Click "Chart and Recording" from the menu, and select "Active" , then a tool bar as shown in
Fig. 18 will appear underneath the menu.
Fig.18
② Click the button on the tool bar or "Chart and Recording" - "Interval" of the menu, then the
window as shown in Fig. 19 appears, enabling setting of update interval of chart display and
logging interval.
Select the preferred interval from "0.2 Second" (only in RS485 communication), "0.5 Second" (only
in RS485 communication), "1 Second", "3 Seconds", "5 Seconds", "10 Seconds", "30 Seconds",
"1 Minute", "5 Minutes", "10 Minutes", and "1 Hour" and click "OK".
Fig.19
Page 15
E-025-2-E
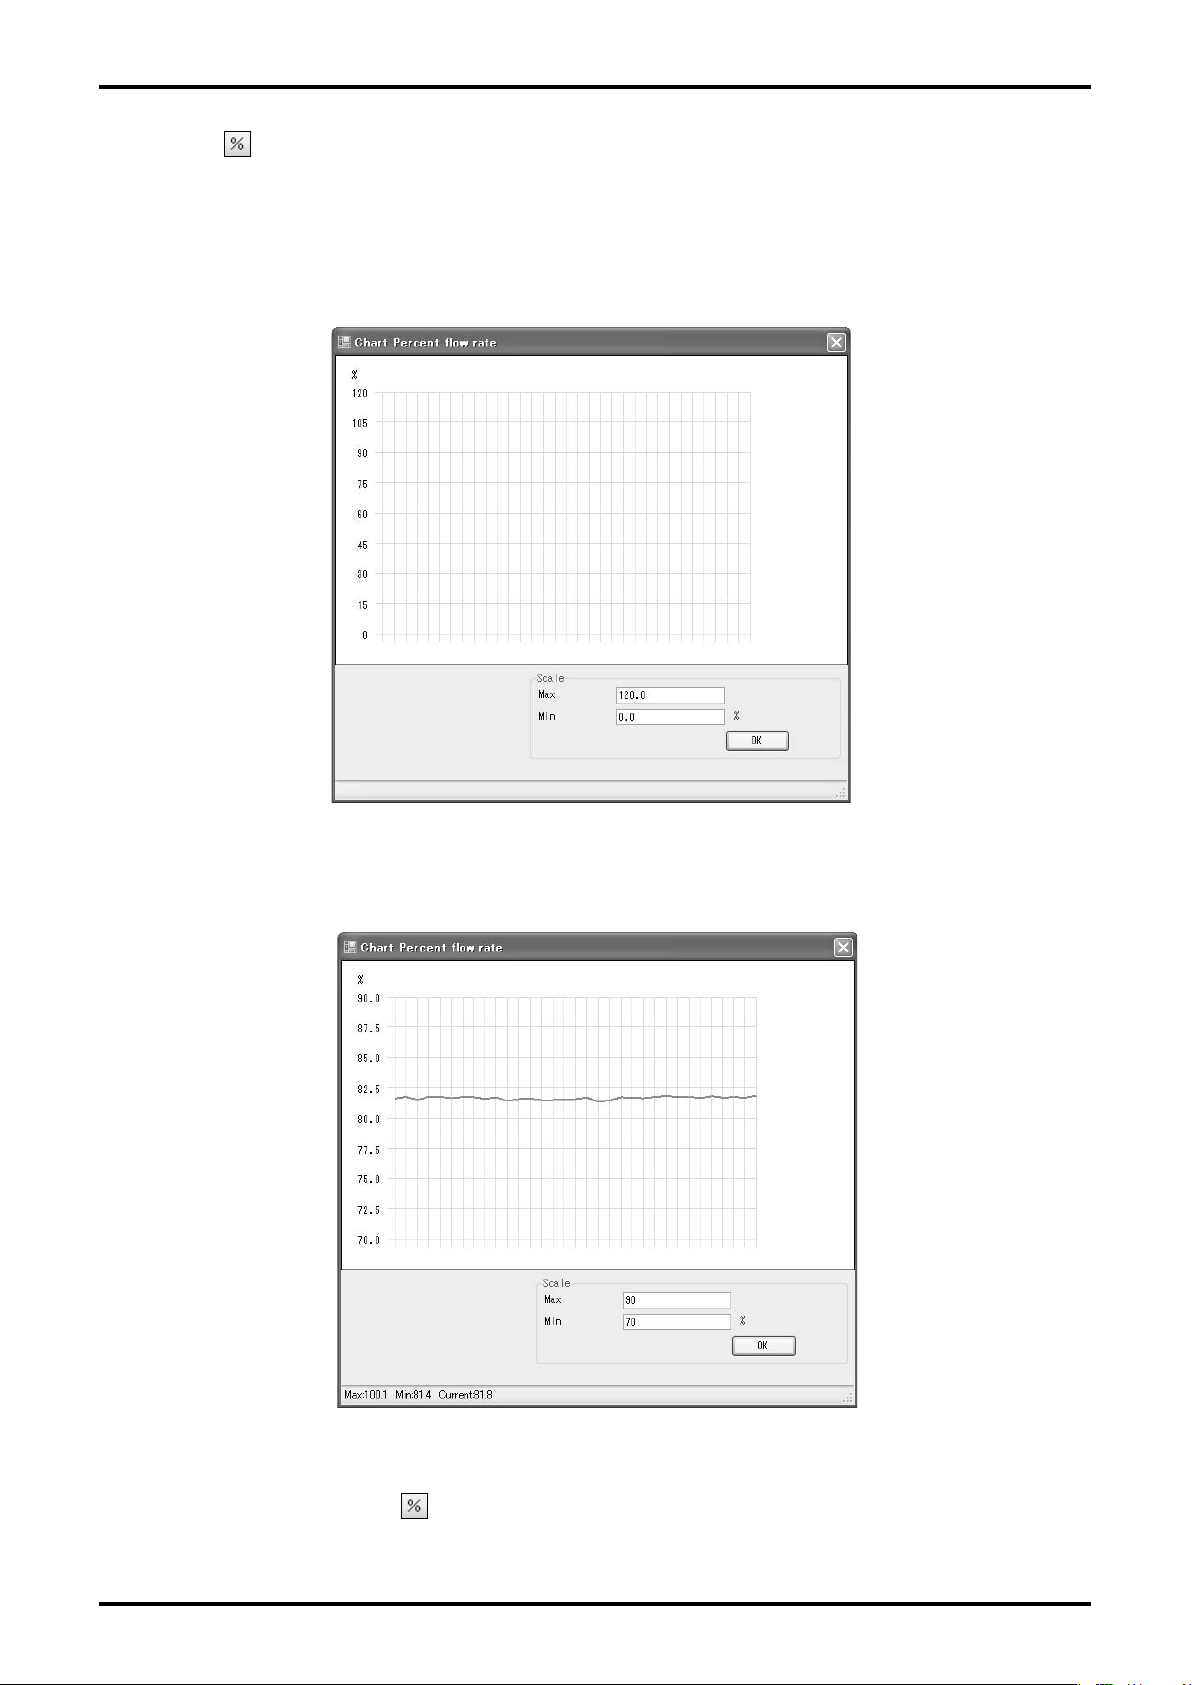
③ Click the button of the tool bar or "Chart and Recording" - "Chart" - "Percent ow rate" from
the menu, then the window as shown in Fig. 20 is displayed, enabling chart display of Percent
ow rate.
When changing the scale of the vertical axis, enter the preferred values to "Max" and "Min", then
click "OK".
Fig.20
④ A chart is drawn at the intervals of update set in ②.
Fig.21
⑤ To hide the chart, click the button of the tool bar or "Chart and Recording" - "Chart" - "Percent
ow rate" from the "Proccess Variables (V)" menu.
5
Page 16
E-025-2-E
⑥ Similarly, by clicking the button of the tool bar or "Chart and Recording" - "Chart" - "Flow rate"
from the "Proccess Variables (V)" menu, actual ow rate can be shown or hidden. If you click the
button or "Chart and Recording" - "Chart" - "Flow velocity" from the "Proccess Variables (V)"
menu, ow velocity chart can be shown or hidden as well.
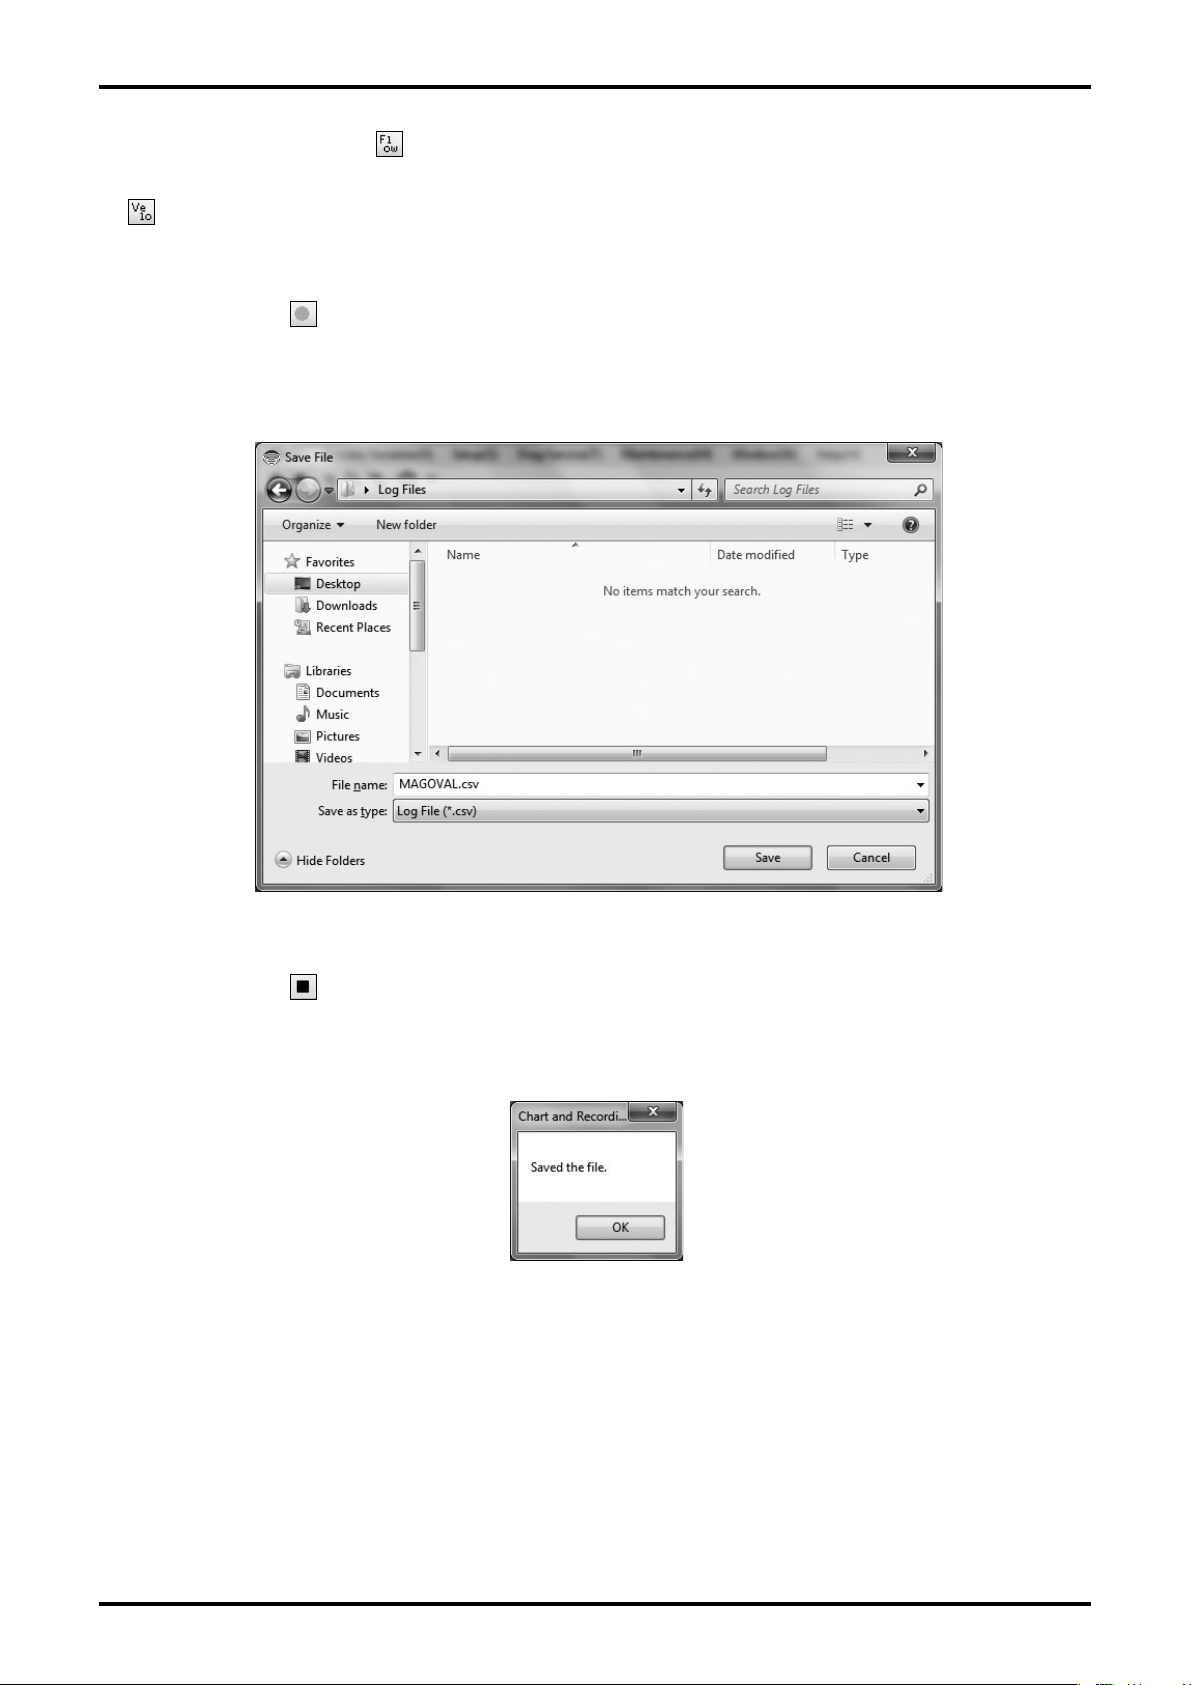
⑦ If you click the button of the tool bar or "Chart and Recording" - "Recording" - "Start" in the
menu, the following dialog box (Fig. 22) is displayed. Select the disk and folder to create a le,
enter a le name, and click "Save (S)". A CSV le is created and data logging begins.
Fig.22
⑧ If you click the button of the tool bar or "Chart and Recording" - "Recording" - "Stop" in the
menu, logging stops (terminating the writing process on the le) and the le is completed. Then the
following message box (Fig. 23) is displayed. Click "OK".
Fig.23
Page 17
E-025-2-E
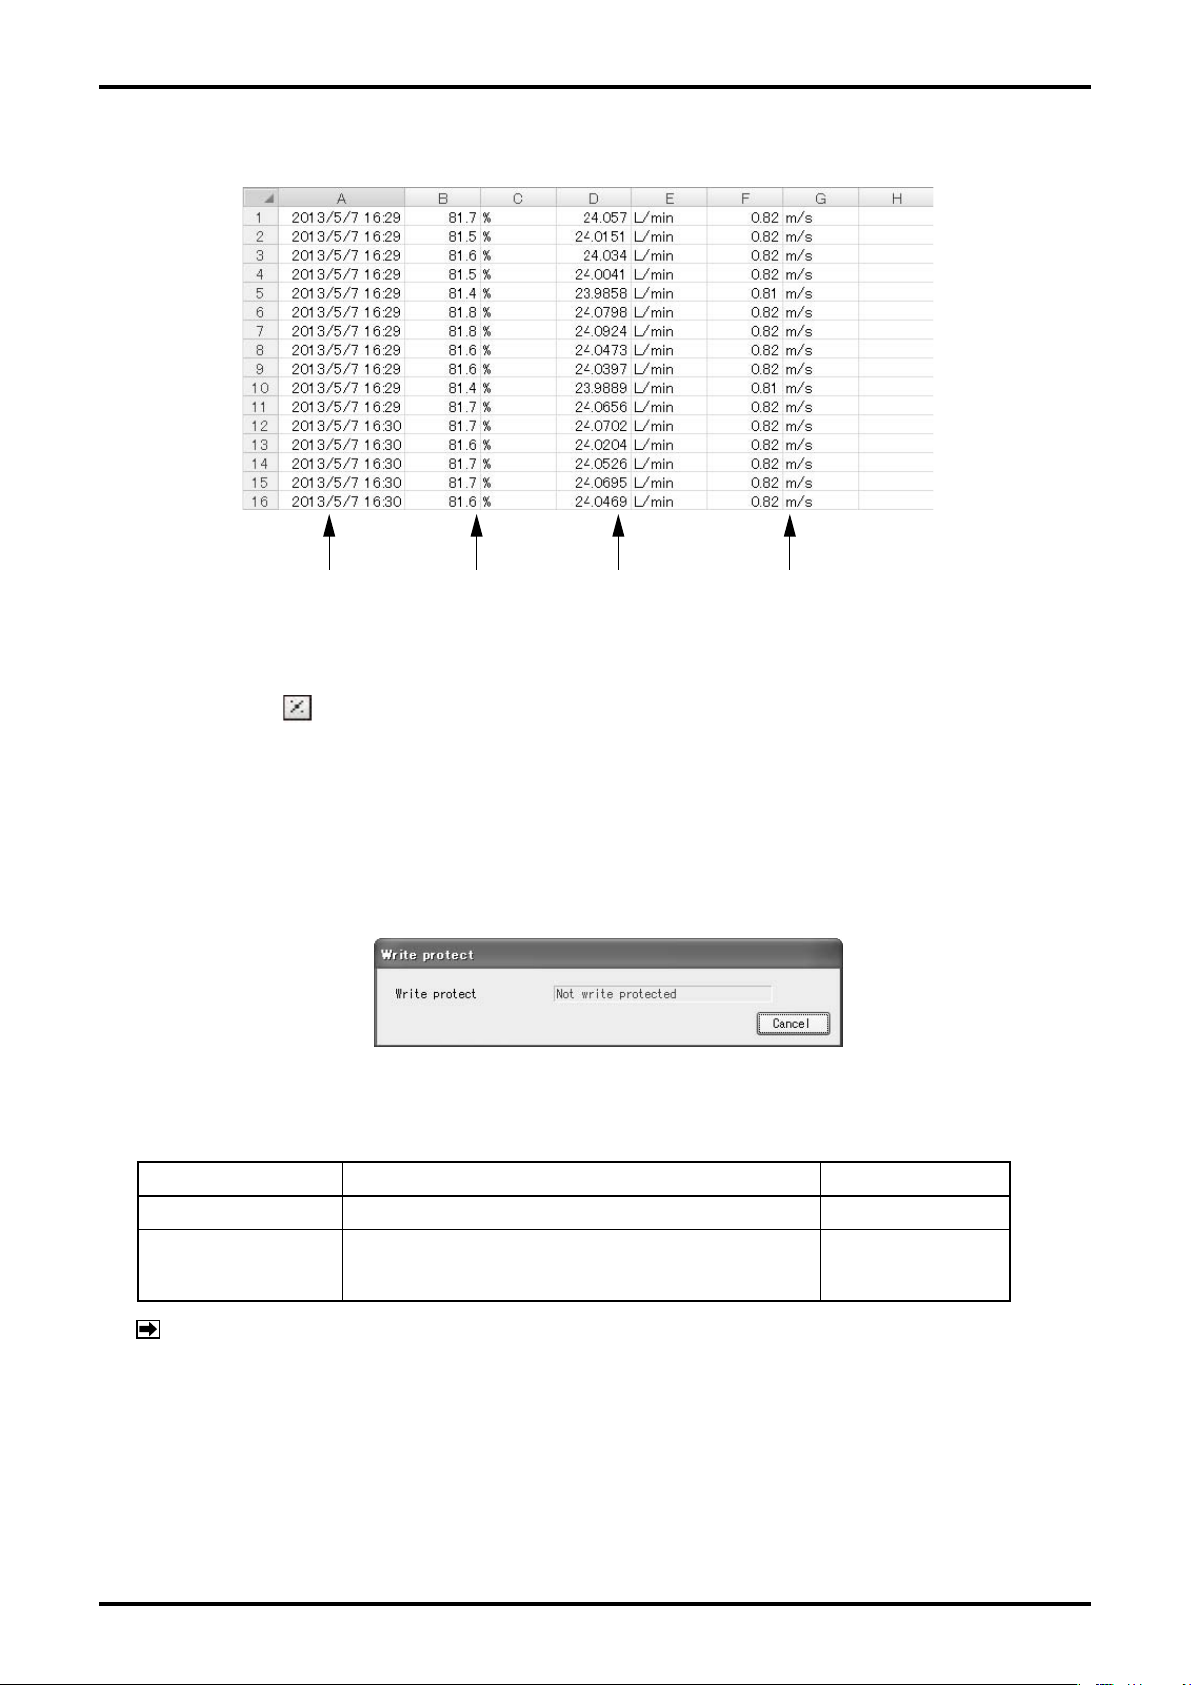
⑨ The content of the log le when logging interval is set to "5 Seconds" is as shown in Fig. 24.
Date and time Percent ow rate Flow rate Flow velocity
Fig.24
⑩ If you click the button of the tool bar or "Chart and Recording" - "Active" from the menu, chart
display and data logging are terminated.
3.5.3 Write Protect (Write protect)
① Click "Process Variables (V)" on the menu and select "Write protect", then the following window
(Fig. 25) will be displayed.
Fig.25
"Write protect" shows whether parameter change of the transmitter is available or not.
Mode Detail SW1-4 Setting
Not write protected Enables changing and setting parameters. OFF
Write protected
Disables changing and setting parameters.
(Conrmation of parameters is available.)
ON
NOTE : Selecting the above mode is available by changing switches SW1-4 on the
CPU board of the flowmeter transmitter.
② To exit this procedure, click "Cancel".
Page 18
E-025-2-E
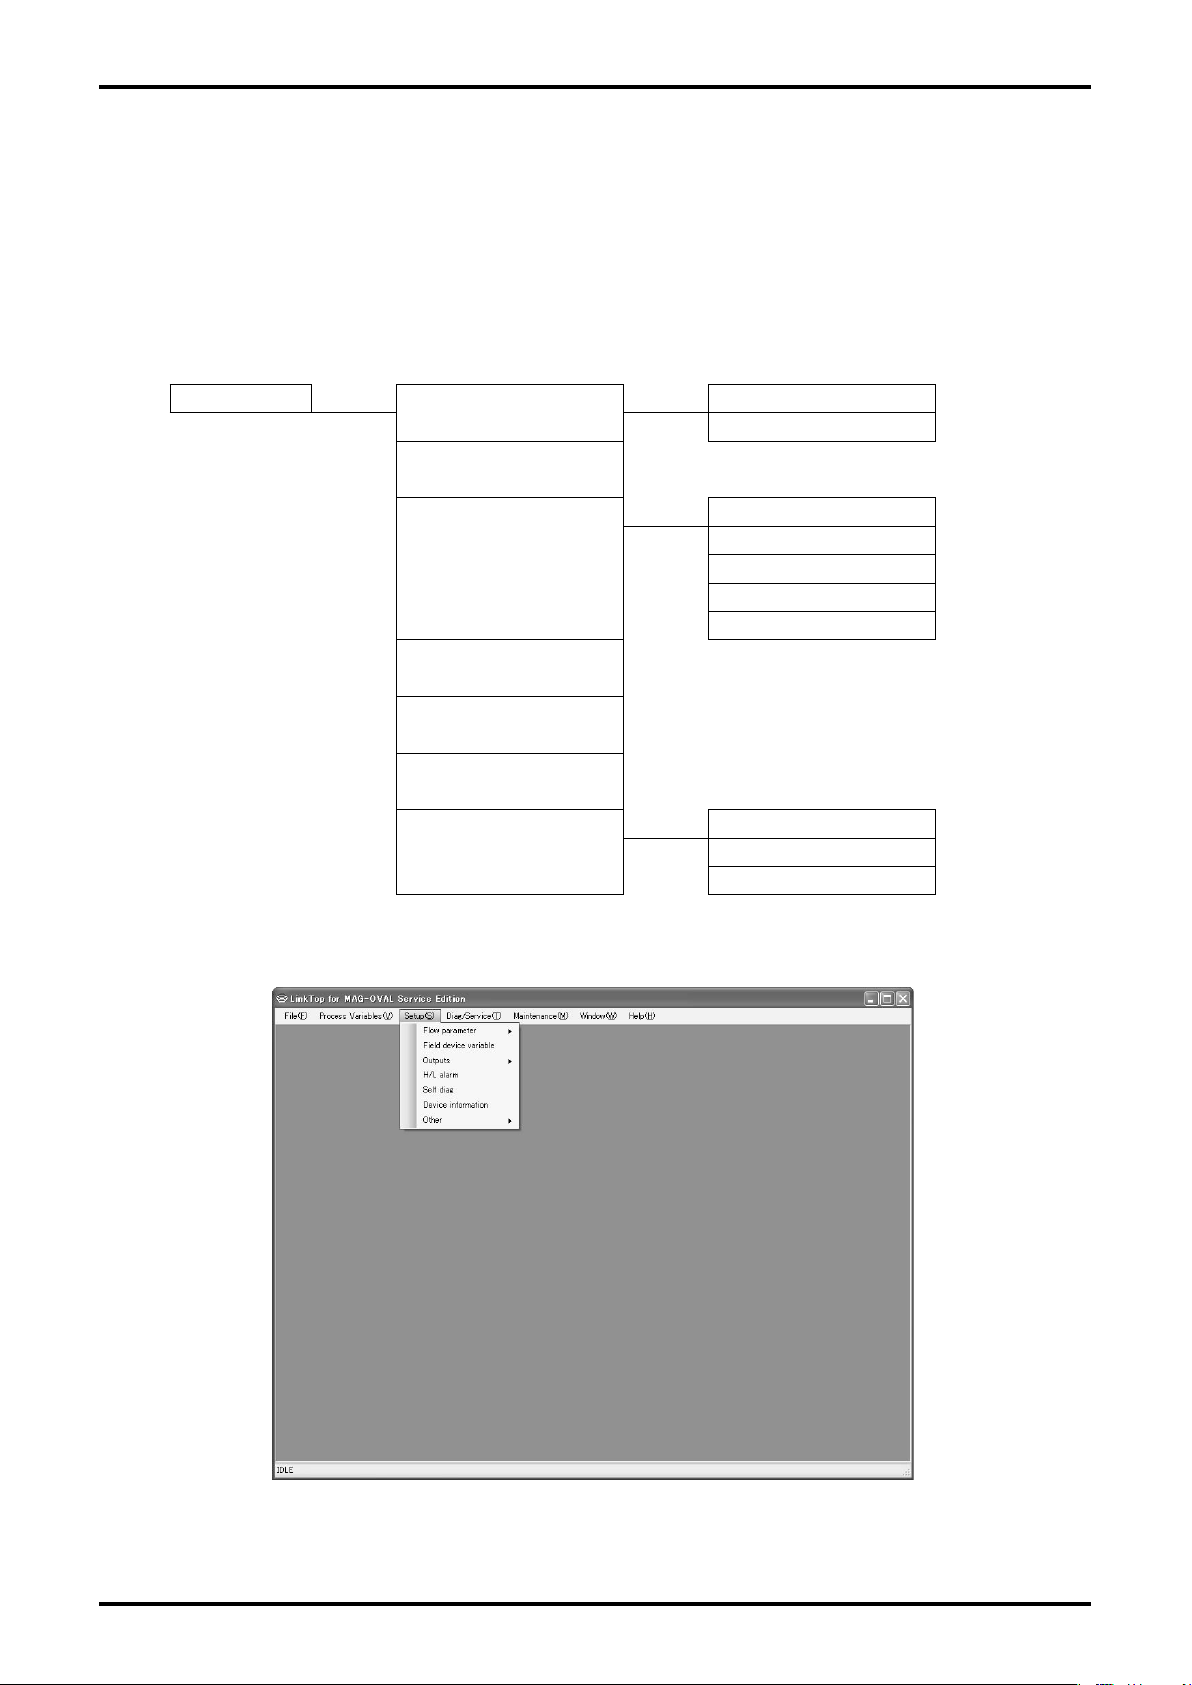
3.6 Menu : Setup (Settings)
The "Setup" menu can be used to set owmeter's various parameter values, transmitter's information,
and so on.
If any windows of "Diag/Service" menu is displayed on the screen, then it will not be possible to
set the various parameters, transmitter information, and so on. Close these windows before making
settings. For the actual screen, refer to Fig. 26.
Setup
Flow parameter
Field device variable
Outputs
H/L alarm
Self diag
Device information
Other
Setup Item Tree
Nominal diameter
Flow range
Analog output
Pulse output
Status output
Status select
Error output
Display setting
Security
Polling address
Fig.26
Page 19
E-025-2-E
3.6.1 Flow Rate Parameter (Flow parameter)
3.6.1.1 Nominal Diameter (Nominal diameter)
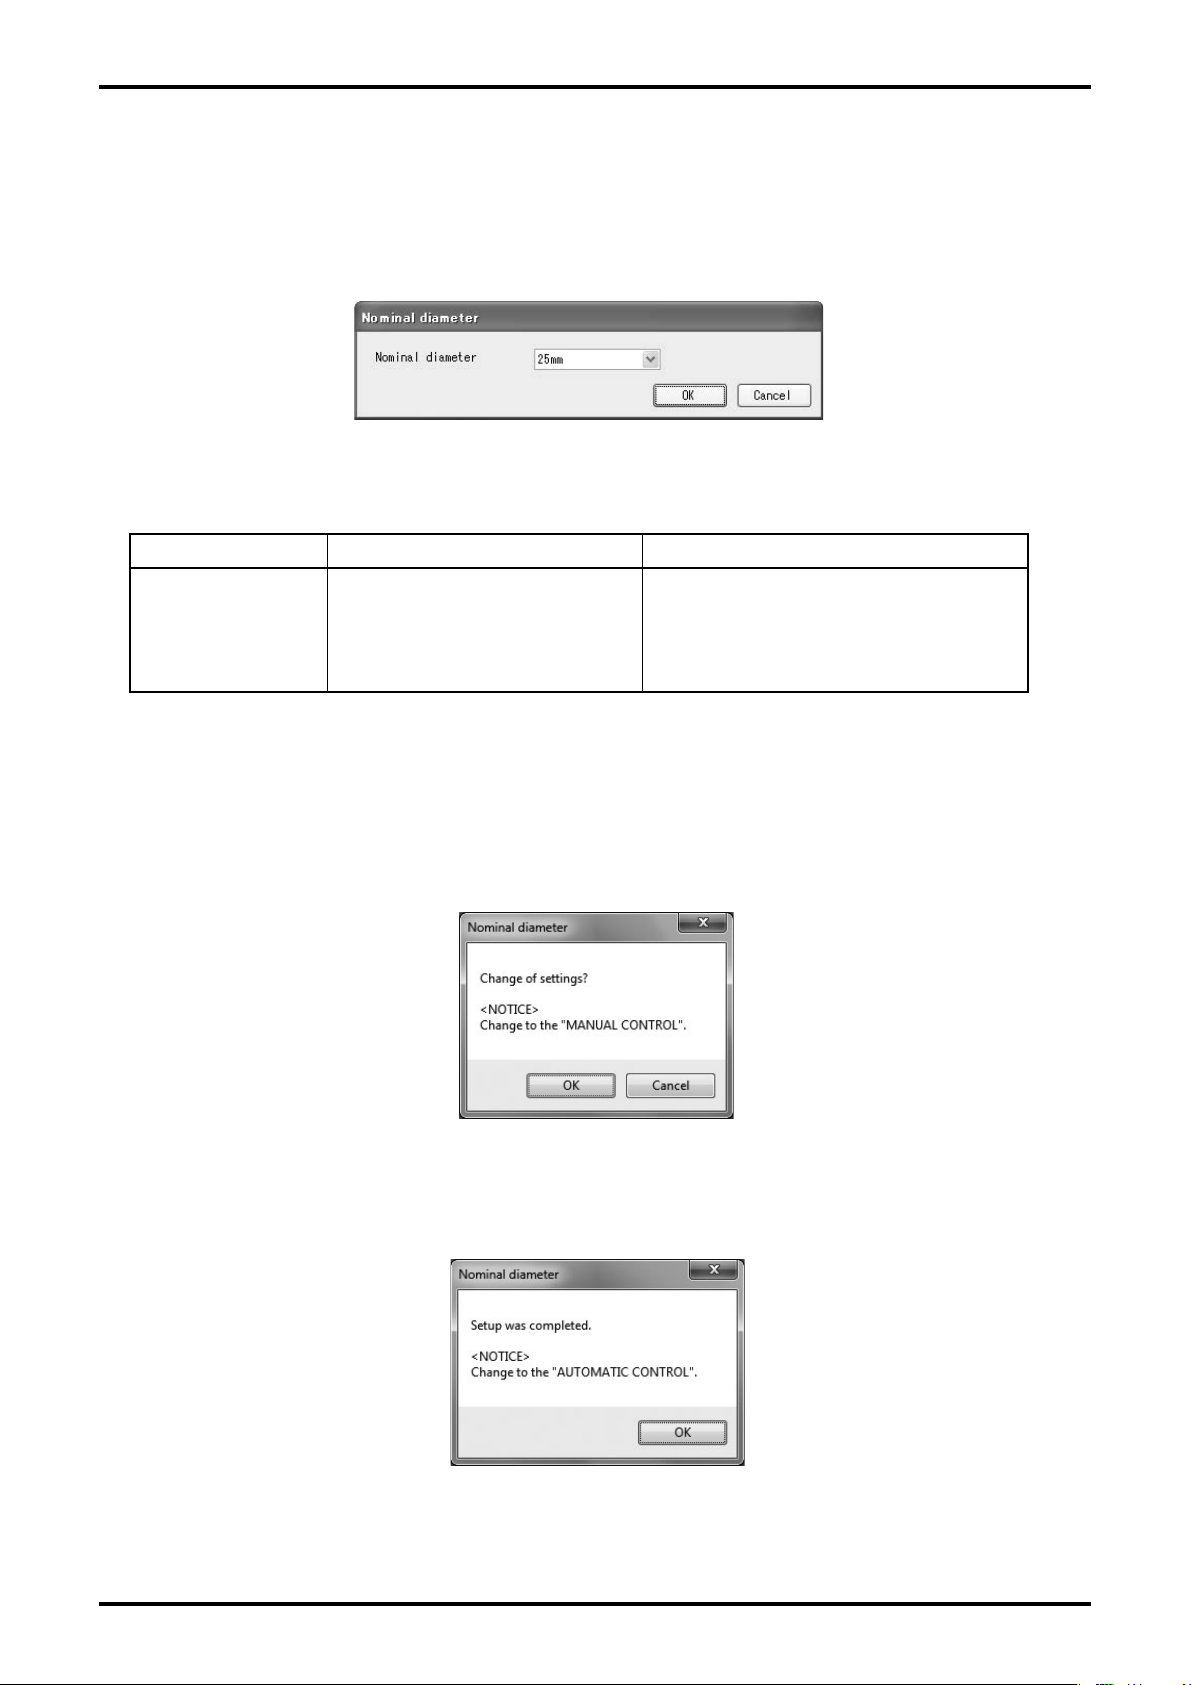
① Click "Setup (S)" from the menu, and select "Nominal diameter" from the drop-down list of "Flow
parameter", then the following window (Fig. 27) will be displayed.
Fig.27
② Select the correct nominal diameter.
Setting item Detail Setting range
3mm, 4mm, 6mm, 8mm, 10mm, 15mm,
Nominal diameter
Nominal diameter of sensor
(Select from the right column.)
20mm, 25mm, 32mm, 40mm, 50mm,
65mm, 80mm, 100mm, 125mm, 150mm,
200mm
③ Click "OK" after the setting is completed to display the message box (Fig. 28). Click "OK" here
to change the settings to the inputted values, and to reect the changed setting values in the
owmeter's output. If the owmeter's output is used to control valves or other such parts as safety
protocol, change that control loop to manual control so that the control loop cannot be inuenced
by the owmeter's output.
Fig.28
④ The message box (Fig. 29) is displayed after changing the setting values. Click "OK" to complete
the setting process.
Fig.29
⑤ The window for setting item is displayed. To exit, click "Cancel".
Page 20
E-025-2-E
3.6.1.2 Measuring Range (Flow range)
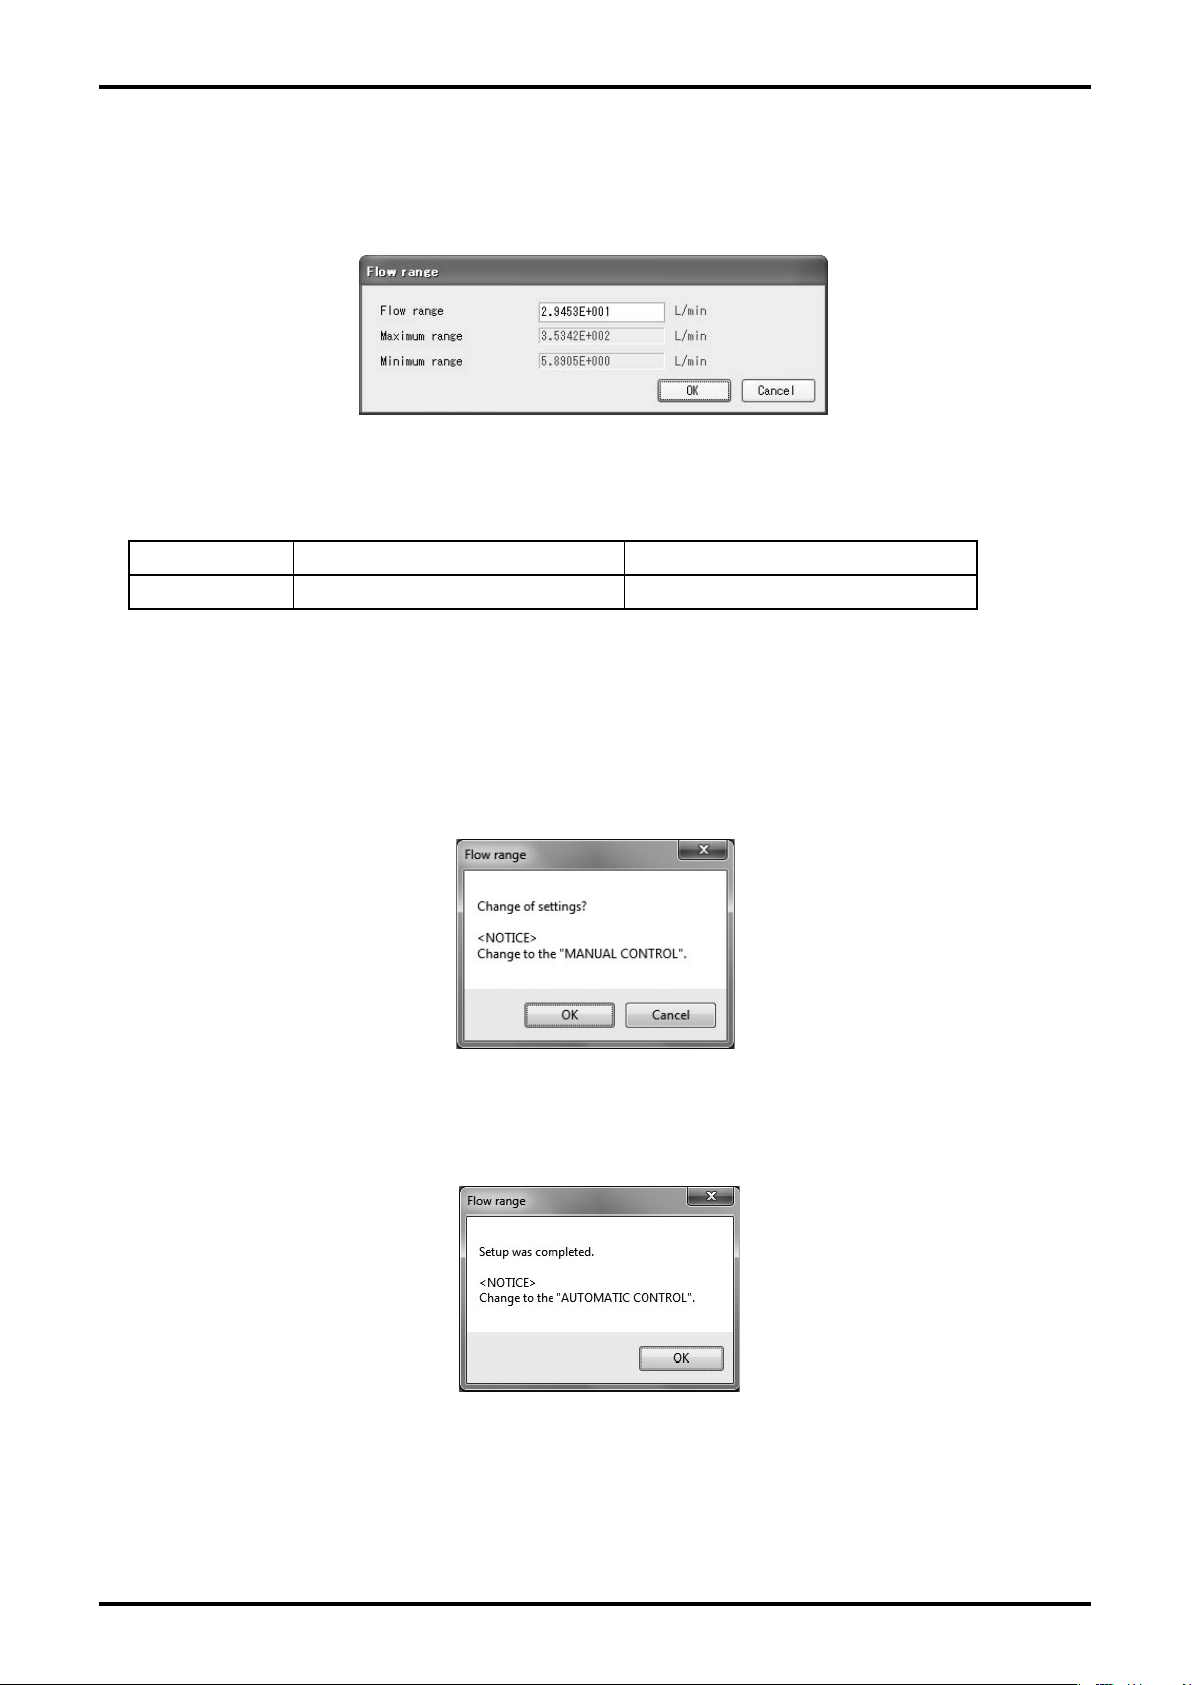
① Click "Setup (S)" from the menu then select "Flow range" from the drop-down list of "Flow
parameter", then the following window (Fig. 30) will be displayed.
Fig.30
② Enter a numeric value for the item.
Setting item Detail Setting range
Flow range Measuring range (Full scale flow) Minimum range to Maximum range
③ Click "OK" after the setting is completed to display the message box (Fig. 31). Click "OK" here
to change the settings to the inputted values, and to reect the changed setting values in the
owmeter's output. If the owmeter's output is used to control valves or other such parts as safety
protocol, change the control loop to manual control so that the control loop cannot be inuenced
by the owmeter's output.
Fig.31
④ The message box (Fig. 32) is displayed after changing the setting values. Click "OK" to complete
the setting process.
Fig.32
⑤ The window for setting item is displayed. To exit, click "Cancel".
20
Page 21
E-025-2-E
3.6.2 Transmitter Variables (Field device variable)
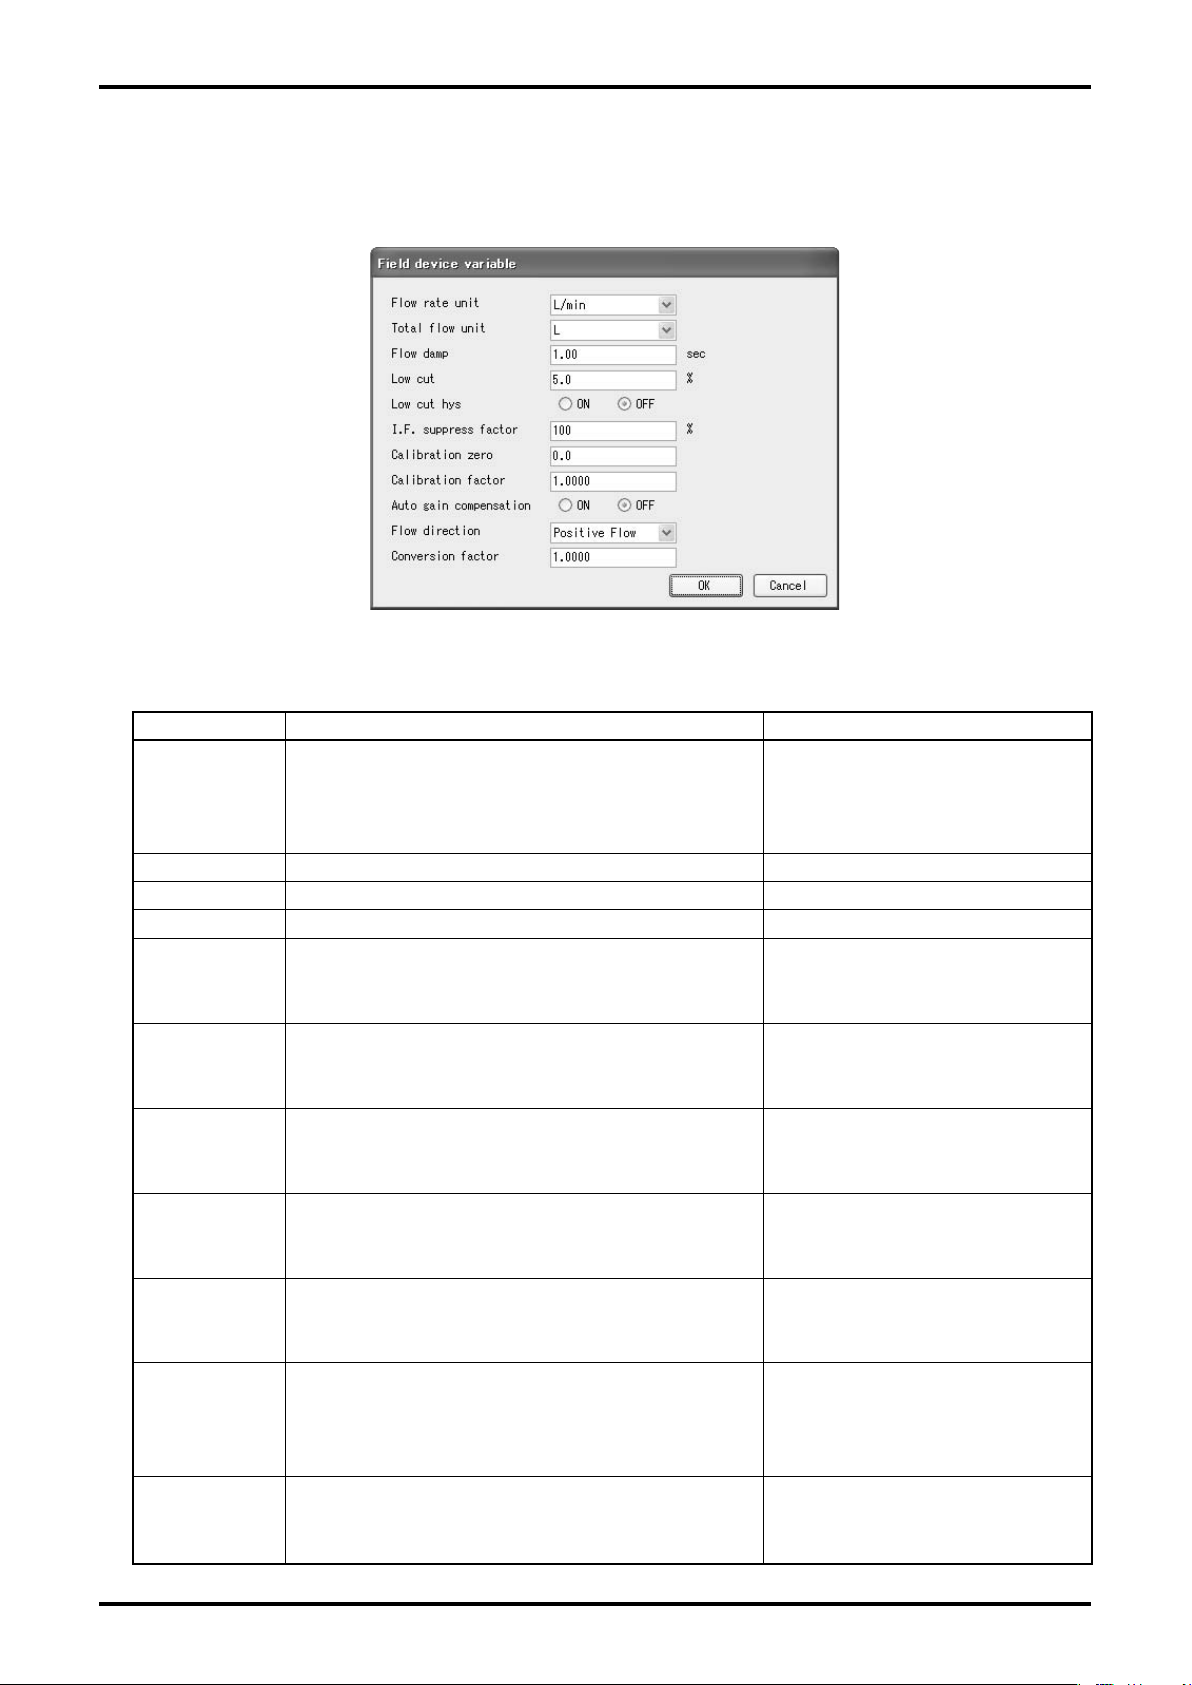
① Click "Setup (S)" from the menu, and select "Field device variable" , then the following window
(Fig. 33) will be displayed.
Fig. 33
② Select and enter numeric values for respective items.
Setting item Detail Setting range
Unit of instantaneous flow rate (Select from the
Flow rate unit
Total flow unit
Flow damp Time constant of flow metering damping 0.48 to 99.99sec
Low cut Low-cut value of actual flow 0.0 to 100.0%
Low cut hys
I.F. suppress
factor
Calibration
zero
Calibration
factor
Auto gain
compensation
right column.)
At the change between volumetric flow rate
unit ⇔ mass flow rate unit, total value is reset.
Unit of total flow (Select from the right column.)
Low-cut hysteresis (Select from the right column.)
A function to provide the low-cut value with 5%
hysteresis
Suppress fluctuation of flow output due to impulse-like noise.
Sets the suppression amount of fluctuation with percent
value to the measuring range.
Zero point constant (Offset amount)
This is a constant value related to the accuracy
of the flowmeter. Do not change.
Calibration factor
This is a constant value related to the accuracy
of the flowmeter. Do not change.
Automatic compensating function to keep the
amplifier gain constant at all times. (Select from
the right column.)
L/s, L/min, L/h, L/d, gal/s,
gal/min, gal/h, gal/d, m3/s,
m3/min, m3/h, m3/d, kg/s, kg/min,
kg/h, kg/d, t/s, t/min, t/h, t/d
L, gal, m3, kg, t
ON, OFF
1 to 100%
More than -1000.0 and less than
1000.0
0.7000 or more and less than
2.0000
ON, OFF
Flow direction
Conversion
factor
Flow direction (Select from the right column.)
Sets "Negative Flow" when the direction of fluid
flow is reversed against the arrow direction (flow
direction) of the sensor.
Fixed conversion factor
Used as a parameter similar to density.
Multiplied to actual flow to calculate mass flow.
Positive Flow, Negative Flow
0.2 to 5.0
2
Page 22
E-025-2-E
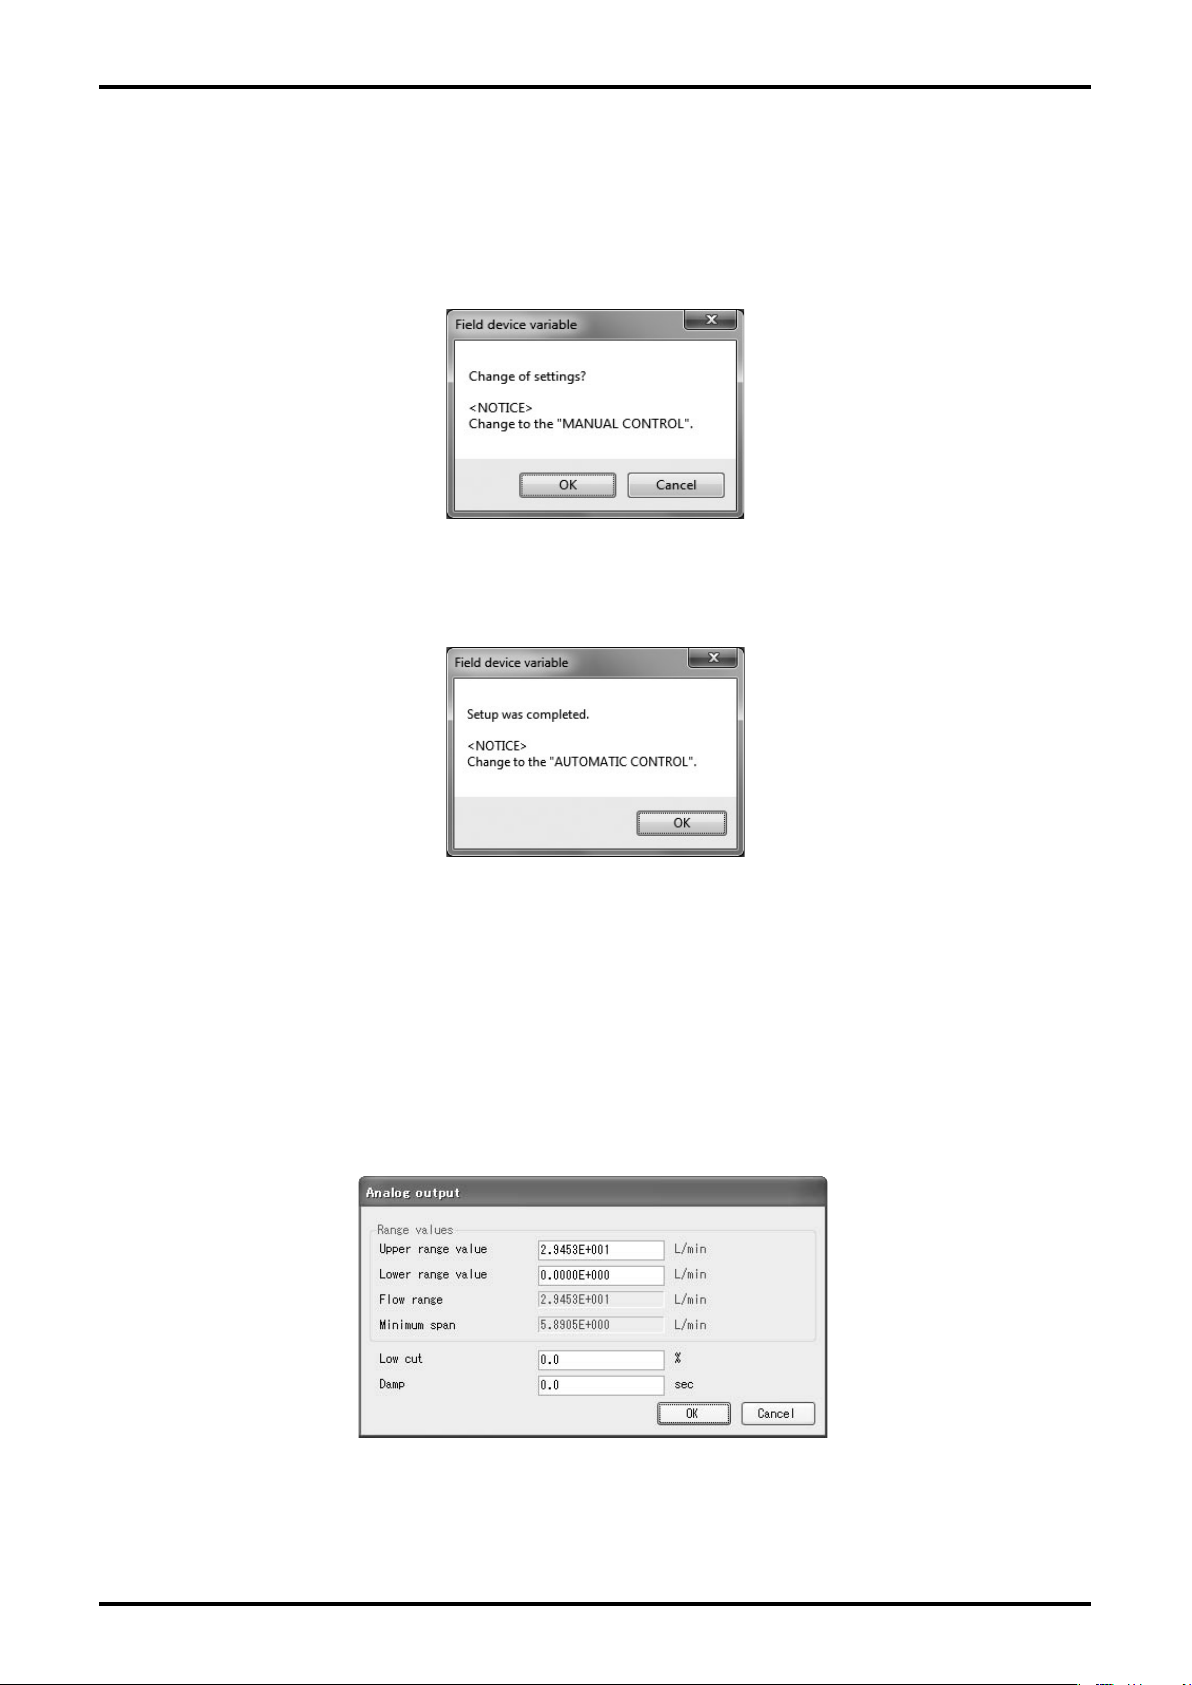
③ Click "OK" after the setting is completed to display the message box (Fig. 34). Click "OK" here
to change the settings to the inputted values, and to reect the changed setting values in the
owmeter's output. If the owmeter's output is used to control valves or other such parts as safety
protocol, change the control loop to manual control so that the control loop cannot be inuenced
by the owmeter's output.
Fig.34
④ The message box (Fig. 35) is displayed after changing the setting values. Click "OK" to complete
the setting process.
Fig.35
⑤ The window for setting item is displayed. To exit, click "Cancel" .
3.6.3 Output Settings (Outputs)
3.6.3.1 Analog Output (Analog output)
① Click "Setup (S)" from the menu, and select "Analog output" from the drop-down list of "Outputs",
then the following window (Fig. 36) will be displayed.
22
Fig.36
Page 23
E-025-2-E
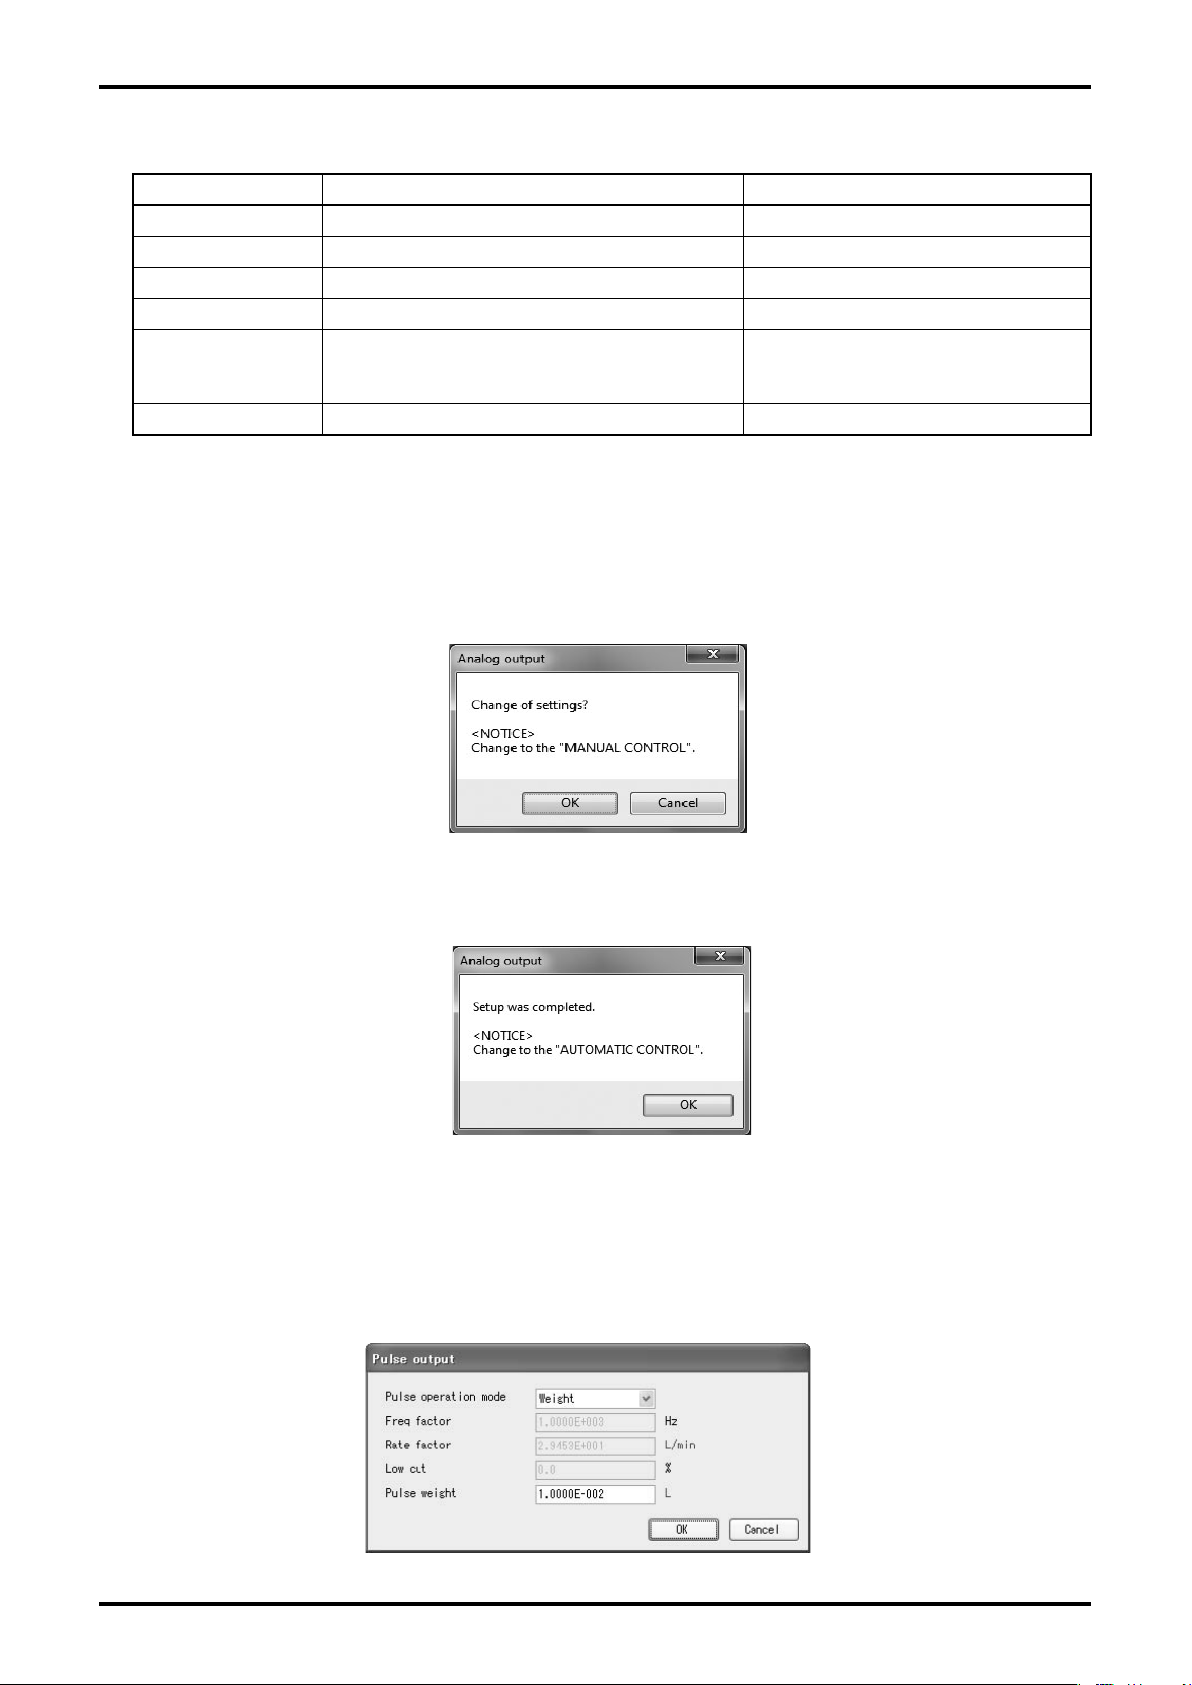
② Enter numeric values for respective items.
Setting item Detail Setting range
Upper range value Sets 20mA output of analog output. Minimum span to Flow range
Lower range value Sets 4mA output of analog output. 0.0 to (Flow range - Minimum span)
Flow range Metering range Only for reference
Minimum span
Low cut
Damp Time constant for analog output damping 0.0 to 200.0sec
③ Click "OK" after the setting is completed to display the message box (Fig. 37). Click "OK" here
to change the settings to the inputted values, and to reect the changed setting values in the
owmeter's output. If the owmeter's output is used to control valves or other such parts as safety
protocol, change that control loop to manual control so that the control loop cannot be inuenced
by the owmeter's output.
Minimum span of 100% - 0% value of analog output
Low-cut value of analog output
Low-cut value for preventing pulse output
when flow rate is near 0%.
Only for reference
0.0 to 10.0%
Fig.37
④ The message box (Fig. 38) is displayed after changing the setting values. Click "OK" to complete
the setting process.
Fig.38
⑤ The window for setting item is displayed. To exit, click "Cancel".
3.6.3.2 Pulse Output (Pulse output)
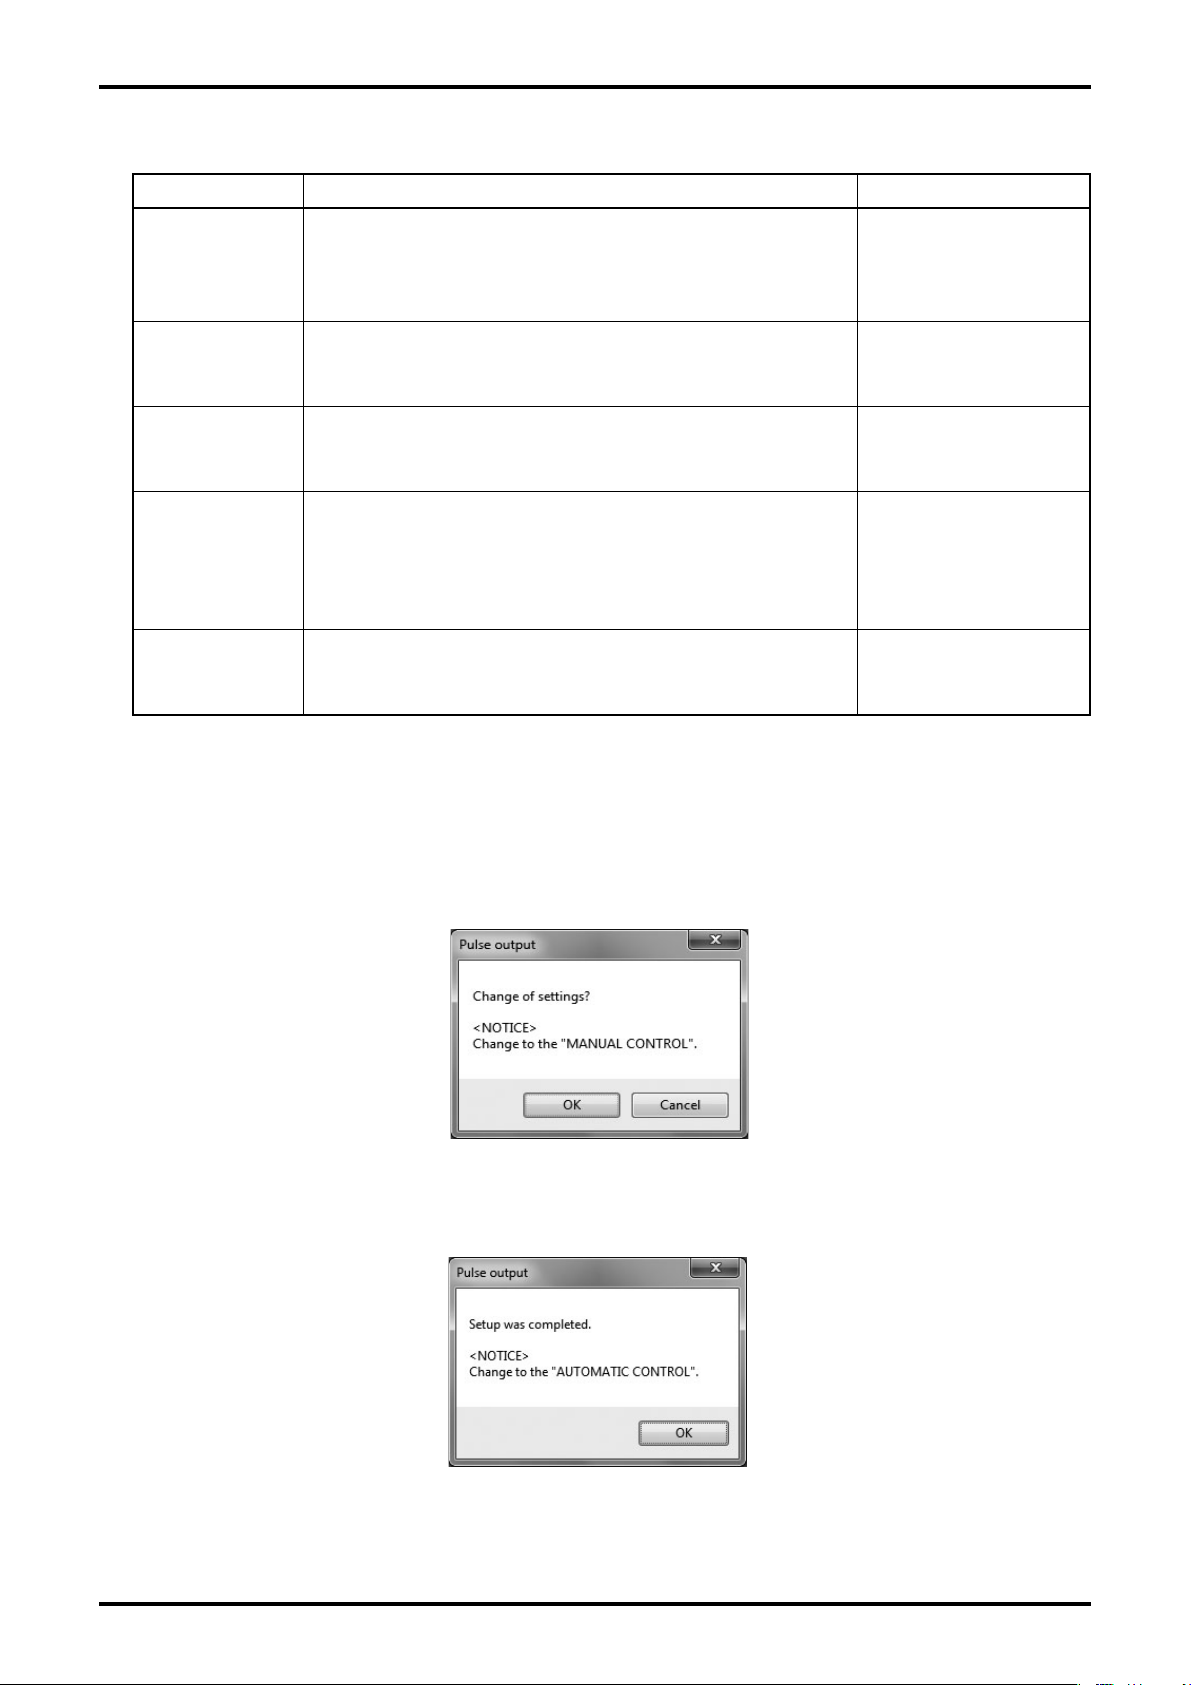
① Click "Setup (S)" from the menu, and select "Pulse output" from the drop-down list of "Outputs",
then the following window (Fig. 39) will be displayed.
Fig.39
2
Page 24
E-025-2-E
② Enter numeric values for respective items.
Setting item Detail Setting range
Pulse output mode selection (Select from the right column.)
Pulse operation
mode
Freq factor
Rate factor
Low cut
Pulse weight
Frequency: Calculate with full-scale frequency and full scale flow.
Weight: Calculate with pulse weight.
Full-scale frequency of pulse output
Valid when pulse output mode is Frequency.
(Set value display area is highlighted.)
Full-scale flow rate of pulse output
Valid when pulse output mode is Frequency.
(Set value display area is highlighted.)
Low-cut value of pulse output
Low-cut value for preventing pulse output when flow rate
is near 0%.
Valid when pulse output mode is Frequency.
(Set value display area is highlighted.)
Pulse weight
Valid when pulse calculation mode is Weight.
(Set value display area is highlighted.)
Frequency, Weight
1 to 10000
—
0.0 to 100.0%
—
③ Click "OK" after the setting is completed to display the message box (Fig. 40). Click "OK" here
to change the settings to the inputted values, and to reect the changed setting values in the
owmeter's output. If the owmeter's output is used to control valves or other such parts as safety
protocol, change the control loop to manual control so that the control loop cannot be inuenced
by the owmeter's output.
Fig.40
④ The message box (Fig. 41) is displayed after changing the setting values. Click "OK" to complete
the setting process.
Fig.41
⑤ The window for setting item is displayed. To exit, click "Cancel".
2
Page 25
E-025-2-E
3.6.3.3 Status Output (Status output)
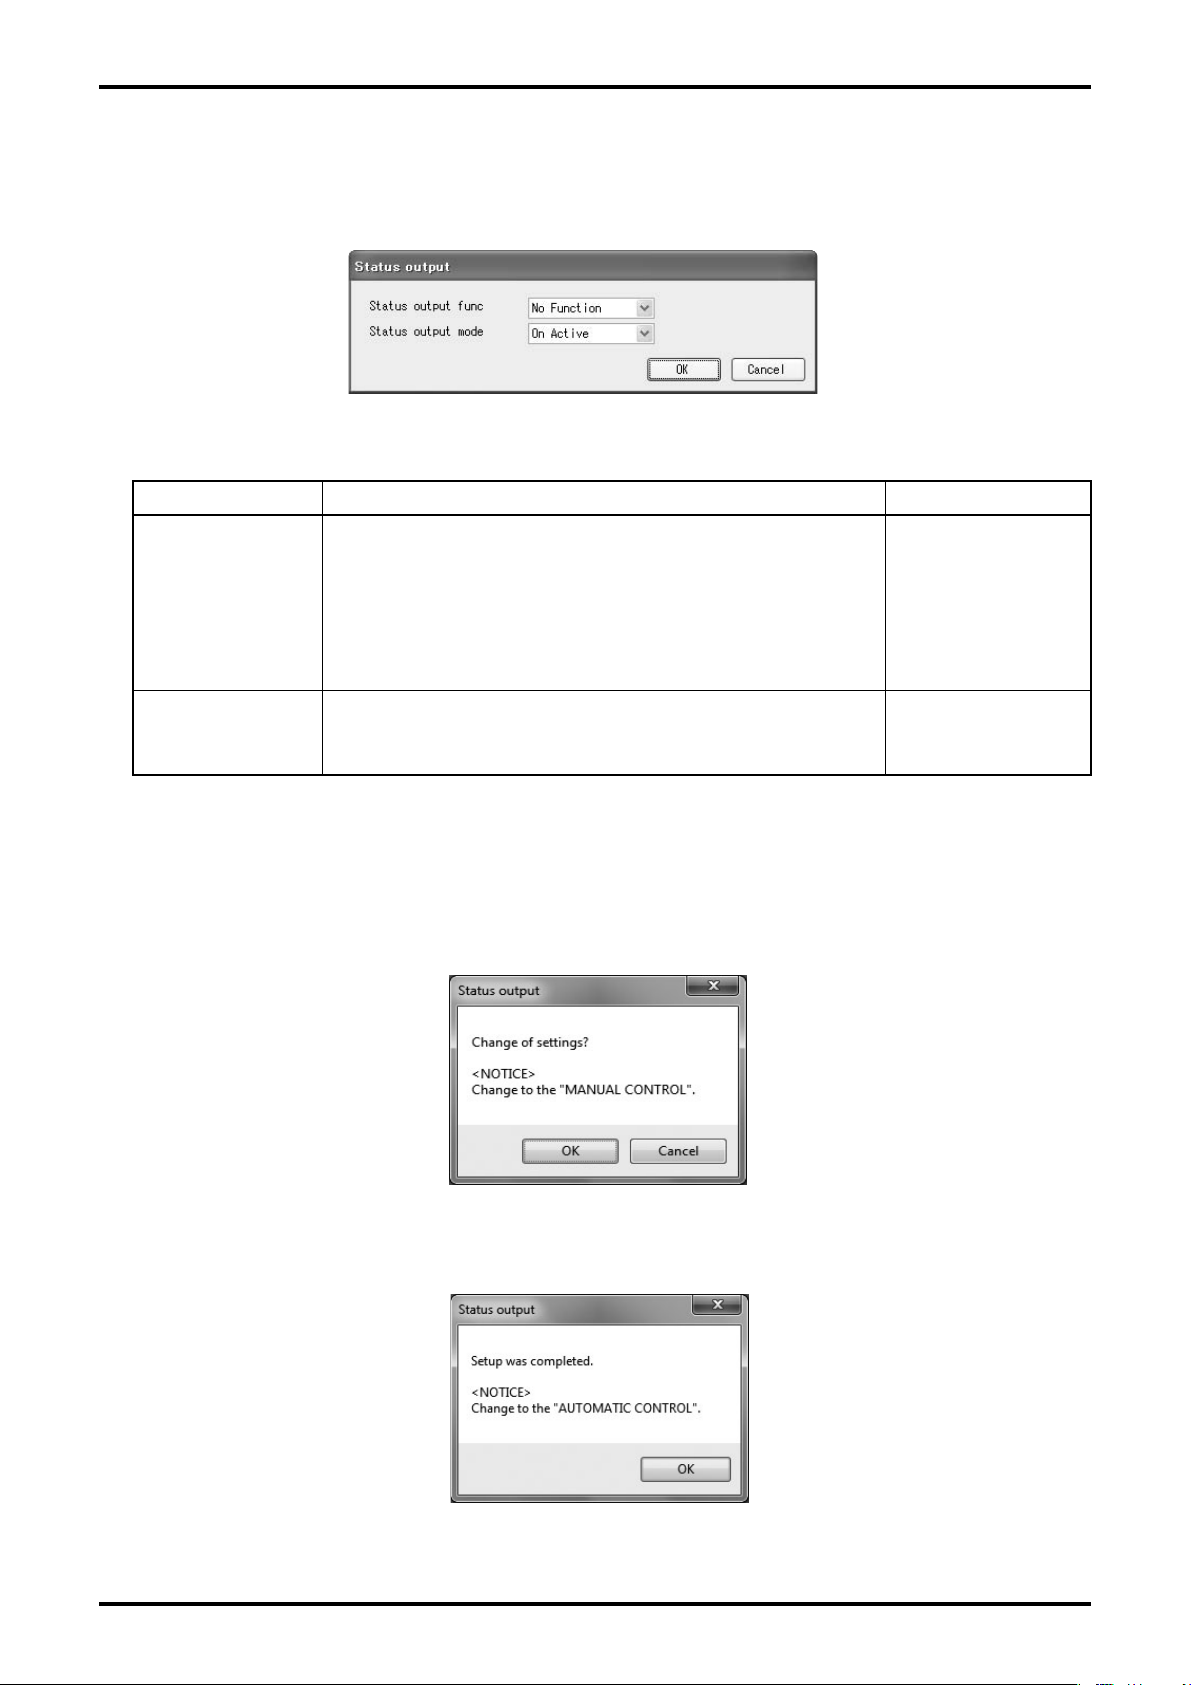
① Click "Setup (S)" from the menu, and select "Status output" from the drop-down list of "Outputs",
then the following window (Fig. 42) will be displayed.
Fig.42
② Select for respective items.
Setting item Detail Setting range
Status output selection (Select from the right column.)
Status output func
No Function: No function, Contact output OFF
Error Status: ACTIVE when relevant error occurs with
Status select
H/L Alarm: ACTIVE at high/low alarm
Flow Direction: ACTIVE at the occurrence of reverse flow
No Function, Error
Status, H/L Alarm,
Flow Direction
Status output mode (Select from the right column.)
Status output mode
Off Active: Output transistor Off at operation
On Active: Output transistor On at operation
Off Active, On Active
③ Click "OK" after the setting is completed to display the message box (Fig. 43). Click "OK" here
to change the settings to the inputted values, and to reect the changed setting values in the
owmeter's output. If the owmeter's output is used to control valves or other such parts as safety
protocol, change the control loop to manual control so that the control loop cannot be inuenced
by the owmeter's output.
Fig.43
④ The message box (Fig. 44) is displayed after changing the setting values. Click "OK" to complete
the setting process.
Fig.44
⑤ The window for setting item is displayed. To exit, click "Cancel".
25
Page 26
E-025-2-E
3.6.3.4 Selecting Status Output Objects (Status select)
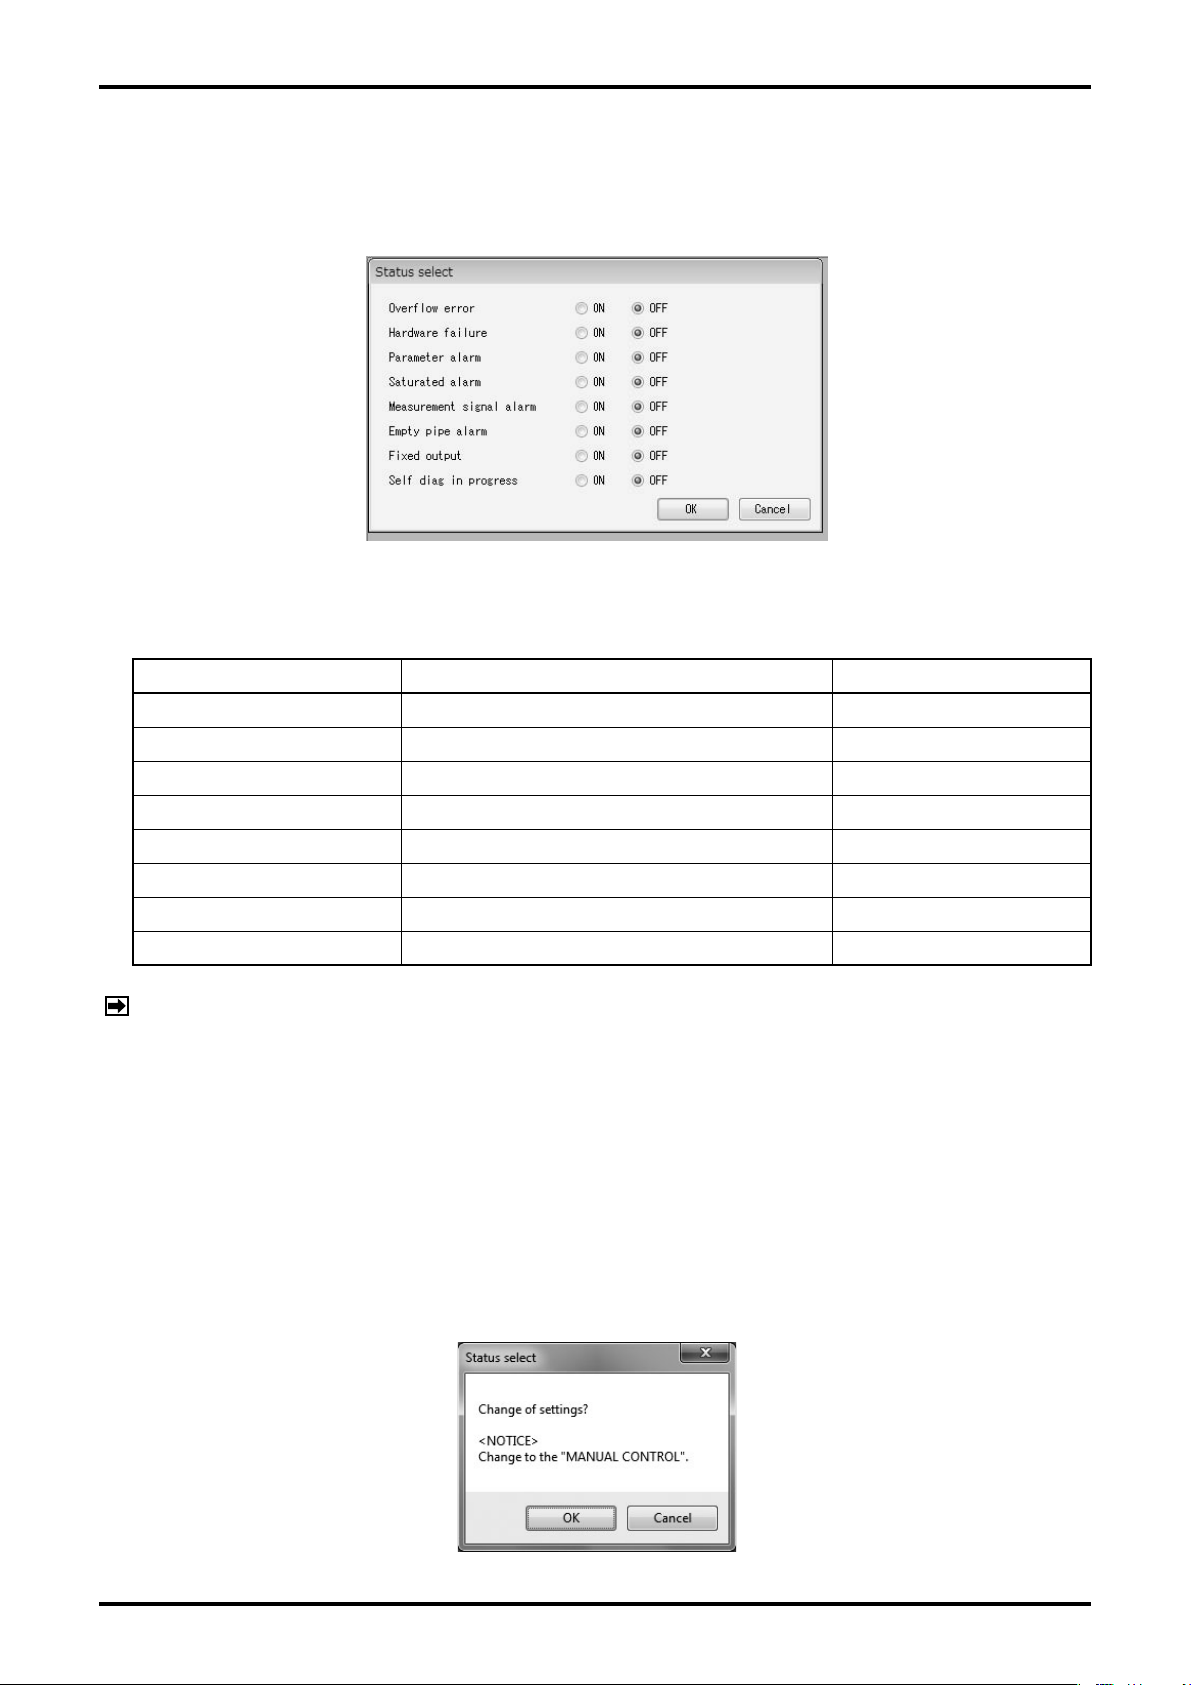
① Click "Setup (S)" from the menu, and select "Status select" from the drop-down list of "Outputs",
then the following window (Fig. 45) will be displayed.
Fig.45
② Select for respective items.
Setting item Detail Setting range
Overflow error Overflow error ON, OFF
Hardware failure Hardware failure error ON, OFF
Parameter alarm Parameter alarm ON, OFF
Saturated alarm Output saturation alarm (Analog, Pulse) ON, OFF
Measurement signal alarm Measurement signal alarm ON, OFF
Empty pipe alarm Measurement pipe empty detection alarm ON, OFF
Fixed output Fixed output state (Analog, Pulse, Contact) ON, OFF
Self diag in progress Self-diagnosis in process ON, OFF
NOTE: 1. When setting error and alarm as status output, click "ON".
2. Error output is valid only when "Status output func" is set to "Error Status".
3. Change the contact output when one or more items selected are in error.
4. For the detail of error, refer to "3.11.4 Error/Alarm, Status List".
③ Click "OK" after the setting is completed to display the message box (Fig. 46). Click "OK" here
to change the settings to the inputted values, and to reect the changed setting values in the
owmeter's output. If the owmeter's output is used to control valves or other such parts as safety
protocol, change the control loop to manual control so that the control loop cannot be inuenced
by the owmeter's output.
2
Fig.46
Page 27
E-025-2-E
④ The message box (Fig. 47) is displayed after changing the setting values. Click "OK" to complete
the setting process.
Fig.47
⑤ The window for setting item is displayed. To exit, click "Cancel".
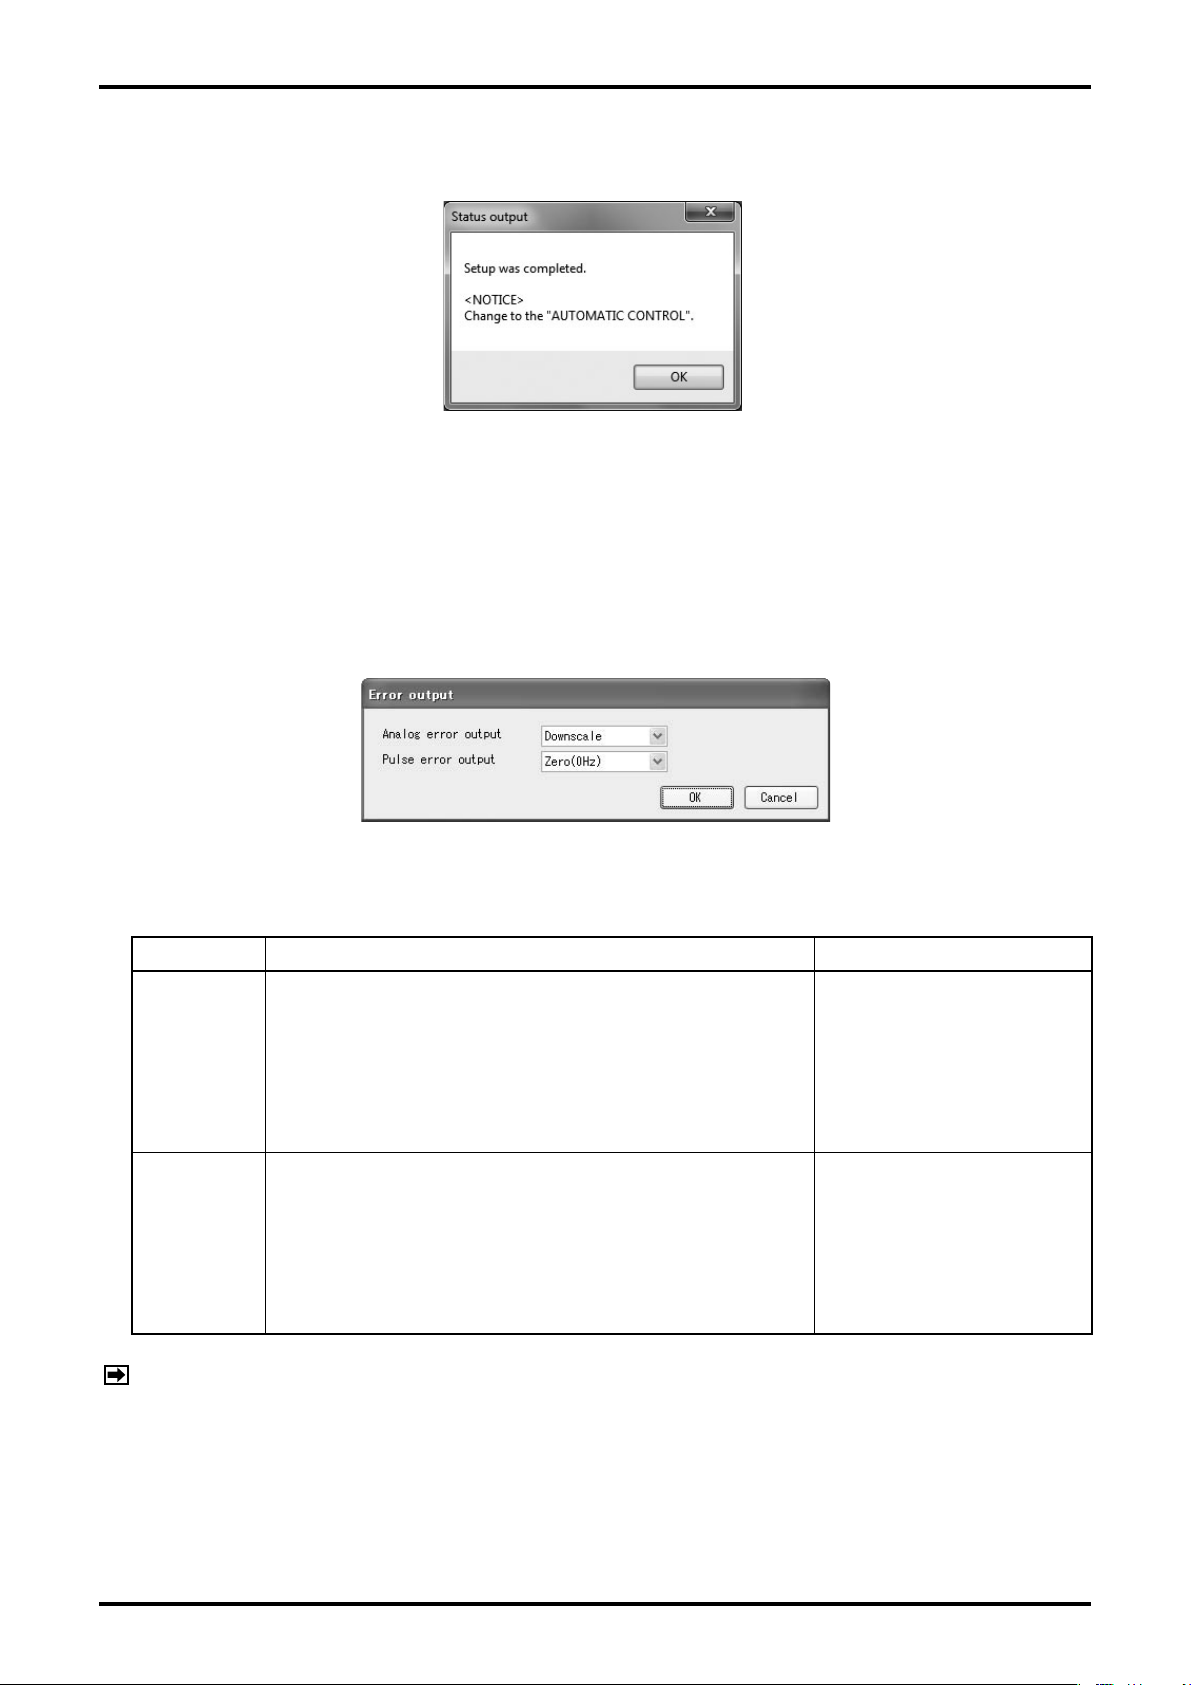
3.6.3.5 Output at Error/Alarm (Error output)
① Click "Setup (S)" from the menu, and select "Error output" from the drop-down list of "Outputs",
then the following window (Fig. 48) will be displayed.
Fig.48
② Select for respective items.
Setting item Detail Setting range
Analog output at error (Select from the right column.)
No Function: Normal output
Analog error
output
Pulse error
output
Downscale: Hold by outputting 2.4mA
Zero: Hold by outputting 4.0mA
Hold: Hold current value just before occurrence of error
Upscale: Hold by outputting 21.6mA
Pulse output at error (Select from the right column.)
No Function: Normal output
Zero: 0Hz (Stops pulse output)
Hold: Hold the frequency just before occurrence of error
Upscale: Outputs the frequency equivalent to 110% of
metering range.
No Function, Downscale,
Zero, Hold, Upscale
No Function, Zero, Hold,
Upscale
NOTE: "Error output" functions when any one of "Overflow Error", "Hardware Failure",
"Parameter Alarm", "Self Diag Alarm", and "Empty Pipe Alarm" occurs. For errors,
refer to "3.11.4 Error/Alarm, Status List".
2
Page 28
E-025-2-E
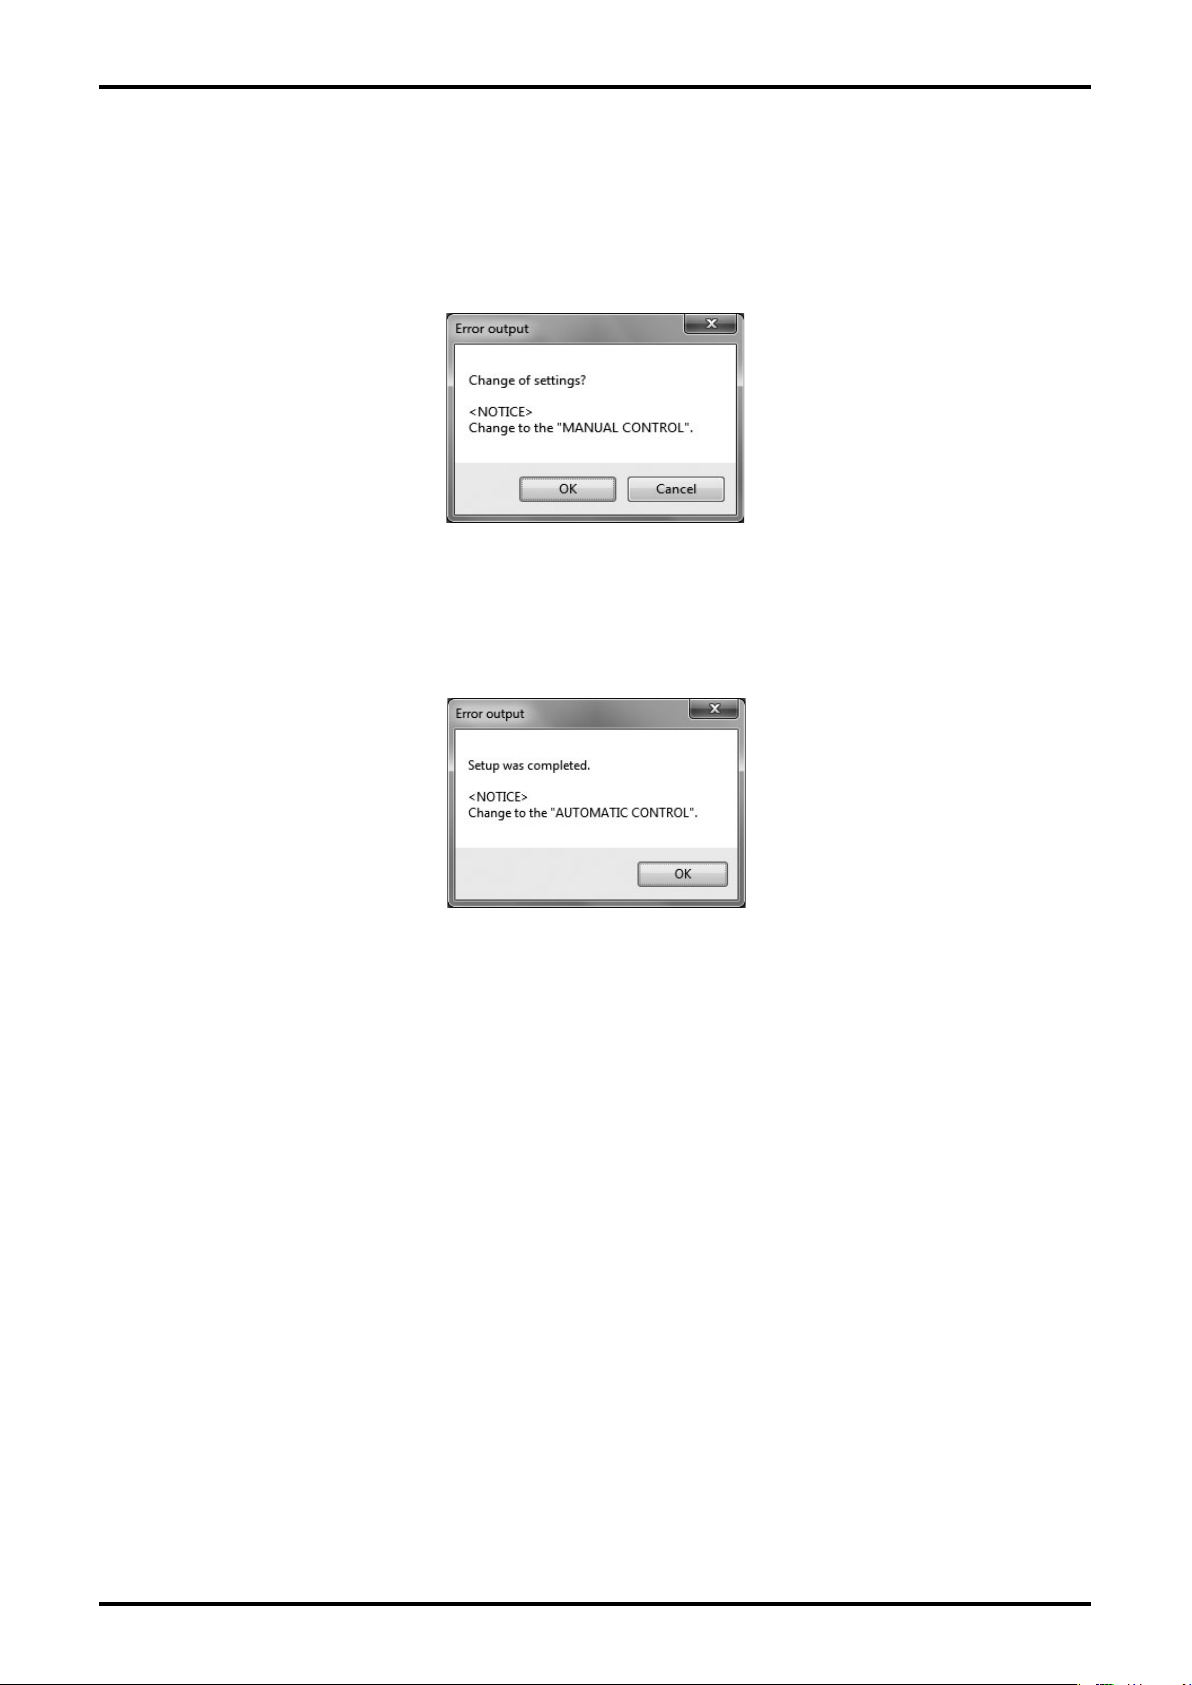
③ Click "OK" after the setting is completed to display the message box (Fig. 49). Click "OK" here
to change the settings to the inputted values, and to reect the changed setting values in the
owmeter's output. If the owmeter's output is used to control valves or other such parts as safety
protocol, change the control loop to manual control so that the control loop cannot be inuenced
by the owmeter's output.
Fig.49
④ The message box (Fig. 50) is displayed after changing the setting values. Click "OK" to complete
the setting process.
Fig.50
⑤ The window for setting item is displayed. To exit, click "Cancel".
2
Page 29
E-025-2-E
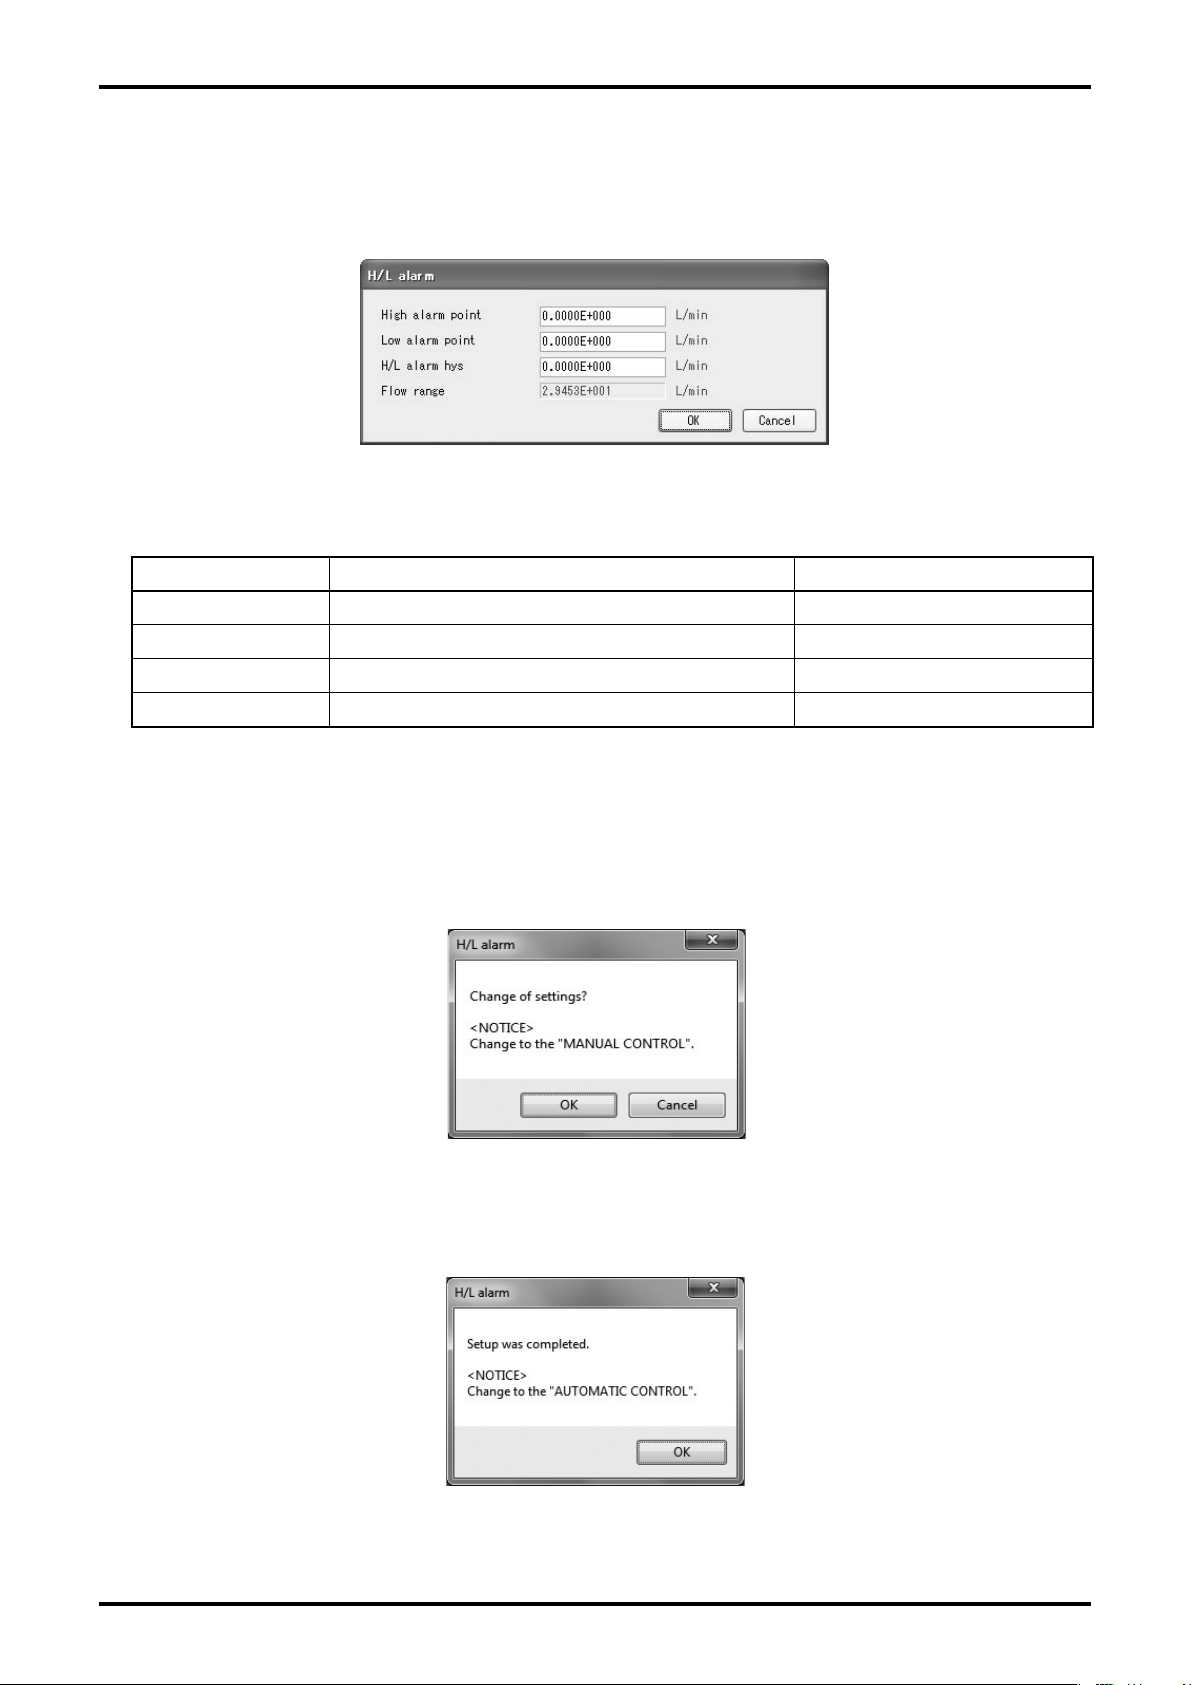
3.6.4 High/Low Alarm (H/L alarm)
① Click "Setup (S)" from the menu, and select "H/L alarm" then the following window (Fig. 51) will
be displayed.
Fig.51
② Enter numeric values for respective items.
Setting item Detail Setting range
High alarm point Comparison value with high alarm of flow 0.0 to Flow range
Low alarm point Comparison value with low alarm of flow 0.0 to Flow range
H/L alarm hys Hysteresis of high/low alarm comparison values 0.0 to Flow range
Flow range Metering range Only for reference
③ Click "OK" after the setting is completed to display the message box (Fig. 52). Click "OK" here
to change the settings to the inputted values, and to reect the changed setting values in the
owmeter's output. If the owmeter's output is used to control valves or other such parts as safety
protocol, change the control loop to manual control so that the control loop cannot be inuenced
by the owmeter's output.
Fig.52
④ The message box (Fig. 53) is displayed after changing the setting values. Click "OK" to complete
the setting process.
Fig.53
⑤ The window for setting item is displayed. To exit, click "Cancel".
2
Page 30
E-025-2-E
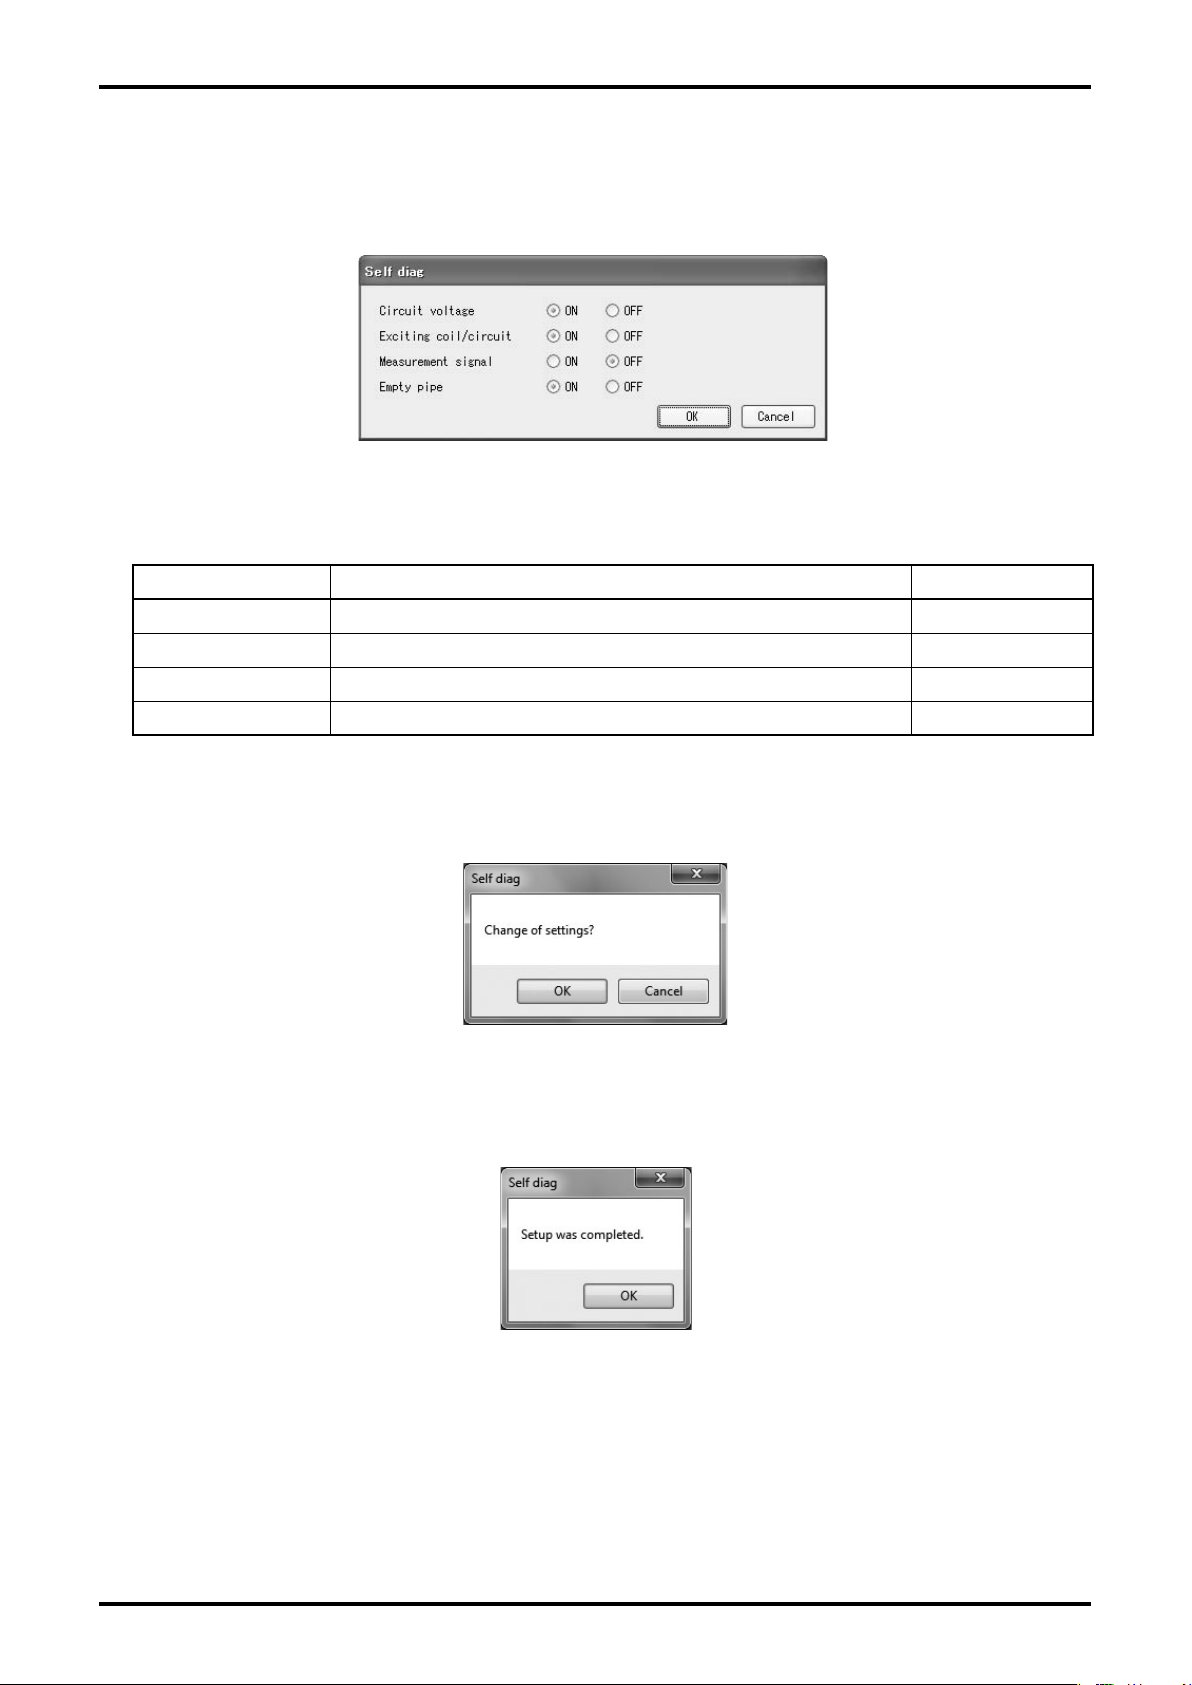
3.6.5 Setting Self Diagnosis (Self diag)
① Click "Setup (S)" from the menu, and select "Self diag", then the following window (Fig. 54) will be
displayed.
Fig.54
② Select for respective items.
Setting item Detail Setting range
Circuit voltage Sets periodic monitoring of circuit voltage. ON, OFF
Exciting coil/circuit Sets periodic diagnosis of coil and exciting frequency. ON, OFF
Measurement signal Sets periodic diagnosis of measurement signal. ON, OFF
Empty pipe Sets periodic diagnosis of detecting empty measurement pipe. ON, OFF
③ Click "OK" after the setting is completed to display the message box (Fig. 55). Click "OK" here to
change the settings to the inputted values.
Fig.55
④ The message box (Fig. 56) is displayed after changing the setting values. Click "OK" to complete
the setting process.
Fig.56
⑤ The window for setting item is displayed. To exit, click "Cancel".
0
Page 31
E-025-2-E
3.6.6 Device Information (Device information)
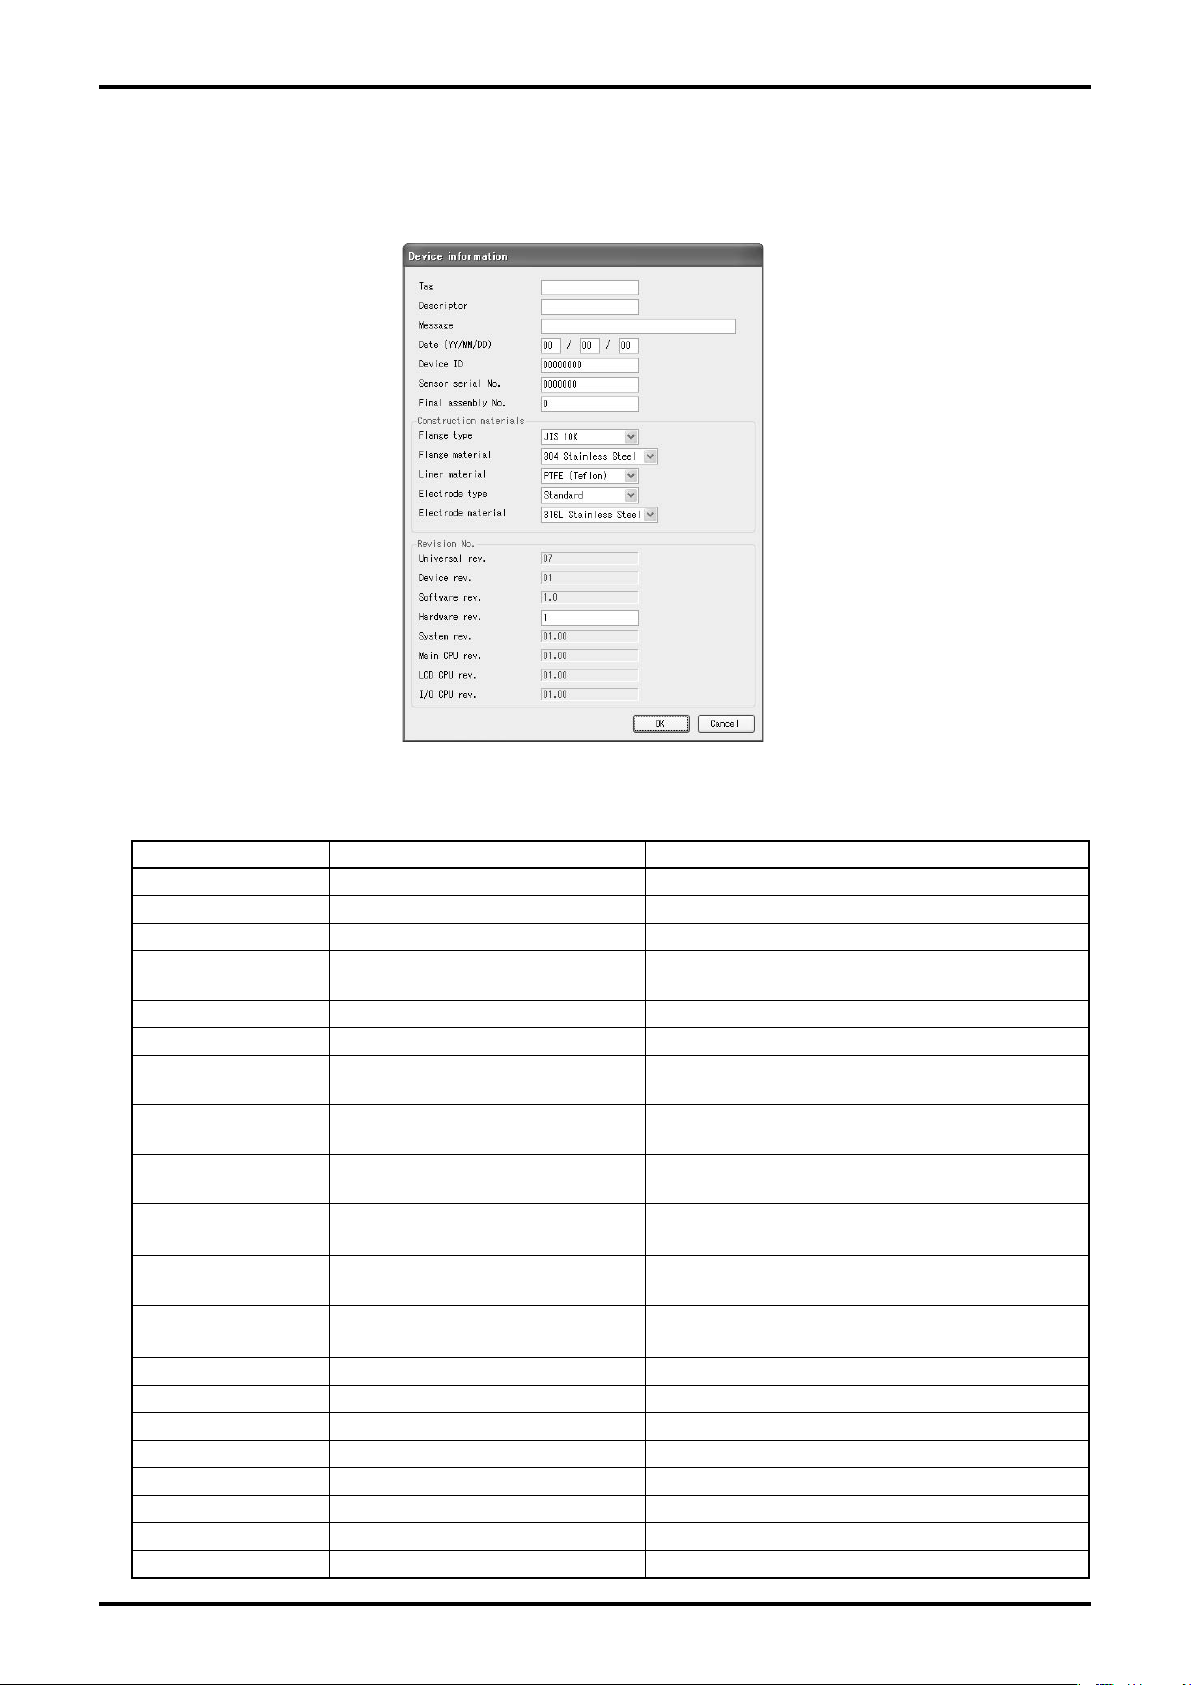
① Click "Setup (S)" from the menu, and select "Device information", then the following window
(Fig. 57) will be displayed.
Fig.57
② Select or enter characters or numeric values for respective items.
Setting item Detail Setting range
Tag Tag number of meter 8 alphanumeric characters
Descriptor Description 16 alphanumeric characters
Message Message 32 alphanumeric characters
Date Month/Day/Year
Device ID Device ID of transmitter 0 to 16777215 (Only for reference)
Sensor serial No. Sensor serial number 0 to 16777215 (Only for reference)
Final assembly No.
Flange type
Flange material
Liner material
Electrode type
Electrode material
Universal rev. Communication protocol revision Only for reference
Device rev. Device revision Only for reference
Software rev. Software revision Only for reference
Hardware rev. Hardware revision Only for reference
System rev. System revision Only for reference
Main CPU rev. Main CPU revision Only for reference
LCD CPU rev. Display CPU revision Only for reference
I/O CPU rev. Input/Output CPU revision Only for reference
Transmitter manufacturing
number
Flange type (Select from the
right column.)
Flange material (Select from the
right column.)
Liner material (Select from the
right column.)
Electrode type (Select from the
right column.)
Electrode material (Select from
the right column.)
Month, Day and Year, each represented in 2
digits of positive integer
0 to 16777215 (Only for reference)
JIS 10K, JIS 20K, JIS 30K, ANSI/ASME150,
ANSI/ASME300, Flangeless, Sanitary, Union, Special
Carbon Steel, 304 Stainless Steel, Special
PTFE, Ceramic, PFA, ETFE, Soft Gum,
Hard Gum, Special
Standard, Replaceable, Special
Alloy C276, Tantalum, 316L Stainless Steel,
Platinum Special
Page 32
E-025-2-E
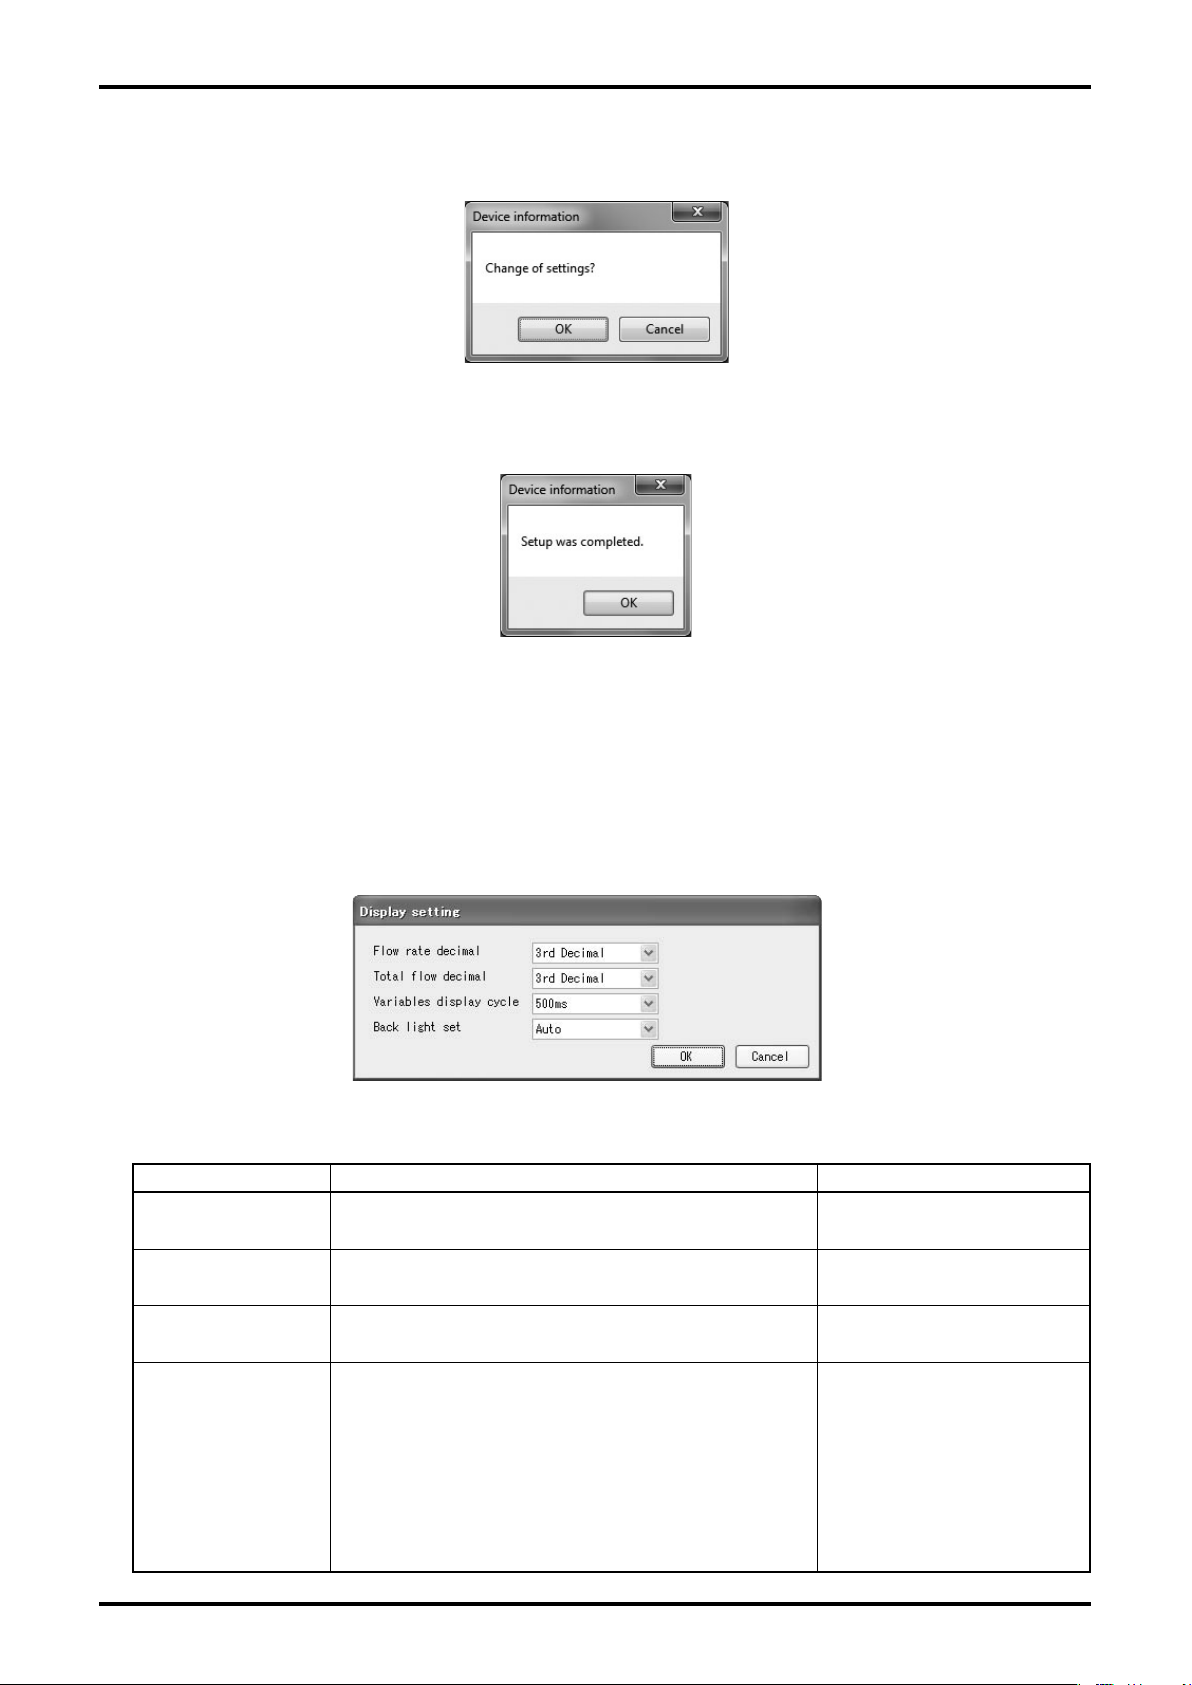
③ Click "OK" after the setting is completed to display the message box (Fig. 58). Click "OK" here to
change the settings to the inputted values.
Fig.58
④ The message box (Fig. 59) is displayed after changing the setting values. Click "OK" to complete
the setting process.
Fig.59
⑤ The window for setting item is displayed. To exit, click "Cancel".
3.6.7 Other Settings (Other)
3.6.7.1 Display Setting (Display setting)
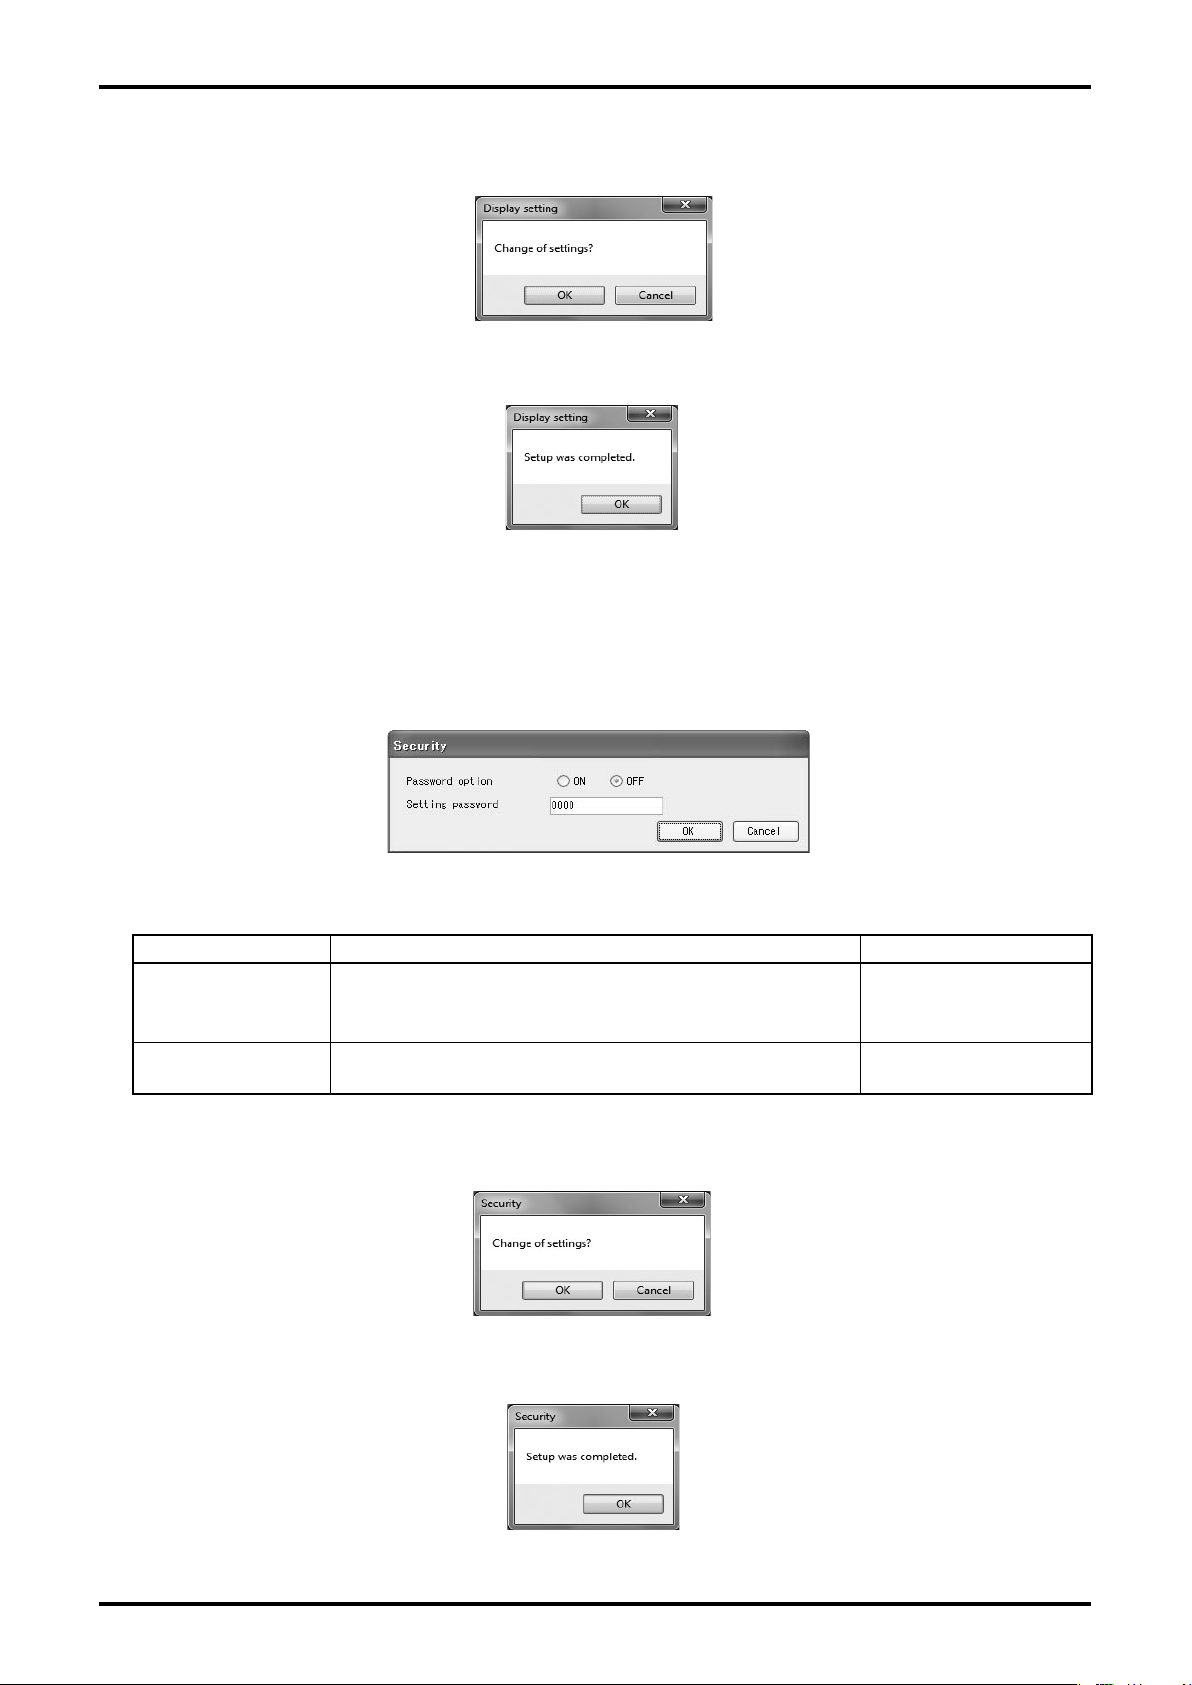
① Click "Setup (S)" from the menu, and select "Display setting" from the drop-down list of "Other",
then the following window (Fig. 60) will be displayed.
Fig.60
② Select for respective items.
Setting item Detail Setting range
Flow rate decimal
Total flow decimal
Variables display
cycle
Number of digits following decimal point of LCD
actual flow display (Select from the right column.)
Number of digits following decimal point of LCD
total flow display (Select from the right column.)
Update interval of displaying LCD variables
(Select from the right column.)
Integer, 1st Decimal,
2nd Decimal, 3rd Decimal
Integer, 1st Decimal,
2nd Decimal, 3rd Decimal
100ms, 300ms, 500ms,
1000ms
Back light set
2
Setting LCD backlight operation (Select from the
right column.)
Off: Backlight Off at all times
On: Backlight On at all times
Auto: Automatically turns off without key
operation for 10 seconds after backlight is
turned on (turns on again with key
operation)
Off, On, Auto
Page 33
E-025-2-E
③ Click "OK" after the setting is completed to display the message box (Fig. 61). Click "OK" here to
change the settings to the inputted values.
Fig.61
④ The message box (Fig. 62) is displayed after changing the setting values. Click "OK" to complete
the setting process.
Fig.62
⑤ The window for setting item is displayed. To exit, click "Cancel".
3.6.7.2 Security (Security)
① Click "Setup (S)" from the menu, and select "Security" from the drop-down list of "Other", then the
following window (Fig. 63) will be displayed.
Fig.63
② Select or enter numeric values for respective items.
Setting item Detail Setting range
Selects password.
Password option
Setting password
ON: Enables password function.
OFF: Disables password function (Default setting)
Password (4 numeric digits)
Default: 0000
ON, OFF
0000 to 9999
③ Click "OK" after the setting is completed to display the message box (Fig. 64). Click "OK" here to
change the settings to the inputted values.
Fig.64
④ The message box (Fig. 65) is displayed after changing the setting values. Click "OK" to complete
the setting process.
Fig.65
⑤ The window for setting item is displayed. To exit, click "Cancel".
Page 34
E-025-2-E
3.6.7.3 Polling Address (Polling address)
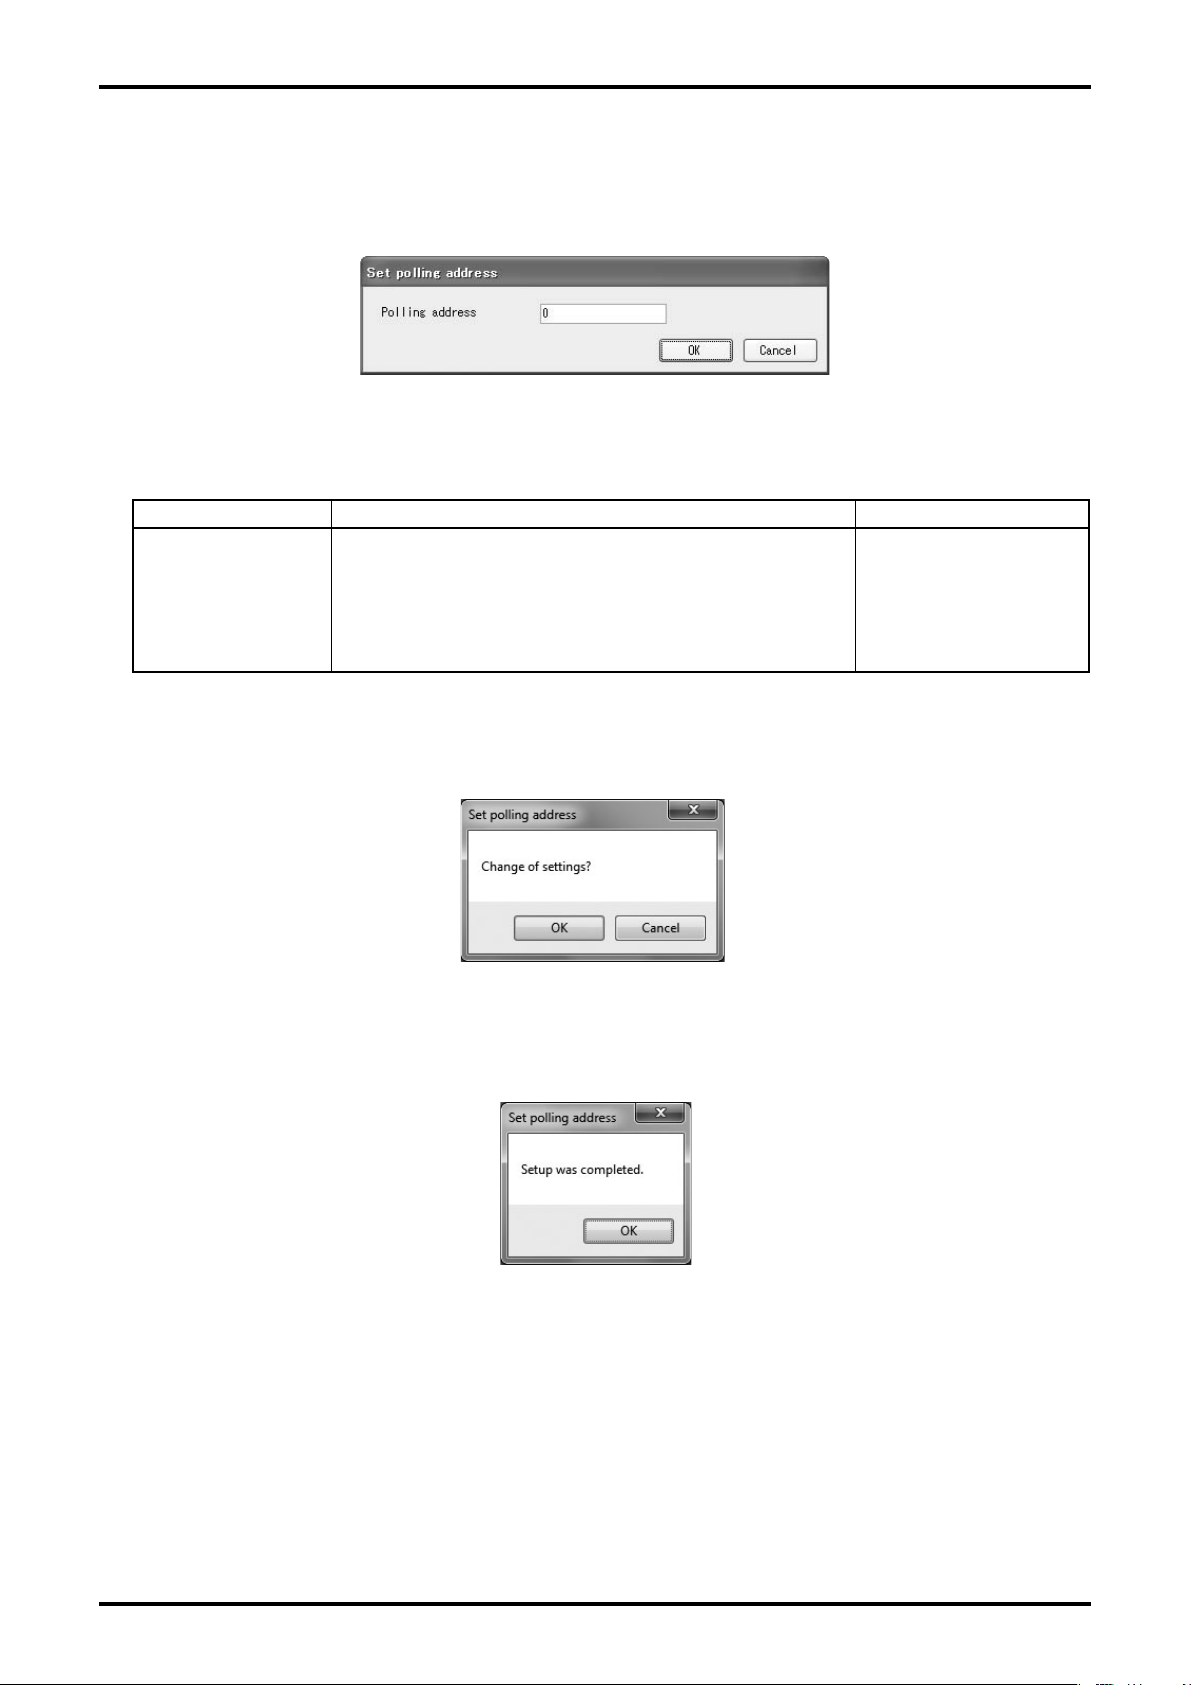
① Click "Setup (S)" from the menu, and select "Polling address" from the drop-down list of "Other",
then the following window (Fig. 66) will be displayed.
Fig.66
② Enter numeric values for the item.
Setting item Detail Setting range
Polling address (Address for multi-dropping)
Default: 0
Polling address
When connecting two or more flowmeters to the same
segment, assign different addresses other than“0”to
each flowmeter.
0 to 63
③ Click "OK" after the setting is completed to display the message box (Fig. 67).
Click "OK" here to change the settings to the inputted values.
Fig.67
④ The message box (Fig. 68) is displayed after changing the setting values. Click "OK" to complete
the setting process.
Fig.68
⑤ The window for setting item is displayed. To exit, click "Cancel".
Page 35
E-025-2-E
3.7 Menu: Diag/Service (Checking and Adjustment)
"Diag/Service" can be used to diagnose the owmeter transmitter, perform loop tests on each output,
adjust output values, reset cumulative totals, and calibrate sensor input.
Close all "Setup (S)" windows to enable checking and adjustment functions.
Also note that other than "Loop test", the "Diag/Service (T)" window cannot be displayed
simultaneously with multiple windows (other than "Totalizer control").
The actual screen is as shown in Fig. 69.
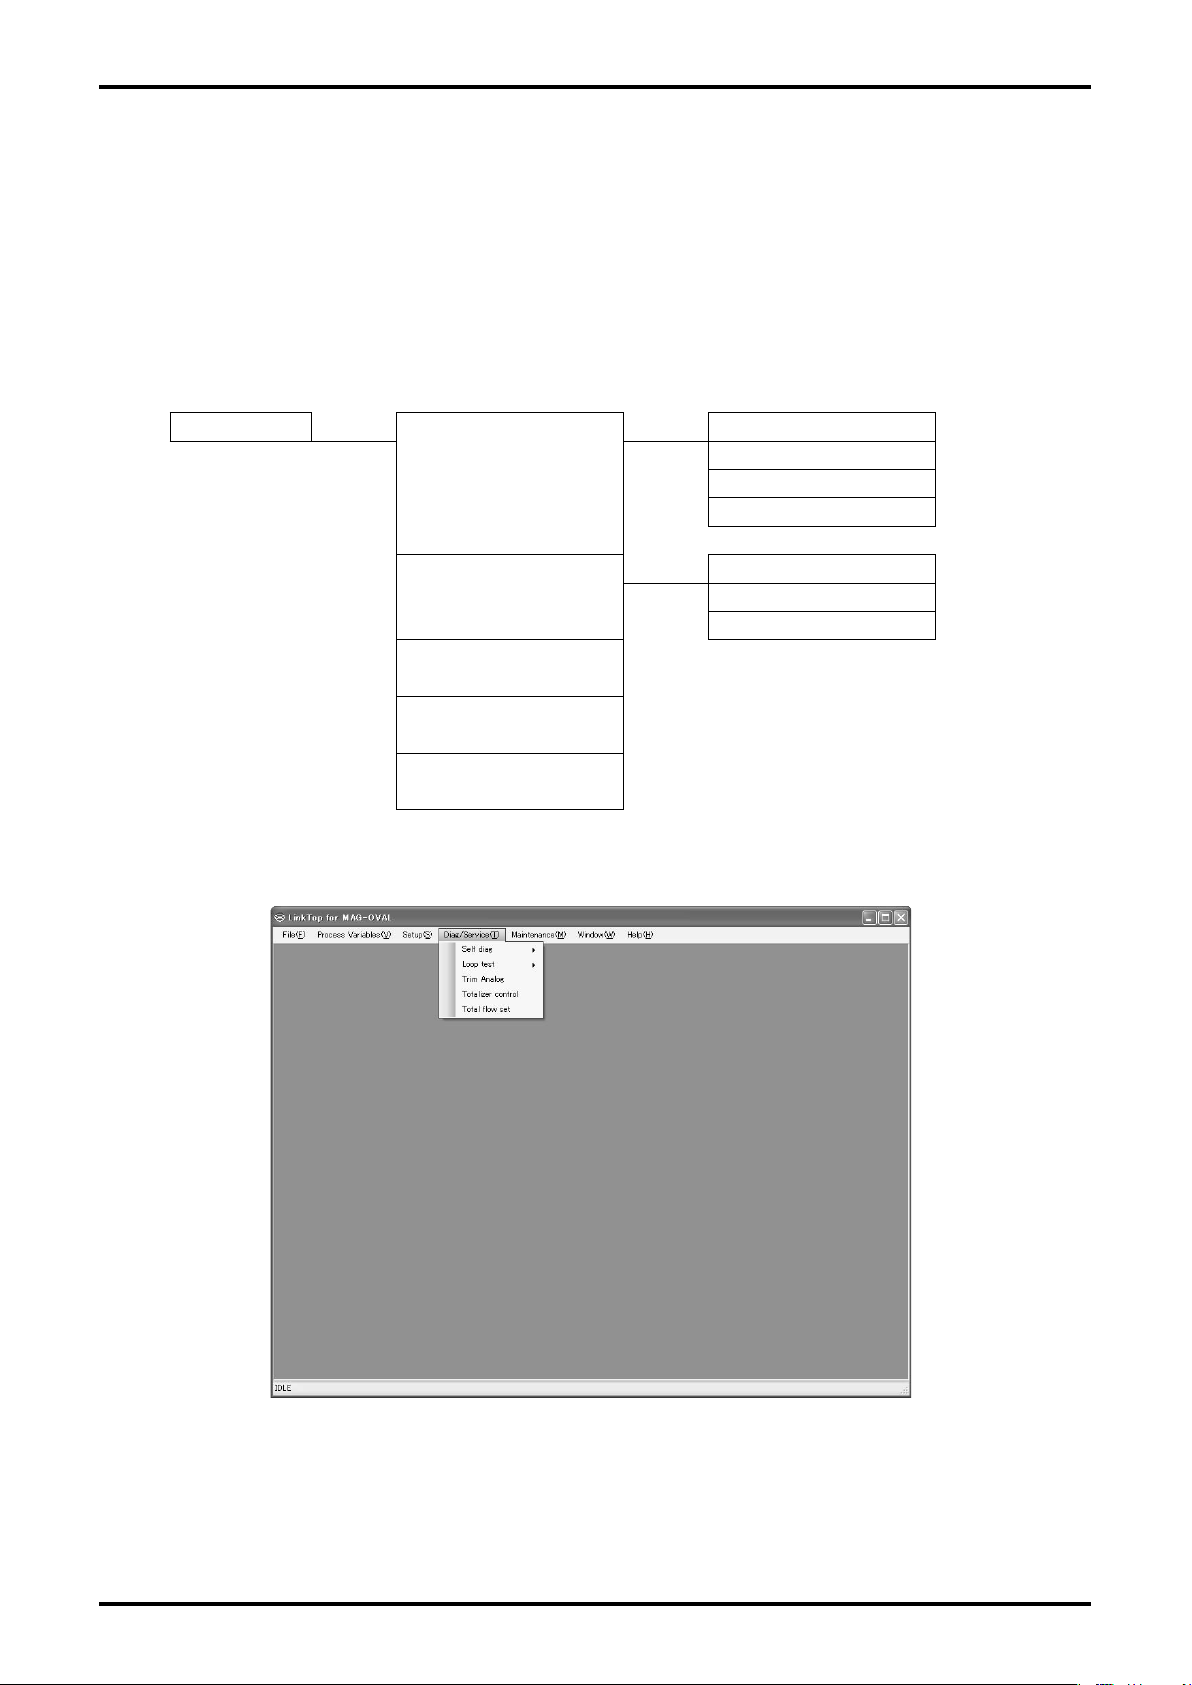
Diag/Service
Self diag
Loop test
Trim Analog
Totalizer control
Total ow set
Diag/Service Item Tree
Circuit voltage
Exciting coil/circuit
Measurement signal
Empty pipe
Fix Analog
Fix Pulse
Fix Status output
Fig.69
5
Page 36
E-025-2-E
3.7.1 Self-diagnosis (Self diag)
These functions are used to self-diagnose the transmitter.
3.7.1.1 Circuit Voltage Self-diagnosis (Circuit voltage)
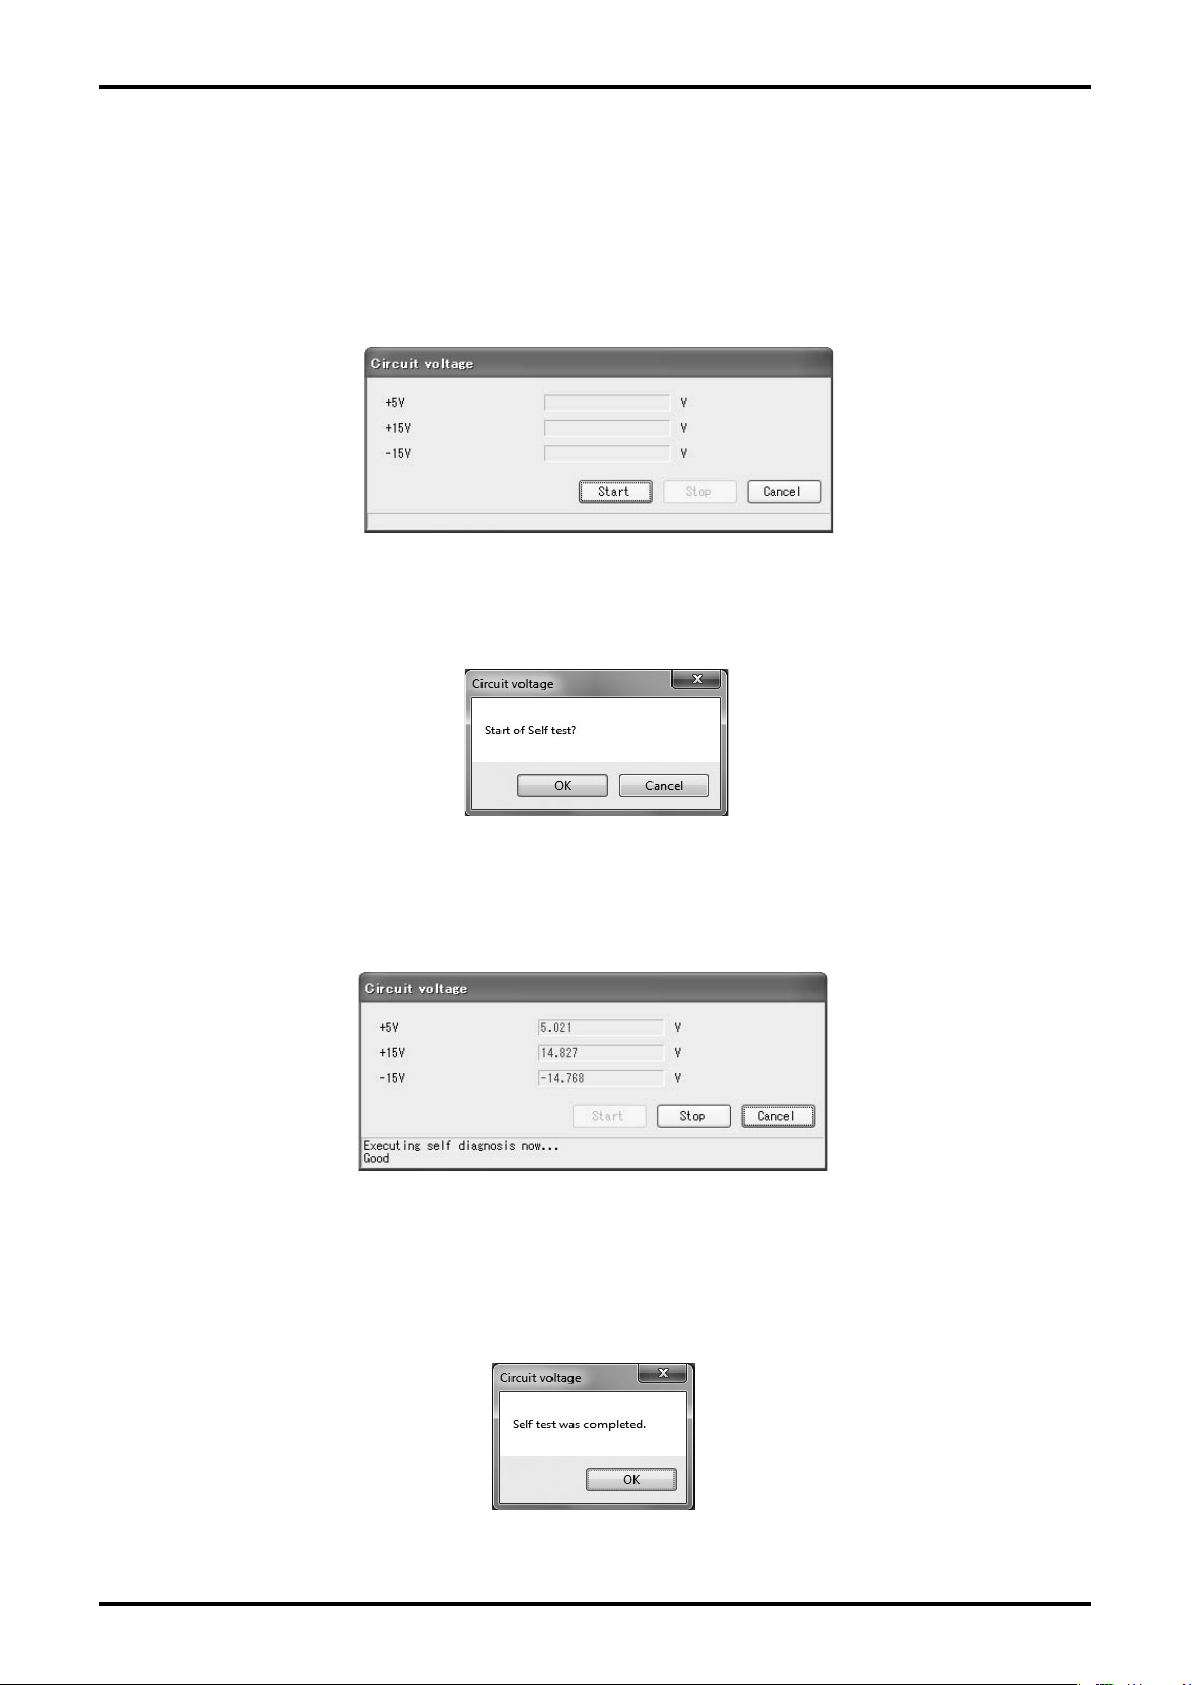
① Click "Diag/Service (T)" from the menu, and select "Circuit voltage" from the list of "Self diag",
then the following window (Fig. 70) will be displayed.
Fig.70
② In this step, circuit voltage is monitored. Click "Start" , and a massage box (Fig. 71) will be
displayed. click "OK" to start diagnosis.
Fig.71
③ During diagnosis, a message, "Executing self diagnosis now ... " is displayed at the bottom of the
window as shown in Fig. 72. If the diagnosis indicates normal, "Good" is displayed. If the diagnosis
indicates abnormal, "Fail" is displayed.
Fig.72
"+5V" ... Voltage at detector point +5V
"+15V" ... Voltage at detector point +15V
"-15V" ... Voltage at detector point -15V
④ To stop diagnosis, click the "Stop" button. A message box will be shown (Fig. 73). Then click
"OK" .
Fig.73
⑤ The window for setting item is displayed. To exit, click "Cancel" .
Page 37
E-025-2-E
3.7.1.2 Coil and Exciting Circuit Diagnosis (Exciting coil/circuit)
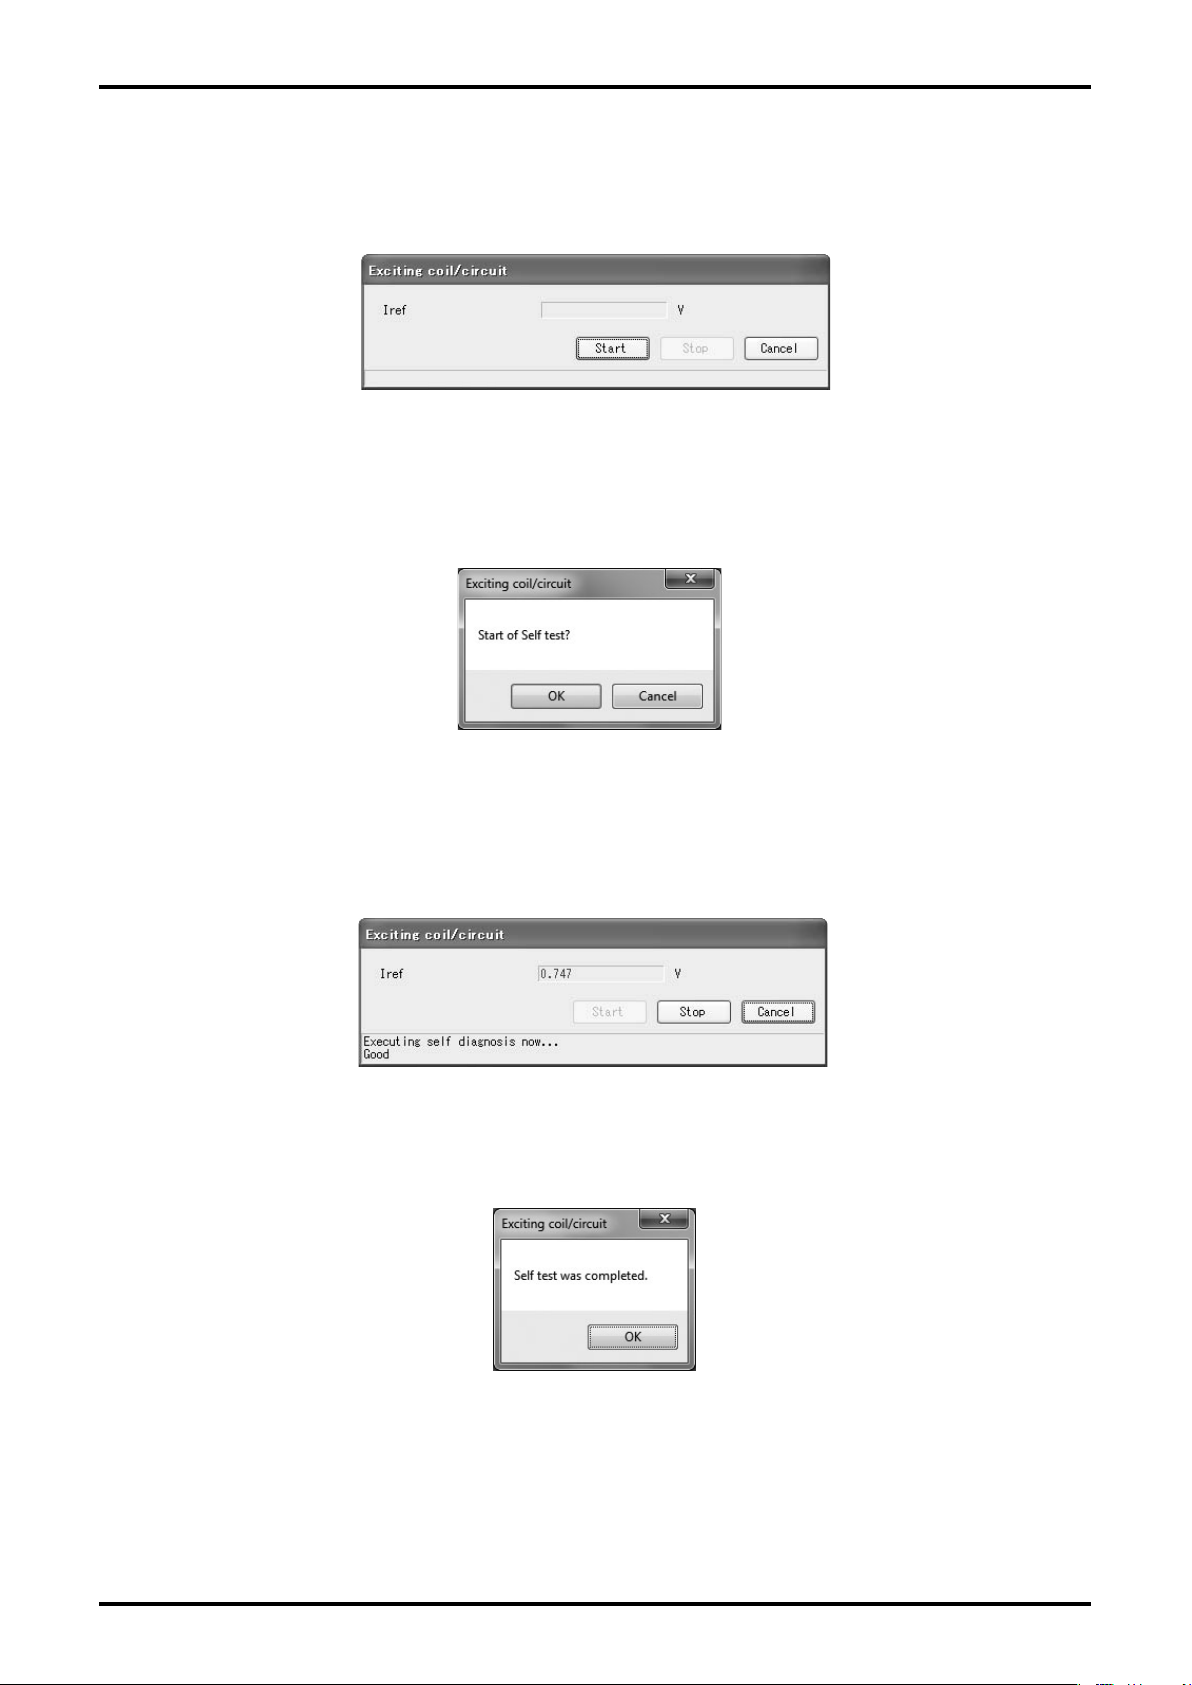
① Click "Diag/Service (T)" from the menu, and select "Exciting coil/circuit" from the list of "Self
diag", then the following window (Fig. 74) will be displayed.
Fig.74
"Iref" ... Voltage at detector point Iref
② Diagnose coil and exciting circuit for abnormality. Click "Start" to display a message box
(Fig. 75). Click "OK" to start diagnosis.
Fig.75
③ During diagnosis, a message, "Executing self diagnosis now ... " is displayed at the bottom of the
window as shown in Fig. 76. If the diagnosis indicates normal, "Good" is displayed. If the diagnosis
indicates abnormal, "Fail" is displayed.
Fig.76
④ To stop the diagnosis, click "Stop" . A message box (Fig. 77) is displayed. Click "OK" .
Fig.77
⑤ The window before starting diagnosis is displayed. To exit, click "Cancel".
Page 38
E-025-2-E
3.7.1.3 Diagnosing Measurement Signal (Measurement signal)
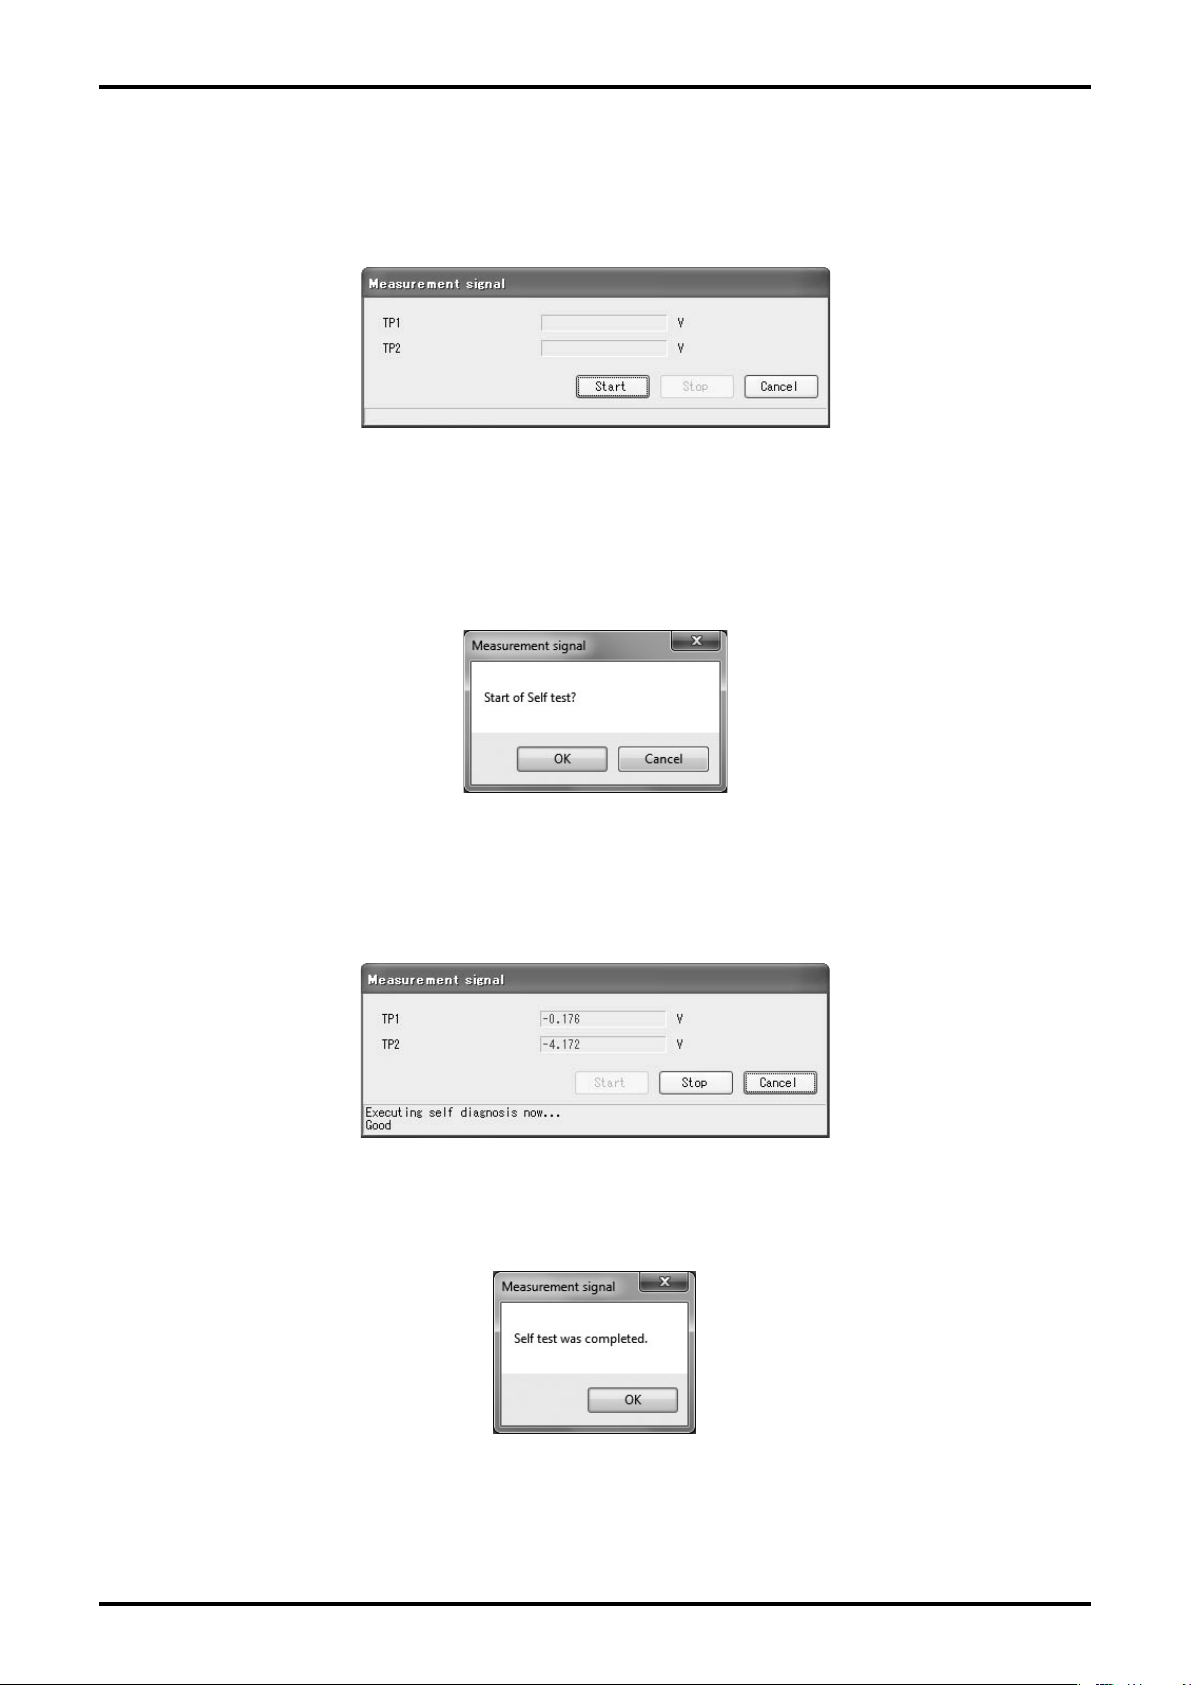
① Click "Diag/Service (T)" from the menu, and select "Measurement signal" from the list of
"Self diag", then the following window (Fig. 78) will be displayed.
"TP1" ... Voltage at detector point TP1
Fig.78
"TP2" ... Voltage at detector point TP2
② Diagnose the measurement signal for abnormality. Click "Start" to display a message box (Fig. 79).
Click "OK" to start diagnosis.
Fig.79
③ During diagnosis, a message, "Executing self diagnosis now ... " is displayed at the bottom of the
window as shown in Fig. 80. If the diagnosis indicates normal, "Good" is displayed. If the diagnosis
indicates abnormal, "Fail" is displayed.
Fig.80
④ To stop the diagnosis, click "Stop" . A message box (Fig. 81) is displayed. Click "OK" .
Fig.81
⑤ The window before starting diagnosis is displayed. To exit, click "Cancel" .
Page 39
E-025-2-E
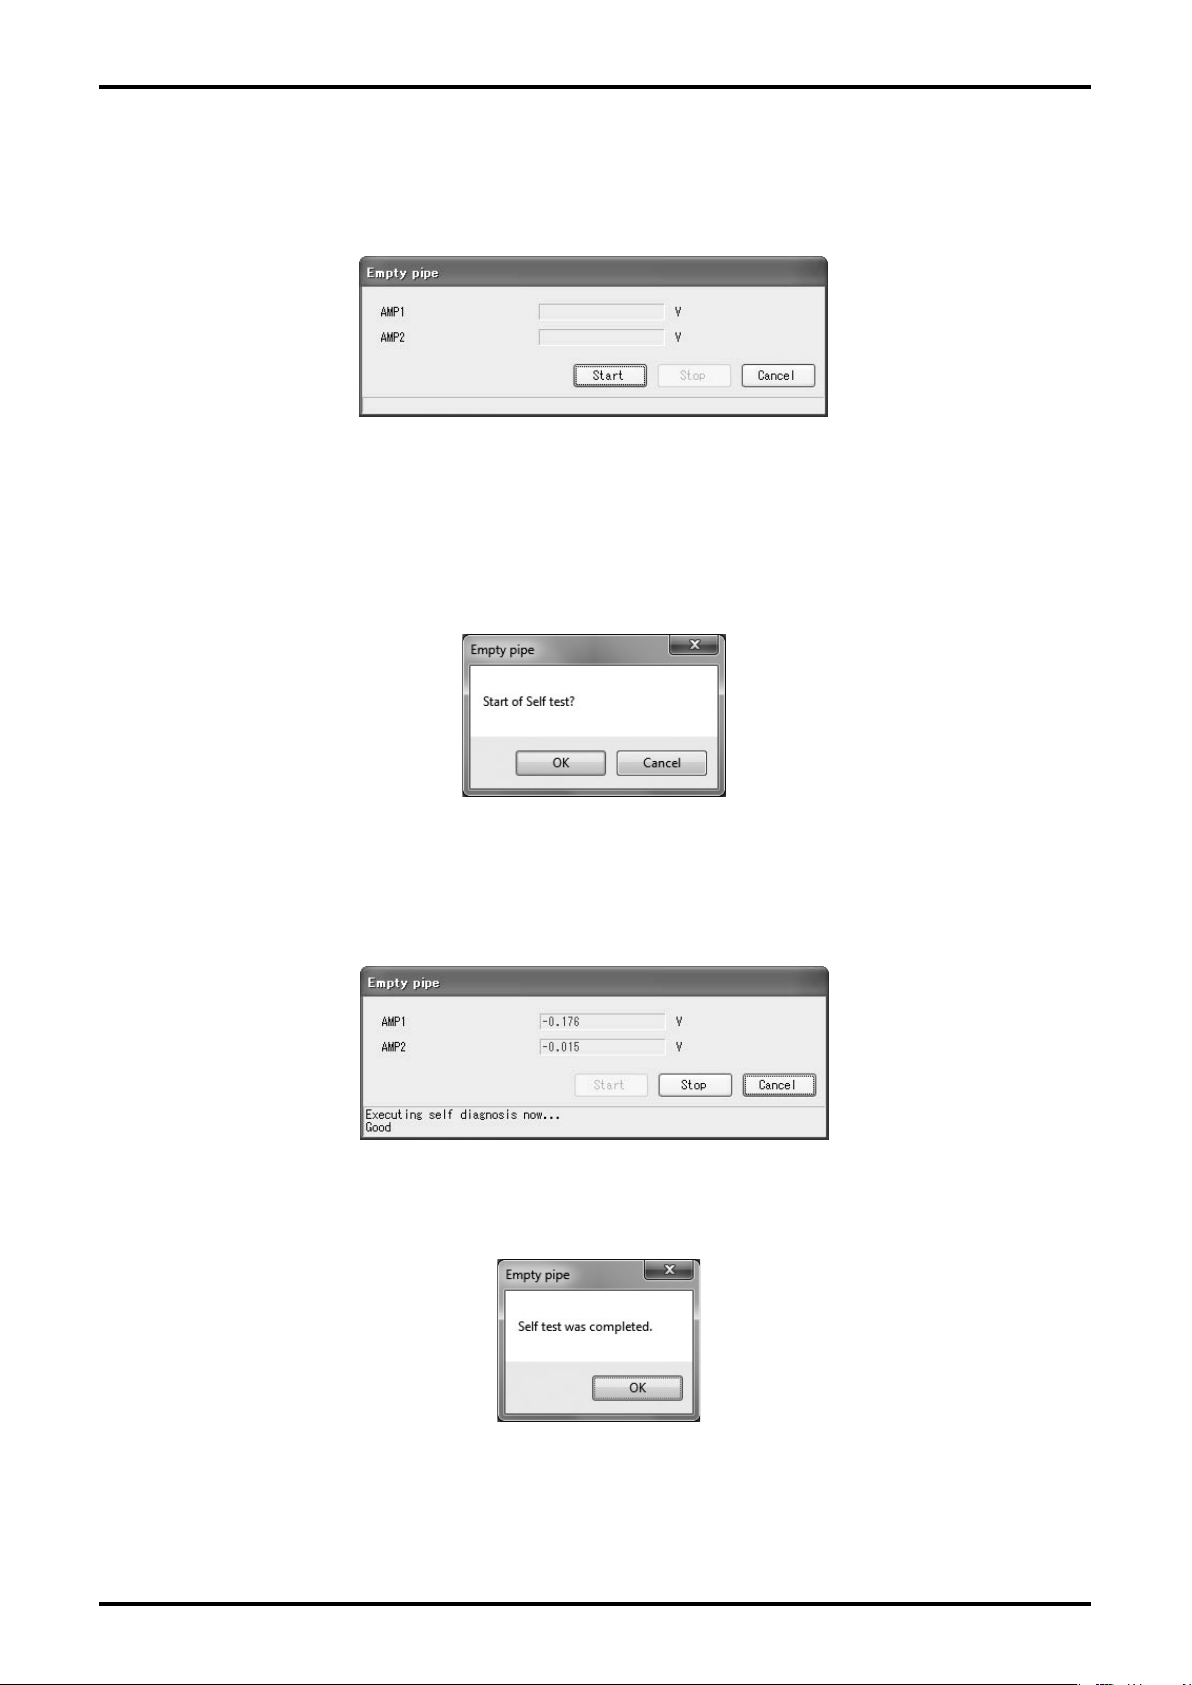
3.7.1.4 Measurement Pipe Empty Detection Function (Empty pipe)
① Click "Diag/Service (T)" from the menu, and select "Empty pipe" from the list of "Self diag", then
the following window (Fig. 82) will be displayed.
Fig.82
"AMP1" ... Voltage at detector point AMP 1
"AMP2" ... Voltage at detector point AMP 2
② Execute detection of an empty measurement pipe. Click "Start" to display a message box (Fig. 83).
Click "OK" to start diagnosis.
Fig.83
③ During diagnosis, a message, "Executing self diagnosis now ... " is displayed at the bottom of the
window as shown in Fig. 84. If the diagnosis indicates normal, "Good" is displayed. If the diagnosis
indicates abnormal, "Fail" is displayed.
Fig.84
④ To stop the diagnosis, click "Stop" . A message box (Fig. 85) is displayed. Click "OK" .
Fig.85
⑤ The window before starting diagnosis is displayed. To exit, click "Cancel" .
Page 40
E-025-2-E
3.7.2 Loop Test (Loop test)
Simulated output will be created.
3.7.2.1 Analog Output Loop Test (Fix Analog)
This test can be used to put analog output into a simulated output state, and to verify the output line
with a loop test.
The test creates simulated output regardless of the process state. If the owmeter's output is used to
control valves or other such parts, change the control loop to manual control for the sake of safety,
and so that the control loop cannot be inuenced by the owmeter's output.
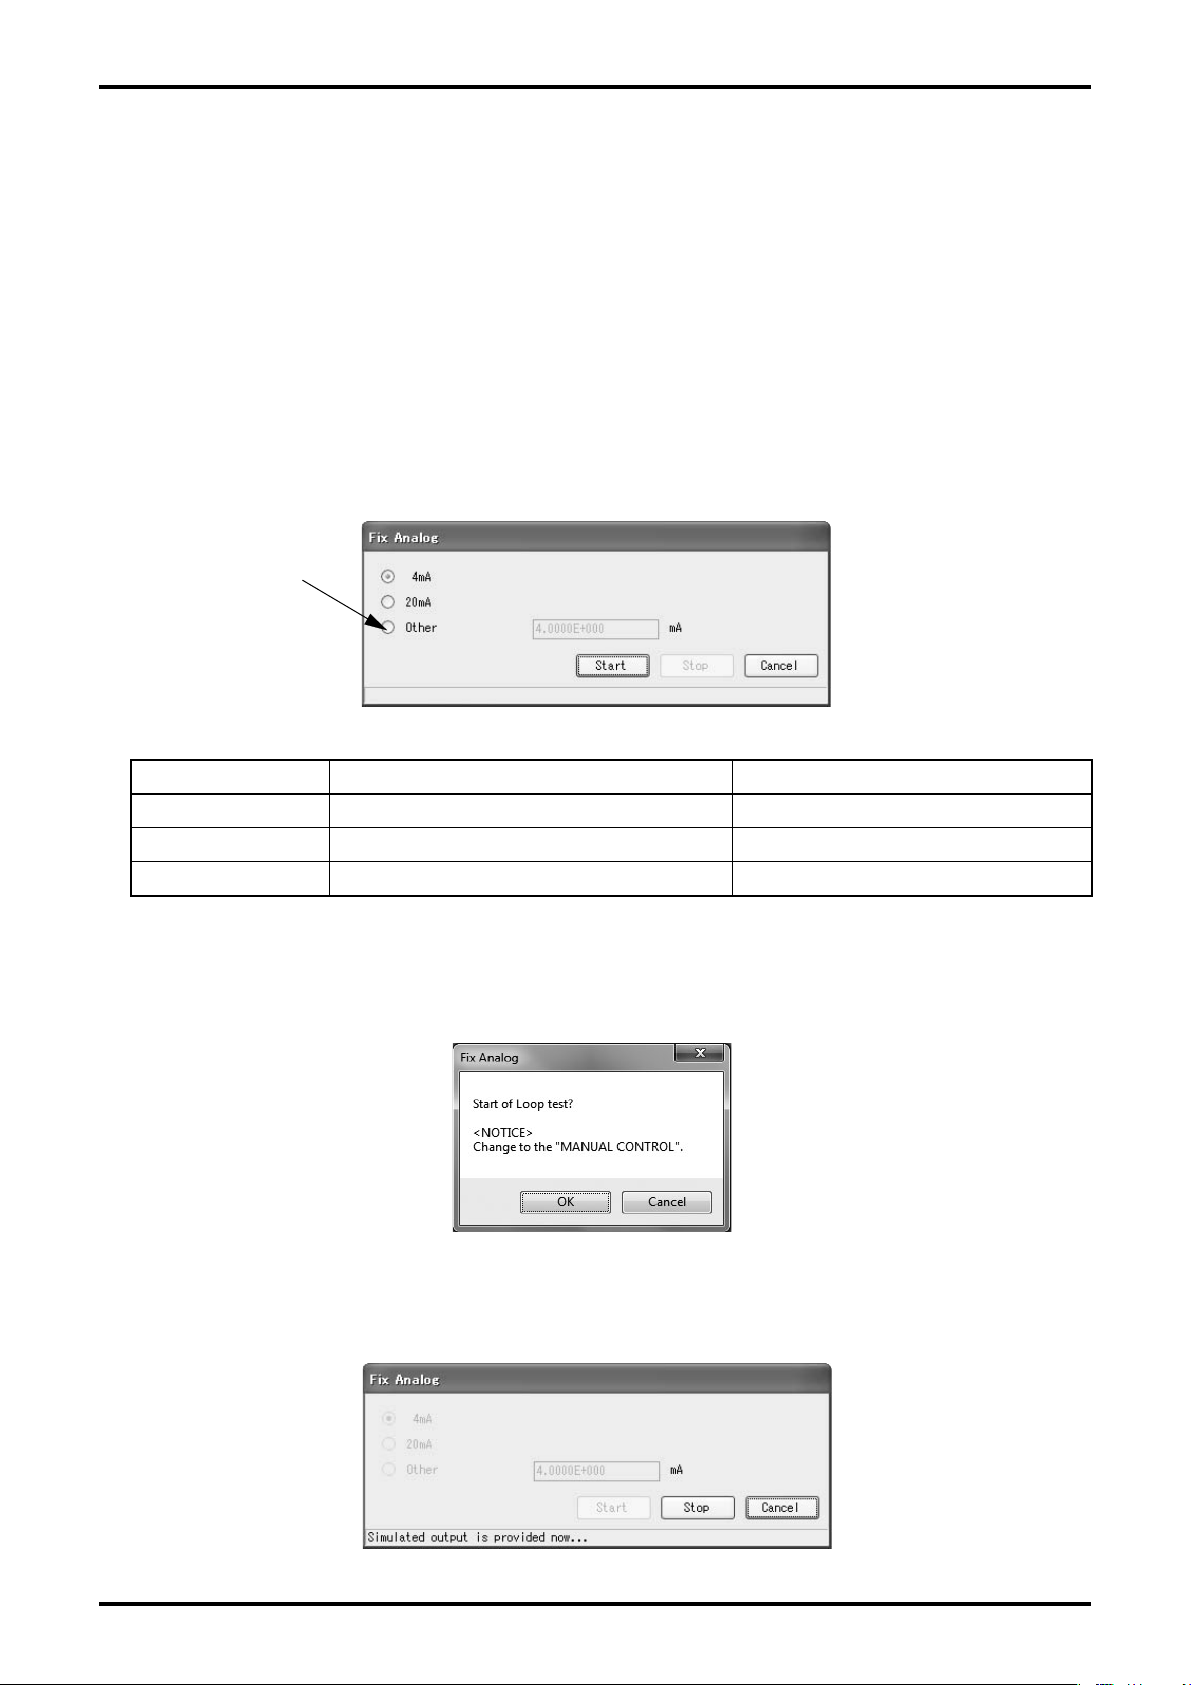
① Click "Diag/Service (T)" from the menu, and select "Fix Analog" from the list of "Loop test", then
the following window (Fig. 86) will be displayed.
Click here and input a
value to set any analog
simulated output.
Fig.86
Setting item Detail Setting range
4mA 4mA fixed output —
20mA 20mA fixed output —
Other Sets a desired output value. 2.4 to 21.6mA
② Select the simulated output value. To set a desired output value, click "Other" and enter the value.
By clicking "Start", a message box (Fig. 87) will be displayed. When you click "OK" , the analog
output is generated with the output value you set.
Fig.87
③ During simulated output, a message, "Simulated output is provided now ..." is displayed at the
bottom of the window as shown in Fig. 88.
0
Fig.88
Page 41
E-025-2-E
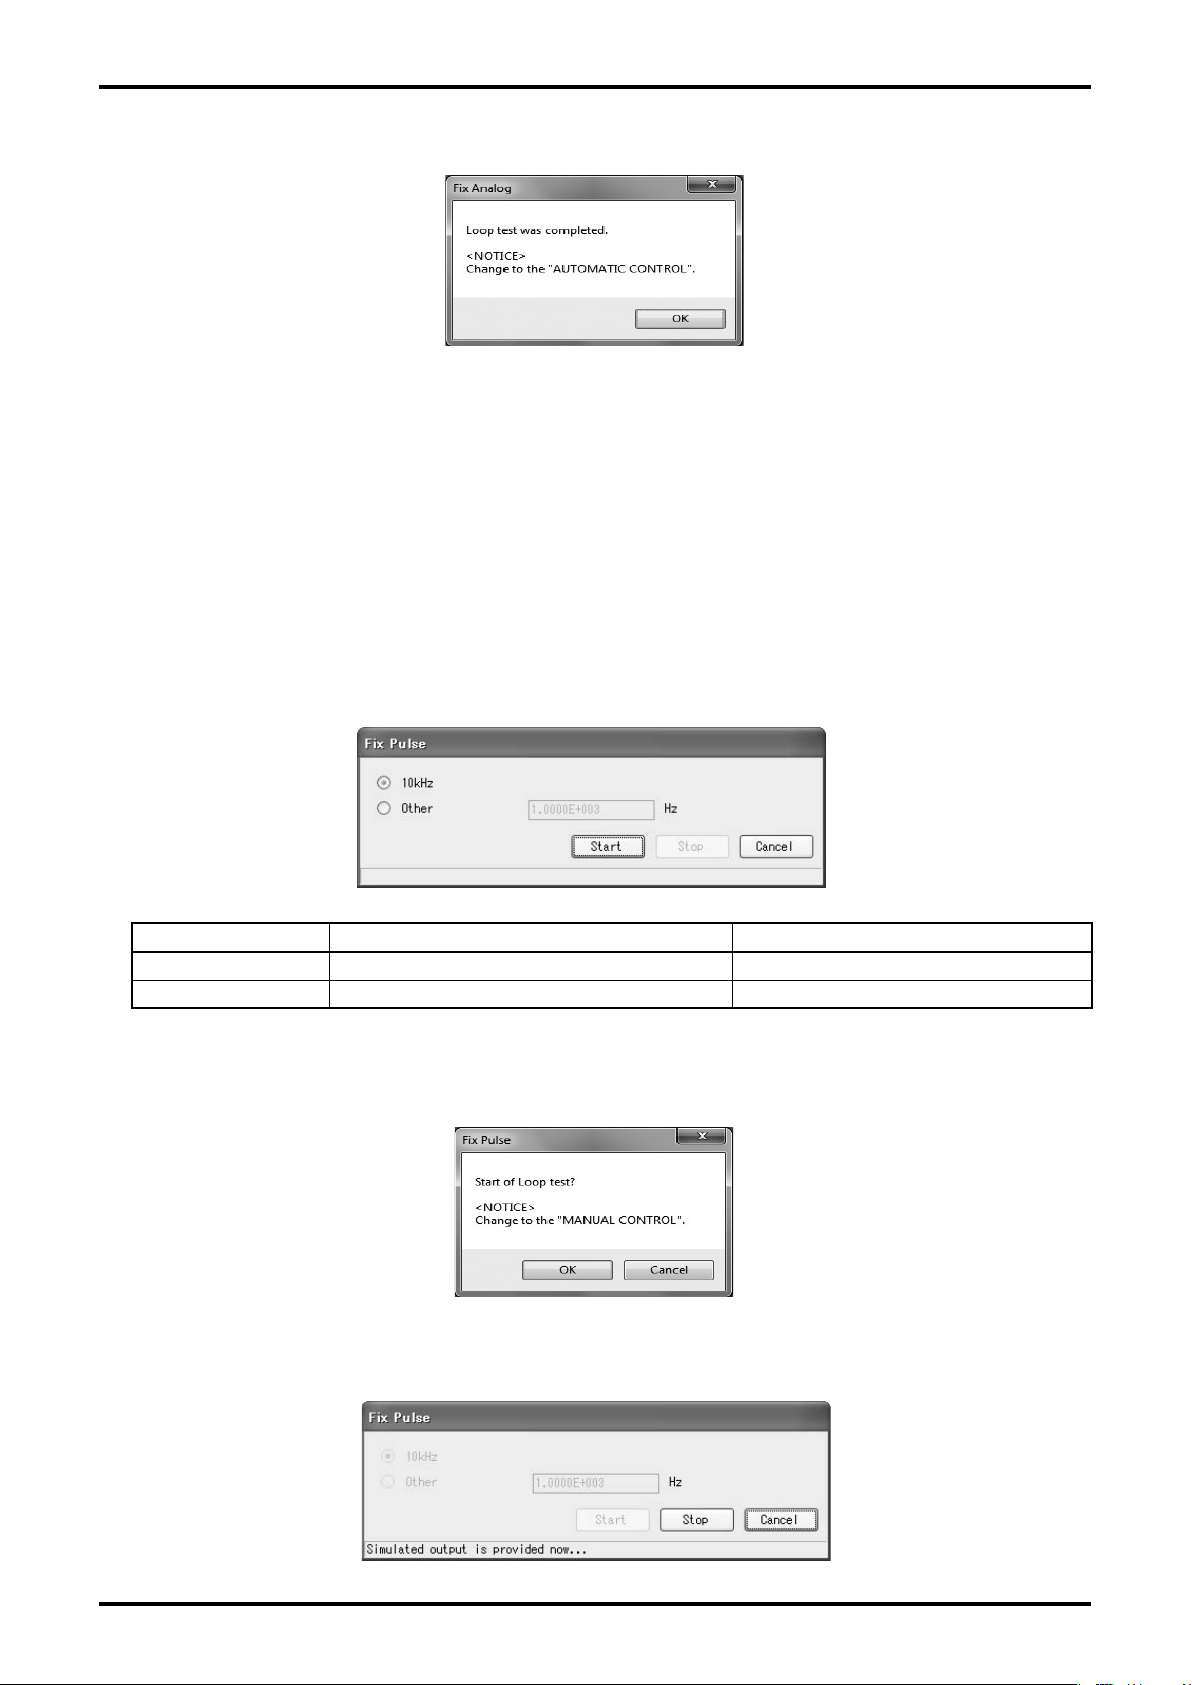
④ Click "Stop" to stop the simulated output. Then a message box (Fig. 89) is displayed. Click "OK" .
Fig.89
⑤ The window for setting the simulated output value is displayed. To exit, click "Cancel".
3.7.2.2 Pulse Output Loop Test (Fix Pulse)
This test can be used to put pulse output into a simulated output state, and to verify the output line
with a loop test.
The test creates simulated output regardless of the process state. If the owmeter's output is used to
control valves or other such parts, change the control loop to manual control for the sake of safety,
and so that the control loop cannot be inuenced by the owmeter's output.
① Click "Diag/Service (T)" from the menu, and select "Fix Pulse" from the list of "Loop test", then the
following window (Fig. 90) will be displayed.
Fig. 90
Setting item Detail Setting range
10kHz 10kHz fixed output —
Other Sets a desired output value. 0.01 to 11000Hz
② Select the simulated output value. To set a desired output value, click "Other" and enter the value.
By clicking "Start", a message box (Fig. 91) will be displayed. When you click "OK" , the analog
output is generated.
Fig.91
③ During simulated output, a message, "Simulated output is provided now ..." is displayed at the
bottom of the window as shown in Fig. 92.
Fig.92
Page 42
E-025-2-E
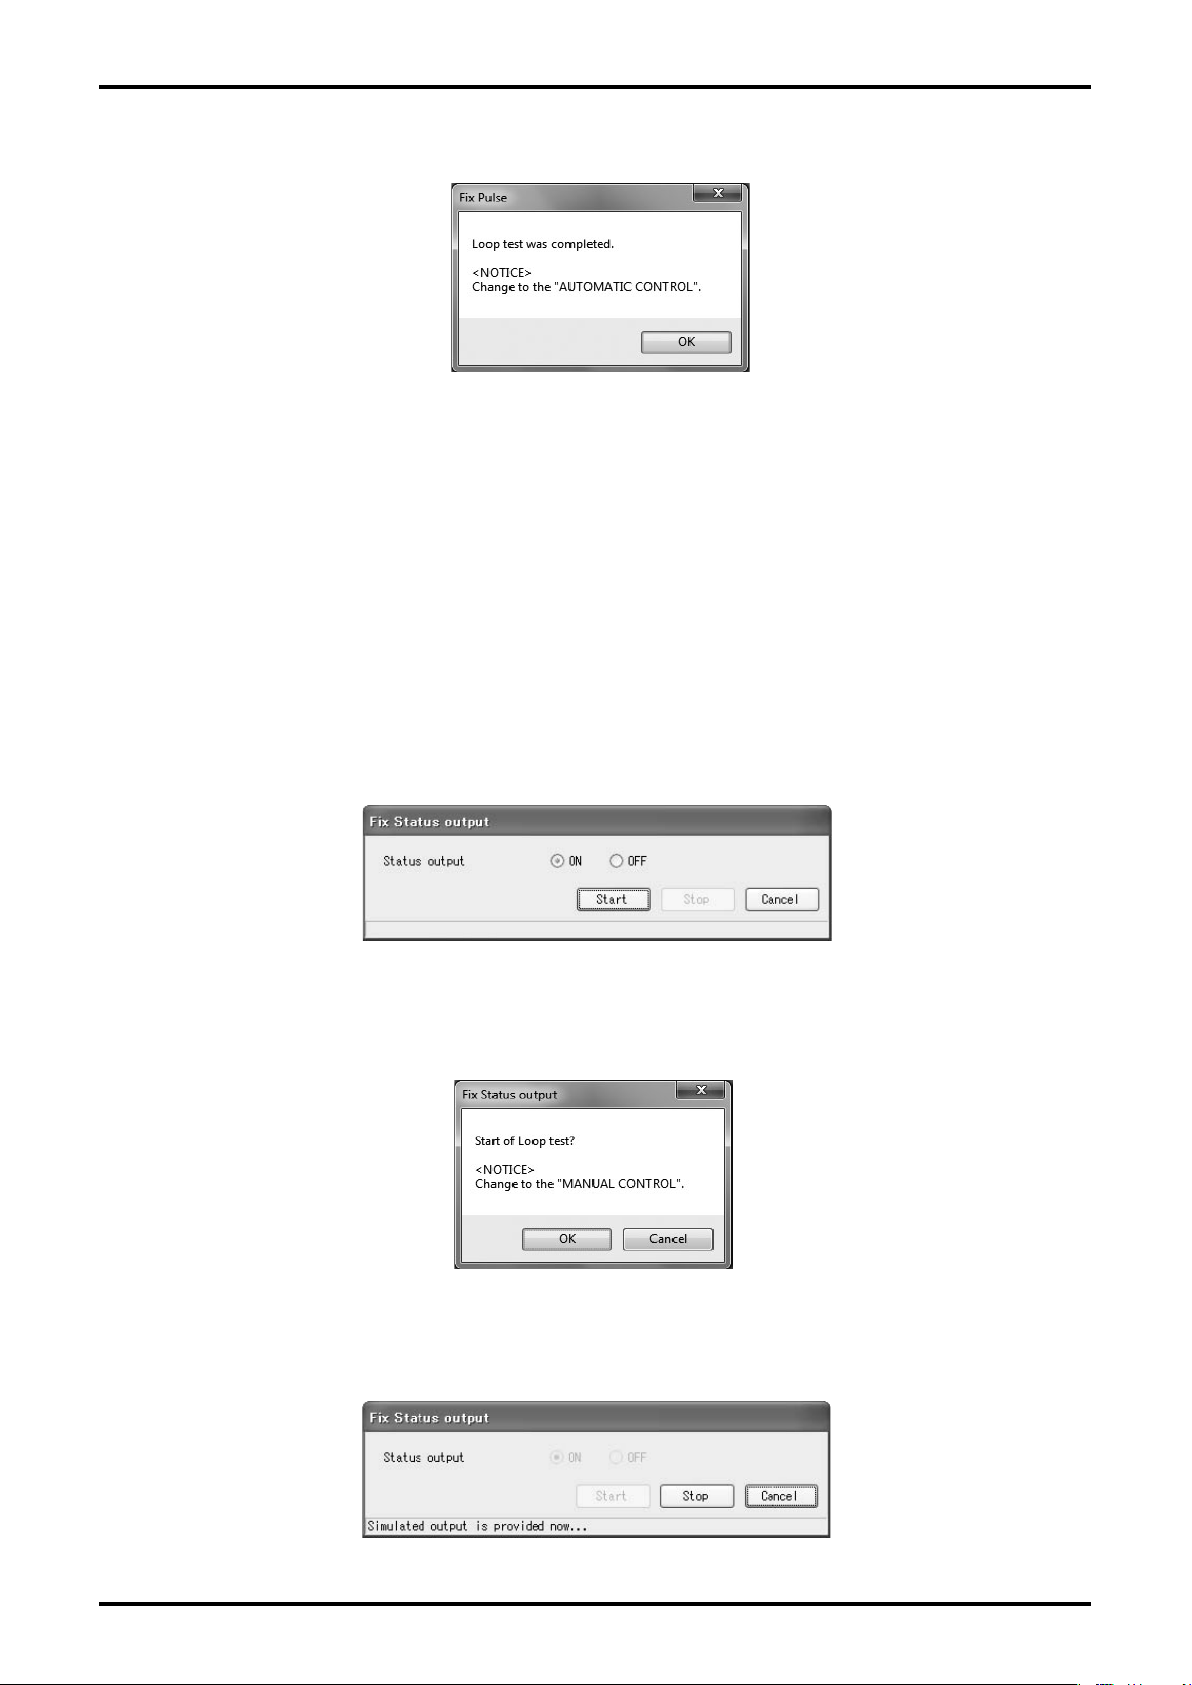
④ Click "Stop" to stop the simulated output. Then a message box (Fig. 93) is displayed. Click "OK" .
Fig.93
⑤ The window for setting the simulated output value is displayed. To exit, click "Cancel".
3.7.2.3 Status Output Loop Test (Fix Status output)
This puts status output into a simulated output state, and conducts a loop test on the output line.
This test creates simulated output regardless of the process state. If the owmeter's output is used to
control valves or other such parts, change the control loop to manual control for the sake of safety,
and so that the control loop cannot be inuenced by the owmeter's output.
① Click "Diag/Service (T)" from the menu, and select "Fix Status output" from the list of "Loop test",
then the following window (Fig. 94) will be displayed.
Fig.94
② Select the simulated output state. By clicking "Start", a message box (Fig. 95) will be displayed.
When you click "OK", the analog output is generated.
Fig.95
③ During simulated output, a message, "Simulated output is provided now ..." is displayed at the
bottom of the window as shown in Fig. 96.
Fig.96
2
Page 43
E-025-2-E
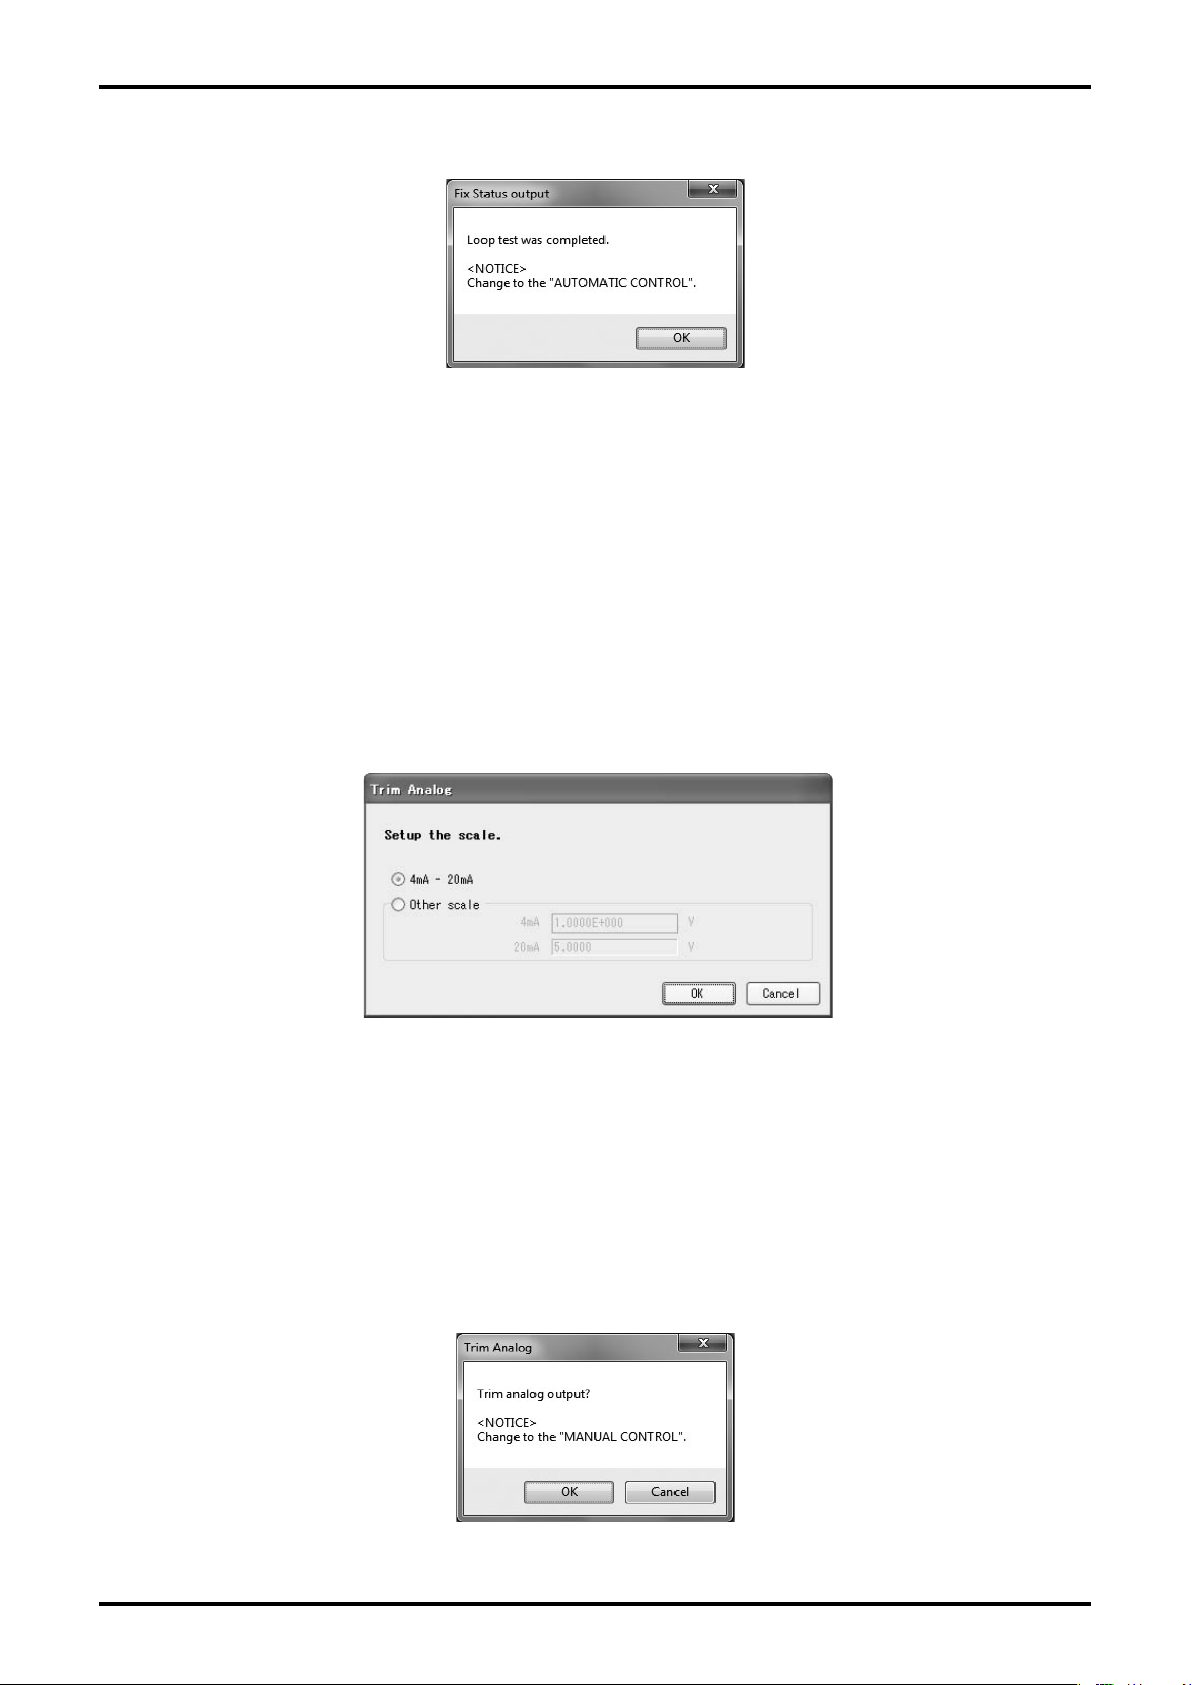
④ Click "Stop" to stop the simulated output. Then a message box (Fig. 97) is displayed. Click "OK" .
Fig.97
⑤ The window for setting the simulated output value is displayed. To exit, click "Cancel" .
3.7.3 Analog Output Adjustment (Trim Analog)
This adjusts the output value of the owmeter transmitter's analog output.
This function is for adjusting the values by outputting analog values equivalent to 4mA and 20mA
regardless of the processing state. If the owmeter's output is used to control valves or other such
parts as safety protocol, change the control loop to manual control so that the control loop cannot be
inuenced by the owmeter's output.
① Click "Diag/Service (T)" from the menu, and select "Trim Analog", then the following window
(Fig. 98) will be displayed.
Fig.98
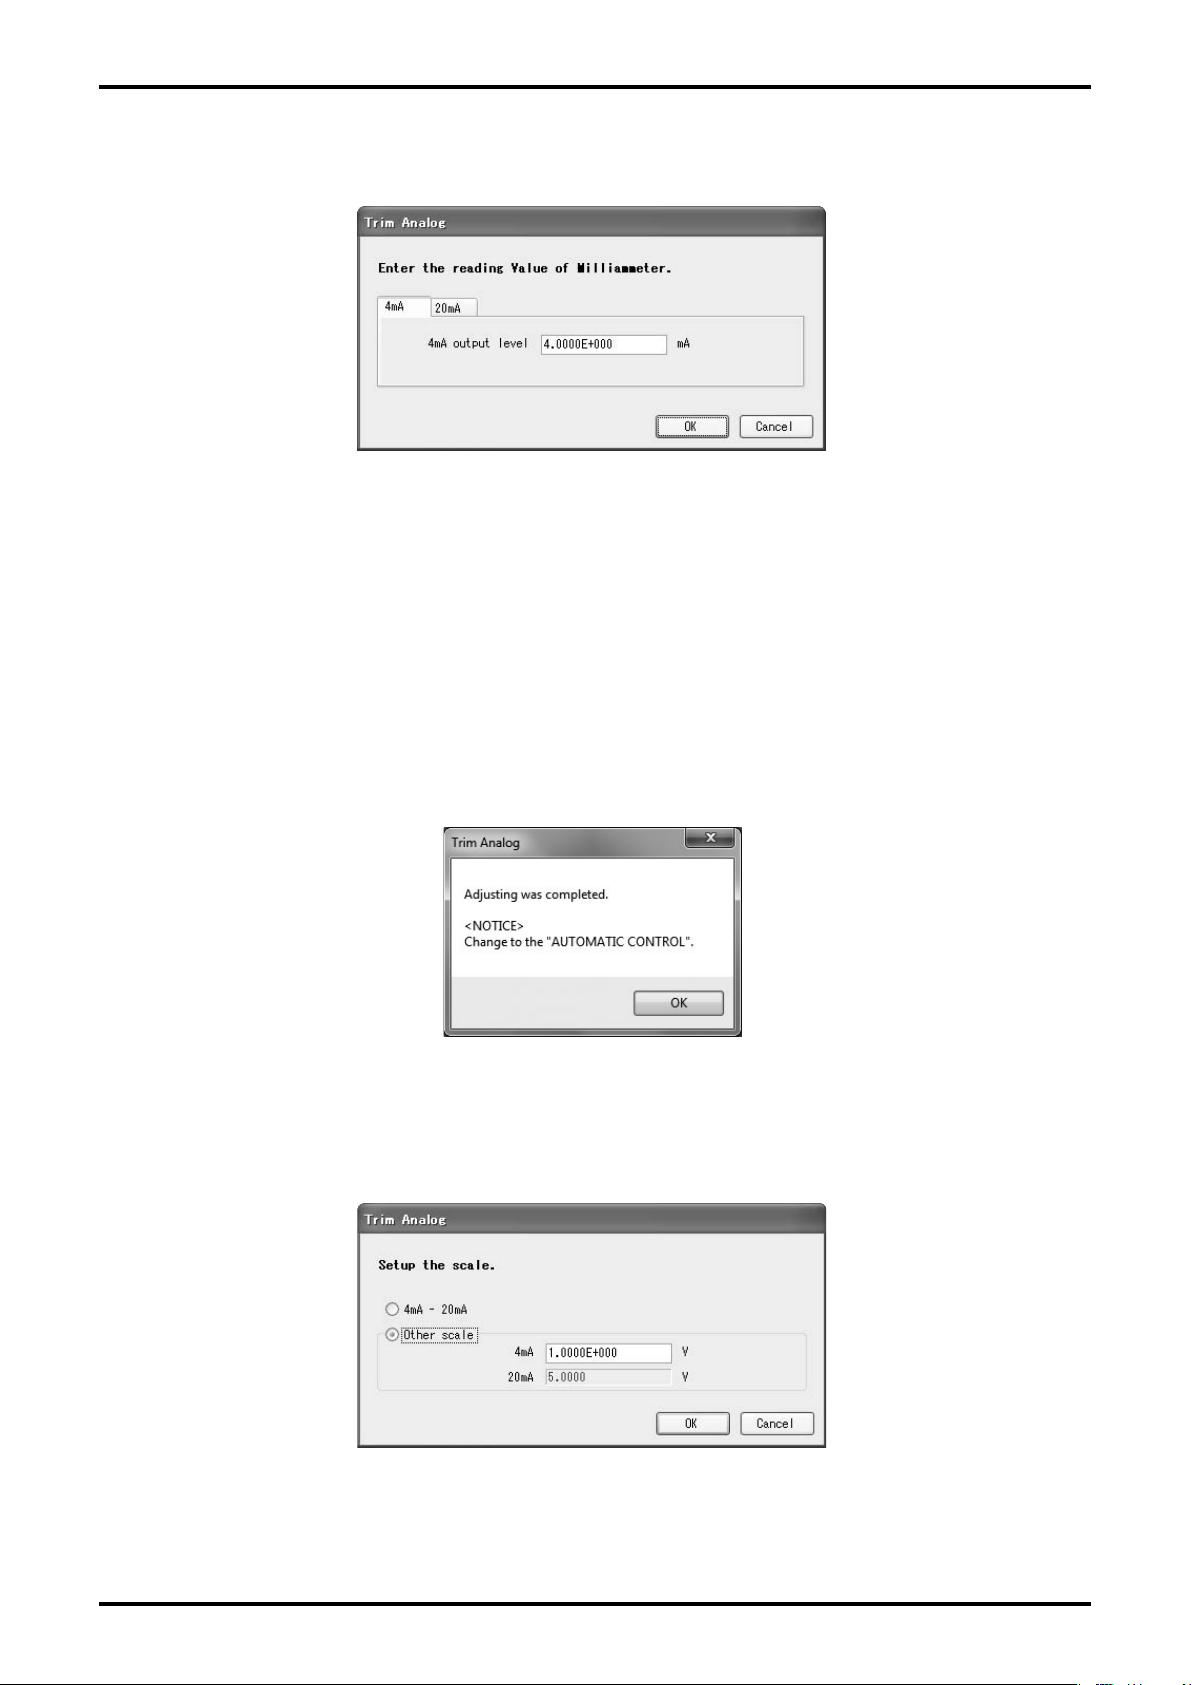
② Select the scale from "4mA - 20mA" or "Other scale" and click "OK".
When "4mA - 20mA" is used for adjustment, a standard ammeter is inserted into the analog output
loop, and adjustment follows the method described in steps ③ to ⑥.
When "Other scale" is used, load resistance is inserted into the analog output loop, and adjustment
follows the method described in steps ⑦ to ⑪ (this description covers the situation where
RL= 250Ω will be inserted, with adjustment to both ends of the voltage value scale of 1 to 5V).
③ A message box (Fig. 99) is displayed. Click "OK" to execute analog output at 4mA.
Fig.99
Page 44
E-025-2-E
④ When you select "4mA-20mA", a window as shown in Fig. 100 appears. Select 4mA or 20mA
adjustments. Here, an example with 4mA adjustment is explained.
Fig.100
Enter the reading of the ammeter currently outputting at "4mA output level" box and click "OK" .
When the reading is sent, the transmitter automatically adjusts the output to 4mA. Verify that the
indicator of the connected ammeter shows 4mA.
If another adjustment is required, repeat the same procedure.
⑤ To execute 20mA adjustment, click the "20mA" tab on the window in Fig. 100. Then execute
adjustment so that the connected ammeter indicator reads 20mA in the same manner as 4mA
adjustment.
⑥ By clicking "Cancel", a message box (Fig. 101) is displayed. Click "OK" .
Fig.101
⑦ When you select "Other scale", scale input with a voltage value is enabled as shown in Fig.102. When
you enter an analog value (here 1V as an example) equivalent to the output of 4mA for "4mA", the
corresponding value is entered in "20mA" automatically.
Fig. 102
Here, analog output adjustment with 1 to 5V scale is available. Click "OK" to start the adjustment.
Connect a measuring instrument (reference voltmeter) across both ends of load resistance RL.
Page 45
E-025-2-E
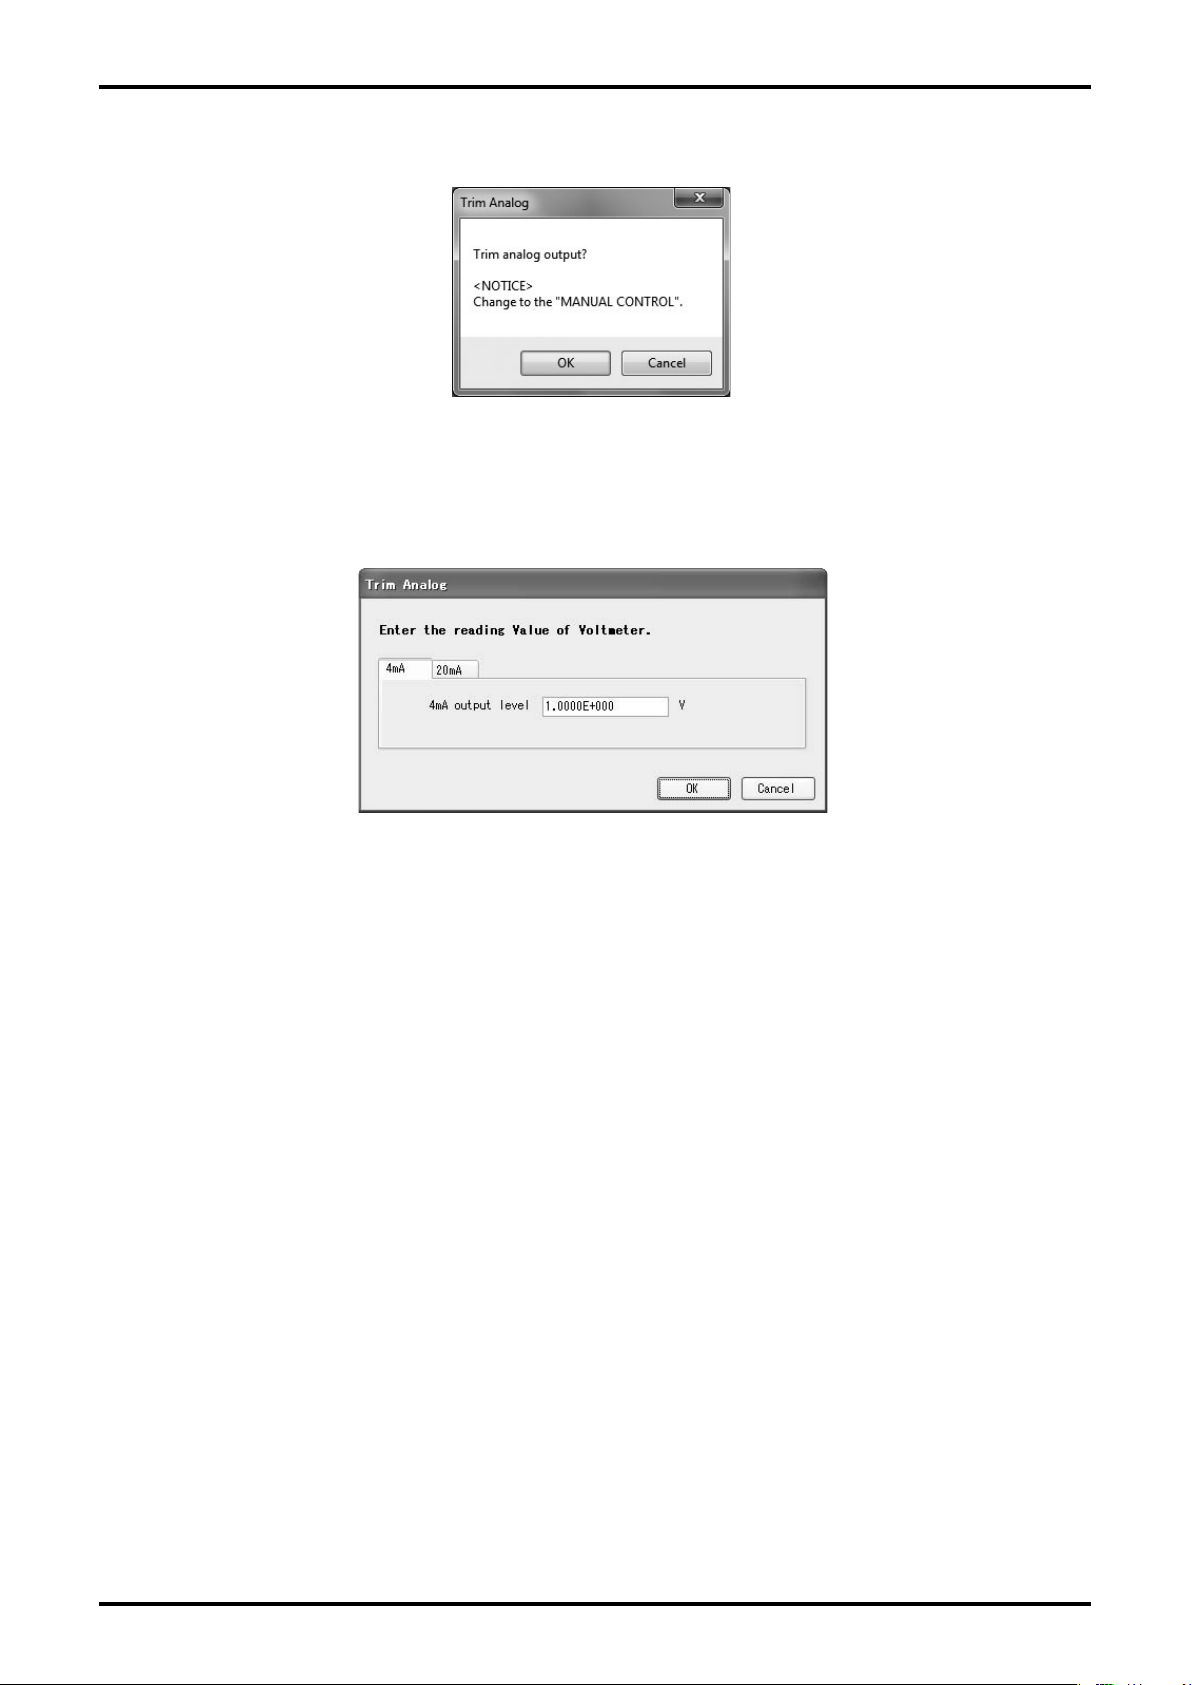
⑧ A message box (Fig. 103) will be displayed. Click "OK" to execute analog output at 4mA.
Fig.103
⑨ When you select "Other scale", a window shown in Fig. 104 is displayed for the adjustment of
4mA and 20mA levels. Here, explanation is given for the case with 4mA adjustment.
Fig.104
Enter the reading of the ammeter currently outputting at "4mA output level" box and click "OK" .
When the reading is sent, the transmitter automatically adjusts the output to 4mA. Verify that the
indicator of the connected measuring instrument is 1V.
If another adjustment is required, execute the same procedure.
⑩ To execute 20mA adjustment, click the“20mA”tab on the window in Fig. 104 and execute
adjustment so that the indicator of the connected ammeter shows 20mA as in the same way as
4mA adjustment.
⑪ By clicking "Cancel", a message box (Fig. 101) is displayed. Click "OK" .
5
Page 46
E-025-2-E
3.7.4 Cumulative Total Display and Control (Totalizer Control)
Use this for functions such as displaying the cumulative totals, and starting, stopping, and resetting
the count.
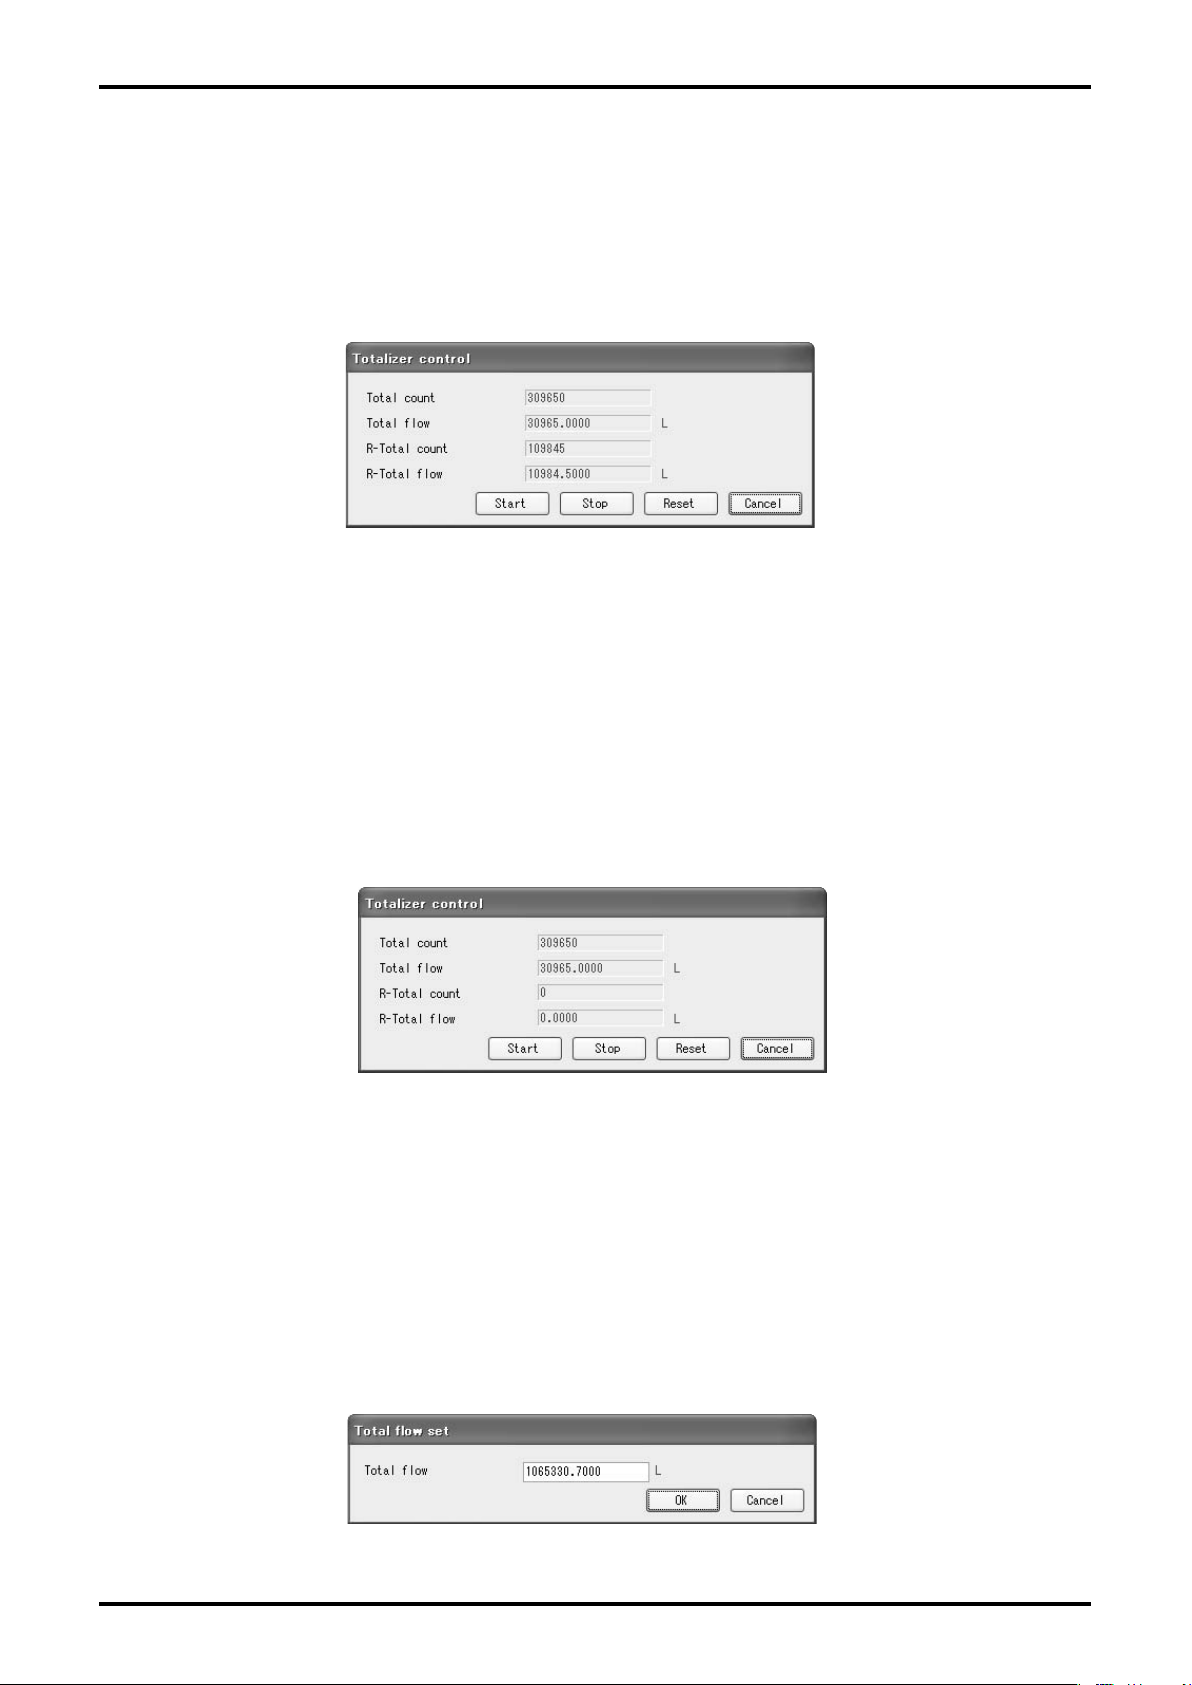
① Click "Diag/Service (T)" from the menu, and select "Totalizer control", then the following window
(Fig. 105) will be displayed.
Fig.105
"Total count" ... Accumulated total ow counter: Not resettable
"Total ow" ... Accumulated total ow: Not resettable
"R-Total count" ... Resettable total ow counter: Resettable
"R-Total ow" ... Resettable total ow: Resettable
② To stop totalizing, click "Stop". To resume totalizing, click "Start". To reset the resettable total
ow, click "Reset". If you execute resetting when totalizing is suspended, the following window
(Fig. 106) will be displayed.
Fig.106
③ To exit, click "Cancel" .
3.7.5 Setting Accumulated Total Flow (Total ow set)
Accumulated total ow value is set as necessary.
① Click "Diag/Service (T)" from the menu, and select "Total ow set", then the following window
(Fig. 107) will be displayed.
Fig.107
Page 47
E-025-2-E
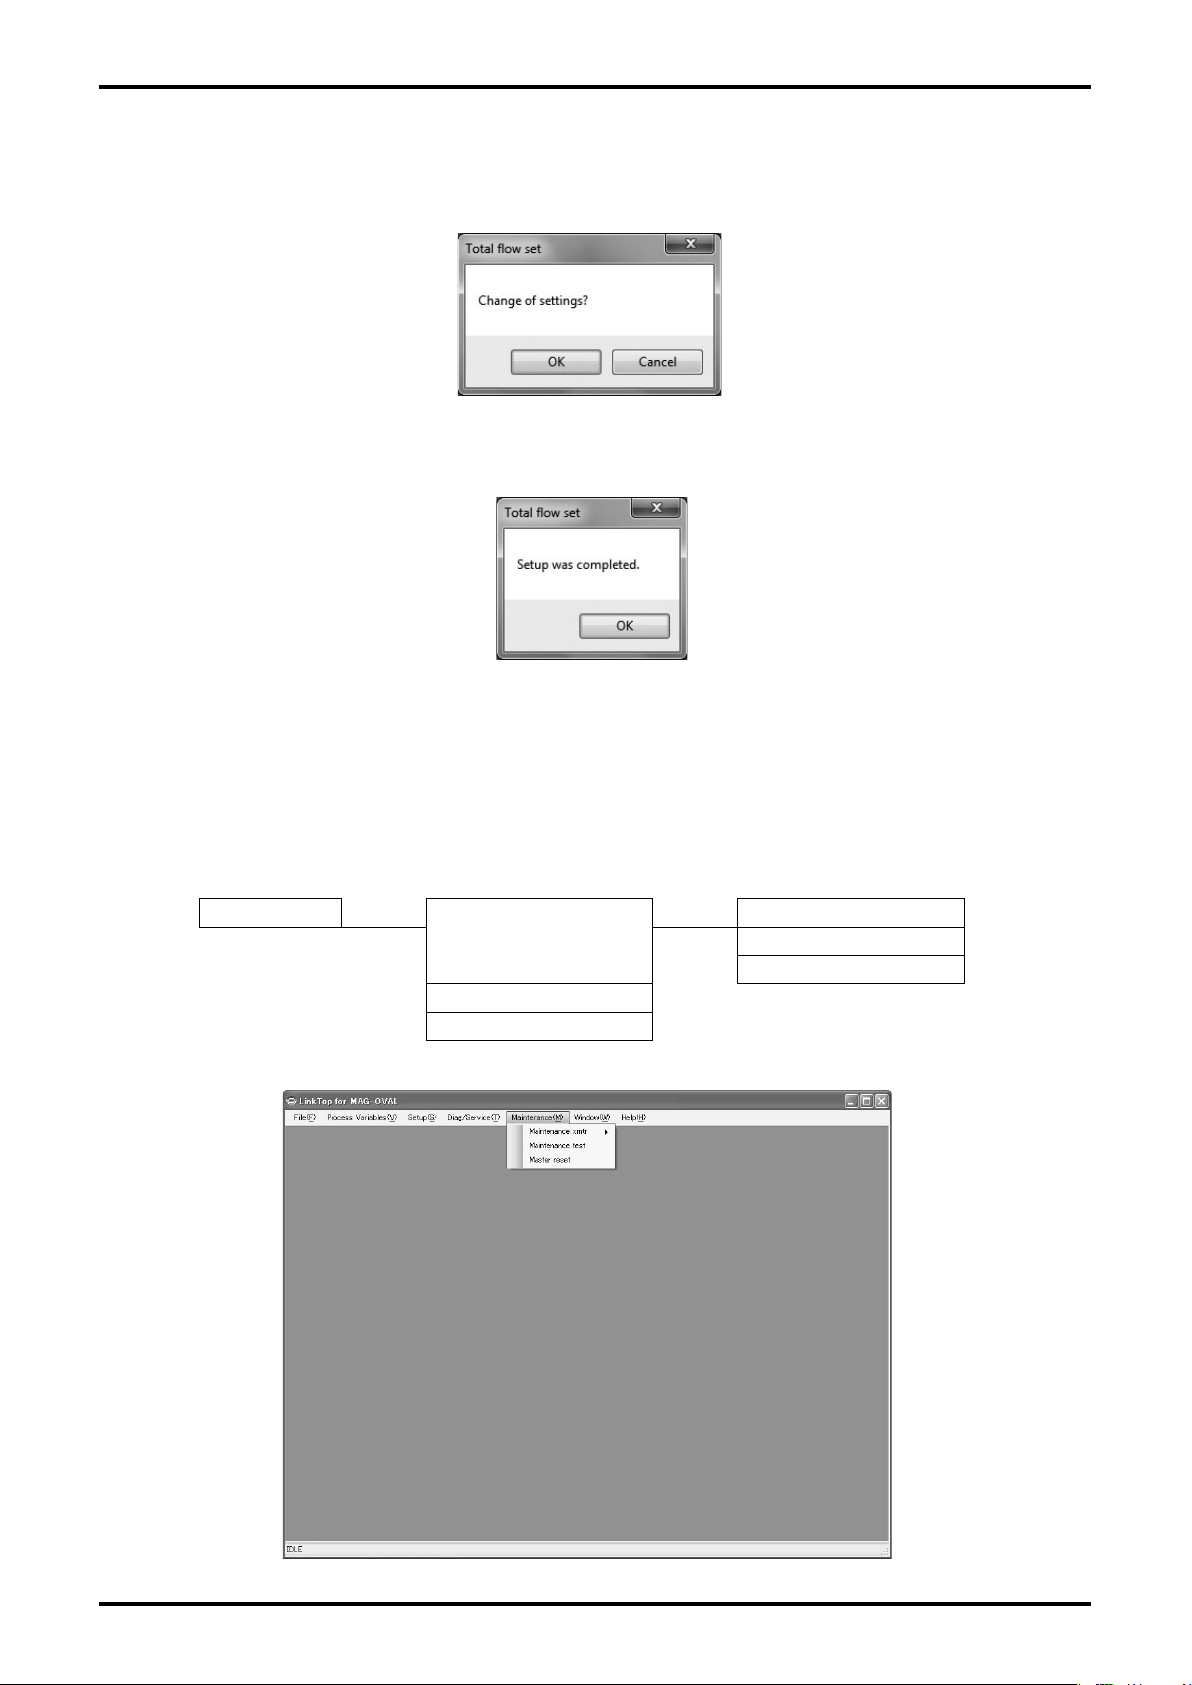
② Set the value of total ow at the start of measurement. If the setting is completed, click "OK" .
A message box (Fig. 108) will be displayed. By clicking "OK" again, the value is changed to the
entered set value.
Fig.108
③ When the set value is changed, a message box (Fig. 109) will be displayed. Click "OK" to
complete the setting.
Fig.109
④ The window for setting item is displayed. To exit, click "Cancel" .
3.8 Menu: Maintenance (Maintenance)
With "Maintenance (M) ", error log (occurrence/release), temperature in the transmitter, and operating
time will be displayed, and simulated output of ow, etc. and master resetting can be performed.
The actual screen is as shown in Fig. 110.
Maintenance
Maintenance xmtr
Maintenance test
Master reset
Diag/Service Item Tree
Error log
Xmtr temp
Operating time
Fig.110
Page 48
E-025-2-E
3.8.1 Maintaining Transmitter (Maintenance xmtr)
3.8.1.1 Error Log Display (Error log)
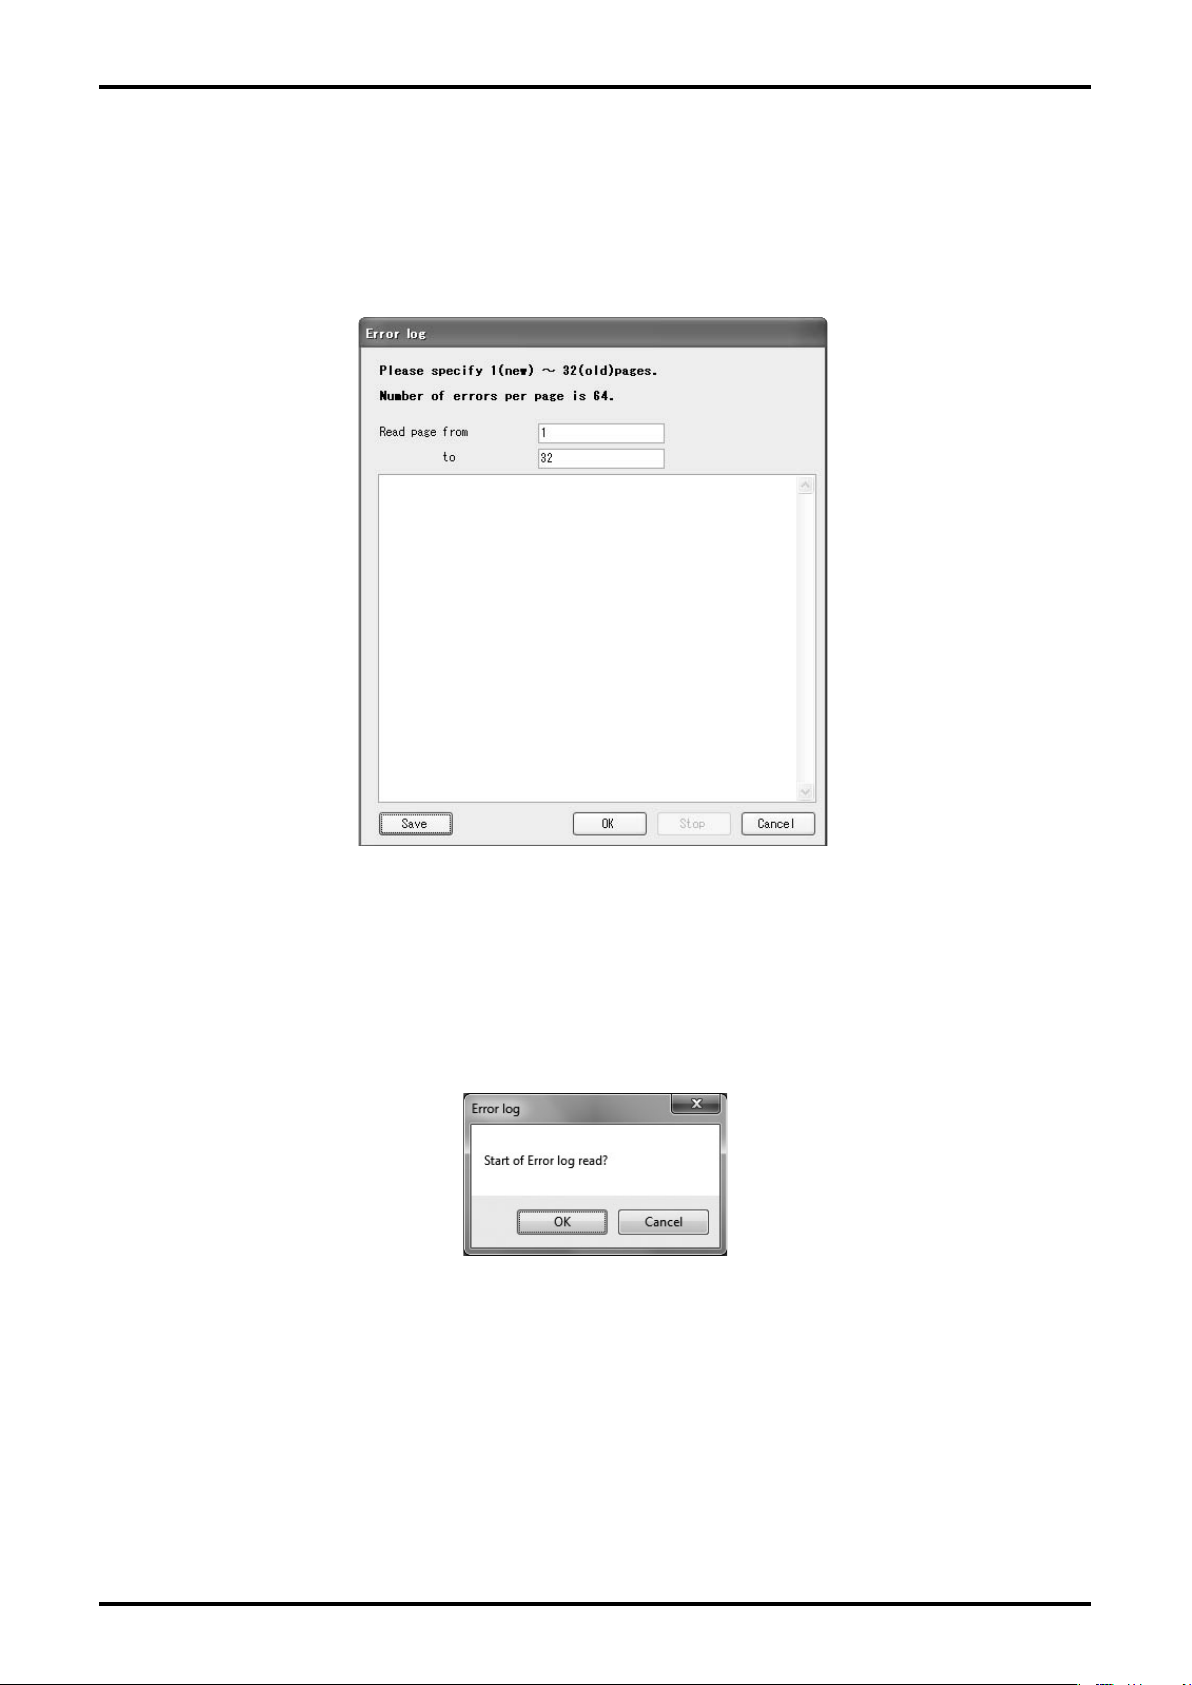
① Click "Maintenance (M)" from the menu, and select "Error log" from the list of "Maintenance xmtr",
then the following window (Fig. 111) will be displayed.
Fig.111
② Logs are saved in 32 pages with 64 items per page with the latest log on the rst page.
Enter the page number into "Read page from" and "(Read page) to" boxes, then click "OK".
A message box will be displayed. Click "OK" to start getting and displaying logs.
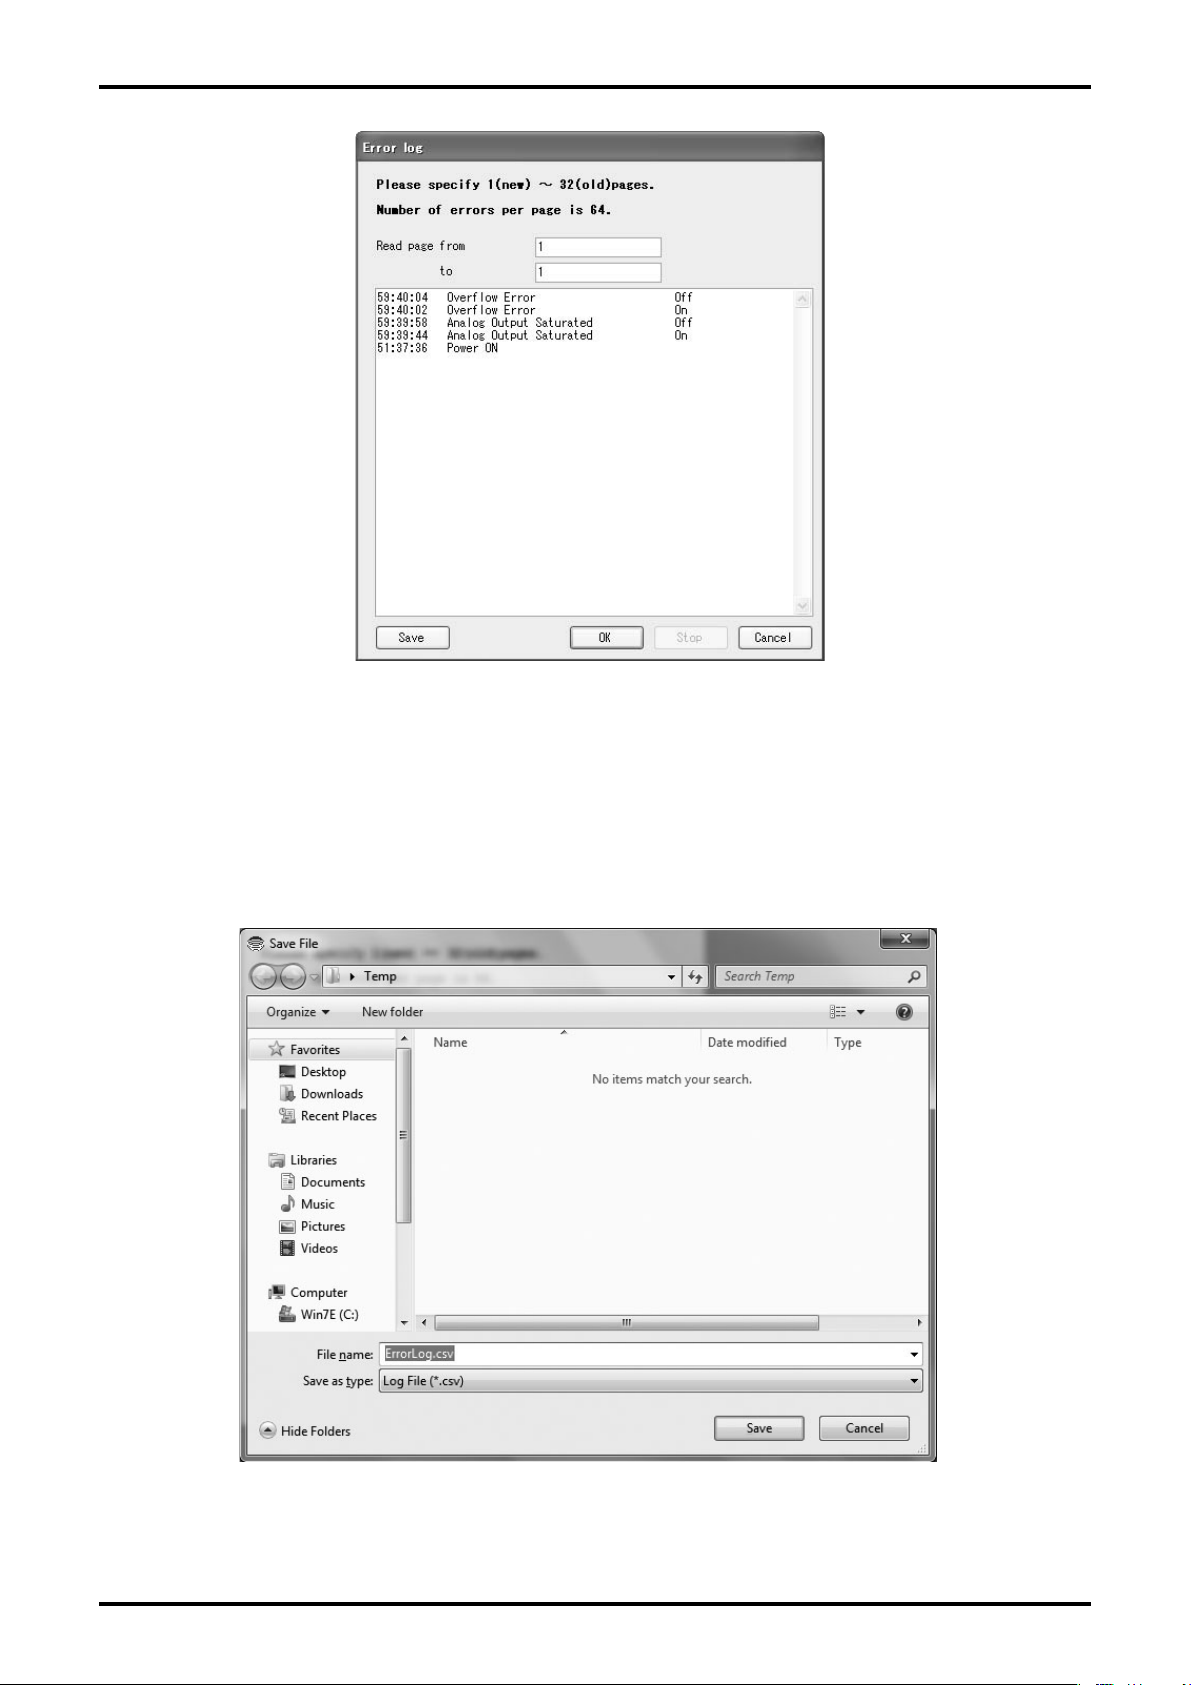
An example of a log on page 1 is shown as Fig. 113.
Fig.112
Page 49
E-025-2-E
Fig.113
③ To stop getting and displaying logs, click "Stop" .
④ You can save the currently displayed log as a CSV le by clicking "Save". Then the following
dialog box (Fig. 114) will be displayed. Assign the location of saving le and a le name and click
"Save (S)".
⑤ To exit error log display, click "Cancel" .
Fig.114
Page 50
E-025-2-E
3.8.1.2 Transmitter Internal Temperature Display (Xmtr temp)
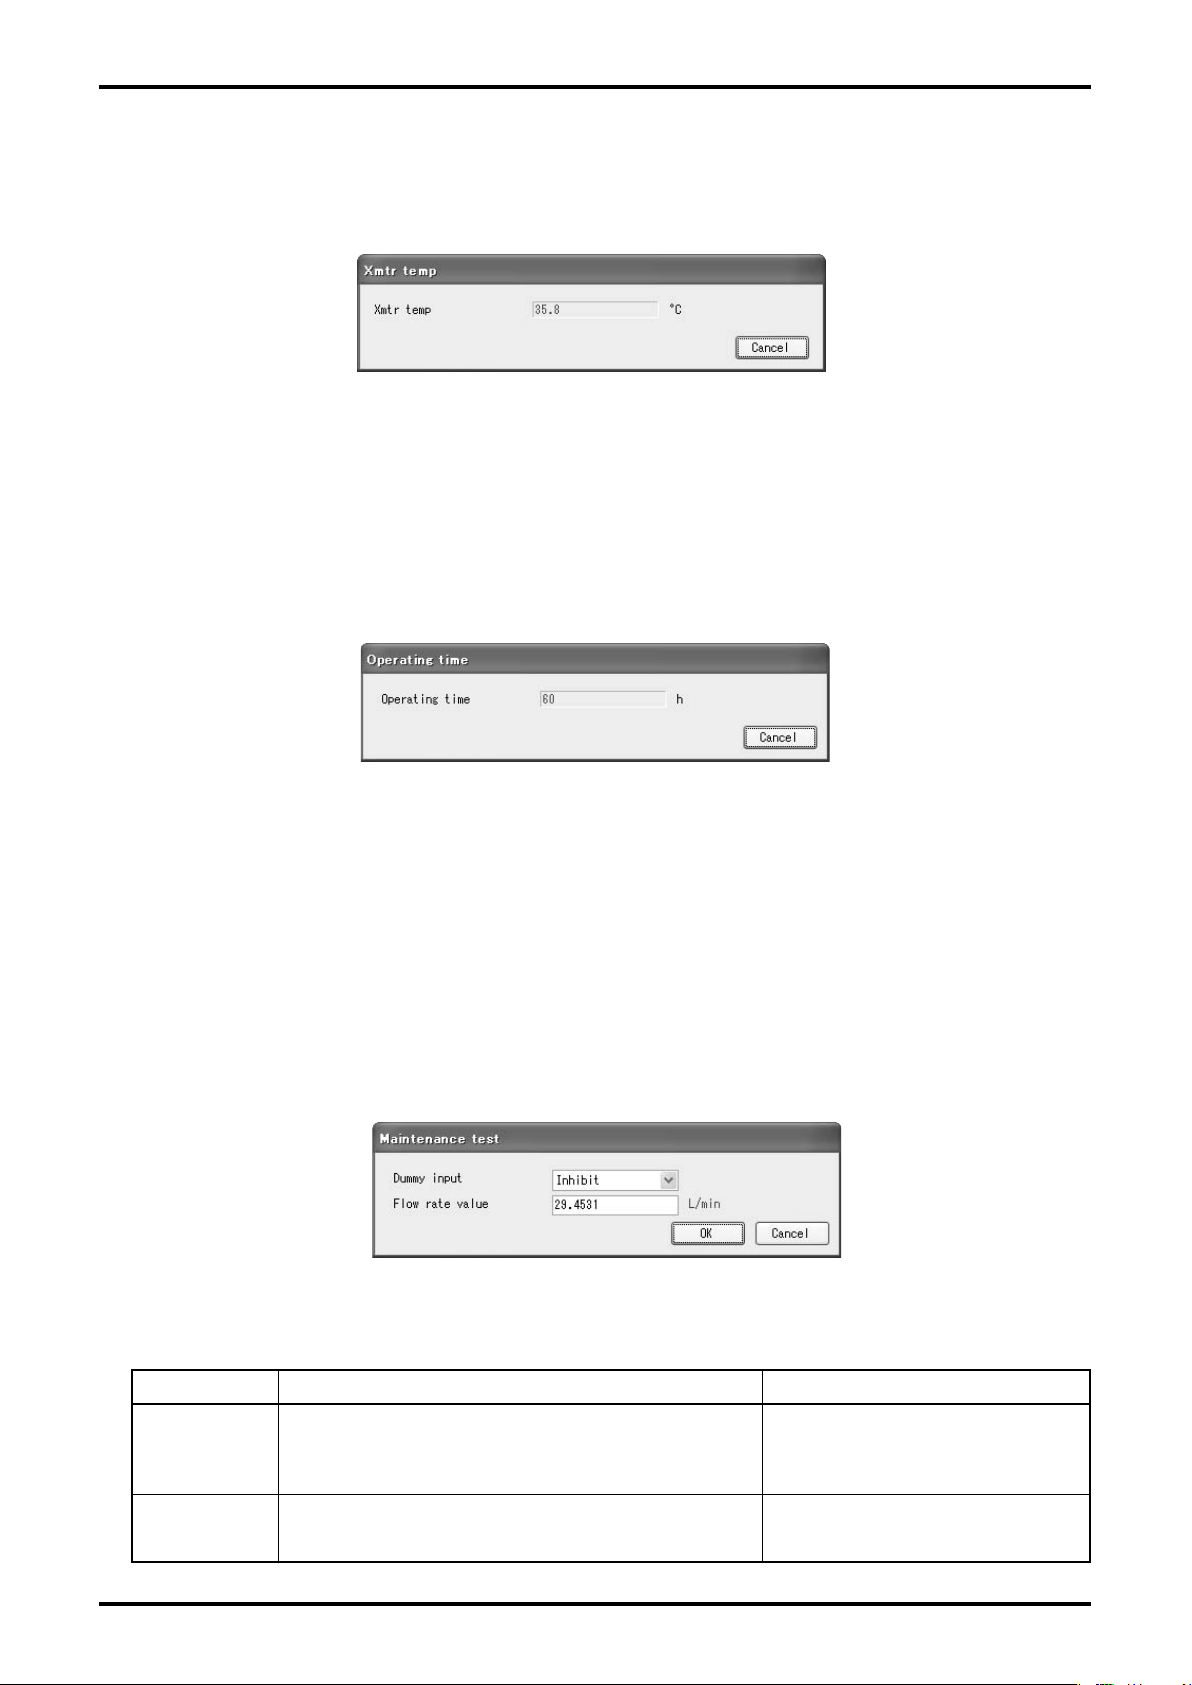
① Click "Maintenance (M)" from the menu, and select "Xmtr temp" from the list of "Maintenance
xmtr", then the following window (Fig. 115) will be displayed.
Fig.115
② You can conrm the internal temperature of the transmitter. To exit, click "Cancel" .
3.8.1.3 Displaying Operating Time (Operating time)
① Click "Maintenance (M)" from the menu, and select "Operating time" from the list of "Maintenance
xmtr", then the following window (Fig. 116) will be displayed.
Fig.116
② You can conrm the total operating time up to now. To exit, click "Cancel" .
3.8.2 Maintenance Test (Maintenance test)
Input setting for simulated ow is conducted.
① Click "Maintenance (M)" from the menu, and select "Maintenance test", then the following window
(Fig. 117) will be displayed.
Fig.117
② Select and enter numeric values for respective items.
Setting item Detail Setting range
Simulated input setting (Select from the right column.)
Dummy input
Flow rate
value
50
Inhibit
Enable
Input value for simulated flow
Inhibit, Enable
Minimum range to Maximum range
in "3.6.1.2 Setting Flow"
Page 51
E-025-2-E
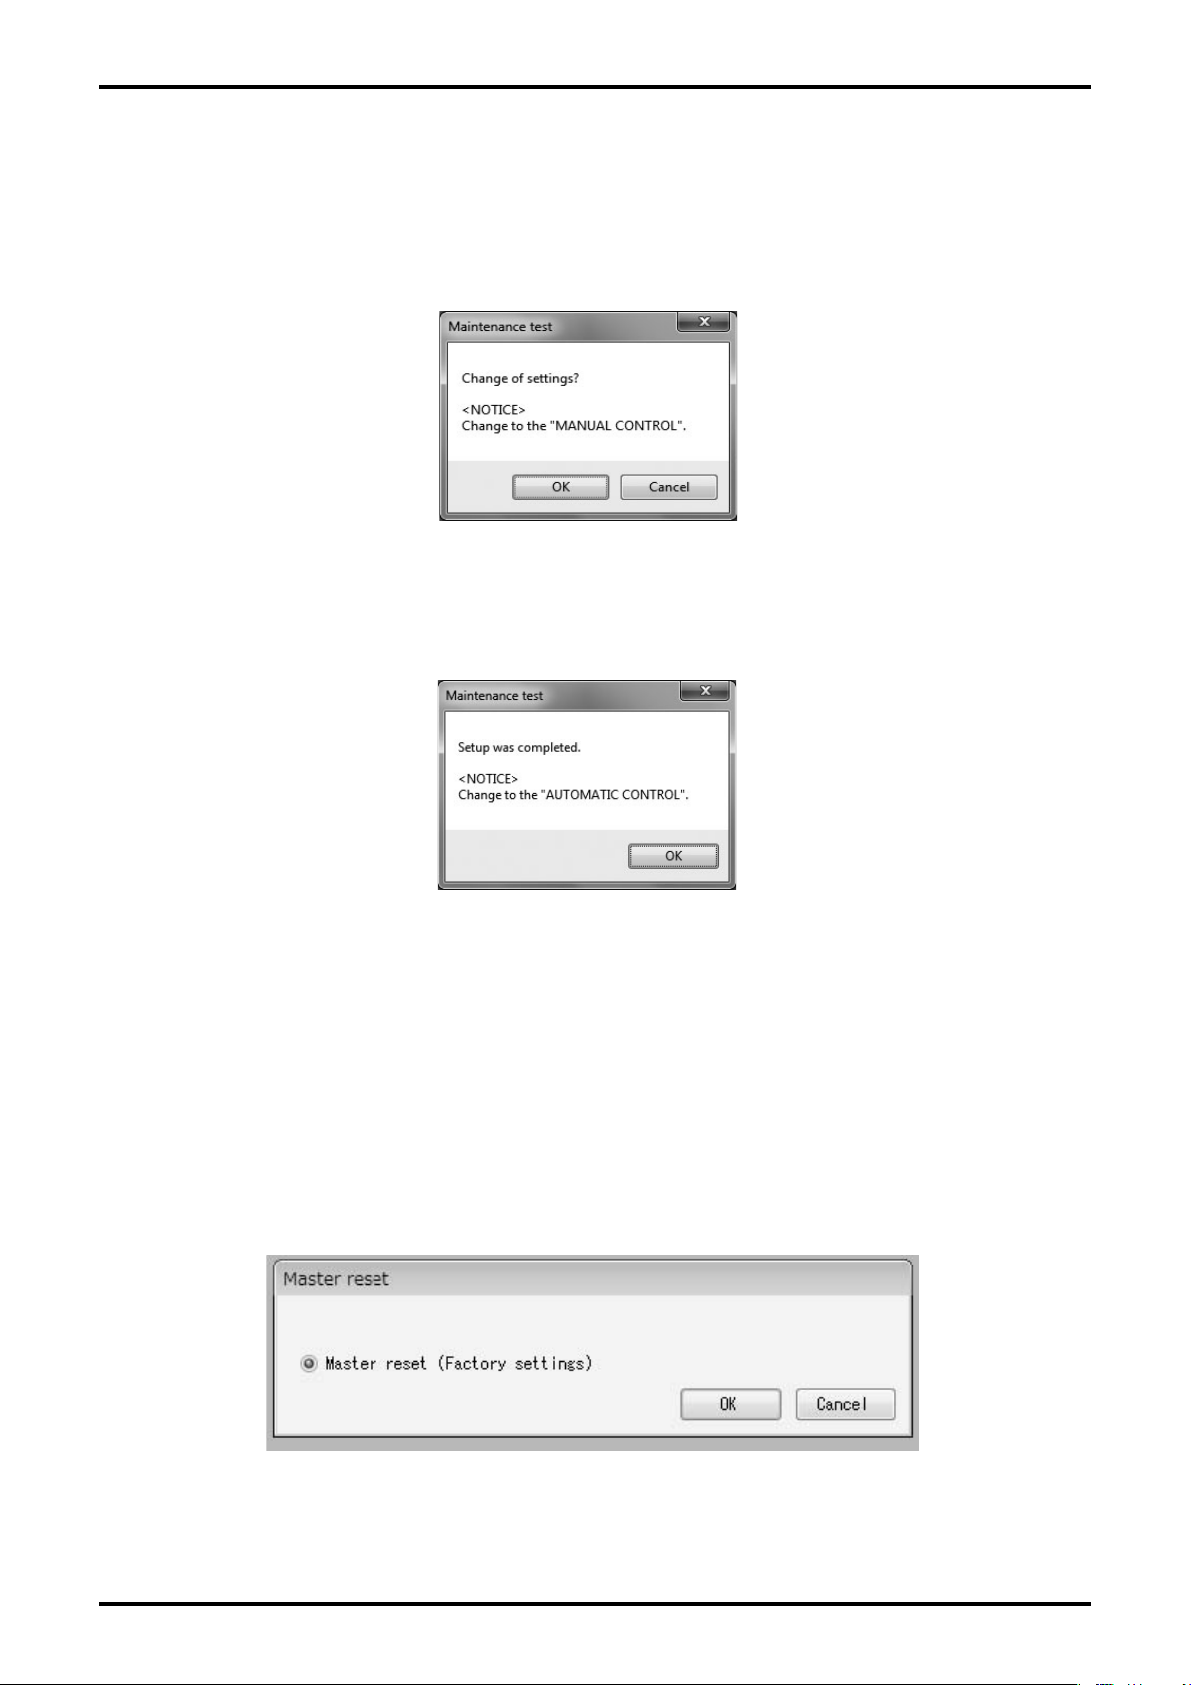
③ Click "OK" after the setting is completed to display the message box (Fig. 118). Click "OK" here
to change the settings to the inputted values, and to reect the changed setting values in the
owmeter's output. If the owmeter's output is used to control valves or other such parts as safety
protocol, change the control loop to manual control so that the control loop cannot be inuenced
by the owmeter's output.
Fig.118
④ When the set value is changed, a message box (Fig. 119) will be displayed. Click "OK" to
complete the setting.
Fig.119
⑤ The window for setting item is displayed. To exit, click "Cancel".
3.8.3 Resetting Master (Master reset)
Current parameters are restored to the factory set values.
① Click "Maintenance (M)" from the menu, and select "Master reset", then the following window
(Fig. 120) will be displayed.
Fig.120
5
Page 52
E-025-2-E
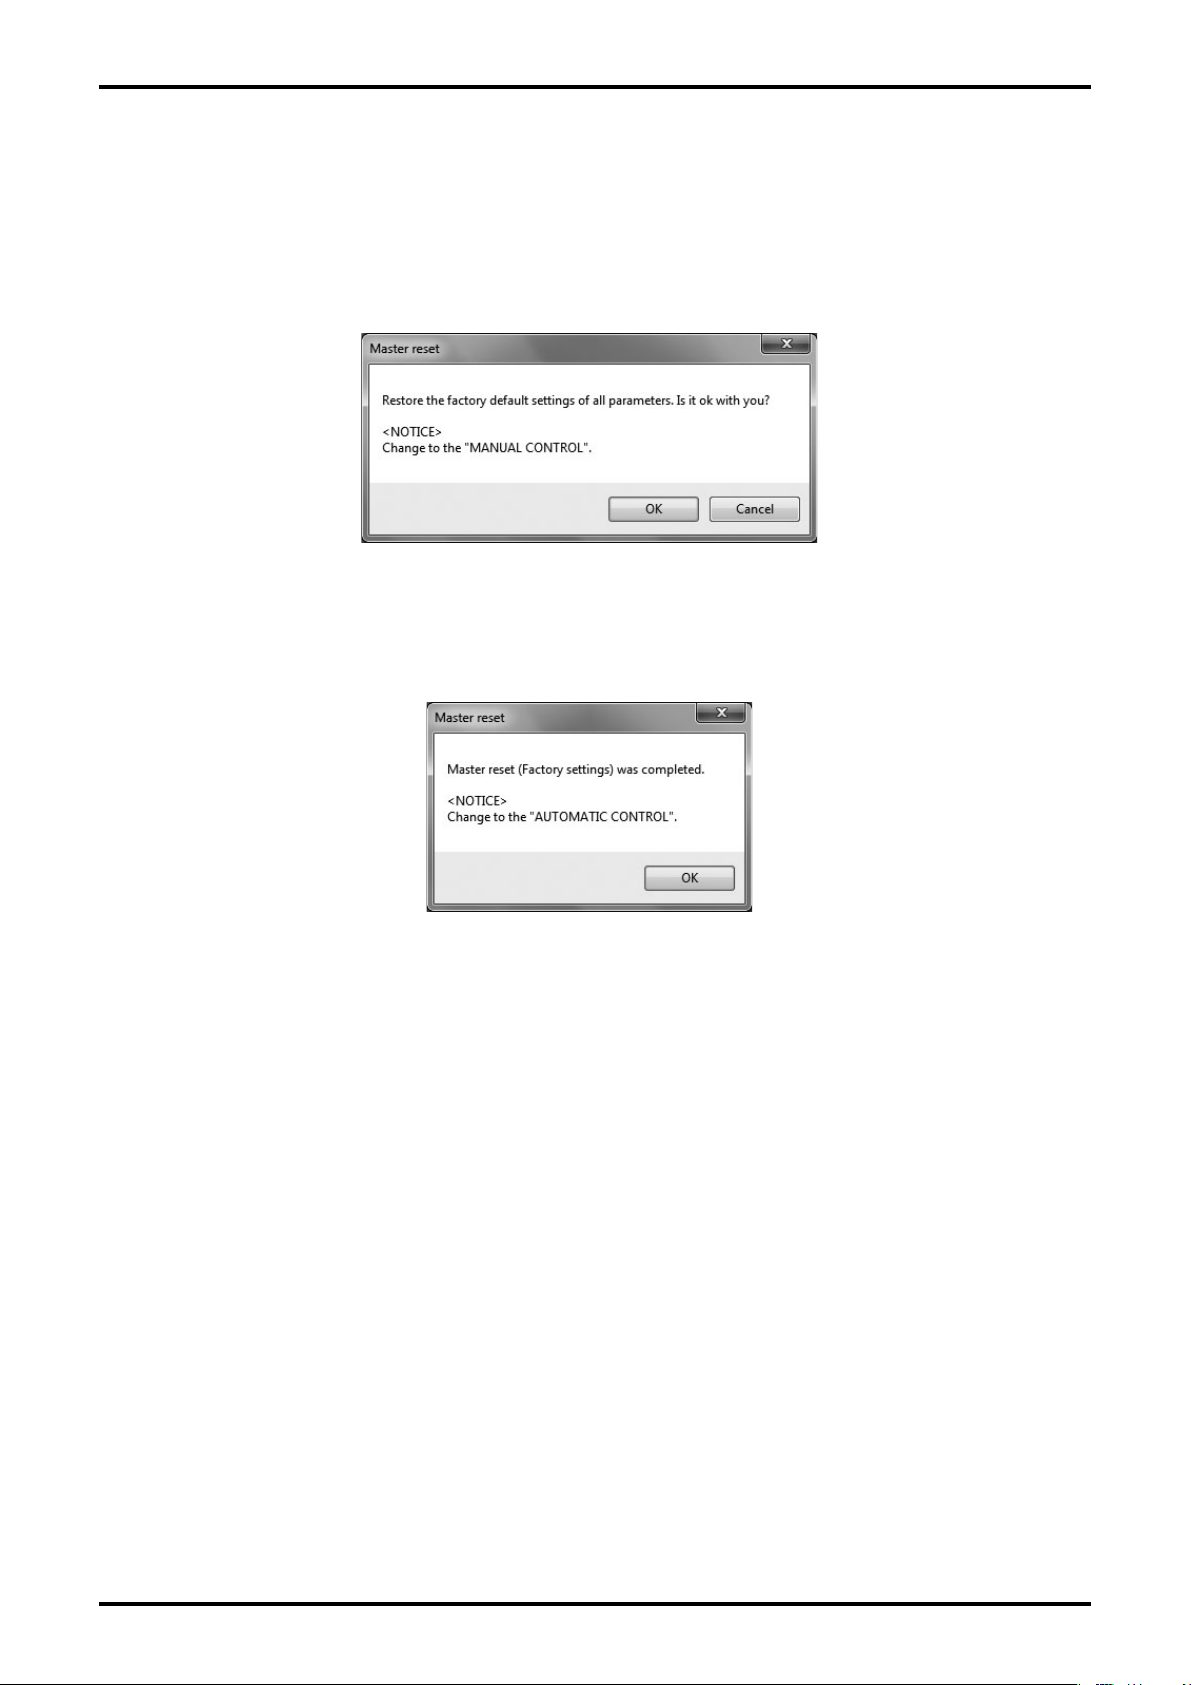
② To restore the parameters to the factory set values, click "OK" . The message box (Fig. 121) will be
displayed. Here, click "OK" . Then the operation is completed, and the changed setting values are
reected in the owmeter's output. If the owmeter's output is used to control valves or other such
parts as safety protocol, change the control loop to manual control so that the control loop cannot
be inuenced by the owmeter's output.
Fig.121
③ When the operation is nished, a message box (Fig. 122) will be displayed. Click "OK" to complete
the operation.
Fig.122
④ The window for setting items is displayed. To exit, click "Cancel" .
52
Page 53
3.9 Menu: Window (Window)
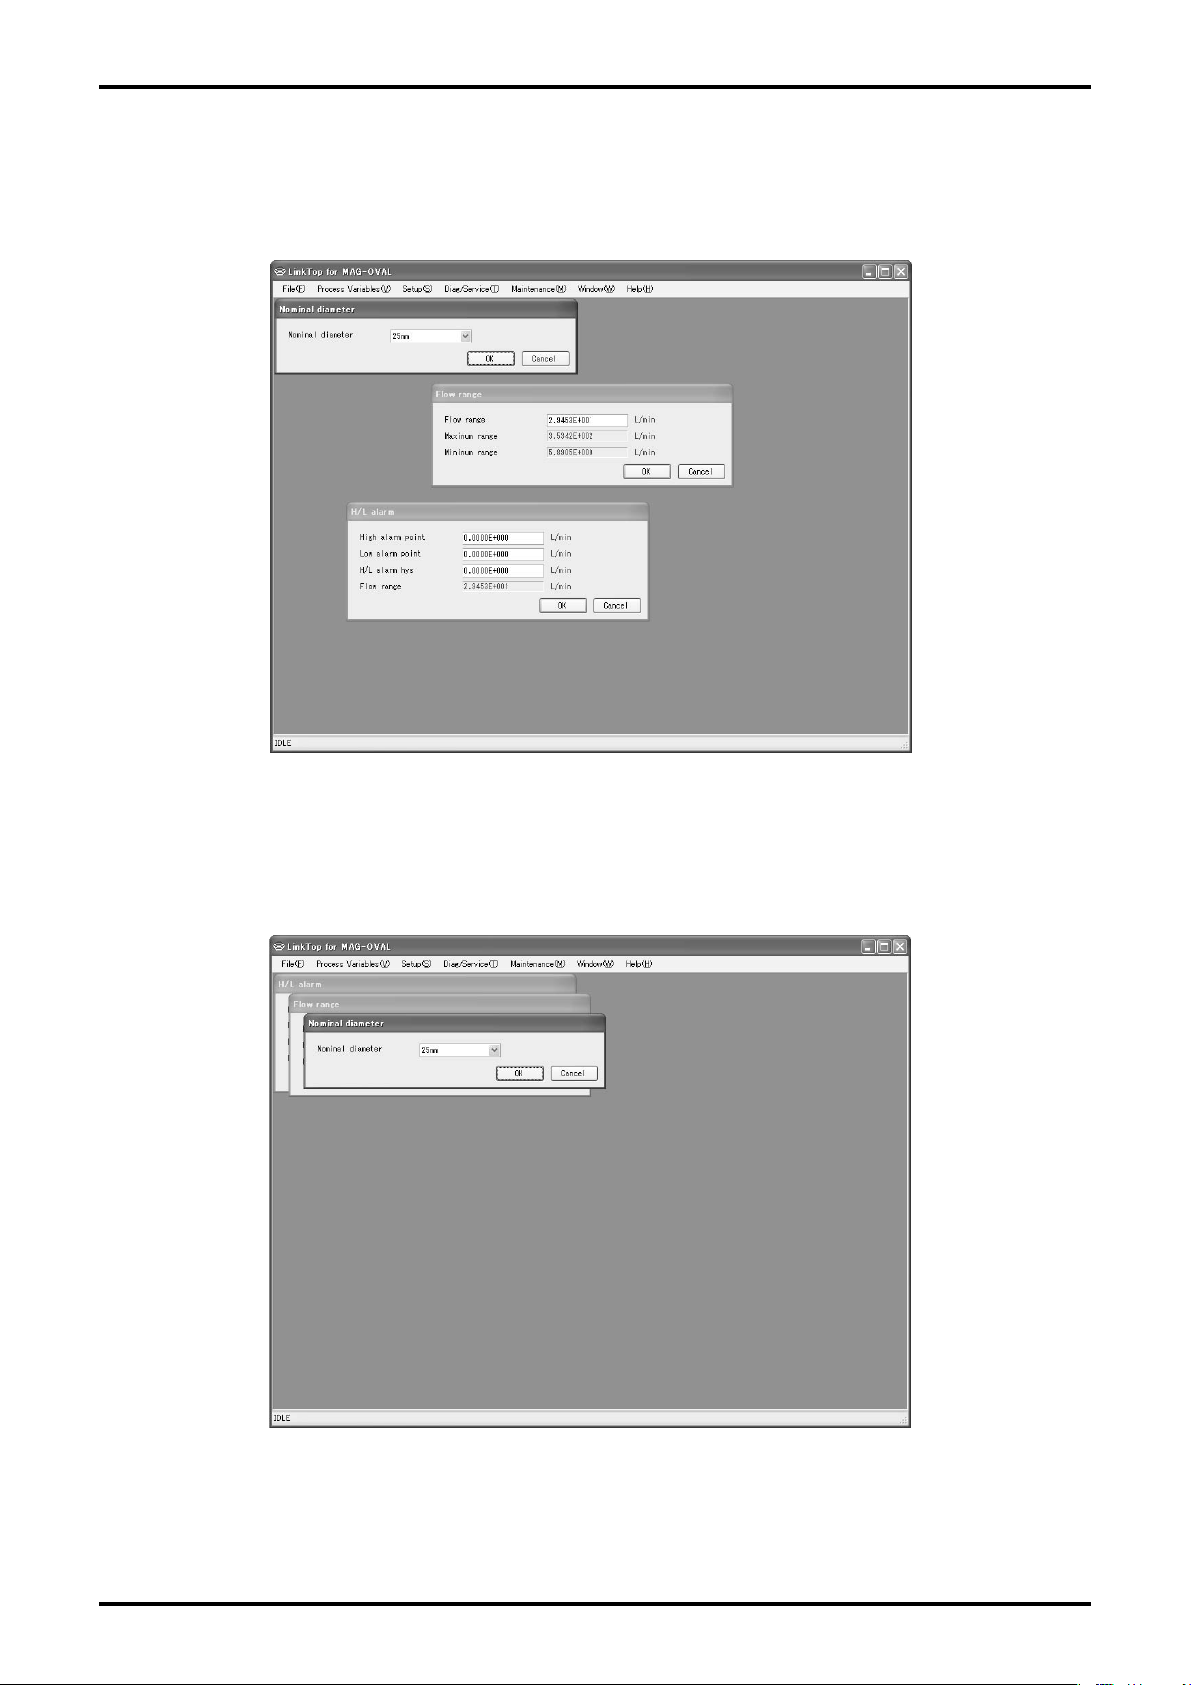
The "Window" menu can be used to arrange the currently displayed windows.
For instance, assume that multiple windows are being displayed, as shown in Fig. 123.
E-025-2-E
Fig.123
① Click "Window (W)" from the menu, and select "Cascade", then windows will be overlaid as shown
in Fig. 124.
Fig.124
5
Page 54
E-025-2-E
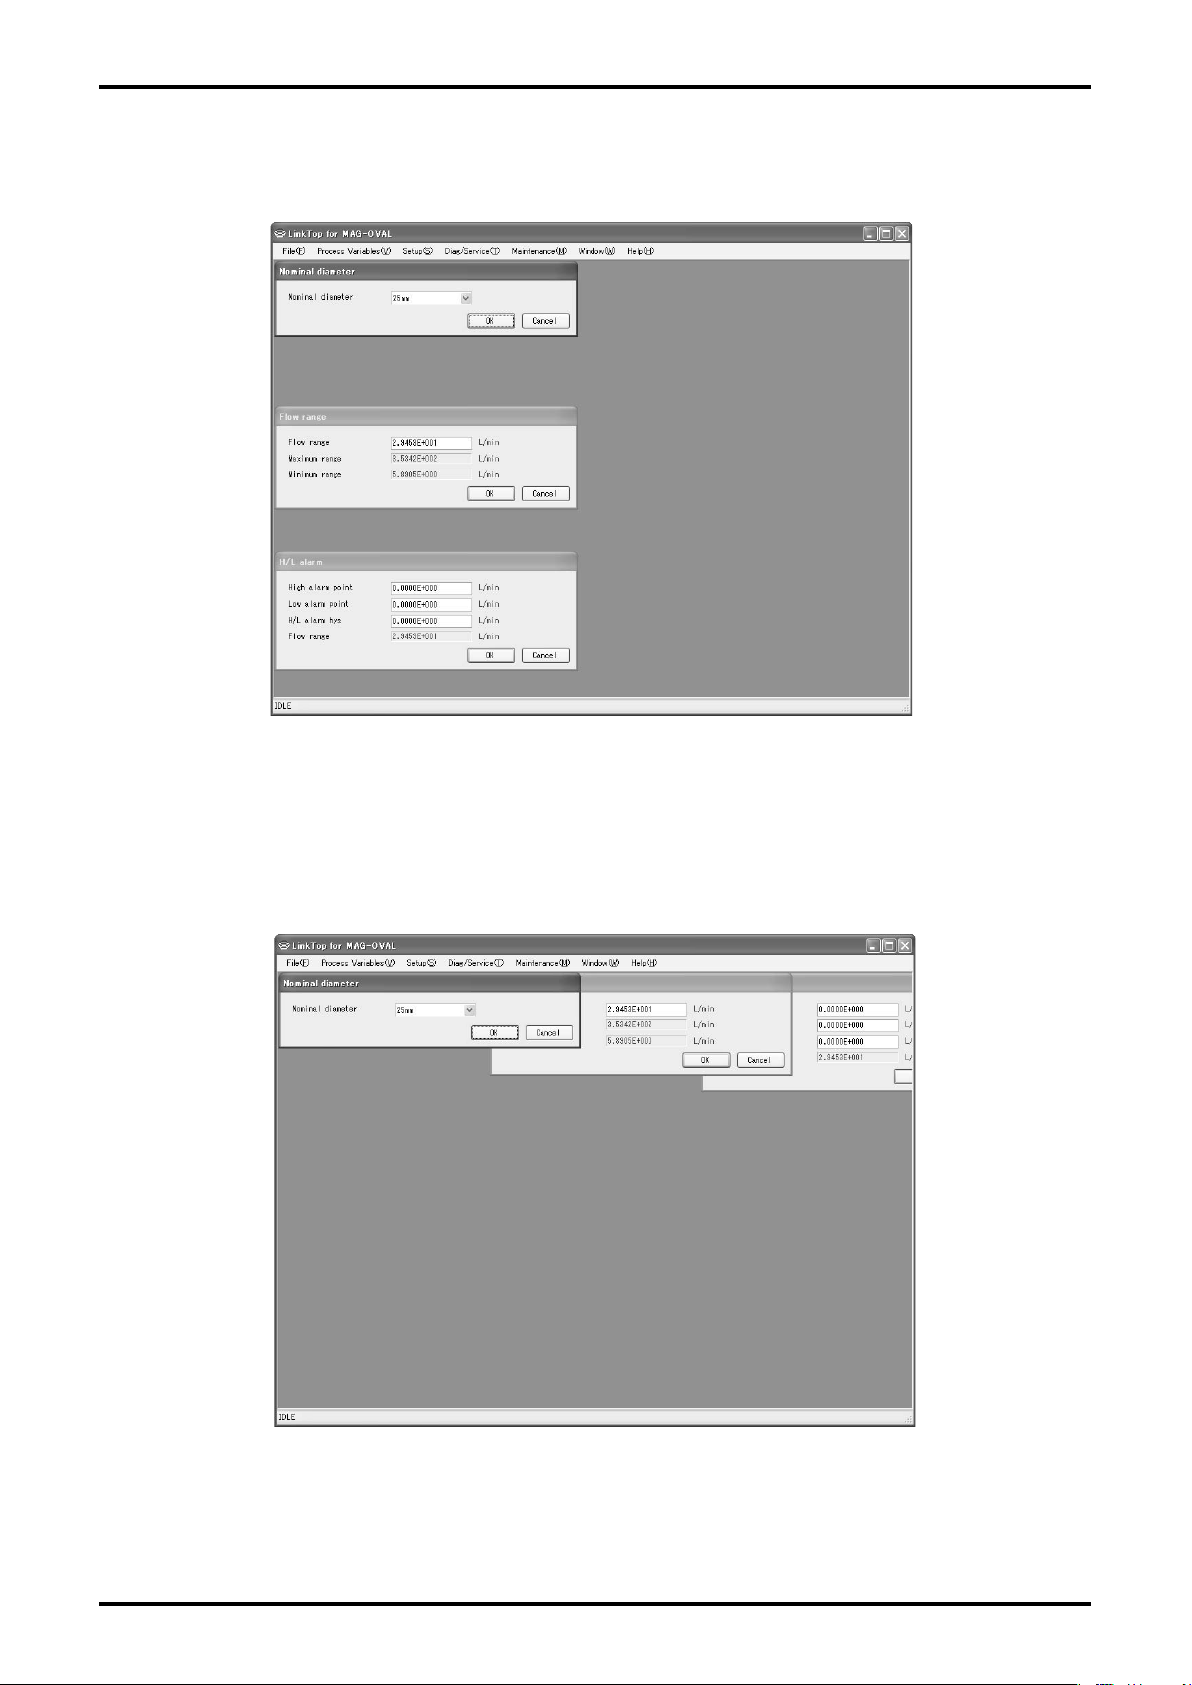
② Click "Window (W)" from the menu, and select "Tile Horizontal", then windows will be displayed as
shown in Fig. 125.
Fig.125
③ Click "Window (W)" from the menu, and select "Tile Vertical", then windows will be displayed
as shown in Fig. 126.
5
Fig.126
Page 55
E-025-2-E
3.10 Menu: File (File)
The "File" menu can be used to connect communications (refer to section "3.2 Starting LinkTop and
Connections"), to disconnect (refer to section "3.3 Terminating the Connection", and "3.4 Terminating
LinkTop), as well as to set ports, to create a owmeter transmitter parameter database, and print
parameters. This section describes the database and printing features.
3.10.1 Database
The various parameters, transmitter information, etc., that are inputted through the "Setup" menu
(described in section 3.6) are stored in a database. This can be saved on a hard disk, ash memory,
or other types of storage medium. Setting values can also be downloaded to the owmeter transmitter.
3.10.1.1 Opening Files
It is possible to load data from a saved le.
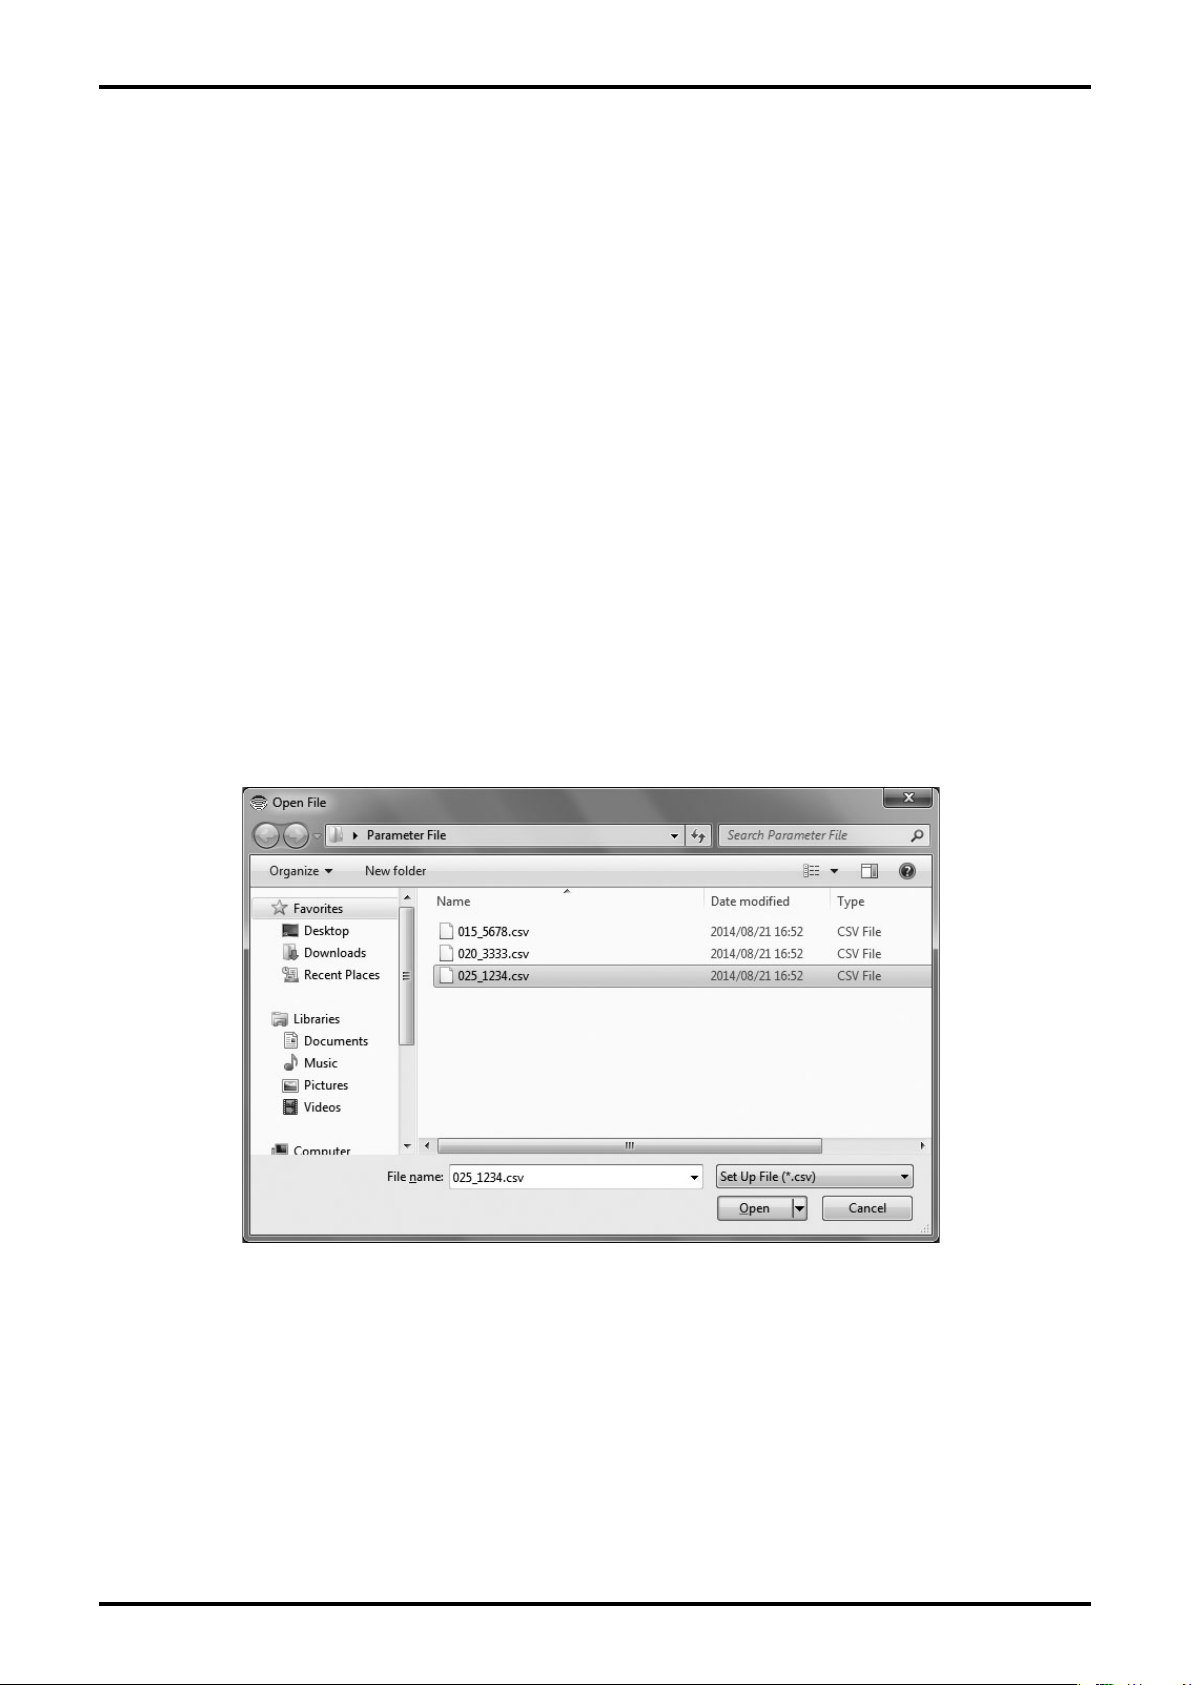
① Click "File (F)" from the menu, and select "Open File" from the list of "Database", then the
following dialog box (Fig. 127) will be displayed. Select the disk and folder where the relevant le
is stored and specify the le. Then click "Open (O)" .
Fig.127
② Data of the selected le is displayed on the print preview window of the Setting Parameter Table.
For printing, refer to "3.10.2 Printing".
55
Page 56
E-025-2-E
3.10.1.2 Saving Files
It is possible to save the data set in the owmeter transmitter to a le.
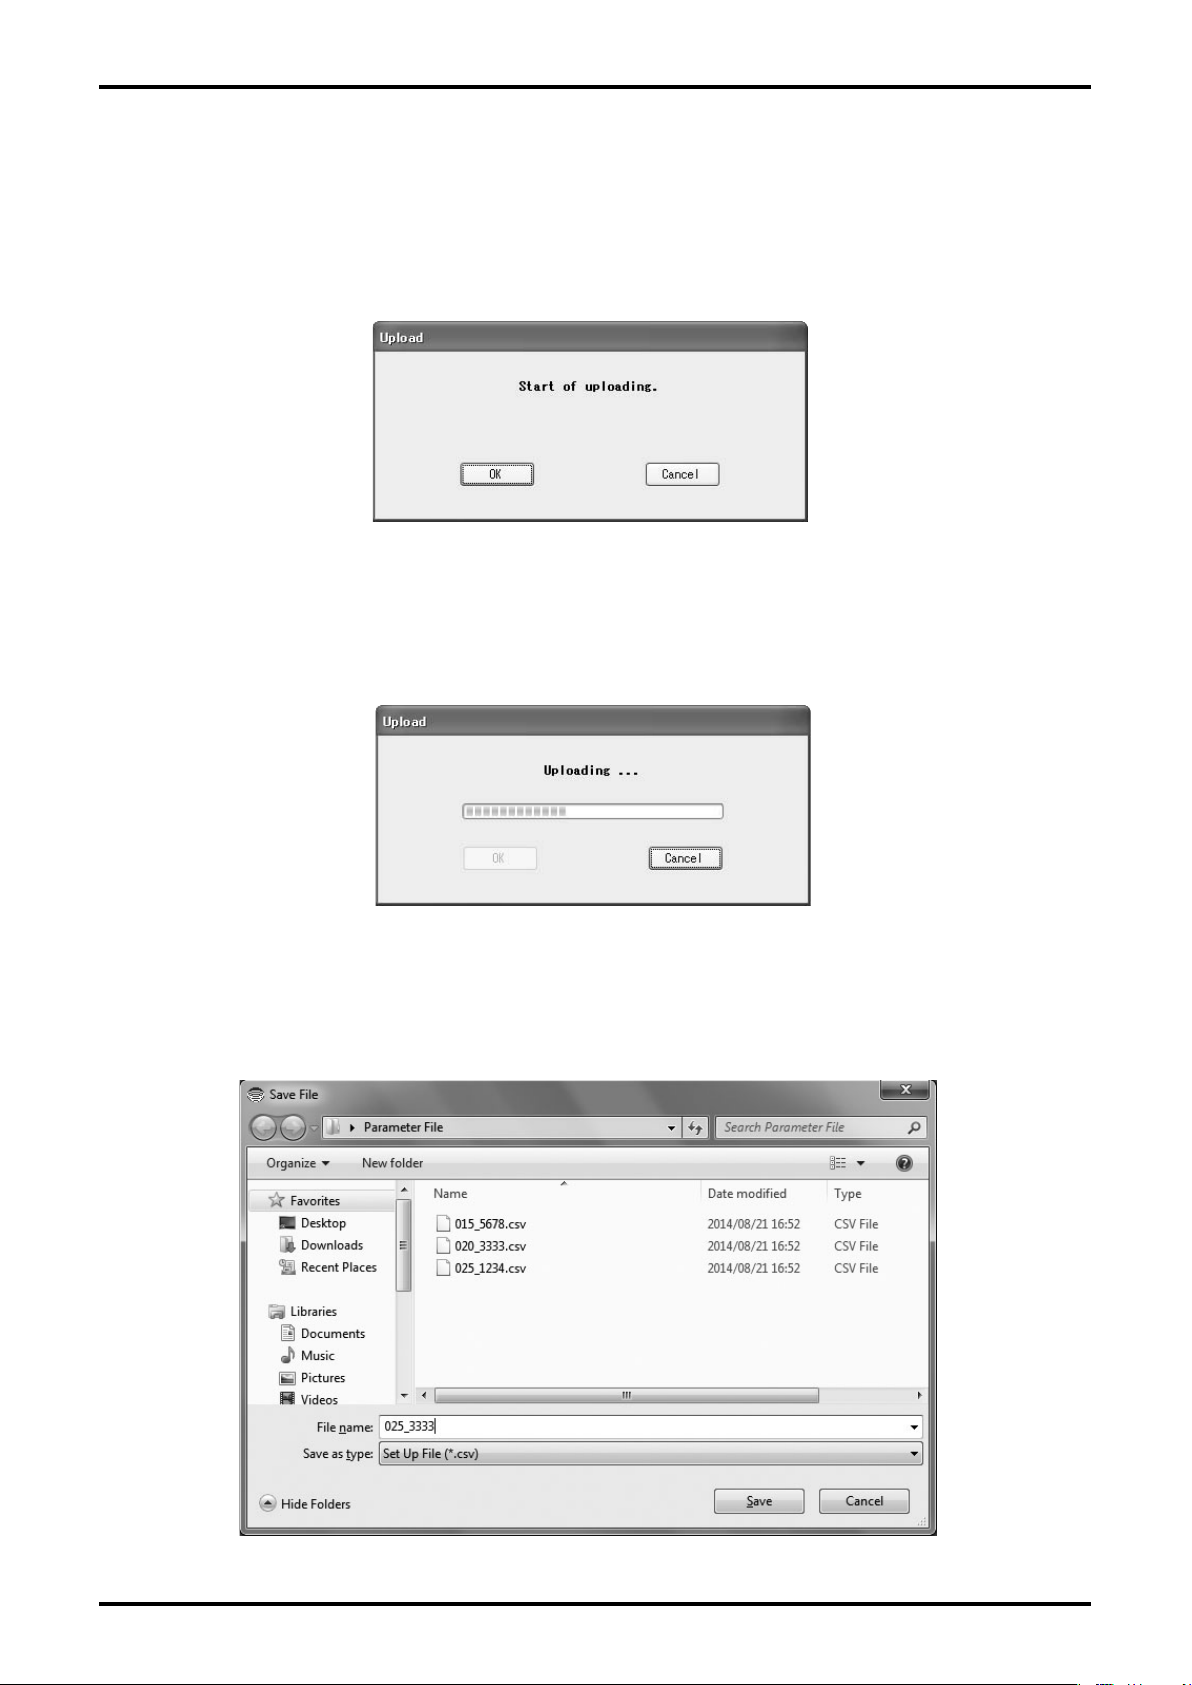
① Click "File (F)" from the menu, and select "Save File" from the list of "Database", then the following
window (Fig. 128) will be displayed.
Fig.128
② By clicking "OK", the data set in the transmitter begins to be uploaded. As shown in Fig. 129, you
can conrm the status of uploading process by the bar graph in the center of the message box.
Fig.129
③ When uploading is completed, the following dialog box (Fig. 130) will be displayed. Select the disk
and folder to save the le from the list and enter a le name. Then click "Save (S)" .
5
Fig.130
Page 57
E-025-2-E
3.10.1.3 Deleting Files
It is possible to delete data les that are no longer necessary.
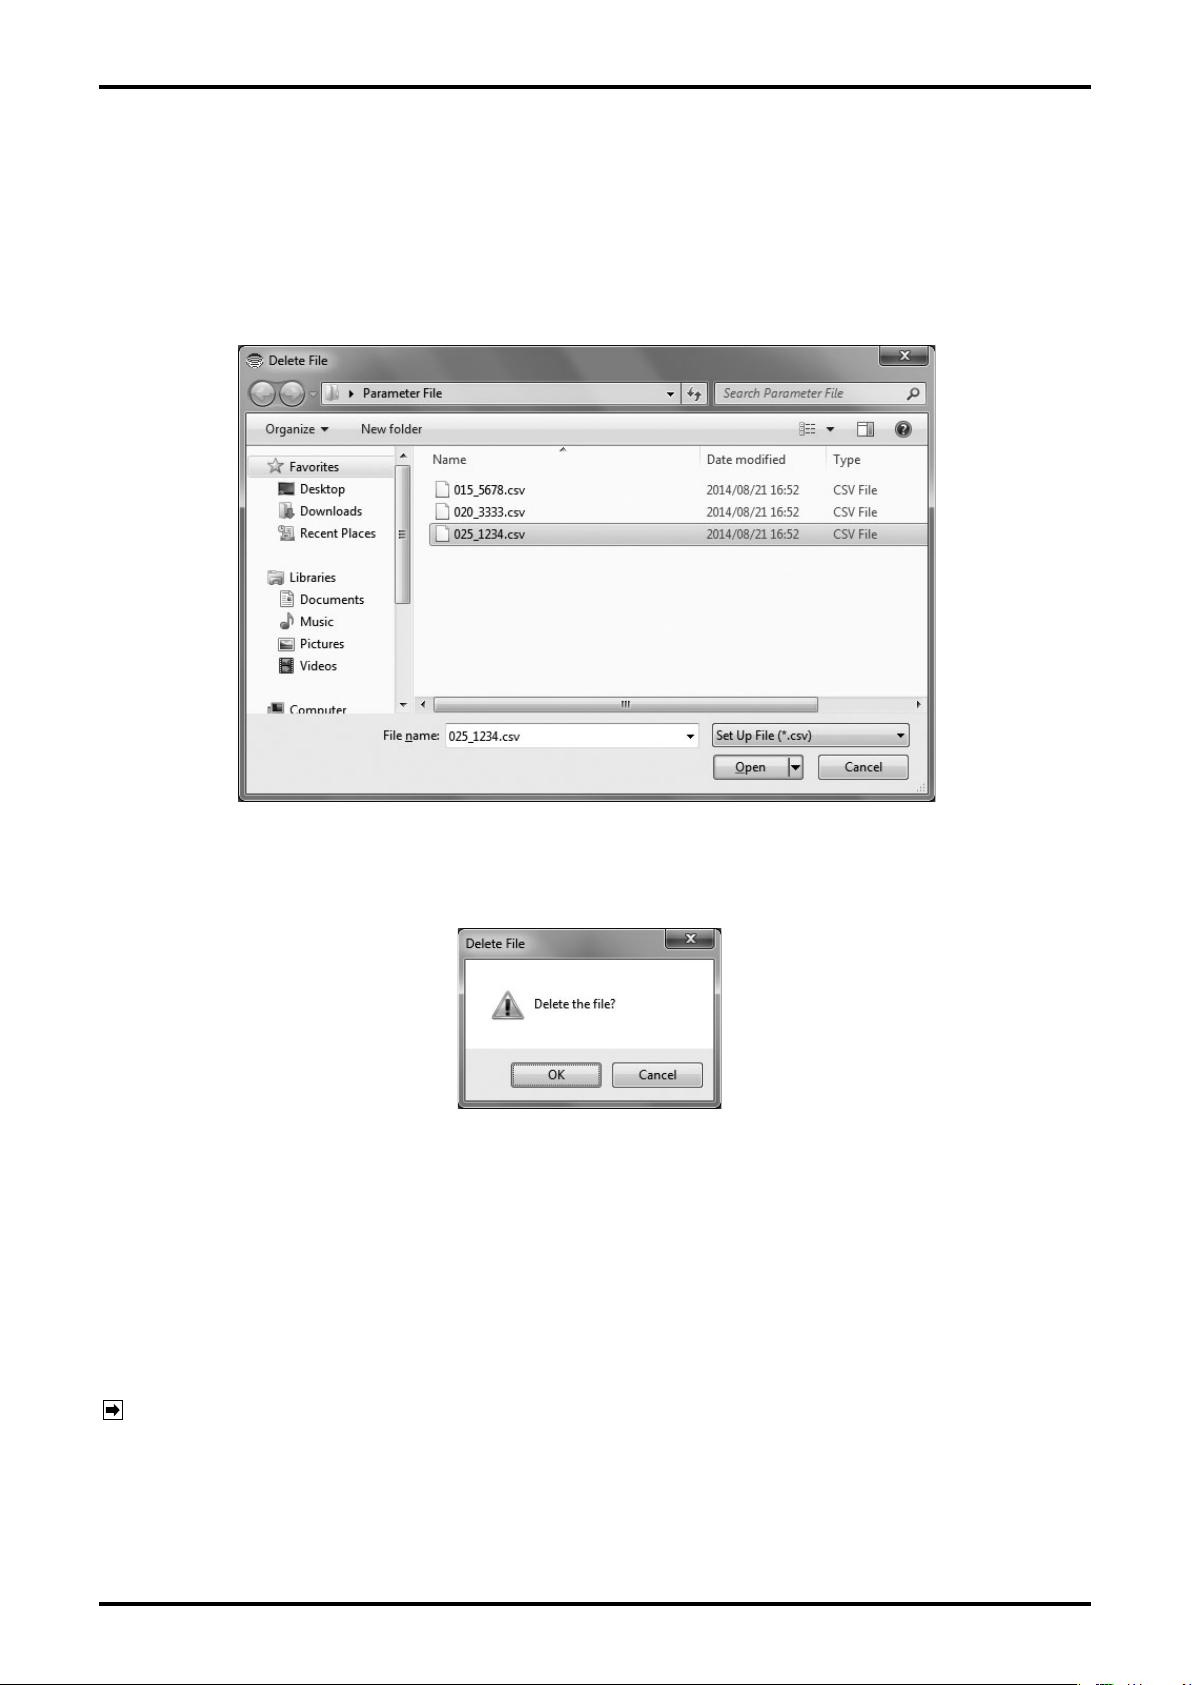
① Click "File (F)" from the menu, and select "Delete File" from the list of "Database", then the
following dialog box (Fig. 131) will be displayed. Select the disk and folder where the relevant le
is stored from the list and specify the le. Then click "Open (O)" .
Fig.131
② A message box (Fig. 132) will be displayed. Click "OK" to delete the le.
Fig.132
3.10.1.4 Downloading
This function is used to send all the parameters from a selected le to the owmeter transmitter.
This makes it possible to use the same parameters to set up another owmeter transmitter (to copy
settings).
However, rewritable parameters are limited to those related to the measuring condition or output.
Parameters specic to a transmitter, coecient (Basis coef 1 to Basis coef 8) used for calculation of
the reference ow, and data related to analog output adjustment (Trim Analog) cannot be overwritten.
NOTE: Parameters not overwritten: [Basis coef1 to 8] [Calibration Zero] [Calibration Factor] [Device ID]
[Sensor Serial No.] [Final Assembly No.] [Hardware rev] [Password Option] [Setting Password]
[Polling Address] [RS485 Baudrate] [4mA adjust value] [20mA adjust value]
Before executing downloading, conrm the parameter currently set to the owmeter and make sure
the owmeter is the one suitable for this operation.
5
Page 58
E-025-2-E
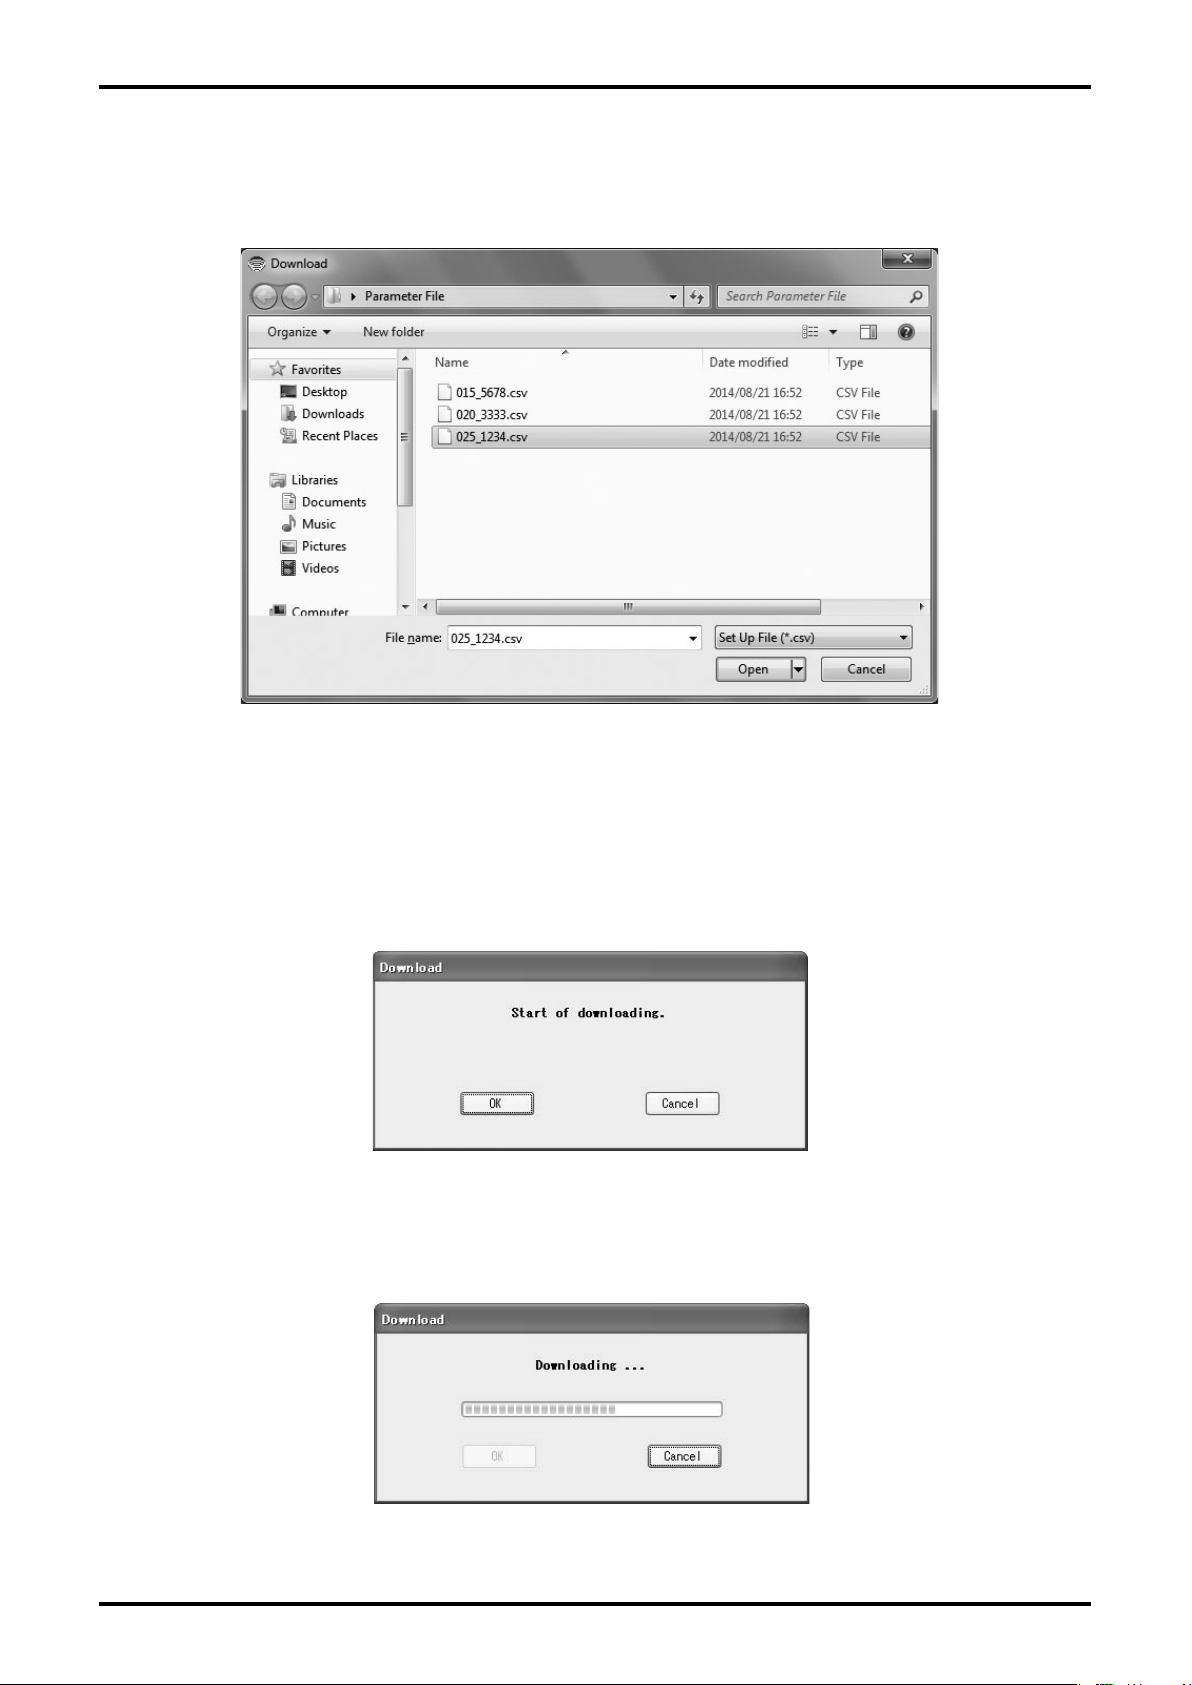
① Click "File (F)" from the menu, and select "Download" from the list of "Database", then the
following dialog box (Fig. 131) will be displayed. Select the disk and folder where the relevant le
is stored and specify the le. Then click "Open (O)" .
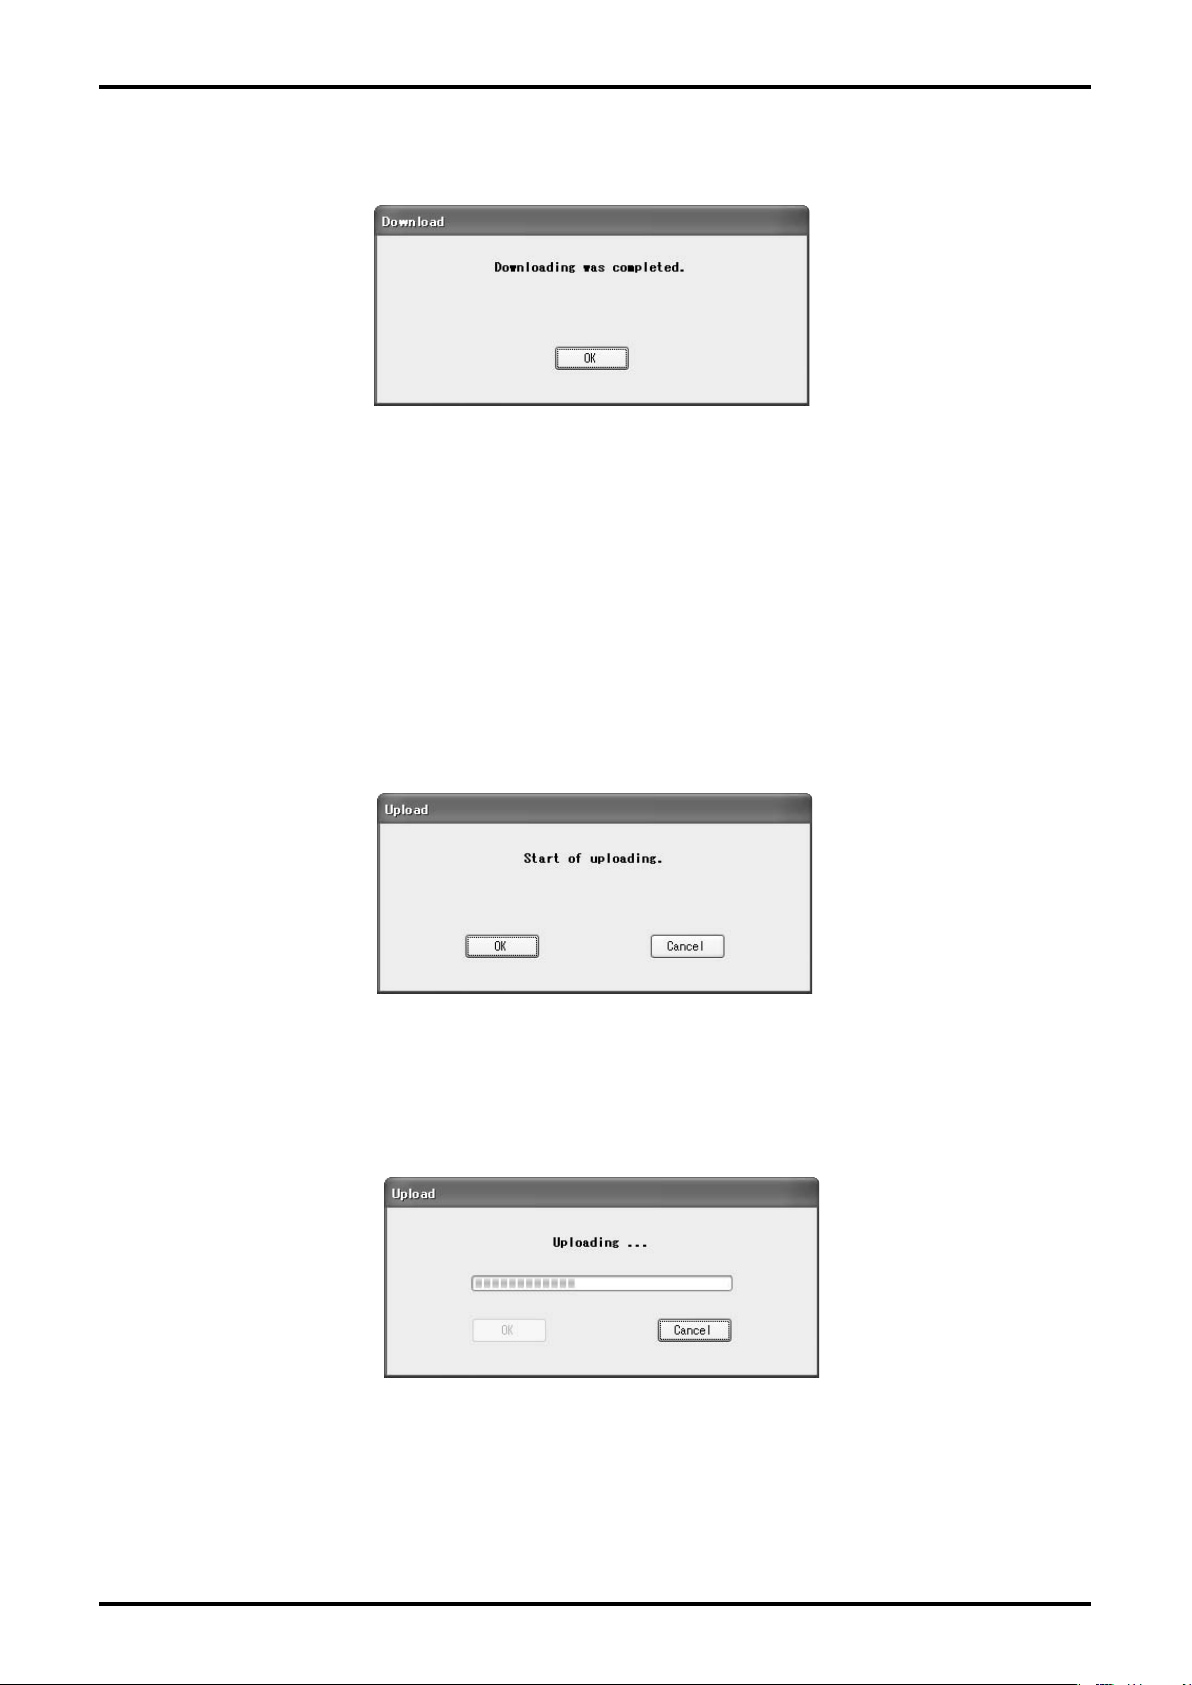
Fig.133
② A message box (Fig. 134) will be displayed. Click "OK" to start downloading.
When data is downloaded, various set values are changed and the output value from the owmeter
is also changed. If valves are controlled by the output of the owmeter, change the control loop to
manual control for the sake of safety, so that the control loop may not be aected by the output of
the owmeter.
Fig.134
③ As shown in Fig. 135, you can conrm the status of downloading process by the bar graph in the
center of the message box.
5
Fig.135
Page 59
E-025-2-E
④ Once the download is completed, a message box (Fig. 136) will be displayed. Click "OK" .
Fig.136
⑤ Connect the flowmeter to the transmitter in the procedure given in "3.2 Starting LinkTop and
Connections".
3.10.2 Printing
It is possible to print a table of the transmitter's setting parameters.
① When the owmeter is connected to the transmitter, click "File (F)" from the menu, and select "Print (P)",
and the following window (Fig. 137) will be displayed.
Fig.137
② By clicking "OK", the data set in the transmitter begins to be uploaded. As shown in Fig. 138, you can
conrm the status of reading process by the bar graph in the center of the message box.
Fig.138
5
Page 60
E-025-2-E
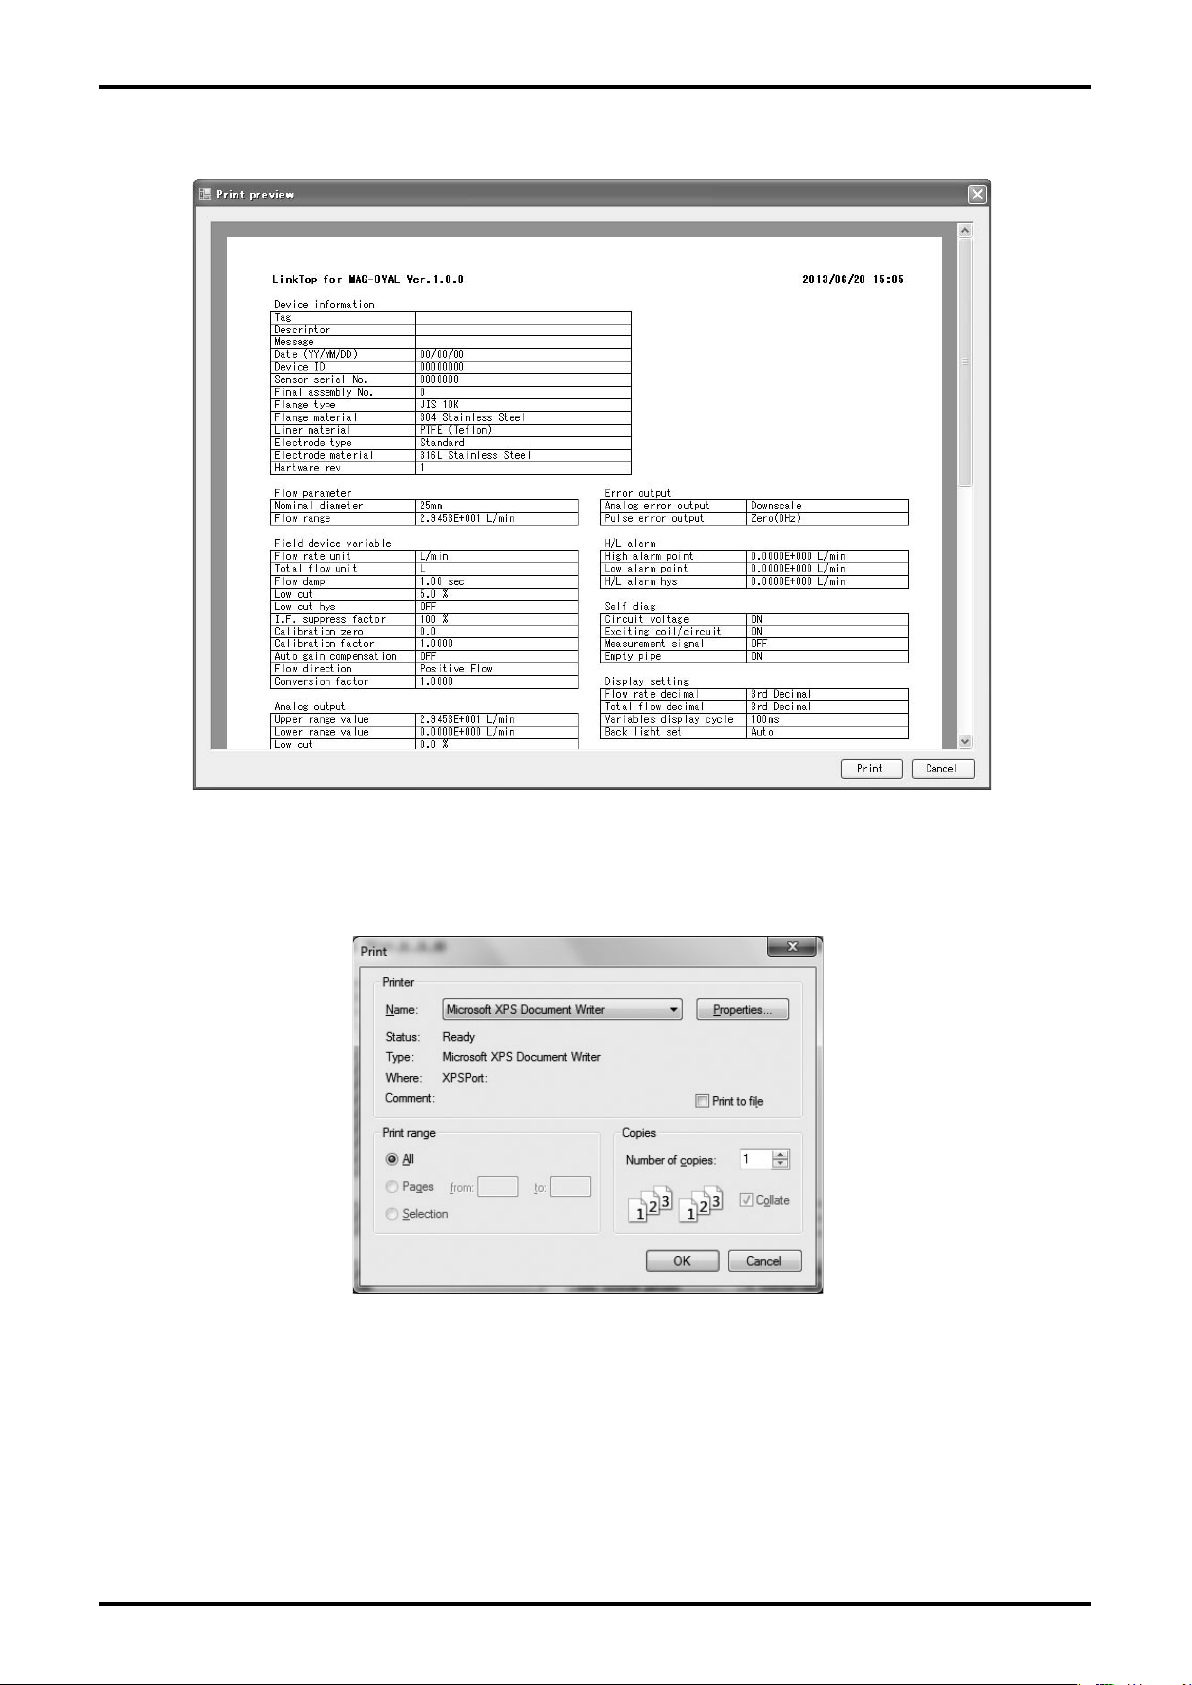
③ When reading is completed, the print preview window will be displayed as Fig. 139.
Fig.139
④ By clicking "Print", a dialog box for print setting (Fig. 140) will be displayed.
Fig.140
0
Page 61
E-025-2-E
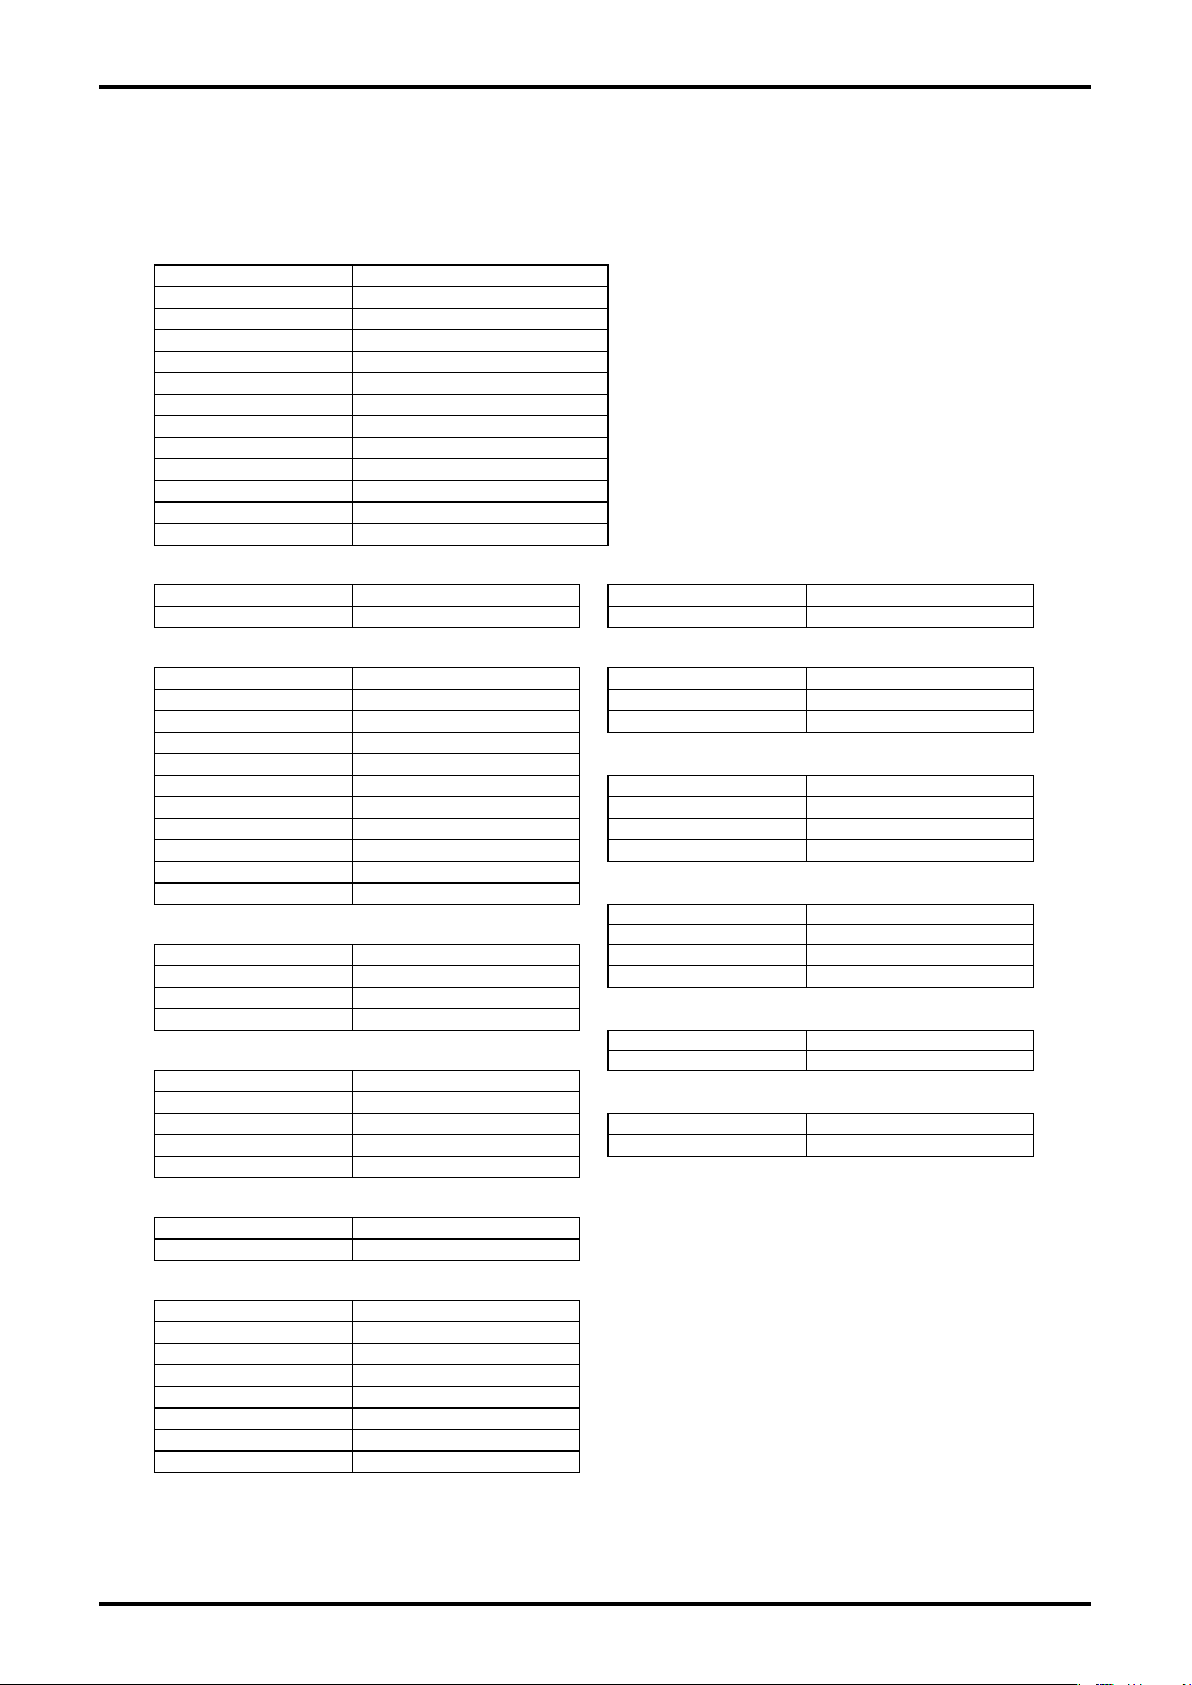
⑤ Enter the setting as necessary and click "OK". An image as shown in Fig. 141 will be printed on a
sheet of A4-size paper.
LinkTop for MAG-OVAL Ver.1.0.3
Device information
Tag
Descriptor
Message
Date (YY/MM/DD) 00/00/00
Device ID 1
Sensor serial No. 0
Final assembly No. 0
Flange type JIS 10K
Flange material 304 Stainless Steel
Liner material PTFE
Electrode type Standard
Electrode material 316L Stainless Steel
Hardware rev 1
Flow parameter
Nominal diameter 25mm Analog error output Downscale
Flow renge 2.9453E+001 L/min Pulse error output Zero (0Hz)
Field device variable
Flow rate unit L/min High alarm point 0.0000E+000 L/min
Total ow unit L Low alarm point 0.0000E+000 L/min
Flow damp 0.50 sec H/L alarm hys 0.0000E+000 L/min
Low cut 0.5 %
Low cut hys OFF
I.F. suppress factor 100 % Circuit voltage ON
Calibration zero 0.0 Exciting coil/circuit ON
Calibration factor 1.000 Measurement signal OFF
Auto gain compensation OFF Empty pipe ON
Flow direction Positive Flow
Conversion factor 1.0000
Analog output
Upper range value 2.9453E+001 L/min Variables display cycle 500ms
Lower range value 0.0000E+0001 L/min Back light set ON
Analog low cut 0.0 %
Analog damp 0.0 sec
Pulse output
Pulse operation mode Weight
Freq factor 1.0000E+003 Hz
Rate factor 2.9453E+001 L/min 4mA adjust value 3210
Pulse low cut 0.0 % 20mA adjust value 16064
Pulse weight 1.0000E+001 L
Error output
H/L alarm
Self diag
Display setting
Flow rate decimal 1st Decimal
Total ow decimal 1st Decimal
Security
Password option OFF
Setting password 0000
Trim Analog
Status output
Status output function No Function
Status output mode On Active
Status select
Overow error OFF
Hardware failure OFF
Parameter alarm OFF
Saturated alarm OFF
Measurement signal alarm OFF
Empty pipe alarm OFF
Fixed output OFF
Self diag in progress OFF
Fig. 141
Page 62
E-025-2-E
3.11 Troubleshooting
3.11.1 If There is No Response
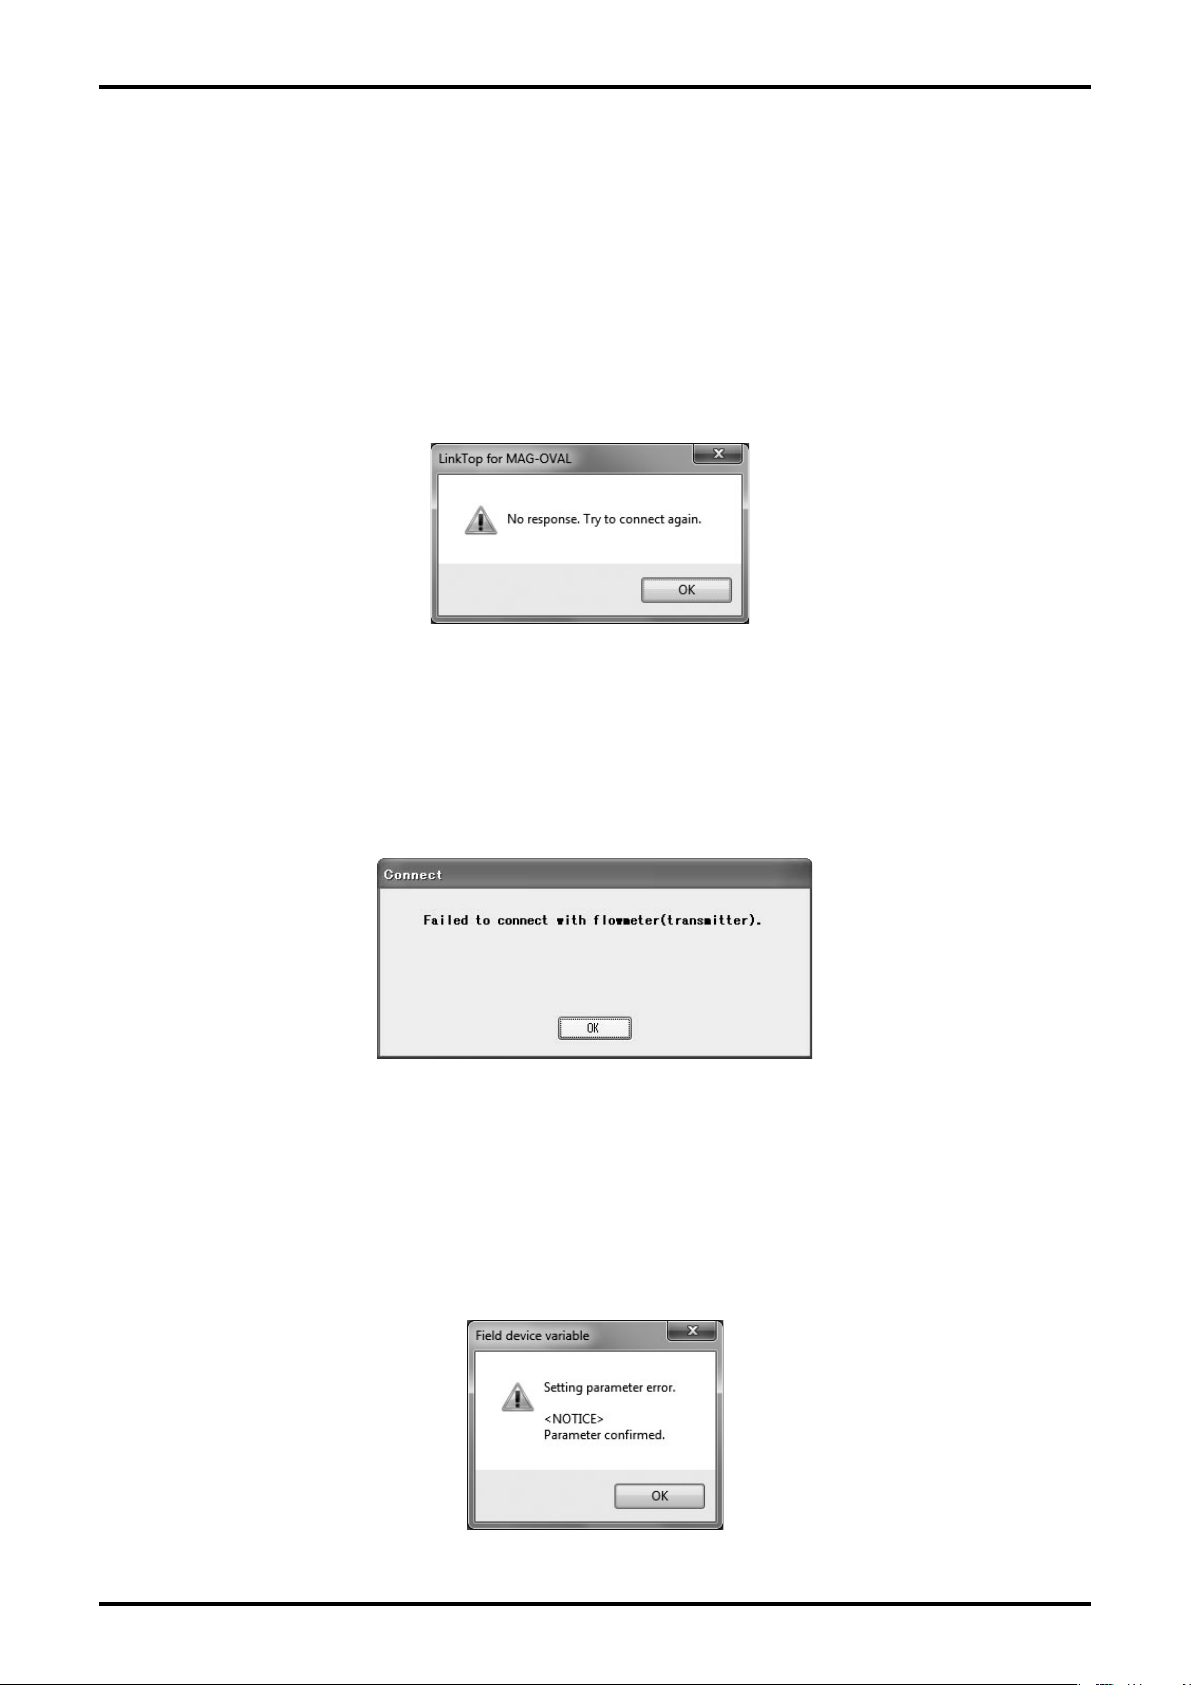
If there is a problem preventing communication between the PC and owmeter when the owmeter is
connected as described in section "3.2 Starting LinkTop and Connections", or while this application
is being used, then a message box will appear as shown in Fig. 142. Click "OK" if this happens,
then verify the following and try reconnecting as described in section "3.2 Starting LinkTop and
Connections":
- Is the communication interface's probe or PC disconnected?
- Is the owmeter transmitter receiving power?
Fig.142
3.11.2 If It is Not Possible to Connect to the Flowmeter
When connecting the flowmeter to the transmitter in "3.2 Starting LinkTop and Connections", a
message box in Fig. 143 will be displayed if the flowmeter transmitter is not supported by this
application software. In this case, click "OK" and make sure the connected owmeter transmitter
meets this application.
Fig.143
3.11.3 Input Errors
If invalid values are inputted during "3.6 Menu: Setup (Settings)" or "3.7 Menu: Diag/Service (Checking
and Adjustment)", an error will be displayed.
① If the entered data cannot be identied as a numeric value or the required items are left blank, an
error message box similar to Fig. 144 will be displayed. Click "OK" and correct the relevant data.
2
Fig.144
Page 63
E-025-2-E
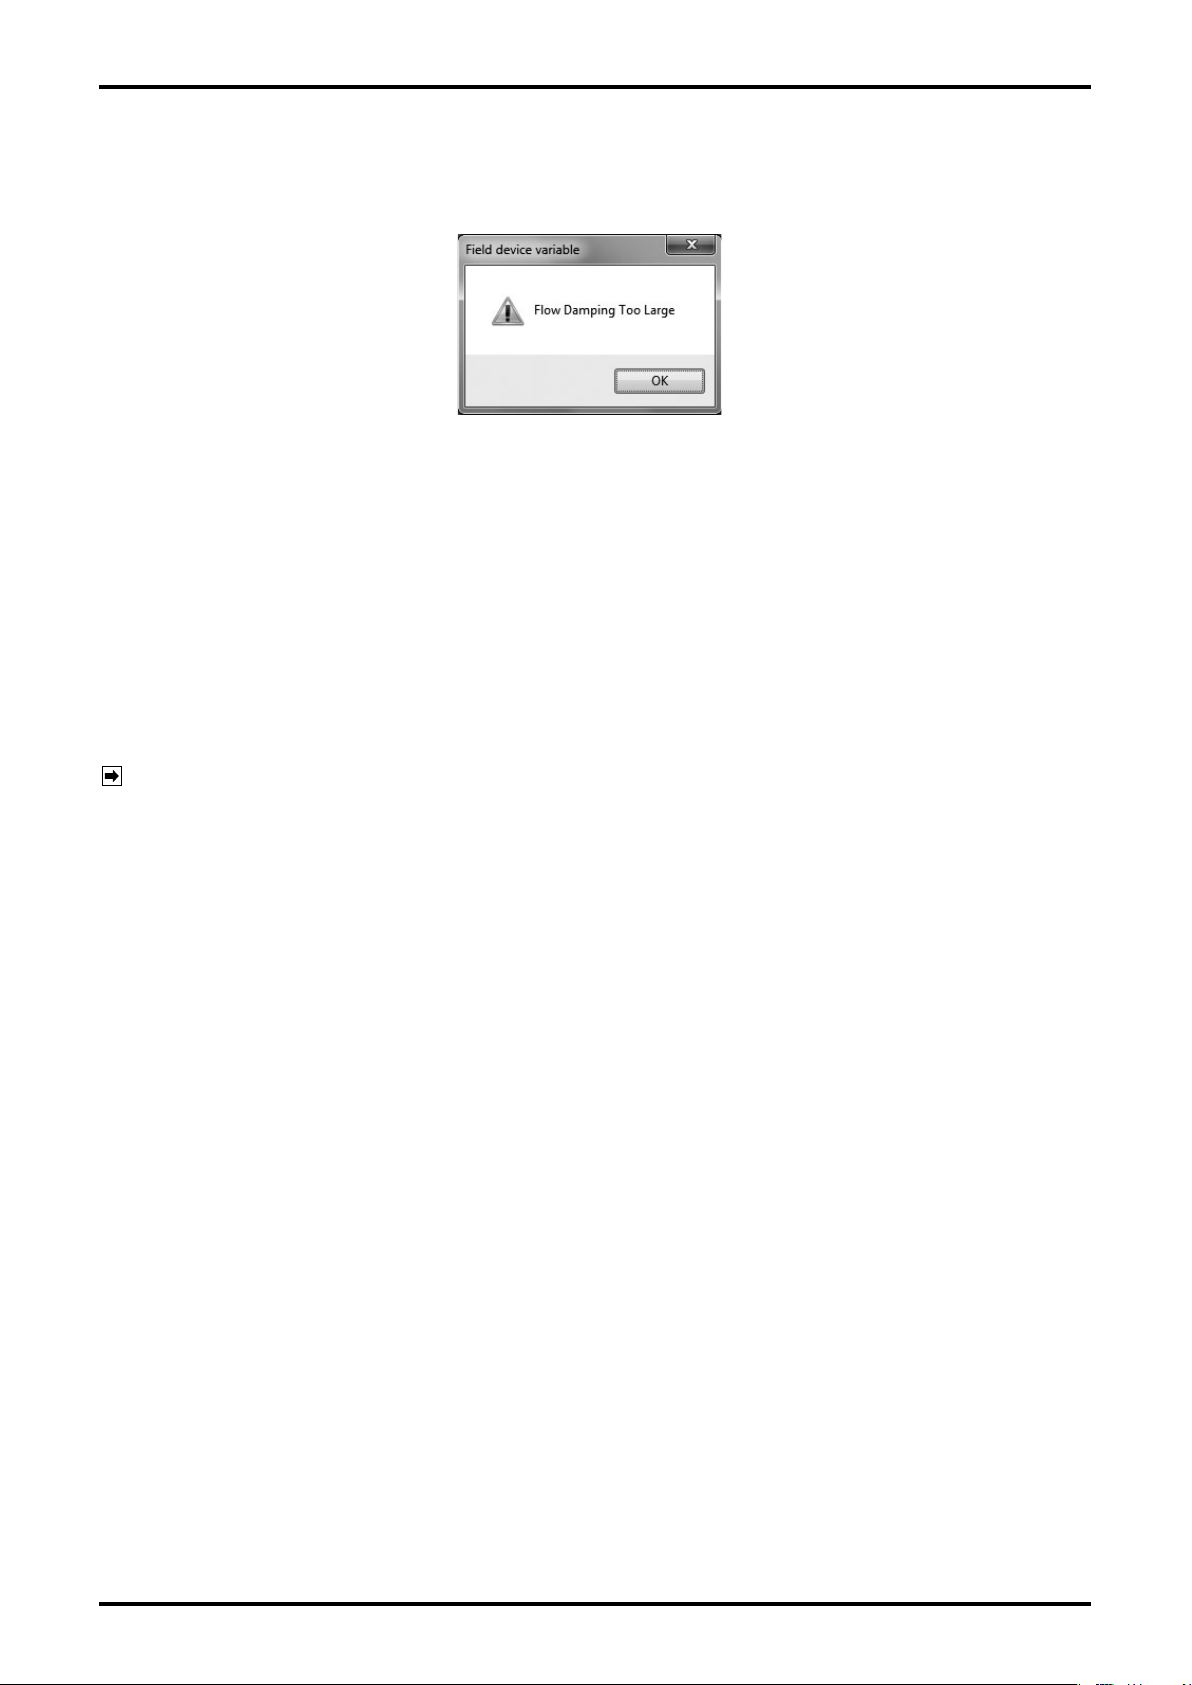
② When the transmitter detects invalid data is inputted, an error message box similar to Fig. 145 will
be displayed. Click "OK" and correct the relevant data.
Fig.145
3.11.4 Error/Alarm, Status List
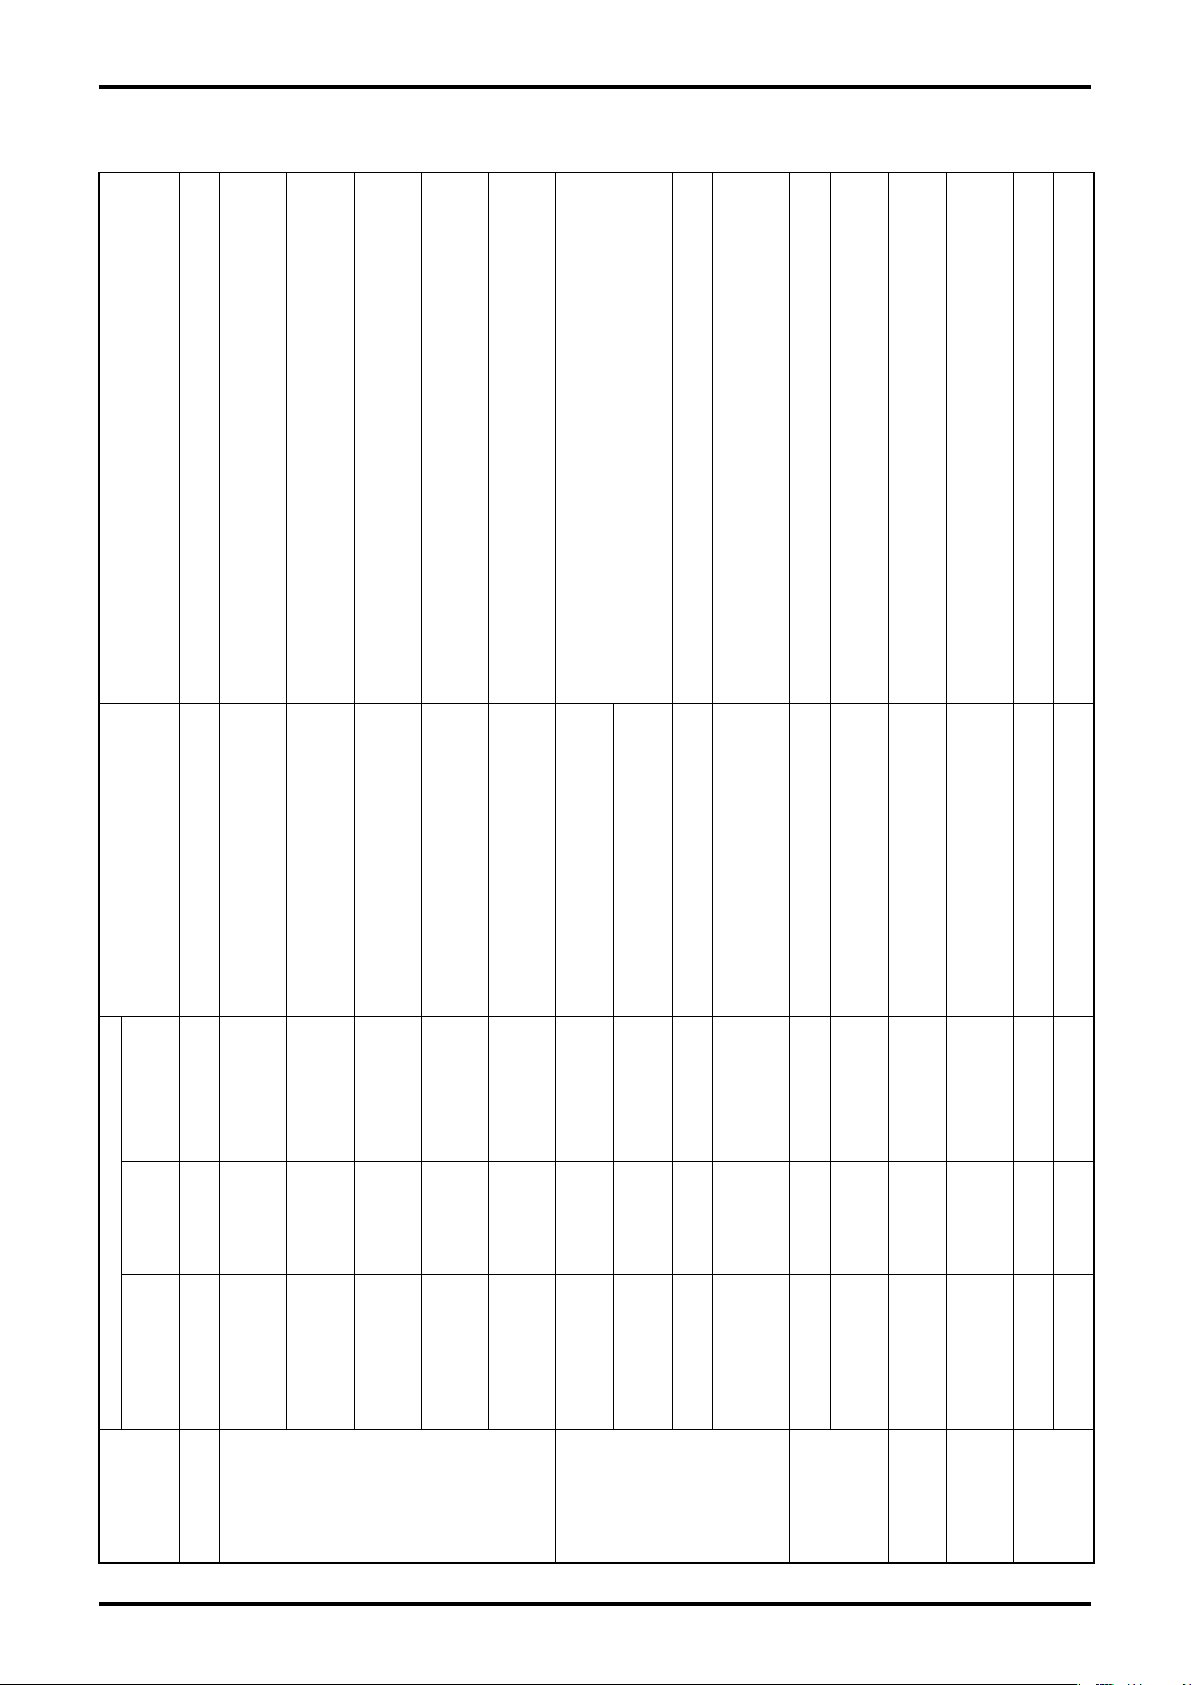
3.11.4.1 Error/Alarm
If any error/alarm occurs, the following message or code appears on the "Process Variables" screen
of LinkTop or the LCD display of the transmitter. Execute the countermeasures on the next page.
When error/alarm is cleared, the message will disappear.
NOTES: 1. Error is a state where ow measurement is not carried out normally due to improper
setting or occurrence of a signicant problem.
2. Alarm is a state where measurement is conducted but output or display is not
carried out normally.
Page 64
E-025-2-E
Error/Alarm List
Adjust the ow so that percent ow is less than 110% or
increase the measurement range setting value.
Disconnection of exciting coil or transmitter failure.
Contact OVAL representative you purchased the product or your
nearest OVAL sales oce or service center.
Description Cause and Countermeasure
Flow is exceeding 110% of
measurement range.
Exciting coil of sensor or exciting
circuit of transmitter is faulty.
Error/alarm
on transmitter
code displayed
Message
transmitter
displayed on
CoiL.Cir Er-21
Writing data to FRAM (memory) is faulty or some parts are damaged.
If the error is not cleared by rebooting the transmitter, contact
OVAL representative you purchased the product or your
nearest OVAL sales oce or service center.
Data communication between built-in CPUs is faulty or faulty parts.
If the error is not cleared by rebooting the transmitter, contact OVAL
representative you purchased the product or your nearest OVAL
sales oce or service center.
Sensor or transmitter is faulty.
If the error is not cleared by rebooting the transmitter, contact
OVAL representative you purchased the product or your
nearest OVAL sales oce or service center.
Transmitter failure.
If the error is not cleared by rebooting the transmitter, contact OVAL
representative you purchased the product or your nearest OVAL
sales oce or service center.
Writing data in FRAM (memory)
is not executed normally.
Internal data is not updating
normally.
Compensation reference value
of transmitter amplier is not
appropriate and normal ow
calculation is not available.
Voltage in transmitter circuit is
abnormal.
Parameter setting value of
input measurement range is not
dAtA.updt Er-23
HArd.Ap Er-24
Cir.voLt Er-25
SEt.FL.Hi AL-31
Set the measurement range within 0.5 to 10m/s when
converted to ow velocity.
(exceeding the upper limit).
appropriate
Set the upper and lower limits of analog output so that analog output
is below measurement range and more than minimum span.
• Set alarm upper limit to be less than measurement range setting.
• Set alarm lower limit to be less than alarm upper limit setting.
• Set hysteresis value to be equal to or smaller than the dierence
between alarm upper limit setting and alarm lower limit setting.
Parameter setting value of input
measurement range is not appropriate
(below the lower limit).
Upper/lower alarm setting for entered analog
output is not appropriate (exceeding the limit).
Entered alarm setting value is not
appropriated (exceeding the limit).
Set.A.Out AL-33
Set.AL.Ar AL-34
Set.FL.Lo AL-32
Adjust the ow so that analog output is in the range of 4 to
20mA, or change the upper and lower limits.
Adjust the ow so that pulse output frequency is 10kHz
or less, or change the pulse weight or frequency factor to
appropriate values.
In this state, transmitter measurement signal failure is
occurring. Verify that owmeter is connected correctly or
check for any foreign matter on the electrode of sensor.
Bleed air from the measurement pipe and keep the pipe fully
lled with liquid.
Adjust the ow so that it is less than High Alarm Point setting
or increase the setting value of High Alarm Point setting.
Adjust the ow so that it is greater than Low Alarm Point setting or
increase the setting value of Low Alarm Point setting.
Analog output reaches lower limit
of 2.4mA or upper limit of 21.6mA
Pulse output frequency reaches the
upper limit of 11kHz
Transmitter measurement signal is abnormal.
(State where voltages at TP1 and TP2 are
abnormal)
Measurement pipe is not
completely lled with liquid.
A.Out.Satu AL-41
P.Out.Satu AL-42
SiG.QuAL AL-43
E.PiPE AL-44
Fr.Hi AL-45 High alarm is occurring.
Fr.Lo AL-46 Low alarm is occurring.
Name of error/alarm
LinkTop
Message
displayed on
Category
Error/Alarm
Overow Error Overow Error OvEr.Flo Er-11
Exciting Coil/
Circuit Error
FRAM Error PArA.FrA Er-22
Data Update
Error
Hardware
Failure
Amplier
Hardware Error
Circuit Voltage
Error
Flow Range Set
Too High Alarm
Flow Range Set
Too Low Alarm
Parameter
Analog Set
Alarm
Alarm
H/L Alarm Point
Set Alarm
Analog Output
Saturated
Pulse Output
Saturated
Saturated
Alarm
Measurement
Signal Alarm
Empty Pipe
Measurement
Signal Alarm
Empty Pipe
Alarm
Alarm
High Alarm
Occurring
Low Alarm
H/L Alarm
Occurring
Page 65
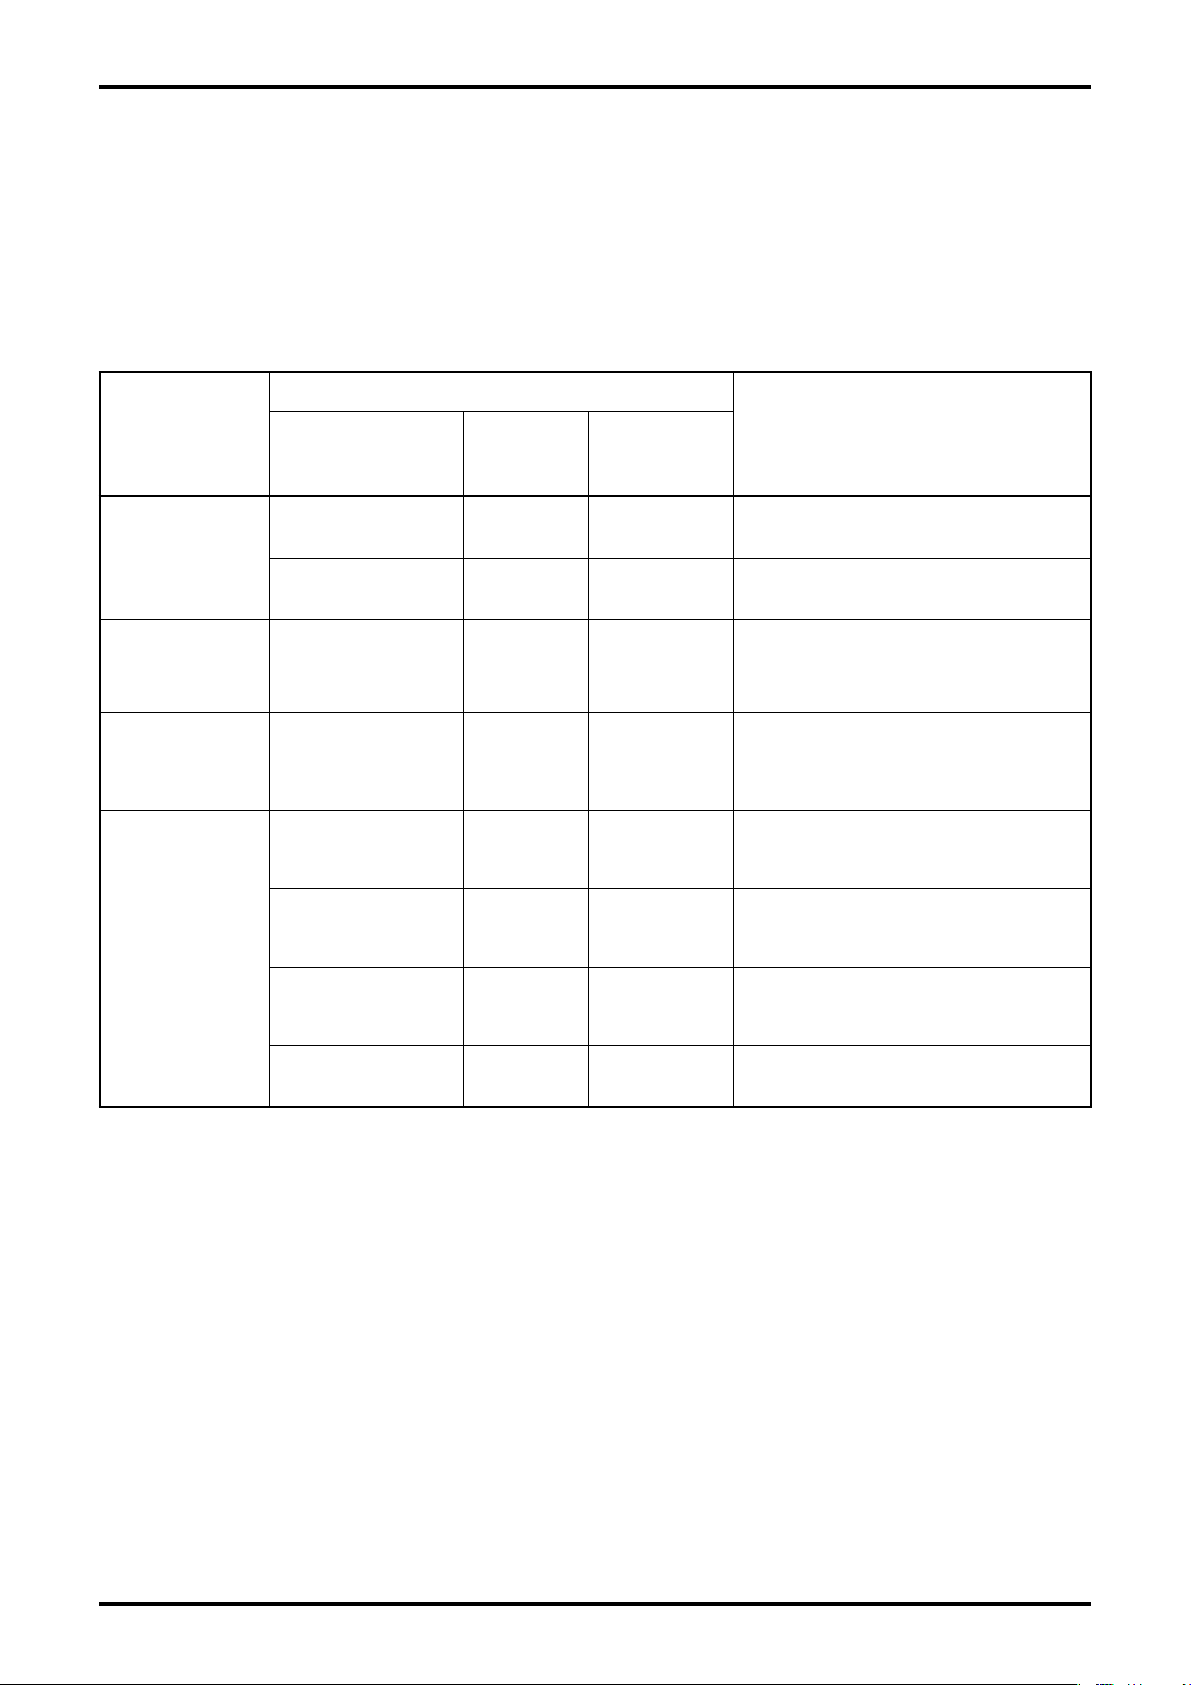
E-025-2-E
3.11.4.2 Status
When specic operation or processing is implemented (executing various functions), the following
message and code appear in the "Process Variables" screen of LinkTop or the LCD display of the
transmitter.
When the function is suspended or the processing is terminated, the message will disappear.
Status Display List
Name of Status
Status
Category
Message displayed
on LinkTop
Message
displayed on
transmitter
Status
displayed on
transmitter
Details
Analog Output
Fixed Output
Measurement
Signal Alarm
Maintenance Maintenance Test tEStinG St-64 CPU simulation is in process.
Self Diagnosis
Fixed
Pulse Output Fixed P.Out.Fi St-61
Status Output
Fixed
Self Diag
Voltage
Self Diag Exciting
Coil/Circuit
Self Diag
Measurement Signal
Self Diag Empty
Pipe
Circuit
A.Out.Fi St-60
S.OutFi St-62
SELF.d.VoL St-70
SELF.d.CoI St-71
SELF.d.SiG St-72
SELF.d.PiP St-73
Fixed output of analog output is in
process.
Fixed output of pulse output is in
process.
Fixed output of status output is in
process.
Self-diagnosis - Circuit voltage
diagnosis is in process.
Self-diagnosis - Exciting coil,
exciting circuit diagnosis is in
process.
Self-diagnosis - Measurement signal
diagnosis is in process.
Self-diagnosis - Empty measurement
pipe diagnosis is in process.
5
Page 66
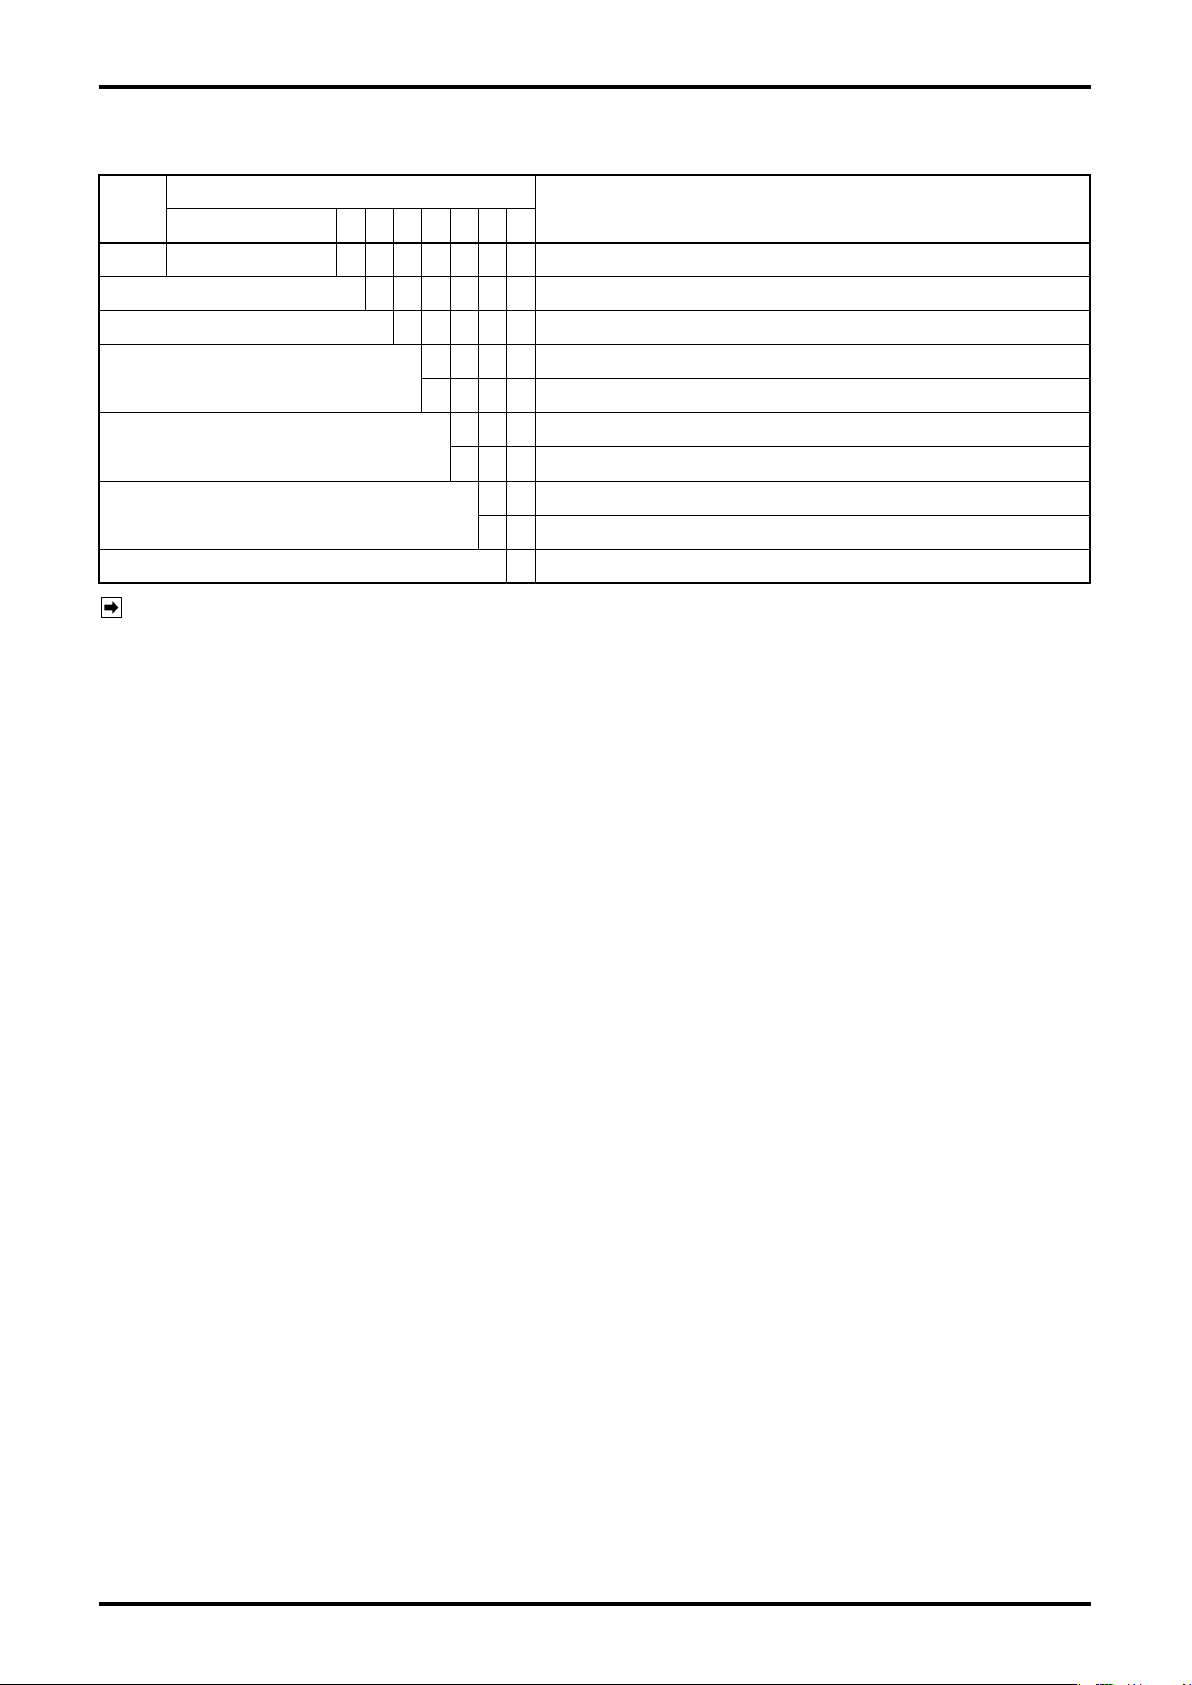
E-025-2-E
4. PRODUCT CODE EXPLANATION
Item
① ② ③ ④ ⑤ ⑥ − ⑦ ⑧ ⑨ ⑩ ⑪ ⑫
Type E L 2 3 1 0 − Smart Communication Unit
Power source 0 Always "0"
Applicable owmeter B Electromagnetic Flowmeter MAG-OVAL Ⅲ
Language
Interface
Media (application software)
Product Code
Description
J Japanese (Japanese version OS)
E English (English version OS)
0 Without interface (application software only)
1 With Bell202 - USB conversion interface(※)
1 CD-ROM
9 Other than the above
0 Al w a ys "0"
NOTE:※ Bell202 communication specications for MAG-OVAL III are supported specically.
Page 67
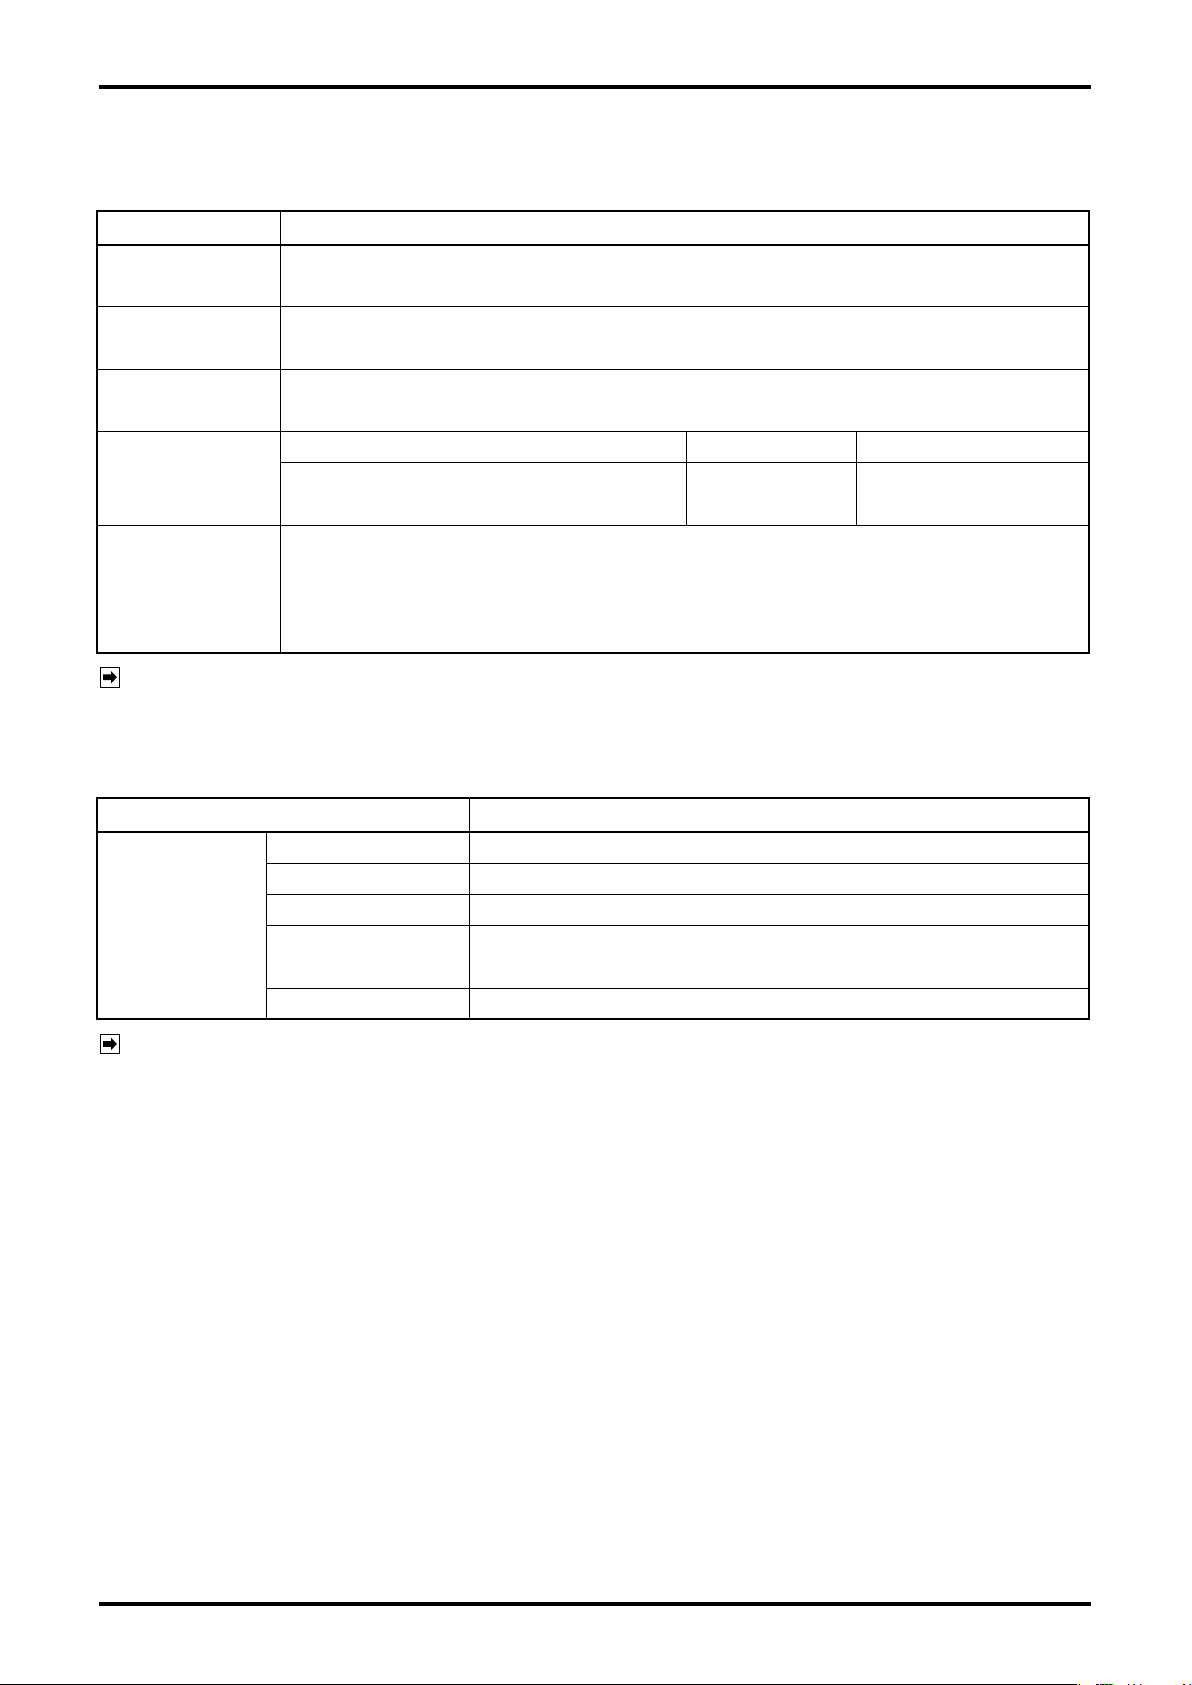
5. GENERAL SPECIFICATIONS
Communication specications
Item Description
E-025-2-E
Physical layer
Communication
system
Communication
baud rate
Operating
environment
Functions
RS485 ( ※ ), Bell202 (Bell202 communication spec. for MAG-OVAL Ⅲ is supported
specically)
Master-slave system
・In case of RS485 communication: 9600, 19200, 38400bps
・In case of Bell202: 1200bps xed
Supported OS Memory (RAM) Hard disk
Windows XP, Windows Vista,
Windows 7 to 10
・Monitoring of measurement value (numeric display, graphic display)
・Logging and saving instantaneous ow rate, % ow rate, and ow velocity
(Saving format: CSV le, Logging period: 0.2s to 1 hour)
・Reading, setting change, and saving of parameters
256MB min.
1Idle capacity of
10MB min.
NOTE ※:Bell202 communication specications for MAG-OVAL III are supported specically.
Bell202 Communication Interface Specications
Item Description
Connector USB (A type)
Bell202
Communication
interface
Input/output signal Bell202 ←→ USB
Operating temp. -5 to +60℃
Outer dimensions
Housing Resin (Black)
Meter body: W50 × H20 × D35mm
Probe: Approx. 1500mm (xed to interface body)
NOTE:
When using Bell202 communication interface, installing dedicated driver software is required.
(Driver software is included in the CD-ROM of LinkTop.)
When using Bell202 communication interface, USB port is necessary.
Page 68

E-025-2-E
All specifications are subject to change without notice for improvement.
2017.04 Revised △
2014.07 Released
E-025-2-E(1)
 Loading...