

Page 1

ORTEC
®
Easy-MCS
™
with the MCS-32 (A73-B32) Software for
®
Microsoft
Hardware and Software User’s Manual
Windows® 7 and Windows XP® SP3
Software Version 2.2
Printed in U.S.A. ORTEC Part No. 931054 1213
Manual Revision C
Page 2

Advanced Measurement Technology, Inc.
a/k/a/ ORTEC®, a subsidiary of AMETEK®, Inc.
WARRANTY
ORTEC* warrants that the items will be delivered free from defects in material or workmanship. ORTEC makes no other
warranties, express or implied, and specifically NO WARRANTY OF MERCHANTABILITY OR FITNESS FOR A
PARTICULAR PURPOSE.
ORTEC’s exclusive liability is limited to repairing or replacing at ORTEC’s option, items found by ORTEC to be defective
in workmanship or m aterials within one year from the date of delivery. ORTEC’s liability on any claim of any k ind, including
negligence, loss, or damages arising out of, connected with, or from the performance or breach thereof, or from the
manufacture, sale, delivery, resale, repair, or use of any item or serv ices covered by this ag reement or purchase order, shall in
no case exceed the price allocable to the item or service furnished or any part thereof that gives rise to the claim . I n the ev ent
ORTEC fails to manufacture or deliv er items called for in this ag reement or purchase order, O RTEC’s exclusive liability and
buyer’s exclusive rem edy shall be release of the buy er from the oblig ation to pay the purchase price. In no event shall O RTEC
be liable for special or consequential damages.
Quality Control
Before being approved for shipment, each ORTEC instrument must pass a stringent set of quality control tests designed to
expose any flaws in materials or workm anship. Permanent records of these tests are m aintained for use in warranty repair and
as a source of statistical information for design improvements.
Repair Service
If it becomes necessary to return this instrument for repair, it is essential that Customer Services be contacted in advance of
its return so that a Return Authorization Number can be assigned to the unit. Also, ORTEC m ust be informed, either in writing,
by telephone [(865) 482-4411] or by facsim ile transmission [(865) 483-2133], of the nature of the fault of the instrument being
returned and of the model, serial, and revision (“Rev” on rear panel) numbers. Failure to do so may cause unnecessary delay s
in getting the unit repaired. The ORTEC standard procedure requires that instrum ents returned for repair pass the same quality
control test s th at are used for new-production instruments. Instruments that are returned should be packed so that they will
withstand normal transit handling and must be shipped PREPAI D via Air Parcel Post or United Parcel Service to the designated
ORTEC repair center. The address label and the package should include the Return Authorization Number assigned.
Instruments being returned that are dam aged in transit due to inadequate pack ing will be repaired at the sender' s expense, and
it will be the sender's responsibility to make claim with the shipper. Instruments not in warranty should follow the same
procedure and ORTEC will provide a quotation.
Damage in Transit
Shipments should be examined immediately upon receipt for evidence of external or concealed damage. The carrier making
delivery should be notified immediatel y of any such damage, since the carrier is normally liable for damage in shipment.
Packing materials, waybills, and other such documentation should be preserved in order to establish claims. After such
notification to the carrier, please notify ORTEC of the circumstances so that assistance can be provided in making damage
claims and in providing replacement equipment, if necessary.
Copyright © 2013, Advanced Measurement Technology, Inc. All rights reserved.
®
*ORTEC
property of their respective owners.
NOTICE OF PROP RIETARY PROPERTY — This document and the information contained in it are the proprietary
property of AMETEK Inc., ORTEC Business Unit. It may not be copied or used in any manner nor may any of the information
in or upon it be used for any purpose without the express written consent of an authorized agent of AMETEK Inc., ORTEC
Business Unit.
is a registered trademark of Advanced Measurement Technology, Inc. All other trademarks used herein are the
Page 3

TABLE OF CONTENTS
Installation — page 11
Tutorial — page 15
Safety Instructions and Symbols................................................ viii
Cleaning Instructions......................................................... viii
1. INTRODUCTION .......................................................... 1
1.1. Easy-MCS Features ..................................................... 1
1.2. Host Computer and Software Requirements .................................. 2
1.3. What is a Multichannel Scaler? ............................................ 2
1.4. A Closer Look at the Easy -MCS ........................................... 3
2. THE EASY-MCS ........................................................... 7
2.1. Front Panel ............................................................ 7
2.1.1. Inputs .......................................................... 7
2.1.2. Outputs ......................................................... 8
2.2. Rear Panel ............................................................ 9
3. HARDWARE AND SOFTWARE INSTALLATION .............................. 11
3.1. Install the C
3.2. Install the MCS-32 Software ............................................. 11
3.3. Connect the Easy-MCS to the Computer.................................... 11
3.4. Run the MCS Configuration Program to Build the List of Available MCS Units.... 12
3.4.1. Customizing the Master MCS List................................... 12
3.5. Attaching More Than One Easy-MCS to the Computer ........................ 13
3.5.1. Connecting to and Disconnecting from the Computer ................... 13
4. GETTING STARTED — MCS-32 TUTORIAL .................................. 15
4.1. Preparing To Acquire Data .............................................. 15
4.2. Collecting Data ....................................................... 17
4.3. Saving and Retrieving Your Data ......................................... 21
4.4. Aborting Data Acquisition in MCS-32 ..................................... 23
5. DISPLAY FEATURES ..................................................... 25
5.1. Screen Features ....................................................... 25
5.2. Two Spectrum Displays................................................. 27
5.3. The Toolbar .......................................................... 28
5.4. Using the Mouse ...................................................... 29
5.4.1. Moving the Marker with the Mouse ................................. 29
ONNECTIONS Driver Update.................................... 11
iii
Page 4

Easy-MCS ™ Multichannel Scaler and MCS-32 (A73-B32) Software 931054C / 1213
5.4.2. Sizing and Moving the Full Display Window .......................... 29
5.4.3. The Expanded View (Right-Mouse-Button) Menu ...................... 30
5.5. Buttons and Checkboxes ................................................ 30
5.6. The Sidebar .......................................................... 30
5.6.1. Acquisition Section .............................................. 30
5.6.2. View Section.................................................... 31
5.7. About MCS-32 ........................................................ 32
6. MENU COMMANDS ...................................................... 33
6.1. F
6.2. A
ile ................................................................. 35
6.1.1. R
6.1.2. S
6.1.3. P
6.1.4. Report
6.1.5. C
6.1.6. Recall Setting
6.1.7. Sav
6.1.8. I
6.1.9. E
6.1.10. Ex
ecall Data... ................................................... 35
ave Data As... .................................................. 36
rint Data........................................................ 37
... ....................................................... 37
ompare Data... ................................................. 40
s.................................................... 41
e Settings As... ............................................... 41
mport ASCII..................................................... 42
xport ASCII... .................................................. 43
it .......................................................... 43
cquire.............................................................. 43
6.2.1. Sta
6.2.2. St
6.2.3. Cle
6.2.4. MCS > B
6.2.5. P
6.2.6. I
6.2.7. R
rt........................................................... 43
op........................................................... 43
ar .......................................................... 44
uffer................................................... 44
ass Control...................................................... 44
nput Control... .................................................. 45
amp Control... ................................................. 46
6.2.8. Adjust Live Input... ............................................... 47
6.2.9. S
6.3. C
alculate............................................................. 49
6.3.1. S
6.3.2. Data I
6.3.3. Su
6.3.4. Smooth
6.3.5. Strip
6.3.6. Subtract
6.3.7. N
6.3.8. M
6.3.9. Peak Sear
6.3.10. C
CA Sweep... ................................................... 47
ettings... ...................................................... 49
nfo....................................................... 50
m........................................................... 50
........................................................ 51
... ......................................................... 51
... ...................................................... 52
ormalize ...................................................... 52
arker......................................................... 52
ch..................................................... 53
alibrate........................................................ 53
iv
Page 5

931054C / 1213 TABLE OF CONTENTS
6.4. Services ............................................................. 55
6.4.1. Start J
OB... ..................................................... 55
6.4.1.1. Editing .JOB Files ........................................ 56
6.4.2. L
6.4.3. Sample D
6.5. R
OI................................................................. 58
6.5.1. R
6.5.2. S
6.5.3. M
6.5.4. U
6.5.5. Unmark A
6.6. D
isplay .............................................................. 60
6.6.1. MCS/B
6.6.2. Select M
6.6.3. Ti
6.6.4. S
6.6.5. A
6.6.6. L
6.6.7. N
6.6.8. C
6.6.9. P
ibrary... ....................................................... 57
escription... ............................................. 58
ecall ROI....................................................... 59
ave ROI As... .................................................. 59
ark ROI ...................................................... 59
nmark ROI .................................................... 59
ll ROIs ................................................ 59
uffer .................................................... 60
CS... ................................................... 60
me Units ..................................................... 60
horter/Taller ................................................... 61
utomatic ...................................................... 61
ogarithmic .................................................... 61
arrower/Wider ................................................. 61
enter ......................................................... 61
references....................................................... 62
6.6.9.1. P
6.6.9.2. W
6.6.9.3. F
6.6.9.4. G
6.6.9.5. T
6.6.9.6. C
oints/Fill ROI/Fill All .................................... 62
rap Mode ............................................. 62
ull View ............................................... 62
raticules............................................... 63
oolbar................................................. 63
olors... ................................................ 63
7. KEYBOARD FUNCTIONS.................................................. 65
7.1. Introduction .......................................................... 65
7.2. Marker and Display Function Keys........................................ 65
7.2.1. Next/Previous Channel............................................ 65
7.2.2. Next/Previous ROI ............................................... 68
7.2.3. Highlight Channels Left/Right ..................................... 68
7.2.4. Next/Previous Library Entry ....................................... 68
7.2.5. First/Last Channel ............................................... 68
7.2.6. Jump 1/64 Screen Width .......................................... 68
7.2.7. Insert ROI ...................................................... 69
7.2.8. Unmark ROI .................................................... 69
7.2.9. Taller/Shorter ................................................... 69
7.2.10. Shift Compare Spectrum ......................................... 69
v
Page 6

Easy-MCS ™ Multichannel Scaler and MCS-32 (A73-B32) Software 931054C / 1213
7.2.11. Wider/Narrower ................................................ 69
7.2.12. Screen Capture ................................................. 69
7.3. Keyboard Number Combinations ......................................... 70
7.3.1. Start........................................................... 70
7.3.2. Stop........................................................... 70
7.3.3. Clear .......................................................... 70
7.3.4. MCS > Buffer................................................... 70
7.3.5. MCS/Buffer .................................................... 70
7.4. Function Keys ........................................................ 71
7.4.1. MCS/Buffer .................................................... 71
7.4.2. Taller/Shorter ................................................... 71
7.4.3. Narrower/Wider ................................................. 71
7.4.4. Select MCS..................................................... 71
7.5. Keypad Keys ......................................................... 72
7.5.1. Log/Linear ..................................................... 72
7.5.2. Auto/Manual.................................................... 72
7.5.3. Center ......................................................... 72
7.5.4. Wider/Narrower ................................................. 72
8. JOB FILES ............................................................... 73
8.1. JOB Programming Example ............................................. 73
8.1.1. Improving the JOB ............................................... 75
8.1.2. The RUN Command.............................................. 77
8.1.3. Controlling MCS-32 from Other Programs ............................ 77
8.2. Job Commands........................................................ 78
9. LIBRARY FILES.......................................................... 89
APPENDIX A. SPECIFICATIONS.............................................. 91
A.1. Performance.......................................................... 91
A.2. Inputs and Outputs .................................................... 92
A.3. Electrical and Mechanical............................................... 92
A.4. Computer Controls and Indicators ........................................ 93
A.4.1. Sidebar Controls ................................................ 93
A.4.2. Input Control ................................................... 94
A.4.3. SCA Sweep Control.............................................. 95
A.4.4. Pass Control.................................................... 95
A.4.5. Ramp Control................................................... 95
A.4.6. MCS-32 Menus ................................................. 96
A.5. Optional and Related Equipment ......................................... 97
vi
Page 7

931054C / 1213 TABLE OF CONTENTS
APPENDIX B. MCS-32 COMMAND LINE STARTUP ............................. 99
B.1. Command Line Options ................................................ 99
APPENDIX C. FILE FORMATS .............................................. 101
C.1. .MCS Spectral Data Files .............................................. 101
C.2. .ROI Files .......................................................... 103
APPENDIX D. FIRMWARE COMMANDS AND RESPONSES ..................... 105
D.1. Command Format .................................................... 105
D.2. Error Codes ......................................................... 105
D.3. Dollar Response Records .............................................. 107
D.4. Command Catalog.................................................... 107
INDEX.................................................................... 121
vii
Page 8
Safety Instructions and Symbols
This manual contains up to three levels of safety instructions that must be observed in order to
avoid personal injury and/or damage to equipment or other property. These are:
DANGER Indicates a hazard that could result in death or serious bodily harm if the safety
instruction is not observed.
WARNING Indicates a hazard that could result in bodily harm if the safety instruction is not
observed.
CAUTION Indicates a hazard that could result in property damage if the safety instruction is
not observed.
Please read all safety instructions carefully and make sure you understand them fully before
attempting to use this product.
Cleaning Instructions
DANGER Opening the cover of this instrument is likely to expose dangerous voltages.
Disconnect the instrument from all voltage sources while it is being opened.
WARNING Using this instrument in a m anner not specified by the manufacturer may impair
the protection provided by the instrument.
Cleaning Instructions
To clean the instrument exterior:
! Remove loose dust on the outside of the instrument with a lint-free cloth.
! Remove remaining dirt with a lint-free cloth dampened in a general-purpose detergent and
water solution.
! Do not use abrasive cleaners.
CAUTION To keep moisture out of the instrument during external cleaning, use only
enough liquid to dampen the cloth or applicator.
viii
Page 9

NOTE!
We assume throughout this m anual that you are thoroughly familiar
with Microsoft Windows usage and terminology.
The convention used in this manual to represent actual keys
pressed is to enclose the key label within angle brackets; for
example, <F1>. For key com binations, the key labels are joined
by a + within the angle brackets; for example, <Alt + 2> .
ix
Page 10
x
Page 11

1. INTRODUCTION
The ORTEC® Easy-MCS™ converts your computer into a powerful multichannel scaler (MCS)
or multiple-stop-time spectrometer. With dwell times from 100 ns to 1300 s, a memory length of
65,536 channels, and input counting rates up to 150 MHz, the Easy-MCS has the flexibility to
handle a wide variety of counting and timing applications, including:
! Time-resolved single-photon counting
! Phosphorescence lifetime spectrometry
! Atmospheric and satellite LIDAR
! Laser-induced chemical reactions
! Scanning mass spectrometers
! Time-of-flight spectrometry
! Scanning X-ray diffractometers
! Mössbauer experiments
The Easy-MCS connects to your com puter via a high-speed USB 2.0 interface, and one computer can control up to eight units.
The accompanying MCS-32 software allows you to manipulate all controls and spectral data
from your computer or across a network. Multiple Easy-MCS units can be run at the sam e time
with corresponding multiple instances of the MCS-32 program.
1.1. Easy-MCS Features
Hardware
! Small-footprint instrument connects to the host computer via high-speed USB.
! Dwell time selectable from 100 ns to 1,300 seconds per channel.
! Number of channels per scan selectable from 4 to 65, 536.
! Accepts counting rates up to 150 MHz at the fast analog input.
! 1-MHz single-channel analyzer input with computer-controlled upper- and lower-level
discriminators independently adjustable from 0 to +10 V.
! Computer adjustable discriminator thresholds on the fast analog input and the external
channel advance input.
! Zero dead time between channels: absolutely no lost counts and no double counting at
channel boundaries.
! No end-of-pass dead time.
! Sum mode for signal averaging; Replace mode for single-scan data; Replace-then-Sum
mode to circumvent reset dead time between acquisitions.
! Up to 1,073,741,823 counts per channel in single or multiple passes.
! Automatic term ination of data acquisition after a preset number of passes (up to
4 billion).
1
Page 12

Easy-MCS ™ Multichannel Scaler and MCS-32 (A73-B32) Software 931054C / 1213
! The start of the scan can trigger the experiment, or the experiment can trigger the start of
the scan.
! Includes a ramp output with computer-adjustable sawtooth and triangular waveforms.
Software
! Complete with MCS-32 operating, display, and analysis software for Windows 7 and
XP SP3.
! All functions are computer-controlled.
! SCA Sweep mode for recording pulse-height spectra and selecting accurate SCA
windows.
! Spectra and instrument settings can be saved on disk and recalled for further processing.
! Software features include smooth, sum, strip, compare, and norma lize spectra; peak-
search, report, and user-defined job streams.
! Horizontal scale calibration by least squares fitting to user-defined units.
®
! A11-B32 Programme r's Toolkit available separately for ActiveX
®
National Instruments LabVIEW
, and Microsoft Visual Basic or Visual C++.
programming under
®
NOTE The MCS-32 software does not support our legacy ACE
-MCS or MCS-PLUS®.
1.2. Host Computer and Software Requirements
The Easy-MCS is com pletely computer-controlled and can be operated with any suitable version
of the MCS-32 software, communicating via C
ONNECTIONS v7.1 or higher. The Easy-MCS con-
nects via a USB port and can be used on any computer running runs on any computer running
under Windows 7 and XP SP3.
1.3. What is a Multichannel Scaler?
An MCS records the counting rate of events as a function of time. When a scan is started, the
MCS begins counting input events in the first channel of its digital memory. At the end of the
preselected dwell time, the MCS advances to the next channel of me mory to count the events.
This dwell and advance process is repeated until the MCS has scanned through all the channels
in its memory. A display of the contents of the m e mory shows the counting rate of the input
events versus time. In repetitive measurements, where the start of the scan can be synchronized
with the start of the events, multiple scans can be summed to diminish the statistical scatter in
the recorded pattern.
The MCS can also function as a multiple-stop-time spectrometer. In a typical LIDAR application, the MCS scan is started when a laser emits a brief flash of light. The light photons are
reflected back to the detector located near the laser as they encounter objects at various distances
in the line of sight. The resulting “stop” pulses generated in the detector are counted as input
events by the MCS. Thus, a spectrum of the number of photons versus their round-trip flight
2
Page 13

931054C / 1213 1. INTRODUCTION
times is recorded in the MCS memory. By design, the MCS can accept multiple stop pulses in
each scan. The channel numbers in memory can be calibrated to read in terms of round-trip flight
time, or in distance to the reflecting object. Summing the spectra from multiple laser flashes
improves the signal-to-noise ratio.
1.4. A Closer Look at the Easy-MCS
An Abundant Choice of Time Ranges
The Easy-MCS employs a crystal-controlled clock with 100 ppm accuracy and high-speed
digital electronics to achieve a wide range of accurate operating parameters. With the dwell
time per channel selectable from 100 ns to 1300 seconds, and a scan length variable from
4 to 65,536 channels, time scans can be selected ranging from 400 ns to 2.7 years.
No Dead Time Between Channels, and Zero End-of-Pass Dead Time
Easy-MCS employs sophisticated digital circuits to eliminate the dead time between channels that is typically encountered in lower-performance MCSs. The result is absolutely no
loss of counts and no double counting as the MCS advances from one time channel to the
next. Fast digital processing also ensures that there is no end-of-pass dead time before
starting a new scan.
Versatile Counting Inputs
Two different types of counting inputs make the Easy-MCS adaptable to virtually any source
of signals. The fast analog signal input (IN) accommodates both analog and digital signals
with pulse widths >3.5 ns and counting rates up to 150 MHz. The input discriminator threshold is computer adjustable from !1.6 V to +3 V in steps of 1.5 mV. This facilitates the preferential selection of larger pulses for counting and the rejection of noise. Triggering can be
selected for either positive or negative slope to match pulses of either polarity.
For counting rates up to 1 MHz with positive analog signals, Easy-MCS offers the pulseamplitude selectivity of the SCA (single-channel-analyzer) input. This input features two
computer-controlled discriminators whose thresholds can be set anywhere between 0 V and
+10 V with 12-bit resolution. Easy-MCS counts only the analog pulses that rise above the
lower-level threshold without exceeding the upper-level threshold. This input is ideal for
analog signals with amplitudes proportional to a measurement parameter, such as the number
of photons in a pulse. Pulse widths from 0.5 μs to 100 μs can be readily accommodated.
SCA Sweep Mode
The SCA Sweep mode makes the setting of the SCA thresholds quick, easy, and accurate. In
this mode the window width between the lower and upper SCA thresholds is held constant
(at 1/512 of 10 V) while the computer repeatedly sweeps the position of the window from
0 V to +10 V in 512 equal steps. In synchronism, the MCS repeatedly scans from channel
3
Page 14

Easy-MCS ™ Multichannel Scaler and MCS-32 (A73-B32) Software 931054C / 1213
0 to 511 while counting the SCA output. The result is a display of the pulse-amplitude spectrum present at the SCA input. The mouse can be used to mark the lower and upper limits of
a spectral feature in this display for selective counting in a subsequent MCS mode. Once
these limits are marked, clicking the mouse on the Set SCA button in the display locks the
lower and upper thresholds of the SCA into the exact settings that bracket the feature.
Improved Precision by Signal Averaging
For any selected dwell time and memory length, the data collected in each scan can either
replace the data stored in memory, or can be added to the data in memory. The latter mode is
useful for reducing statistical scatter. Effectively, it improves the signal-to-noise ratio by
signal averaging. For random noise (noise that is not correlated with the Start trigger or the
dwell-time clock), the signal-to-noise ratio improves in proportion to the square root of the
number of scans added together. Selection of a “preset pass count” programs the instrument
to collect data for the desired number of scans (or passes) and then automatically stop data
acquisition. Once data acquisition commences, the computer is free to run other software
programs. To permit repetitive data addition to high precision, the preset pass count can be
set to any value from 1 to 4,294,967,295, with a memory capacity of 1,073,741, 823 counts
per channel.
Versatile Scan Synchronization
Easy-MCS offers two methods for synchronizing the scans with the start of the events to be
counted. Either the start of a scan in the Easy-MCS can provide the trigger for the events
(internal trigger mode), or an external trigger for the events can start the scan (external
trigger mode).
! Internal Trigger Mode The Start Output signal is 160 ns wide, positive TTL, produced
in synchronization with the start of a scan. This output can be used to trigger the external
events. For example, this signal can trigger a laser, whose output light pulse is used to
excite phosphorescence in a sample. The decaying counting rate of photons emitted by
the sample after each laser pulse is counted by the Easy-MCS.
For measurements requiring analog control of a parameter (e.g., Mössbauer experiments),
Easy-MCS provides a Ramp O utput voltage proportional to the channel number in the
scan. The ramp can be operated with either a sawtooth pattern or a triangular waveform.
In the sawtooth mode, the ramp voltage varies linearly from the beginning voltage to the
ending voltage as the scan progresses. At the end of the scan the voltage abruptly
changes back to the beginning voltage. With the triangular pattern, the ramp voltage
changes linearly from the beginning voltage to the mid-point voltage during the first half
of the scan. During the second half of the scan, it makes another linear transition from the
mid-point voltage to the ending voltage. All three voltages (Begin, Mid, and End) are
adjustable via the computer from 0 to +10 V in 65,536 steps. For precise repeatability,
4
Page 15

931054C / 1213 1. INTRODUCTION
the ramp profile is stored as a digital image in half the memory. This limits the memory
length available for counting events to 32,768 channels when the ramp is active.
! External Trigger Mode In the external trigger mode, a positive TTL logic pulse
delivered to the Start Input will initiate the scan in the Easy-MCS. The scan can proceed
based on the internal dwell-time clock in the Easy-MCS, or the channel advance can be
implemented by supplying pulses to the Channel Advance Input.
Using the internal dwell time, the scan starts on the first edge of the internal 50-MHz
clock following the rising edge of the Start Input pulse. When the external channel
advance is used, the scan starts as the rising edge of the first channel advance input pulse
crosses its discriminator threshold, subsequent to the rising edge of the Start Input. The
external channel advance input includes a computer-controlled discriminator threshold
selectable from –1.6 V to +3 V in 1.5-mV steps. This discriminator permits adaptation to
a variety of signal sources at the external channel advance input. The minimum interval
between external channel advance pulses is 100 ns.
Quick Access to Multiple Spectra
The MCS-32 software allows you to view either the spectrum being acquired in the EasyMCS memory (MCS mode) or you can transfer the contents of the MCS memory to the
MCS-32 software’s buffer window (buffer mode). The full power to display and manipulate
can be applied to the spectra in either of these memories. Spectra can also be saved as disk
files for later recall (into the buffer window) and processing.
Full and Expanded Displays Reveal Quantitative Details
Two views of the selected spectrum are displayed. The box in the upper, right-hand corner
always shows the full spectrum. A region selected and marked on this small display is
expanded in the larger display for better resolution of details. Using the mouse, you can
move a marker through the spectrum to a feature of interest. Simultaneously, the computer
displays the horizontal coordinate for the channel designated by the marker position, and the
number of counts recorded in that channel. By default, the horizontal coordinate is displayed
as the channel number in the external dwell-time m ode. In the internal dwell-time mode, the
default horizontal coordinate corresponds to the selected dwell time. The horizontal scale can
be easily calibrated in user-defined units through least-squares fitting to a linear, quadratic,
or cubic function. In that case, the marker position reads out in the calibrated units. Once the
system is calibrated, you can quickly toggle back and forth between the default and
calibrated units.
The marker also serves to paint regions of interest (ROIs) on the spectrum. Comm a nds under
the Calculate menu then trigger the computer to display the centroid of the ROI, the gross
(total) counts in the ROI, and the net counts above background in the region.
5
Page 16

Easy-MCS ™ Multichannel Scaler and MCS-32 (A73-B32) Software 931054C / 1213
More Analysis Options
Further software features allow you to compare two spectra, subtract or add two spectra, normalize the vertical scale, subtract a flat background, or smooth statistical fluctuations. Also
available is a routine that automatically finds each peak in a spectrum and marks it with an
ROI. The centroids, gross counts, and net counts from all the ROIs in a spectrum can be
printed, either with or without library matching. If the computer has been asked for a m a tch
to a user-defined library of peak locations, the library information will be printed along with
the matching ROI data. In addition to the standard
.MCS file format, spectra can be imported
and exported as ASCII text.
Programmed D ata Acquisition
Some measurements require changes in the data acquisition conditions as different spectra
are acquired. The Start JOB command gives you an easy way to define a stream of “job
commands” that varies the instrume nt settings and controls ac quisition of multiple spectra.
The job stream can be simple or sophisticated. Once the job stream is defined and im plemented, data acquisition proceeds automatically under the job’s control. If you wish, you can
set up a job as an icon on your Windows desktop, and run it with one click of the mouse.
Other software programs can activate the Easy-MCS for a specific operation by calling the
MCS-32 software with a .JOB file name specified on the command line. Alternatively, the
ONNECTIONS Programmer’s Toolkit (A11-B32) can be purchased and used to program the
C
Easy-MCS at the command level. The use of ActiveX controls in A11-B32 makes programming orders of magnitude easier w ith National Instruments LabVIE W, Microsoft Visual
Basic, or Microsoft Visual C++.
Inbit FullShot™ Screen Capture and Graphics Printing
The Easy-MCS package includes the Inbit FullShot Image Capture and Printing Utility. With
FullShot, you can capture a whole screen, a window, or a portion of a window and save it in
a variety of graphics file formats or send it directly to the printer. See the accompanying
FullShot user manual.
6
Page 17
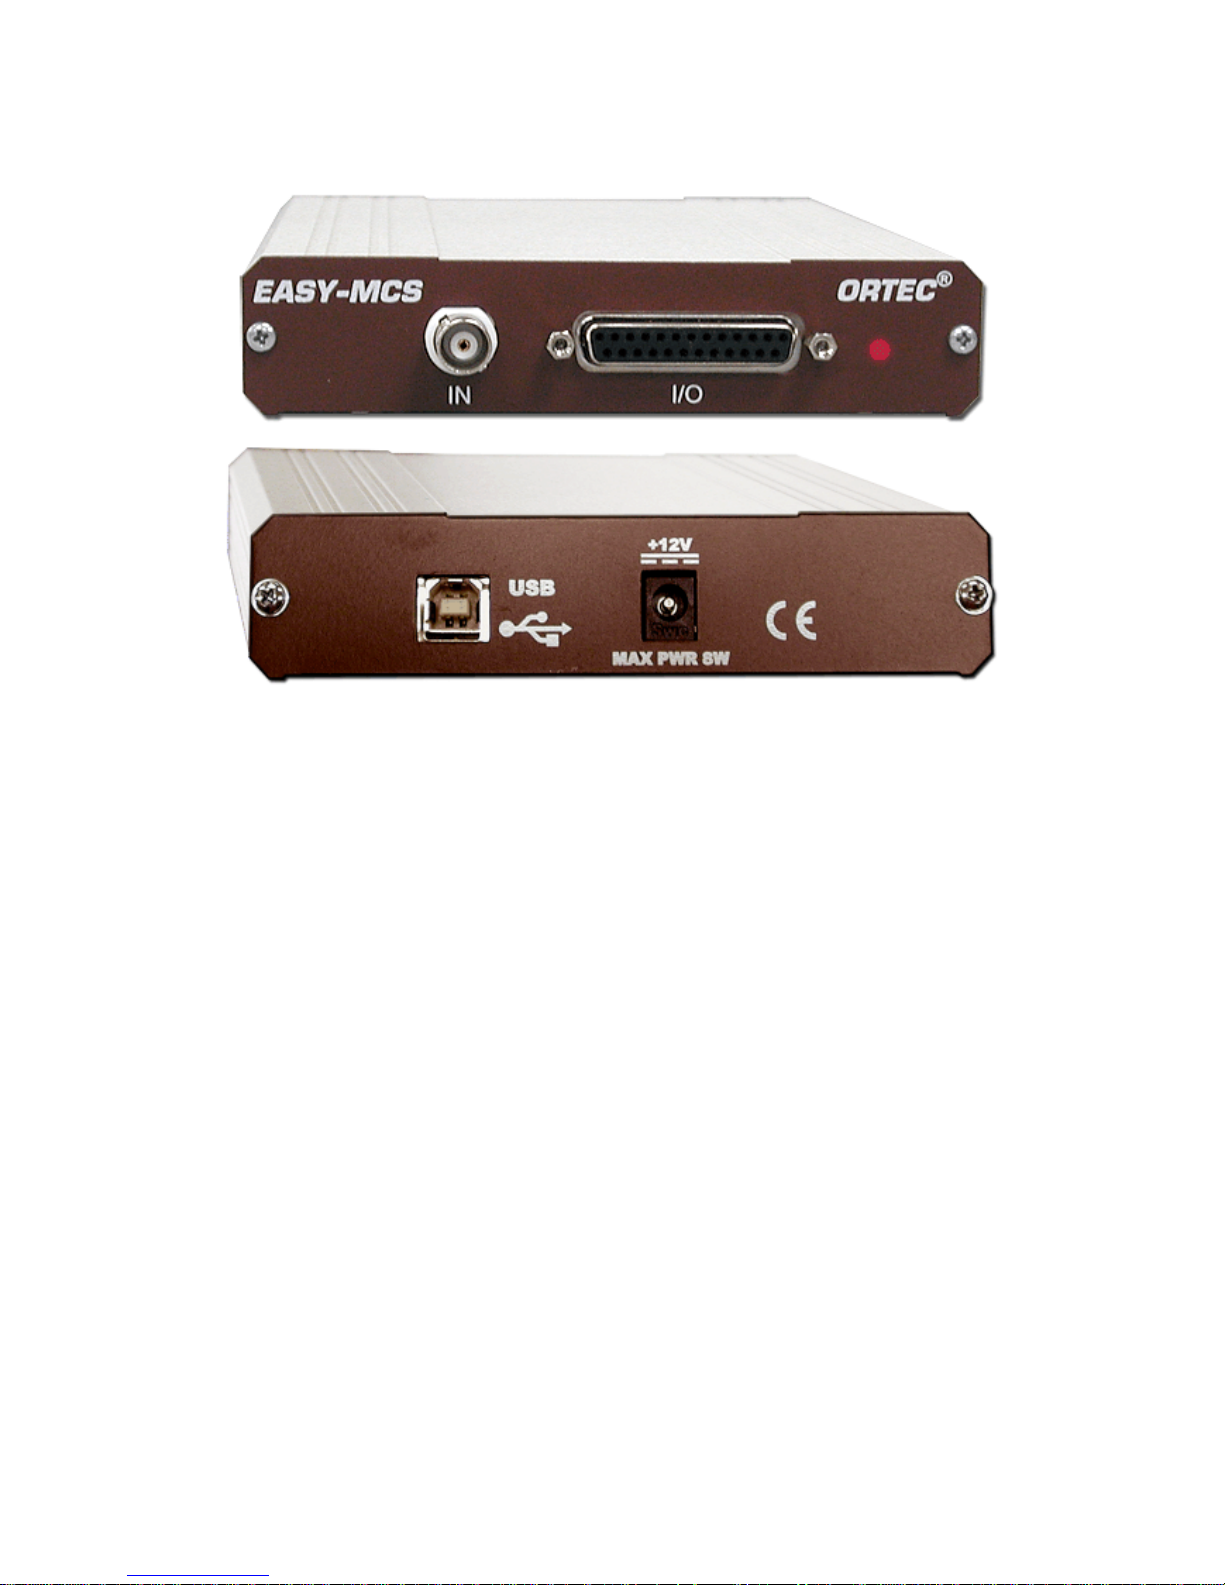
Figure 1 shows the Easy-MCS front and rear panels.
2. THE EASY-MCS
Fig. 1. The Easy-MCS.
2.1. Front Panel
2.1.1. Inputs
All inputs except the fast analog IN are supplied on the 25-pin D connector on the rear panel.
The MCS-PCI-OPT2 option offers convenient BNC connections to the D connector.
IN Fast analog signal input accepts analog or digital pulses up to ±5 V in amplitude on a rearpanel BNC connector. Pulses are counted as they cross the discriminator threshold. Computer
selection of triggering on either positive or negative slope. Threshold is computer adjustable
from !1.6 V to +3 V in steps of 1.5 mV (minimum pulse amplitude 30 mV). Computer selection
of either 50-Ω or 1000-Ω input impedance, dc-coupled. Minimum input pulse width is 3 ns at
the discriminator threshold. Maximum counting rate is 150 MHz.
SCA IN 1-MHz window discriminator (single-channel analyzer) accepts linear signals from
0 V to +12 V for counting. SCA input is dc-coupled with a 1000-Ω input impedance. Minimum
input pulse width is 500 ns. The upper- and lower-level thresholds are independently adjustable
from 0 V to +10 V in 4096 steps via the computer. A signal that rises above the lower-level
threshold without exceeding the upper-level threshold will be counted as it falls below the
lower-level threshold.
7
Page 18

Easy-MCS ™ Multichannel Scaler and MCS-32 (A73-B32) Software 931054C / 1213
START IN Accepts a TTL signal to start the scan on the next clock edge after the falling edge
of the transition from +2.5 V to 0 V is detected on the START IN. In the Internal Dwe ll mode
the next clock edge is obtained from the 50-MHz internal time base. For the External Dwell
mode, the next clock edge is obtained from the External Channel Advance Input. The START
IN edge is ignored during a scan or when disabled by the Start Enable Input. Input impedance is
1000 Ω to ground. Minimum pulse width is 10 ns.
STOP IN Accepts an external TTL input rising from 0 to +2.5 V to stop scanning at the end of
the current scan. Minimum pulse width is 10 ns. Input impedance is 5000 Ω to ground.
CHN ADV IN (Channel Advance Input) Accepts an analog or digital pulse to cause a channel advance when the signal crosses the threshold with a positive slope (provided External
Dwell has been selected in the MCS-32 software). Threshold is adjustable from !1.6 to +3 V
in 1.5 mV steps via the computer. Minimum dwell time is 100 ns. Minimum pulse width
is 10 ns. Minimum pulse amplitude is 30 mV. Input impedance is 1000 Ω to ground.
GATE IN Accepts a TTL input to prevent counting of the signals at the IN and SCA IN
connectors. When the GATE IN is <0.8 V, counting is inhibited. Counting is enabled when the
GATE IN level is >2 V, or when the GATE IN is not connected to signal source. Input
impedance is 1000 Ω to +5 V.
TTL (START ENABLE INPUT) Accepts a TTL input to enable/disable response to a START
IN trigger. When the START ENABLE INPUT is <0.8 V, triggering is inhibited. Triggering is
enabled when the START ENABLE INPUT level is >2 V, or when the START ENABLE
INPUT is not connected to a signal source. Input impedance is 5000 Ω to +5 V. START
ENABLE INPU T must be at the desired level when the rising edge of the START IN arrives.
2.1.2. Outputs
All outputs are supplied on the 25-pin D connector on the rear panel. The MCS-PCI-OPT2
option offers convenient BNC connections to the D connector.
START OUT This TTL ouput rises from <+0.4 V to >+2.4 V when a scan starts, and returns to
<+0.4 V after 160 ns. Useful for synchronizing external instruments with the start of the scan.
The output is short-circuit protected and can drive impedances $50 Ω.
CHN ADV OUT (Channel Advance Output) This TTL output rises from <+0.4 V to >+2.4 V
when the Easy-MCS advances from one channel to the next. The pulse width is approximately
20 ns. The output is short-circuit protected and can drive impedances $50 Ω.
SCA OUT A TTL output pulse for every SCA IN signal that occurs between the upper and
lower discriminator thresholds. The output rises from <+0.4 V to >+2.4 V as the SCA IN signal
8
Page 19

931054C / 1213 2. THE EASY-MCS
falls through the lower discriminator threshold. The pulse w idth is nominally 250 ns. The output
is short-circuit protected and can drive impedances $50 Ω.
MIDPASS OUT This TTL output rises from <+0.4 V to >+2.4 V after half the channels in a
pass have been scanned. It returns to <+0.4 V at the end of the pass. If the number of channels in
a pass is odd, the MIDPASS OUT remains low for one more channel than it stays high. The
output is short-circuit protected and can drive impedances $50 Ω.
RAMP OUT Provides an analog voltage ramp from a digital-to-analog converter to drive
external devices. See Ramp Control for a description. The output voltage range is computer
adjustable from 0 V to +10 V w ith 16-bit resolution. Minimum voltage step size is approximately 0.15 mV for any range. Settling time is 2 μs. The output impedance is 100 Ω, shortcircuit protected.
2.2. Rear Panel
POWER INPUT The EASY-MCA uses an ac/dc adapter that connects to the instrument’s
+12 V DC connector.
USB High-speed USB connector connects to the computer.
9
Page 20

Easy-MCS ™ Multichannel Scaler and MCS-32 (A73-B32) Software 931054C / 1213
[Intentionally blank]
10
Page 21

3. HARDWARE AND SOFTWARE
INSTALLATION
Installing the Easy-MCS and the MCS-32 software takes just four easy steps. You must have
Windows administrator access to install OR TEC software.
1) Install the accompanying C
select the USB-based instruments family on the install wizard’s Instrument Setup page.
2) Install the MCS-32 software (v2.2 or higher).
3) Connect the Easy-MCS to the computer.
4) Run the MCS Configuration program to build the list of available ORTEC MCSs.
ONNECTIONS Driver Update Kit (Part No. 797230), being sure to
3.1. Install the CONNECTIONS Driver Update
The first step is to install the accompanying CONNECTIONS Driver Update Kit (Part No. 797230)
according to its instruction sheet (p/n 932721). Be sure to read the update kit’s instructions
thoroughly. They explain how to install C
ORTEC instrument(s), use the MCS Configuration program’s optional command line arguments,
and share ORTEC instruments across a network.
On the install wizard’s Instrument Setup page, be sure to select the USB-based instruments
family. Otherwise the Easy-MCS will not be able to communicate with the computer and
MCS-32 software. At the end of installation, you will be directed to restart the computer. After
restart, return here to continue software and hardware installation.
ONNECTIONS, enable/disable the drivers for your
3.2. Install the MCS-32 Software
Insert the MCS-32 CD, navigate to the CD drive, and open Setup.exe. If one or more security
dialogs ask if you wish to continue installation, select the “install anyway” option to start the
installation wizard. Click Next and follow the wizard prompts.
Existing instruments (i.e., units configured before this upgrade) do not have to be powered on
during this part of the installation procedure, but must be powered on before running the MCS
Configuration program discussed in Section 3.4.
NOTE You can enable other device drivers later, as described in the C
instructions.
ONNECTIONS update
3.3. Connect the Easy-MCS to the Computer
With the computer powered on, connect the Easy-MCS to a high-speed USB port on the computer or to a powered hub attached to the computer. A series of “found new hardware” messages
11
Page 22
Easy-MCS ™ Multichannel Scaler and MCS-32 (A73-B32) Software 931054C / 1213
will be displayed. W hen this operation is complete, you are ready to run the MCS Configuration
program so the MCS-32 software can communicate with the Easy-MCS.
3.4. Run the MCS Configuration Program to Build the
List of Available MCS Units
From the Windows Start menu, enter mcs in the “search programs and files” box, then
click the MCS Configuration search result; or open the Windows Start menu and click
MCS-32, then MCS Configuration.
The MCS Configuration program will locate all (powered on) ORTEC MCSs attached to the
local computer and to any (powered-on) network computers, display the list of MCSs found,
allow you to enter customized instrument numbers and descriptions, and optionally write this
configuration to those other network PCs, as described in the next section.
3.4.1. Customizing the Master MCS List
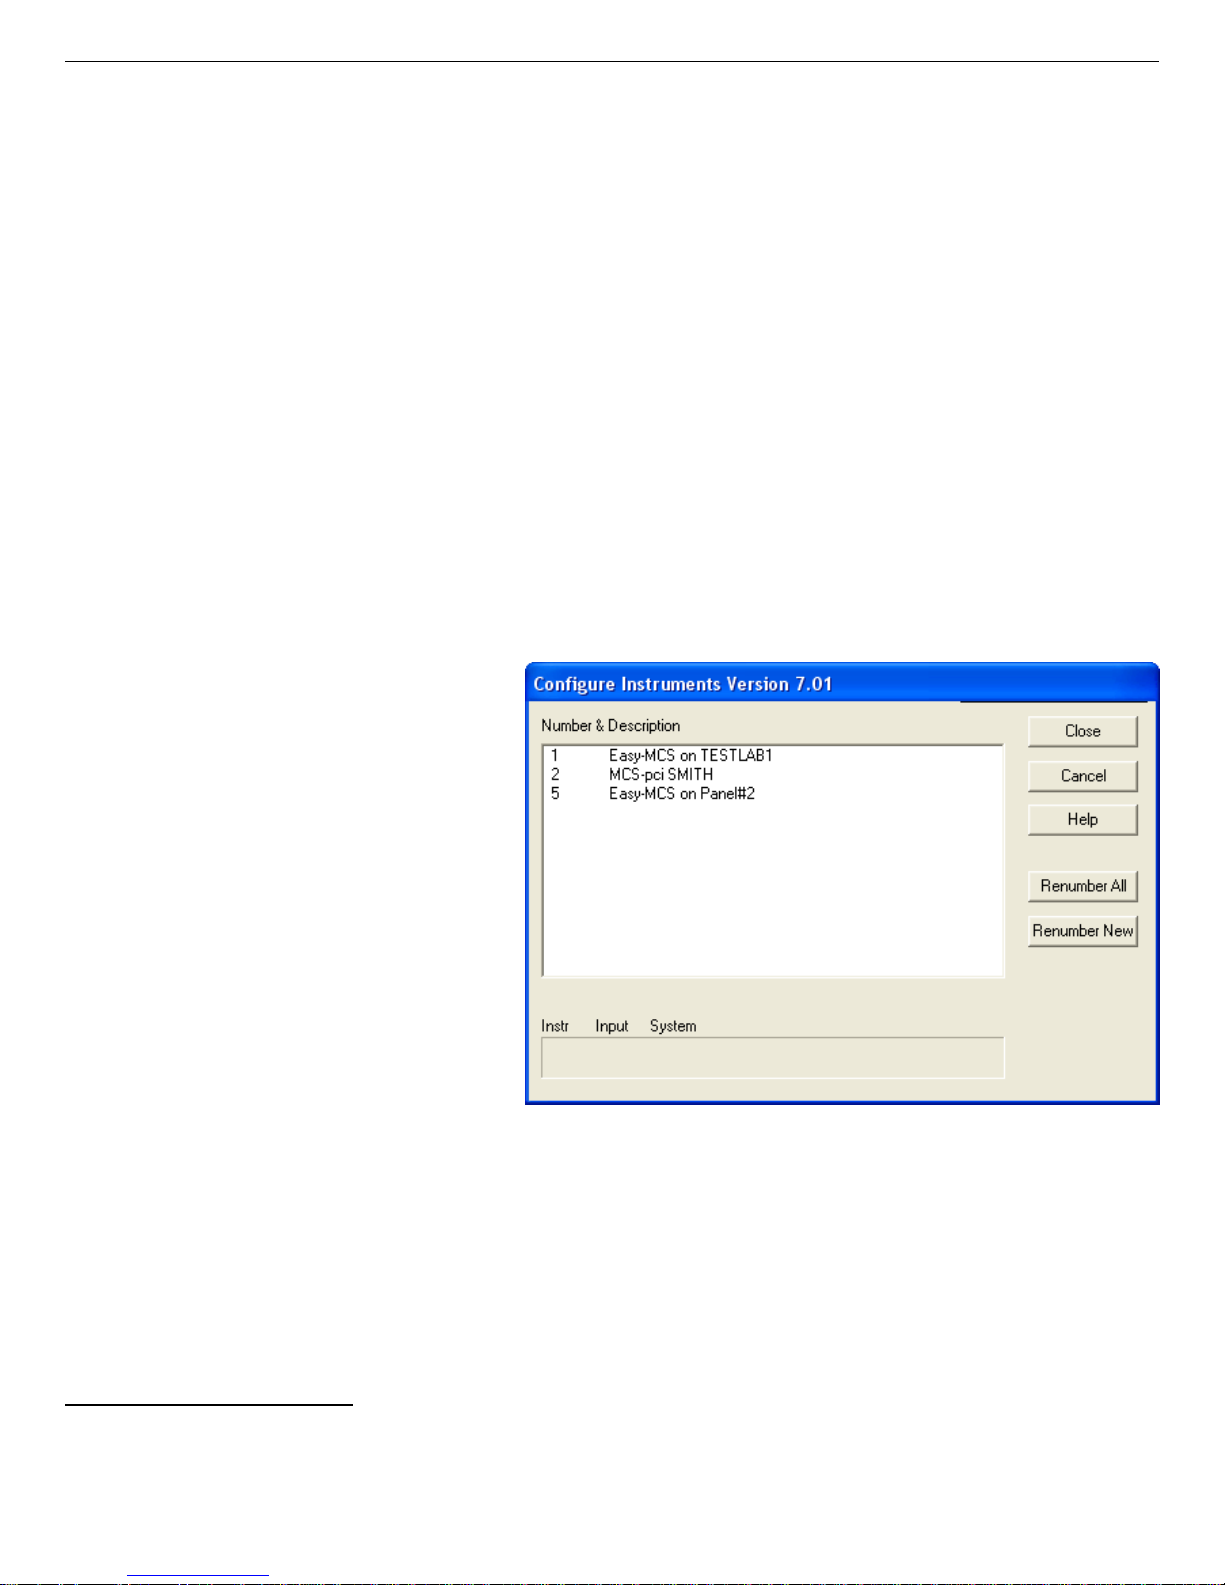
When MCS Configuration runs,
it searches the computer and the
network (if any) for MCSs, then
displays a master list of the
1
instruments found (Fig. 2).
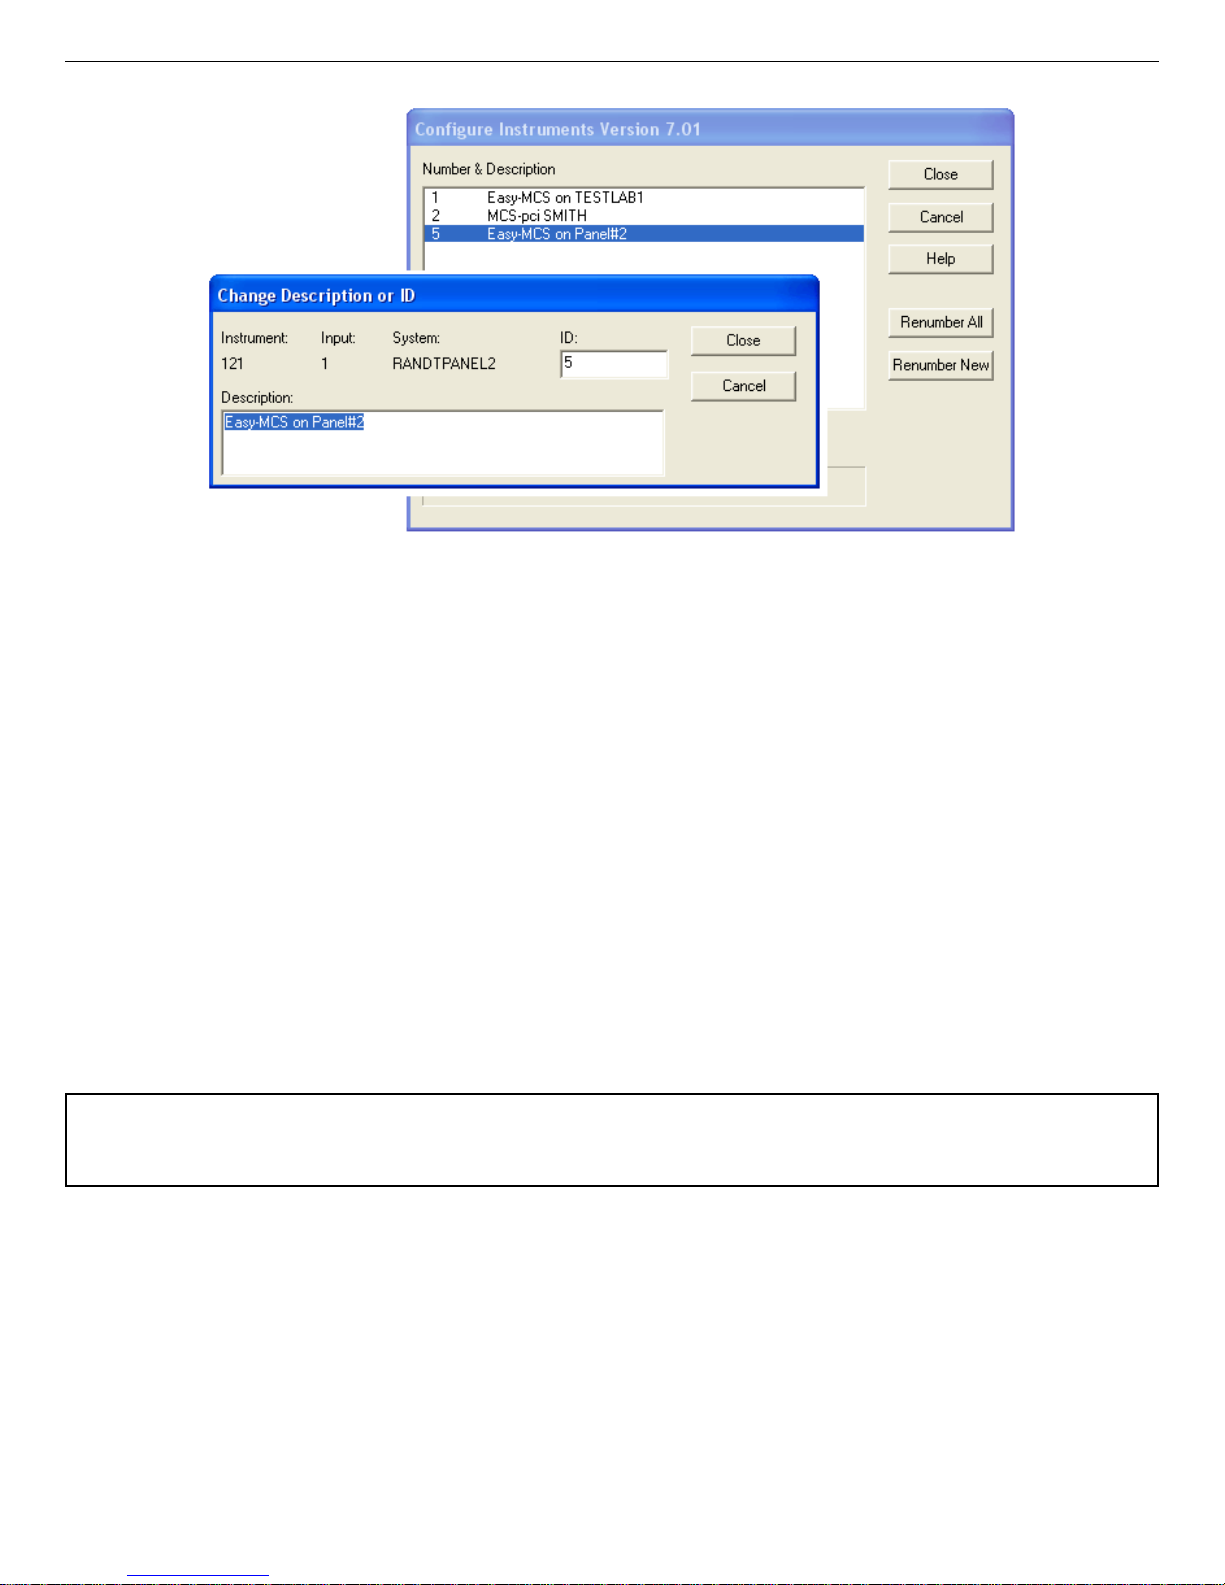
You can change the instrument
numbers and descriptions by
double-clicking an instrument
entry in the list. This opens the
Change Description or ID dialog
(Fig. 3). It shows the physical
detector location (read-only) and
allows you to change the ID and
Fig. 2. MCS Numbering and Descriptions.
Description. When you close
the dialog, any changes you have
made to an ID num ber or description will be written back to the corresponding MCS. Complete
details on assigning MCS numbers and descriptions are in the C
ONNECTIONS Driver Update Kit
instructions.
1
MCS Configuration will also locate and display any ORTEC spectroscopy units in your system. To see only the
list of MCS units in your system, use the Select MCS command discussed in Section 6.6.2.
12
Page 23
931054C / 1213 3. HARDWARE AND SOFTWARE INSTALLATION
Fig. 3. Change MCB Number or Description.
NOTE Remember that some applications use the instrument number to refer to a specific MCS
or device (e.g., the
.JOB file command SET_DETECTOR 5). Therefore, you may wish
to avoid changing an instrument’s number so all defined processes will still operate.
You are now ready to run one instance of the MCS-32 software for each Easy-MCS connected to
your computer (to a limit of 8), as described in the remainder of the manual.
3.5. Attaching More Than One Easy-MCS to the Computer
Once the driver for one Easy-MCS has been installed, simply attach the new unit(s) to a USB
port or powered hub on the computer. You can attach as many as eight (8) Easy -MCSs to a
single computer.
REMINDER Be sure to run MCB Configuration every time you add new Easy-MCSs (or
other ORTEC instruments) to your system .
3.5.1. Connecting to and Disconnecting from the Computer
The USB connection allows you to connect Ea sy-MCSs to and disconnect them from a USB port
without shutting down the computer or USB hub. If you disconnect the Easy-MCS while the
MCS-32 program is running, simply close and reopen the MCS-32 program to re-detect the
instrument.
13
Page 24

Easy-MCS ™ Multichannel Scaler and MCS-32 (A73-B32) Software 931054C / 1213
[Intentionally blank]
14
Page 25
4. GETTING STARTED — MCS-32 TUTORIAL
This chapter is a short tutorial to help first-time users. It tells you how to:
! Set up an acquisition
! Collect data
! Store spectra to and retrieve them from disk.
! Abort a data acquisition
This tutorial assumes that your Easy-MCS and MCS-32 software have been installed as
described in Chapter 3.
4.1. Preparing To Acquire Data
The first step is to start MCS-32 and prepare the hardware for acquisition.
1) Start MCS-32
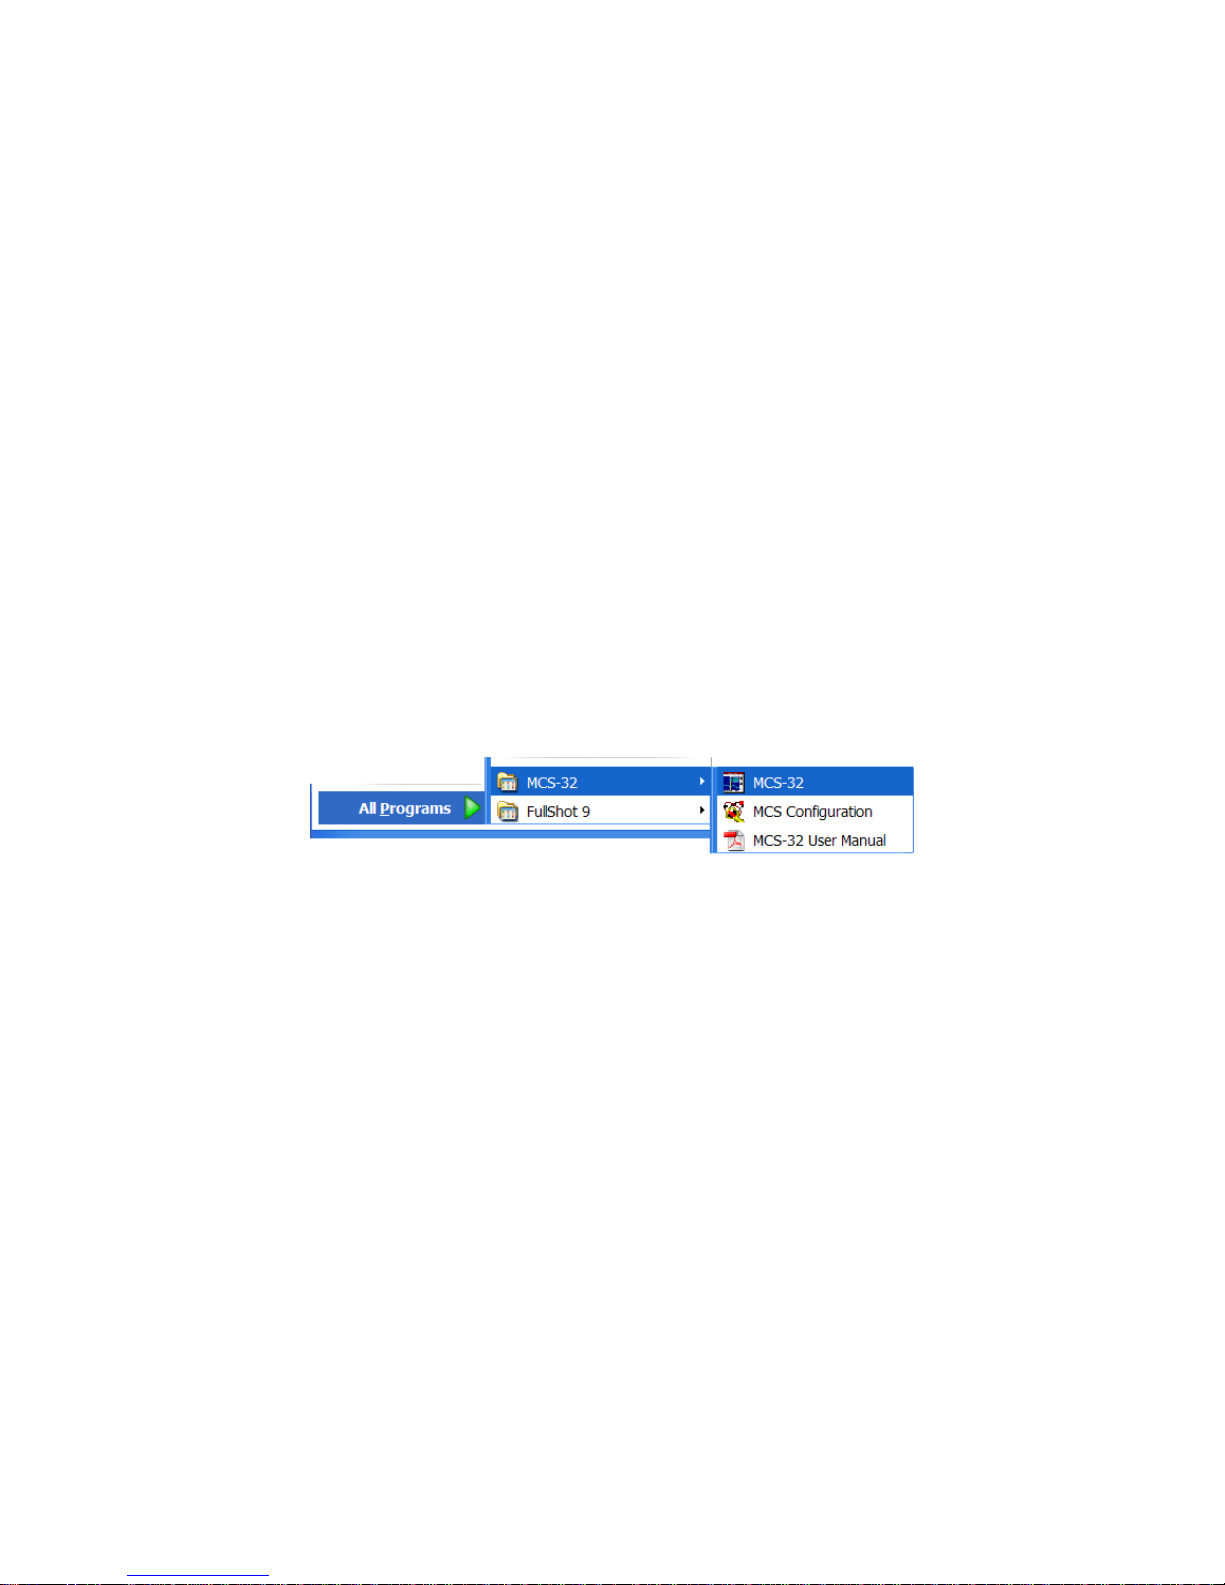
From the Windows Start menu, type mcs in the “
click the MCS-32 search result; or open the Windows Start menu and click MCS-32, then
MCS-32 (Fig. 4).
Fig. 4. Starting MCS-32.
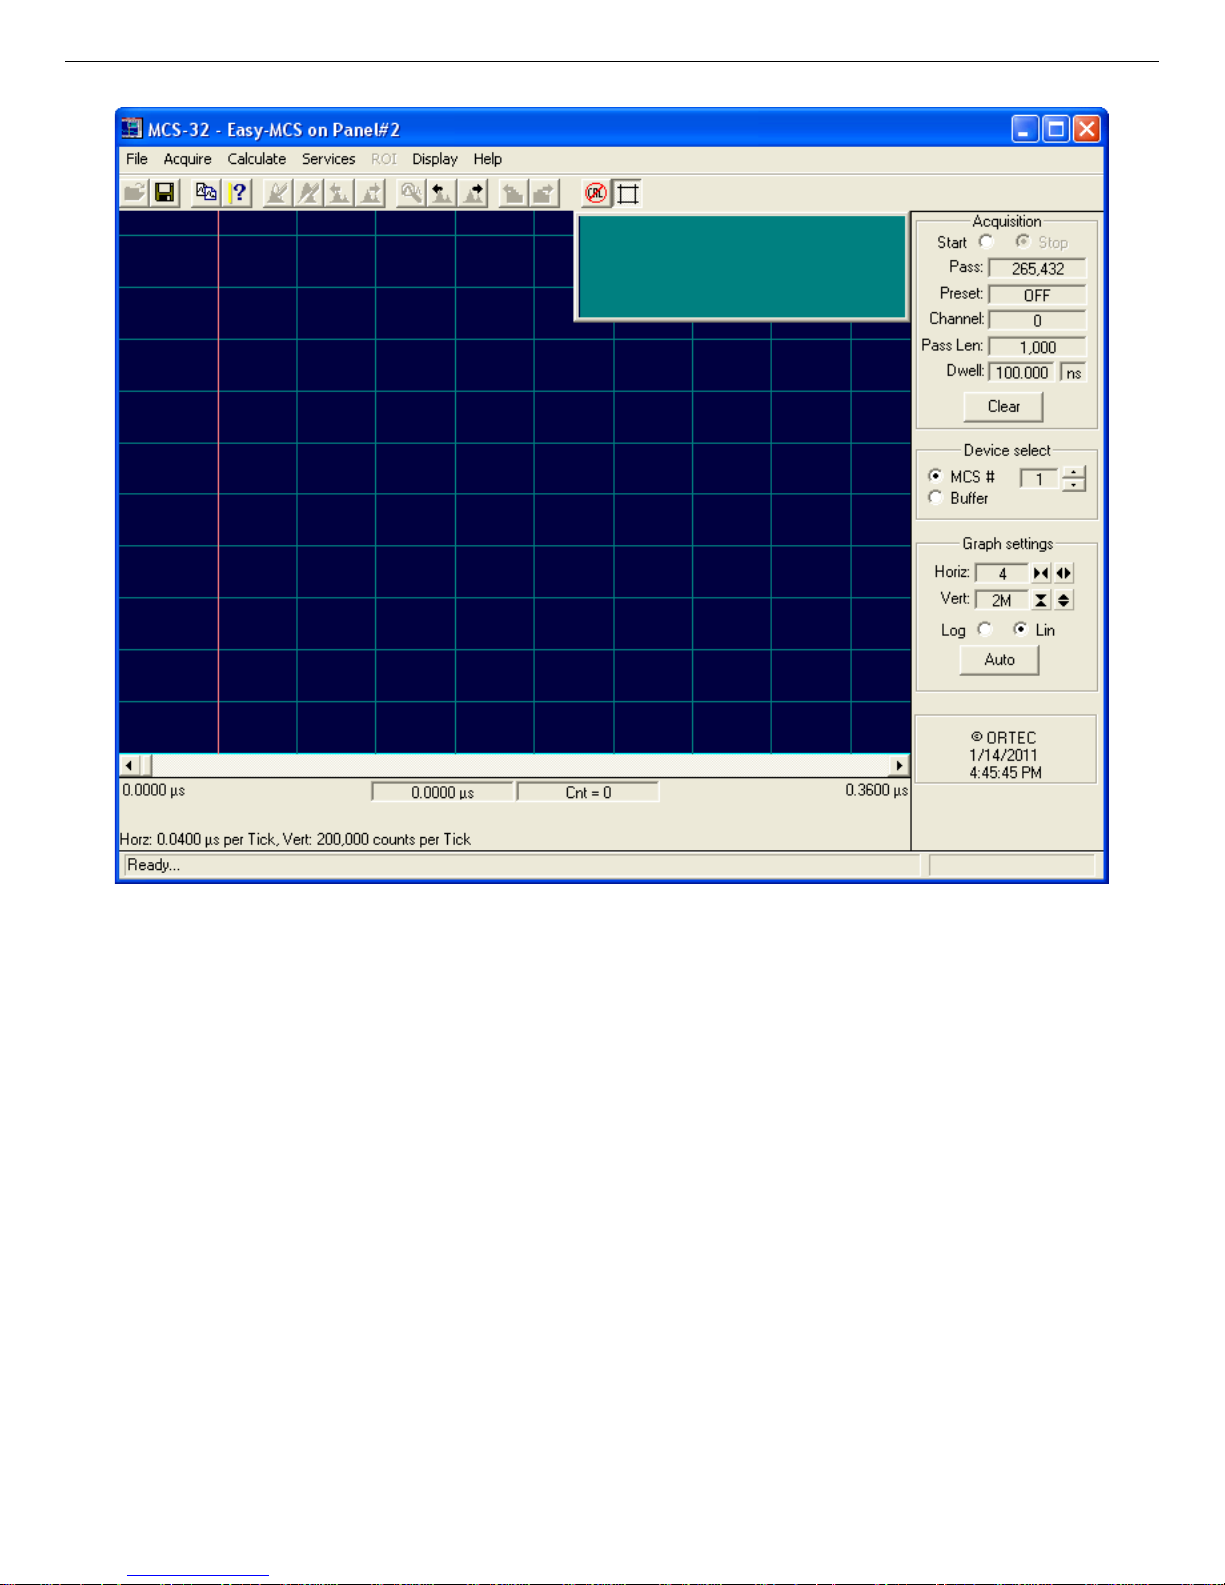
The startup screen for MCS-32 will look similar to Fig. 5. N ote that the program starts in
MCS mode (i.e., live monitoring of an MCS instrument) by default. See Section 5.2 for a
discussion of the horizontal and vertical scaling.
2) Stop any current acquisition and clear the data
! Check the Stop radio button in the upper section of the sidebar on the right of the screen.
If it is not marked with a black dot, the MCS is collecting data. Click the Stop button
until it is marked (this shouldn’t take more than two clicks.
search programs and files” box, then
! Next, click the Clear button near the middle of the sidebar. This clears any data in the
MCS that may have been left over from a previous experiment.
You are now ready to get started with your first acquisition. However, before starting an
acquisition, you must set the pass and input control parameters.
15
Page 26
Easy-MCS ™ Multichannel Scaler and MCS-32 (A73-B32) Software 931054C / 1213
Fig. 5. The MCS-32 Screen.
1) Select Pass Control... from the Acquire menu
To set the pass control parameters, click the Acquire menu at the top of the screen, and
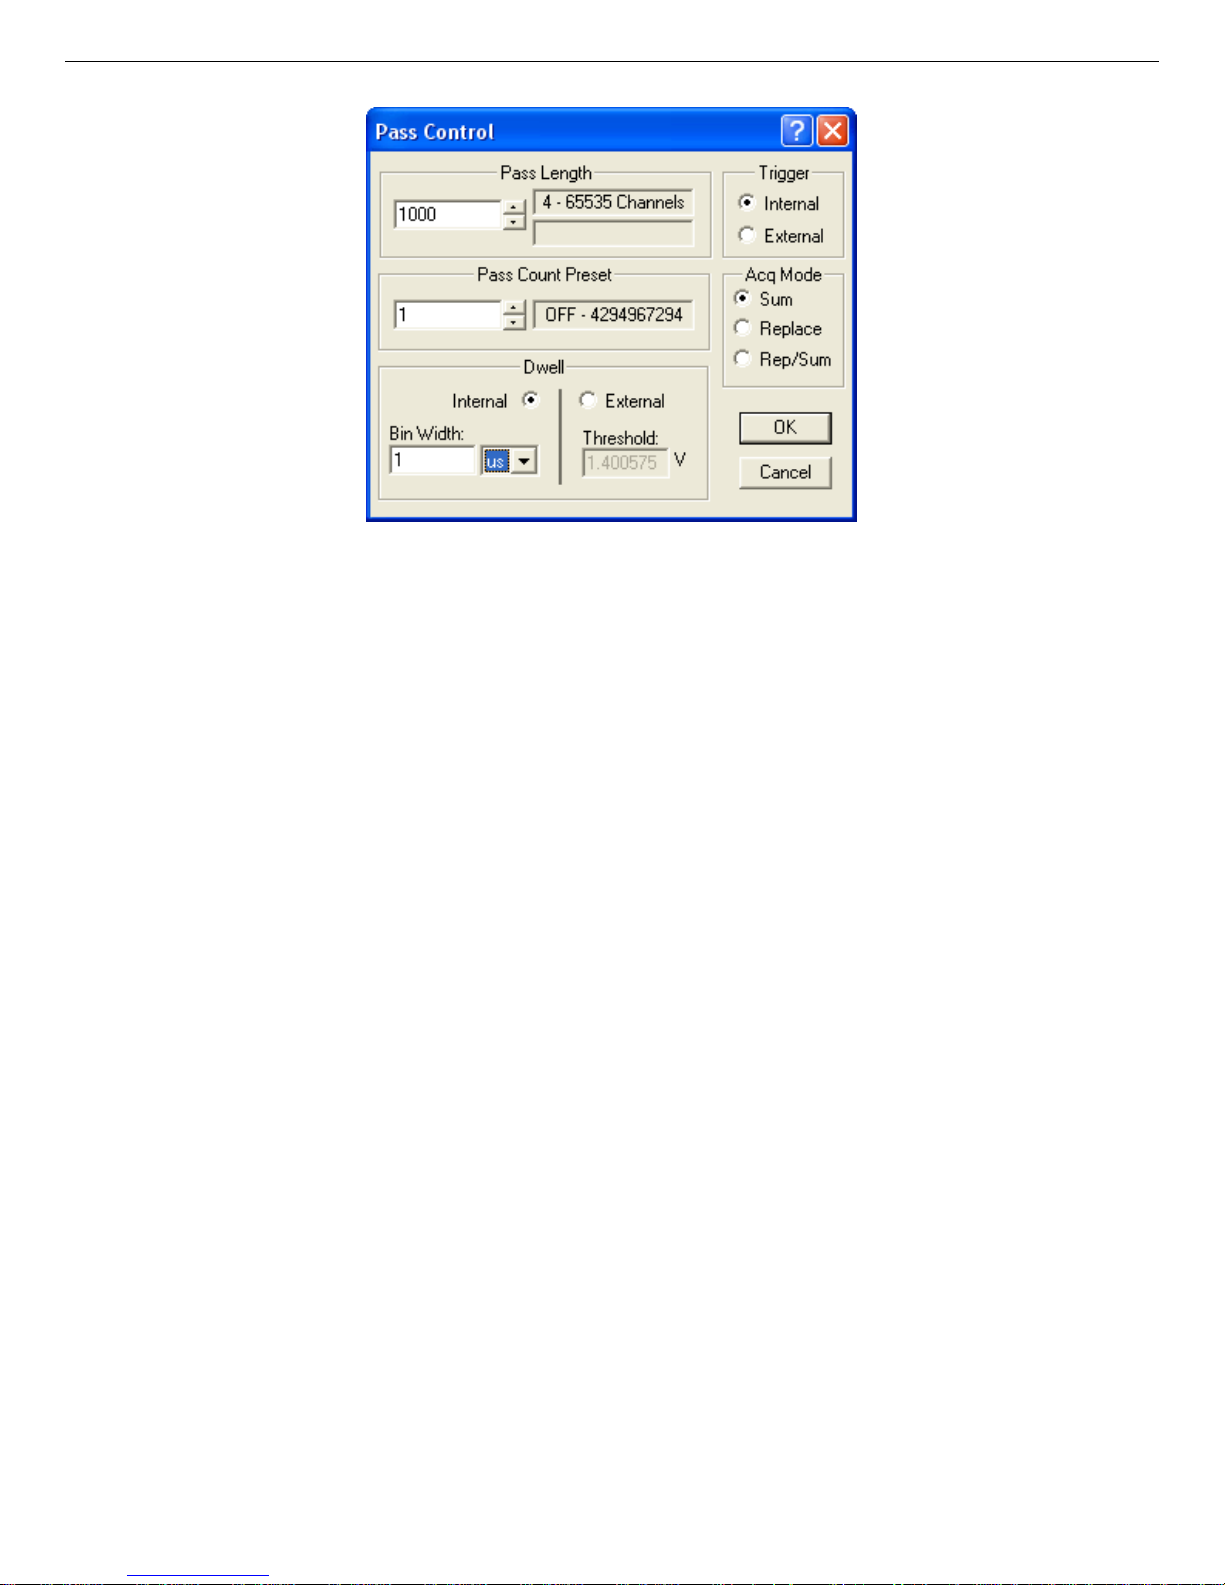
select Pass Control.... This will open the Pass Control dialog shown in Fig. 6.
2) Set the Pass Length to 1000
Assume that 1000 channels of data are required. To set the Pass Length to 1000, double-
click the current value to highlight it (or click and drag across it until it is highlighted).
Type 1000 (this will overwrite the previous value), but don’t click OK yet.
3) Set The Pass Count Preset to 1
Use the same procedure as was used for Pass Length. Double-click the current value and
type 1 (which will overwrite the preceding value), but don’t yet click OK.
16
Page 27
931054C / 1213 4. GETTING STARTED — MCS-32 TUTORIAL
Fig. 6. Pass Control Dialog.
4) Set the Dwell Time to 1 µs
Click the Internal dwell radio button. Next, set the value in the box to 1. Finally, select the
time units from the list beside the Bin width field. Click the down-arrow to open the list
and select uS to set the range to microseconds. Don’t click OK yet.
5) Set the Acq Mode (acquire mode) to Sum
If the Sum button is not already m a rked with a dot, click it to mark it.
6) Set the Trigger to Internal
If the radio button labeled Internal is not already marked with a black dot, click it to mark
it.
7) Click OK to accept these settings
If you’ve entered all of the fields correctly, the Pass Control dialog will look exactly like
Fig. 6. If everything is correct, click the OK button to accept the settings.
4.2. Collecting Data
At this point, you have set the pass parameters for the acquisition. You are now ready to start
data acquisition and see what happens.
1) Start data acquisition
! The Start button is at the top of the sidebar. Click it to start the acquisition.
17
Page 28
Easy-MCS ™ Multichannel Scaler and MCS-32 (A73-B32) Software 931054C / 1213
! Note that several things happened after you clicked on Start:
(a) The Start button was highlighted for an instant, indicating that acquisition was
taking place. Since the dwell time was 1 μs and the pass length was 1000, the
acquisition lasted 1 μs × 1000, or only 0.001 second.
(b) The Pass Count changed from 0 to 1 on the sidebar.
(c) No data were collected because there was no input. (You m a y have acquired a few
counts if anything is connected to your instrument’s DISC or SCA inputs.)
! If you want to see it happen again, click the Clear button. Note that the Pass value
changes from 1 to 0. Click Start again.
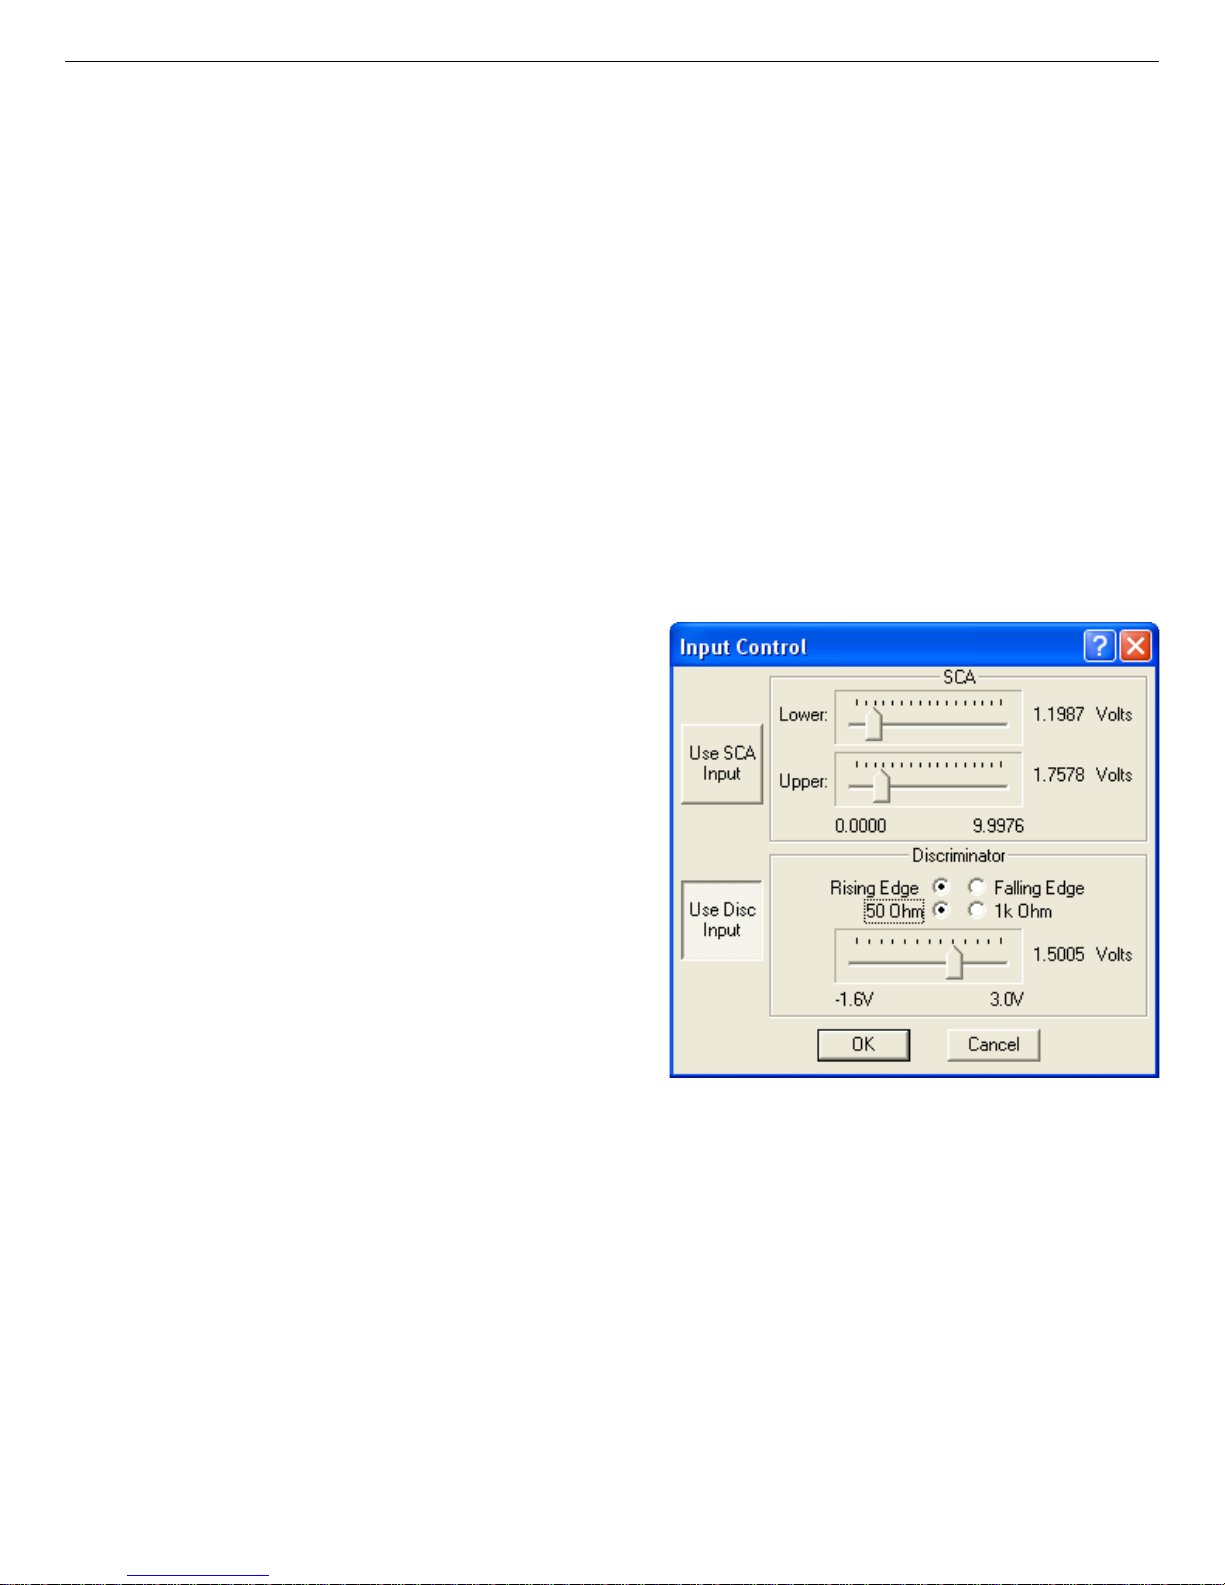
2) The next step: Select Input Control... from the Acquire Menu
Click the Acquire menu and select
Input Control.... This will open the
dialog shown in Fig. 7.
3) Choose which input to use
The Easy-MCS has two different inputs:
a fast discriminator and a single-channel
analyzer (SCA). In general, the fast discriminator is used to count pulses with
fast edges (<100 ns), while the SCA is
used to count slow-positive pulses (pulse
widths from 0.5 μs to 100 μs). For this
tutorial, connect the Channel Advance
output to the discriminator input so the
discriminator will be used.
4) Connect the CHANNEL ADVANCE
Output to the DISC input
Fig. 7. Input Control Dialog.
With a 50-Ω coaxial cable, connect the BNC labeled Channel Advance Output to the BNC
on the MCS-PCI-OPT2 Fan-Out Cable that you installed on the Easy-MCS. Note that there
is also a Channel Advance Input, so be careful to connect to the correct BNC. If you do not
have a fan-out cable, you will need to m a ke a wired connection between the appropriate
two pins on the 25-pin D connector illustrated in Fig. 60 (page 92).
18
Page 29

931054C / 1213 4. GETTING STARTED — MCS-32 TUTORIAL
5) Select the Discriminator
If the Use Disc Input button does not look “pushed in” or highlighted, click it.
6) Set the Discriminator to Rising-Edge-Triggered
The discriminator can trigger on rising or falling edges. To select Rising-Edge-Triggered,
click the Rising Edge radio button until it is marked with a dot.
7) Set the Discriminator Voltage to 1.5 V
! Since the Channel Advance Output signal goes from a low value of 0.8 V (max) to a
high value of 2 V (min), use the Discriminator slide bar to set the threshold to 1.5 V.
! Click and drag the slider button toward the 1.5-V setting. Note how much the voltage
readout (located to the right of the slide bar) changes as you move the slider.
! To make fine adjustments to the voltage, click to the immediate right or left of the slide
button. To make super-fine adjustments, click the slide bar once to activate it, then use
the <7> and <6> keys.
! When the discriminator is set to 1.5 V, click the OK button to close the dialog.
You are now ready to run another experim e nt.
8) Clear the data and start another acquisition
! Click the Clear button followed by Start. This time you should get some data.
! Look at the Marker counts at the bottom center of the screen. T here should be 1 count in
the marker channel.
! Click the Auto button in the lower section of the sidebar. This changes the vertical scale
to 16, so you should be able to see exactly 1 count in every channel. This makes sense
because you are counting the edge that indicates we are moving from one channel to the
next.
It’s now time to collect more data by acquiring more than one pass.
9) Select Pass Control... from the Acquire menu
! Click the Acquire menu and select Pass Control.... This will open the dialog shown in
Fig. 6.
19
Page 30

Easy-MCS ™ Multichannel Scaler and MCS-32 (A73-B32) Software 931054C / 1213
! Set the Pass Count Preset to 1000, then click OK.
10) Clear and start
! Click Clear, then Start.
! This time the pass count should go to 1000, and there should be 1000 counts in every
channel. Click the Auto button to scale the data in the Expanded Display W indow.
11) Reduce the horizontal scale to 62
! In the sidebar, click the down arrow beside the Horiz field until the value is 62. This
zooms in on the data so that there are only 62 data points displayed across the screen.
! Notice that the full display in the corner still displays the entire spectrum. The part of the
full display visible in the expanded display has the sam e color background as the
expanded display, while the rest of the spectrum has a different color background.
12) Point and Click in the Full Display Window and click
This causes the expanded display to move to the area pointed to in the full display. Note
that the marker channel changes at the bottom of the screen. Try it a few times.
13) Point and Click in the Expanded View and click
This moves the ma rker channel in the expanded display and changes the marker
information at the bottom of the screen.
14) Highlight a range of channels
! Click somewhere in the expanded display.
! Click and drag to the left or right across the spectrum. Note that the marker width
increases as you continue dragging the mouse across the screen.
! When you release the mouse button, this set of channels stays highlighted. You can now
manipulate this block of channels, such as m a rking them as a region of interest (ROI); or
calculating their centroid, gross area and net area.
15) Use the Data Info command from the Calculate menu
! Click the Calculate menu and select Data Info.
! Notice that the Marker Information Line at the bottom of the screen is now reporting a
centroid, gross area, and net area for the set of channels you just highlighted. (Since the
spectrum is flat, the centroid and net area aren’t very exciting.)
20
Page 31
931054C / 1213 4. GETTING STARTED — MCS-32 TUTORIAL
You have now been introduced to the major aspects of acquiring, viewing, and analyzing data.
The next step is to save the data to disk.
4.3. Saving and Retrieving Your Data
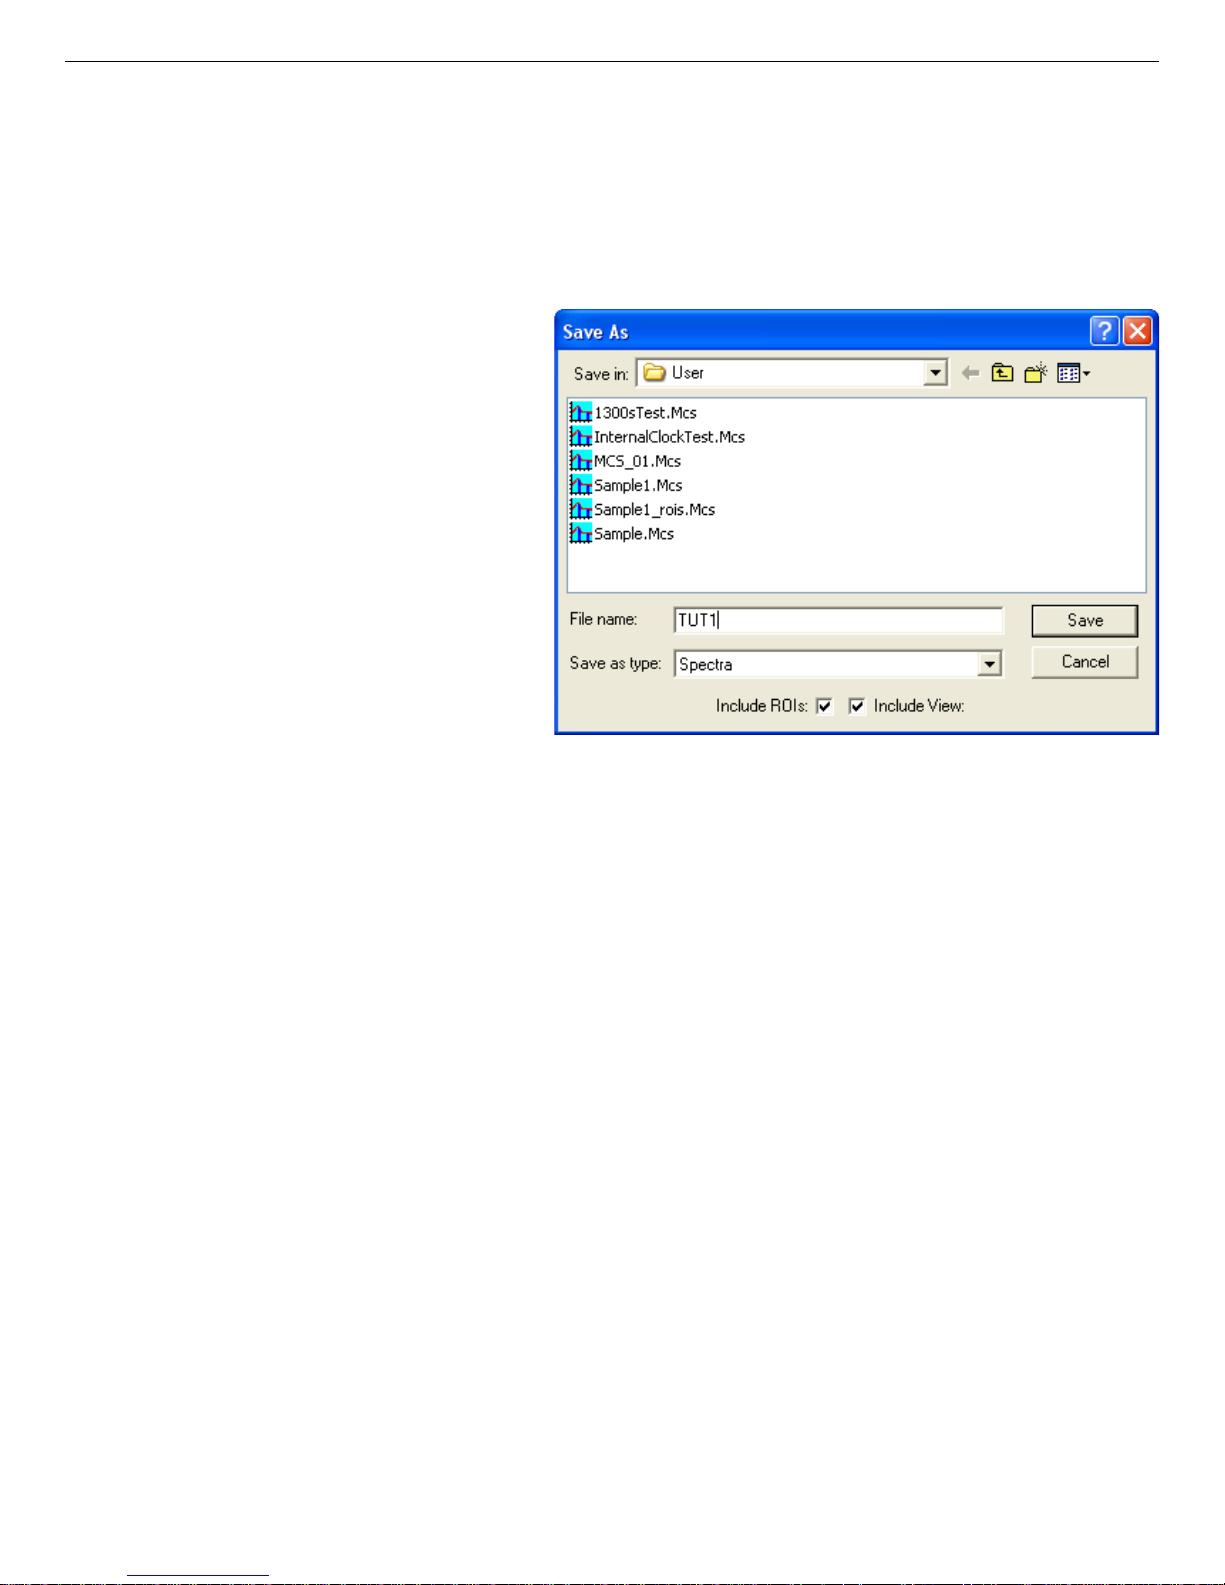
1) Save the spectrum to disk
! Select Save Data As... from
the File menu. This will open
the dialog shown in Fig. 8.
! Name the file
this, type
TUT1. To do
TUT1 in the File
name field, then click the
Save button. Your file,
TUT1.MCS, will be saved in
the default directory. First,
though, the Sample Description dialog will open so you
can describe what’s stored
in the file. You’ll see this
description again when you
retrieve the spectrum.
! Enter
Tutorial Data as the sample description.
Now it’s time to retrieve your file.
2) Switch to buffer mode
Fig. 8. Save File TUT1.MCS.
! The buffer is simply a place w here you can work with your data without tying up the
MCS. For example, you can be running a long acquisition on the MCS and, at the same
time, be analyzing old data in the buffer. The buffer is completely separate, and will
retain any data you put there until y ou clear it, overwrite it, or exit the software.
! Click the Buffer radio button in the lower section of the sidebar. The screen should
change so that only 16 channels are displayed and all the data points are zero.
3) Load
TUT1.MCS into the buffer
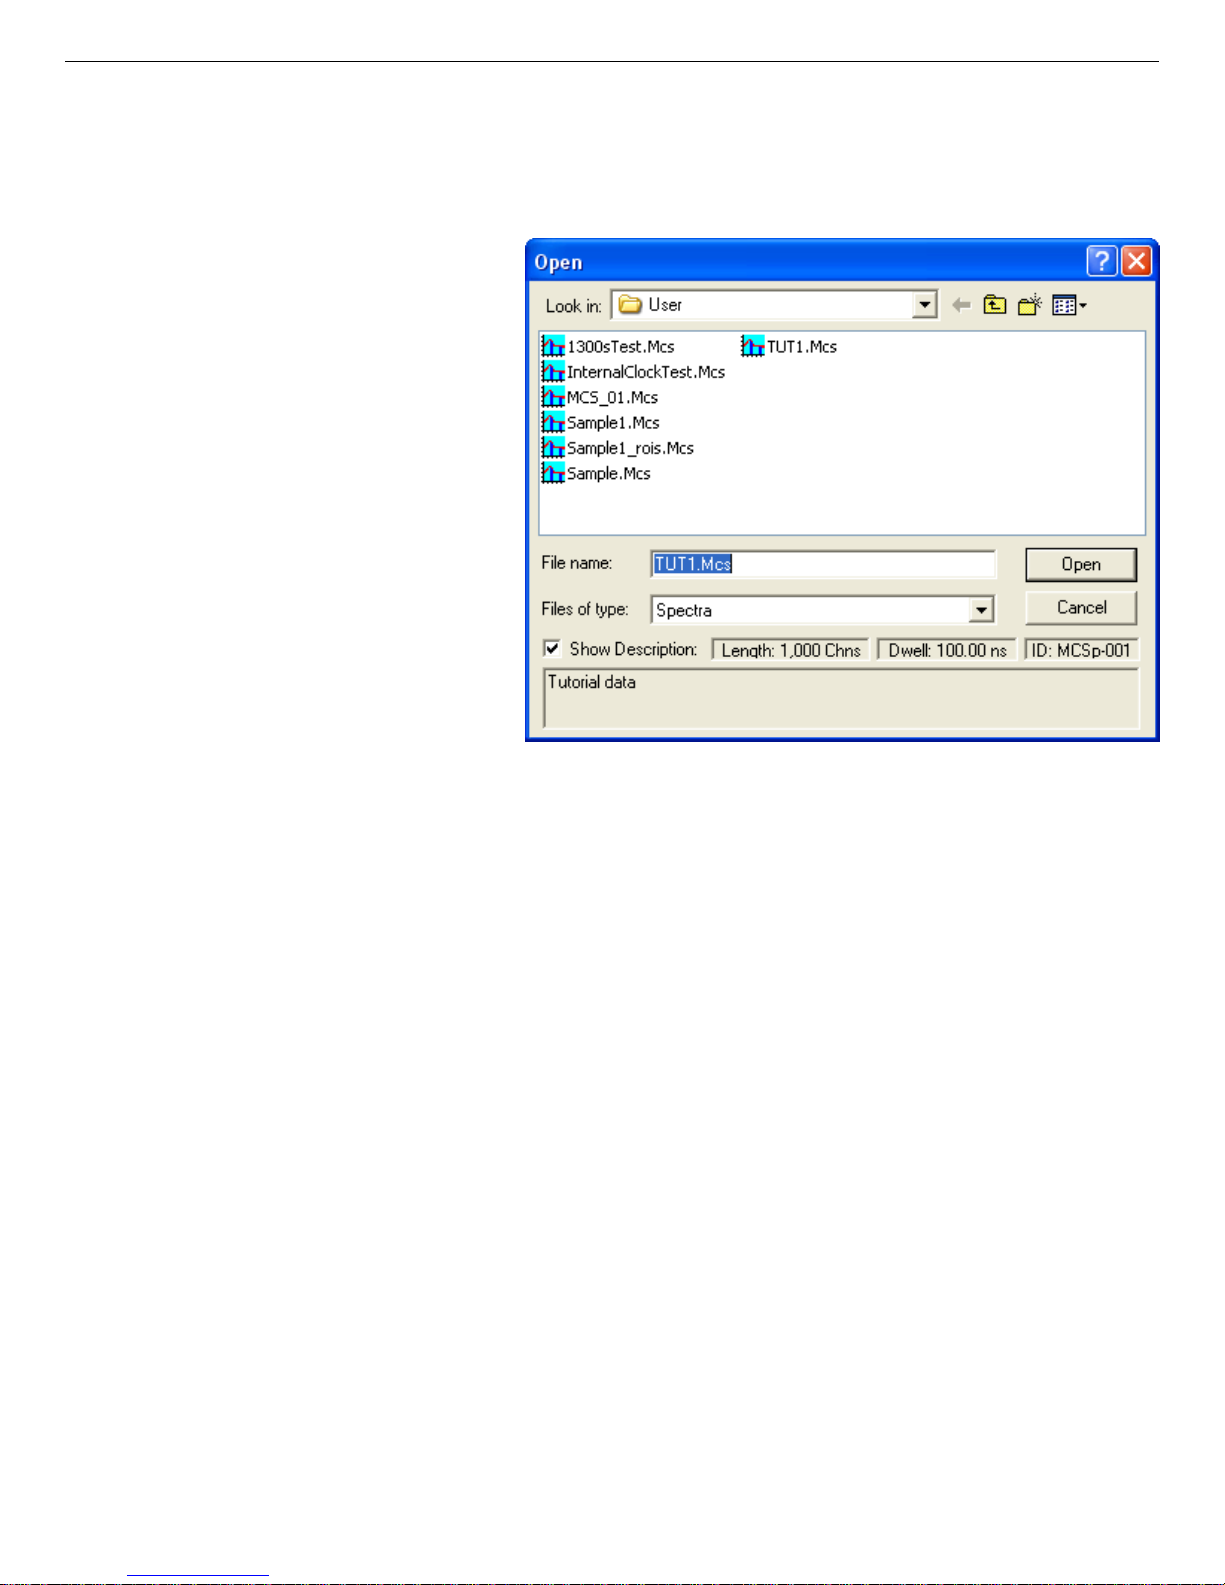
! To recall your spectrum file into the buffer, select Recall Data... from the File menu.
This will open the dialog shown in Fig. 9.
21
Page 32
Easy-MCS ™ Multichannel Scaler and MCS-32 (A73-B32) Software 931054C / 1213
! The main section of this dialog is a list-of-files box. One of the files in the list should be
TUT1.MCS. Click the filename to highlight it. Now notice that the sample description
you just entered,
Tutorial Data, is displayed in the bottom section of the dialog.
! Click the Open button
to load the file. The data
saved from the MCS will
appear in the full and
expanded displays.
! This was a very round-
about way to load the MCS
data into the buffer (it was
a quick way to demonstrate
the Save Data As... and
Recall Data... commands).
The faster and more direct
way to do it is to use the
MCS > Buffer command
on the Acquire menu.
Fig. 9. Recall (retrieve) File TUT1.MCS.
During normal operation
(as opposed to a tutorial),
you don’t have to save the data to a file unless you wish to.
4) Use the MCS > Buffer Command to transfer data from the MCS to the buffer
! Clear the data in the buffer by clicking the Clear button just as you would do to clear the
data in the MCS.
! Switch back to MCS mode by clicking the MCS# radio button in the lower section of the
sidebar.
! Select MCS > Buffer from the Acquire menu.
! Return to buffer mode by clicking the Buffer radio button. Notice that the data has been
transferred.
It’s now time to return to the MCS and do a few more acquisitions to explore the ways to abort
an MCS-32 data acquisition.
22
Page 33

931054C / 1213 4. GETTING STARTED — MCS-32 TUTORIAL
4.4. Aborting Data Acquisition in MCS-32
1) Enter a new round of data acquisition presets
! Click the MCS# radio button to return to MCS mode.
! Select Pass Control... from the Acquire menu.
! Set the Pass Length to 20.
! Set the Pass Count preset to 1000.
! In the Dwell Time section, set Bin Width to 1 second (the time unit from the list will
be seconds, s).
! Click OK to close the dialog.
2) Clear the data and start an acquisition
! Now the sidebar display is changing more slowly because the time unit is 1 second
instead of 1 microsecond. Notice that the current channel, displayed in the Channel field
on the sidebar, is incrementing slowly (once per second). Also, each time the Channel
value reaches 19, it returns to zero and the pass count increments.
! Click the Auto button to scale the data. You should be able to see individual points
move as the MCS advances from one channel to the next. You are collecting exactly 1
count per channel.
! You will notice that the Start radio button stays highlighted. It will remain highlighted
until the acquisition is completed. With the current settings, this will take 20,000
seconds (1000 passes × 20 channels/pass × 1 second/channel).
! Since this exercise was introduced as a short tutorial, it’s time to abort the acquisition
and move on to explore yet another aspect of the MCS-32 software.
3) Abort the acquisition
! Wait until the current channel is less than 10, then click the Stop button. You will notice
that the current channel keeps incrementing, and the Stop button starts flashing.
! If you now wait (w ithout clicking Stop again) for the channel to reach zero again, you’ll
see the mark in the Start button clear, while at the same time, the Stop button will stop
flashing and will now display the mark (dot).
23
Page 34

Easy-MCS ™ Multichannel Scaler and MCS-32 (A73-B32) Software 931054C / 1213
! Here’s what’s taking place: when you click Stop once, this tells the MCS that you want
to stop at the end of the current pass. While this pass is finishing, the Stop button blinks
so you’ll know the command was accepted. When the MCS finishes this final pass, Stop
is marked, indicating that acquisition has ended.
If you don’t want to wait for the last pass to finish (that is, if you want to quit
immediately):
4) Abort the acquisition im mediately
! Click the Start button to restart the acquisition.
! Click the Stop button once; notice that it starts flashing.
! Click Stop again. Now acquisition has come to a complete stop. Notice that there is a
step in the data where the pass was stopped.
This concludes the MCS-32 tutorial. It has introduced you to just a few of the important features
of the MCS-32 program. You may wish to go to Chapter 6, which discusses all of the menu
commands in detail.
24
Page 35
5. DISPLAY FEATURES
This chapter explains the MCS-32 software’s display features, discusses the role of the mouse
and keyboard, covers the use of the Toolbar and sidebars, discusses how to change to different
disk drives and folders, and shows how to use additional features such as Help.
5.1. Screen Features
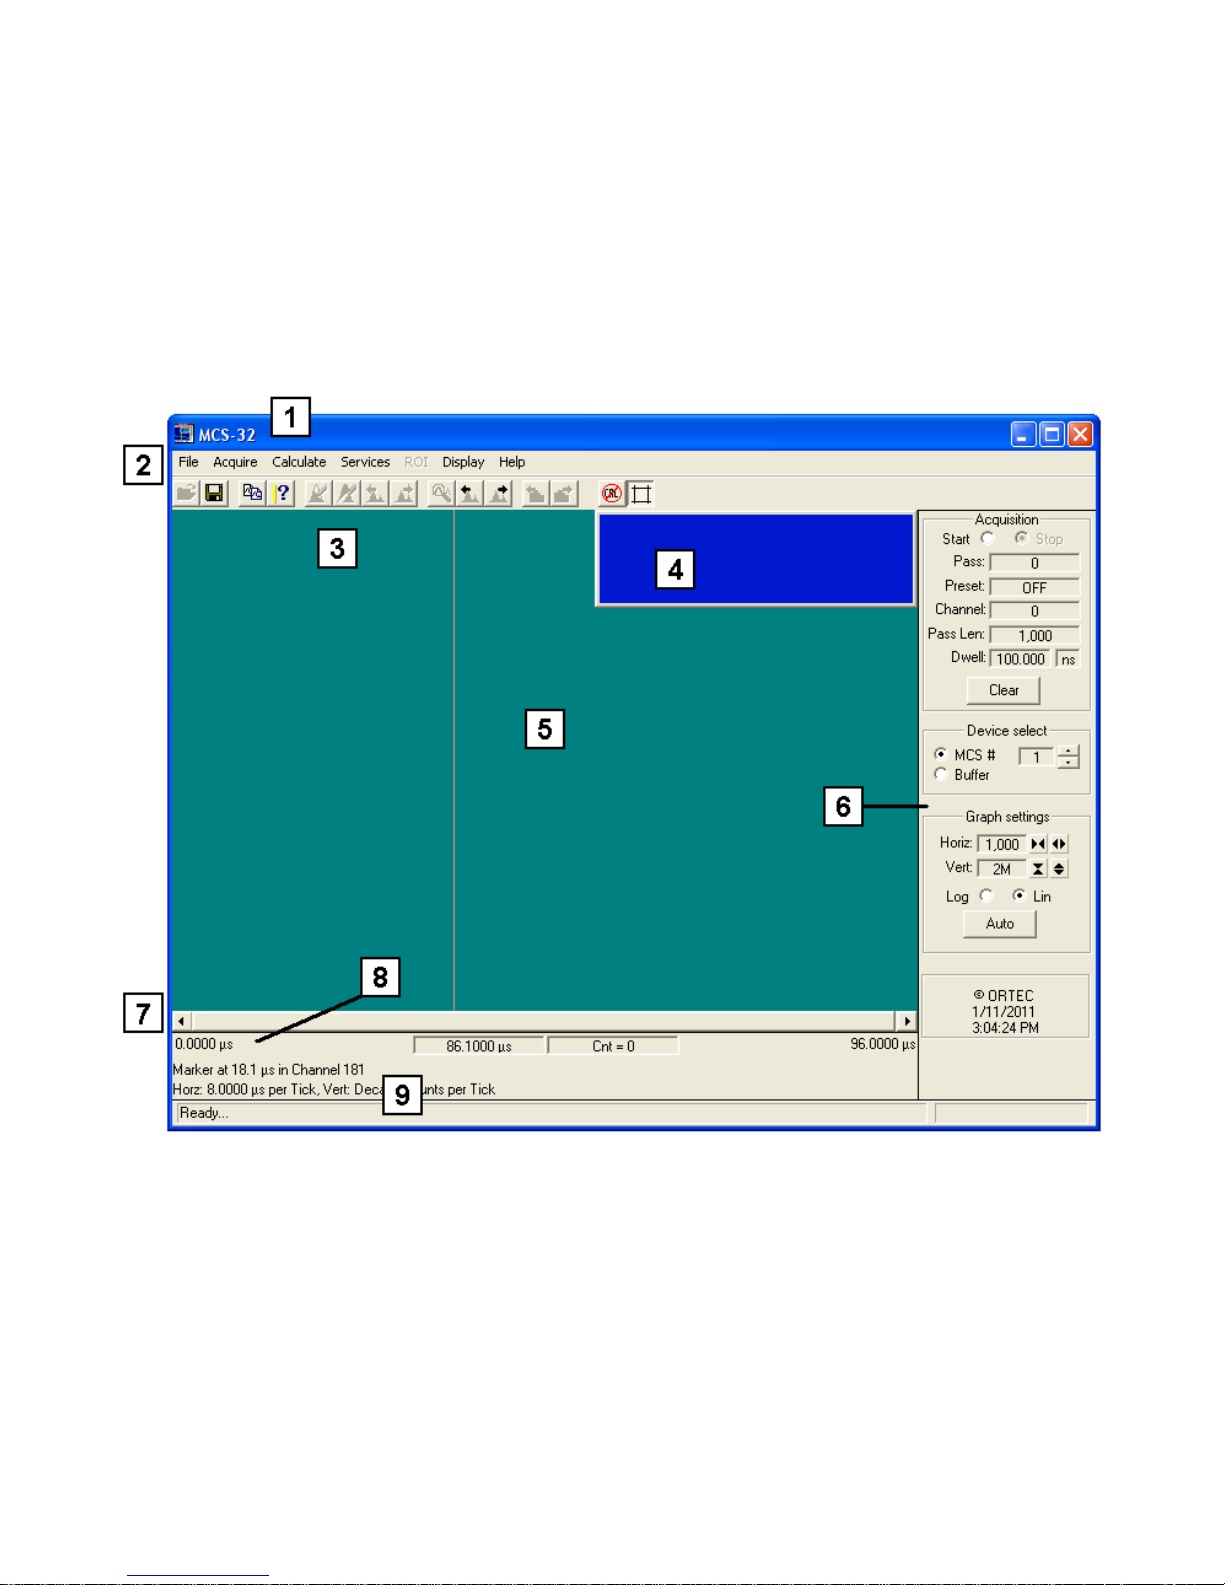
Figure 10 shows the major screen features of MCS-32:
Fig. 10. Main MCS-32 Screen Features.
1) Title bar, showing the source of the currently displayed spectrum. This is either the MCS
description; the word “Buffer” if the buffer is selected; or a file name, if a file has been
saved or recalled and not yet modified (if a sample description has been entered for the file,
it will accompany the file name). On the far right are the Minimize, Maximize, and Close
buttons.
25
Page 36

Easy-MCS ™ Multichannel Scaler and MCS-32 (A73-B32) Software 931054C / 1213
2) Menu Bar, showing the menu commands (w hich can be selected with either the mouse or
keyboard); these functions are discussed in detail in Chapter 6.
3) Toolbar, beneath the Menu Bar, contains buttons for 15 of the most commonly used
MCS-32 commands.
4) Full Display Window, showing the complete histogram from the MCS memory, buffer, or
file, and indicating which part of the spectrum is now displayed in the Expanded Display
Window. The vertical scale is always logarithmic. The expanded part of the spectrum is
highlighted in a different color than the rest of the spectrum. Clicking any part of the spectrum in this window will display that part of the spectrum in the expanded window; the
expanded window will be centered on the channel where the mouse was clicked. The Full
Display Window can be moved and sized (see Section 5.4.2).
5) Expanded Display Window, showing all or part of the complete histogram. In this window,
you can change the vertical and horizontal scaling, and perform a number of analytical
operations such as calculating peak information, marking ROIs, locating library peaks, or
calibrating the spectrum. This window also contains a vertical line called a marker that
highlights a particular position in the spectrum.
6) Sidebar, on the right side of the screen, providing information on the current MCS presets
and counting times, the time and date, MCS vs. buffer mode, and vertical and horizontal
scale. The MCS# and Buffer radio buttons allow you to switch between modes. The pairs of
arrow buttons next to the vertical- and horizontal-scale readings are used to adjust the
scaling. The Auto button automatically sets the vertical scale of the expanded display.
7) Horizontal Scroll Bar, directly beneath the expanded display, lets you scroll through the
expanded display at any horizontal and vertical scale.
8) Marker Information Line, beneath the scroll bar, showing the channel in which the marker
is currently positioned, and its calibration and contents. The Display menu and Toolbar contain a toggle that lets you switch between calibrated units and time units when running in
internal dwell mode.
9) Supplementary Information Line, below the Marker Information Line, used to show
results of certain calculations, display warning me ssages, or post instructions during certain
procedures.
26
Page 37

931054C / 1213 5. DISPLAY FEATURES
5.2. Two Spectrum Displays
The Full and Expanded Display Windows show, respectively, a complete histogram of the current spectrum (whether from an MCS or the buffer) and an expanded view of all or part of the
spectrum. These two windows are the central features of the MCS-32 screen. All other windows
and most functions relate to the spectrum windows. The Full Display Window shows the entire
data memory of the MCS as defined in the configuration. In addition, it has a marker box showing which portion of the spectrum is displayed in the Expanded Display Window.
The Expanded Display W indow contains a reverse-color marker line at the horizontal position of
the pixel representing the marker channel. This m a rker can be moved with the mouse pointer, as
described in Section 5.4.1, and with the <7>/<6> and <PgUp>/<PgDn> keys.
Note that in both spectrum windows the actual spectrum is scaled to fit in its window as it
appears on the display. Also, since both windows can be resized, it follows that the scaling is not
always by pow ers of two, nor even integral multiples. Therefore, MCS-32 uses algorithms to
scale the window properly and ma intain the correct peak shapes regardless of the actual size of
the window. The vertical scale in the Full Display Window is always logarithmic. In the
Expanded Display Window, use the menus, right-mouse-button menu, accelerator keys, and
Toolbar to choose between logarithmic and linear scales, change the horizontal or vertical axes,
and select which region of the spectrum to view.
Depending on the expansion or overall size of the spectrum, all or part of the selected spectrum
can be shown in the expanded window. Therefore, the number of channels may be larger than
the horizontal size of the window, as measured in pixels. In this case, w here the number of
channels shown exceeds the window size, all of the channels cannot be represented by exactly
one pixel dot. Instead, the channels are grouped together, and the vertical displacement corresponding to the maximum channel in each group is displayed. This maintains a meaningful
representation of the relative peak heights in the spectrum. For a more precise representation of
the peak shapes displaying all available data (i.e., where each pixel corresponds to exactly one
channel), the scale should be expanded until the number of channels is less than or equal to the
size of the window.
NOTE The marker can be moved by no less than one pixel or one channel (whichever is
greater) at a time. In the scenario described above, where there are many more memory
channels being represented on the display than there are pixels horizontally in the
window, the marker will move by m ore than one memory channel at a time, even with
the smallest possible change as performed with the <6> and <7> keys. If true singlechannel motions are required, the display must be expanded, as described above.
27
Page 38
Easy-MCS ™ Multichannel Scaler and MCS-32 (A73-B32) Software 931054C / 1213
In addition to changing the scaling of the spectrum, you can change the colors of the various
spectrum features (e.g., background, spectrum, ROIs) using the Display menu commands.
5.3. The Toolbar
The row of buttons below the Menu Bar provides convenient shortcuts to some of the most
commonly used MCS-32 commands.
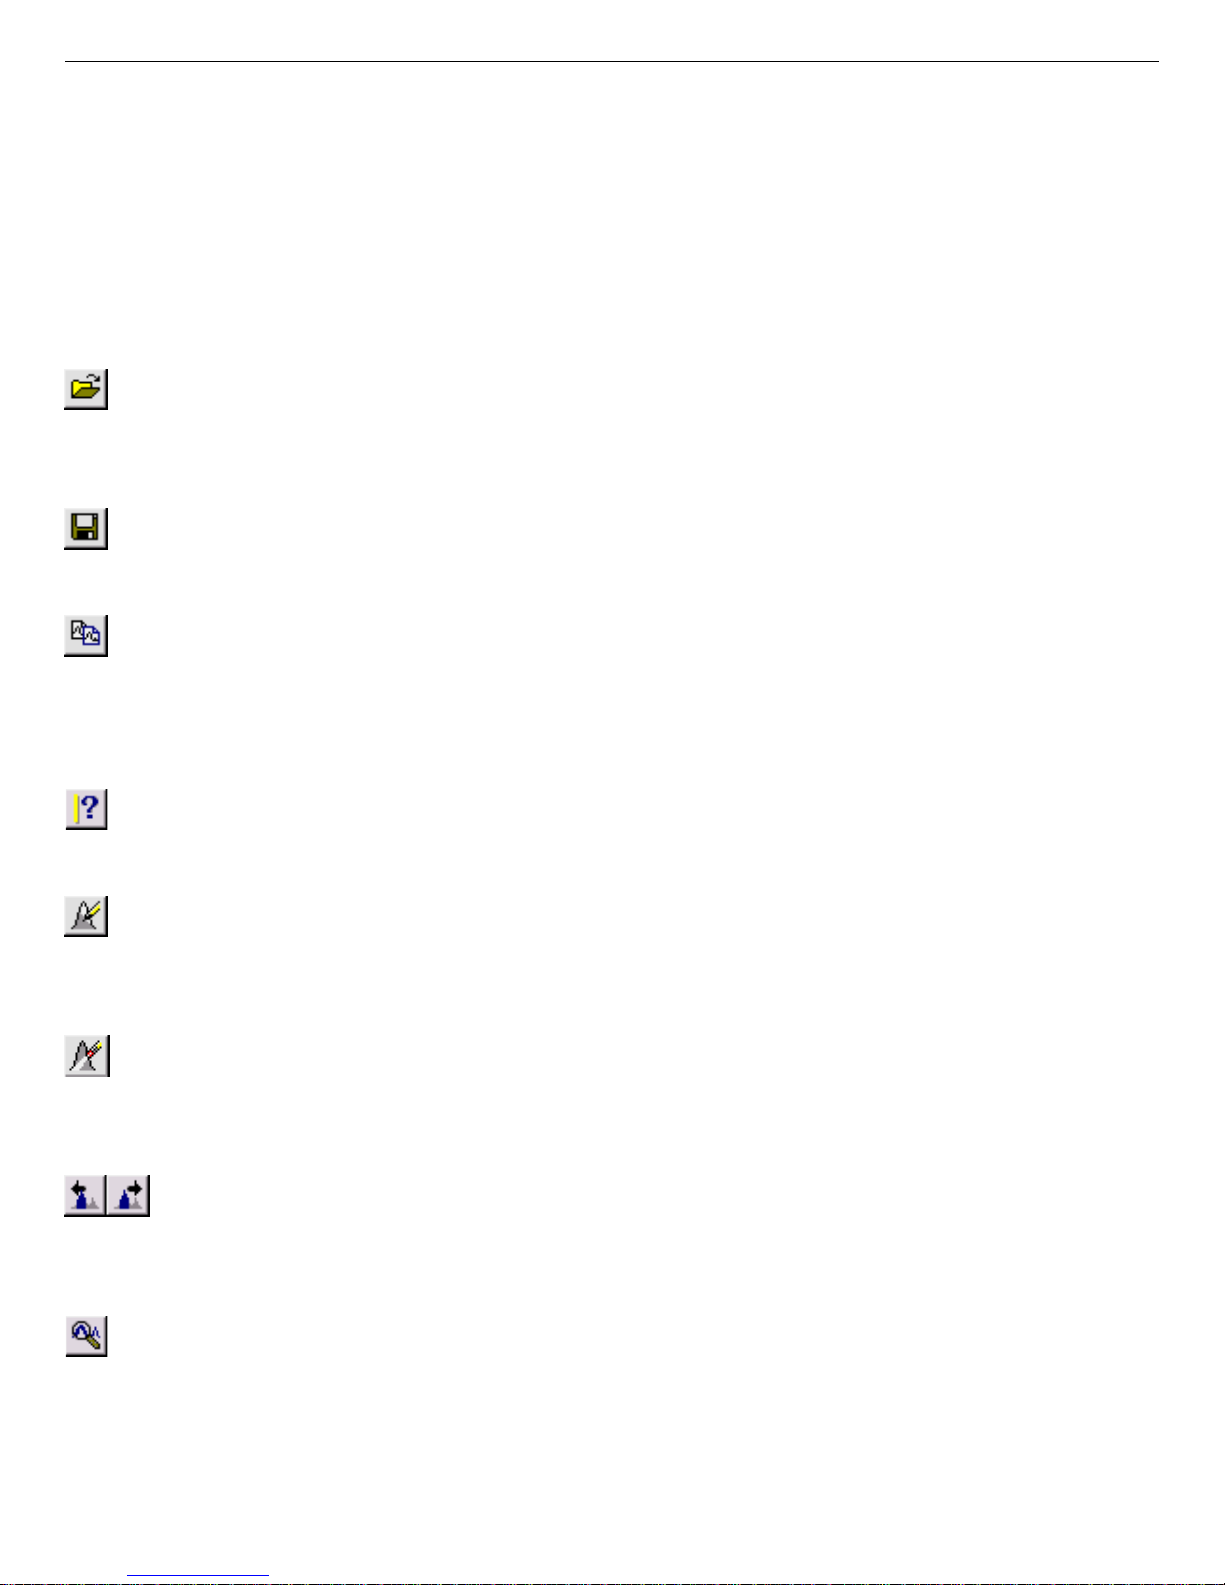
The Recall button reads an existing spectrum file into the buffer; MCS-32 must first be
in buffer mode. This command is the equivalent of selecting File/Recall Data... from
the menu.
Save Spectrum copies the currently displayed spectrum to disk. It duplicates the menu
functions File/Save Data As....
MCS > Buffer copies the currently displayed instrument’s spectrum data to the buffer.
This duplicates Acquire/MCS > Buffer. To then view the buffer contents, click the
Buffer radio button on the Sidebar, press <F4> or <Alt + 6>, or use the
Display/MCS/Buffer menu command.
Show Marker Information reports the current marker position on the Supplementary
Information Line. This duplicates Calculate/Marker and <Alt + M>.
Mark ROI marks the highlighted block of channels at the marker position as an ROI.
This duplicates ROI/Mark Peak, and the <Insert> and Keypad<Ins> keys. This
command is available in buffer mode only.
Clear ROI removes the ROI mark from the channels of the peak currently selected
with the marker. This duplicates ROI/Unmark ROI, and the <Delete> and
Keypad<Del> keys. This command is available in buffer mode only.
Find Previous ROI and Find Next ROI move the marker backward or forward
through the spectrum to the next closest ROI. They duplicate <Ctrl + 7> and
<Ctrl + 6>, respectively, and are available in buffer mode only .
Execute Peak Search performs the peak search described in Section 6.3.9, and marks
the resulting peaks as ROIs. This command is available in buffer mode only. This
duplicates Calculate/Peak Search.
28
Page 39
931054C / 1213 5. DISPLAY FEATURES
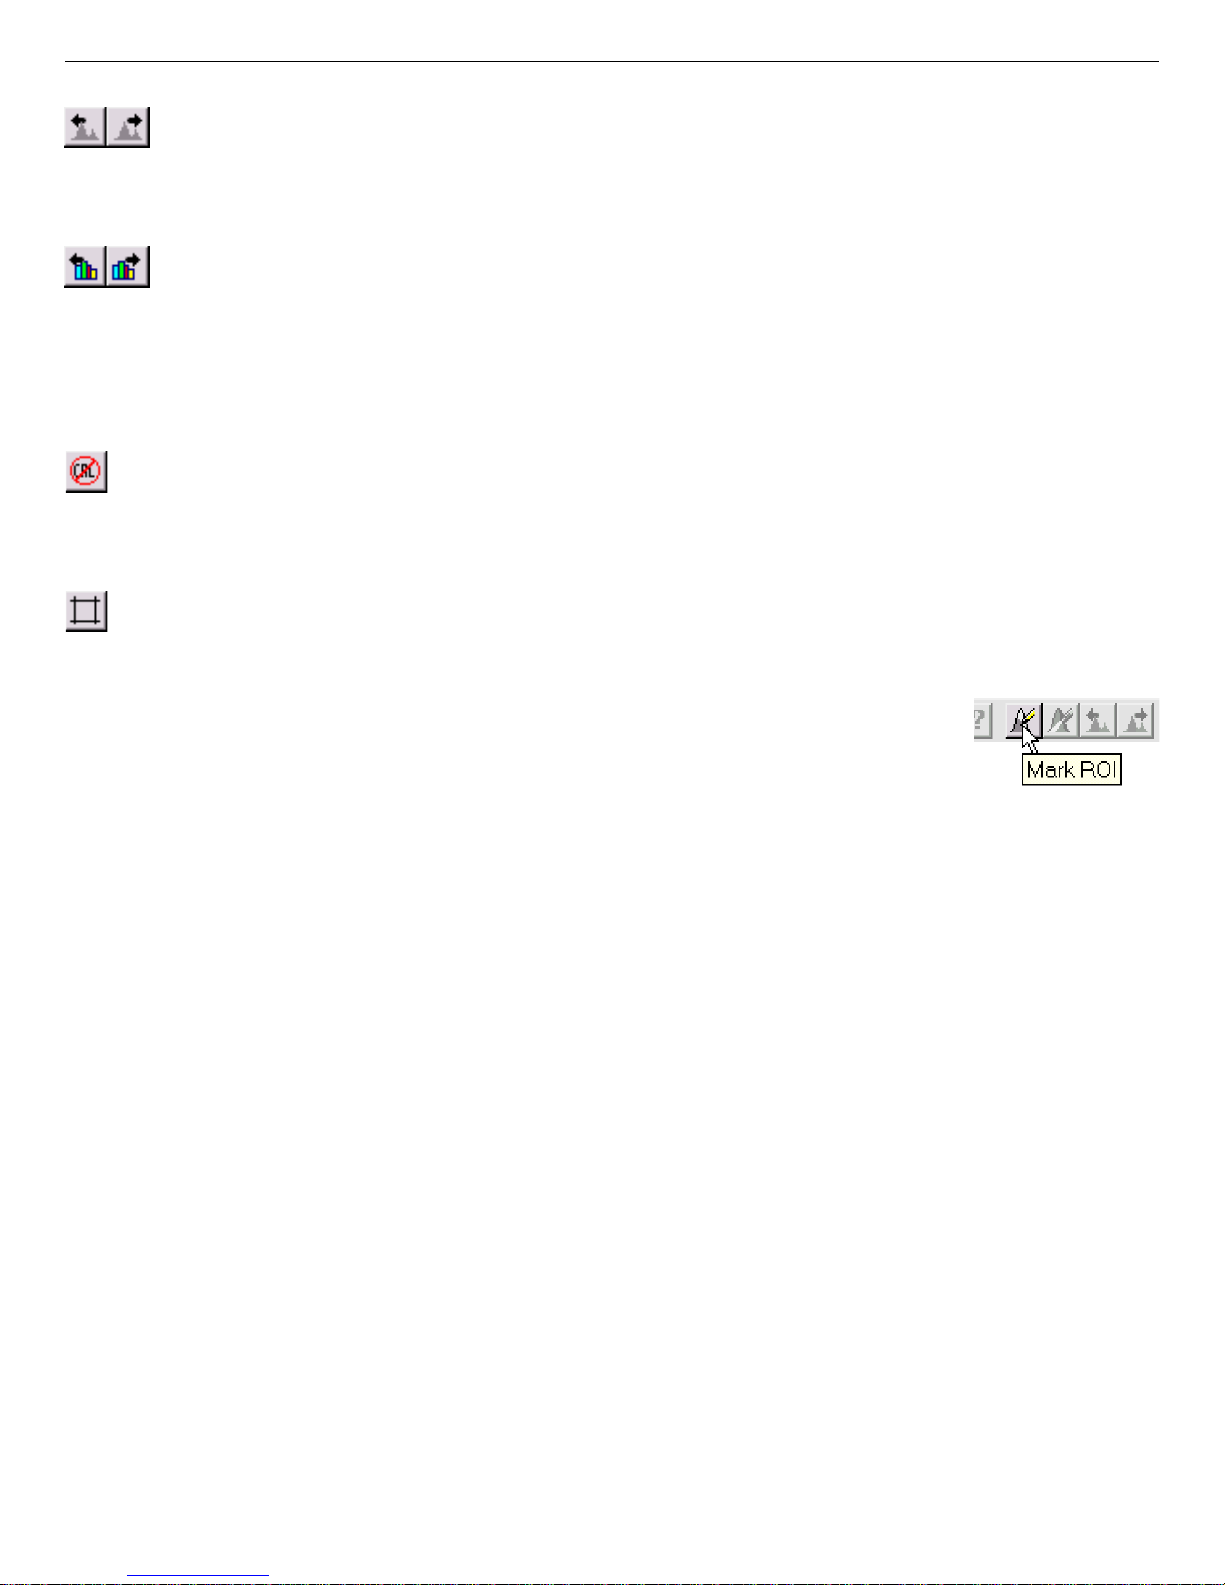
Find Previous Peak and Find Next Peak move the marker backward or forward,
respectively, through the spectrum to the next closest peak. These functions use the
Calculate/Peak Search algorithm (Section 6.3.9).
Find Previous Library Entry and Find Next Library Entry move the marker back-
ward or forward, respectively, through the peak-identification library to the next
closest library entry. Any available peak data are displayed on the Marker Information
Line. The library entry is identified at the bottom of the screen, beneath the Sidebar.
These commands duplicate <Alt + 7> and <Alt + 6>, respectively.
Toggle Calibration switches the expanded display between calibrated units and time
units in internal dwell mode, and between calibrated units and channels in external
dwell mode. This has the same function as Display/Time Units (Section 6.6.3).
Toggle Graticules displays or hides the grid marks for the Expanded Display
Window. This duplicates Display/Preferences/Graticules (Section 6.6.9. 4).
Finally, note that as you pause the mouse pointer over the center of a
Toolbar button, a pop-up tool tip box opens, describing the button’s
function (Fig. 11).
Fig. 11. Tool Tip.
5.4. Using the Mouse
The mouse can be used to access the menus, Toolbar, and sidebars; adjust spectrum scaling;
mark and unmark ROIs; locate spectrum, library, and ROI peaks; select MCSs; work in the
dialogs — every function in MCS-32 except text entry.
5.4.1. Moving the Marker with the Mouse
To position the marker with the mouse, move the pointer to the desired channel in the Expanded
Display Window and click the left mouse button once. This will m ove the marker to the mouse
position. This is generally a much easier way to move the marker around in the spectrum than
using the arrow keys and other accelerators, although you m a y still prefer some keyboard
functions for specific motions.
5.4.2. Sizing and Moving the Full Display Window
To resize the Full Display Window , click and drag the sides, corners, or bottom edge. To move
it, click the top edge and drag.
29
Page 40
Easy-MCS ™ Multichannel Scaler and MCS-32 (A73-B32) Software 931054C / 1213
5.4.3. The Expanded View (Right-Mouse-Button) Menu
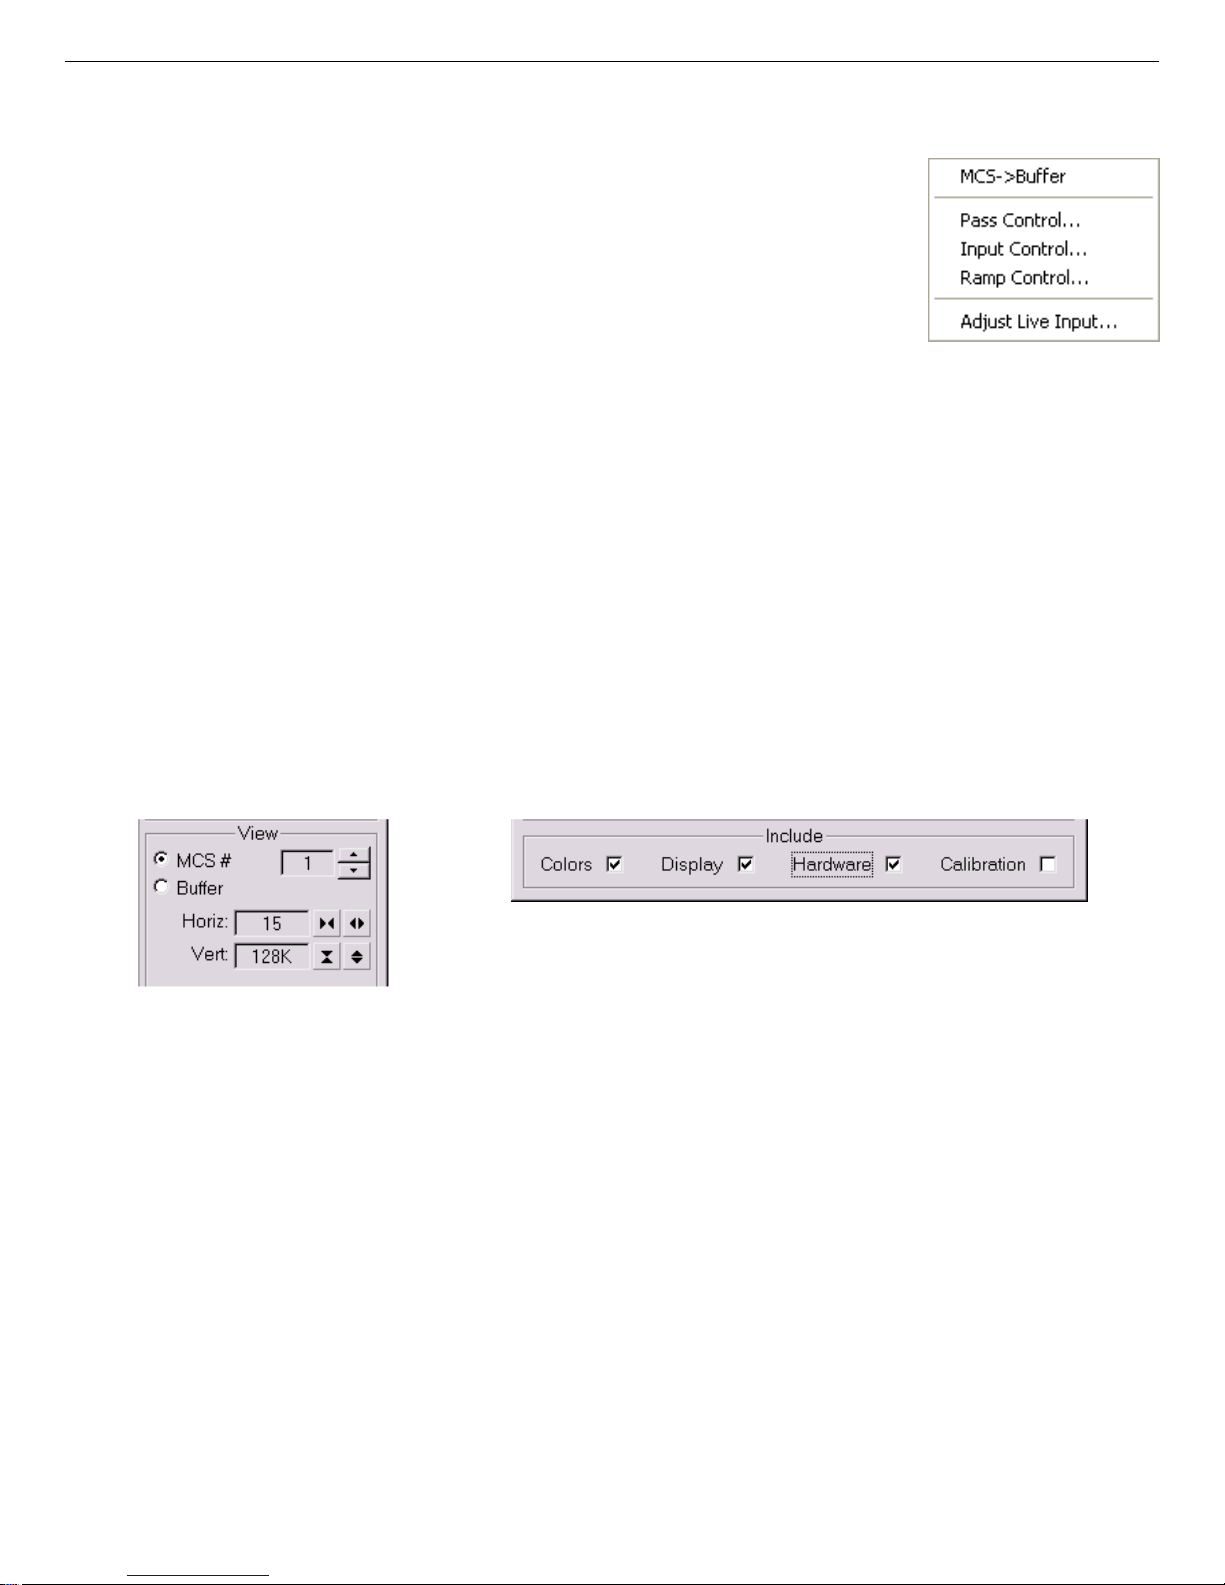
Figure 12 shows the right-mouse-button menu. To open it, position
the mouse pointer in the spectrum display and click the right mouse
button. When the menu opens, use the left mouse button to select
from the list of commands.
All five commands are available in MCS mode; Ramp Control...
and Adjust Live Input... are not available in buffer mode. These
Fig. 12. Expanded
View Menu.
functions belong to the Acquire menu, and are discussed in detail
in Section 6.2.
5.5. Buttons and Checkboxes
This section describes the MCS-32 radio buttons, arrow buttons, and checkboxes. To activate a
button or checkbox, just click it.
Radio buttons (Fig. 13) allow you to select only one of the choices. The arrow buttons in the
lower section of the Sidebar are for scrolling through the list of available MCS instruments, and
adjusting the expanded display’s horizontal and vertical scaling. Checkboxes (Fig. 14) allow
you to choose one or more of the options at the same time.
Fig. 14. Checkboxes.
Fig. 13. Arrow Buttons.
5.6. The Sidebar
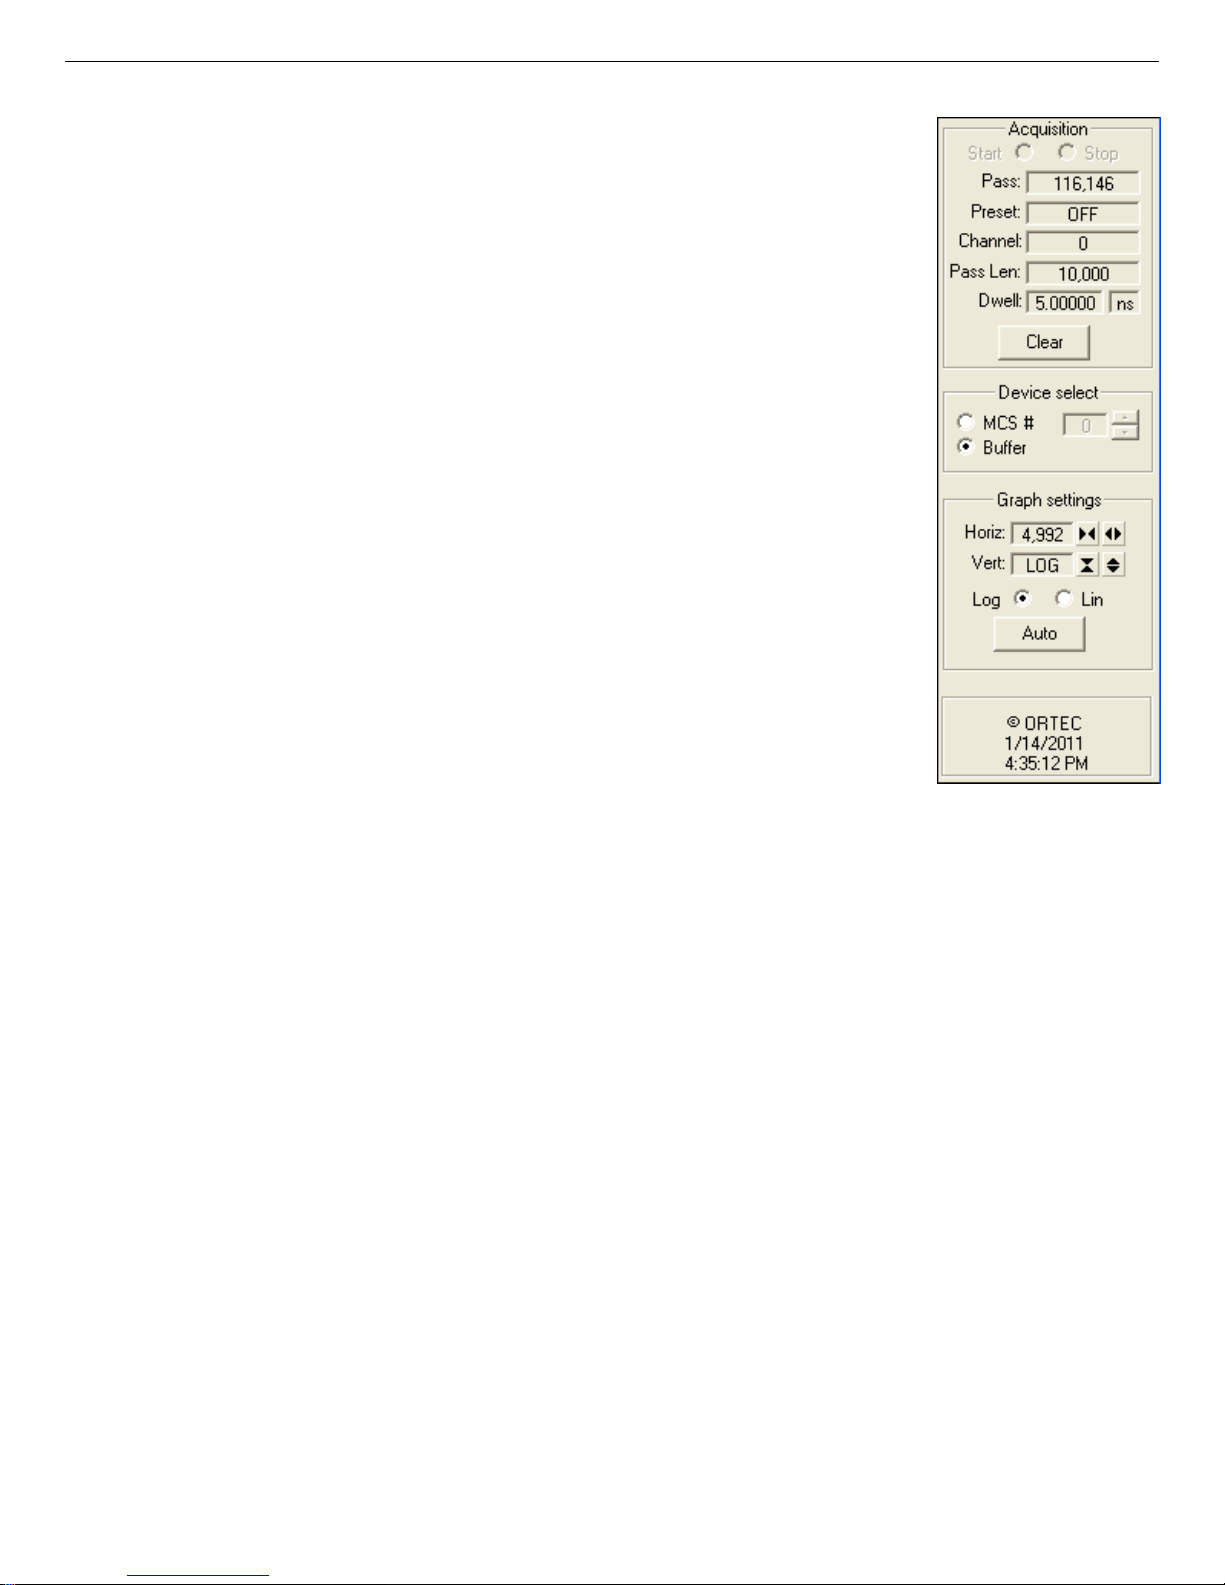
Figure 15 shows the Sidebar.
5.6.1. Acquisition Section
The Acquisition (top) section of the Sidebar is activated when MCS-32 is in MCS mode, and
displays the pass, pass count preset, channel, pass length, and dwell time settings for the
selected MCS. In buffer mode, the Acquisition fields show the presets for the current buffer or
MCS contents, and except for the Clear button, are inactive or read-only.
30
Page 41
931054C / 1213 5. DISPLAY FEATURES
The Start and Stop radio buttons provide controls for the data
acquisition functions, as well as status information.
To start acquisition in the selected MCS, click the Start button.
Start will then turn gray, indicating that it is now inactive.
Click the Stop button to end data acquisition. When you click
Stop, acquisition stops at the end of the current pass. While this
final pass is collected, the Stop button flashes. Once the final
pass is completed, the Stop button stops flashing.
You can abort the acquisition without finishing the current pass
by clicking Stop a second time. When the selected MCS is not
acquiring data, Stop is gray (inactive).
The Start and Stop buttons have the same function as Acquire/
Start and Acquire/Stop (see Section 6.2), and are duplicated by
the <Alt + 1> and <Alt + 2> accelerators, respectively.
The Clear button clears the spectrum data and pass count from
the buffer or the selected MCS. To clear an inactive MCS, click
Fig. 15. Sidebar.
once on Clear. During acquisition, the Clear button is gray
(inactive).
The Clear button has the same functions as Acquire/Clear (Section 6.2.3) and the <Alt + 3>
accelerator.
5.6.2. View Section
The controls in the View (lower) section of the sidebar are active in both MCS and buffer mode.
The Horiz and Vert arrow buttons are for scaling the expanded display up and down by factors
of two. These buttons duplicate, respectively, the Narrower/Wider and Shorter/Taller commands on the Display menu (see Section 6.6), and their accelerator keys, <F7>/<F8> and
<F5>/<F6>.
The Log and Lin radio buttons switch the expanded display between logarithmic and linear
scaling. These buttons duplicate the function of the Logarithmic toggle on the Display menu
(see Section 6.6), and the Keypad</>
key.
31
Page 42
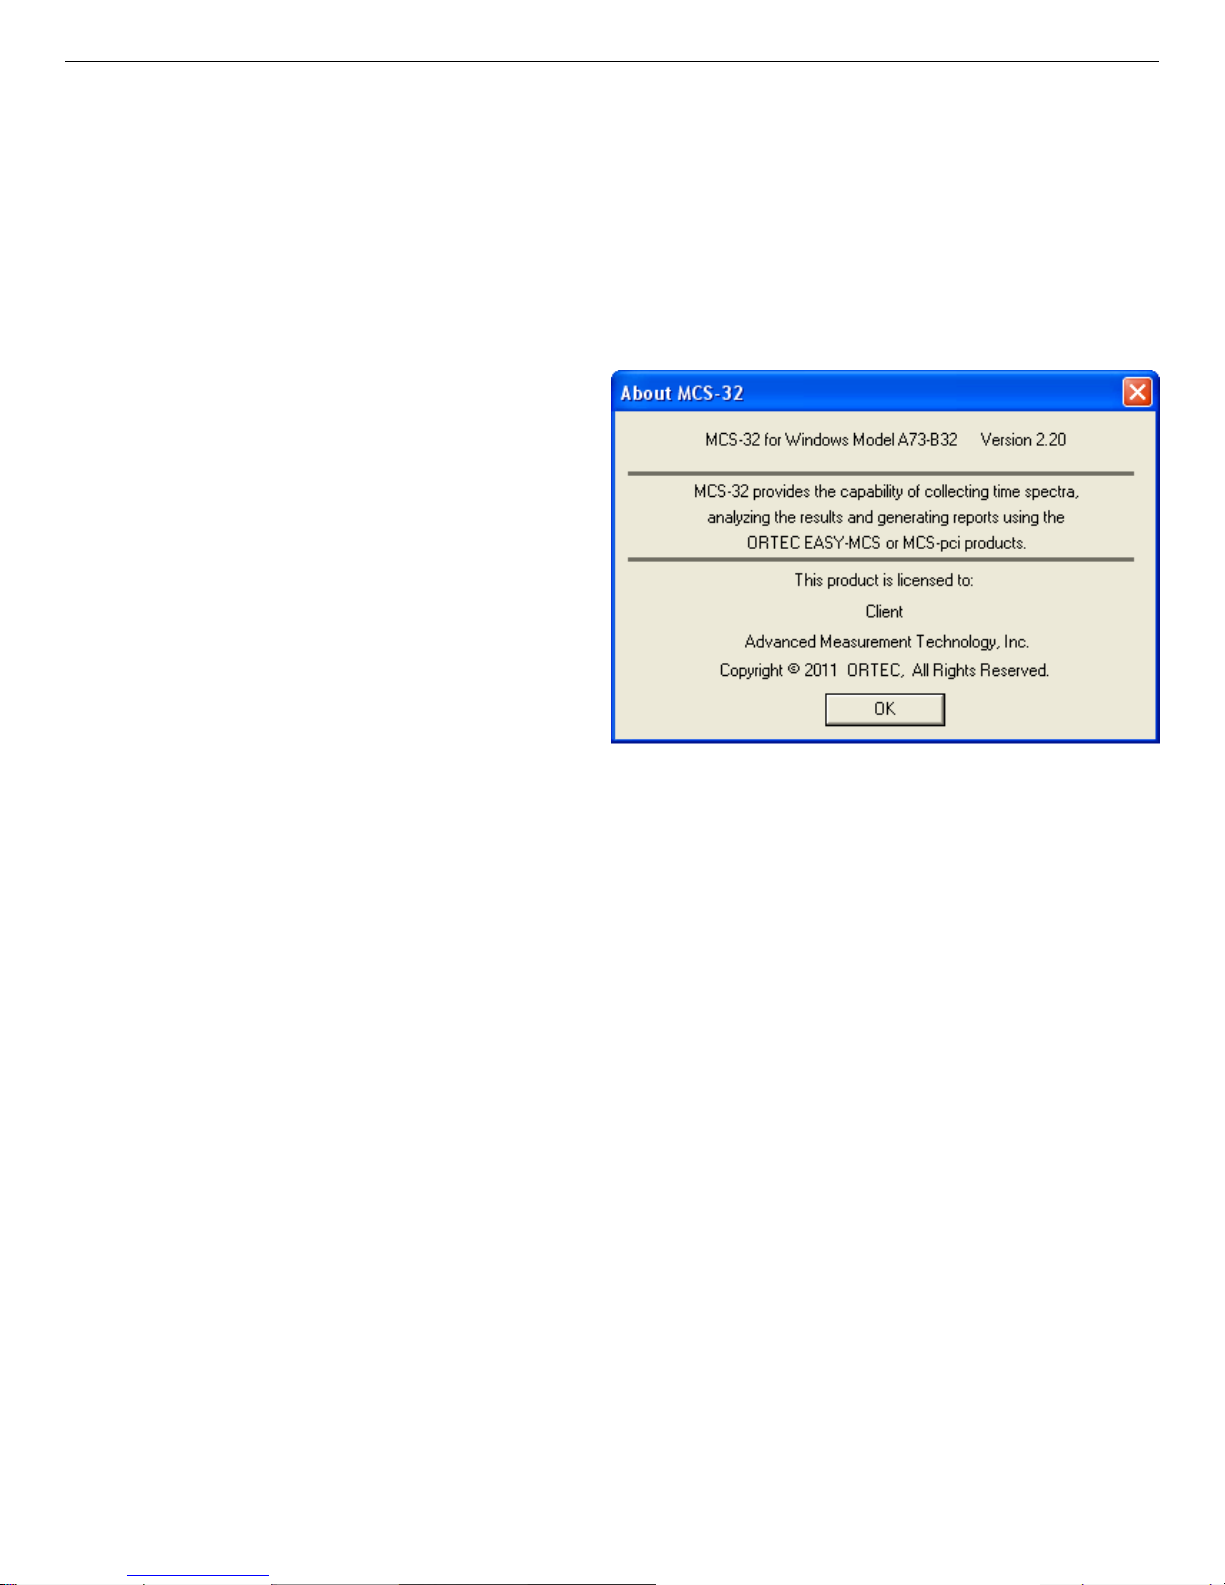
Easy-MCS ™ Multichannel Scaler and MCS-32 (A73-B32) Software 931054C / 1213
The Auto button switches the Expanded Display Window from a logarithmic vertical scale to a
linear scale that is automatically adjusted so the largest peak in the current display is at its maximum height w ithout overflowing the display. In addition, it centers the m a rker in the expanded
display. Auto also toggles the vertical scale of the spectrum display between the automatic and
manual modes. This function is duplicated by Display/Automatic and Keypad<*>.
5.7. About MCS-32
Figure 16 shows the About MCS-32
dialog under the Help menu. The information on this dialog will be useful
should you need customer support.
Fig. 16. About MCS-32.
32
Page 43

6. MENU COMMANDS
This chapter describes the MCS-32 menu commands and their associated dialogs. The accelerator(s), if any, are listed on the me nus to the right of the command they duplicate. Also, the
underlined
for quick access in the menu. (So, for example, the S
reached with the key sequence <Alt + S>, <Alt + D>.) The ellipsis (...) following a menu selection indicates that a dialog is displayed to complete the function. Finally, a small arrow (“<”)
following a menu selection means this item has a submenu.
File
R
ecall Data...
S
ave Data As...
P
rint Data...
Report
C
ompare Data...
Recall Setting
Sav
I
mport ASCII...
E
xport ASCII...
Ex
letter in the menu item indicates a key that can be used together with the <Alt> key
elect MCS... dialog under Display can be
...
s...
e Settings As...
it
cquire
A
Sta
rt Alt + 1
St
op Alt + 2
Cle
ar Alt + 3
MCS > B
P
ass Control... Alt + P
I
nput Control... Alt + I
R
amp Control... Alt + R
Adjust Live Input...
S
CA Sweep...
alculate
C
S
ettings...
Data I
Su
m
Smooth
Strip...
Subtract
N
ormalize
M
arker Alt + M
Peak Sear
C
alibrate...
uffer Alt + 5
nfo Dbl-Clk
...
ch
33
Page 44

Easy-MCS ™ Multichannel Scaler and MCS-32 (A73-B32) Software 931054C / 1213
Services
Start J
L
Sample D
OI
R
R
S
M
U
Unmark A
isplay
D
MCS/B
Select M
Ti
T
S
A
L
N
W
C
P
OB...
ibrary...
escription...
ecall ROI...
ave ROI As...
ark ROI Insert
nmark ROI Delete
ll ROIs
uffer F4 or Alt + 6
CS... Ctrl + Fn
me Units
aller F6 or Up-Arrow
horter F5 or Dn-Arrow
utomatic Keypad<*>
ogarithmic Keypad</>
arrower F7 or Keypad<!>
ider Keypad<+>
enter Keypad<5>
references <
P
oints
Fill R
OI
Fill A
W
F
G
T
C
ll
rap Mode
ull View
raticules
oolbar
olors...
Help
Help T
H
A
opics F1
ow To Use Help
bout MCS-32...
Expanded View (Right-Mouse-Button) Menu
MCS > Buffer
Pass Control...
Input Control...
Ramp Control...
Adjust Live Input...
34
Page 45
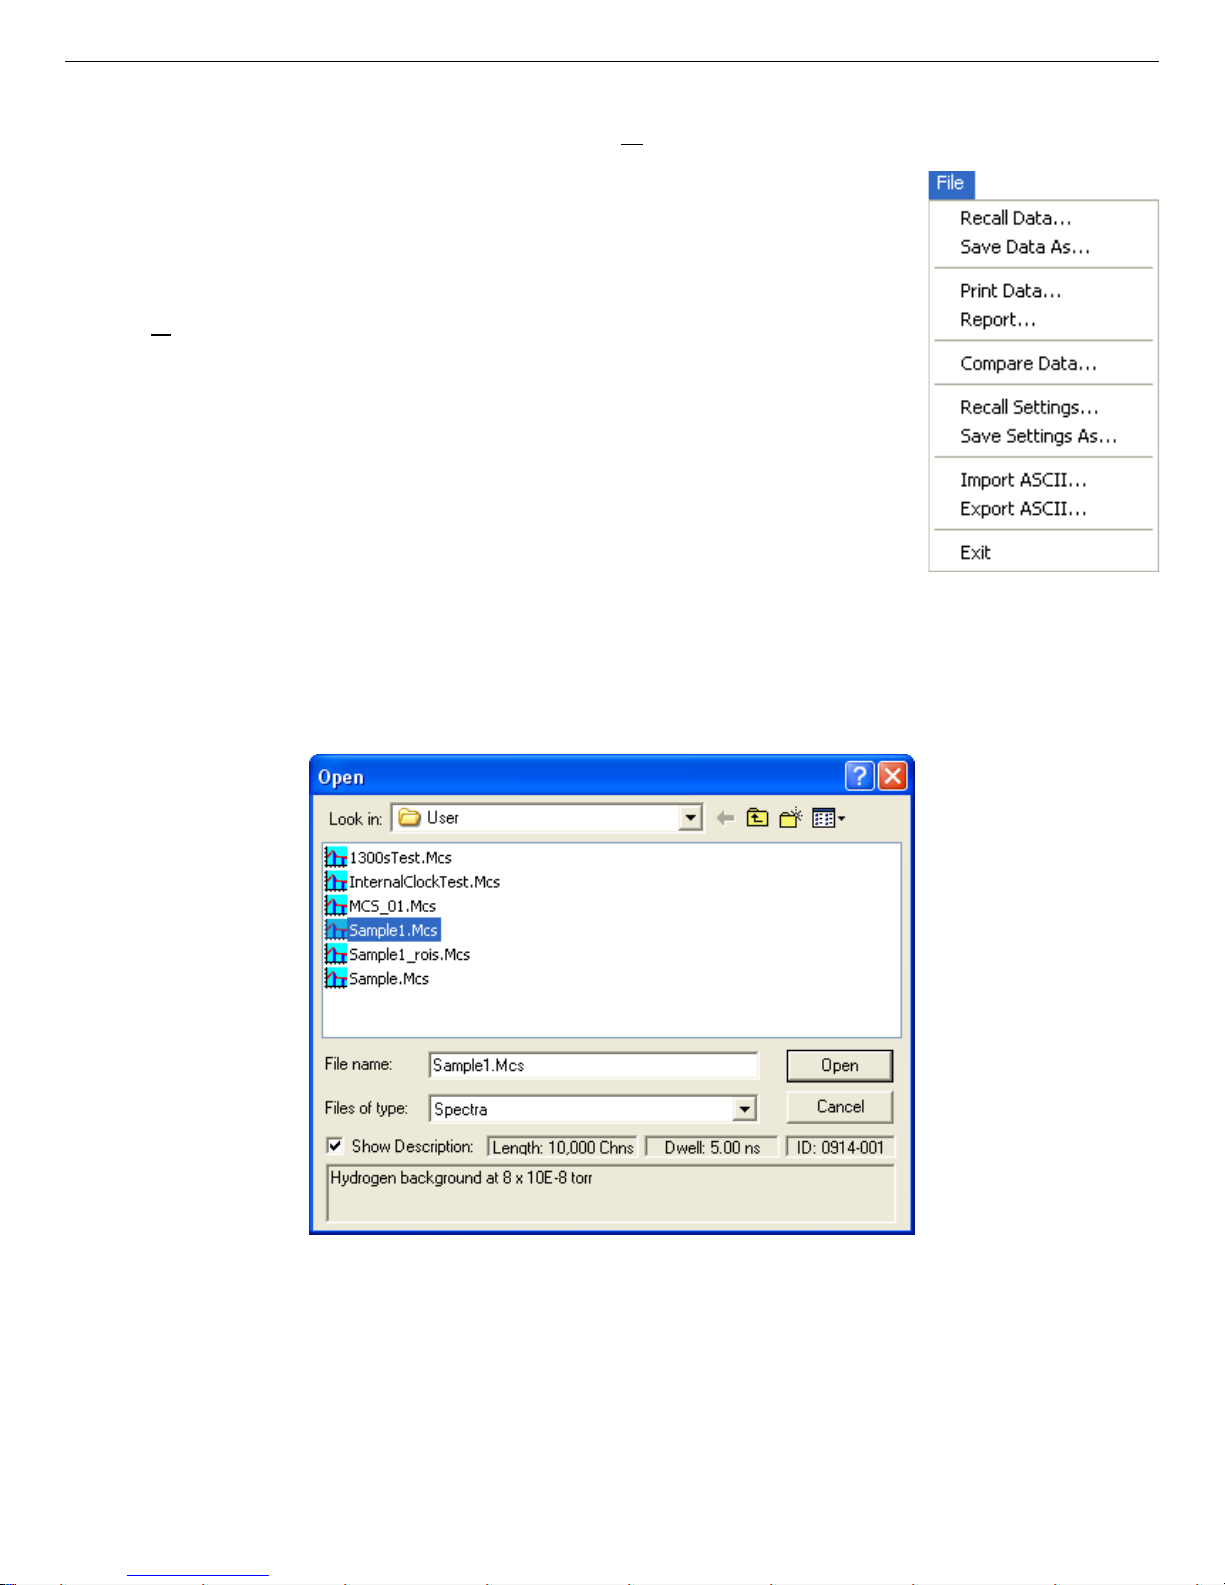
931054C / 1213 6. MENU COMMANDS
6.1. File
The File menu is shown in Fig. 17. These commands are available
for both the MCS and the buffer with the exception of Recall
Data..., which is only available in buffer mode.
6.1.1. R
ecall Data...
Switch to buffer mode before using Recall Data.... This function
read a spectrum file created by the MCS-32 Save Data As... command into the buffer. The buffer must be selected first. The buffer
is sized to conform to the pass length of the recalled spectrum.
If the buffer contains data that have not been saved, a warning
dialog opens first, asking if the data should be saved. Click Yes
to perform a Save As, No to continue with Recall..., and Cancel
to return to the main display with no action.
The Open dialog (Fig. 18) shows the list of available
.MCS files in the current directory.
Fig. 17. File Menu.
Fig. 18. Recall Spectrum Dialog.
Note the Show Description: checkbox on the lower left of the dialog. Use this to display the
sample description, format, and spectrum size of each file without having to open it.
35
Page 46
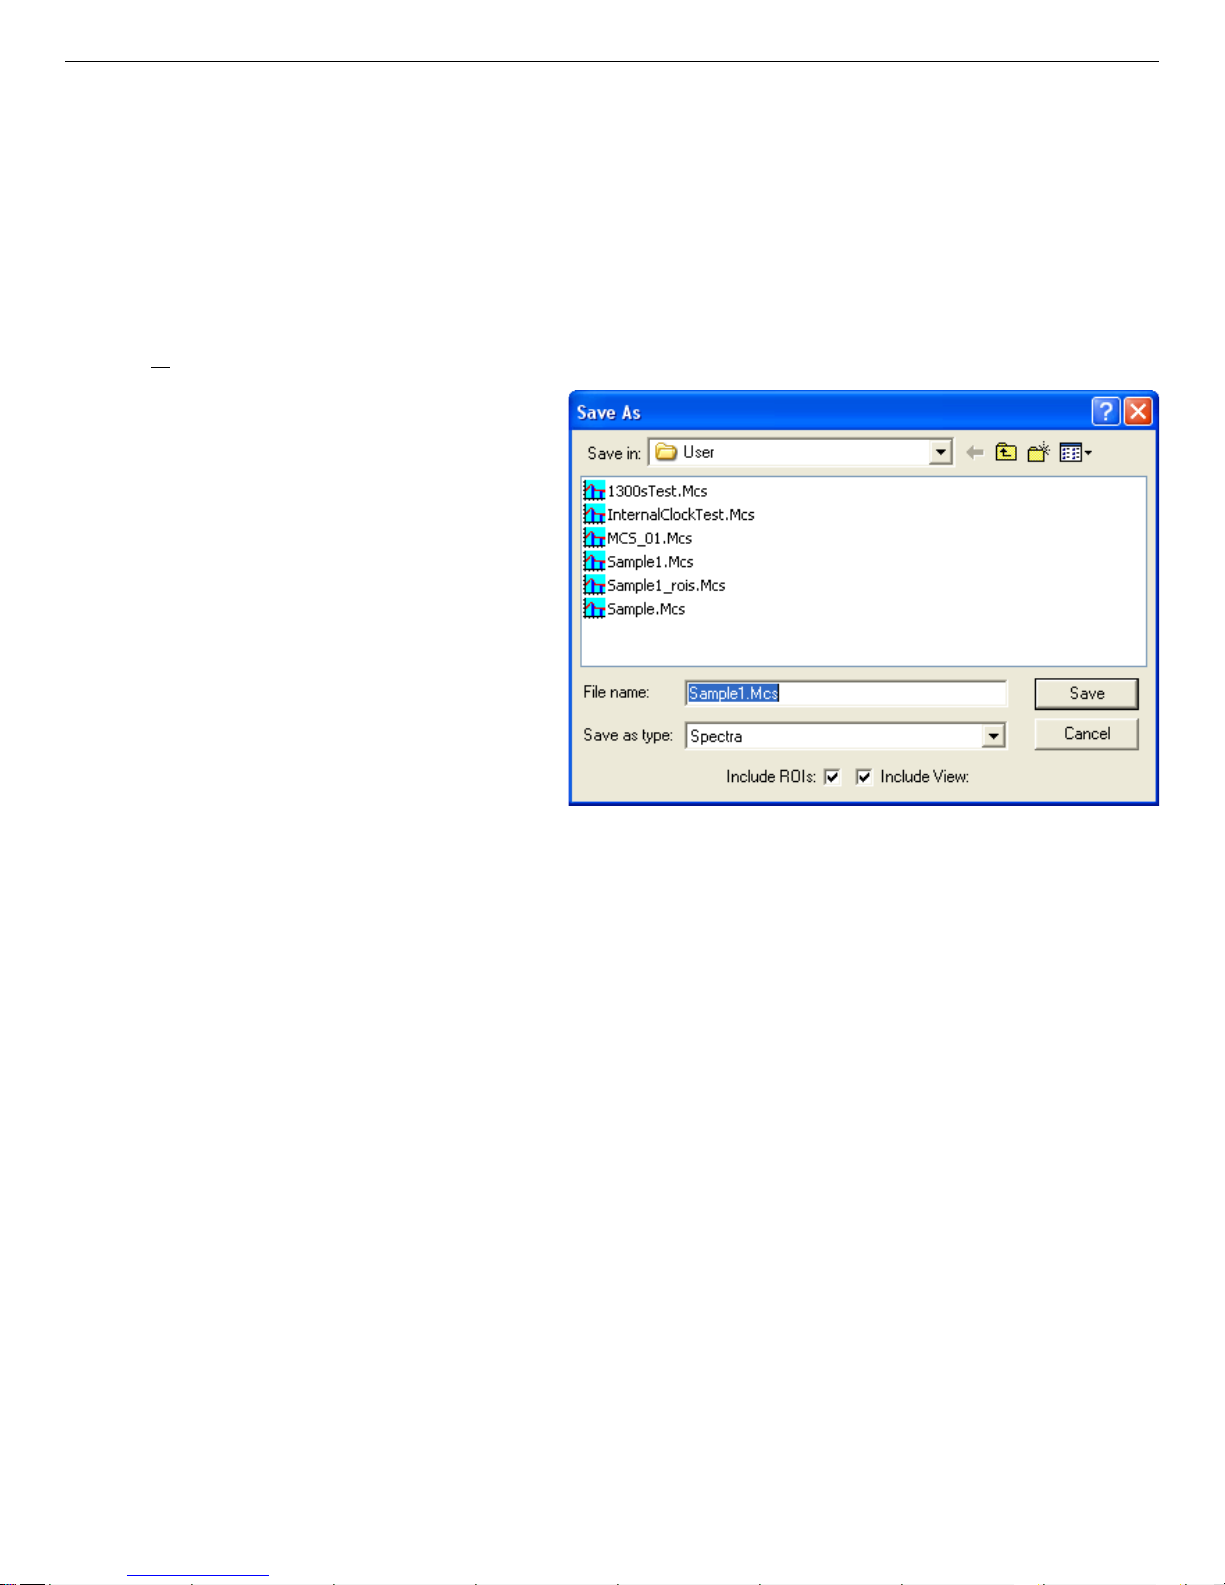
Easy-MCS ™ Multichannel Scaler and MCS-32 (A73-B32) Software 931054C / 1213
When the spectrum has been read successfully by this function, the descriptors (pass count,
dwell time, etc.) are obtained from the file for the buffer, and the filename is displayed in the
Title Bar. If the spectrum file has calibration information, this is used to set the calibration for
the buffer.
This command is duplicated by the Recall Data button on the Toolbar.
6.1.2. S
ave Data As...
This comm and writes the displayed
spectrum to disk. The Save Spec-
trum File dialog (Fig. 19) opens
when Save As... is selected. Enter
any valid location and filename in
the File name: field. The file extension is
.MCS.
The following are stored in the
.MCS file with the data: pass count,
dwell time, pass length, pass count
preset, input control settings, acquisition start time, hardware and sample
descriptions, acquisition mode, and
calibration (if any). The
.MCS file
structure is detailed in Appendix C.
Fig. 19. Save Spectrum File Dialog.
The check boxes labeled Include View and Include ROIs determine whether or not the scaling
and/or ROI information will be saved in the file.
Click Save. If the file already exists, a message box opens asking you to verify the entry or
cancel the operation. Click OK to overwrite the existing file, or click Cancel.
When you click Save, a Sample Description dialog will open in which you can enter a short
description of the file contents. (This is the sample description display e d at the bottom of the
Recall Data... dialog when a file is selected.)
After the file has been written, its filename is displayed on the Title Bar if MCS-32 is in buffer
mode.
This command is duplicated by the Save Data As button on the Toolbar.
36
Page 47
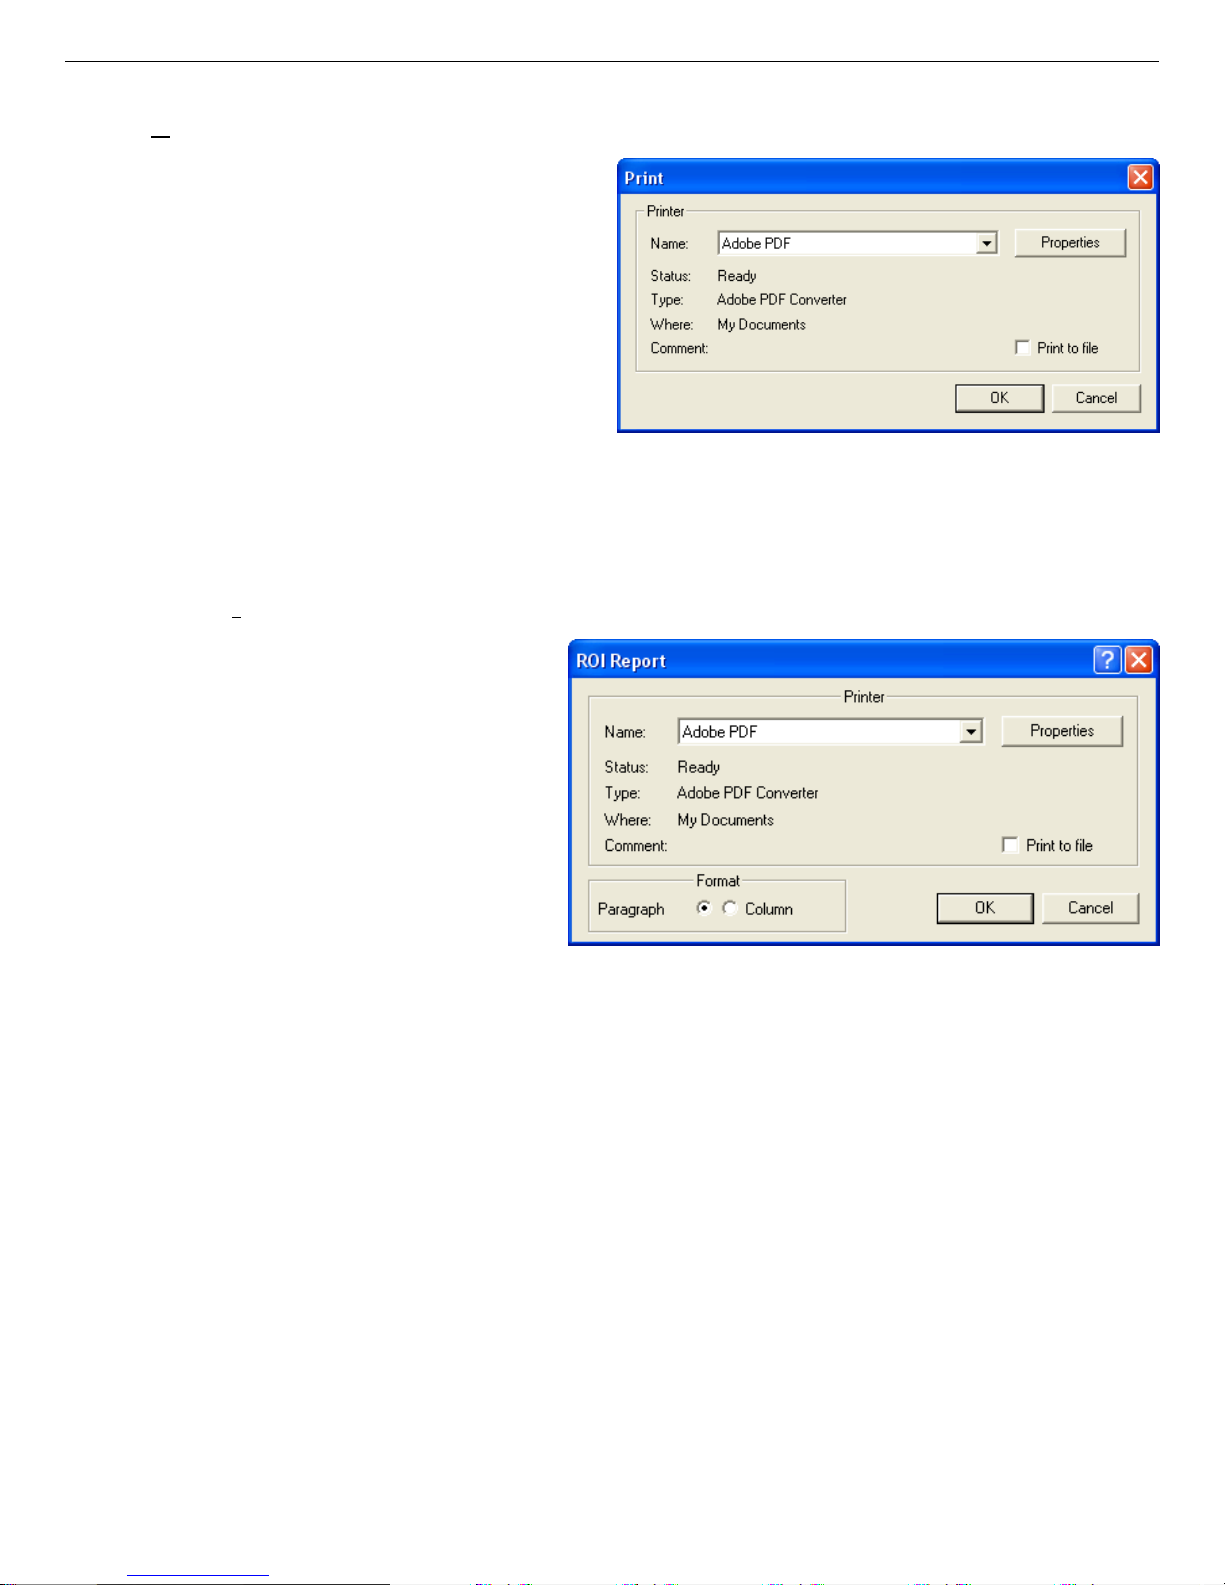
931054C / 1213 6. MENU COMMANDS
6.1.3. Print Data...
This comma nd prints, to the printer or a
text (ASCII) file, the contents of the channels currently selected with the marker.
The data are formatted at seven channels
per line with the channel number on the
left. To select the channels to be printed,
highlight the region by clicking and dragging the mouse from one edge of the
region to the other edge.
Fig. 20. Print Spectrum.
Use the Print dialog (Fig. 20) to print the
output or save it in a disk file (click Print to file to mark it).
6.1.4. Report
...
The Report... function creates a report
describing acquisition conditions and
contents of all ROIs, and sends this to
a text file and/or the printer, in one of
two output formats, Paragraph or
Column.
The ROI Report dialog, shown in
Fig. 21, opens first. If you check
Print to file, a file-save dialog opens,
Fig. 21. ROI Report Dialog.
prompting for a filename. Enter a name
and click OK.
Examples of the Paragraph- and Column-style reports are shown in Figs. 22 and 23, respectively. Both report formats supply the same information.
If the spectrum is not calibrated, the following are reported for each ROI:
! ROI number (1 is lowest).
! Start channel of the ROI.
! Stop channel of the ROI.
! Gross area of the peak.
! Net area of the peak, as calculated in Calculate/Data Info.
! Centroid channel of peak, as calculated in Calculate/Data Info.
37
Page 48

Easy-MCS ™ Multichannel Scaler and MCS-32 (A73-B32) Software 931054C / 1213
If the spectrum is calibrated, both calibrated and channel values are given for 1–6 above, and in
addition the following is also included:
! The best match from the library.
! Corrected net area of the peak, using the factor supplied in the library.
MCS 1 ACQ 01-20-88 at 11:52:12, 10 mS Dwell, 10 Pass(es)
Mass Spectrometer SN 123
MENNE01.MCS with calibration and library
ROI 1 Range: 121 (241.408 amu) to 135 (269.414 amu)
Gross: 534209, Net: 127924
Centroid: 129.150 (257.711 amu)
ID: XYZ-138 at 258.411 amu, Adjusted Net: 406107.5
ROI 2 Range: 200 (399.44 amu) to 212 (423.444 amu)
Gross: 493232, Net: 118381.3
Centroid: 206.129 (411.7 amu)
ID: ABC-198 at 411.8044 amu, Adjusted Net: 123945.3
ROI 3 Range: 300 (599.479 amu) to 311 (621.483 amu)
Gross: 498328, Net: 117078
Centroid: 305.325 (610.13 amu)
ID: RST-103 at 610.33 amu, Adjusted Net: 2075851
ROI 4 Range: 354 (707.5 amu) to 366 (731.505 amu)
Gross: 535655, Net: 127914.3
Centroid: 360.453 (720.409 amu)
ID: ABX-126 at 720.5 amu, Adjusted Net: 237754.4
Fig. 22. Example Spectrum Report (Paragraph Format).
38
Page 49

931054C / 1213 6. MENU COMMANDS
Fig. 23. Example Spectrum Report (Column Format).
MCS 1 ACQ 01-20-88 at 11:52:12, 10 mS Dwell, 10 Pass(es)
Mass Spectrometer SN 123
MENNE01.MCS with calibration and library
ROI From To Gross Net Centroid Library Adj Net
1 241.408 amu 269.414 amu 534209 127924 257.711 amu XYZ-138 258.411 amu 406107.5
2 399.440 amu 423.444 amu 493232 118381.3 411.700 amu ABC-198 411.804 amu 123945.3
3 599.479 amu 621.483 amu 498328 117078 610.130 amu RST-103 610.330 amu 2075851
4 707.500 amu 731.505 amu 535655 127914.3 720.409 amu ABX-126 720.500 amu 237754.4
39
Page 50
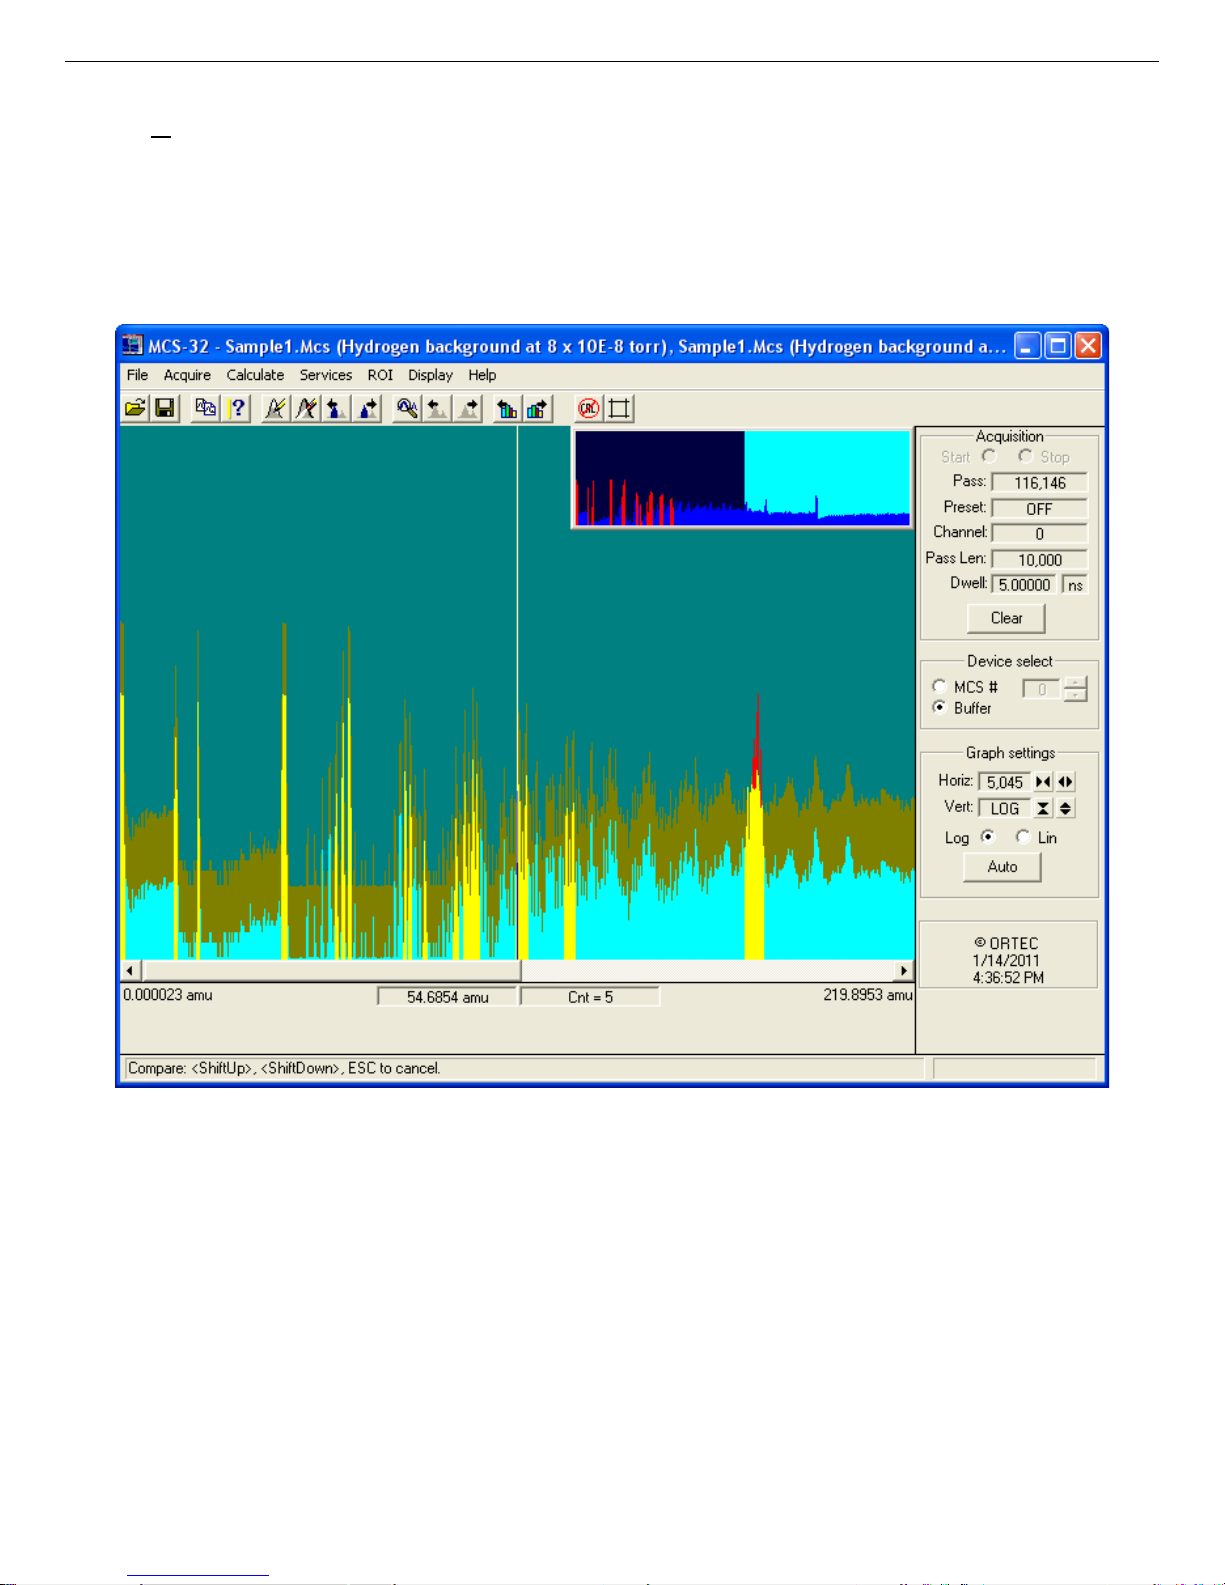
Easy-MCS ™ Multichannel Scaler and MCS-32 (A73-B32) Software 931054C / 1213
6.1.5. Compare Data...
This function displays a disk spectrum along with the spectrum in the buffer so that the two can
be visually compared. When Compare Data... is selected, a standard file-open dialog opens,
allowing you to select the desired spectrum file . Once the Compare file is opened, the Expanded
Display Window shows both spectra, as illustrated in Fig. 24.
Fig. 24. Compare Mode Screen.
Note that the spectra in this illustration are displayed in Fill All mode, in which all of the area
under the peaks is filled with a color different from the background (see Display/Preferences/
Fill All, Section 6.6.9.1).
The Compare spectrum is offset from the starting spectrum, and can be moved up and down
incrementally with the <Shift + 8> and <Shift + 9> accelerators. In addition, the vertical scale
of both spectra can be simultaneously changed with <8>/<9>. Note that the Compare spectrum’s
ROIs (if any were saved with the file) are not marked in this mode.
40
Page 51
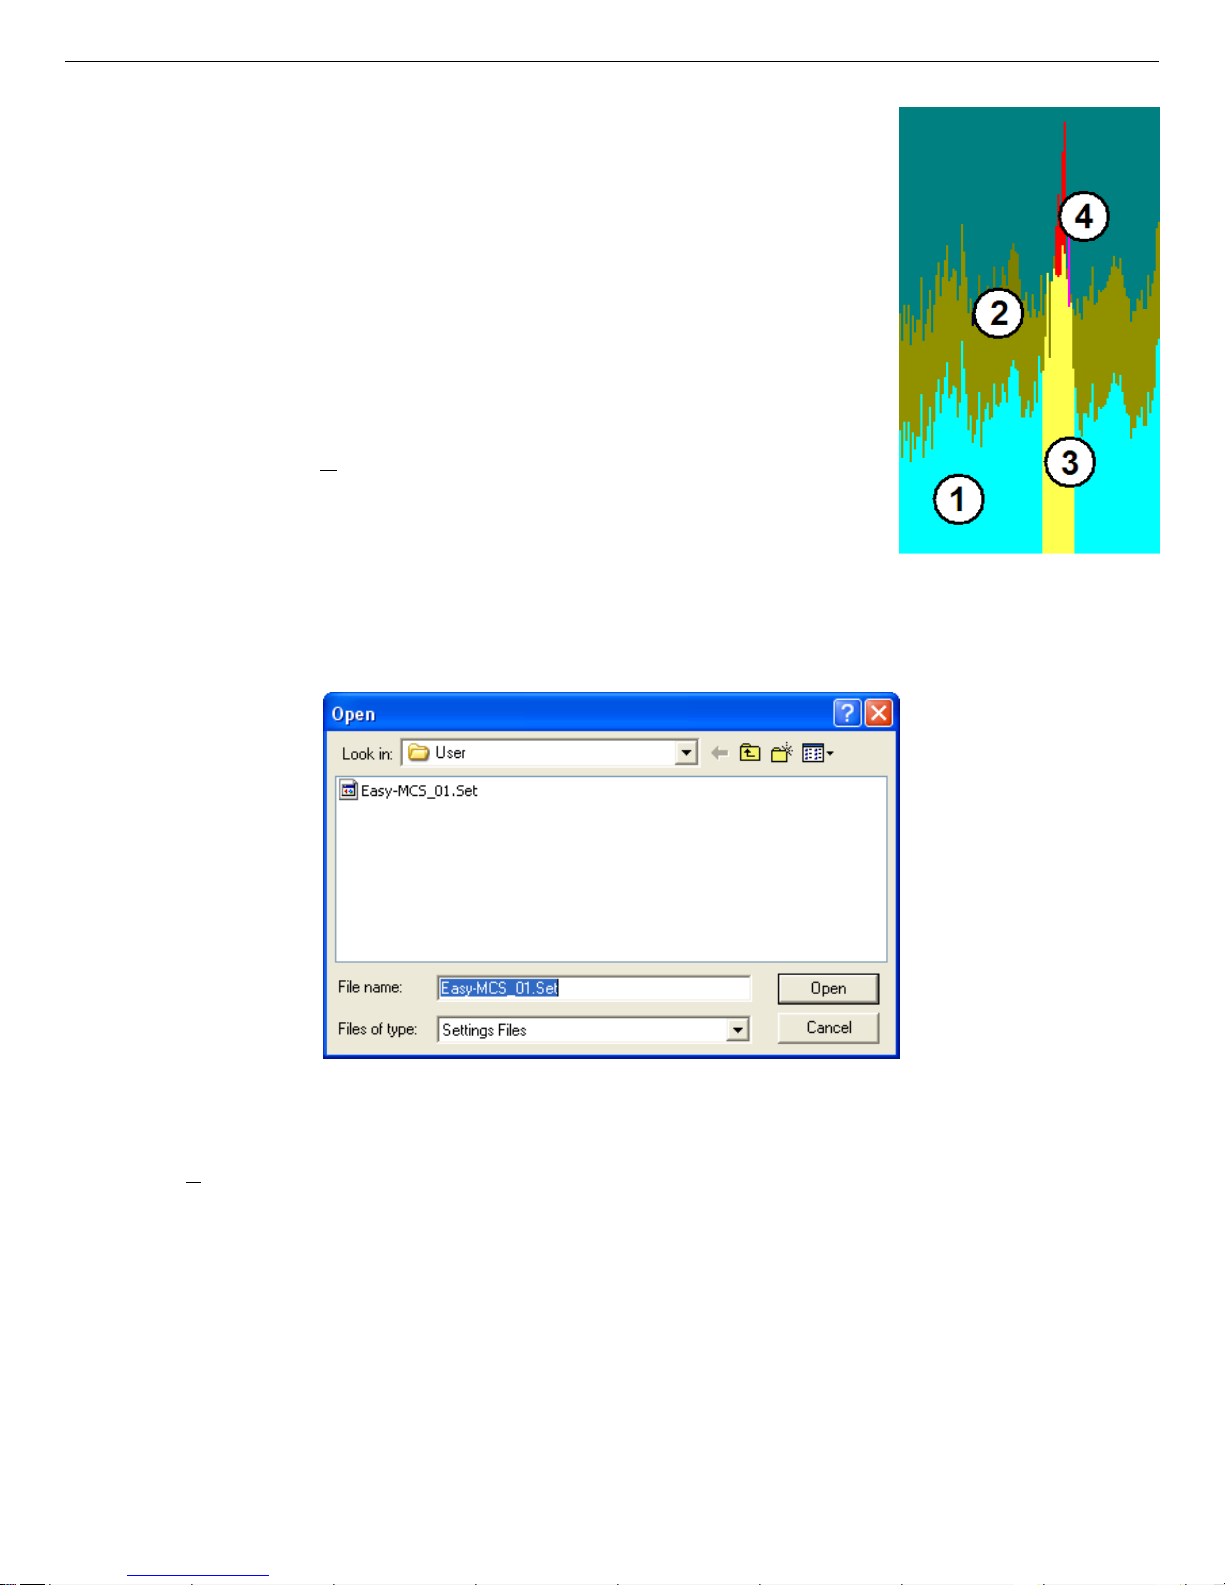
931054C / 1213 6. MENU COMMANDS
Figure 25 is taken from Fig. 24. In this illustration, the starting
spectrum is displayed in color (1), the Compare spectrum is
shown in color (2), the starting spectrum’s ROIs are marked in
color (3), and the portion of the starting spectrum that exceeds
the Compare spectrum is indicated by color (4). These colors —
called Foreground, Compare, ROI, and Combine, respectively
— are chosen on the Colors dialog discussed in Section 6.6.9.6.
Press <Esc> to leave Compare mode.
6.1.6. Recall Setting
s...
This function restores settings saved by the Save Settings As...
function. When the Recall Settings... function is selected, a
standard file-open dialog opens (Fig. 26). The recalled settings
apply to the current MCS or buffer depending on which is
selected at the time Recall Settings... is performed.
Fig. 25. Spectrum
Colors in Compare
Mode.
Fig. 26. Recall Settings Dialog.
6.1.7. Sav
e Settings As...
This comma nd saves the settings of the current MCS or buffer, depending on which is selected.
The dialog (Fig. 27) has several checkboxes that determine the information saved in the settings
file.
! If the Colors box is marked, the current screen colors are saved in the file.
! If the Display box is marked, the current settings of the Fill All, Fill ROI, Full View,
and Wrap Mode comma nds on the Display menu are saved.
41
Page 52
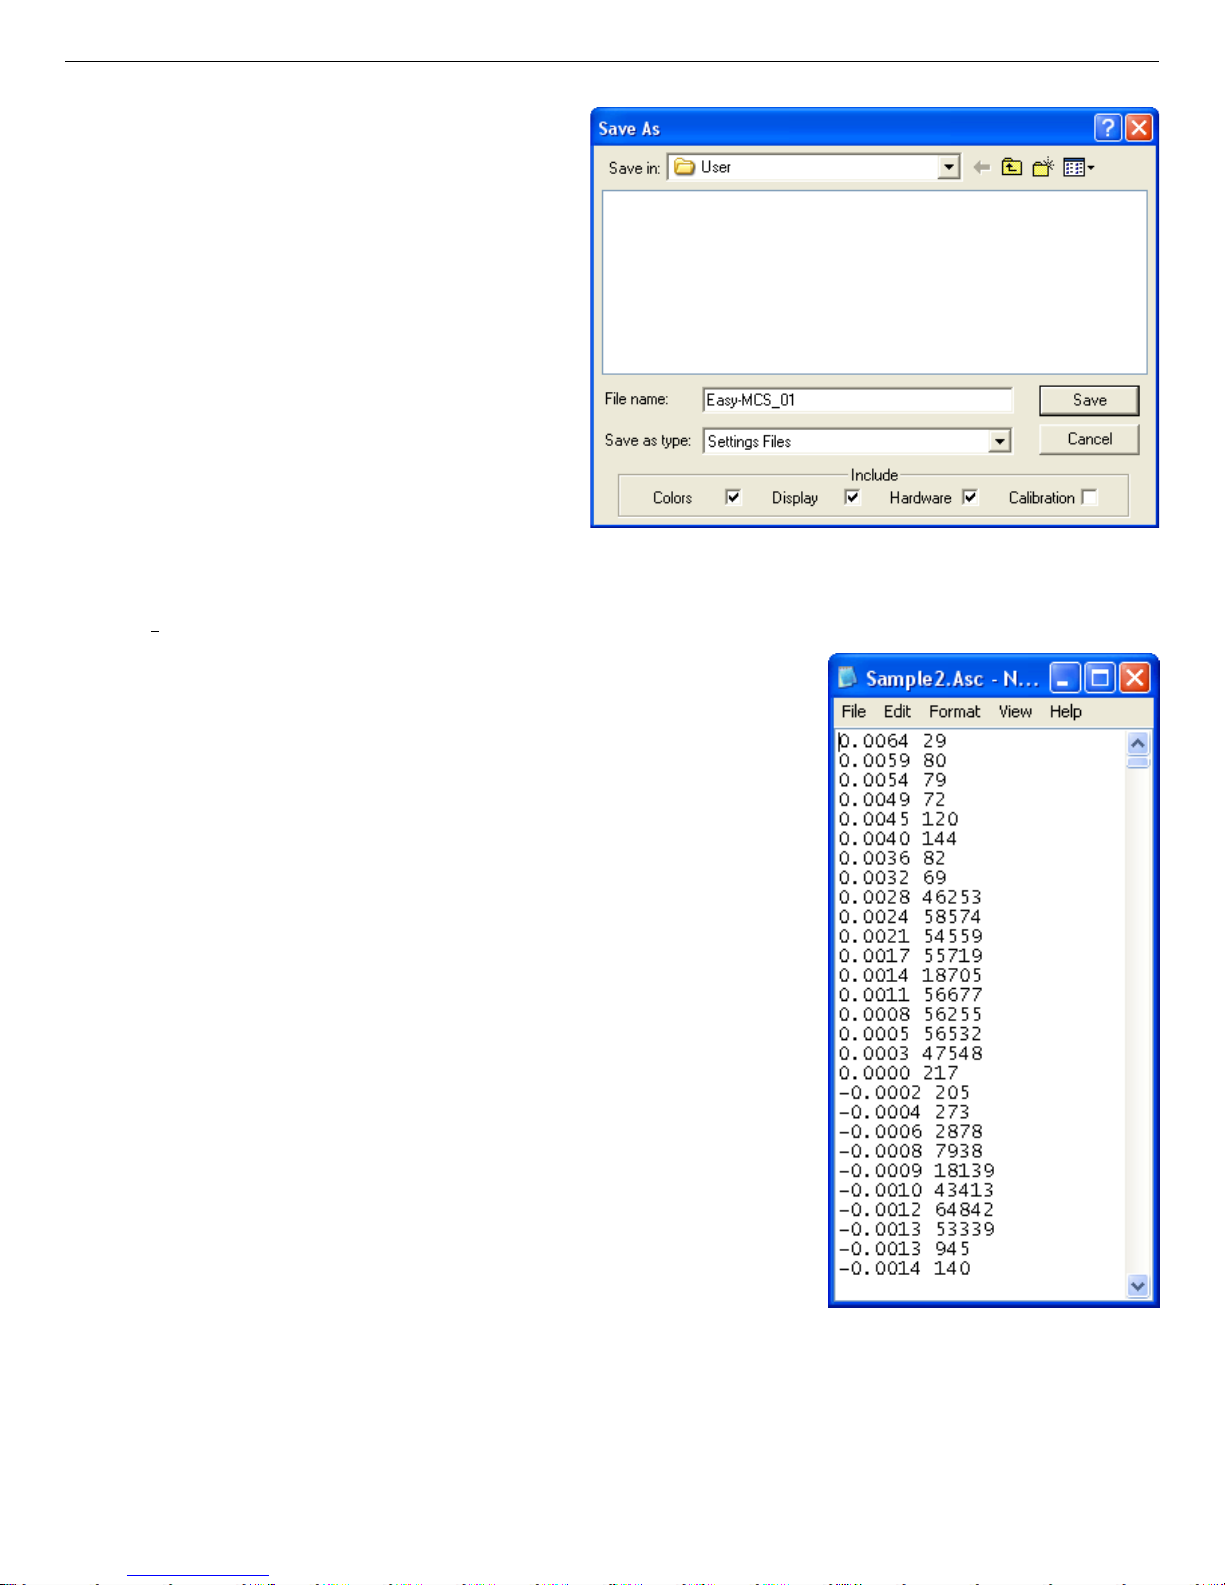
Easy-MCS ™ Multichannel Scaler and MCS-32 (A73-B32) Software 931054C / 1213
! If the Hardware box is marked,
the Pass Length, Pass Count
Preset, Dwell Time, Sum/Replace
Mode, Internal/External Trigger,
Discrim-nator, SCA, and Ramp
Settings are saved.
! If the Calibration box is marked,
the current calibration is saved.
Any or all checkboxes can be marked
to control what is stored in the settings
file. The default and recommended
extension for a settings file is
.SET.
Fig. 27. Save Settings on Disk.
6.1.8. I
mport ASCII...
This comma nd reads into the buffer an ASCII, histogram
data file created by the Export ASCII... command. MCS-32
must be in buffer mode before the command is executed.
The data format for the text file consists of a list of twoelement lines. Each line is composed of the calibrated value
(floating point) and the counts (integer) separated by spaces,
tabs, commas, or semicolons; see the example in Fig. 28.
The number of channels read into the buffer is equal to the
number of lines in the text file.
If the buffer contains data that have not been saved, a warning message opens. Click Yes to execute the Save Data
As... command, No to continue the import operation, and
Cancel to return to the main display with no action.
A standard file-open dialog opens, displaying a list of
ASCII text files. Select a file and click on Open. A progress
indicator at the bottom of the screen will track the progress
of the importation.
Fig. 28. Format of Exported
When the text file has been read successfully, the descrip-
ASCII File.
tors (Pass, Dwell Time , etc.) will be set to default values
for the buffer (since descriptors are not saved by the Export ASCII... command). The Acquisi-
tion fields on the Sidebar are grayed to indicate that the values did not come from an actual
42
Page 53
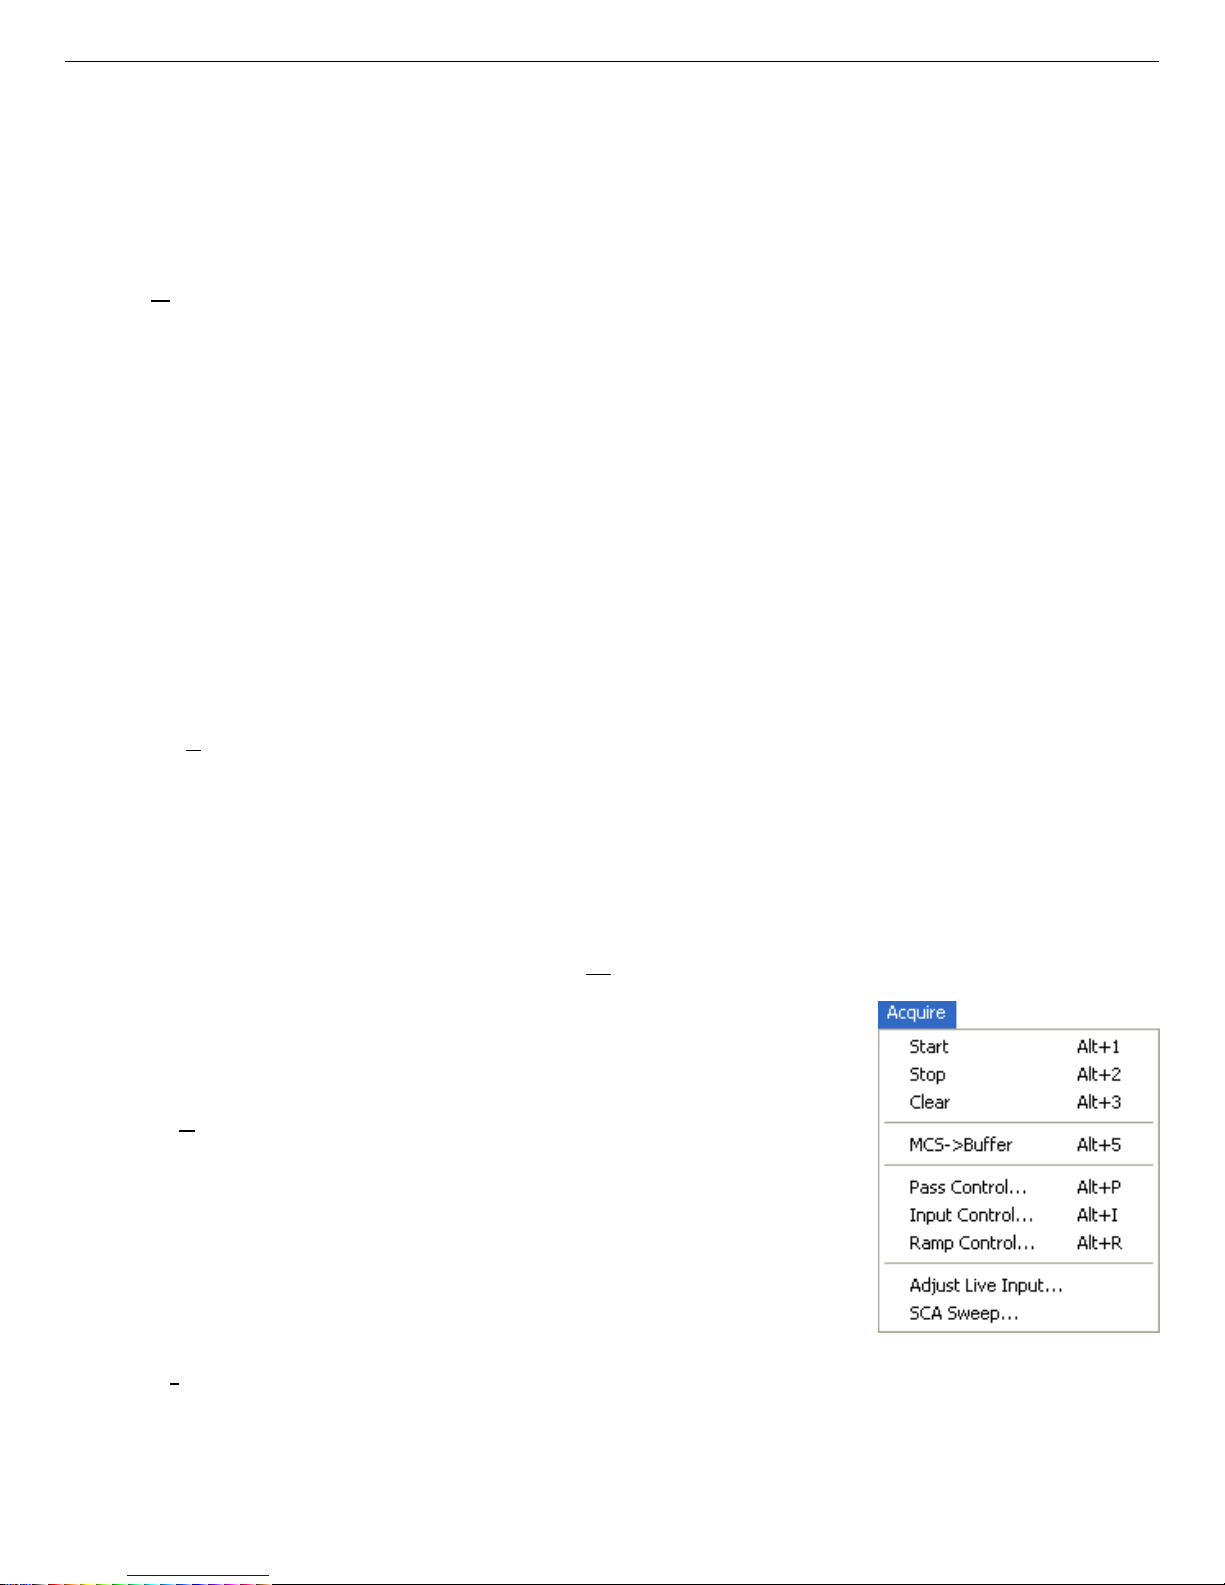
931054C / 1213 6. MENU COMMANDS
acquisition. The calibration curve is fitted as a linear, quadratic, or cubic fit depending on the
number of channels in the file. The calibration units ar e set to “???” to indicate that the units did
not come from the file. In addition, an MCS calibration table (
.MCT) file is also generated which
shows the calibration points selected during the import process.
6.1.9. E
xport ASCII...
The Export ASCII... command writes the displayed data to an ASCII text file with the default
extension
.ASC. When this comm a nd is selected, a standard file-save dialog opens. Enter a valid
filename (consisting of an optional drive and directory, a file name, and an optional extension)
and click Save. If the specified file already exists, a m e ssage box opens asking you to verify the
entry or cancel the operation. Click Yes to overwrite the existing file. A progress indicator at the
bottom of the screen will track the duration of the save.
The entire spectrum is saved to disk. The data format for the text file consists of a list of twoelement lines. Each line is composed of the calibrated value (floating point) and the counts
(integer) separated by spaces. This is also the format read by the Import ASCII... command.
Figure 28 shows the layout of an exported ASCII file.
6.1.10. Ex
it
This exits MCS-32 and returns to Windows. If the buffer contains a spectrum that has not been
saved, a warning message is displayed to allow you to save. Any JOBs are terminated. If data
acquisition is in progress, acquisition will continue — the hardware can continue data collection
even if the software is not active.
6.2. Acquire
The Acquire menu is shown in Fig. 29. T he Start, Stop, and
MCS > Buffer commands are active only in MCS mode.
6.2.1. Sta
The Start command initiates data collection in the selected
MCS. You can also start the MCS with the <Alt + 1> accelerator, or by clicking the Start button on the Sidebar. See
Pass Control... (Section 6.2.5) for information on what takes
place when you select Start.
6.2.2. St
Stop terminates data collection in the selected MCS. The MCS
can also be stopped with the <Alt + 2> accelerator or by clicking the Stop button on the Sidebar.
rt
Fig. 29. Acquire Menu.
op
43
Page 54
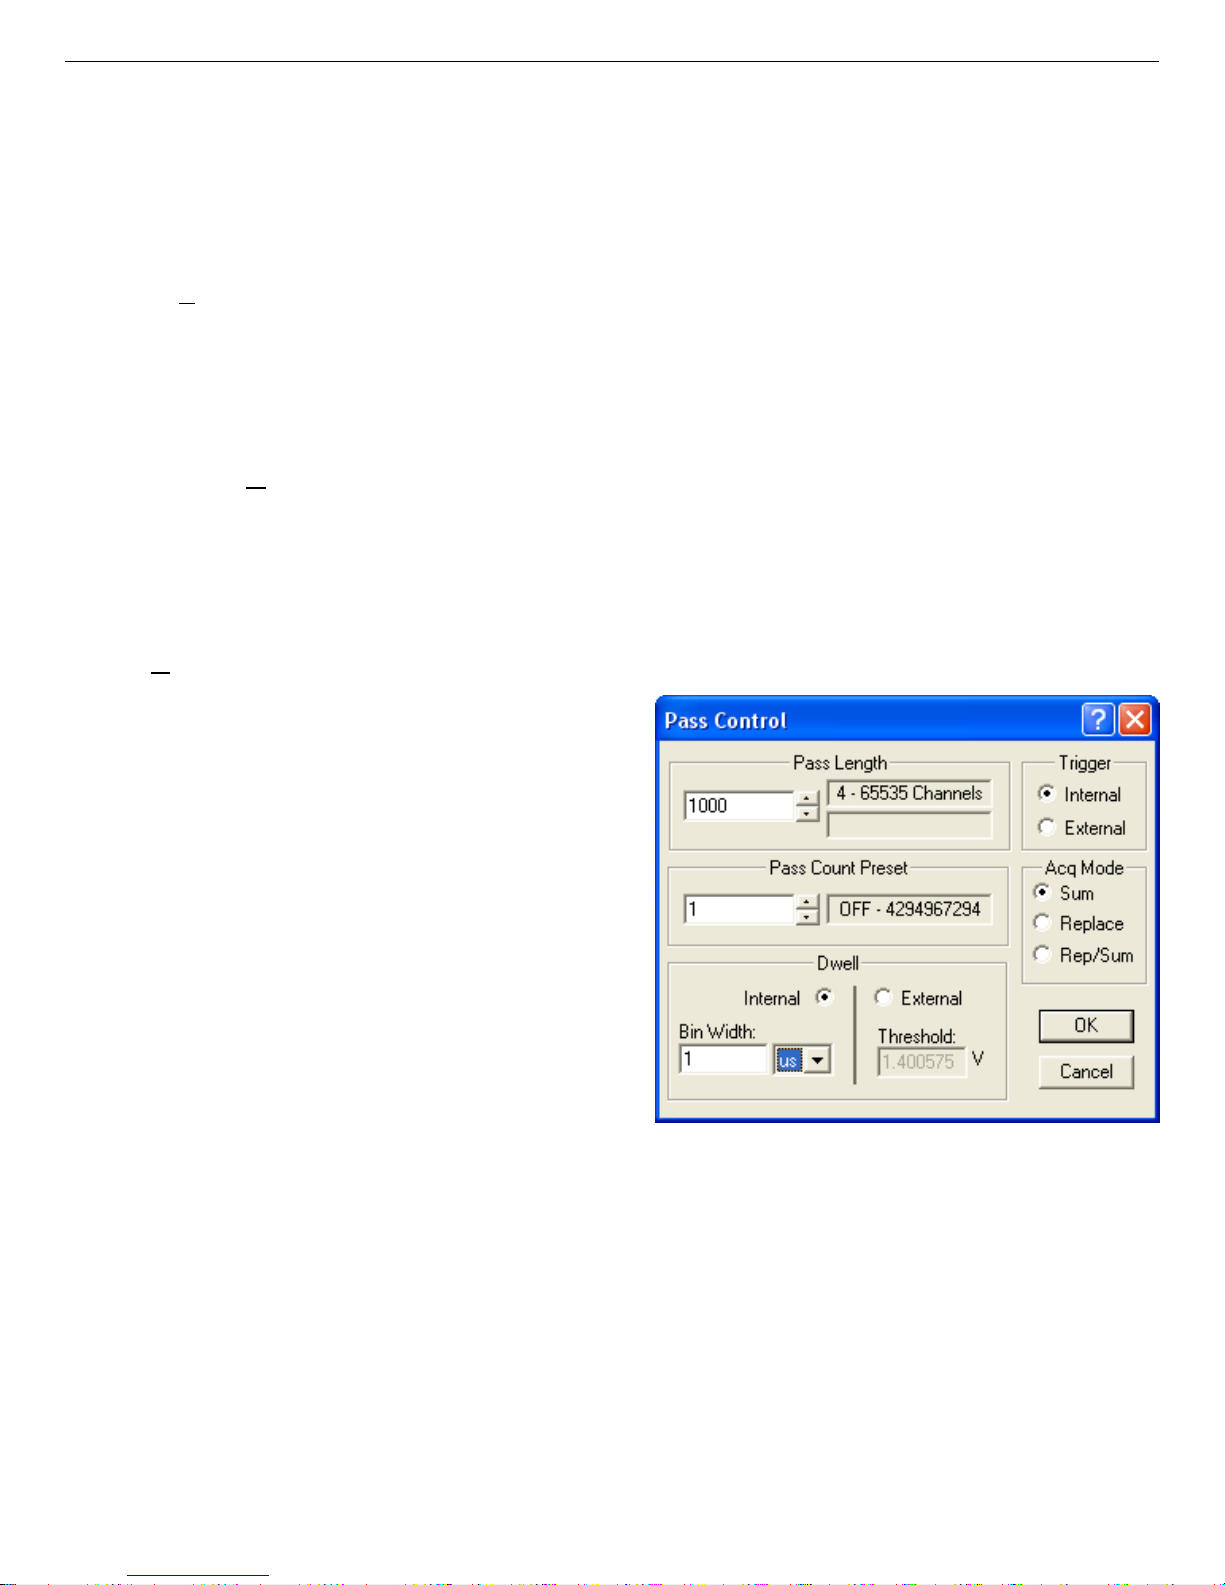
Easy-MCS ™ Multichannel Scaler and MCS-32 (A73-B32) Software 931054C / 1213
If the MCS is not collecting data, the Stop command is ignored. If the MCS is collecting data,
the Stop command will stop acquisition after the current pass is completed. The Stop button on
the Sidebar flashes while this final sweep is completed. If you then issue Stop a second time, the
current pass will terminate before completion.
6.2.3. Cle
ar
Clear erases the spectral data and pass count. This command will not operate on an active MCS.
You can also execute the Clear command with <Alt + 3> or by clicking the Clear button on the
Sidebar.
6.2.4. MCS > B
uffer
This comma nd transfers data and all pertinent information (pass count, pass length, dwell time,
etc.), from the selected MCS to the buffer. The MCS > Buffer function can also be performed
by pressing <Alt + 5>.
6.2.5. P
ass Control...
This comm and opens the dialog shown in
Fig. 30 appears. This function is available
in both buffer and MCS modes, even if the
MCS is acquiring data. However, for the
buffer and for MCSs acquiring data, the
current settings can’t be changed.
Enter the number of channels to use for
MCS acquisition in the Pass Length field.
The minim um pass length is 4 and the
maxim um is 65536.
The Pass Count Preset entry field is used
to enter the number of passes to collect.
Fig. 30. Pass Control Dialog.
With this preset condition, the MCS stops
counting when the pass count reaches this
value. To turnoff this preset, enter 0 (zero) or the word “off”; the MCS will then collect data
until the Stop command is issued.
In the Dwell section, select either Internal or External. For internal dwell, enter the dwell time
in the Bin Width field, then open the adjacent drop-down list and select the time units. If you
select external dwell, the Channel Advance input on the MCS is used to provide the signal that
causes the MCS to move from one channel to the next. Set the dwell threshold voltage to a value
44
Page 55

931054C / 1213 6. MENU COMMANDS
between !1.6 V to +3.0 V (inclusive). Typically, the threshold voltage should be set halfway
between the upper and lower amplitude limits of the signal provided to the Channel Advance
input.
The Acq Mode radio buttons determine how new data is collected.
! Sum — The current pass data are added to data from previous passes.
! Replace — The current pass data replace the data from previous passes.
! Rep/Sum — The first pass replaces any current data, then the remaining passes are
summed.
The Trigger radio buttons determine how passes are started.
! Internal — The first pass begins immediately when the Start comm a nd is issued. When
a pass completes, the next pass starts immediately with no dead time.
! External — A pass does not start until the appropriate signal is applied to the START
input on the front panel of the MCS. After a pass completes, the MCS unit stops and
waits until another start signal occurs on the START input before beginning the next
pass. See Section 2.1.1 for timing details.
In general, the External trigger is used to synchronize the MCS to the external hardware, while
the external hardware is synchronized to the MCS by selecting the Internal trigger. See
Sections 2.1.1 and 2.1.2.
The current Pass Count Preset and Dwell Time for the selected MCS are shown on the Sidebar.
These values are not affected while you enter the values into the dialog or Cancel the dialog.
They do change, however, as soon as you click OK.
6.2.6. I
nput Control...
Selecting Input Control... opens the dialog shown in Fig. 31. This command is available in both
buffer and MCS mode, even if the MCS is acquiring data. However, for the MCSs that are
acquiring data and in buffer mode, the settings can’t be changed.
The Use SCA Input and Use Disc Input buttons determine which input is used. When Use SCA
Input is “on” (highlighted), the SCA input is activated. When the Use Disc Input button is
highlighted, the fast discriminator is activated for the BNC connector labeled IN.
The SCA input accepts pulses that fall between two levels. For the signal to be accepted, the
signal must start at a voltage less than the lower level, rise to a voltage that is between the low e r
and upper levels, then return to a voltage less than the lower level. The lower and upper levels
45
Page 56
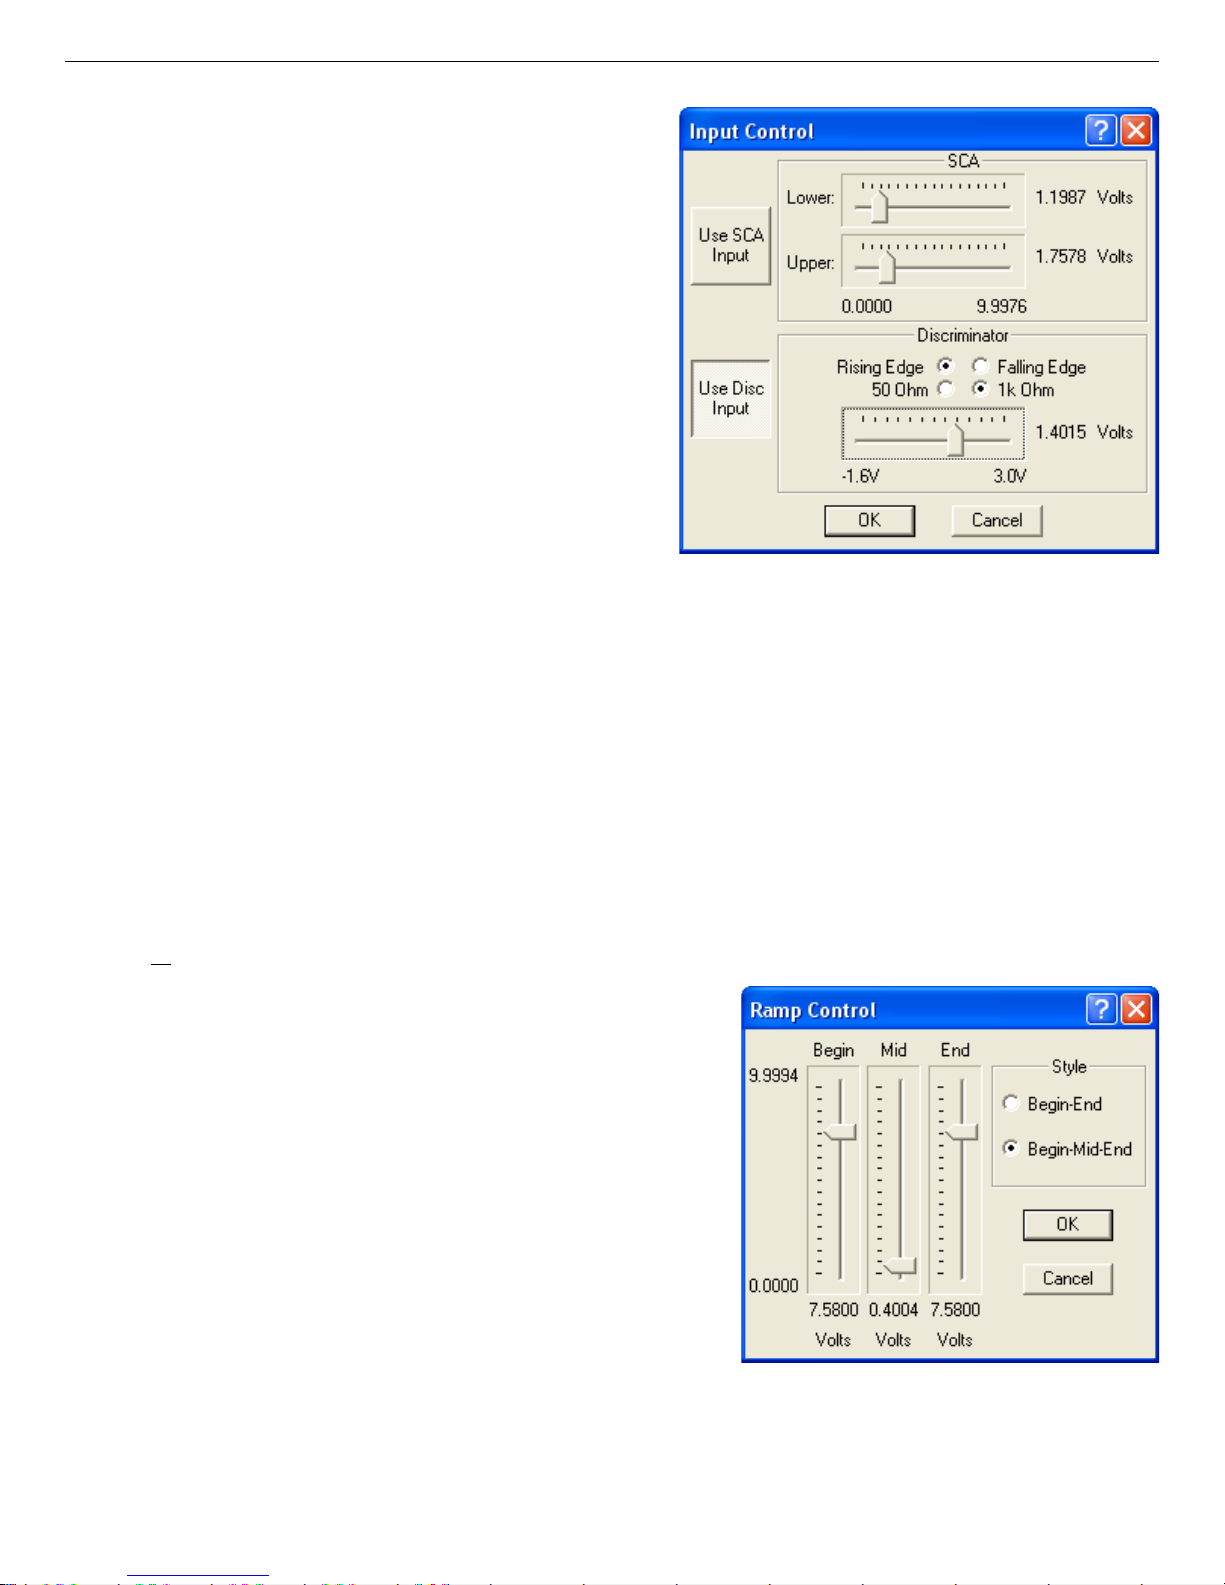
Easy-MCS ™ Multichannel Scaler and MCS-32 (A73-B32) Software 931054C / 1213
are set with the Lower and Upper slide bars
in the SCA section of the dialog. The nominal
voltage of the levels is displayed to the right of
each slide bar. To change the voltage, point at
the slide button, click and hold the left mouse
button, and drag the mouse to the voltage you
want. To ma ke small adjustments, click the
slide bar to the left or right of the button. To
make super-fine adjustments, click the slide
bar to activate it, then use the <8>/<9> keys.
The Discriminator input (the BNC connector labeled IN) accepts pulses that cross the
Dis criminator Voltage. When the Rising
Fig. 31. Input Control Dialog.
Edge radio button is marked, the discrimi-
nator triggers when the input crosses the discriminator voltage with a positive slope. When the Falling Edge radio button is marked, the
discriminator triggers when the input crosses the discriminator voltage with a negative slope.
The discriminator voltage is set with the slide bar. The nominal voltage of the discriminator
level is displayed to the right of the slide bar. To change the voltage, drag the slide button left or
right. To make fine adjustments, click the slide bar to the left or right of the slide button. To
make super-fine adjustments, click the slide bar to activate it, then use the <8>/<9> keys. Use
the discriminator threshold to reject noise and smaller-amplitude pulses while counting largeramplitude pulses.
6.2.7. R
amp Control...
Ramp control provides an analog waveform synchronized with the MCS sweep. Use the Ramp Control...
command (Fig. 32) to set up the type of waveform
that will be used.
The Style radio buttons determine the type of waveform. The Begin-End style generates a “ sawtooth”
waveform, while the Begin-Mid-End button generates a “triangle” waveform.
Several examples of Begin-End and Begin-Mid-
End waveforms are illustrated in Fig. 33.
Fig. 32. Ramp Control Dialog.
When the Begin-End Style is selected, you must specify two voltages: the voltage at channel 0
and the voltage at the last channel in the sweep. The dialog displays two slide bars for setting
46
Page 57
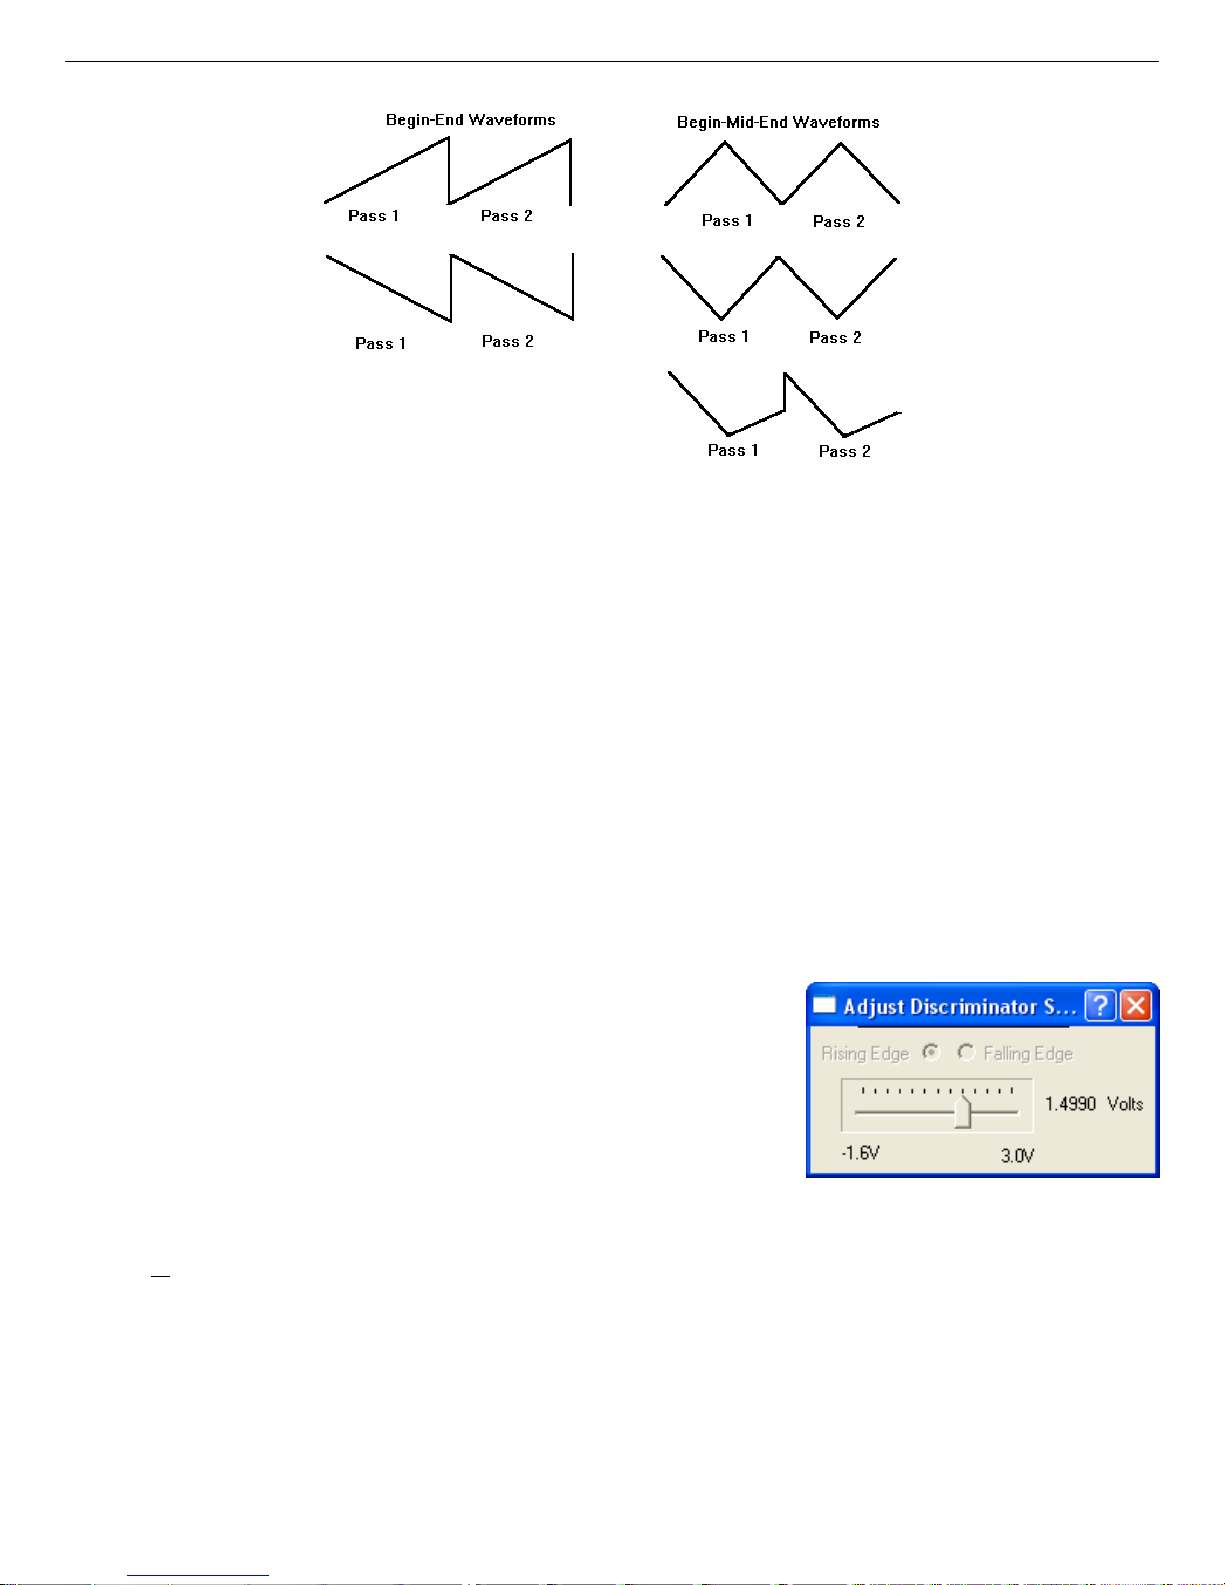
931054C / 1213 6. MENU COMMANDS
Fig. 33. Example Ramp Waveforms.
these voltages. To change a voltage, click the slide button and drag the mouse up or down to the
setting you want. To make small adjustments, click the slide bar above or below the slide button.
To make super-fine adjustments, click once on the slide bar to activate it, then use the <8>/<9>
keys. The nominal voltage is displayed below the bar.
When the Begin-Mid-End Style is selected, the voltage at the middle channel in the pass must
be specified. A third slide bar is displayed to specify this voltage. A straight line will be drawn
between the specified voltages; however, since the voltage is generated by a digital-to-analog
convertor, the waveforms will have a discrete appearance (“stair steps”).
6.2.8. Adjust Live Input...
This comm a nd opens a small dialog (Fig. 34) that allows
you to adjust the discriminator or SCA levels while data
collection is in progress. This feature is useful in setting
up the thresholds since the data responds immediately as
the threshold is adjusted. In contrast, if you use the Input
Control... dialog to adjust the thresholds, you must close
that dialog before the adjustment takes effect.
6.2.9. S
CA Sweep...
Fig. 34. Adjust Input Levels
During Data Acquisition.
This comma nd opens a dialog and sidebar that allow you to efficiently choose the optimum SCA
settings. An SCA window (with a width of 19.5 mV between the upper and lower levels) is
swept from 0 to +10 V in 512 steps. The Easy-MCS records the number of counts that arrive
during each setting. The resulting histogram displays the pulse-height spectrum presented at the
SCA input.
47
Page 58
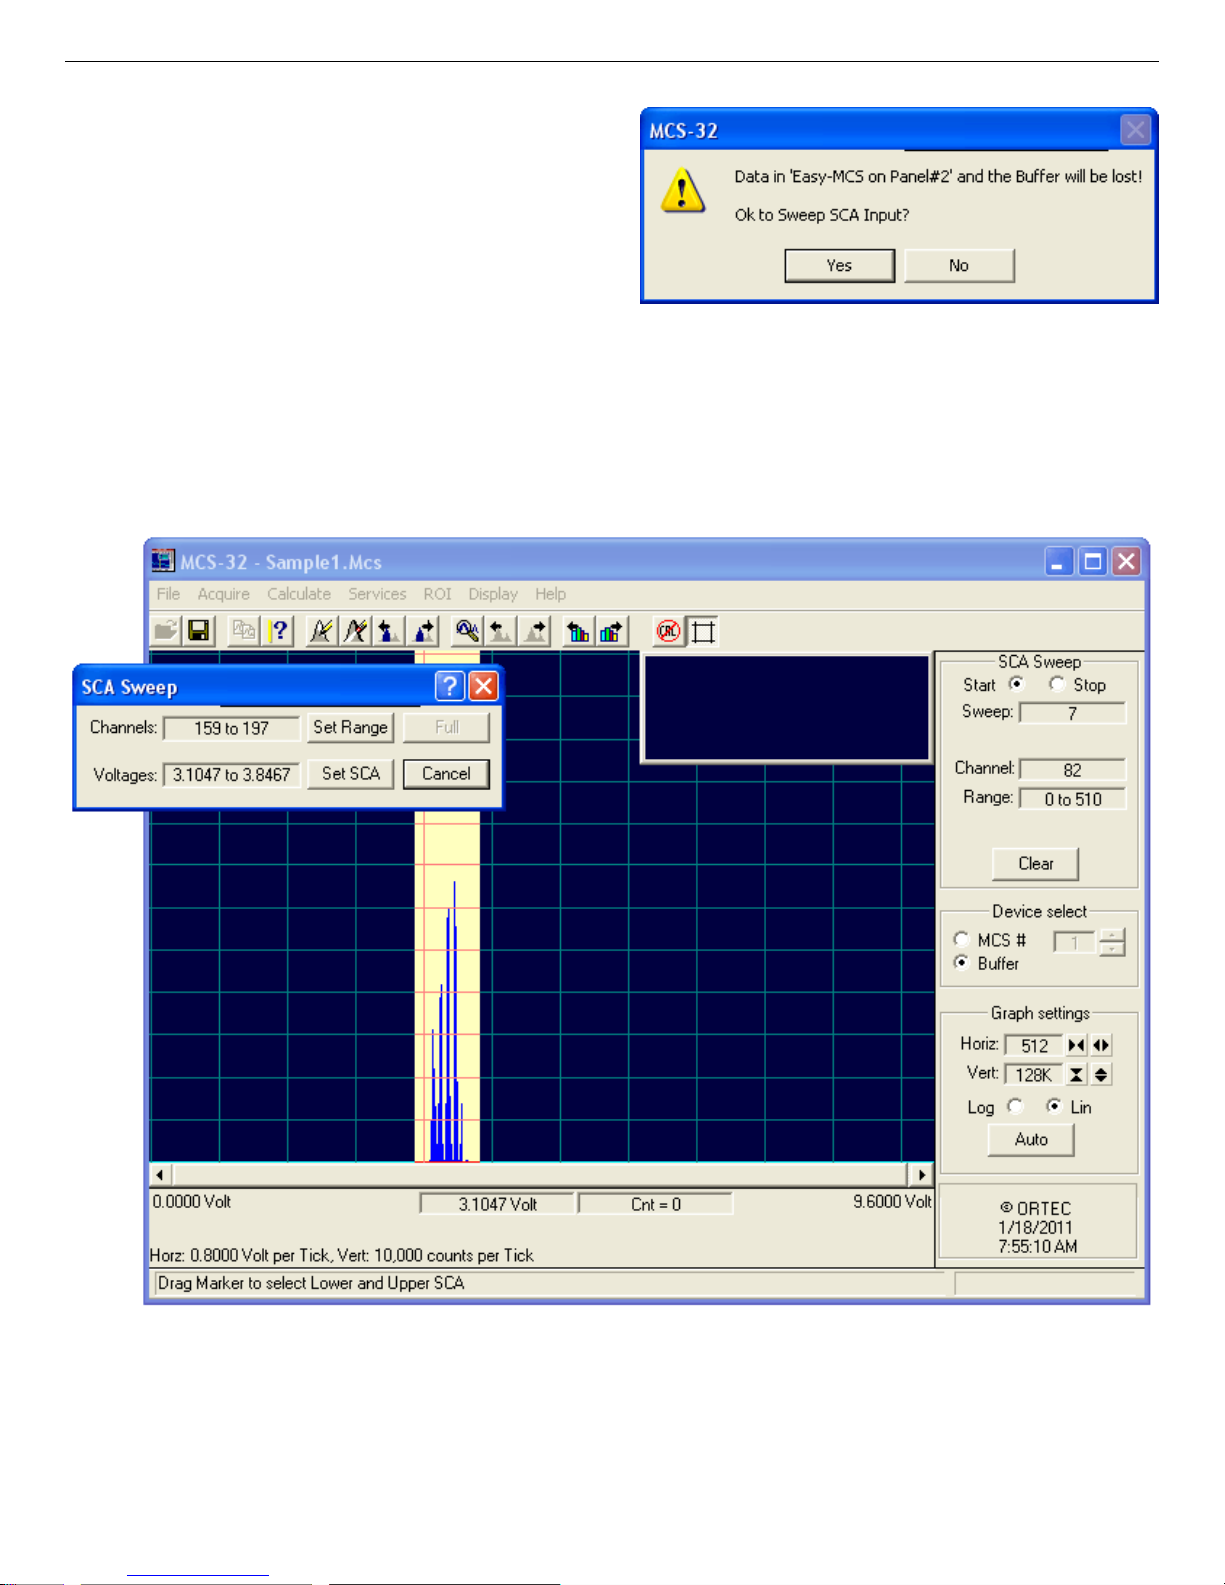
Easy-MCS ™ Multichannel Scaler and MCS-32 (A73-B32) Software 931054C / 1213
If the buffer contains unsaved data when you
issue the SCA Sweep command, a warning
dialog (Fig. 35) opens. To cancel the sweep
without losing the buffer contents, click No.
Once the SCA Sweep dialog and sidebar open
(Fig. 36), the Easy-MCS continuously sweeps
the SCA discriminator voltage to create the
Fig. 35. Warning that Buffer Contents Will Be
Lost.
histogram. Each sweep takes 5 to 20 seconds
depending on the speed of the computer. Click
the Stop button to stop the SCA sweep when enough data have been collected to adequately
define the pulse-height spectrum.
Fig. 36. SCA Sweep Display (voltage range set by clicking and dragging marker with mouse).
48
Page 59
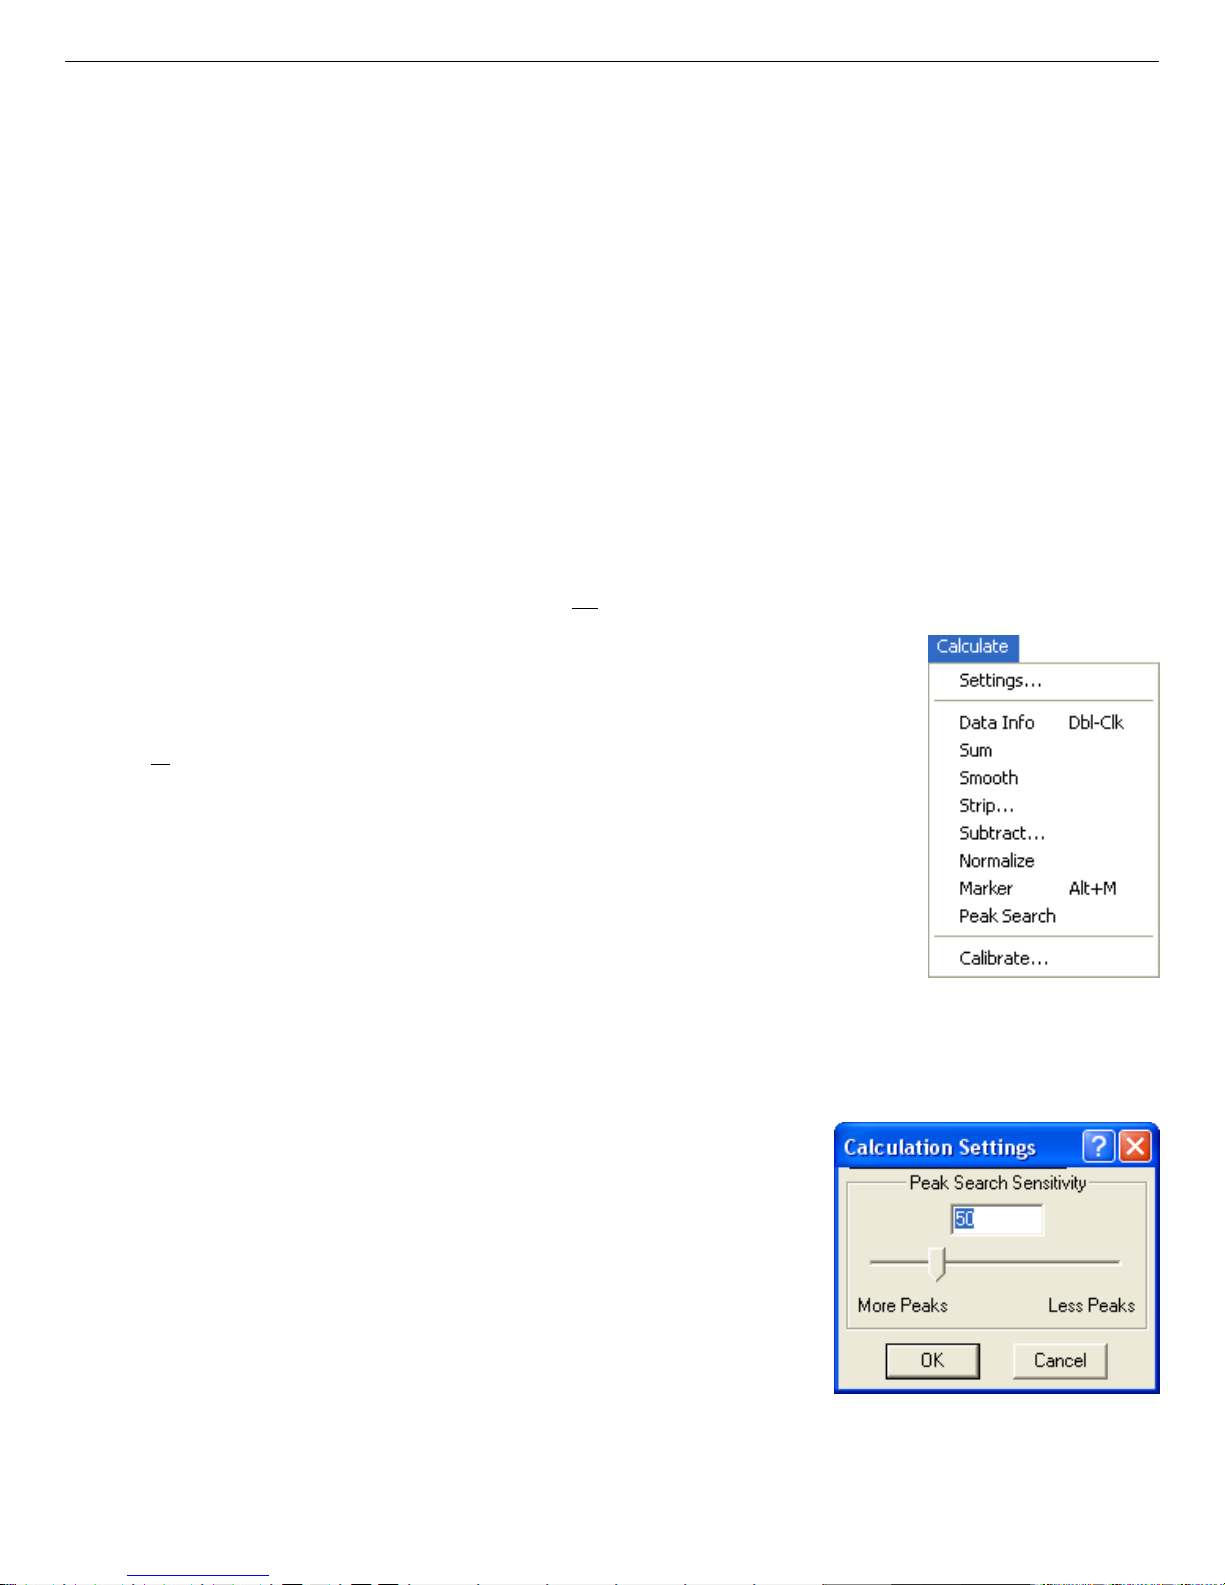
931054C / 1213 6. MENU COMMANDS
In Fig. 36, a signal with an amplitude of approximately 5 V has been fed into the SCA input. T he
spectrum peak collected has been marked in reverse video by clicking and dragging the mouse
from one side of the peak to the other. The voltage range of this marked region is reflected in the
Voltages field in the dialog (note that the Channels and Voltages fields in the SCA Sweep
dialog will update in real time as you click a nd drag the mouse). These SCA voltages correspond
to the upper and lower limits of the region m a rked on the peak. To set the SCA levels to these
voltages, click the Set SCA button. The SCA sweep will run faster if the range of sweep voltages is limited. To do this, click and drag the marker over the range of channels to be swept and
click the Set Range button.
The Full Button returns the range to 10 V. The Stop Button stops acquisition. The Start Button
restarts the acquisition and Clear Data clears the data. The Cancel Button can be used to exit
the SCA sweep mode and return the SCA settings to their original values.
6.3. Calculate
The Calculate menu is shown in Fig. 37. These commands
functions are available in both MCS and buffer mode.
6.3.1. S
ettings...
Settings... opens the dialog shown in Fig. 38, which allows
you to set the sensitivity of the algorithm used in Peak Search.
Duringa peak search, suspected peaks in a spectrum must pass
a sensitivity test to be accepted. This test compares the magnitude of the smoothed second difference with the weighted error
to be accepted. The peak search sensitivity is a multiplicative
factor in the weighting factor.
Use the Peak Search Sensitivity slider to set the sensitivity to a value between 1 and 200. A value of 1 is the most
sensitive (i.e., finds more peaks), and 200 is the least sensitive (i.e., fewer peaks will be found). Click and drag the
slider to the setting you want. To make finer adjustments,
click the slider bar to activate it, then use the <8>/<9>
keys.
Fig. 37. Calculate
Menu.
Click OK to activate the new settings.
Fig. 38. Set the Peak Search
Sensitivity.
49
Page 60
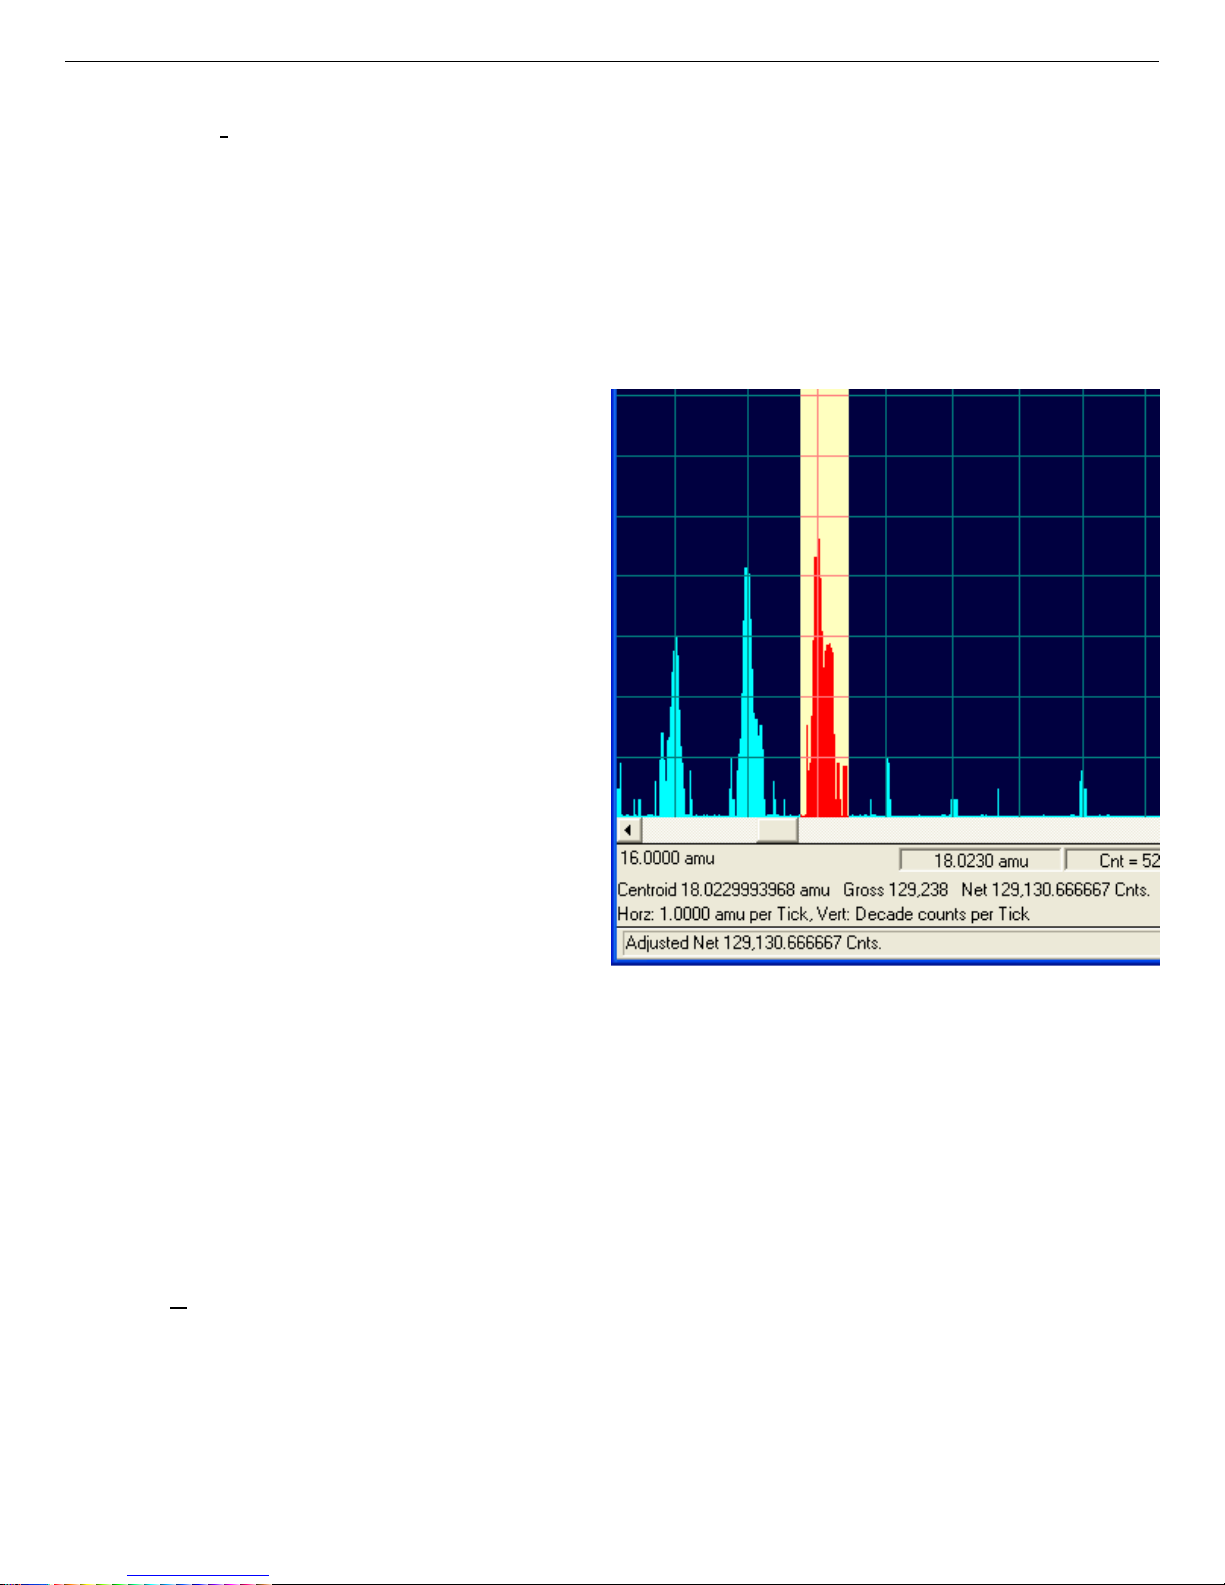
Easy-MCS ™ Multichannel Scaler and MCS-32 (A73-B32) Software 931054C / 1213
6.3.2. Data Info
This command calculates a centroid, gross area, and net area for the region selected with the
marker. To select a region, click and drag the mouse across the desired set of channels in the
expanded display.
Alternatively, this calculation can be performed on an ROI by double-clicking the ROI. This
automatically selects the region marked by the ROI and performs the Data Info calculation.
Figure 39 shows how the results of the
Data Info command are displayed on
the Marker Information Line. The
marker value changes to the centroid,
and a gross and net count are displayed.
If the spec-trum is calibrated, the centroid is reported in calibration units.
If the spectrum is not calibrated, the
centroid is reported in either time
(internal dwell time mode) or channels
(external channel advance mode). Also,
if a library file has been specified (see
Section 6.4.2), MCS-32 searches the
library for the value that most closely
matches the calculated centroid, and
reports the name associated with that
value on the bottom line of the screen.
The centroid is calculated by taking the
Fig. 39. Data Info Results.
first moment of the selected data after a
linear background is subtracted from
the data. The background is calculated by averaging the last three channels of the region on each
side of the region as end points of a straight-line fit. The background is calculated from the midpoint of the three points used in the average. If the region is less than 6 channels wide or the net
counts is zero, the calculated centroid will be the first mome nt of the selected data without
subtracting the background.
6.3.3. Su
m
This comma nd sums all of the data values in the spectrum and reports the value on the Supplementary Information Line. If the MCS is acquiring data at the time the Sum command is issued,
an approximate sum is reported.
50
Page 61
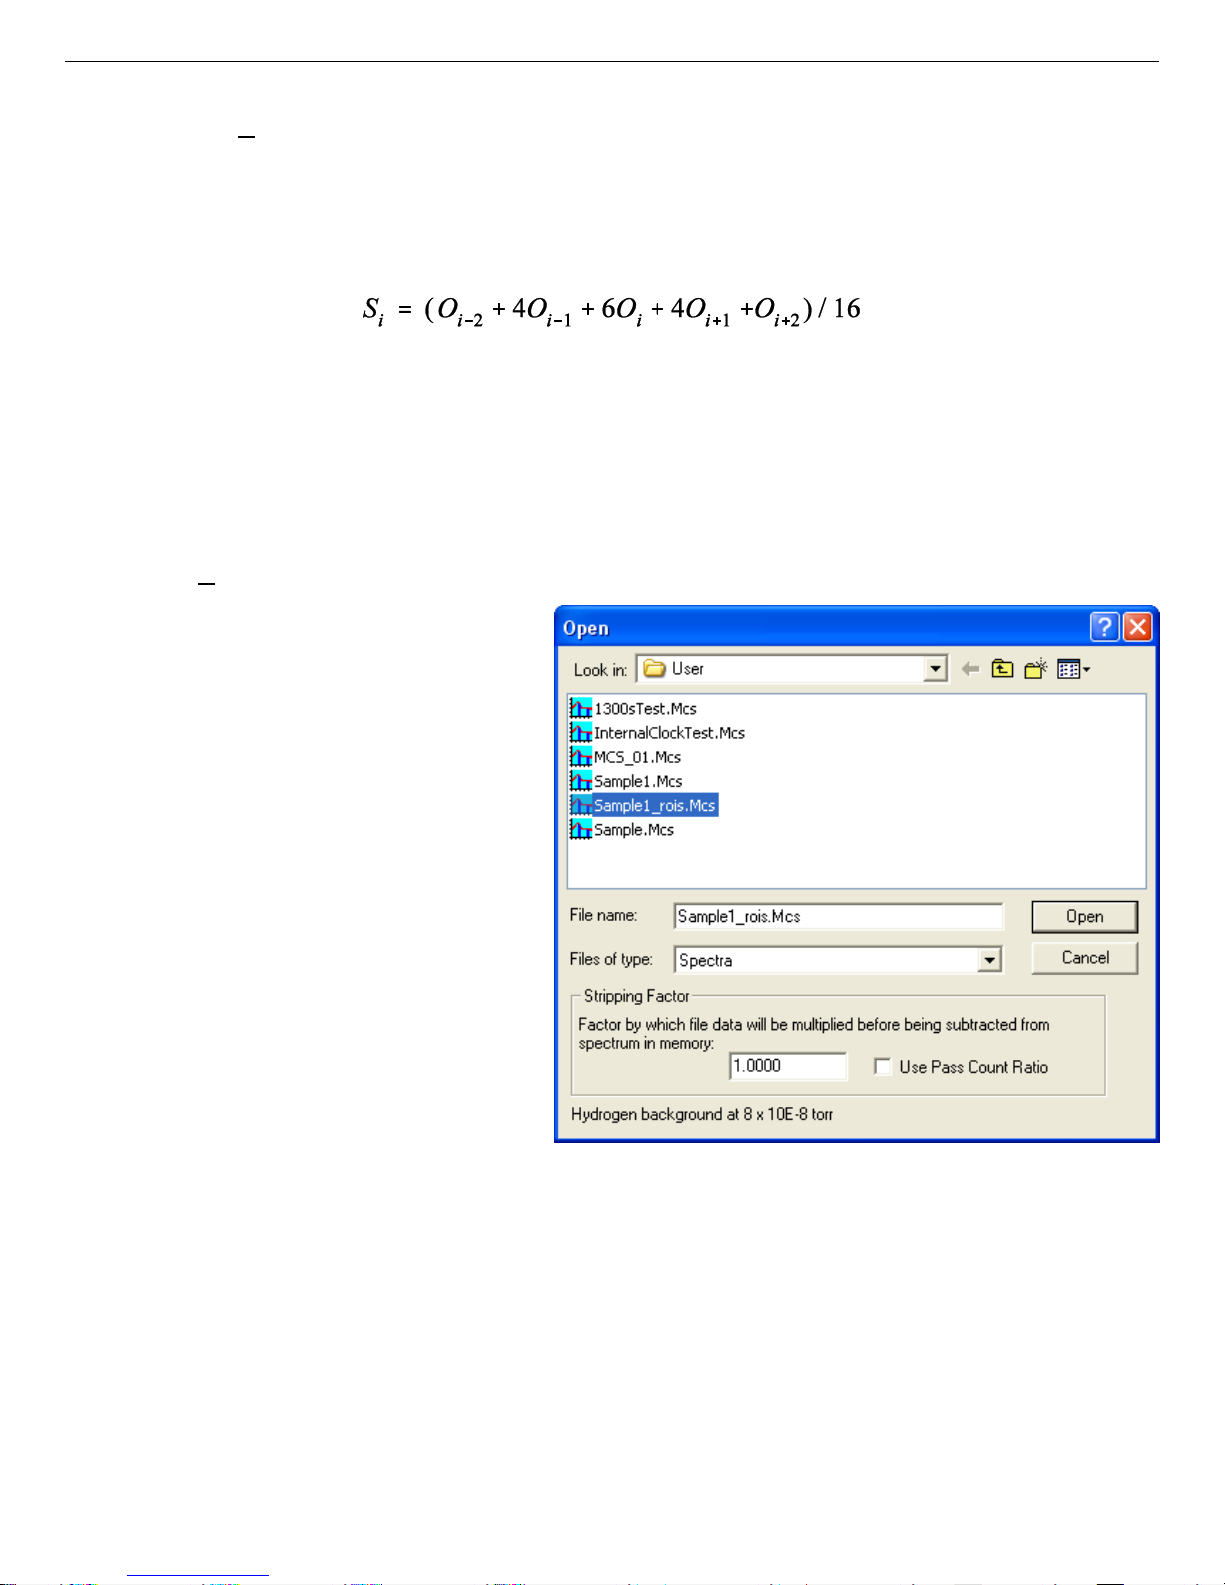
931054C / 1213 6. MENU COMMANDS
6.3.4. Smooth
The Smooth function transforms the data in the buffer according to a five-point, area-preserving, binomial smoothing algorithm. That is, the existing data are replaced, channel-by-channel,
with the smoothed data as follows:
where
S
O
= the smoothed data in channel i
i
= the original data in channel i
i
After S
6.3.5. Strip
is calculated, it is rounded off to the closest integer.
i
...
When Strip... is selected, the dialog
shown in Fig. 40 opens, prompting
you for a filename and Stripping
Factor. The strip file should be a
valid
.MCS file containing the same
number of channels as the buffer.
Once you select a file and click
OK, MCS-32 strips the specified
disk spectrum from the spectrum in
the buffer and stores the result in
the buffer.
The Stripping Factor is a real
number that is multiplied, channel
by channel, by the disk spectrum
before being subtracted from the
buffer. This factor can be negative,
in which case the spectra are added.
Fig. 40. Choose a Stripping File and Stripping Factor.
If the Use Pass Count Ratio box in the file-recall dialog is marked, the strip factor is calculated
as the ratio of the pass count of the buffer spectrum to the pass count of the disk spectrum. The
pass count is not changed by any strip operation.
51
Page 62
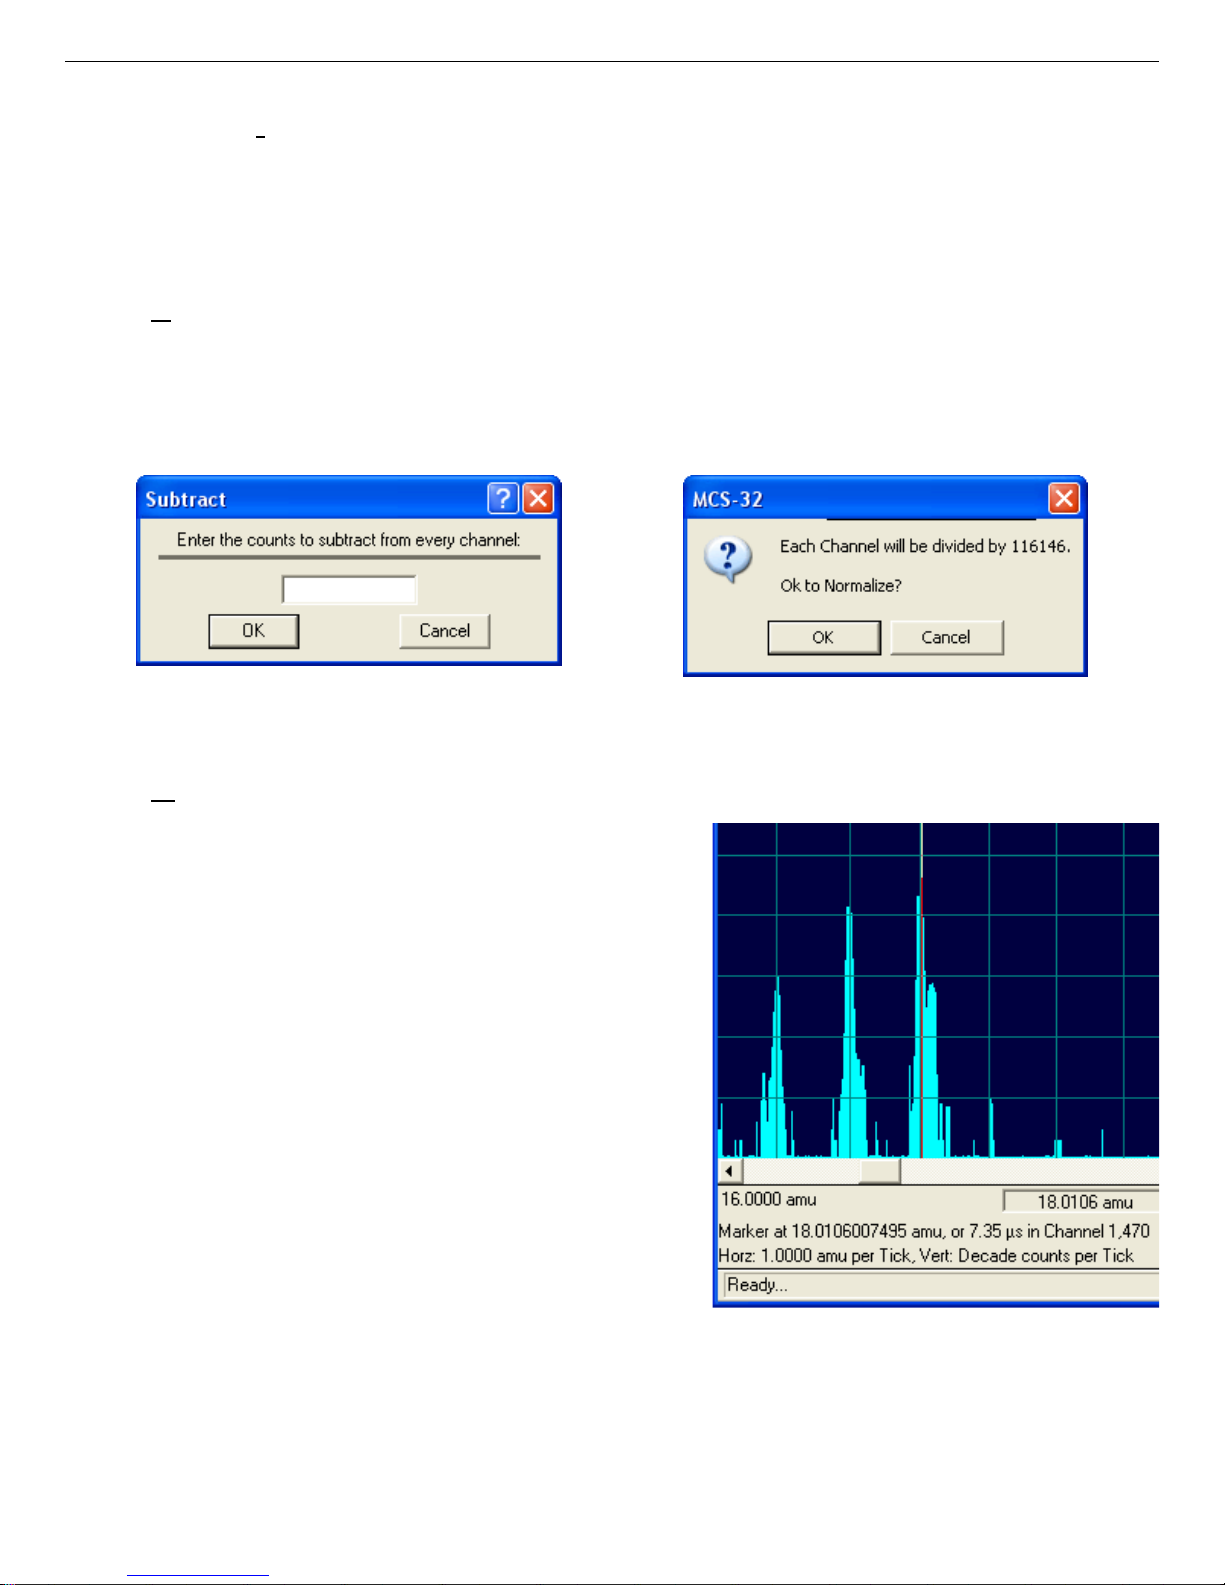
Easy-MCS ™ Multichannel Scaler and MCS-32 (A73-B32) Software 931054C / 1213
6.3.6. Subtract...
The Subtract function (Fig. 41) subtracts a constant from each channel in the buffer. This function is useful if small peaks are present on a large, constant background. The background can be
subtracted off to get a better look at the peaks.
6.3.7. N
ormalize
The Normalize function transforms the data in the buffer by dividing the data in each channel
by the pass count and rounding that value off to the closest integer (see Fig. 42). This command
changes the pass count to 1.
Fig. 41. Enter the Subtraction Constant.
Fig. 42. Normalize?
6.3.8. M
arker
Marker reports the current marker position on
the Supplementary Information Line near the
bottom of the display (see Fig. 43).
By default, the marker is reported at the center
of the channel. The marker position is displayed
at a much higher precision than on the Marker
Information Line.
In the external dwell time mode, the marker position is displayed in channels. In the internal dwell
time mode it is displayed in time. If the spectrum
is calibrated, the marker position is also displayed
in calibrated units. In all three cases, the closest
channel number is also included on the Supplementary Information Line.
Fig. 43. Results of Marker Command.
If a region is selected with the marker, the width of the region is displayed, in time or calibrated
units, instead of the single marker position.
52
Page 63

931054C / 1213 6. MENU COMMANDS
This command is duplicated by the <Alt + M> accelerator and the Marker button on the
Toolbar.
6.3.9. Peak Sear
This function initiates a Mariscotti
ch
2
-type peak search on the spectrum in the buffer. This
smoothed-second-derivative peak-search algorithm is useful for peak widths in the range of
2–20 channels (full width at half maxim um [FWHM]). The peak-search sensitivity is set in
Calculate/Settings.... Each peak found is marked as an ROI. Overlapping or close peaks may
have contiguous ROIs. Existing ROIs are cleared before the command executes.
This command is duplicated by the Peak Search button on the Toolbar.
The Report command (see Section 6.1.4) can be used w ith Peak Search to produce a semi-
quantitative peak list for the spectrum.
6.3.10. C
alibrate...
The Calibrate command is used to establish a calibration for or remove a calibration from the
spectrum such that channel numbers and peak param eters are reported in the specified units as
well as time.
The calibration is stored with the spectrum when the Save Spectrum As... com mand is executed. The calibration values are also saved in the default configuration settings that are loaded
when MCS-32 is started, so the calibration is automatically restored.
To calibrate a spectrum:
1) Select Calibration.... This will open the Calibration Worksheet dialog shown in Fig. 44.
This dialog provides a place for entering up to 64 time or channel values, and the calibration
values that correspond to the times or channels. By default, time values are entered when the
dwell is internal. For external dwell, you must enter channel numbers. The Marker Information Line is updated to display the marker pos ition and display limits in the selected time
units when the calibration dialog is displayed.
2) Enter Time (Channel) values by ty ping the appropriate value into the Data Point section of
the worksheet, or by clicking the desired time or channel in the expanded display. The channel number entered does not have to be an integer. If you mark a set of channels and select
2
M.A. Mariscotti, “A Method for Automatic Identification of Peaks in the Presence of Background and its
Application to Spectrum Analysis,” Nuclear Instruments and Methods 50, 309!320 (1967).
53
Page 64
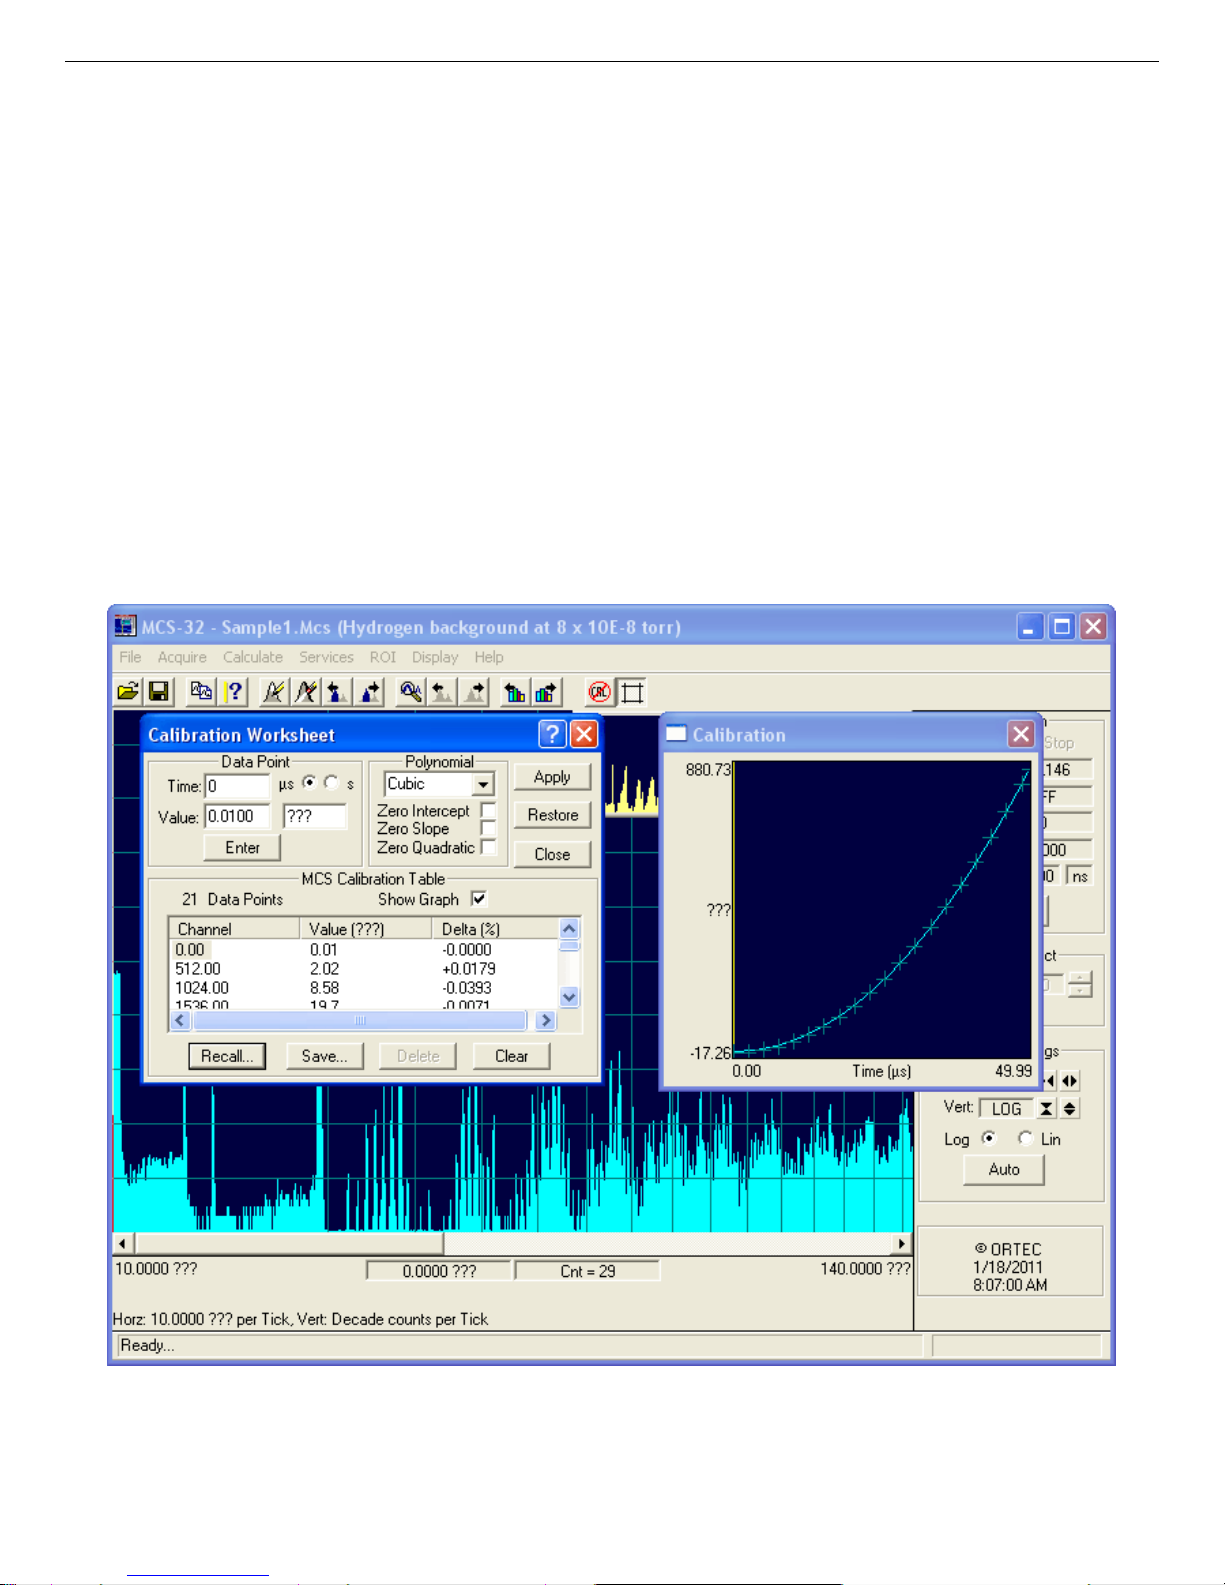
Easy-MCS ™ Multichannel Scaler and MCS-32 (A73-B32) Software 931054C / 1213
the Data Info command (see Section 6.3.2), the calculated centroid will be entered in the
calibration channel field.
3) Once this value is displayed in the Time (Channel) field, enter the calibration Value and
units.
4) Click the Enter button to add this calibration point to the MCS Calibration Table at the
bottom of the Calibration Worksheet.
5) Repeat this procedure for each calibration point.
The Polynomial group determines the calibration equation; specify a Linear, Quadratic, or
Cubic polynomial. Two or more points are required for a linear fit, a minimum of three points
for a quadratic fit, and four or more points for a cubic fit.
Fig. 44. The Calibration Worksheet and Graph.
54
Page 65
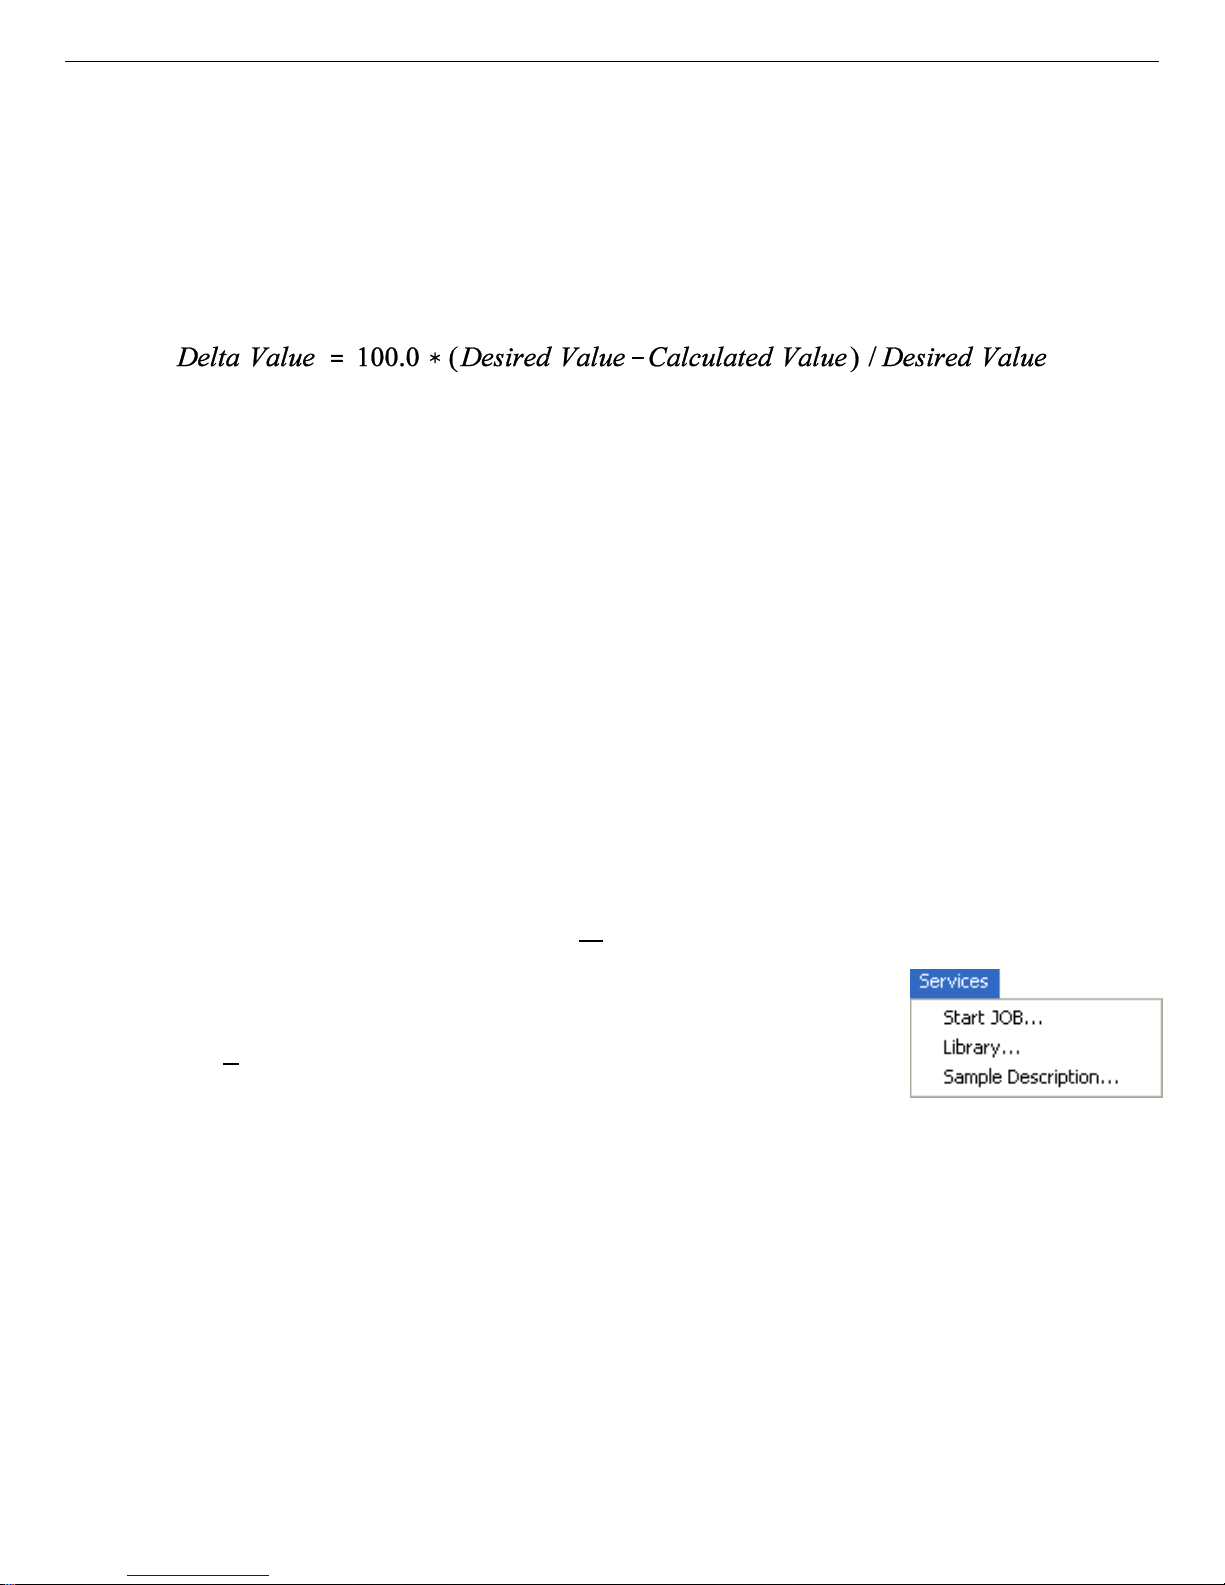
931054C / 1213 6. MENU COMMANDS
In addition, you can force the intercept, slope, or quadratic terms of the polynomial to zero by
marking the appropriate checkboxes.
The MCS Calibration Table shows the list of calibration points entered. If MCS-32 successfully performs the polynomial fit with the calibration points in the MCS Calibration Table, the
Delta(%) field of the table shows the goodness of fit. This value is calculated as:
MCS calibration tables can be saved to or recalled from disk. The default extension for these
files is
.MCT. The Recall button displays a standard file-recall dialog from which you can open a
previously stored table. The Save button displays a standard file-save dialog.
To undo the calibration and start over, click the Restore button. Click Clear to clear the calibration, and use Apply to apply the calibration to the displayed spectrum.
To end the calibration procedure, click Close.
Note that once a spectrum is calibrated, the Toggle Calibration Toolbar button and Display/
Time Units command (Section 6.6.3) switch the expanded display between calibrated units and
either time units (for internal dwell) or channels (for external dwell). For example, in internal
dwell mode, if the dwell time is 1 second and the pass length is 100 channels, it will take
100 seconds for a single sweep; each channel still represents one second.
6.4. Services
Figure 45 shows the Services menu.
6.4.1. Start J
Most of the functions under the various MCS-32 menus can
be automated by writing a JOB, which consists of one or more
commands written in ASCII text (see Chapter 8 for an in-depth
discussion and catalog of the commands). JOBs allow you to
easily perform repetitive tasks and/or define initial conditions at MCS startup. These files are
given a filename extension of
JOB... to display the dialog shown in Fig. 46. You can also edit
or any other ASCII text editor.
OB...
Fig. 45. The Services
Menu.
.JOB. To start a JOB or edit a .JOB file, select Services/Start
.JOB files in Windows Notepad
To display the contents of a
.JOB file at the bottom of the dialog, click once to highlight the file,
then click the Show Contents checkbox.
55
Page 66
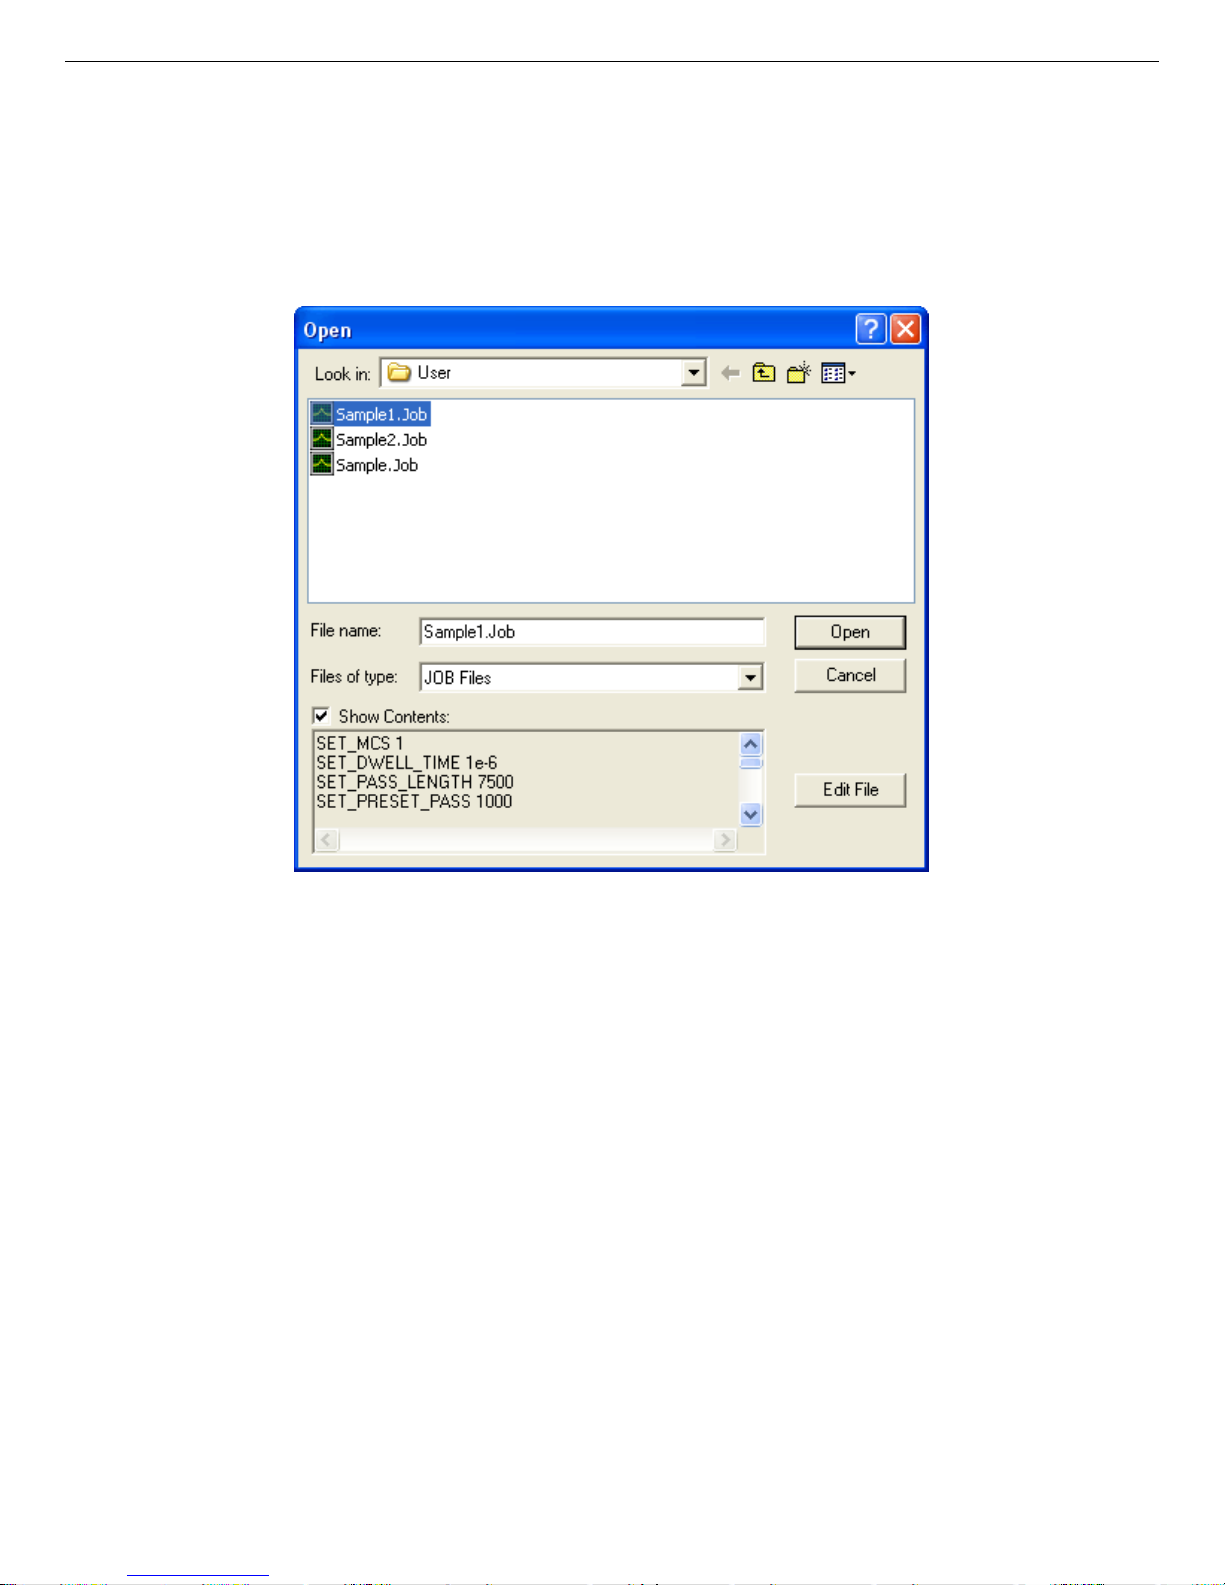
Easy-MCS ™ Multichannel Scaler and MCS-32 (A73-B32) Software 931054C / 1213
To run a JOB, select a .JOB filename and click Open. Once a JOB is started, most menu functions will be disabled (grayed) to prevent interference with JOB as it runs. The
.JOB filename
will be displayed on the Title Bar. In addition, a JO B control dialog in the upper left corner of
the display window will show the current status (current line number) of the JOB. This dialog
includes a Cancel button so the JOB can be aborted.
Fig. 46. .JOB File Selection and Execution.
If an error is encountered in a
occurred, and will display the offending line of the
.JOB file, an error message will indicate that an error has
.JOB file.
6.4.1.1. Editing .JOB Files
To edit a
.JOB file from the Start JOB dialog (whether or not Show Contents is activated),
select a file from the list and click the Edit File button. This will open Windows Notepad with
.JOB file loaded.
the
NOTE When editing is complete, the file must be saved in Notepad (select Save or Save As
under the File menu) for the changes to be effective. When Notepad is closed (File/
Exit), the newly edited file will be shown in the Start JOB dialog’s Show Contents
list box.
56
Page 67
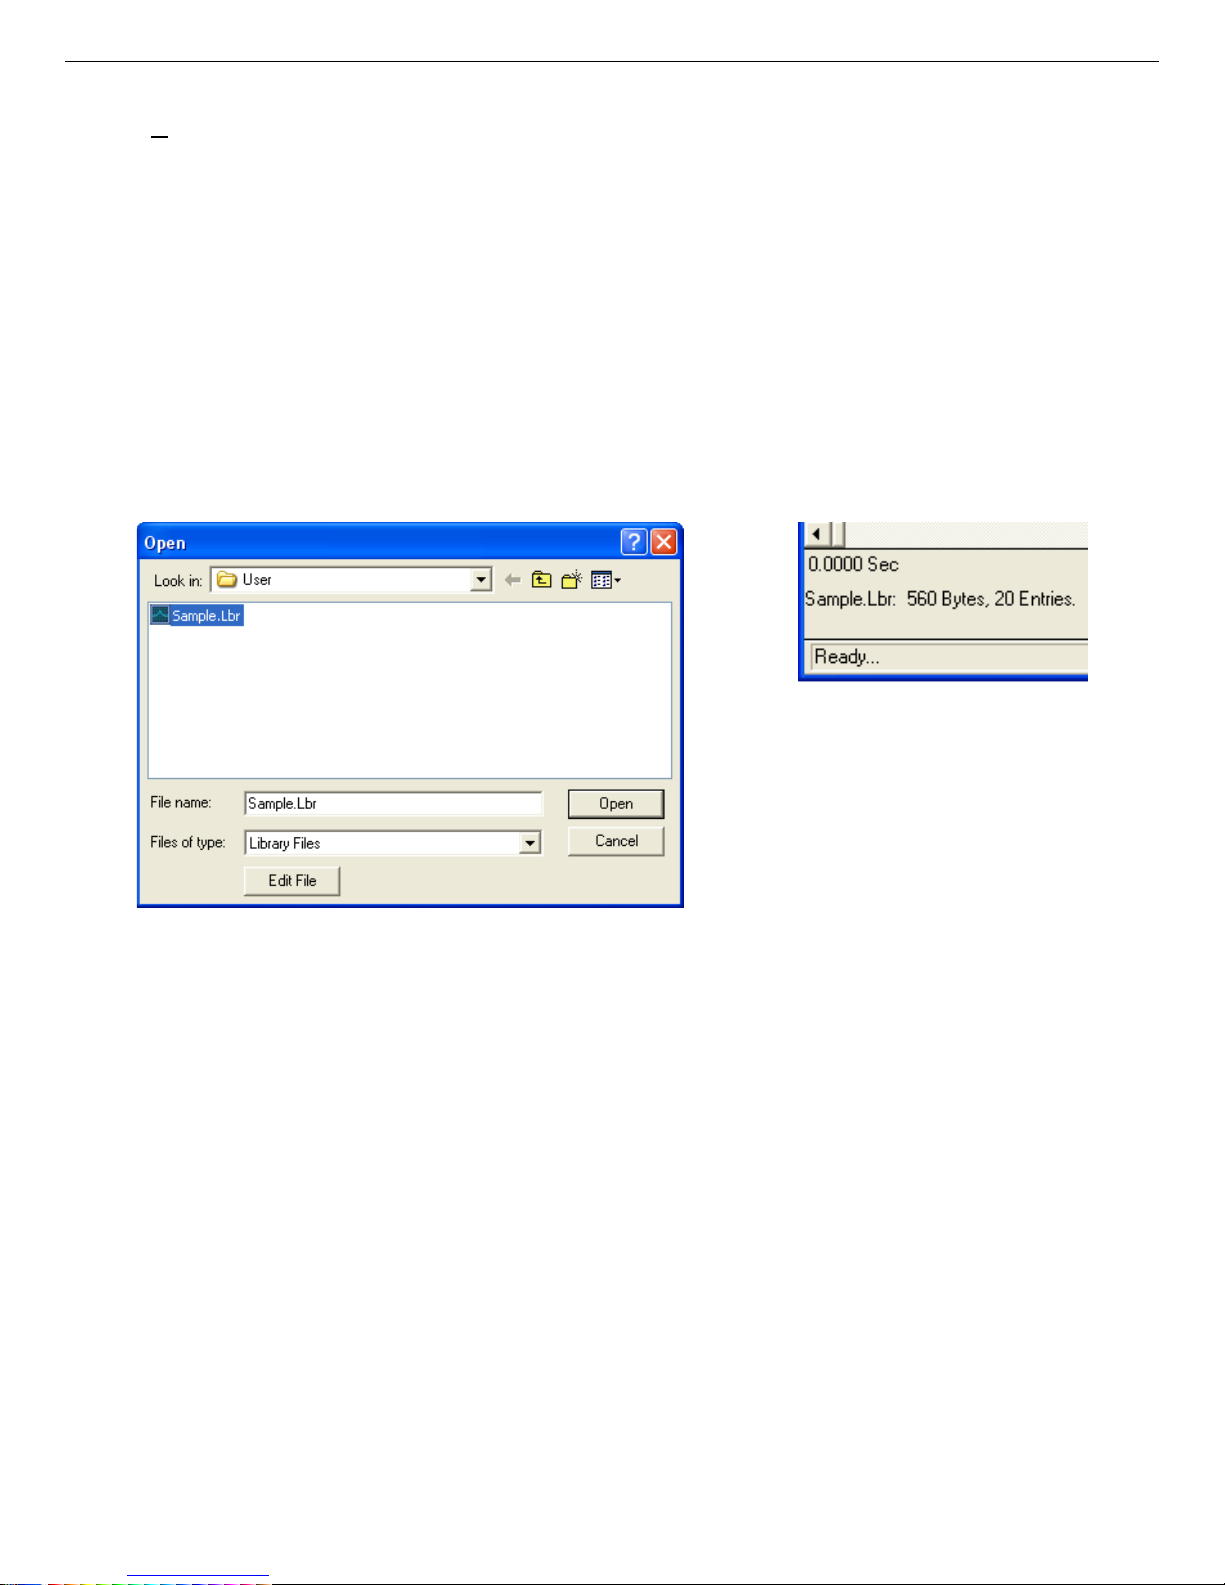
931054C / 1213 6. MENU COMMANDS
6.4.2. Library...
A library stays resident in memory after it has been loaded, and is used in such functions as
Calculate/Data Info and File/Report... for identifying spectral components according to cali-
brated peak channel value. Refer to Chapter 9 for information on creating custom libraries that
can be loaded with this comm and.
The Library... function opens the file-recall dialog shown in Fig. 47. The default library file
extension is
.LBR.
When the library file has loaded, MCS-32 displays a status message on the Supplemental
Information Line, as shown in Fig. 48.
Fig. 48. Status Message
Confirms Library File has
Loaded.
Fig. 47. Load a Library File.
To edit an existing library file, click a filename to highlight it, then click the Edit File button at
the bottom of the dialog. This will open Windows Notepad with the library file loaded (see the
example in Fig. 49). Remember to save the edited file before exiting Notepad, or the changes
will be lost.
57
Page 68
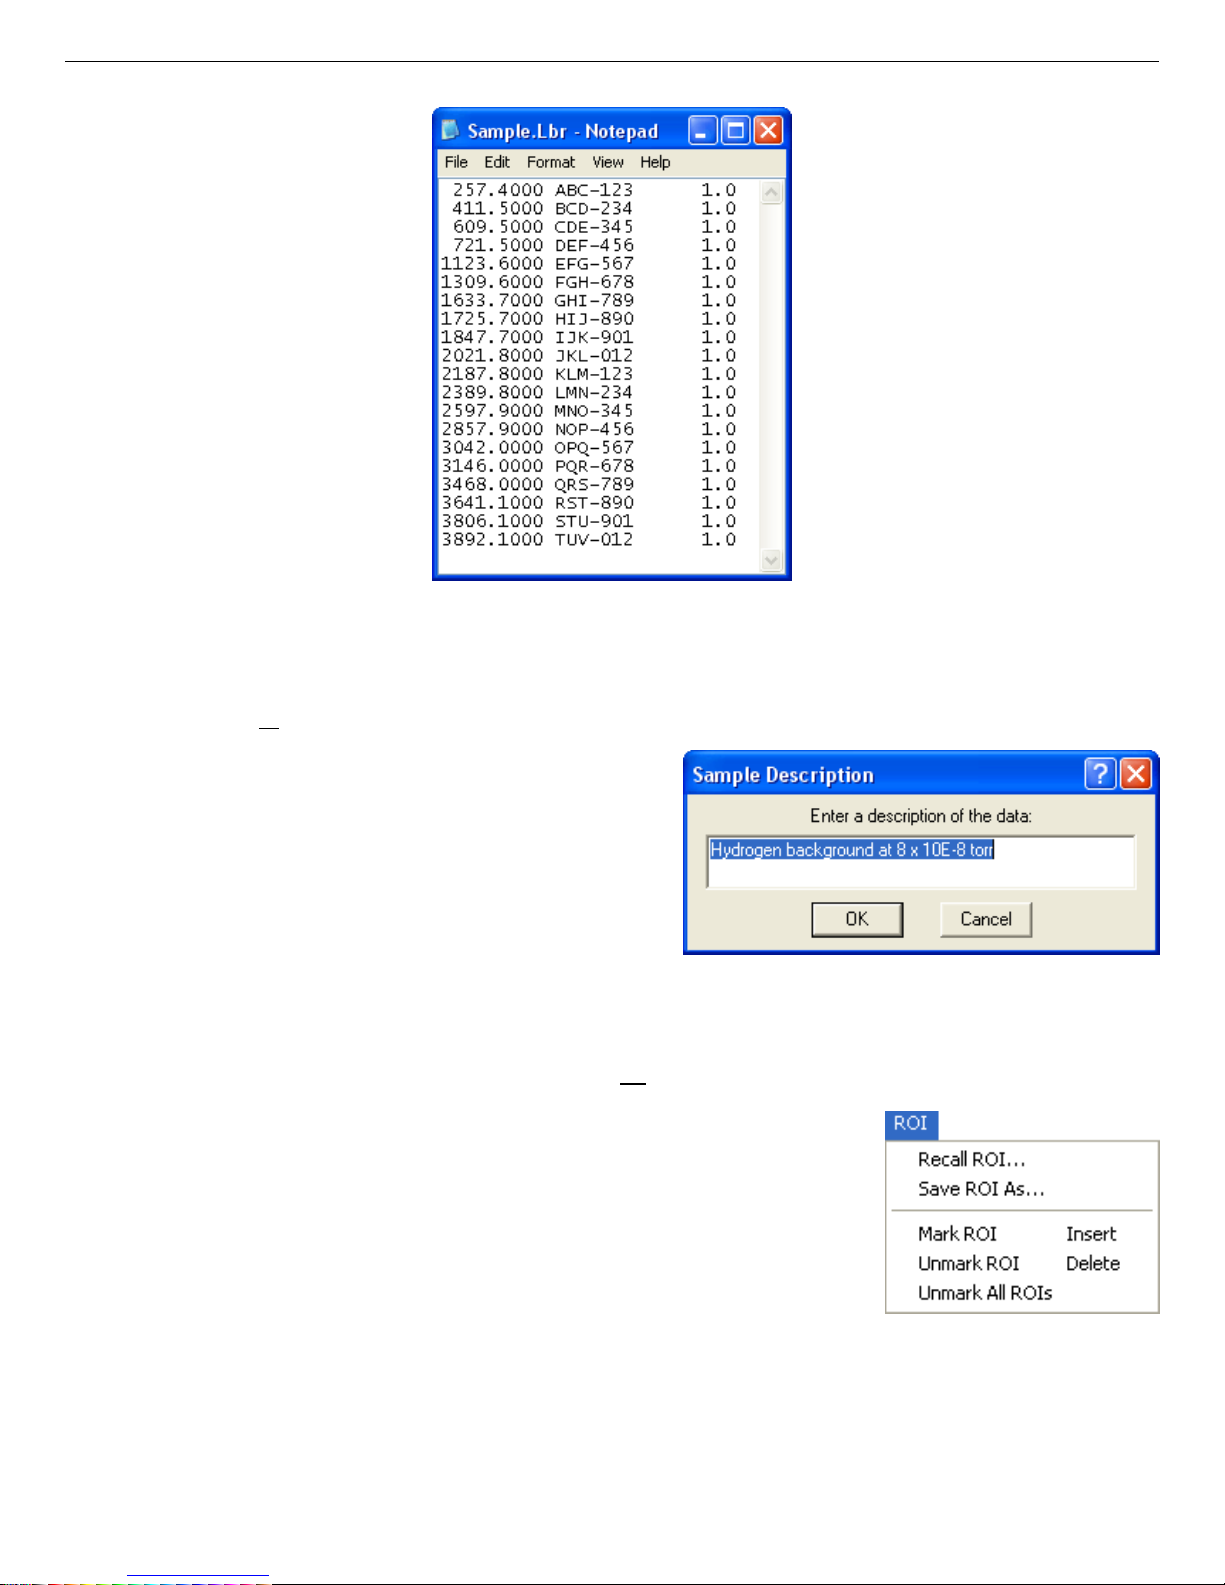
Easy-MCS ™ Multichannel Scaler and MCS-32 (A73-B32) Software 931054C / 1213
Fig. 49. Editing a Library File in
Windows Notepad.
6.4.3. Sample Description...
Use this command to read, edit, or enter a sample
description for the displayed spectrum (Fig. 50).
The description can be up to 128 characters in
length, and automatically accompanies the spectrum when it is subsequently copied or saved
to a file. The description also appears in the Title
Bar when the spectrum file is opened.
Fig. 50. Sample Description Entry.
6.5. ROI
A region of interest (ROI) is a way to denote channels or groups
of channels as having special meaning. Channels marked as ROI
channels are displayed graphically in a different color than the
unmarked channels. ROIs are only available in buffer mode, so
the ROI menu is gray (inactive) when MCS mode is selected.
ROIs are typically used to integrate the area under a spectrum
peak. The ROI menu is shown in Fig. 51.
Fig. 51. ROI Menu.
58
Page 69
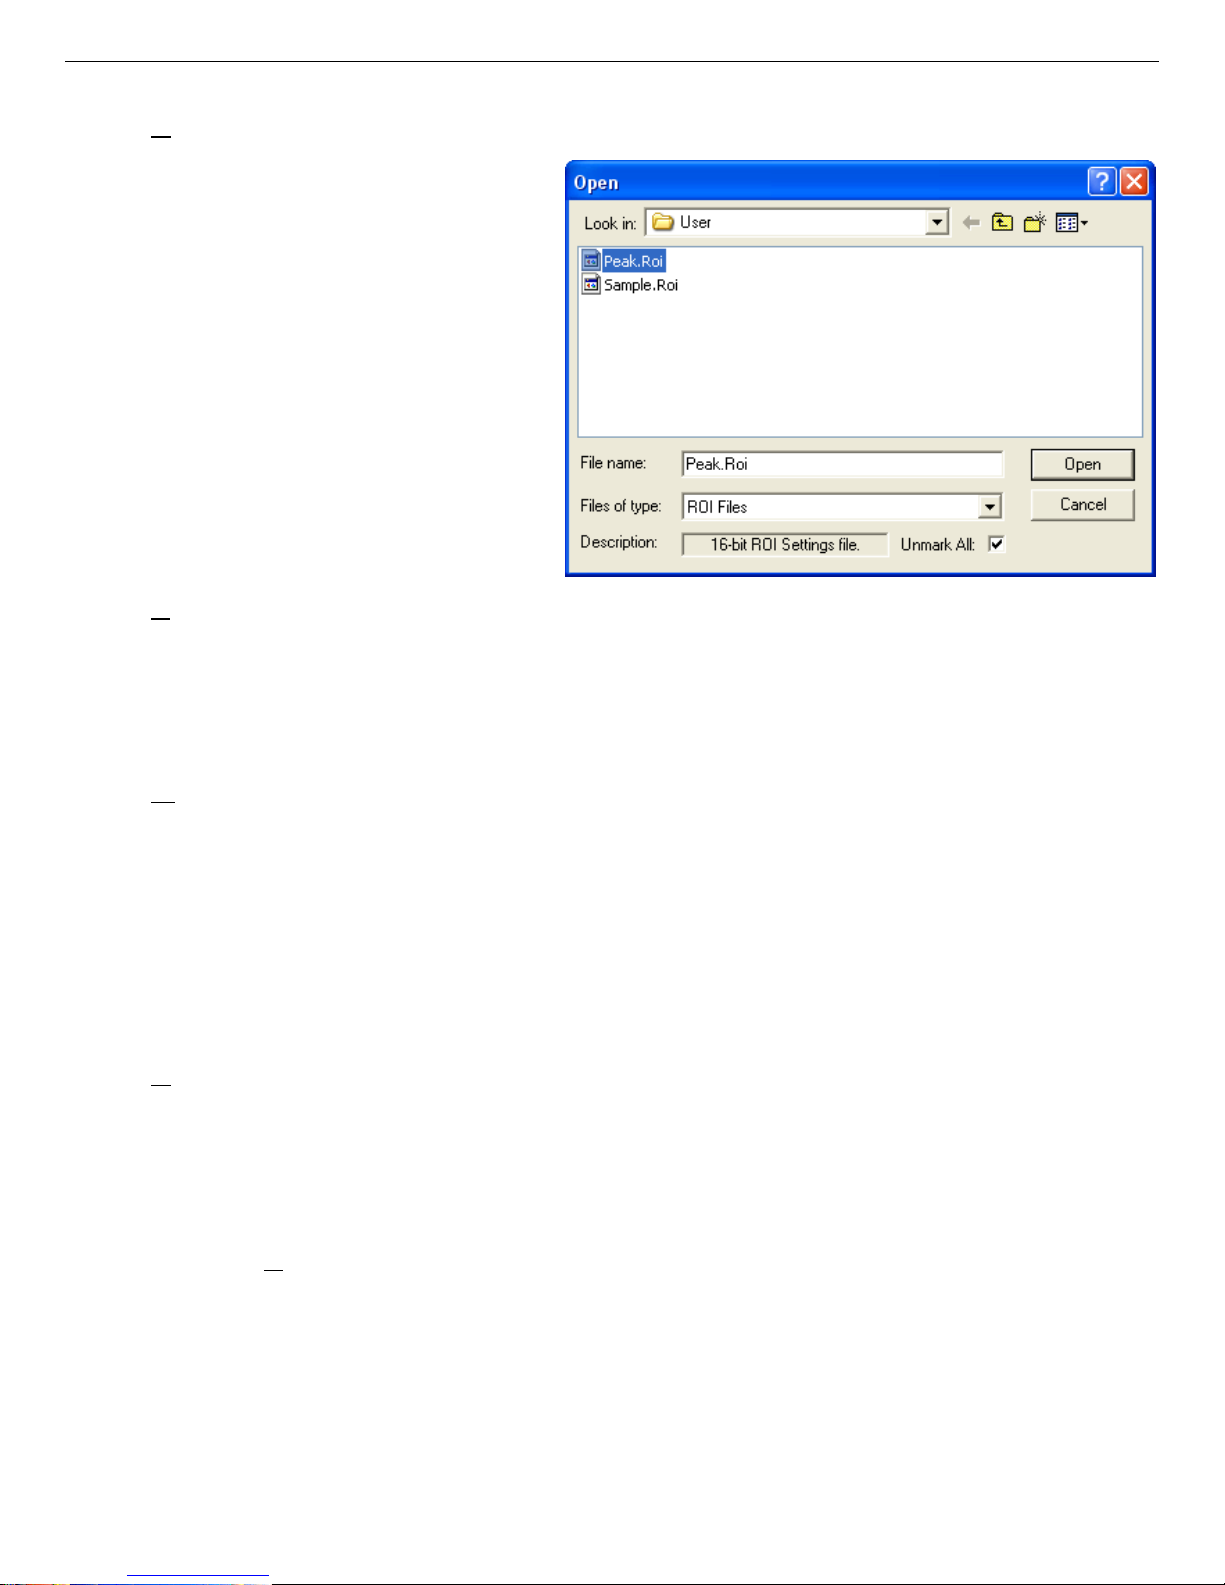
931054C / 1213 6. MENU COMMANDS
6.5.1. Recall ROI...
Recall ROI... opens the dialog shown
in Fig. 52. Select the desired file and
click on Open.
This comma nd sets the ROIs in the
buffer to conform to the table in the
file created by Save ROI As.... The
data contents of the buffer are not
changed by this operation, only the
ROI bits. If the Unmark All checkbox on the dialog is marked, the previous ROIs in the buffer are cleared.
6.5.2. S
ave ROI As...
Fig. 52. Load ROI Information from .ROI File.
This comma nd opens a standard filesave dialog so you can save the ROI information in the current spectrum. The contents of the
spectrum are not changed. The default and recommended file extension is
6.5.3. M
ark ROI
.ROI.
Mark ROI sets an ROI in the region currently selected by the marker. To select a region, click
and hold on one edge of the region, drag the mouse to the other edge of the region, and release
the left button.
This command is duplicated by the <Insert> and Keypad<Ins> keys, and by the Mark ROI
button on the Toolbar.
6.5.4. U
nmark ROI
Unmark ROI clears all ROIs in the region currently selected by the marker. This comm a nd is
duplicated by the <Delete> and Keypad<Del> keys, and by the Clear ROI button on the
Toolbar.
6.5.5. Unmark A
ll ROIs
Unmark All ROIs unmarks all the ROIs in the spectrum. The spectral data are not affected.
59
Page 70
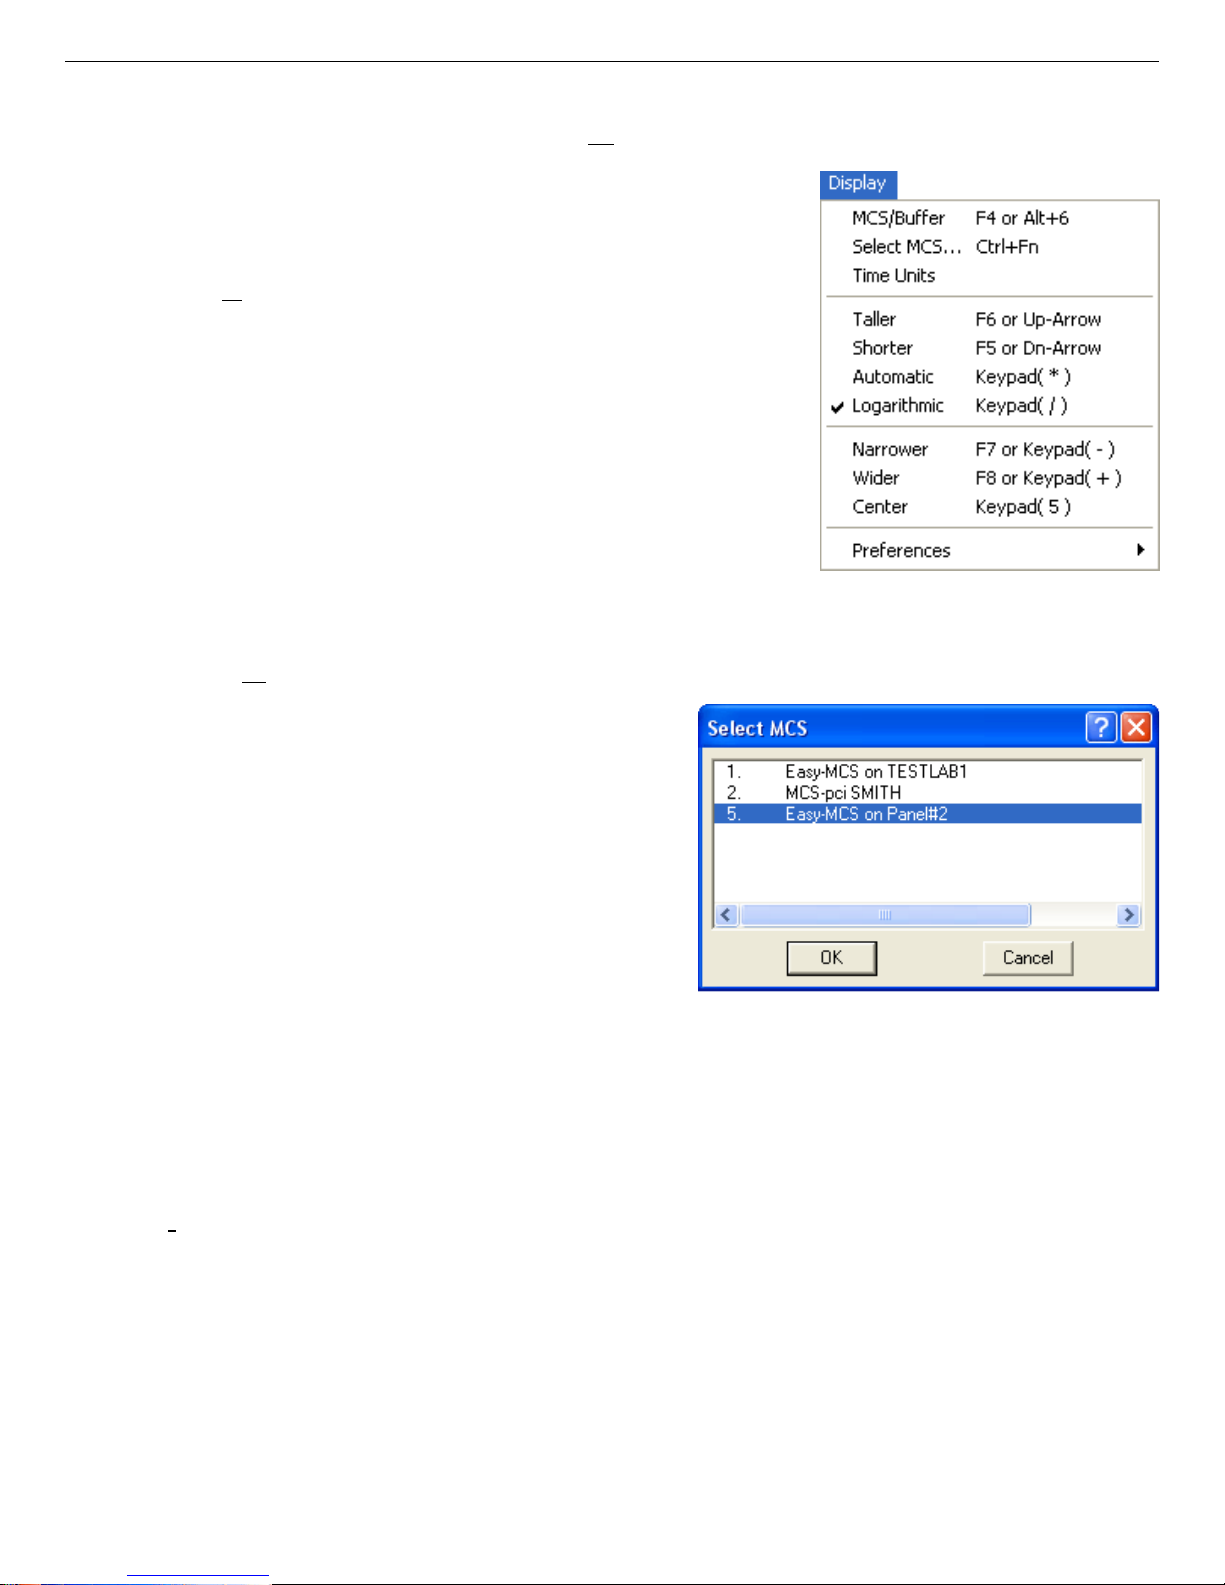
Easy-MCS ™ Multichannel Scaler and MCS-32 (A73-B32) Software 931054C / 1213
6.6. Display
Figure 53 shows the Display menu. These commands are
available in both buffer and MCS mode.
6.6.1. MCS/B
uffer
This function switches the source of the spectrum and
Status Sidebar display between the MCS and buffer. The
source of the displayed spectrum (MCS or buffer) is
shown by the radio buttons on the Sidebar. The sidebar
also shows the corresponding descriptors and presets.
The horizontal and vertical scales remain the same in
both views. This function is duplicated by the <Alt + 6>
and <F4> accelerators, and the MCS > Buffer button on
the Toolbar.
6.6.2. Select M
CS...
Use this dialog (Fig. 54) to select an MCS from
the current configuration for display. Click the
appropriate MCS, then click OK.
You can also select an MCS with <Ctrl + F1>
for MCS #1, <Ctrl + F2> for MCS #2, and so
on, through <Ctrl + F8>; or by clicking the
MCS # radio button on the Sidebar, then clicking the up/ down buttons beside it.
Fig. 53. Display Menu.
Fig. 54. MCS Pick List.
Note that although the instrument configuration program locates all ORTEC C
ONNECTIONS-
compatible instruments, the Select MCS dialog shows only Easy-MCS and legacy ORTEC MCS
instruments.
6.6.3. Ti
me Units
This comm a nd switches the expanded display between calibrated units and time units if the
dwell time is known (e.g., when running in internal dwell mode). For external dwell times, it
switches between calibrated units and channels. For example, in internal dwell mode, if the
dwell time is 1 second and the pass length is 100 channels, it will take 100 seconds for a single
sweep; each channel represents one second.
60
Page 71

931054C / 1213 6. MENU COMMANDS
If the spectrum is calibrated, switching off the time units shows the display in calibrated units.
If the spectrum is uncalibrated, switching off the tim e (internal dwell) or channel (external
dwell) units does nothing, since an uncalibrated spectrum is shown in time (internal dwell) or
channels (external dwell).
6.6.4. S
horter/Taller
Shorter and Taller switch the spectrum display to a linear vertical scale and, respectively ,
increase or decrease the full-scale value by a power of two. In either case, the current vertical
full-scale value is shown in the Vert field on the Sidebar. Shorter and Taller are duplicated by
the <F5>/<F6> and <9>/<8> keys.
6.6.5. A
utomatic
Automatic is used to switch the spectrum window from a logarithmic vertical scale to a linear
scale that is automatically adjusted until the largest peak shown is at its maximum height without
overflowing the display. It also toggles the vertical scale of the spectrum display between the
automatic and ma nual modes. This function is duplicated by Keypad<*> and the Auto button
on the Sidebar.
6.6.6. L
ogarithmic
Logarithmic toggles the vertical scale of the expanded display between the logarithmic and
linear modes. This function is duplicated by Keypad</> and the Log radio button on the
Sidebar. To switch out of automatic vertical scaling mode, click the Automatic, Taller, or
Shorter menu com mand, or the Auto button or Lin radio button on the sidebar.
6.6.7. N
arrower/Wider
Narrower and Wider increase and decrease the horizontal full scale of the Expanded Display
Window by a factor of two so that the peaks appear respectively narrower and wider. The
number of channels in the expanded display is shown in the Horz field on the Sidebar. These
functions are duplicated by the <F7>/<F8> and Keypad<!>/Keypad<+> keys, and the arrow
buttons beside the Horz field.
6.6.8. C
enter
This function forces the marker to the center of the screen by shifting the spectrum without
moving the marker from its current channel. This function is only required when moving the
marker with the m ouse. The keyboard functions for moving the marker automatically shift the
spectrum to center the marker when the marker travels past the end of the current expanded
display. Center is duplicated by Keypad<5>.
61
Page 72
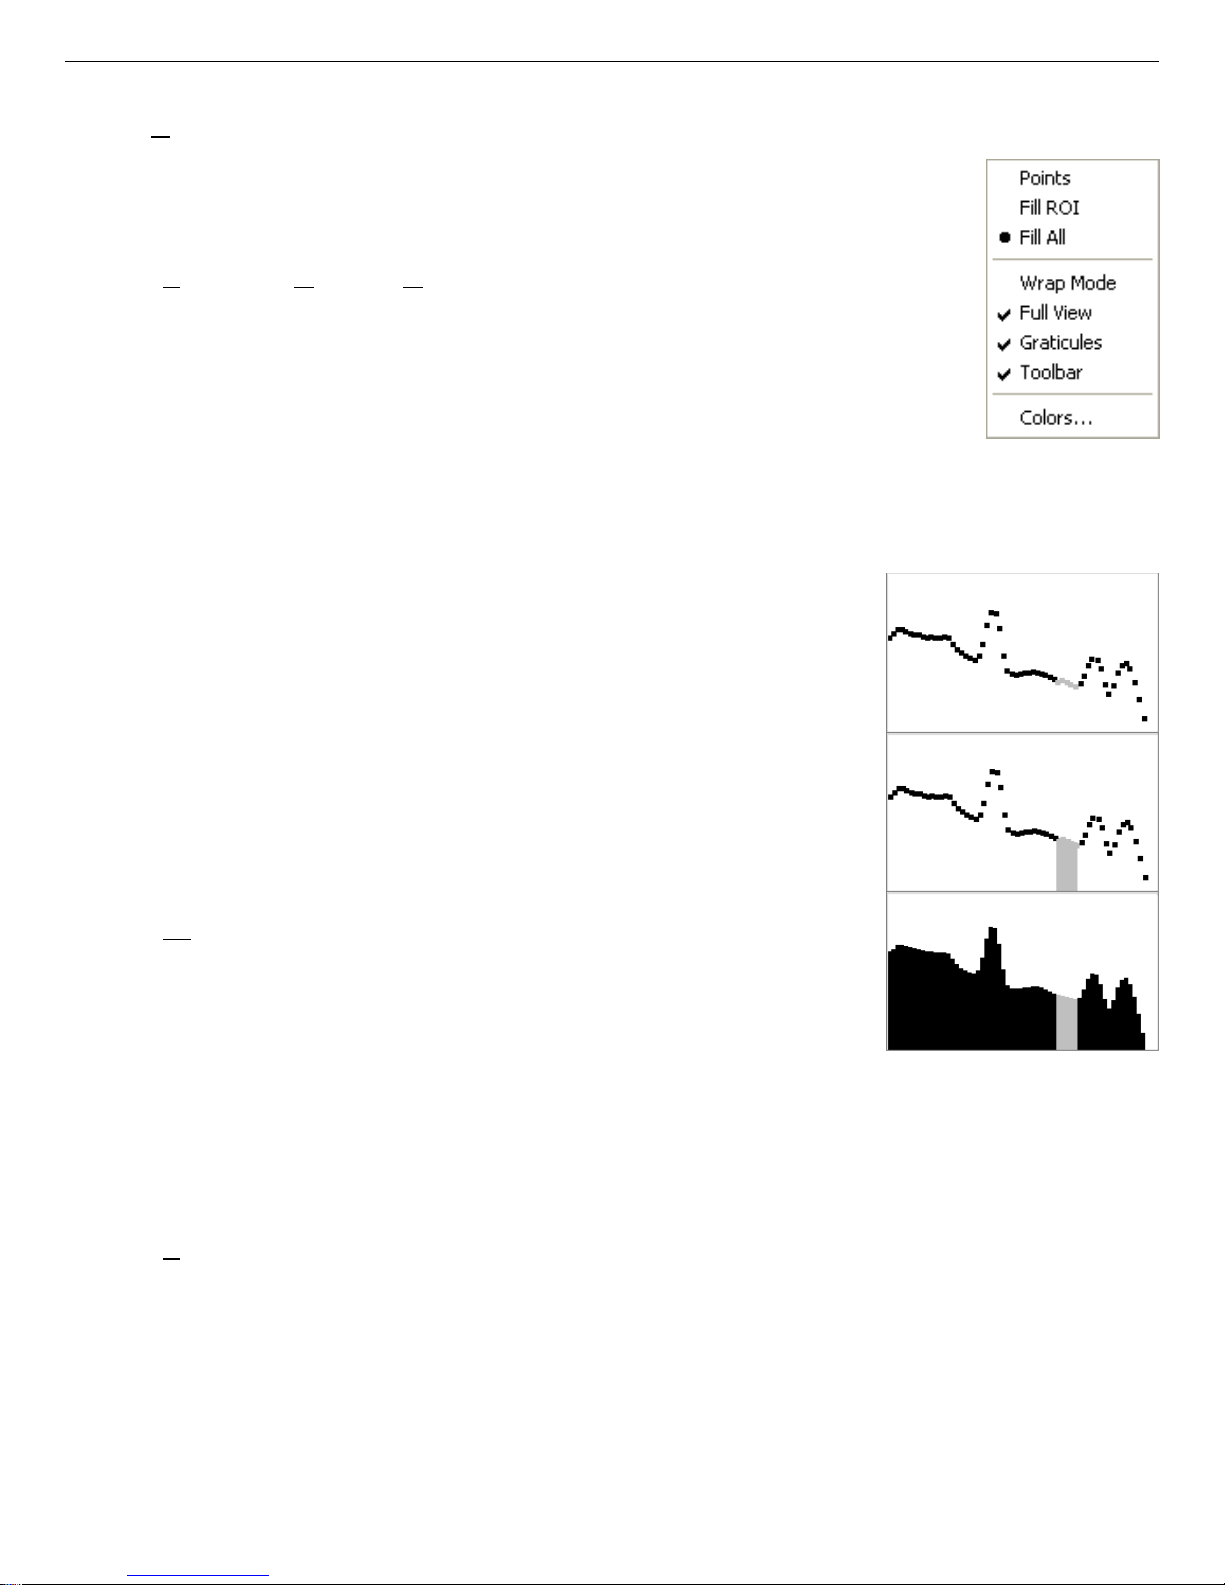
Easy-MCS ™ Multichannel Scaler and MCS-32 (A73-B32) Software 931054C / 1213
6.6.9. Preferences...
This displays the options available for selecting the screen colors
and spectrum display options. The submenu is shown in Fig. 55.
6.6.9.1. P
oints/Fill ROI/Fill All
Use these functions to select the histogram display mode for both
spectrum windows.
In Points mode, the data are displayed as points or pixels on the
screen, in the colors chosen for Foreground and ROI under
Display/Preferences/ Spectrum Colors... (see Section 6.6.9.6).
In Fill ROI mode, the unmarked regions of the spectrum are
displayed as points, while the ROIs are filled from the baseline
to the data point with the ROI spectrum color.
In Fill All mode, all the data points are filled from the baseline
to the data point with the Foreground and ROI spectrum colors.
Figure 56 shows a comparison of the three display modes. Note
that the point/pixel size in the Point- and Fill ROI-mode illustrations has been exaggerated to make them easier to see.
Fig. 55. Display
Preferences.
6.6.9.2. W
rap Mode
When Wrap Mode is selected, data that exceeds the vertical
scale are displayed as if the data value is the remainder when that
value is divided by the vertical scale. For example, if the channel
value is 1030 and the vertical scale is 1024, the data point is
displayed as if 6 is the data value. If Wrap Mode is not selected,
Fig. 56. Comparison of
the Points, Fill ROI, and
Fill All Display Modes.
data points which exceed the vertical scale are displayed at the
top of the screen.
6.6.9.3. F
ull View
This function displays or hides the Full Display Window. When the Full Display Window is off,
more of the Expanded Display Window is visible and the screen updates more quickly . However, the ability to rapidly move from one part of the spectrum to another w ithout increasing the
number of channels in the horizontal scale (using Narrower) is lost.
62
Page 73
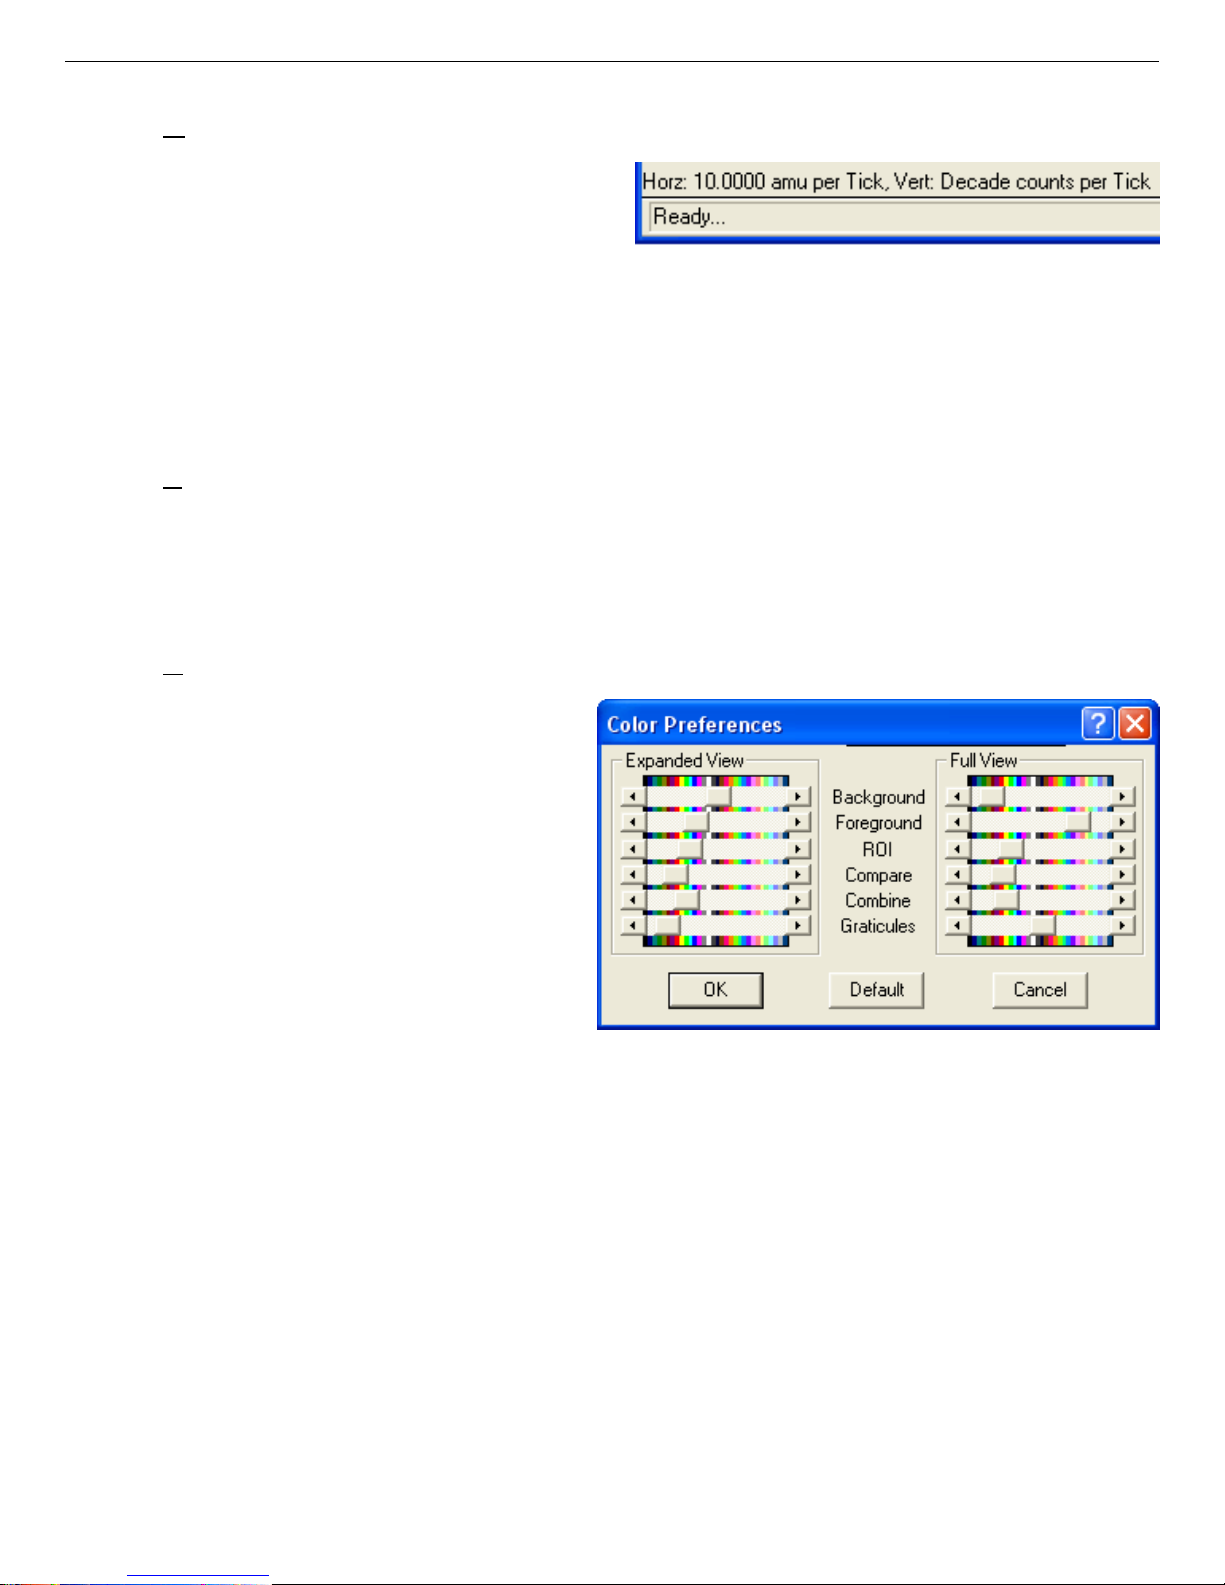
931054C / 1213 6. MENU COMMANDS
6.6.9.4. Graticules
This comm and displays or hides the grid
marks for the Expanded Display Window.
When the graticules are displayed, a checkmark appears beside the menu item. This
Fig. 57. Graticule Spacing Information.
command is duplicated by the Graticules
button on the Toolbar. While the graticules are displayed, their spacing is defined at the bottom
of the screen as “spacing per tick” (see Fig. 57). The spacing units can be counts on the vertical
scale; and time, channels, or calibrated units on the horizontal scale.
6.6.9.5. T
oolbar
This displays and hides the Toolbar. W hen the Toolbar is hidden, the spectrum windows are
larger, but the controls the bar provides are not available (except for those duplicated on the
menus and Sidebar).
6.6.9.6. C
olors...
Use this dialog (see Fig. 58) to select
colors for various features in the two
spectrum windows. Each scroll bar
controls the color of a different feature.
The vertical colored stripes behind the
scroll bars show the available colors.
The Background scroll bar controls
the background color of the spectrum
window, Foreground determines the
color of the spectrum points or fill,
Fig. 58. Display Color Selections.
ROI governs the color of the ROI
points or fill. The points/fill of a compared spectrum (File/Compare...) use the Compare color,
unless they overlap with the original spectrum, in which case the Combine color is used. The
grid that can be superimposed on the expanded display uses the Graticules color.
! To change a color, click the scroll bar button and drag it slowly across the different
colors. The expanded and full displays will change color in real time as you drag the
mouse. When the desired color is displayed on the screen, release the mouse button.
! To accept the color changes, click OK, then answer Yes to the pop-up dialog.
63
Page 74

Easy-MCS ™ Multichannel Scaler and MCS-32 (A73-B32) Software 931054C / 1213
! To cancel a color change, return the slider button to its starting color, or close the Color
Preferences palette by clicking Cancel or pressing <Esc>.
! To reset the color values to the original MCS-32 colors, click Default.
NOTE The colors on this palette affect only the Expanded and Full Display Windows. The
colors of the remaining features on the screen must be changed using the Windows
Control Panel (which will also, of course, affect the appearance of all other Windows
applications on this computer).
64
Page 75

7. KEYBOARD FUNCTIONS
This chapter describes the MCS-32 accelerator keys. The keys described in this section are
grouped primarily according to location on the keyboard and secondarily by related function.
7.1. Introduction
Table 1 provides a quick reference to all of the MCS-32 keyboard and keypad functions. T hese
accelerators are also illustrated in Fig. 59, and discussed in more detail in the remainder of the
chapter.
The accelerators are available only in the MCS-32 window. The Title Bar must be highlighted
with the active title bar color (as set up in Windows Control Panel). In addition, the active cursor
— or input focus — must be in the spectrum window. Similar to other Windows applications,
the input focus can be switched between MCS-32 and other applications by clicking the
Windows Taskbar, pressing <Alt + Tab>, or, if the inactive window is visible, pointing with the
mouse at some spot in the inactive window and clicking.
The multi-key functions, such as <Alt + 1> or <Shift + 6>, are executed by holding down the
first key (e.g., <Alt>, <Shift>, or <Ctrl>) while pressing the key that follows the “+” sign in the
brackets, then releasing both keys simultaneously. Functions that use the keypad keys begin w ith
the word Keypad, e.g., Keypad<5>.
As usual for any Windows application, the menus are accessed by clicking them with the mouse,
or by using the Alt key plus the key that matches the underlined
For example, the multi-key combination to activate the F
Note that the MCS-32 accelerator keys do not interfere with Windows m e nu operations or task
switching. For example, when a menu is active (i.e., pulled down), the <7>/<6> and <8>/<9>
keys revert to their normal Windows functions of moving across the me nu bar and scrolling
up/down within a menu, respectively. As soon as the menu is closed, they behave as MCS-32
accelerators again.
ile menu is <Alt + F>.
letter in the menu item name.
7.2. Marker and Display Function Keys
7.2.1. Next/Previous Channel <6>/<7>
The right and left arrow keys move the marker by one displayed pixel in the corresponding
direction. This may represent a jump of more than one spectral data memory channel, especially
if the horizontal scale in channels is larger than the width in pixels of the window (see the
discussion in Section 5.2).
65
Page 76

Easy-MCS ™ Multichannel Scaler and MCS-32 (A73-B32) Software 931054C / 1213
Table 1. Quick Reference to MCS-32 Keyboard Commands.
Key F unction
<9> or <F5>
<8> or <F6>
<6>
<7>
<Ctrl + 6>
<Ctrl + 7>
<Shift + 6>
<Shift + 7>
<Alt + 6>
<Alt + 7>
<PageUp>
Increase the vertical scale so peaks appear smaller.
Decrease the vertical scale so peaks appear larger.
Move marker to higher channel.
Move marker to lower channel.
Jump to next higher ROI.
Jump to next lower ROI.
Highlight channels to the right.
Highlight channels to the left.
Jump to next library entry.
Jump to previous library entry.
Jump to higher channel number in 1/64th-screen-width
increments.
<PageDown>
Jump to lower channel number in 1/64th-screen-width
increments.
<Home>
<End>
<Ctrl + Fi>
<F4> or <Alt + 6>
<F5> or <9>
<F6> or <8>
<F7> or Keypad<!>
<F8> or Keypad<+>
Keypad<!> or <F7>
Keypad<+> or <F8>
Keypad<5>
Keypad</>
Keypad<*>
Insert or <Ins>
Delete or <Del>
Jump to first channel of the full display.
Jump to last channel of the full display.
Select MCS i (i = 1 to 12, in pick list order).
Switch between displaying selected MCS an d bu f f e r .
Increase the vertical scale so that peaks appear smaller.
Decrease the vertical scale so that peaks appear larger.
Increase the horizontal scale so peaks appear narrower.
Decrease the horizontal scale so peaks appear wider.
Increase the horizontal scale so peaks appear narrower.
Decrease the horizontal scale so peaks appear wider.
Center Expanded Display Window on cursor.
Switch to logarithmic vertical scale.
Switch to auto vertical scale.
Mark the highlighted area as an ROI.
Clear the ROI.
<Shift + 8> Shift the Compare spectrum upwards.
<Shift + 9> Shift the Compare spectrum downwards.
<Alt + 1>
<Alt + 2>
<Alt + 3>
<Alt + 5>
<Alt + 6> or <F4>
<PrintScreen>
Start acquisition in selected MCS.
Stop acquisition in selected MCS.
Clear data and descriptors for the selected MCS.
Copy data in the selected MCS to the buffer.
Switch between displaying selected MCS and buffer.
Capture screen to Windows Clipboard.
66
Page 77
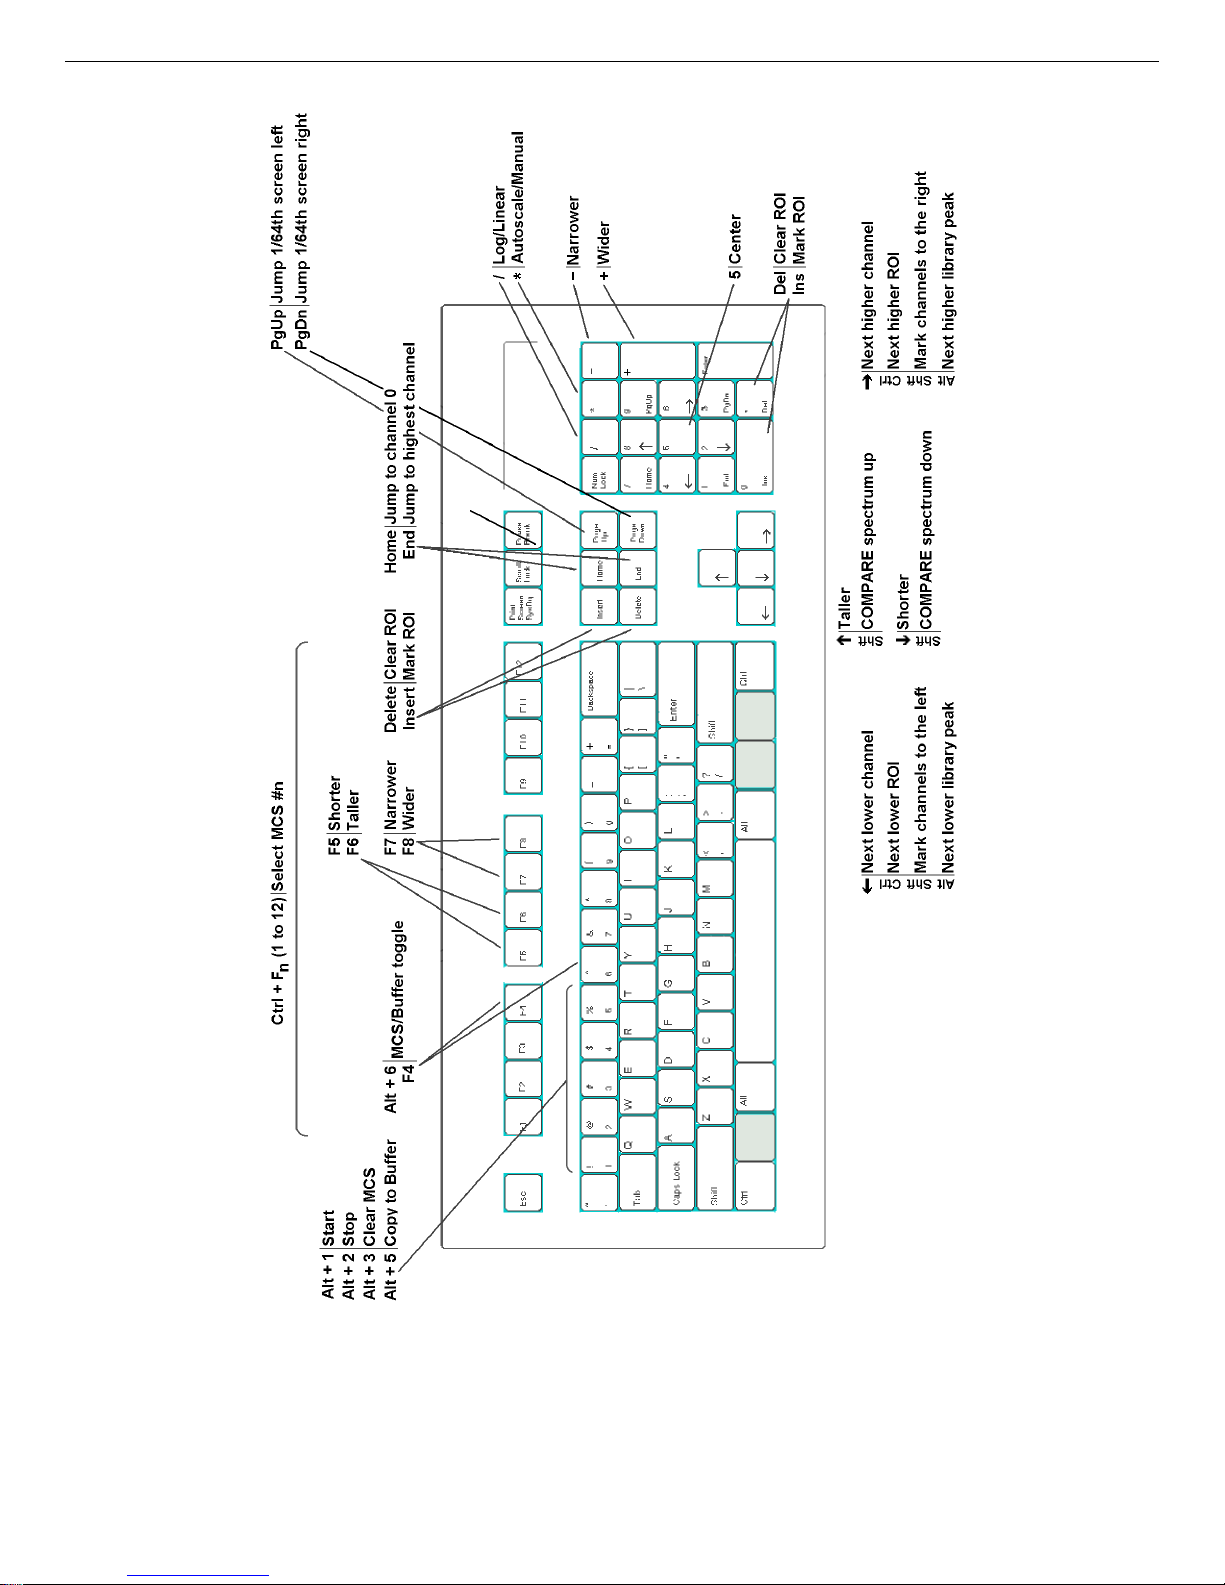
931054C / 1213 7. KEYBOARD FUNCTIONS
Fig. 59. MCS-32 Keyboard and Keypad Accelerators.
67
Page 78

Easy-MCS ™ Multichannel Scaler and MCS-32 (A73-B32) Software 931054C / 1213
If the horizontal scale is expanded, when the marker reaches the edge of the spectrum window,
the next key press past the edge shifts the window to the next block of channels in that direction
such that the marker is now in the center of the display.
7.2.2. Next/Previous ROI <Ctrl + 6>/<Ctrl + 7>
The <Ctrl + 6> and <Ctrl + 7> move the m a rker to the beginning of the next higher channel
ROI, and the end of the preceding ROI, respectively, of the displayed spectrum. These functions
are duplicated by the Find Previous ROI and Find Next ROI buttons on the Toolbar.
7.2.3. Highlight Channels Left/ Right <Shift + 6>/<Shift + 7>
The <Shift + 6> and <Shift + 7> keys allow you to highlight a block of channels from the current marker position to the left or right, respectively. This is the keyboard equivalent of highlighting a block of channels by clicking and dragging with the mouse. You can then perform
such operations as marking the highlighted region as an ROI and calculating the centroid of the
region.
7.2.4. Next/Previous Library Entry <Alt + 6>/<Alt + 7>
These keys move forward or backward through the peak-identification library to the next closest
library entry. Each button press advances to the next library entry and moves the marker to the
corresponding energy. Also, instead of indexing from a previously identified peak, the marker
can be positioned anywhere in the spectrum and these keys used to locate the entries closest to
that point. If a warning beep sounds, it means that all library entries have been exhausted in that
direction, or that the spectrum is not properly calibrated for reaching further entries with the
marker. In any case, if an appropriate peak is available at the location of the marker, data on the
peak are displayed on the Marker Information Line. These functions are duplicated by the
Library indexing buttons on the Sidebar.
7.2.5. First/Last Channel <Home>/<End>
These keys move the m a rker to the first or last channel of the spectrum.
7.2.6. Jump 1/64 Screen Width <PageDown>/<PageUp>
<PageDown> and <PageUp> jump the marker position to the left (to lower channel num bers) or
right (to higher channel numbers), respectively, 1/64 of the window width, regardless of the
horizontal scale. The status of the ROI bit is not altered when the marker is moved with these
keys, that is, the ma rk/unmark state is ignored. The marker channel contents and Marker Information Line are continuously updated as the marker jumps, so when the jump is complete, the
marker information is up-to-date for the current channel.
68
Page 79

931054C / 1213 7. KEYBOARD FUNCTIONS
7.2.7. Insert ROI <Insert> or Keypad<Ins>
These keys mark a selected set of spectrum channels as an ROI. To select the channels to be
marked, highlight the region by clicking and dragging the mouse from one edge of the region to
the other edge. These accelerators duplicate the function of the Mark ROI Toolbar button and
the ROI/Mark ROI command (see Section 6.5.3).
7.2.8. Unmark ROI <Delete> or Keypad<Del>
<Delete> and Keypad<Del> clear the ROI bits of all ROI channels contiguous to the channel
containing the marker. These accelerators duplicate the function of the Clear ROI button on the
Toolbar and the ROI/Unmark ROI comm a nd (see Section 6.5.4).
7.2.9. Taller/Shorter <8>/<9>
The <8> and <9> keys decrease or increase the vertical full scale of the displayed spectrum so
the peaks appear taller or shorter, respectively. The minimum is 16 counts-full-scale; the maximum is 1024 million counts. Each successive key press doubles or halves the full scale until the
maximum or minimum is reached. Whenever the maximum full-scale value is reached, the next
<8> key press switches to logarithmic scale. If the display is already in logarithmic scale, the
display switches to linear scale. In either case, the vertical full-scale value is always shown on
the Sidebar. Note that if the number of counts exceeds the full-scale value, the data points will
be displayed at the full-scale value unless Wrap Mode has been selected (see Section 6.6.9.2).
These keys duplicate the <F6>/<F5> keys.
7.2.10. Shift Compare Spectrum <Shift+8>/<Shift+9>
In Compare mode, the <Shift + 8> or <Shift + 9> keys decrease or increase the vertical separation between the two spectra. Each successive key press increases or decreases the separation by
moving the spectrum read from disk. The spectrum from disk can be moved below the first
spectrum if it has fewer counts.
7.2.11. Wider/Narr ower Keypad<+>/<!>
Keypad<+> decreases the horizontal scale of the Expanded Display Window so the peaks
appear wider, while
Keypad<!> increases the horizontal scale, making the peaks look narrower.
The horizontal and vertical scale values are displayed on the Sidebar. These functions are
duplicated by <F7>/<F8>.
7.2.12. Screen Capture <PrintScreen>
The <PrintScreen> key captures the entire monitor display to the Windows Clipboard, where it
is available for use in other applications such as word processors, Windows Paint, etc.
69
Page 80

Easy-MCS ™ Multichannel Scaler and MCS-32 (A73-B32) Software 931054C / 1213
A typical usage would be to set up the display as desired for the snapshot (you may wish to use
Display/Preferences/Spectrum Colors... to select black or white for all areas rather than colors,
since they produce clearer printouts), then press <PrintScreen>. Start the desired graphics or
word processing application. Copy the image from the Clipboard with <Ctrl + V> or Edit/Paste
(refer to the documentation for the graphics or word processing program). See the accom panying
FullShot manual for other screen-capture and screen-printing methods.
7.3. Keyboard Number Combinations
NOTE Only the keyboard numbers will function in the following combinations. The keypad
number keys will not perform these functions.
7.3.1. Start <Alt + 1>
<Alt + 1> starts the acquisition in the selected MCS. Any presets desired must be entered before
starting acquisition. This accelerator duplicates the Start Toolbar button, the Start command on
the right-mouse-button menu, and Acquire/Start, discussed in Section 6.2.1.
7.3.2. Stop <Alt + 2>
<Alt + 2> stops acquisition in the selected MCS. This duplicates the Stop Toolbar button, the
Stop comma nd on the right-mouse-button menu, and Acquire/Stop, discussed in Section 6.2.2.
Acquisition stops at the end of the current pass. To stop before the end of the pass, issue the
Stop command twice.
7.3.3. Clear <Alt + 3>
<Alt + 3> clears the displayed instrument’s histogram data and its descriptors (real time, live
time, etc.). This accelerator duplicates the Clear Spectrum Toolbar button, the Clear command
on the right-mouse-button menu, and Acquire/Clear, discussed in Section 6.2.3. Stop
acquisition before executing the Clear command.
7.3.4. MCS > Buffer <Alt + 5>
<Alt + 5> copies the histogram data from the selected MCS to the buffer, along with its descriptors (e.g., live time, real time), and displays the spectrum in a new window. This duplicates the
MCS > Buffer Toolbar button and Acquire/MCS > Buffer, discussed in Section 6.2.4.
7.3.5. MCS/Buffer <Alt + 6>
<Alt + 6> switches the display between the histogram of the spectrum in the selected MCS and
the spectrum in the buffer. The buffer will have the mem ory size of the spectrum that was last
transferred from MCS or disk file. The Sidebar indicates whether the buffer or a particular MCS
70
Page 81

931054C / 1213 7. KEYBOARD FUNCTIONS
is currently displayed, and shows the presets for the displayed data. This duplicates <F4> and
Display/MCS/Buffer; see Section 4.6.2.
7.4. Function Keys
7.4.1. MCS/Buffer <F4>
The <F4> key switches between the display of the data in the MCS and the data in the buffer. It
duplicates the function of <Alt + 6> and Display/MCS/Buffer; see Section 7.3.5.
7.4.2. Taller/Shorter <F5>/<F6>
These keys decrease or increase the vertical full scale of the displayed spectrum so the peaks
appear taller or shorter, respectively. They duplicate the function of the <8> and <9> keys. The
vertical scale value is always shown on the Sidebar.
7.4.3. Narrower/Wider <F7>/<F8>
F7 increases the horizontal scale of the Expanded Display Window so the peaks appear narrower, while F8 decreases the horizontal scale, making the peaks look wider. The horizontal and
vertical scale values are displayed on the Sidebar. These functions are duplicated by
<F7>/<F8>.
7.4.4. Select MCS <Ctrl + F1> through <Ctrl + F8>
These keys open a new window and display the spectrum for the specified MCS n (where n = 1
to 8, corresponding to <Ctrl + Fn>, in the order that the instruments are defined in the MCS
pick list). The selected instrument name (or the buffer) is shown on the Sidebar.
These keys duplicate the function of the MCS pick list on the Sidebar, and the Select MCS...
command under the Display menu. However, be aw are of which instrument numbers are available when using the function keys. An error message will appear if the selected instrument is
invalid. In systems w ith more than eight instruments, use Display/Select MCS... or the MCS
pick list on the Sidebar.
71
Page 82

Easy-MCS ™ Multichannel Scaler and MCS-32 (A73-B32) Software 931054C / 1213
7.5. Keypad Keys
7.5.1. Log/Linear Keypad</>
Keypad</> toggles the active spectrum window between logarithmic and linear vertical display.
This is duplicated by the Log and Lin radio buttons on the Sidebar. The vertical scale can also
be controlled with the Taller/Shorter commands, Keypad<+>/<!>, the <8> and <9> keys, and
<F7/F8>.
7.5.2. Auto/Manual Keypad<*>
Keypad<*> switches the spectrum window between automatic and manual vertical full scale
(see the discussion in Section 6.6.5). This is duplicated by the Auto button on the Sidebar, and
Display/Automatic.
7.5.3. Center Keypad<5>
Keypad<5> forces the marker to the center of the screen by shifting the spectrum without
moving the marker from its current channel. This is duplicated by Display/Center. For more
information, see Section 6.6.8.
7.5.4. Wider/Narr ower Keypad<+>/<!>
Keypad<+> decreases the horizontal scale of the Expanded Display Window so the peaks
appear wider, while Keypad<!> increases the horizontal scale, making the peaks look narrower.
The horizontal and vertical scale values are displayed on the Sidebar. These functions are
duplicated by <F7>/<F8>.
72
Page 83

8. JOB FILES
An MCS-32 .JOB file consists of one or more lines of ASCII text representing a series of commands that can automate most of the functions described earlier in this manual. This chapter
gives the details of the commands including required syntax. A
the Services/Start JOB... dialog, or by including the name of the
when MCS-32 is first started (e.g.,
.JOB files are used for the following types of functions:
MCS32 -JDEMO.JOB).
1) Performing a repetitive task, such as running a sequence of experiments without user
intervention.
2) Defining initial conditions at startup (this is useful for preloading presets for a specific
experiment, although a settings [
.SET] file can serve the same function; see Section 6.1.7).
MCS-32 can run repetitive loops. Furthermore, the current loop count can be included as a variable in any string, including filenames, program parameters, and text. Data can thus be stored
with unique filenames and labeled with unique descriptions.
.JOB file can be executed with
.JOB file on the command line
If an error occurs in running a
.JOB file, file execution stops and control returns to MCS-32. An
error code appears in the Start JOB... dialog, as described in Section 6.4.1.
8.1. JOB Programming Example
A common operation that is ideal for a .JOB file is the collection of many consecutive sample
spectra without user intervention. This process can be described as follows:
1) Set the MCS parameters, such as dwell time
2) Start the acquisition
3) Wait for acquisition to stop
4) Integrate a spectrum peak
5) Record the peak area
6) Repeat this for the required number of samples
By looking at the list of steps above and the explanations below, the necessary commands can be
determined.
The first step in the process is to set the MCS parameters and clear the data:
SET_MCS 1
SET_DWELL_TIME 1e-6
SET_PASS_LENGTH 7500
73
Page 84

Easy-MCS ™ Multichannel Scaler and MCS-32 (A73-B32) Software 931054C / 1213
SET_PRESET_PASS 1000
CLEAR
Note that only the Dwell Time, Pass Length, and Pass Preset were set. We will assume that the
other parameters (Disc Voltage, Acq Mode, etc.) were set before the JOB was started. Now start
the acquisition and wait for completion of the pass preset.
START
WAIT
During this time, the display-manipulation keys and mouse are active so the spectrum can be
studied while data collection takes place.
Now move the spectrum from the MCS to the buffer, and select the buffer for the computational
step.
FILL_BUFFER
SET_MCS 0
In the next step, the peak of interest is being marked by reading in an .ROI file. This .ROI file
has been previously defined by looking at the spectrum and marking the peak (or the region
around the peak). These ROI data are saved on the disk under the name
PEAK.ROI. This .JOB
file will work on different peaks just by changing the ROI file.
RECALL_ROI “PEAK.ROI”
The peak areas of the marked peak or peaks is printed on the printer by this command.
REPORT “PRN”
This gives a list of the peak areas for the marked peak. If the library (LIB.MCS) has a peak near
this peak, the peak identity will also be printed.
The set of instructions, as written so far, will only collect data and report once. There are two
ways to make the process repeat itself for a series of samples. T he first and hardest is to write
one set of the above instructions for every sample in the series. A much more efficient way is to
use the LOOP command. To use this, put LOO P before CLEAR and END_LO OP after
REPORT. The whole
.JOB file now looks like this:
SET_MCS 1
SET_DWELL_TIME 1e-6
SET_PASS_LENGTH 7500
74
Page 85

931054C / 1213 8. JOB FILES
SET_PRESET_PASS 1000
LOOP 10
CLEAR
START
WAIT
FILL_BUFFER
SET_MCS 0
RECALL_ROI “PEAK.ROI”
REPORT “PRN”
SET_MCS 1
END_LOOP
Note that an additional SET_MCS 1 has been inserted after REPORT, so the loop will operate
on the desired MCS.
This file is included on the MCS-32 CD-ROM under the name
lation was performed, this file will be located in
c:\User.
Now select Services/Job Control. Click once on an existing
SAMPLE.JOB. If a typical instal-
.JOB filename then click the Edit
File button. This will display the contents of that file in Windows Notepad. You could overwrite
the existing instructions with the above set of comm ands by saving the above commands to the
.JOB filename you just selected in the dialog. Instead, though, save these new instructions to a
new file named
SAMPDATA.JOB using the File/Save As function (do not use Save or the
original file will be lost).
This new
Control... to display the Run JOB File dialog. Select
.JOB file can then be executed in MCS-32 from the Services menu by selecting Job
SAMPDATA.JOB from the list of files and
click Open.
8.1.1. Improving the JOB
.JOB file can be improved by adding a save step for each spectrum collected. This is done
This
by inserting the SAVE command in the
.JOB file. The spectrum sample description is also
entered here. This sample description is saved with the spectrum and is printed by the REPORT
command. Note that the loop counter (the ??? in the
.JOB file text) is used in the SAVE and
DESCRIBE_SAMPLE commands.
The new
SAMPDATA.JOB file is:
SET_MCS 1
SET_DWELL_TIME 1e-6
SET_PASS_LENGTH 7500
SET_PRESET_PASS 1000
75
Page 86

Easy-MCS ™ Multichannel Scaler and MCS-32 (A73-B32) Software 931054C / 1213
LOOP 10
CLEAR
START
WAIT
FILL_BUFFER
SET_MCS 0
DESCRIBE_SAMPLE “This is sample ???.”
SAVE “PEAK???.MCS”
RECALL_ROI “PEAK.ROI”
REPORT “PRN”
SET_MCS 1
END_LOOP
Spooling the report may take some time. To overlap the data collection with the analysis, the
logic of the
.JOB file needs to be modified to restart the acquisition after the data have been
moved to the buffer.
NOTE All of the analysis is performed on the buffer spectrum so the MCS spectrum can be
erased and the next one started.
Insert CLEAR and START after FILL_BUFFER, as shown here:
SET_MCS 1
SET_DWELL_TIME 1e-6
SET_PASS_LENGTH 7500
SET_PRESET_PASS 1000
CLEAR
START
LOOP 10
WAIT
FILL_BUFFER
CLEAR
START
SET_MCS 0
DESCRIBE_SAMPLE “This is sample ???”
SAVE “PEAK???.MCS”
RECALL_ROI “PEAK.ROI”
REPORT “PRN”
SET_MCS 1
END_LOOP
76
Page 87

931054C / 1213 8. JOB FILES
8.1.2. The RUN Command
The RUN command can be used to execute other programs. For exam ple, if the system consists
of a computer-controlled filter changer and an Easy-MCS, you can write a program that triggers
the filter changer to change the filter. Following is an example of this type of JO B:
SET_MCS 1
SET_DWELL_TIME 2e-6
SET_PASS_LENGTH 7500
SET_PRESET_PASS 1000
CLEAR
START
LOOP 10
WAIT
FILL_BUFFER
CLEAR
RUN “MOVEFILT.EXE”
START
SET_MCS 0
DESCRIBE_SAMPLE “This is filter ???”
SAVE “PEAK???.MCS”
RECALL_ROI “PEAK.ROI”
REPORT “PRN”
SET_MCS 1
END_LOOP
Now the filter is changed before each acquisition.
Note that when an
EXE program is run, the program starts but returns to the JOB before it exits.
This is usually undesirable. For instance, in the preceding example, the Easy-MCS will start the
acquisition before the filter is changed. The way around this is to add a WAIT command
immediately after the RUN command:
RUN “MOVEFILT.EXE”
WAIT “MOVEFILT.EXE”
The .JOB file will now suspend execution until MOVEFILT.EXE exits.
8.1.3. Controlling MCS-32 from Other Programs
In the preceding example, MCS-32 ran another executable to control the system . A different
method of operation is to run MCS-32 from another control program. In this situation, a userwritten program would set up the hardware for the acquisition, then run MCS-32 with a command line that immediately starts a JOB to perform the acquisition. Using the Q UIT comma nd as
77
Page 88

Easy-MCS ™ Multichannel Scaler and MCS-32 (A73-B32) Software 931054C / 1213
the last line of the JOB would cause MCS-32 to exit at the end of the acquisition and return to
®
the control program. For example, if you use the MAESTRO
MCA Emulator software, you
might write a JOB that runs MCS-32, then returns to MAESTRO after the acquisition. See
Section B.1 for information on the MCS-32 command line.
8.2. Job Commands
In the following descriptions, a variable filename or text is enclosed in “...” and a variable
number is enclosed in <...>; anything enclosed in square brackets [...] is optional.
BEEP [<freq>, <duration>] or [<ID>] or [<String>]
This comma nd functions for computers without a sound card (typically , legacy PCs).
Format 1
This format produces an audible tone at a pitch of <freq> Hertz, lasting for <duration>
milliseconds.
: BEEP <freq>, <duration>
Format 2
: BEEP <ID>
This format produces a sound based on a system event. See the following table:
ID
Event
0 PC Speaker Beep
1 Default Windows Beep
2 Start Windows
3Asterisk
4 Exclamation
5 Critical Stop
6 Question
7 Exit Windows
Format 3
This format plays a
BEEP TADA.WAV plays the
: BEEP <String>
.WAV file or any event defined in the Windows Registry. For example,
TADA.WAV file, and BEEP Question plays the sound
associated with Question.
CLEAR
Clears (erases) the data and the pass count for the selected MCS. The presets are not
changed. This command has the same function as the Clear function under the Acquire
menu. The command would logically be preceded by the SET_MCS command as follows:
.
.
SET_MCS 1
CLEAR
.
78
Page 89

931054C / 1213 8. JOB FILES
CLEAR_ROI
Erases the ROIs in the buffer. The command is only valid when the buffer is selected.
DESCRIBE_HARDWARE “description”
This command accepts a 63-character description of the sy stem. This description is saved
with the spectrum using the SAVE command function, and is included in the RE PORT printout. This command is only applicable in the buffer.
The loop count value can be included in any text by typing three question marks in the text
where the loop count is to be inserted. The loop count replaces “???” wherever they appear.
DESCRIBE_SAMPLE “description”
Accepts a 63-character description of the sample being analyzed. This description is saved
with the spectrum using the SAVE command function, and is included in the REPORT
printout.
The loop count value can be included in any text by typing three question marks in the text
where the loop count is to be inserted. The loop count replaces “???” w herever it appears.
ENABLE_AUTOCLR
Enables the AutoClr function of the Easy-MCS for sum-then-replace mode (see
Section 6.2.5). When enabled (i.e., in sum-then-replace mode), the first pass replaces the
data in memory, then additional passes are summe d with the data in memory, as in sum
mode.
ENABLE_DISCRIMINATOR
Enables the Discriminator Input on the MCS and disables the SCA Input. This command
performs the same function as clicking “Use Disc” in the Input Control dialog box. This
command fails if the buffer is selected.
ENABLE_SCA
Enables the SCA Input on the MCS and disables the Discriminator Input. This command
performs the same function as clicking “Use SCA” in the Input Control dialog box. This
command fails if the buffer is selected.
EXPORT “[D:\Path\]File[.Asc]”
Exports the viewed spectrum to an ASCII text file. It is valid both for the MCS and buffer.
Any valid filename, including the drive and subdirectory, can be used. If the drive and subdirectory are omitted, the last subdirectory used for exporting data is used as the default. If a
file extension is not provided, the default extension .Asc is appended to File. This command
is identical to the Export ASCII... command on the File menu.
79
Page 90

Easy-MCS ™ Multichannel Scaler and MCS-32 (A73-B32) Software 931054C / 1213
FILL_BUFFER
Transfers the MCS data to the buffer. This command has the same function as MCS >
Buffer under Acquire. This command fails if the buffer is selected.
IMPORT “[D:\Path\]File[.Asc]”
Imports the ASCII text file into the buffer. Any valid filename, including the drive and subdirectory, can be used. If the drive and subdirectory are omitted, the last directory used for
importing data is used as the default. If a file extension is not provided, the default extension
.Asc is appended to File. This command is identical to the Import ASCII... command on the
File menu. This command fails if the buffer is selected.
LOAD_LIBRARY “lib.lbr”
Loads the specified library, and duplicates the function of Library... under the Services
menu.
LOOP <repetitions> ... END_LOOP
This comma nd pair executes multiple times all the commands between LOOP and END_
LOOP. The number of execution times is specified by <repetitions>. Each command must be
given on a separate line. A value of zero or a LOOP with no END_LOOP statement executes
once.
The loop count value can be included in any text by typing three question marks in the text
where the loop count is to be inserted. The loop count replaces “???” the first tim e the
question marks appear. Spaces should be included only in the text and not in the filenam e .
Filenames with spaces cannot easily be used by D OS commands.
The following is an example:
SET_MCS 1
SET_PRESET_PASS 20
LOOP 3
SET_MCS 1
CLEAR
START
WAIT
FILL_BUFFER
SET_MCS 0
SAVE “TEST???.MCS”
END_LOOP
The above comma nds run three 20-pass acquisitions and store the data on a disk in
TEST001.MCS, TEST002.MCS and TEST003.MCS.
80
Page 91

931054C / 1213 8. JOB FILES
NORMALIZE
Normalizes the data in the buffer by dividing the data in each channel by the pass count. If
the buffer is not selected, this comma nd fails. This command has the same function as
Normalize in the Calculate menu.
PRINT_DATA “[D:\Path\]File[.Rpt]” or “PRN” [0/1]
Executes the Print... command under the File menu. The output can be printed to the printer
(PRN) or saved to a disk file, which can be used by other program s or printed later. Any
valid filename, including the drive and subdirectory, can be used. If the drive and subdirectory are omitted, the last subdirectory used for report files is the default. If a file extension is
not provided, the default extension .Rpt is appended to File.
The loop count value may be used in the file name by typing thr ee question marks “???” in
the text where the loop count is to be inserted. The loop count replaces the “???” in the file
name.
An optional argument is provided to enable or disable the Data Only feature of the command. If absent, a standard report is generated. If equal to “1", the Data Only format of the
command is generated. If equal to “0", the standard format is generated.
QUIT
Unconditionally terminates MCS-32 and returns control to Windows.
RECALL “file.mcs”
Reads a disk filename to the buffer. The disk file must be in the format created by SAVE.
Any valid filename, including the drive and subdirectory, can be used. If the file has calibration information, the calibration parameters are used to set the calibration for the buffer. This
command has the same function as Recall File... under the File menu. If the buffer is not
selected, this comma nd fails.
The loop count value can be included in the above filename, as in any text, by typing three
question marks in the text where the loop count is to be inserted. The loop count replaces
“???” whe rever they a ppear.
RECALL_CALIBRATION “file.mcs” or “file.set”
Loads the calibration parameters from the calibration data stored with a spectrum if an
“.mc s” file is supplied, or the calibration from the settings file if a “.set” file is specified.
This comma nd can be used in generating reports that include library peak identification. See
the RECALL_ROI command for an example of such a
.JOB file.
81
Page 92

Easy-MCS ™ Multichannel Scaler and MCS-32 (A73-B32) Software 931054C / 1213
RECALL_ROI “file.roi”
Marks the ROI channels in the buffer to conform to the table in the disk file, created by
SAVE_ROI or Save ROI As... under the ROI menu. The data contents of the buffer are not
changed by this operation. The previous ROIs are cleared.
This comma nd has the same function as Recall ROI... under ROI. This command fails if the
buffer is not selected.
This comma nd can be used in generating reports that look for specific peaks. For example, a
calibration spectrum containing known peaks is run, the spectrum is calibrated, and the
peaks are marked with ROIs. The calibration is saved as spectrum file
STANDARD.MCS
and as ROI file STANDARD.ROI. The command sequence is:
.
.
RECALL_CALIBRATION “STANDARD.MCS”
RECALL_ROI “STANDARD.ROI”
REPORT “STANDARD.RPT”
.
.
These commands report the values only for the peaks that were marked in the calibration
spectrum.
As usual, the loop count value can be included in any text by typing three question marks in
the text where the loop count is to be inserted.
RECALL_SETTINGS “file.set”
Reads the settings from a disk filename and applies them to the selected MCS or buffer. The
disk file must be in the format created by File/Save Settings As.... Any valid filename,
including the drive and subdirectory, can be used.
This comma nd has the same function as File/Recall Settings.
The loop count value can be included in the above filename, as in any text, by typing three
question marks in the text where the loop count is to be inserted. The loop count replaces
“???” whe rever they a ppear.
REM [Text]
This line is a comme nt (remark), and is ignored during command processing. The REM
command allows you to enter descriptive comments into
commands while testing a
.JOB file.
.JOB files or temporarily disable
82
Page 93

931054C / 1213 8. JOB FILES
REPORT “filename”
Generates a paragraph-style report in the selected file. This command has the same function
as File/Report.... See Section 6.1. 4 for a description of the report format.
The output can be printed on the printer (PRN), or sent to a disk file, which can be used by
other programs or printed later. The loop count value can be included in the filename by
typing three question marks in the text where the loop count is to be inserted. The loop count
replaces “???” in the filenam e .
RUN “program”
Executes an application named “ pr ogram”. This is typically an
.EXE filename. Note that the
program will not run to completion before returning to MCS-32 unless it is run at higher
priority or the WAIT “program” com mand is used (see also the discussion of WAIT
“program” on p. 77).
RUN_MINIMIZED “program [arguments]”
This comma nd executes an application named “program” in a minimized window. This is
typically an
.EXE or .PIF filename. Note that the program will not run to completion before
returning to the MCS-32 program unless it is run at higher priority or the WAIT “program ”
command is used.
SAVE “[d:][\path\]file[.mcs]”
This comm a nd, which has the same function as Save As... under the File menu, saves the
MCS or buffer to a disk file. The disk filename (in quotation m arks) can be any valid filename; the drive [d:], path [\path\] and extension [.mcs] are optional. If an extension is not
supplied, the default extension is automatically
.MCS. Also, the current drive and directory
are used by default when the optional path specification is not supplied. The loop count
value can be included in the filename by typing three question marks in the text where the
loop count is to be inserted. The loop count replaces “???” wherever it appears.
SAVE_ROI “[d:][\path\]file[.roi]”
This comm a nd, which has the same function as Save ROI... under the ROI menu, saves in a
disk file, a table of channel numbers that have the ROI set for the buffer. The contents of the
spectrum are not altered by this operation. T he disk filename (in quotation marks) can be any
valid filename, with optional elements as described for the SAVE command. The default
extension is
.ROI. The loop count value can be included in the filename by typing three
question marks in the text where the loop count is to be inserted. The loop count replaces
“???” where ver it appears. This command fails if the buffer is not selected.
83
Page 94

Easy-MCS ™ Multichannel Scaler and MCS-32 (A73-B32) Software 931054C / 1213
SEND_MESSAGE “command”
This comm and is used to send NIM-488 comm ands to the MCS. It can be used to perform
any desired MCS operations. The text must be in the syntax expected by the MCS. If the
response from the MCS does not end with a command-accepted message, this command will
exit with error. Specific MCS commands and syntax are described in Appendix D.
Following is an example of using this com mand to set the date in the Easy-MCS to March 3,
2000:
.
.
SET_MCS 1
STOP
SEND_MESSAGE “SET_DATE 3,3,00"
.
.
SET_DISCRIMINATOR_EDGE <n>
If <n> is 0, the discriminator is set to rising-edge triggered. If <n> is not zero, the discrim inator is set to falling-edge triggered. This command performs the same function as the
Rising/Falling radio buttons on the Input Control dialog (Acquire/Input Control...). This
command fails if the buffer is selected.
SET_DISCRIMINATOR <f>
Sets the discriminator level to <f> volts. The value of <f> may be a floating-point number
between !1.6 V and +3.0 V. This command performs the same function as the Discrimi-
nator slide bar on the Input Control dialog (Acquire/Input Control...). This command fails
if the buffer is selected.
SET_DWELL_ETHLD <f >
Sets the external dwell threshold. F can be a floating-point number between !1.6 V and
3.0 V.
SET_DWELL_EXTERNAL
Sets the dwell time to external. The SET_DWELL_TIME command switches the MCS from
external to internal dwell. This command is only valid when an MCS is selected and is not
acquiring data.
SET_DWELL_TIME <f>
Sets the dwell time to <f> seconds and selects internal dwell time. The value of <f> is a
floating-point number that may take on any value from 5 × 10
time is specified, the MCS will roundoff the value to the closest legal value. This command
fails if the buffer is selected or the MCS is acquiring data.
84
!
9
to 65535. If an invalid dwell
Page 95

931054C / 1213 8. JOB FILES
SET_INPED <number>
Sets the input impedance. The value of <number> has only 2 valid possibilities, zero and 1.
Zero sets the input impedance to 50 Ω; 1 sets the input im pedance to 1 kΩ.
SET_MCS <number>
This command selects the active MCS or the buffer. The MCS num ber can be 1 to 8 according to the MCS configuration, or 0 for the buffer. SET_MCS without an argument is used to
switch to the previously selected MCS . If an MCS that does not exist is selected, no change
is made.
This comma nd (for values 1 to 8) has the same function as <Ctrl + F1> through
<Ctrl + F8>. For value 0 or no argument, this command duplicates the buffer-selection
capabilities of the MCS/Buffer toggle under the Display menu, <F4>, <Alt + 6>, and the
MCS# and Buffer radio buttons on the Sidebar.
SET_MODE_ACQUIRE <n>
Sets the acquire mode to Sum if <n> is 0, or to Replace if <n> is not 0. Performs the same
function as the Acq Mode radio buttons in the Pass Control dialog (Acquire/Pass
Control...). Valid pass lengths with ramp control enabled are 4–65536. This command fails
if the buffer is selected or the MCS is acquiring data.
SET_PASS_LENGTH <n>
Sets the pass length to <n> channels. <n> can be any value from 4 to 65536. T his command
performs the same function as the Pass Length field in the Pass Control dialog (Acquire/
Pass Control...). This command fails if the buffer is selected or the MCS is acquiring data.
SET_PRESET_PASS <n>
Sets the pass preset to <n> passes. <n> can be any value from 0 to 4,294,967,295. If 0 is
specified, there is no preset. Performs the same function as the Pass Count Preset field in
the Pass Control dialog (Acquire/Pass Control...). This command fails if the buffer is
selected or the MCS is acquiring data.
SET_RAMP <f1>,<f2>[,<f3>]
Sets the ramp parameters. If all three values are specified, a “triangle” ramp is selected
(Begin-Mid-End). The three values then specify the ramp voltage in channel 0 (<f1>), the
middle channel of the pass (<f2>), and the last channel (<f3>). If <f3> is omitted, a
“sawtooth” ramp is selected (Begin-End). In that case, <f1> is the voltage at channel 0 and
<f2> is the voltage in the last channel. See the Ramp Control dialog box (Acquire/Ramp
Control...) for more information. This command fails if the buffer is selected or the MCS is
acquiring data.
85
Page 96

Easy-MCS ™ Multichannel Scaler and MCS-32 (A73-B32) Software 931054C / 1213
SET_SCA_LOWER <f>
Sets the SCA lower-level discriminator voltage to <f> volts. <f> is a floating-point number
that may take on values from 0 to 10. If an invalid value is specified, the MCS rounds off to
the nearest legal value. This command performs the same function as the Lower slide bar on
the Input Control dialog (Acquire/Input Control...). This command fails if the buffer is
selected.
SET_SCA_UPPER <f>
Sets the SCA upper-level discriminator voltage to <f> volts. <f> is a floating-point number
that may take on values from 0 to 10. If an invalid value is specified, the MCS rounds off to
the nearest legal value. This command performs the same function as the Upper SCA slide
bar on the Input Control dialog (Acquire/Input Control...). This command fails if the buffer
is selected.
SET_TRIGGER <n>
Sets the trigger to Internal if <n> is 0, and to External if <n> is not 0. This command fails if
the buffer is selected, or the MCS is acquiring data.
SMOOTH
Smooths the data in the buffer using a five-point, area-preserving, binomial smoothing algorithm. Its function is the same as Smooth under the Calculate menu. The original contents
of the buffer are lost. This command fails if the buffer is not selected.
START
Initiates data collection in the selected MCS. This function is the same as Start under the
Acquire menu. This command fails if the buffer is selected.
STOP
Stops data collection in the selected MCS at the end of the current pass. To stop before the
end of the current pass, issue this comma nd twice. If the MCS has already been stopped,
STOP has no effect. This com mand has the same function as Stop under the Acquire menu.
It fails if the buffer is selected.
STRIP <factor>,”file.mcs”
Strips the disk spectrum from the spectrum in the buffer, and stores the results in the buffer.
The disk and buffer spectra must be the same size. The disk spectrum can be scaled up or
down by <factor> (a constant) or, if <factor> is zero, by the ratio of the pass counts of the
two spectra. This command fails if the buffer is not selected.
86
Page 97

931054C / 1213 8. JOB FILES
WAIT [<seconds>]
Suspends execution of the JOB to wait until either the active MCS stops counting (in the
case where the <seconds> argument is not included), or for a fixed number of seconds
(which can be fractional). Note that the “wait for end of acquisition” form of the command
(i.e., no argument) suspends the JOB indefinitely if there is no pass preset that can be
satisfied (i.e., if acquisition proceeds indefinitely).
WAIT “program”
Suspends execution of the JOB to wait until the named program stops execution. If the
program does not stop, the JOB does not continue.
87
Page 98

Easy-MCS ™ Multichannel Scaler and MCS-32 (A73-B32) Software 931054C / 1213
[Intentionally blank]
88
Page 99

9. LIBRARY FILES
Library files are used to provide names for specific features (usually peaks) in the spectra.
Library files have a very simple format consisting of a series of text lines, terminated by carriage
returns, specifying one peak per line in the following format:
<Calibrated Value> <Name> <Factor>
where <Calibrated Value> is the location of the peak in the appropriate calibration units,
<Name> is the name of the peak (it must be no more than 8 characters), and <Factor> is a real
number used to obtain a corrected net area in the Report function (use a Factor of 1.0 for no
correction).
All fields on each line are separated by spaces or tabs. Extra spaces and tabs are ignored. Since
spaces are used to separate the items, spaces are not allowed in the Name; however, all other
characters are legal. An underscore ( _ ) is a good substitute for a space.
The text file can be created by any programming text (i.e., ASCII) editor that does not put
special codes in the text (for example, Windows N otepad). The following is an example of a
short library file:
14.4100 ABC-123 1.0
31.8171 BCD-234 1.0
32.1936 CDE-345 1.0
36.4000 DEF-456 1.0
122.0630 EFG-567 1.0
136.4760 FGH-678 1.0
661.6600 GHI-789 1.0
802.0000 HIJ-890 1.0
1173.2370 IJK-901 1.0
1332.5010 JKL-012 1.0
2616.0000 KLM-123 1.0
89
Page 100

Easy-MCS ™ Multichannel Scaler and MCS-32 (A73-B32) Software 931054C / 1213
[Intentionally blank]
90
 Loading...