

Page 1

ORTEC
®
®
DSPEC 50 /50A
®
DSPEC 502/502A
Standard / Advanced
Digital Gamma-Ray Spectrometer
Hardware User’s Manual
Printed in U.S.A. ORTEC Part No. 932502 0618
Manual Revision G
Page 2

Advanced Measurement Technology, Inc.
(“AMT”)
WARRANTY
AMT warrants that the items will be delivered free from defects in material or workmanship. AMT makes no other warranties,
express or implied, and specifically NO WARRANTY OF MERCHANTABILITY OR FITNESS FOR A PARTICULAR
PURPOSE.
AMT’s exclusive liability is limited to repairing or replacing at AMT’s option, items found by AMT to be defective in
workmanship or materials within one year from the date of delivery. AMT’s liability on any claim of any kind, including
negligence, loss, or damages arising out of, connected with, or from the performance or breach thereof, or from the
manufacture, sale, delivery, resale, repair, or use of any item or services covered by this agreement or purchase order, shall in
no case exceed the price allocable to the item or service furnished or any part thereof that gives rise to the claim. In the event
AMT fails to manufacture or deliver items called for in this agreement or purchase order, AMT’s exclusive liability and buyer’s
exclusive remedy shall be release of the buyer from the obligation to pay the purchase price. In no event shall AMT be liable
for special or consequential damages.
Quality Control
Before being approved for shipment, each AMT instrument must pass a stringent set of quality control tests designed to expose
any flaws in materials or workmanship. Permanent records of these tests are maintained for use in warranty repair and as a
source of statistical information for design improvements.
Repair Service
If it becomes necessary to return this instrument for repair, it is essential that Customer Services be contacted in advance of
its return so that a Return Authorization Number can be assigned to the unit. Also, AMT must be informed, either in writing,
by telephone [(865) 482-4411] or by facsimile transmission [(865) 483-2133], of the nature of the fault of the instrument being
returned and of the model, serial, and revision (“Rev” on rear panel) numbers. Failure to do so may cause unnecessary delays
in getting the unit repaired. The AMT standard procedure requires that instruments returned for repair pass the same quality
control tests that are used for new-production instruments. Instruments that are returned should be packed so that they will
withstand normal transit handling and must be shipped PREPAID via Air Parcel Post or United Parcel Service to the designated
AMT repair center. The address label and the package should include the Return Authorization Number assigned. Instruments
being returned that are damaged in transit due to inadequate packing will be repaired at the sender’s expense, and it will be the
sender’s responsibility to make claim with the shipper. Instruments not in warranty should follow the same procedure and AMT
will provide a quotation.
Damage in Transit
Shipments should be examined immediately upon receipt for evidence of external or concealed damage. The carrier making
delivery should be notified immediately of any such damage, since the carrier is normally liable for damage in shipment.
Packing materials, waybills, and other such documentation should be preserved in order to establish claims. After such
notification to the carrier, please notify AMT of the circumstances so that assistance can be provided in making damage claims
and in providing replacement equipment, if necessary.
Copyright © 2018, Advanced Measurement Technology, Inc. All rights reserved.
®
ORTEC
respective owners.
NOTICE OF PROPRIETARY PROPERTY — This document and the information contained in it are the proprietary property of
AMETEK Inc. It may not be copied or used in any manner nor may any of the information in or upon it be used for any purpose without the
express written consent of an authorized agent of AMETEK Inc.
is a registered trademark of Advanced Measurement Technology, Inc. All other trademarks used herein are the property of their
Page 3

ADDITIONAL WARRANTY STATEMENT
Please note that the integrated computer that controls the ORTEC
DSPEC 50® is intended exclusively for the tasks detailed in this operation
manual. Using this computer for any other purpose may void your
warranty.
In addition, the DSPEC 50 contains no user-serviceable parts. Breaking
the seal on the case voids your warranty. The DSPEC 50 should be
opened only by ORTEC-authorized service personnel.
If you have any questions about the use or maintenance of this instrument,
please contact your ORTEC representative or our Global Service Center
first.
®
iii
Page 4

[Intentionally blank]
iv
Page 5

TABLE OF CONTENTS
Installation — page 33
WARRANTY. . . . . . . . . . . . . . . . . . . . . . . . . . . . . . . . . . . . . . . . . . . . . . . . . . . . . . . . . . . . . . . . . ii
ADDITIONAL WARRANTY STATEMENT. . . . . . . . . . . . . . . . . . . . . . . . . . . . . . . . . . . . . . . iii
Safety Instructions and Symbols.. . . . . . . . . . . . . . . . . . . . . . . . . . . . . . . . . . . . . . . . . . . . . . . . . . ix
Cleaning Instructions.. . . . . . . . . . . . . . . . . . . . . . . . . . . . . . . . . . . . . . . . . . . . . . . . . . . . . . . . . . . ix
1. INTRODUCTION. . . . . . . . . . . . . . . . . . . . . . . . . . . . . . . . . . . . . . . . . . . . . . . . . . . . . . . . . . . 1
1.1. DSPEC-Family Technologies for HPGe Systems.. . . . . . . . . . . . . . . . . . . . . . . . . . . . . . 2
1.2. Ballistic Deficit and Adjusting the Flattop Duration. . . . . . . . . . . . . . . . . . . . . . . . . . . . 4
1.3. Resolution Enhancer Corrects for Charge Trapping.. . . . . . . . . . . . . . . . . . . . . . . . . . . . 5
1.4. Enhanced Throughput Mode. . . . . . . . . . . . . . . . . . . . . . . . . . . . . . . . . . . . . . . . . . . . . . . 6
1.5. The Low Frequency Rejector (LFR) Filter. . . . . . . . . . . . . . . . . . . . . . . . . . . . . . . . . . . . 7
1.6. Zero Dead-Time (ZDT) Mode.. . . . . . . . . . . . . . . . . . . . . . . . . . . . . . . . . . . . . . . . . . . . . 9
1.6.1. Off — Uncorrected Spectrum Only. . . . . . . . . . . . . . . . . . . . . . . . . . . . . . . . . . . 10
1.6.2. NORM_CORR — ZDT and Uncorrected Spectra Stored.. . . . . . . . . . . . . . . . . 11
1.6.3. CORR_ERR — ZDT and Error Spectra Stored.. . . . . . . . . . . . . . . . . . . . . . . . . 11
1.6.4. Choosing a ZDT Mode.. . . . . . . . . . . . . . . . . . . . . . . . . . . . . . . . . . . . . . . . . . . . 13
1.6.4.1. The NORM_CORR Diagnostic Mode. . . . . . . . . . . . . . . . . . . . . . . . . 14
1.6.4.2. To Summarize. . . . . . . . . . . . . . . . . . . . . . . . . . . . . . . . . . . . . . . . . . . . 14
1.7. Host Computer and Software Requirements. . . . . . . . . . . . . . . . . . . . . . . . . . . . . . . . . . 14
1.8. About This Manual. . . . . . . . . . . . . . . . . . . . . . . . . . . . . . . . . . . . . . . . . . . . . . . . . . . . . 15
2. THE DSPEC 50. . . . . . . . . . . . . . . . . . . . . . . . . . . . . . . . . . . . . . . . . . . . . . . . . . . . . . . . . . . . 17
2.1. Front Panel.. . . . . . . . . . . . . . . . . . . . . . . . . . . . . . . . . . . . . . . . . . . . . . . . . . . . . . . . . . . 17
2.1.1. The ON/OFF Switch and Power-Up. . . . . . . . . . . . . . . . . . . . . . . . . . . . . . . . . . 17
2.1.2. The Touchscreen Interface.. . . . . . . . . . . . . . . . . . . . . . . . . . . . . . . . . . . . . . . . . 17
2.1.3. The Display Control Screen (Status Screen Setup). . . . . . . . . . . . . . . . . . . . . . . 19
2.1.3.1. Import Photos from SD Card.. . . . . . . . . . . . . . . . . . . . . . . . . . . . . . . . 19
2.1.4. The Communication Control Screen. . . . . . . . . . . . . . . . . . . . . . . . . . . . . . . . . . 20
2.1.4.1. Set Password. . . . . . . . . . . . . . . . . . . . . . . . . . . . . . . . . . . . . . . . . . . . . 21
2.1.4.2. Regional Settings.... . . . . . . . . . . . . . . . . . . . . . . . . . . . . . . . . . . . . . . . 22
2.1.5. The Data Display Screens. . . . . . . . . . . . . . . . . . . . . . . . . . . . . . . . . . . . . . . . . . 22
2.1.5.1. The Gauges Screen. . . . . . . . . . . . . . . . . . . . . . . . . . . . . . . . . . . . . . . . 22
2.1.5.2. The Chart Screen. . . . . . . . . . . . . . . . . . . . . . . . . . . . . . . . . . . . . . . . . . 24
2.1.5.3. The Spectrum Screen.. . . . . . . . . . . . . . . . . . . . . . . . . . . . . . . . . . . . . . 25
v
Page 6

DSPEC 50® and DSPEC 502® Digital Gamma-Ray Spectrometer User’s Manual 932502G / 0618
2.1.5.4. The Big Numbers Screen.. . . . . . . . . . . . . . . . . . . . . . . . . . . . . . . . . . . 27
2.2. Rear Panel. . . . . . . . . . . . . . . . . . . . . . . . . . . . . . . . . . . . . . . . . . . . . . . . . . . . . . . . . . . . 27
2.2.1. Changing the Fuse(s) and Line Voltage.. . . . . . . . . . . . . . . . . . . . . . . . . . . . . . . 29
2.2.1.1. Replacing the Fuse(s). . . . . . . . . . . . . . . . . . . . . . . . . . . . . . . . . . . . . . 30
2.2.1.2. Changing the Line Voltage. . . . . . . . . . . . . . . . . . . . . . . . . . . . . . . . . . 31
2.2.1.3. Closing the Input Power Module.. . . . . . . . . . . . . . . . . . . . . . . . . . . . . 32
3. HARDWARE AND SOFTWARE INSTALLATION.. . . . . . . . . . . . . . . . . . . . . . . . . . . . . . 33
3.1. Step 1: Line Voltage, Fusing, and Power Cord. . . . . . . . . . . . . . . . . . . . . . . . . . . . . . . 33
3.2. Step 2: Install the CONNECTIONS Driver Update. . . . . . . . . . . . . . . . . . . . . . . . . . . . . . 33
3.3. Step 3: Install the Spectroscopy Application Software. . . . . . . . . . . . . . . . . . . . . . . . . 34
3.4. Step 4: Connect the DSPEC 50 to Your Network or Computer. . . . . . . . . . . . . . . . . . 34
3.4.1. Ethernet Connection.. . . . . . . . . . . . . . . . . . . . . . . . . . . . . . . . . . . . . . . . . . . . . . 34
3.4.2. USB Connection.. . . . . . . . . . . . . . . . . . . . . . . . . . . . . . . . . . . . . . . . . . . . . . . . . 35
3.5. Step 5: Run MCB Configuration to Establish Communication With Your MCBs.. . . 35
3.5.1. Configuring a New Instrument.. . . . . . . . . . . . . . . . . . . . . . . . . . . . . . . . . . . . . . 36
3.5.2. Customizing ID Numbers and Descriptions. . . . . . . . . . . . . . . . . . . . . . . . . . . . 37
3.5.3. Connecting to and Disconnecting from the Computer. . . . . . . . . . . . . . . . . . . . 37
4. MCB PROPERTIES IN MAESTRO. . . . . . . . . . . . . . . . . . . . . . . . . . . . . . . . . . . . . . . . . . . . 39
4.1. Amplifier. . . . . . . . . . . . . . . . . . . . . . . . . . . . . . . . . . . . . . . . . . . . . . . . . . . . . . . . . . . . . 39
4.1.1. Optimize. . . . . . . . . . . . . . . . . . . . . . . . . . . . . . . . . . . . . . . . . . . . . . . . . . . . . . . . 40
4.2. Amplifier 2.. . . . . . . . . . . . . . . . . . . . . . . . . . . . . . . . . . . . . . . . . . . . . . . . . . . . . . . . . . . 41
4.2.1. InSight Mode. . . . . . . . . . . . . . . . . . . . . . . . . . . . . . . . . . . . . . . . . . . . . . . . . . . . 42
4.2.1.1. Mark Types. . . . . . . . . . . . . . . . . . . . . . . . . . . . . . . . . . . . . . . . . . . . . . 44
4.3. Amplifier PRO. . . . . . . . . . . . . . . . . . . . . . . . . . . . . . . . . . . . . . . . . . . . . . . . . . . . . . . . . 46
4.3.1. “Training” the Resolution Enhancer. . . . . . . . . . . . . . . . . . . . . . . . . . . . . . . . . . 48
4.4. ADC. . . . . . . . . . . . . . . . . . . . . . . . . . . . . . . . . . . . . . . . . . . . . . . . . . . . . . . . . . . . . . . . . 49
4.5. Stabilizer. . . . . . . . . . . . . . . . . . . . . . . . . . . . . . . . . . . . . . . . . . . . . . . . . . . . . . . . . . . . . 51
4.6. High Voltage. . . . . . . . . . . . . . . . . . . . . . . . . . . . . . . . . . . . . . . . . . . . . . . . . . . . . . . . . . 52
4.7. About. . . . . . . . . . . . . . . . . . . . . . . . . . . . . . . . . . . . . . . . . . . . . . . . . . . . . . . . . . . . . . . . 53
4.8. Status. . . . . . . . . . . . . . . . . . . . . . . . . . . . . . . . . . . . . . . . . . . . . . . . . . . . . . . . . . . . . . . . 53
4.9. Presets. . . . . . . . . . . . . . . . . . . . . . . . . . . . . . . . . . . . . . . . . . . . . . . . . . . . . . . . . . . . . . . 54
4.10. MDA Preset. . . . . . . . . . . . . . . . . . . . . . . . . . . . . . . . . . . . . . . . . . . . . . . . . . . . . . . . . . 56
4.11. Nuclide Report Tab. . . . . . . . . . . . . . . . . . . . . . . . . . . . . . . . . . . . . . . . . . . . . . . . . . . . 58
4.11.1. Add New.. . . . . . . . . . . . . . . . . . . . . . . . . . . . . . . . . . . . . . . . . . . . . . . . . . . . . . 58
4.11.1.1. Defining Peaks Manually. . . . . . . . . . . . . . . . . . . . . . . . . . . . . . . . . . 58
4.11.1.2. Selecting Peaks from the Working Library.. . . . . . . . . . . . . . . . . . . . 59
4.11.2. Edit. . . . . . . . . . . . . . . . . . . . . . . . . . . . . . . . . . . . . . . . . . . . . . . . . . . . . . . . . . . 59
4.11.3. Delete. . . . . . . . . . . . . . . . . . . . . . . . . . . . . . . . . . . . . . . . . . . . . . . . . . . . . . . . . 59
4.12. Output Tab. . . . . . . . . . . . . . . . . . . . . . . . . . . . . . . . . . . . . . . . . . . . . . . . . . . . . . . . . . . 59
vi
Page 7

932502G / 0618 TABLE OF CONTENTS
4.13. Setting the Rise Time in Digital MCBs.. . . . . . . . . . . . . . . . . . . . . . . . . . . . . . . . . . . . 60
5. Web Interface. . . . . . . . . . . . . . . . . . . . . . . . . . . . . . . . . . . . . . . . . . . . . . . . . . . . . . . . . . . . . . 63
5.1. Web Page. . . . . . . . . . . . . . . . . . . . . . . . . . . . . . . . . . . . . . . . . . . . . . . . . . . . . . . . . . . . . 63
5.2. Web Services. . . . . . . . . . . . . . . . . . . . . . . . . . . . . . . . . . . . . . . . . . . . . . . . . . . . . . . . . . 64
6. SPECIFICATIONS.. . . . . . . . . . . . . . . . . . . . . . . . . . . . . . . . . . . . . . . . . . . . . . . . . . . . . . . . . 67
6.1.1. Inputs and Outputs. . . . . . . . . . . . . . . . . . . . . . . . . . . . . . . . . . . . . . . . . . . . . . . . 70
6.1.2. Electrical and Mechanical. . . . . . . . . . . . . . . . . . . . . . . . . . . . . . . . . . . . . . . . . . 71
6.2. Feature Mask Bits. . . . . . . . . . . . . . . . . . . . . . . . . . . . . . . . . . . . . . . . . . . . . . . . . . . . . . 72
7. FIRMWARE COMMANDS AND RESPONSES.. . . . . . . . . . . . . . . . . . . . . . . . . . . . . . . . . 77
7.1.1. Command Records. . . . . . . . . . . . . . . . . . . . . . . . . . . . . . . . . . . . . . . . . . . . . . . . 77
7.1.2. USB-Interface Error Codes. . . . . . . . . . . . . . . . . . . . . . . . . . . . . . . . . . . . . . . . . 78
7.1.3. Percent Response Records. . . . . . . . . . . . . . . . . . . . . . . . . . . . . . . . . . . . . . . . . . 79
7.1.4. Dollar Response Records. . . . . . . . . . . . . . . . . . . . . . . . . . . . . . . . . . . . . . . . . . . 81
7.1.5. Command Catalog. . . . . . . . . . . . . . . . . . . . . . . . . . . . . . . . . . . . . . . . . . . . . . . . 81
APPENDIX A. STATIC IP ADDRESSING. . . . . . . . . . . . . . . . . . . . . . . . . . . . . . . . . . . . . . . 123
A.1. Preliminary Notes on IP Addresses and Subnet Masks. . . . . . . . . . . . . . . . . . . . . . . . 123
A.2. Assigning Static IP Addresses. . . . . . . . . . . . . . . . . . . . . . . . . . . . . . . . . . . . . . . . . . . 123
APPENDIX B. TROUBLESHOOTING. . . . . . . . . . . . . . . . . . . . . . . . . . . . . . . . . . . . . . . . . . 127
B.1. MAESTRO Does Not Connect with the DSPEC 50. . . . . . . . . . . . . . . . . . . . . . . . . . 127
B.2. Troubleshooting Static IP Addresses. . . . . . . . . . . . . . . . . . . . . . . . . . . . . . . . . . . . . . 128
B.3. Lost Password. . . . . . . . . . . . . . . . . . . . . . . . . . . . . . . . . . . . . . . . . . . . . . . . . . . . . . . . 128
APPENDIX C. STATE-OF-HEALTH BIT DEFINITIONS.. . . . . . . . . . . . . . . . . . . . . . . . . . 129
APPENDIX D. CALCULATIONS. . . . . . . . . . . . . . . . . . . . . . . . . . . . . . . . . . . . . . . . . . . . . . 131
D.1. The Nuclide Report.. . . . . . . . . . . . . . . . . . . . . . . . . . . . . . . . . . . . . . . . . . . . . . . . . . . 131
D.1.1. Calculations. . . . . . . . . . . . . . . . . . . . . . . . . . . . . . . . . . . . . . . . . . . . . . . . . . . . 131
D.2. Gain and Zero Stabilization. . . . . . . . . . . . . . . . . . . . . . . . . . . . . . . . . . . . . . . . . . . . . 133
APPENDIX E. LIST MODE IN THE DSPEC 50. . . . . . . . . . . . . . . . . . . . . . . . . . . . . . . . . . . 135
E.1. List Mode Data. . . . . . . . . . . . . . . . . . . . . . . . . . . . . . . . . . . . . . . . . . . . . . . . . . . . . . . 135
INDEX.. . . . . . . . . . . . . . . . . . . . . . . . . . . . . . . . . . . . . . . . . . . . . . . . . . . . . . . . . . . . . . . . . . . . 139
vii
Page 8

[Intentionally blank]
viii
Page 9
Safety Instructions and Symbols
This manual contains up to three levels of safety instructions that must be observed in order to avoid
personal injury and/or damage to equipment or other property. These are:
DANGER Indicates a hazard that could result in death or serious bodily harm if the safety instruction
is not observed.
WARNING Indicates a hazard that could result in bodily harm if the safety instruction is not observed.
CAUTION Indicates a hazard that could result in property damage if the safety instruction is not
observed.
In addition, the following symbols may appear on the product:
DANGER – Hazardous voltage
ATTENTION – Consult the manual in all cases where this symbol is
marked in order to determine the nature of the potential hazards and any
actions that must be taken to avoid them
Protective earth (ground) terminal
Please read all safety instructions carefully and make sure you understand them fully before attempting to
use this product.
Cleaning Instructions
To clean the instrument exterior:
! Disconnect the instrument from the power source.
! Remove loose dust on the outside of the instrument with a lint-free cloth.
! Remove remaining dirt with a lint-free cloth dampened in a general-purpose detergent and water
solution. Do not use abrasive cleaners.
CAUTION To prevent moisture inside of the instrument during external cleaning, use only
enough liquid to dampen the cloth or applicator.
!
Allow the instrument to dry completely before reconnecting it to the power source.
ix
Page 10

x
Page 11

1. INTRODUCTION
®1
The DSPEC 50
signal processing techniques resulting from over a half-century of continuous nuclear
instrumentation development by ORTEC®. The instrument controls and digital signal
processing was originally designed for use with high-purity germanium (HPGe) detectors, but it
is also compatible with other detector types.2 Whether your application is in nuclear power, nondestructive analysis, research physics, homeland security, real-time monitoring, or nuclear
safeguards, the DSPEC 50 and the dual-input DSPEC 502® deliver exceptional ease of use,
flexibility, and rock-solid count rate and peak position stability, across an Ethernet or USB
connection. The color touchscreen lets you monitor key aspects of instrument status and data
acquisition at a glance, without referring to your computer.
The DSPEC 50 is available in Standard (DSPEC 50 and DSPEC 502) and Advanced (DSPEC
50A and DSPEC 502A) models with both variants covered in this manual. In addition to the
Standard features, the Advanced models include additional output signals for the Change
Sample port, programmable coincidence and gate settings, counters for the Sample Ready and
Gate input ports, Web Services programming interface, and a Web Page interface for hardware
control and basic MCA emulation functions. Features available only on the Advanced models
are noted accordingly throughout this manual.
is a fully integrated gamma spectrometer with superior stability and digital
The DSPEC 50 is packed full of ORTEC’s premier performance-enhancing technology and
user-beneficial features including:
! Superior-performance digital circuitry with low-noise internal power supplies and detec-
tor bias gives you the best possible system resolution performance.
! The all-metal enclosure provides a high degree of isolation from electrical noise. It fits on
the benchtop or on a shelf in a 19-inch rack.
! Highly stable performance in the presence of temperature and count-rate variation.
! Wide-ranging digital filter settings with automated optimization.
! Ethernet (RJ45) interface for simple network connection, and USB or Ethernet interface
for use on the host computer.
! Connects to ORTEC SMART-1™ and DIM detectors, and to detectors with conventional
connectors.
! The large, color touchscreen provides the TCP/IP connectivity interface; and displays
status readouts including the preset count conditions, current live- and dead-time percentage (if active), input count rate, HV status, and optional gain- and zero-stabilizer correc-
1
Page 12

DSPEC 50® and DSPEC 502® Digital Gamma-Ray Spectrometer User’s Manual 932502G / 0618
tion. The DSPEC 502 screens are labeled MCA-1 and MCA-2 so you can easily tell which
input is onscreen.
! ORTEC’s formidable suite of enhancements to help achieve optimum system perform-
ance, include Ballistic Deficit Correction, Charge Trapping Correction, the LowFrequency Rejector, the data Throughput Enhancer, ZDT™ Mode zero-dead-time counting, and List Mode. These are discussed in detail in the remainder of this chapter.
ORTEC CONNECTIONS software supports an essentially unlimited number of Ethernet or USB
connected DSPEC 50s. In addition, almost any combination of other ORTEC multichannel
buffers1 (connecting via Ethernet, USB, printer port, Dual-Port Memory Interface, etc.) can be
connected to the same system.
1.1. DSPEC-Family Technologies for HPGe Systems
Resolution Enhancer In ORTEC DSPEC products, the flattop width parameter of the trapezoidal filter automatically corrects for ballistic deficit (Section 1.2). Unfortunately, this doesn’t
compensate for resolution loss due to charge trapping, which results in variations in charge collection efficiency over the crystal volume. The DSPEC 50 uses our Resolution Enhancer, which
enables you to correct for charge trapping by “training” the spectrometer to accommodate the
particular performance of your detector. See Section 1.3.
Enhanced Throughput Mode This signal processing method allows the spectrometer to begin
sampling the next pulse before the preceding one has returned to baseline. The effect is optimum
throughput while maintaining resolution and peak shape. See Section 1.4.
Low-Frequency Rejector (LFR) Filter Our Low-Frequency Rejector2 digital filter surpasses
all signal processing methods for reducing the effects of microphonics, ground loops, and virtually all other sources of periodic noise for HPGe and NaI(Tl) spectrometry. See Section 1.5.
Zero Dead-Time Correction
3
The DSPEC 50 features our innovative ZDT™ mode of operation, an alternative to the classical “extended-live-time clock.” The ZDT method produces accurate results in all situations and completely overcomes some of the shortcomings of extended
live-time methods. Moreover, the new ZDT method overcomes some limitations in previous
“loss-free” dead-time correction methods. Most notably, the ZDT mode does not require any
1
We use the term “multichannel buffer” (MCB) to indicate a multichannel analyzer (MCA) with enhanced
features and data memory.
2
Patent pending.
3
Patent number 6,327,549.
2
Page 13

932502G / 0618 1. INTRODUCTION
manual adjustments and is capable of computing the statistical uncertainty of the corrected
spectrum. See Section 1.6.
SMART-1
®
Support Detectors equipped with the SMART-1 technology have their recom-
mended bias values preset at the factory. No more shuffling through paperwork or looking for
tags on the detector to find the right bias setting. Simply turn on the electronics and the
SMART-1 detector senses the detector temperature and applies the right high-voltage bias.
These detectors allow modern instruments like the DSPEC 50 to monitor and display detector
state of health (SOH) during acquisition, including detector temperature, preamplifier power,
bias overrange, and bias on/off state. This continuous SOH monitoring ensures the integrity of
the acquired data. A quick check of the SOH flag in the SMART-1 detectors shows if any parameter deviated from specification during the measurement. This is vitally important for environmental samples that must be counted for long periods of time and regulatory-driven samples
where chain-of-custody integrity means everything.
List Mode In List Mode, the DSPEC 50 records and stores the pulse value with a time-stamp
for every pulse generated by the detector. With List Mode, you can write your own programs
that can reconstruct histograms for any time segment without dead time between histograms, or
make histograms for overlapping time slices. Data can be stored easily for reconstruction of any
time frame needed. In addition, MAESTRO v7 supports our List Mode MCBs with menu and
toolbar commands, as well as commands in our automated JOB streams. If your application
requires real real-time monitoring, no other instrument comes close for HPGe applications. See
Appendix E.
Sample Changer Connections and Controls The DSPEC 50 connects easily to many types of
automatic sample changers. The DSPEC 50A and 502A (Advanced) have configuration options
to output TTL pulses of varying widths from the Change Sample port based on the Input Count
Rate, SCA (pulses within a specified region of interest), and when the ADC Gate is active in
addition to the standard Change Sample output option. The Sample Ready and Gate ports on the
Advanced models are also used for counters.
Standard DSPEC-Family Features The DSPEC 50 also offers the InSight™ Virtual Oscilloscope, which allows you to optimize detector performance for a given application from the
computer; our easy automatic pole zero adjustment4 and automatic baseline restorer5; and the
highly accurate Gedcke-Hale extended live-time correction method.
4
Patent number 5,872,363.
5
Patent number 5,912,825.
6
Ron Jenkins, R. W. Gould, and Dale Gedcke, Quantitative X-Ray Spectrometry (New York: Marcel Dekker,
Inc.), 1981, pp. 266–267.
6
3
Page 14

DSPEC 50® and DSPEC 502® Digital Gamma-Ray Spectrometer User’s Manual 932502G / 0618
1.2. Ballistic Deficit and Adjusting the Flattop Duration
In germanium detectors it takes a variable amount of time to collect all of the charge released in
the detector diode when a gamma ray deposits energy in the detector. The duration of this charge
collection time depends on the dimensions of the detector, the geometry of the electrodes, and
the points at which energy is deposited in the detector. A small, planar detector has charge collection times that vary from 50 ns to 100 ns, whereas a large coaxial detector is characterized by
charge collection times that vary from 100 ns to 700 ns. The variability of the charge collection
time within a specific detector is the source of the resolution degradation described by the
ballistic deficit effect.
The ballistic deficit becomes a significant source of resolution degradation when very short
shaping times are selected in order to reduce dead time and improve the high counting-rate limit.
For a digital filter having the shape of a symmetrical triangle in the time domain, the output
pulse begins to rise as soon as the gamma ray is detected. It continues to rise until it reaches a
peak amplitude at a time specified by the currently selected rise/fall time (this is the Rise Time
parameter entered on the Amplifier 2 tab under Acquire/MCB Properties...; see Section 4.2).
Beyond this peak-amplitude time, the pulse falls back to the baseline to allow a subsequent
gamma ray to be processed. If all the charge has not been collected by the detector by the designated time for peak amplitude, there will be a deficit in the measured peak amplitude and a
broadening of the pulse width. The deficit in amplitude is called the ballistic deficit. Obviously,
events that result in a faster charge collection time will suffer less deficit and less increase in
pulse width than those yielding a slower charge collection time, even though the deposited
energy was identical. Thus, the ballistic deficit resulting from variable charge collection times
broadens the energy resolution for that gamma ray.
If the longest charge collection time is negligible compared to the rise time of the filter pulse, the
ballistic deficit will be imperceptible, and the energy resolution will not be degraded. Thus, at
the 10- to 20-ìs rise times typically selected for optimum signal-to-noise ratio (i.e., minimum
peak FWHM at low energies) the ballistic deficit problem can be ignored.
Long rise times create higher dead times and depress the maximum counting-rate limit. If it is
necessary to accept higher counting rates, the rise/fall times must be shortened accordingly. For
this case, the DSPEC 50 includes a flattop feature for the filter that can eliminate the resolution
broadening caused by ballistic deficit. Instead of a symmetrical triangle with a sharp point at the
peak amplitude, the rising and falling edges are separated by a flattop to form a trapezoid. The
width of the flattop is adjusted to be long enough to match the longest charge collection time for
the detector employed. This allows time for the longer-charge-collection pulses to reach the
same maximum pulse amplitude as the faster-charge-collection pulses from gamma rays of the
same energy. Consequently, the effect of ballistic deficit is reduced, and the energy resolution is
dramatically improved at these short pulse widths.
4
Page 15

932502G / 0618 1. INTRODUCTION
Note that the selection of shorter pulse widths inevitably degrades the signal-to-noise ratio compared to the optimum achieved at longer pulse widths. Thus, operating at shorter pulse widths
will compromise the energy resolution of low-energy gamma rays, for which the preamplifier
noise makes a significant contribution to the energy resolution. The signal-to-noise degradation
is independent of the ballistic deficit effect.
The flattop and other shaping controls are on the Amplifier 2 tab under Acquire/MCB
Properties...; see Section 4.2 for a more detailed discussion.
1.3. Resolution Enhancer Corrects for Charge Trapping
When a gamma ray interacts with a germanium detector, mobile electrons and holes are generated. The electrons and holes are swept to the detector electrodes by the electric field inside the
detector. If all the electrons and holes travel the complete path to the detector electrodes, a signal
is produced proportional to the energy deposited in the detector by the gamma ray. If some of the
electrons or holes do not reach the electrodes, the signal produced will be smaller than expected.
The process of interrupting the movement of an electron or hole is referred to as “charge
trapping.”
If charge trapping did not occur, the resolution of a reasonably low-noise germanium detector
for the 1.33-MeV gamma ray from 60Co would be about 1.5 keV FWHM. Real detectors typically have a resolution of 1.8 to 2.2 keV FWHM. ORTEC’s Charge Trapping Corrector (CTC)
helps reduce this energy resolution loss caused by charge trapping, yielding the DSPEC 50's
Resolution Enhancer Mode. The controls are accessed via the Acquire/MCB Properties... com-
mand in the accompanying MAESTRO
®
Multichannel Analyzer Emulation Software (A65-BW)
and other ORTEC CONNECTIONS compliant software packages.
Charge trapping is caused by various defects and impurities in the germanium crystal, and thus
varies from detector to detector. The amount of charge lost due to trapping also depends on the
distance the charge carrier (electron or hole) has to move to reach the collecting electrode. If the
carrier must travel a long distance, it is more likely to be trapped. If some of the charge is
trapped, it does not contribute to the signal. The reduced signals have a different rise time than
the full signals. The relationship between rise time of the signal and charge trapping is the basis
of the Charge Trapping Corrector.
The digital filter in the DSPEC 50 measures the amount of charge collected for each event and
uses the result to increment the spectrum memory location associated with that charge measurement. The Charge Trapping Corrector also measures the pulse rise time for the event. The pulse
rise time is used to adjust the very fine gain. For each pulse, the measured charge is increased by
the appropriate fine gain factor to correct for the signal lost due to carrier trapping.
5
Page 16
DSPEC 50® and DSPEC 502® Digital Gamma-Ray Spectrometer User’s Manual 932502G / 0618
1.4. Enhanced Throughput Mode
To optimally process an input pulse stream, and thereby obtain the best spectral resolution, the
signal processing device should allow the input signal to return to baseline before beginning to
process the subsequent pulse. However, in cases where some loss of resolution is acceptable, it
is possible for a DSP to begin processing a subsequent pulse before the first pulse has returned
to the baseline, provided the first pulse has returned to baseline when the peak-detect of the
second pulse occurs.
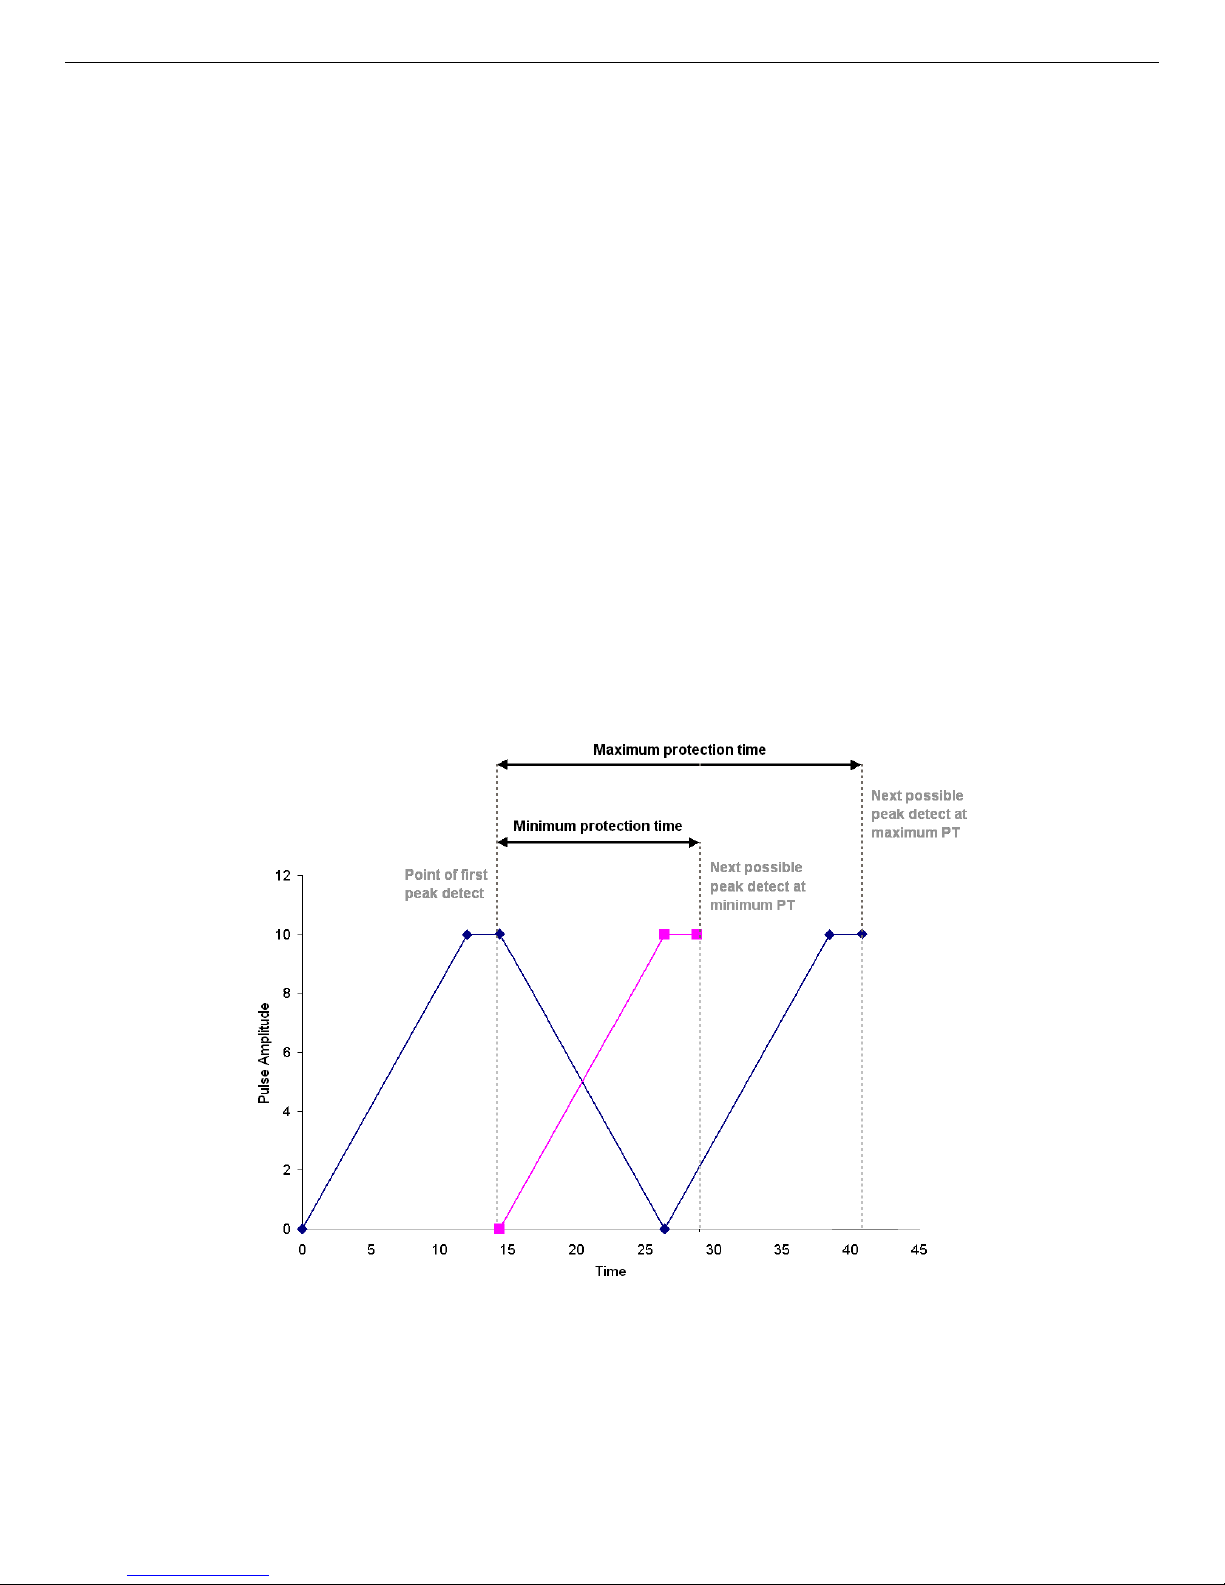
The ORTEC Enhanced Throughput Mode takes advantage of this feature of digital signal processing by allowing you to adjust the delay between the peak-detect and the start of processing
of the next pulse. The dead time for a conventionally processed pulse is the sum of the pulse’s
rise time, flattop, and fall time. By contrast, the dead time in ORTEC’s Enhanced Throughput
Mode can be as little as the rise time plus the flattop. These two scenarios are illustrated in
Fig. 1. The DSPEC 50 lets you set a protection time (PT), following a peak-detect, that blocks
subsequent peak-detects until the protection time has elapsed. Note that the conventional dead
time illustrated in Fig. 1 is the same as the maximum protection time in Enhanced Throughput Mode.
Figure 1. Demonstration of the DSPEC 50's Minimum and Maximum
Protection Times in Enhanced Throughput Mode. At the maximum
protection-time setting, the DSPEC 50 processes pulses in the
conventional way.
6
Page 17

932502G / 0618 1. INTRODUCTION
The protection-time settings with the low-frequency rejector (LFR) filter off range between:
! Minimum PT (highest throughput) = (1 × rise time) + (1 × flattop)
! Maximum PT = (2 × rise time) + (1 × flattop)
With LFR on, the protection-time settings range between:
! Minimum PT = (3 × rise time) + (2 × flattop)
! Maximum PT = (6 × rise time) + (3 × flattop)
1.5. The Low Frequency Rejector (LFR) Filter
In designing an MCB that can be used in conjunction with mechanical coolers, ORTEC has
developed a new digital filter, the Low Frequency Rejector (LFR) filter, capable of correcting
the pulse output signal for changes in the baseline caused by cooler-induced microphonics. In
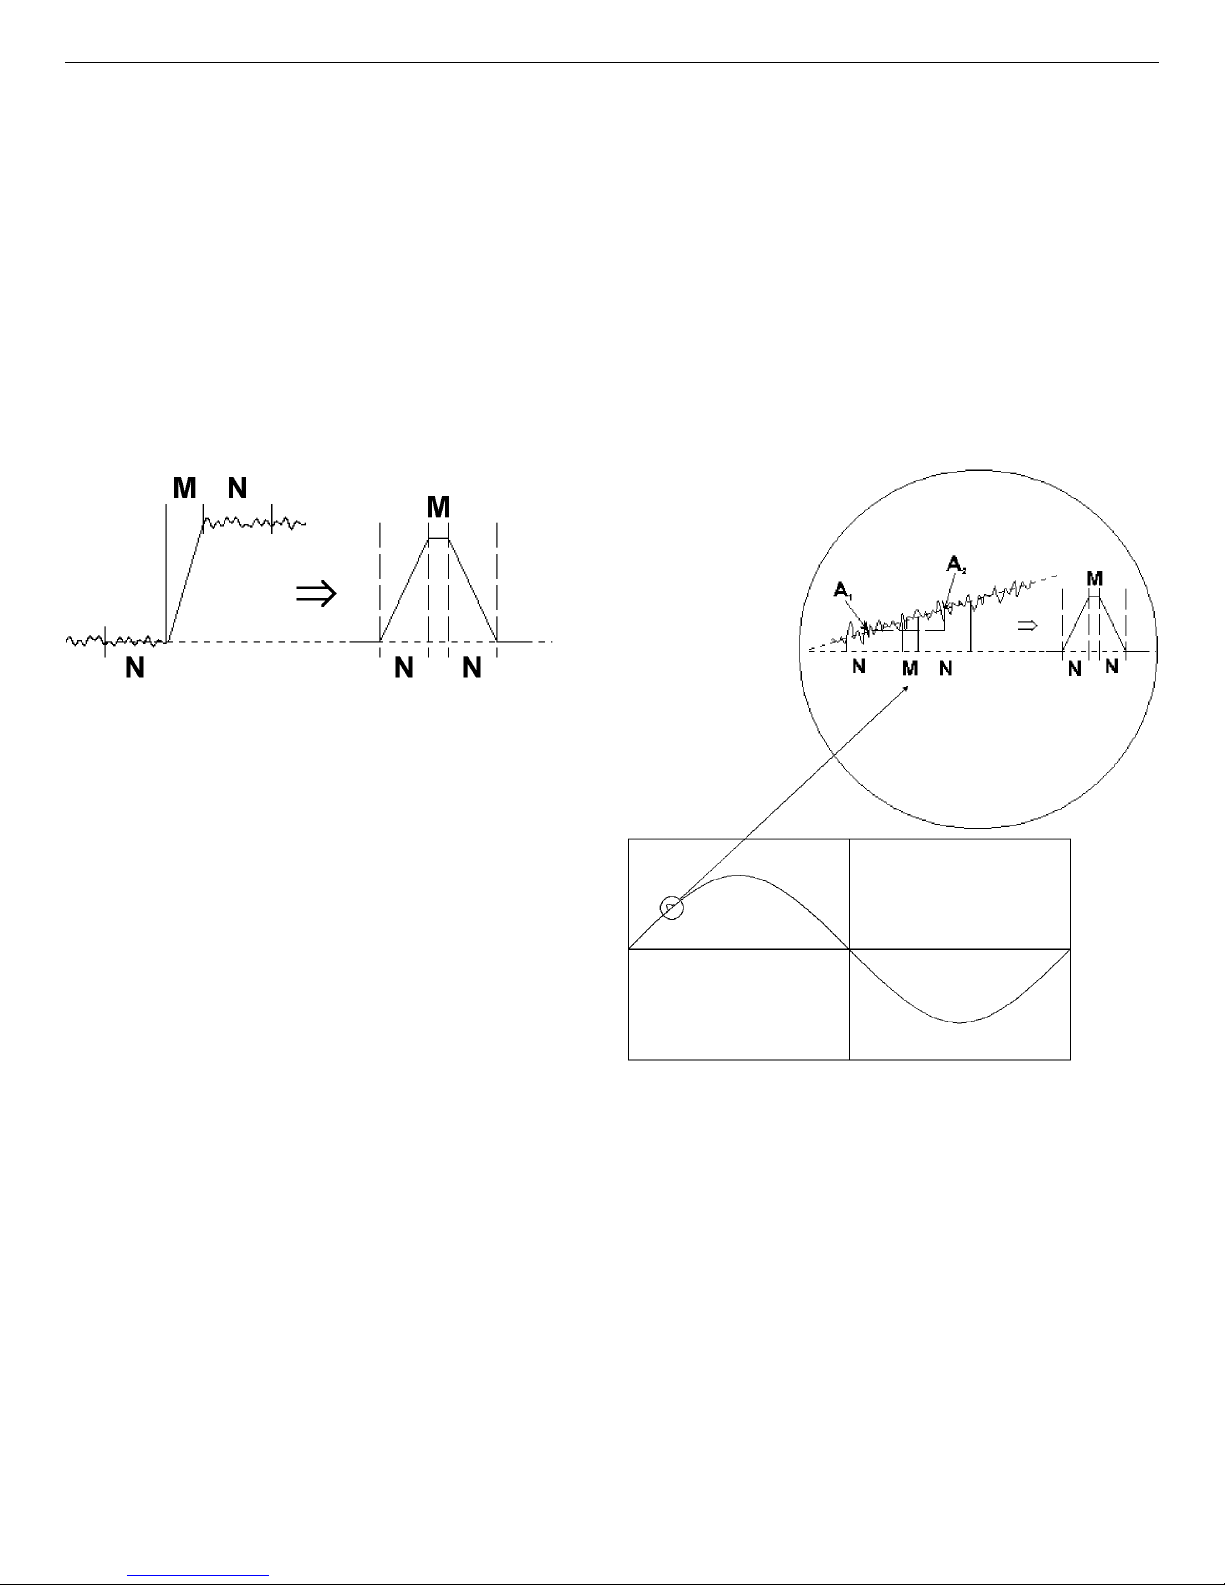
many ways digital filters are easier to understand than their analog counterparts. Figure 2 shows
the voltage step output produced at the preamplifier by the collection of charge produced by
absorption of a gamma-ray and the resulting trapezoidal weighting function in a digital spectrometer. The difficulty in the measurement is to precisely determine the height of the step pulse
because the baseline contains noise. A fairly obvious estimate of the step signal is obtained by
averaging the digitized samples of the signal before and after the step. M samples immediately
after the event are first ignored, to allow for a maximum rise time of M times the sample interval. N samples of the baseline prior to the step pulse are averaged and then subtracted from the
average of N samples taken after the step pulse. This simple procedure produces a trapezoidal
weighting function with a rise time of N sample intervals and a flattop of M sample intervals.
The maximum value of the trapezoid output, occurring at the end of the flattop, is the best estimate of the step height and therefore the gamma-ray energy. With a proper selection of M and N,
this filter is very nearly the optimum filter for a system with noise arising only from the detector
leakage (parallel noise) and the FET current (series noise).
The trapezoidal filter is essentially independent of dc offsets, since the averaging and subtracting
removes the dc component of the signal. Unfortunately, it is just as sensitive as analog filters to
slowly varying signals such as those produced in microphonic noise. Figure 2 shows the output
of the trapezoidal filter is equal to the slope of the baseline signal multiplied by the full width at
half maximum (FWHM) of the trapezoid. If a step pulse were to be measured on such a baseline, the filter output value would be too great by an error equal to the difference between the
average values A1 and A2. Since the microphonic noise component in a signal is approximately
a sine wave, as illustrated in Fig. 3, the error induced can be positive, negative, or zero. This
error signal adds to the width of the spectral lines, appearing as degraded resolution performance
from the detector, and can in many cases be a dominant noise source, especially at lower
energies.
7
Page 18
DSPEC 50® and DSPEC 502® Digital Gamma-Ray Spectrometer User’s Manual 932502G / 0618
The ORTEC LFR filter removes most of the microphonic noise by estimating the microphonicinduced error signal on a pulse-by-pulse basis and subtracting the estimated error signal from the
trapezoid output. As noted above, the error signal is proportional to the slope of the baseline during the energy measurement. If the slope is known, then so is the error introduced by the microphonics. An excellent estimate of the slope can be obtained by using the trapezoidal filter itself
to measure the slope both before and after the energy measurement. Since the digital filter is
always sampling the input signal, it is only necessary to store (1) the values measured before the
event is detected, (2) the gamma-ray energy measurement, and (3) the values measured after the
event is detected. The modified trapezoidal digital filter for LFR from an InSight Virtual
Oscilloscope trace is shown in Fig. 4.
Figure 2. Typical Trapezoidal Weighting
Function (right) Arising from Detector
Preamplifier Output Signal (left).
Figure 3. Example of Weighting Function Output
Resulting from the Positive Slope Due to LowFrequency Noise (shown as a sine wave).
A suitably weighted and averaged value of the before and after slope measurement is then subtracted from the energy measurement producing a measurement essentially free of microphonic
noise. Although the inherent increase in the pulse processing time increases the dead time of the
system, the resolution can be greatly enhanced when periodic noise is present.
To switch to LFR mode, click the Amplifier PRO tab under Acquire/MCB Properties..., and
mark the Low Frequency Rejector checkbox (see Section 4.3). Note that you cannot optimize
8
Page 19

932502G / 0618 1. INTRODUCTION
or pole zero the DSPEC 50 while in LFR mode. The Optimize feature should be used with the
LFR filter off (checkbox unmarked). Subsequent measurements can then be taken with the LFR
filter on.
Figure 4. LFR-Enabled Digital Filter.
1.6. Zero Dead-Time (ZDT) Mode
An extended live-time clock increases the collection time (real time) of the acquisition to correct
for input pulse train losses incurred during acquisition due to system dead time. This corrected
time value, known as the live time, is then used to determine the net peak count rates necessary
to determine nuclide activities.
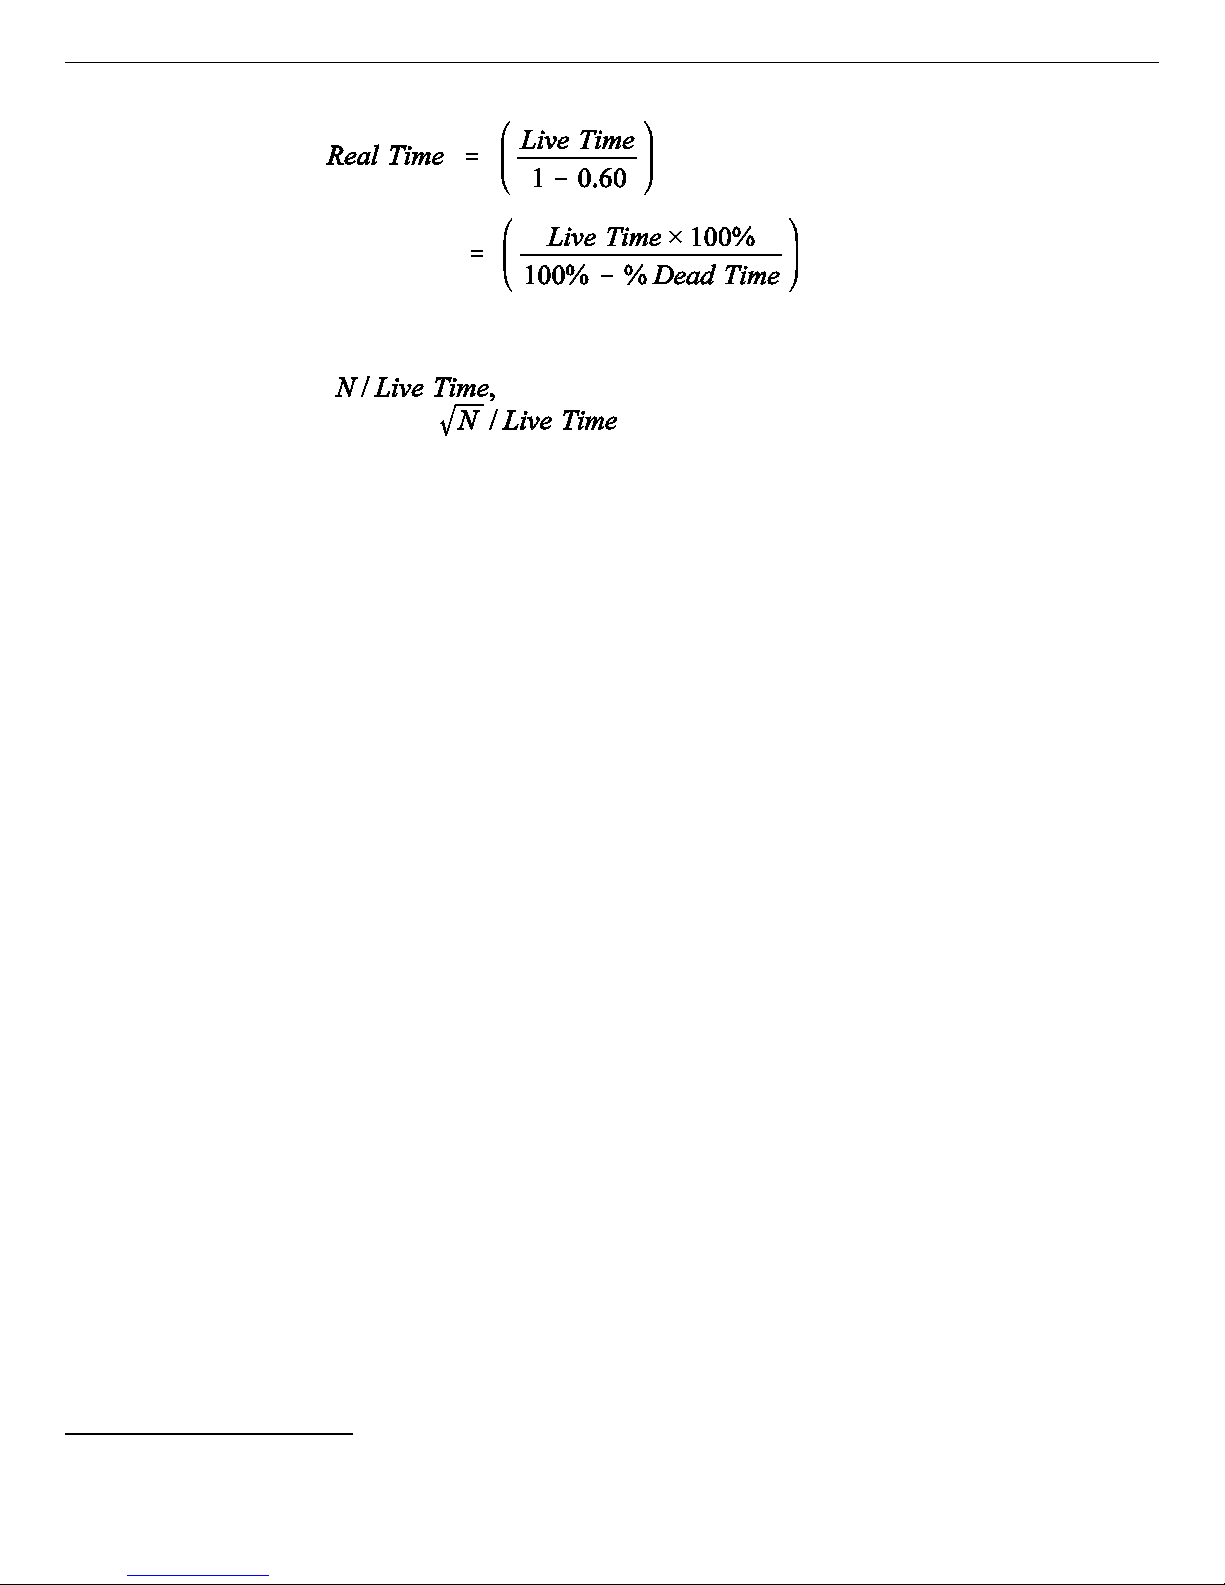
As an example, consider the case where the spectrometry amplifier and ADC are 60% dead
during the acquisition. the elapsed real time will be:
9
Page 20
DSPEC 50® and DSPEC 502® Digital Gamma-Ray Spectrometer User’s Manual 932502G / 0618
If the N counts in the gamma-ray peak in the spectrum are divided by the elapsed live time, the
resulting counting rate, is now corrected for dead-time losses. The standard
deviation in that counting rate is .
Unfortunately, extending the counting time to make up for losses due to system-busy results in
an incorrect result if the gamma-ray flux is changing as a function of time. If an isotope with a
very short half-life is placed in front of the detector, the spectrometer might start out with a very
high dead time, but the isotope will decay during the count and the dead time will be zero by the
end of the count. If the spectrometer extends the counting time to make up for the lost counts, it
will no longer be counting the same source as when the losses occurred. As a result, the number
of counts in the peak will not be correct.
When a supported ORTEC MCB operates in ZDT
7
mode, it adjusts for the dead-time losses by
taking very short acquisitions and applying a correction in real time — that is, as the data are
coming in — to the number of counts in the spectrum. This technique allows the gamma-ray flux
to change while the acquisition is in progress, yet the total counts recorded in each of the peaks
are correct. The resulting spectrum has no dead time at all — in ZDT mode, the data are corrected, not the acquisition time. Thus, the net counts in a peak are divided by the real time to
determine the count rate.
ZDT mode has a unique feature in that it can store both the corrected spectrum and the uncorrected spectrum, or the corrected spectrum and the uncertainty spectrum. Therefore, supported
MCBs allow you to choose between three ZDT Mode settings on the ADC tab under MCB
Properties...: Off, NORM_CORR, and CORR_ERR.
Table 1 shows which spectra are collected in the three possible ZDT modes.
1.6.1. Off — Uncorrected Spectrum Only
In this mode, only the uncorrected spectrum (live time and real time with dead-time losses) —
also called the live-time-corrected or LTC spectrum — is collected and stored in the .SPC file.
The LTC spectrum can be used to determine exactly how many pulses at any energy were
7
Patent number 6,327,549.
10
Page 21

932502G / 0618 1. INTRODUCTION
Table 1. ZDT Modes.
Mode Uncorrected
Off (ZDT Disabled)
NORM_CORR (ZDT–LTC Mode)
CORR_ERR (ZDT–ERR Mode)
Spectrum
Yes No No
Yes Yes No
No Yes Yes
ZDT Corrected
Spectrum
ZDT Error
Spectrum
processed by the spectrometer. The corrected spectrum gives the best estimate of the total counts
that would have been in the peak if the system were free of dead-time effects. The uncertainty
spectrum can be used to calculate the counting uncertainty, channel by channel, in the corrected
spectrum.
NOTE When the spectrometer is placed in ZDT mode, the throughput of the instrument is
reduced somewhat as extra processing must be done on the spectrum; therefore, if the
gamma-ray flux is not changing as a function of time, but absolute highest throughput
is desirable, you might wish to store only the LTC spectrum in the MCB memory.
1.6.2. NORM_CORR — ZDT and Uncorrected Spectra Stored
When the ZDT mode is set to NORM_CORR, the two spectra stored are the LTC spectrum and
the ZDT spectrum (corrected for the dead-time losses; real time only). Unfortunately, in the
analysis of the ZDT spectrum, the uncertainty of the measurement cannot be determined using
either spectrum.
NOTE This mode is not useful for quantitative analysis if the counting rate varies significantly
during the measurement time, particularly if the user desires an accurate counting rate
and standard deviation calculation. When you select the NORM_CORR mode, ORTEC
spectroscopy applications such as GammaVision® and ISOTOPIC ignores the ZDT
spectrum and analyzes the LTC spectrum as it would for the Off ZDT mode.
1.6.3. CORR_ERR — ZDT and Error Spectra Stored
In the CORR_ERR mode, the estimation of the statistical uncertainty is stored in place of the
LTC spectrum, and is referred to as the error spectrum (ERR). In this mode, the ZDT spectrum
is used to measure the counts in a peak, and the error spectrum is used to determine the uncertainty of the measurement made in the corrected spectrum.
For example, if the area of a peak is measured in the corrected spectrum by summing channels
1000 to 1100, the variance of the measurement can be determined by summing the counts in
channels 1000 to 1100 in the error spectrum. Or, shown another way, the counts in channel i can
11
Page 22
DSPEC 50® and DSPEC 502® Digital Gamma-Ray Spectrometer User’s Manual 932502G / 0618
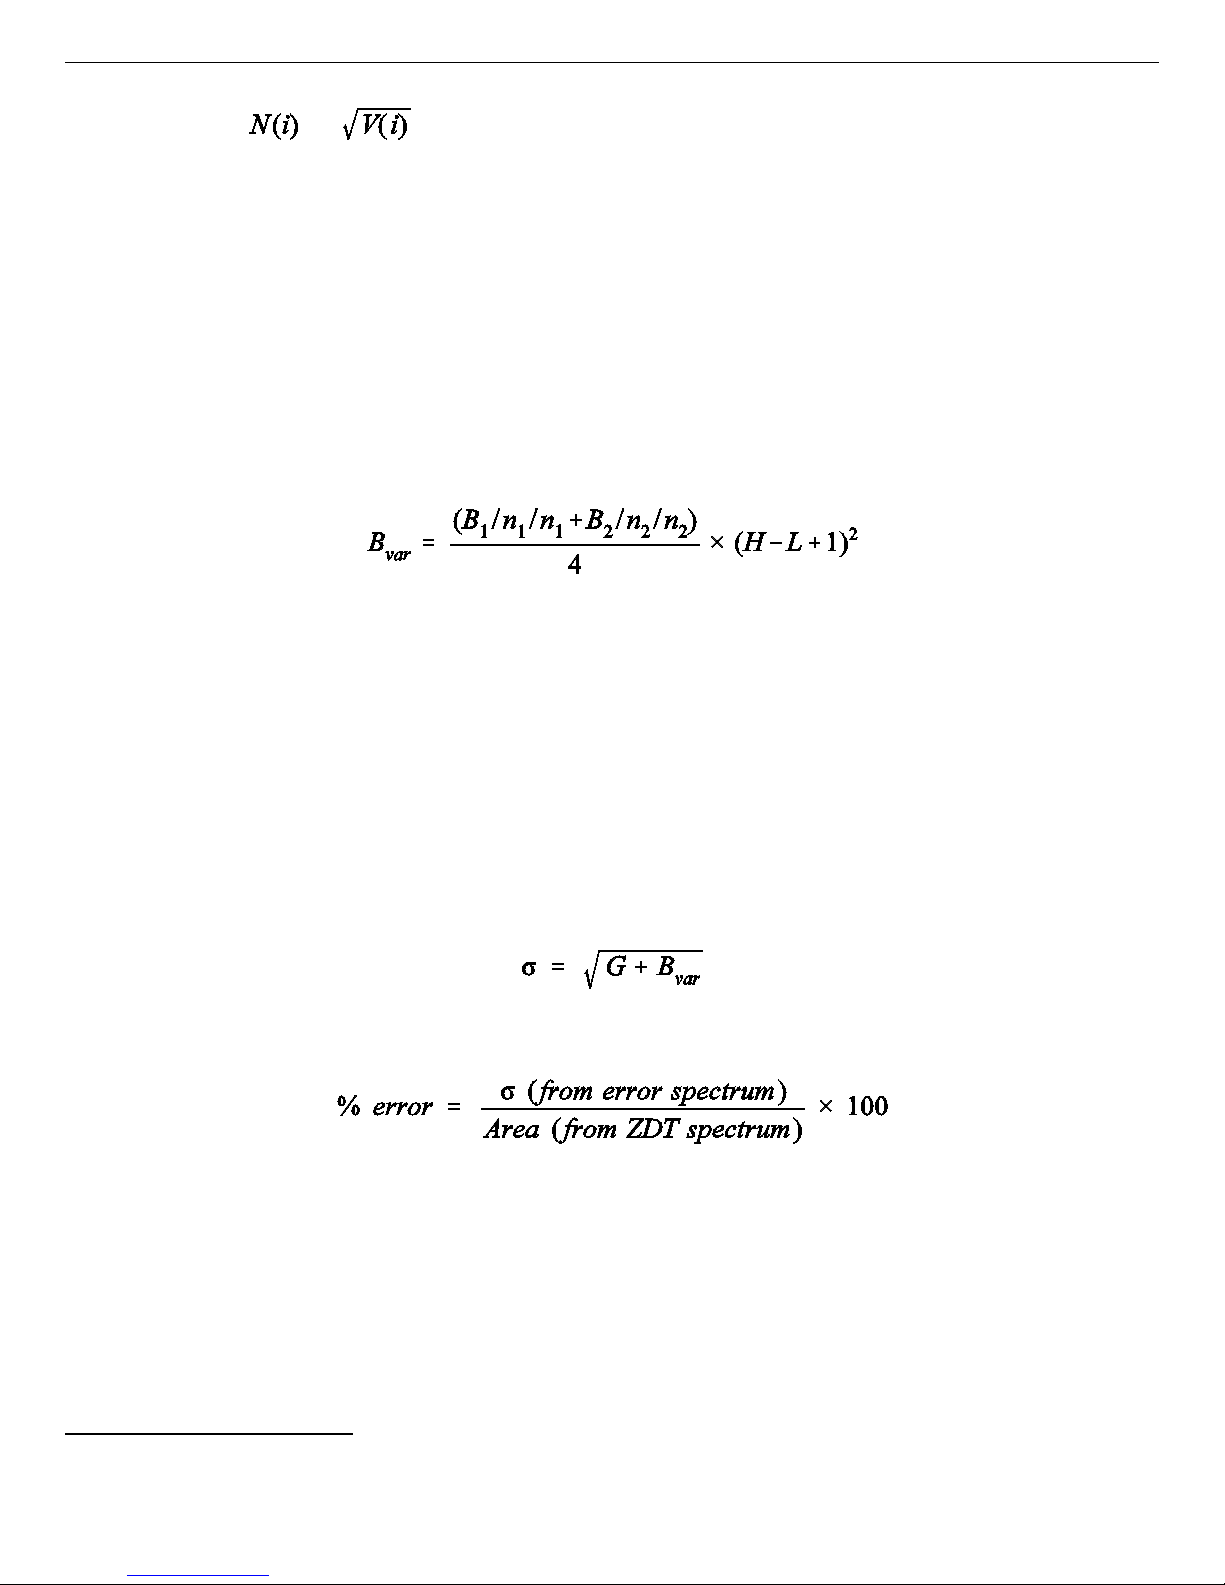
be expressed as ± with a 1-sigma confidence limit, where N is the corrected
spectral data and V is the variance (error) spectral data.
The live time is set to the real time within the analysis engine during the analysis of ZDT
spectra.
8
A CORR_ERR spectrum is analyzed
as a regular spectrum most of the time, with a few
exceptions as listed below.
! To calculate the peak area uncertainty, the error spectrum is used. If the peak limits are
from L and H channels, then the background variance is calculated as:
where:
B
= sum of background counts for the channels adjacent to the peak start (low-
1
energy) channel L
B
= sum of background counts for the channels adjacent to the peak end (high-
2
energy) channel H
n
= the number of low background points (n1 = 1, 3, or 5) used
1
n
= the number of high background points (n2 = 1, 3, or 5) used
2
The peak area uncertainty is calculated from:
where G is the sum of counts, from the error spectrum, from channels L to H.
! In our WAN and ISOWAN analysis engines, the peak-fitting routine fits all the library
peaks as singlets to calculate the peak centroid, peak start and end channels, and peak
background. A linear background under the peak is assumed during the peak fitting
process.
8
Using our gamma-ray spectrum analysis software such as GammaVision® or ISOTOPIC.
12
Page 23

932502G / 0618 1. INTRODUCTION
! The error spectrum is always used to calculate the uncertainties of counts whenever
needed. For example, if peak deconvolution is needed, the error spectrum is used to find
the best fit for the peak background.
1.6.4. Choosing a ZDT Mode
When the counting rate is essentially constant during the time required to acquire the spectrum,
the standard mode — ZDT Off — is the preferred mode; only the uncorrected spectrum is
collected and stored in the spectrum file. But, if the counting rate varies significantly during the
measurement time, the standard mode will not yield the proper dead-time-corrected counting
rate. This can be most easily understood by noting that the uncorrected mode compensates for
dead-time losses by extending the real counting time. Hence a sample containing both a shortlived high-activity isotope and a long-lifetime lower-activity isotope will experience very high
dead-time losses during the first few seconds of the measurement, as the short-lifetime isotope
decays rapidly. This high dead time will cause the counting time to be extended after the shortlived isotope has decayed to zero activity, and the system will count the low-activity isotope for
the extra time. Consequently, the average activity of the short-lived isotope will be underestimated.
If you anticipate significantly varying counting rates during the time taken to acquire the
spectrum, the CORR_ERR ZDT mode should be used. The CORR_ERR mode corrects for
dead-time losses over minuscule time intervals by adding counts to the ZDT spectrum in proportion to the instantaneous ratio of real time to live time. Thus, the dead-time correction can
correctly track rapidly changing counting rates. The CORR_ERR mode should be used whenever the counting rate might change significantly during the measurement time. In addition to
the rapidly-decaying isotope example above, the CORR_ERR mode should be used when
monitoring cooling water flow from a nuclear reactor. The CORR_ERR mode accommodates
brief bursts of high-activity in the water flowing past the gamma-ray detector. Both the corrected
and error spectra are stored in the resulting spectrum file.
Note that the counts in the ZDT spectrum must be divided by the elapsed REAL time to compute
the dead-time corrected counting rate. It is important to note that the standard deviation in the
counts in a gamma-ray peak in the ZDT spectrum is not . Instead the standard
N
ZDT
deviation is obtained from the N
counts in the same peak ROI in the accompanying error
ERR
spectrum. The standard deviation in this case is . And the standard deviation in the
computed counting rate, , is .
13
Page 24

DSPEC 50® and DSPEC 502® Digital Gamma-Ray Spectrometer User’s Manual 932502G / 0618
1.6.4.1. The NORM_CORR Diagnostic Mode
Why is there a NORM_CORR mode, and why should you avoid using it? This mode simultaneously collects the ZDT spectrum and the conventional uncorrected spectrum. It is useful for
demonstrating that the counts in the uncorrected spectrum divided by the live time is the same
counting rate as the counts in the ZDT spectrum divided by the real time, in the special case of
constant counting rate. Because the error spectrum is not collected in NORM_CORR mode, the
standard deviation in the ZDT counts cannot be calculated if the counting rate is varying. GammaVision and ISOTOPIC provide some protection for users if the ZDT-LTC mode is inadvertently selected. In this case, ISOTOPIC ignores the ZDT spectrum and presumes you intended to
use the uncorrected spectrum in a constant-counting-rate application.
1.6.4.2. To Summarize
Use the ZDT Off mode when the counting rate is expected to be constant during the time
taken to acquire the spectrum.
Use the ZDT CORR_ERR mode when the counting rate is expected to change or might
change significantly during the time required to acquire the spectrum.
Avoid using the NORM_CORR mode because ISOTOPIC v4 will default to analyzing
the LTC spectrum and will ignore the ZDT spectrum.
More Information
For more detailed information, contact your ORTEC representative or go to our website at
www.ortec-online.com.
! Application note AN56, “Loss Free Counting with Uncertainty Analysis Using ORTEC’s
Innovative Zero Dead Time Technique.”
! General gamma spectroscopy technical papers in our online publication Library.
1.7. Host Computer and Software Requirements
®
The DSPEC 50 operates on any computer running under Microsoft
Windows
Professional SP3 when used with CONNECTIONS v9 or higher, and an ORTEC spectroscopy
application such as MAESTRO or GammaVision. The DSPEC 50A or 502A may also be
controlled through the Web interface, which is not Windows as described in Section 5.
®
10, 8, 7, or XP
14
Page 25

932502G / 0618 1. INTRODUCTION
1.8. About This Manual
This manual describes the DSPEC 50 including its touchscreen interface, communication
configuration, and connections in a complete spectroscopy system; provides instructions on
configuring the hardware settings (such as high voltage, presets, and gain); and includes the
firmware commands and responses. Features associated only with the Advanced models
(DSPEC 50A and DSPEC 502A) are identified in the respective sections of this manual.
Complete details on using the control software are in the accompanying MAESTRO Software
®
User’s Manual as well as the manuals for GammaVision
MCA emulator/analysis software.
NOTE Except as noted, when we refer to MAESTRO in this manual, we mean the ORTEC
MCA emulator or spectrum analysis application you are using (i.e., MAESTRO,
GammaVision, ISOTOPIC, etc.).
, ISOTOPIC, and our other integrated
15
Page 26

DSPEC 50® and DSPEC 502® Digital Gamma-Ray Spectrometer User’s Manual 932502G / 0618
[Intentionally blank]
16
Page 27

2. THE DSPEC 50
This chapter discusses the front panel power switch and touchscreen interface (Section 2.1); and
the rear-panel connectors (Section 2.2).
2.1. Front Panel
Figure 5 shows the DSPEC 50 front panel, which includes the ON/OFF rocker switch and the
800 × 480 pixel color touchscreen.
Figure 5. The DSPEC 50.
2.1.1. The ON/OFF Switch and Power-Up
On power-up, the DSPEC 50's integrated computer initializes and automatically starts the
DSPEC 50 software application at the Switchboard screen (discussed below). This typically
takes 20–30 seconds.
2.1.2. The Touchscreen Interface
The touchscreen interface includes:
! The Switchboard screen, from which you can open two control screens and four data
display screens. The DSPEC 502 Switchboard displays two banks of four data display
screens, one per MCA; this is shown in Fig. 6.
— To view a control or data display screen, tap its thumbnail. It will remain displayed
until you manually return to the Switchboard. To return from a control screen, tap
Apply. To return from a data display screen, tap anywhere on the screen.
17
Page 28

DSPEC 50® and DSPEC 502® Digital Gamma-Ray Spectrometer User’s Manual 932502G / 0618
Figure 6. The DSPEC 502 Switchboard (showing the two banks of data display
thumbnails for MCA-1 and MCA-2).
— If the Switchboard is displayed for >5 seconds, it begins cycling through the four (or
two sets of four) data display screens
9
(see Section 2.1.3).
! Two interactive control screens:
— Communication Control Use this screen to change how the
data and time are displayed, assign a password to limit access to
this screen and the Display Control screen; and assign static IP
addresses to multiple DSPEC 50s where required (typically not
necessary); see Section 2.1.4.
— Display Control (Status Setup) This screen controls the display,
display order, and display interval of the touchscreen graphics; see
Section 2.1.3.
! Four data display screens (per MCA; i.e., two banks of four for the DSPEC 502) that
provide real-time system and data acquisition status. These allow you to monitor several
key data acquisition parameters at a glance, without referring to the computer. The four
data display screens — Gauges, Chart, Spectrum, and Big Numbers — are discussed
in Section 2.1.5.
9
Plus any user-added images; see page 19.
18
Page 29

932502G / 0618 2. THE DSPEC 50
2.1.3. The Display Control Screen (Status Screen Setup)
Tapping the yellow “multi-screen” thumbnail opens the screen shown in Fig. 7, which allows
you to display or hide the four data display screens and up to nine .JPG-format images of your
choice; control the display order of the images; determine the display interval; and import .JPG
images via the rear-panel SD slot.
Figure 7. Control The Display of Status Screens.
To turn a screen on or off, tap its name (the name will enlarge), then tap the On/Off button. To
change a screen’s display order, tap it, then tap the Up and Down buttons as needed to reposition it. Tap Scroll to move up and down through the list of screens. Tap Time+ and Time! to
change the screen display interval.
The DSPEC 502 has two sets of the four data display screens, identified here with a suffix of
MCA-1 or MCA-2.
Tap Apply to accept any changes and return to the Switchboard. Tap Cancel to return to the
Switchboard without any changes. Tap Default to turn all screens on, and restore them to the
factory order and display interval.
2.1.3.1. Import Photos from SD Card
You can import a maximum of nine .JPG images. They must be named DS50Photo#.jpg, where
# is from 1 to 9. Copy the images to an SD card, orient the card with the contacts facing up,
19
Page 30

DSPEC 50® and DSPEC 502® Digital Gamma-Ray Spectrometer User’s Manual 932502G / 0618
gently click the card into the slot, and tap Import Photos from SD Card. A status message will
ask you to confirm file overwrites, and will report the number of files transferred. These images
can be turned on/off and repositioned in the display sequence just like the data display screens.
2.1.4. The Communication Control Screen
This screen lets you password-protect the Communication and Display Control screens, choose
your preferred date and time formats, and optionally assign a static IP address to an Ethernetconnected unit. Tap the yellow “wrench” thumbnail to access it (Fig. 8). If a password is in
effect, a password screen with soft keyboard will open; tap the password and OK.
The upper-left Host name is factory-assigned. The MAC address is unique to the Ethernet
adapter and can be used to trouble-shoot network connection issues. The Advanced models will
also display the Web Page address (IP address/ORTEC) under the MAC address. The lower
right section of the screen shows the DSPEC 50 software and firmware version numbers, and the
serial number for each MCA board in the chassis.
The dynamic or static IP address assigned to the Ethernet port is displayed in the upper-right
corner. To assign a static IP address, see Appendix A.
To return to the Switchboard without making any changes, tap Cancel.
Figure 8. The Communication Control Screen.
20
Page 31

932502G / 0618 2. THE DSPEC 50
2.1.4.1. Set Password
This options lets you set a password to discourage accidental changes to the settings on the
Communication Control and Data Display screens. You must re-enter the password each time
you attempt to access either screen. Note that you can also block changes to data acquisition
settings, spectrum deletion, etc., with the password feature in MAESTRO; see Section 4.7 and
the MAESTRO user manual.
To set the password:
! Tap the Set Password button to open the soft keyboard shown in Fig. 9. Passwords can
be any length, and any combination of uppercase and lowercase letters, and numbers.
Figure 9. Set or Change Password.
! Enter and reenter the new password. Tap OK to accept the new password or Cancel to
exit the screen with no change. The password goes into effect immediately. When you try
to access either of the setup screens, the password screen will be presented first. Enter the
password and tap OK.
To remove the password:
! Tap Set Password to open the password screen, then simply tap OK. This will
immediately remove the password and return you to Communication Settings screen.
21
Page 32

DSPEC 50® and DSPEC 502® Digital Gamma-Ray Spectrometer User’s Manual 932502G / 0618
If you forget the password:
! See the reset instructions in Section B.3.
2.1.4.2. Regional Settings...
This accesses the DSPEC 50 computer’s Windows Mobile regional settings utility. (You may
wish to use a touchscreen stylus to change these settings.) Tap Regional Settings, choose the
desired locale, and tap OK. This will return you to the Communication Control screen. Tap
Apply to put the new settings into effect and return to the Switchboard.
To modify the settings for the current locale, tap Customize. The locale list does not include Far
East settings; choose a locale and customize the settings as needed. For additional information,
refer to the Microsoft website.
2.1.5. The Data Display Screens
Each MCA in the chassis has four data display screens that track various data acquisition
parameters in real time. All four display the following:
! The current time (Now); the start time for the current or most recent acquisition
(Started); and, at the end of acquisition, the stop time of the most recent acquisition
(Finish).
! A red HV Off indicator ( ) when the bias is off.
! A bright background when data acquisition is in progress, and a neutral background
when acquisition is stopped.
In addition, the two sets of four DSPEC 502 screens are labeled MCA-1 and MCA-2 so you can
easily tell which input is currently being displayed.
Use the Display Control screen to display/hide these screens, and set the display order and
display interval (Section 2.1.3).
2.1.5.1. The Gauges Screen
This screen gives you a “heads-up” display of % of preset remaining, Dead time %, and Input
count rate in cps. Below each gauges is a corresponding text readout (except that no matter the
type of preset used, the left-side text readout shows the live time, LT).
When no presets are defined, the % Preset gauge remains at zero and the LT text readout shows
the current live-time count.
22
Page 33

932502G / 0618 2. THE DSPEC 50
When counting to a preset, the % Preset readout tracks progress, then remains in its final position at the end of acquisition (100% if the preset counted to completion, <100% if the count was
manually halted before the preset was reached).
Figures 10 and 11 respectively illustrate the Gauges screen during and after a data acquisition.
Note that the % of preset gauge in Fig. 10 shows that about 33% of the preset has elapsed. Also,
the Dead time % gauge and readout, as well as the bright screen background, reflect that a
count is in progress. By contrast, in Fig. 11, the 100% reading on the % of preset gauge indicates the preset condition has been met; and the neutral background and 0% dead time indicate
acquisition has stopped.
Figure 10. The Gauges Screen During Data Acquisition.
23
Page 34

DSPEC 50® and DSPEC 502® Digital Gamma-Ray Spectrometer User’s Manual 932502G / 0618
Figure 11. The Gauges Screen, Preset Reached and Acquisition Halted.
2.1.5.2. The Chart Screen
Figure 12 illustrates the Chart screen, which presents “virtual strip-charts” of the current input
count rate and % dead time. If the gain and/or zero stabilizers are enabled (Section 4.5), their
current % correction is also displayed. In addition; the Now/Started/Finish readouts are
shown at the bottom of the screen.
Figure 12. The Chart Screen With Gain Stabilizer Chart.
24
Page 35

932502G / 0618 2. THE DSPEC 50
2.1.5.3. The Spectrum Screen
This screen (Fig. 13) displays the spectrum for the current or most recently acquired spectrum.
Figure 13. Spectrum Screen (Nuclide Report ROIs are yellow with activity
readouts below spectrum; “standard” MAESTRO ROIs are orange with no
readouts).
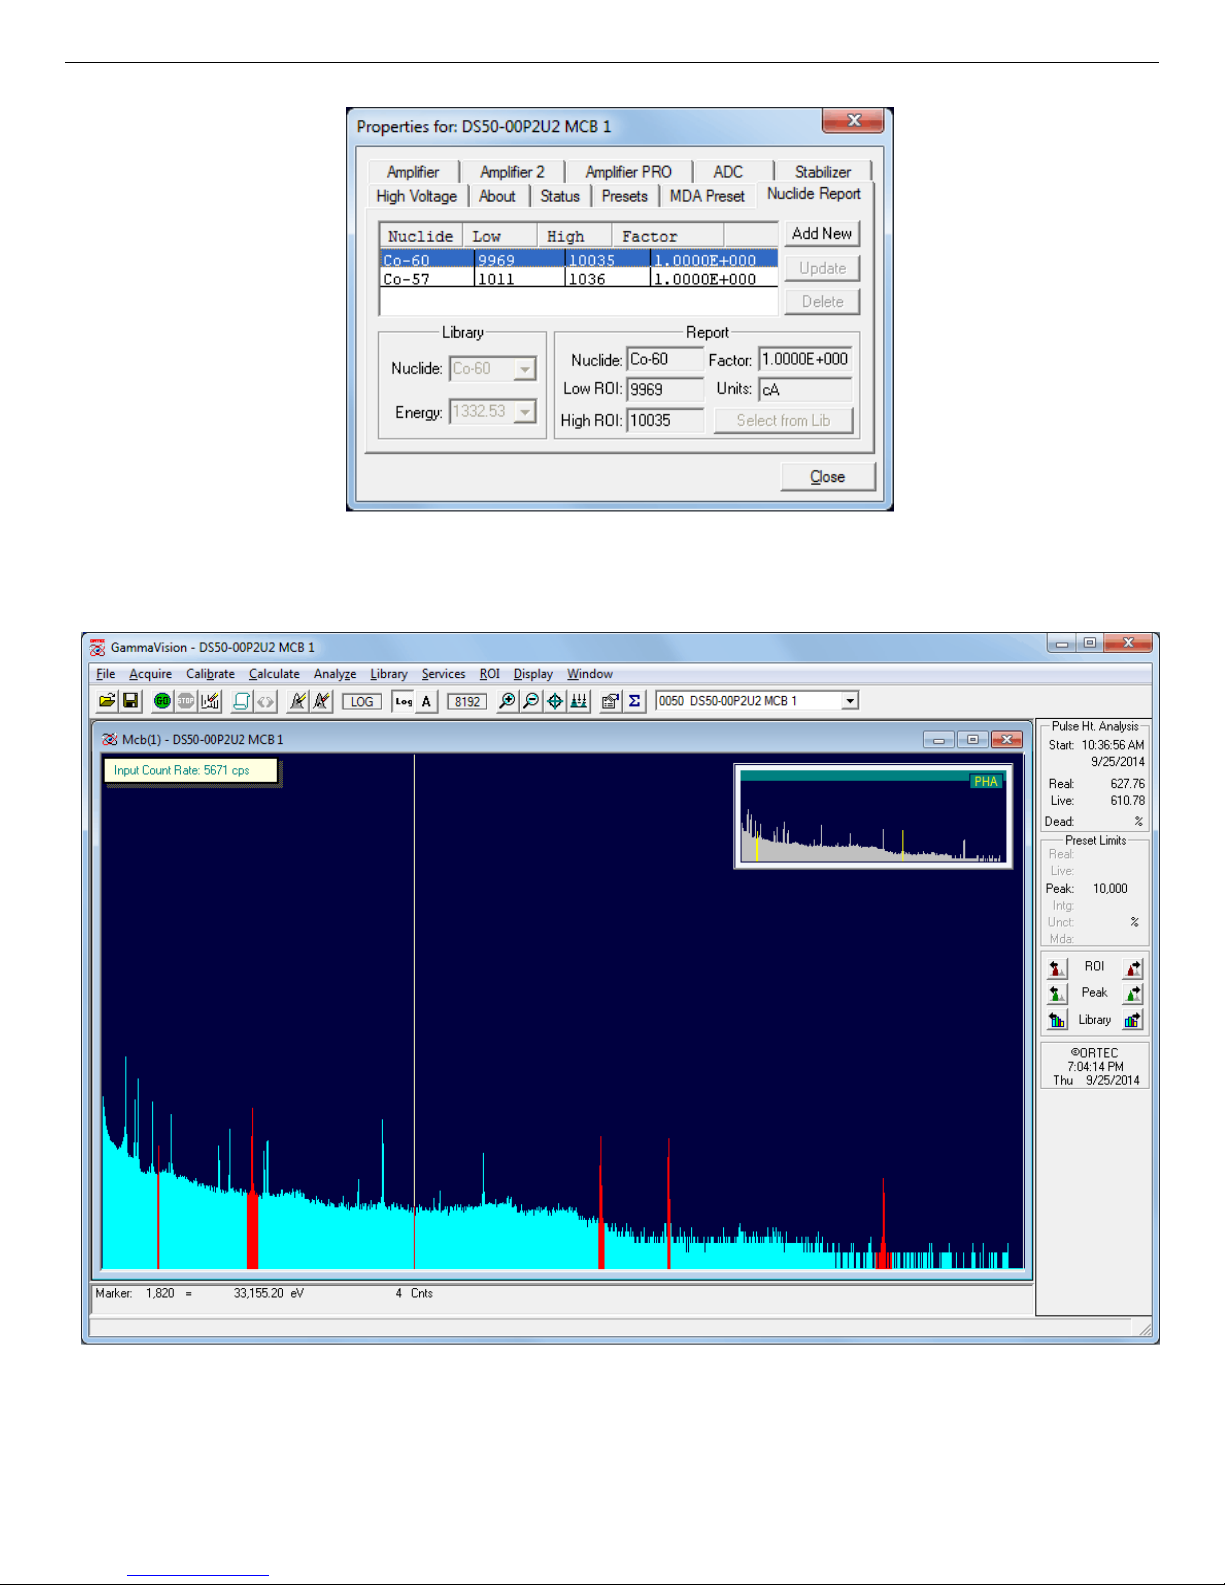
If any Nuclide Report ROIs have been defined (see Section 4.11), the two lowest-energy ROIs
are marked with a yellow background, and an activity readout for each is displayed below the
histogram. See the two yellow ROIs in Fig. 13. Figure 14 shows the Nuclide Report setup tab
for these two ROIs.
If “standard” ROIs have been defined in an ORTEC spectroscopy application, using the commands on the ROI menu, they are indicated with an orange background on the DSPEC 50
spectrum screen. See the three orange ROIs in Fig. 13 and refer to the ROI Mark command in
the software user manual.
For comparison to the Spectrum screen, Fig. 15 shows the corresponding spectrum and
“standard” ROIs in GammaVision.
25
Page 36
DSPEC 50® and DSPEC 502® Digital Gamma-Ray Spectrometer User’s Manual 932502G / 0618
Figure 14. Two Nuclide Report ROIs Defined.
Figure 15. The Spectrum in GammaVision (showing “standard” ROIs).
26
Page 37

932502G / 0618 2. THE DSPEC 50
2.1.5.4. The Big Numbers Screen
The Big Numbers screen makes the current data acquisition status highly visible, even from
across the counting lab. Note the HV Off indicator on the bottom right of Fig. 16.
Figure 16. The High-Visibility “Big Numbers” Screen, Showing the HV Off
Indicator.
2.2. Rear Panel
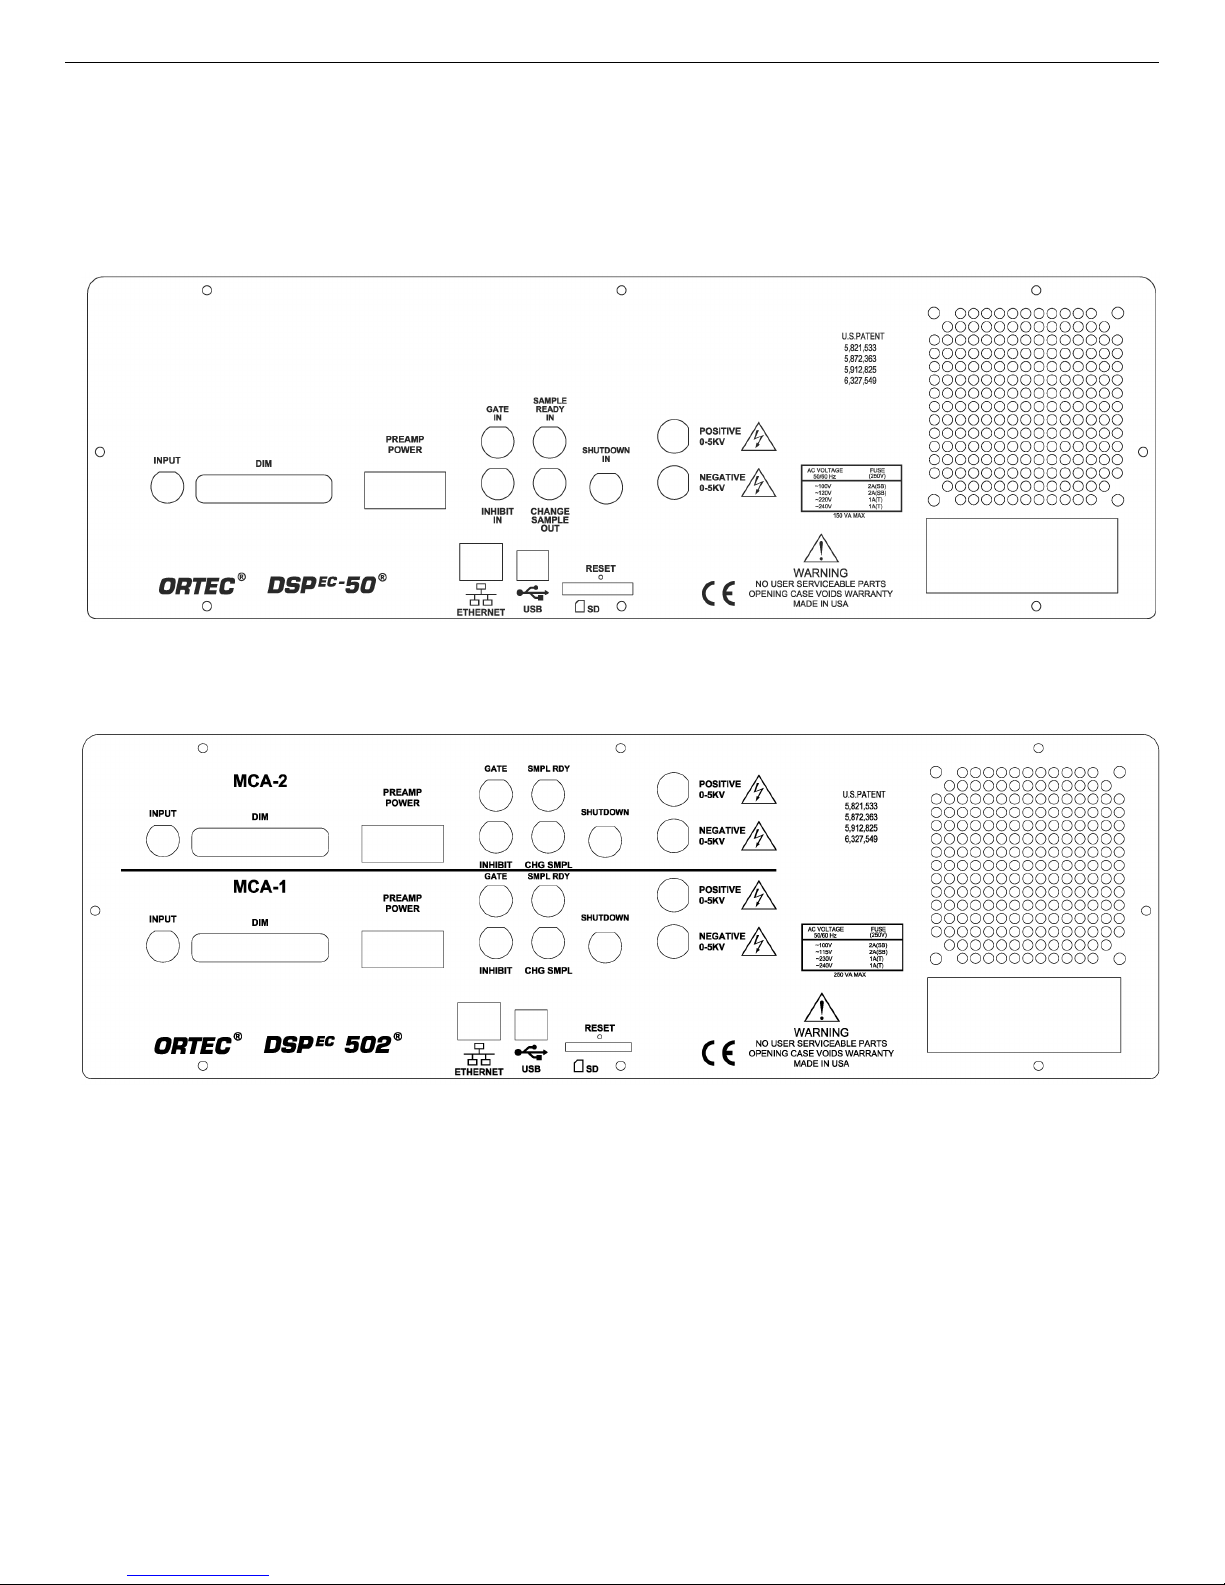
Figures 17 and 18 respectively show the rear panels of the DSPEC 50 and DSPEC 502. Note
that each chassis has only one ac input power module, Ethernet connector, USB connector, SD
card slot, and RESET port. Otherwise, each MCA has the following set of inputs and outputs.
On the DSPEC 502, some connector labels are abbreviated due to space constraints; the
abbreviations are given in parentheses below. See Section 6.1.1 for more detail on the inputs
and outputs.
DIM Multi-pin (13W3) connector supports the SMART-1 and other ORTEC DIM detectors.
No other rear-panel detector connections are required.
CAUTION
To avoid damaging the detector interface module (DIM) cable, be sure to observe the following:
(1) When attaching a detector to the DIM connector, always tighten the cable’s retaining screws
to the rear panel. (2) Before disconnecting the detector from the DIM connector, always power
off the DSPEC-50.
27
Page 38
DSPEC 50® and DSPEC 502® Digital Gamma-Ray Spectrometer User’s Manual 932502G / 0618
INPUT Rear-panel BNC accepts preamplifier output signals of either polarity.
PREAMP POWER Rear-panel, 9-pin D connector; provides ±24 V and ±12 V for
preamplifier power.
Figure 17. The DSPEC 50 Rear Panel.
Figure 18. The DSPEC 502 Rear Panel.
GATE IN (GATE) Accepts slow-positive NIM input; Software-selectable as off,
coincidence, or anticoincidence.
INHIBIT IN (INHIBIT) Rear-panel BNC connector accepts reset signals from TRP or POF
preamplifiers.
28
Page 39

932502G / 0618 2. THE DSPEC 50
SHUTDOWN IN (SHUTDOWN) Rear-panel BNC turns off the bias supply voltage when
the detector is warm. Software-selectable ORTEC or TTL mode (SMART-1 detectors autoselect the SMART shutdown mode). In ORTEC mode, the detector’s Bias Shutdown cable
must be connected to this input or the high voltage will not turn on.
CHANGE SAMPLE OUT (CHG SMPL) Rear-panel BNC connector, TTL compatible.
SAMPLE READY IN (SMPL RDY) Rear-panel BNC connector accepts TTL level signal
from sample changer.
HIGH VOLTAGE
Positive 0–5 kV Rear-panel SHV connector, 500 V–5 kV. Only active when the unit is
!
set for positive bias.
! Negative 0–5 kV Rear-panel SHV connector, 500 V–5 kV. Only active when the unit is
set for negative bias.
ETHERNET Standard 10/100 Mbit Ethernet connection. Link and Activity LEDs are
integrated into the connector.
USB Emulates a USB connection. Any number of DSPEC 50s can be connected to a host
computer via USB.
SD SecureDigital™ (SD) memory card slot for uploading a maximum of 9 optional .JPGformat image files. See page 19.
RESET Maintenance port.
AC (MAINS) POWER MODULE 100–240 V ac, 47–63 Hz, 110 watts. The unit is shipped
with the voltage setting, fusing, and 3-prong grounded ac power cord appropriate for your
location. To change the fuses or voltage setting, see the next section.
2.2.1. Changing the Fuse(s) and Line Voltage
This instrument uses a power entry module that includes a reversible fuse holder and a voltage
selector card. The voltage selector card lets you configure the instrument for a nominal 100,
120, 230, or 240 V ac. The module door has a small window that shows the line voltage setting
now in use.
To open the module:
1) Be sure the instrument is disconnected from the ac (mains) power source.
29
Page 40

DSPEC 50® and DSPEC 502® Digital Gamma-Ray Spectrometer User’s Manual 932502G / 0618
2) Insert a small flat-blade screwdriver in the small gap under the left side of the module’s
door, as shown in Fig. 19.
3) Gently lift up until the entire door pops up approximately 0.25 inch (Fig. 20).
Figure 19. Insert Screwdriver in Gap
Under Door.
Figure 20. Lift the Door.
4) The door can now be opened from the right, exposing the fuse holder and voltage
selector card (Fig. 21).
Figure 21.
2.2.1.1. Replacing the Fuse(s)
1) With the unit disconnected from ac power, lift out the reversible fuse holder (Fig. 22).
2) This instrument requires the following 250 V fuses:
! For 100 or 120 V ac line voltage, one fuse, 2 A (SB) size 3AG.
! For 230 or 240 V ac line voltage, two fuses, 1 A(T) size 5×20 mm.
CAUTION Do not use makeshift fuses or short-circuit the fuse holders, and do not install
both AG and metric fuses at the same time.
30
Page 41

932502G / 0618 2. THE DSPEC 50
Figure 22. Remove the Fuse Holder.
Figure 23 shows the 100 V/120 V side with an AG fuse in place. In Fig. 24, the fuse holder
has been rotated to show the 230 V/240 V side (facing right) and the two brackets for its
metric fuses.
Figure 23. Fuse Holder —
AG Side.
Figure 24. Fuse
Holder — Metric Side.
3) Change the fuse(s), then reinsert the fuse holder fuse side down (thus, for 100 or 120 V ac
line voltage, the single AG fuse should face down; and for 230 or 240 V ac line voltage,
the twin metric fuses should face down). Gently press down until the fuse holder is fully
seated. Close the module door as described in Section 2.2.1.3.
2.2.1.2. Changing the Line Voltage
1) Use the indicator pin to pull the voltage selector card straight out of the module. If
necessary, lift the indicator pin a few millimeters, slide the shaft of a small flat-blade
screwdriver under the top of the pin, and use the screwdriver to gently lift out the card, as
shown in Fig. 25.
2) Unclip the white plastic indicator pin from the card.
31
Page 42

DSPEC 50® and DSPEC 502® Digital Gamma-Ray Spectrometer User’s Manual 932502G / 0618
3) Orient the card so the desired voltage is readable
at the bottom. Figure 26 shows the orientations for
the four voltage settings and how to replace the
indicator pin in the card for that voltage. Note that
the arrow beside the setting indicates the edge of
the card you will insert first into the power entry
module.
4) Reinsert the card into the module, printed side
of the card facing left, toward the IEC power
connector, with the edge listing the desired
Figure 25. Gently Pull Out Voltage
Selector Card.
voltage first (down). Gently but firmly press
the card into the module until it is fully seated.
5) Close the module door as described in Section 2.2.1.3.
Figure 26. Orient the Voltage Selector Card and Clip On the Indicator Pin.
2.2.1.3. Closing the Input Power Module
1) When you have completed changes to the
line voltage and/or fusing, close the module
door, then gently press it down until it is
fully seated and firmly holding the fuse
holder and voltage selector card in place.
2) Verify that the white indicator pin shows
the desired voltage. Figure 27 shows the
instrument set for 120 V.
Figure 27. Note Position of Voltage Indicator
Pin.
3) You are now ready to connect the unit to the ac power source using the appropriate
power cord (mains lead).
32
Page 43

3. HARDWARE AND SOFTWARE
INSTALLATION
When using Windows computers the DSPEC 50 installation is as follows:
1) Confirm the line (mains) voltage, fusing, and input power cord are correct for your
region.
2) Install the included CONNECTIONS Driver Update Kit (p/n 797230).
3) Install the included MAESTRO MCA Emulation Software (A65-BW) or your ORTEC
spectroscopy software application.
4) Connect the DSPEC 50 to your network or computer.
5) Run the MCB Configuration program to establish communication with your MCBs.
NOTE: When using the Web Page or Web Services interface on the DSPEC 50A or 502A then
simply configure the instrument for ethernet connection and enter the web page address from
the communication control screen in your browser application instead of installing
CONNECTIONS and application software.
NOTE You must have Windows administrator-level access to install ORTEC software.
3.1. Step 1: Line Voltage, Fusing, and Power Cord
ORTEC factory-sets the DSPEC 50 line voltage, fusing, and input power cord based on your
location. However, before you use the unit, we strongly recommend that you confirm it is properly set up for your region’s ac mains supply. For instructions on changing the line voltage
and fusing, see Section 2.2.1.
3.2. Step 2: Install the CONNECTIONS Driver Update
Next, install the accompanying CONNECTIONS Driver Update Kit (P/N 797230) according to its
instruction sheet. This product must be installed before your spectroscopy application is
installed. On the Instrument Families page, be sure to mark the USB-based instruments checkbox. Otherwise, USB-connected DSPEC 50s will not be able to communicate with the com-
puter and ORTEC software. No instrument family selection is required if you will only be
communicating via Ethernet.
10
If you also have other types of MCBs attached to this computer, refer to the installation
instructions in the corresponding hardware manuals. Note that you can install device drivers
10
If you also have non-Ethernet MCBs, each will require setup according to its hardware manual, including
selection of the proper Instrument Family in the CONNECTIONS Driver Update wizard. You can enable other
device drivers later, as described in the Update Kit instructions.
33
Page 44

DSPEC 50® and DSPEC 502® Digital Gamma-Ray Spectrometer User’s Manual 932502G / 0618
for other types of instruments later, as described in the CONNECTIONS Driver Update Kit
instructions.
3.3. Step 3: Install the Spectroscopy Application Software
Install MAESTRO or another ORTEC spectroscopy application according to the instructions in
its user manual.
3.4. Step 4: Connect the DSPEC 50 to Your Network
or Computer
NOTE You can attach DSPEC 50s directly to your computer either by Ethernet or by USB
connection, but do not mix the two connection types on the same computer or operational errors could occur. If you switch a DSPEC 50 from one connection type to the
other, you must re-run the MCB Configuration program to reestablish communication
between the DSPEC 50 and the computer.
3.4.1. Ethernet Connection
! Case 1: LAN With DHCP Server — Dynamic IP Addressing
Most users will connect one or more DSPEC 50s, via the rear-panel Ethernet port, to a standard LAN. This is the simplest connection method: Just attach the DSPEC 50 to your network with a standard Cat 5 (RJ45) Ethernet cable, power the DSPEC 50 on, wait 10–15
seconds for the network’s DHCP server to assign a dynamic IP address to the DSPEC 50,
and you’re ready to run the MCB Configuration program (Section 3.5). In addition to these
networked DSPEC 50s, you can attach DSPEC 50s directly to your computer either by
Ethernet or by USB connection, as described in the next two paragraphs and Section 3.4.2.
! Case 2: LAN Without DHCP Server or Standalone Laptop/Computer With LAN
Adapter — Dynamic IP Addressing
If you (a) connect multiple DSPEC 50s to a network that does not have a DHCP server, or
(b) have an isolated computer with a LAN adapter, and wish to attach multiple DSPEC 50s to
the computer via a powered Ethernet switch, Windows will auto-assign IP addresses to each
DSPEC 50. To do this, attach the DSPEC 50s to your network (or to the standalone computer’s Ethernet switch) with a standard Ethernet cable, power the DSPEC 50s on, wait
3–5 minutes for the IP addresses to be assigned, and you’re ready to run the MCB Configuration program (Section 3.5).
! Case 3: Static IP Addressing
(a) If for any reason the network DHCP server or the host computer does not auto-assign an
34
Page 45

932502G / 0618 3. INSTALLATION
IP address to your DSPEC 50, or (b) if you are otherwise using static IP addressing, see the
instructions in Appendix A. When all units have been assigned a static IP address, you’re
ready to run the MCB Configuration program (Section 3.5).
3.4.2. USB Connection
With the computer powered on, connect the DSPEC 50 to a USB port on the computer, power
the DSPEC 50 on, and wait for it to initialize and display the Switchboard screen.
Windows will indicate that the DSPEC 50 has been detected. In Windows10, 8, and 7, the
driver will install without a wizard. In XP, the new hardware installation wizard will open.
Click Next, indicate you do not wish to connect to the internet or the Microsoft website to
locate the driver, choose the “automatically locate driver” option, and follow the remaining
prompts to completion. When this operation is complete, you’re ready to run the MCB
Configuration program (Section 3.5).
3.5. Step 5: Run MCB Configuration to Establish
Communication With Your MCBs
IMPORTANT
This is an abbreviated discussion of the operation and use of the MCB Configuration program.
We strongly recommend that you read the instructions for the CONNECTIONS Driver Update Kit
for complete details on the command line arguments that change how the program searches for
MCBs, customizing MCB ID Numbers and Descriptions, changing your Windows firewall
settings to allow MCB access across a network, enabling additional device drivers, and
troubleshooting.
1) Make sure the DSPEC 50 is connected and powered on.
2) Connect and power on all other local and network ORTEC instruments that you wish to
use, as well as their associated computers. Otherwise, the MCB Configuration program
will not detect them during installation. Any instruments not detected can be configured
another time.
3. Type mcb in the “Search programs and files” box on the Windows Start menu, then
click the MCB Configuration search result; or open the Windows Start menu and click
MAESTRO, then MCB Configuration. For Ethernet-connected DSPEC 50s, do not
append the -L switch to the command line (the -L switch can only locate local, USBconnected DSPEC 50s).
The MCB Configuration program will locate all of the powered-on ORTEC MCBs on the
35
Page 46
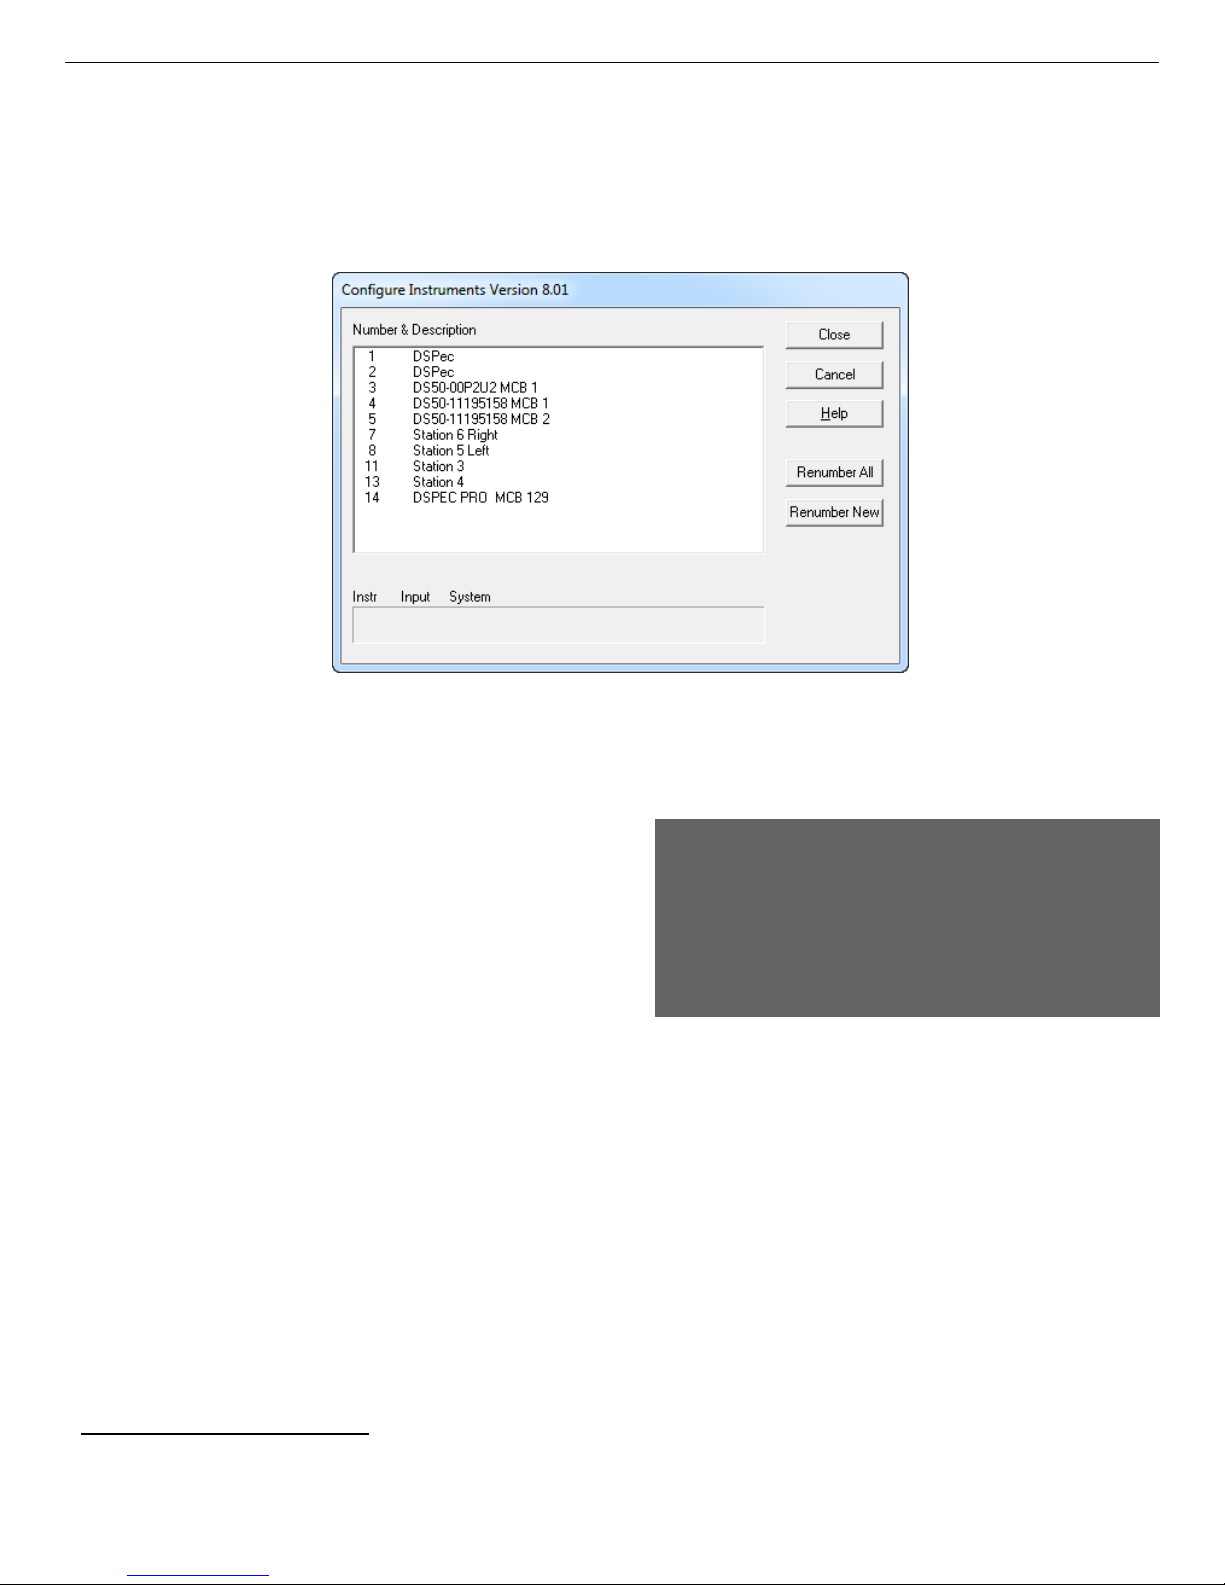
DSPEC 50® and DSPEC 502® Digital Gamma-Ray Spectrometer User’s Manual 932502G / 0618
local computer and the network, and display the Master Instrument List of instruments found
(Fig. 28). Each DSPEC 50 will be identified in the list by the Host name displayed on the
Communication Control screen (Fig. 8, page 20). If you have a DSPEC 502, both inputs will
be discovered, and will be assigned the host name appended with MCB 1 and MCB 2.
Figure 28. MCB Numbering and Descriptions.
3.5.1. Configuring a New Instrument
The first time a new instrument is detected, the
dialog shown in Fig. 29 will remind you that
all new instruments must be assigned a unique,
non-zero ID number.11 Click OK. You can
either manually change the ID Number and
Description as described in the next subsection,
or you can click the Renumber New button
to renumber only the new instruments.
Figure 29. New Instruments Must Have a NonZero ID Number.
NOTE We strongly recommend not using the Renumber All button. In addition, we
strongly recommend not renumbering MCBs that “belong” to other users, as this
could affect the interaction between their MCBs and their ORTEC software, for
instance, if they control their MCBs with .JOB files (e.g., the .JOB file command
SET_DETECTOR 5), or use the GammaVision or ISOTOPIC spectroscopy
applications. See also the NOTE FOR MULTIPLE USERS ON A NETWORK in the
next section.
11
If this is a first-time installation of ORTEC products, all your instruments will be “new.”
36
Page 47
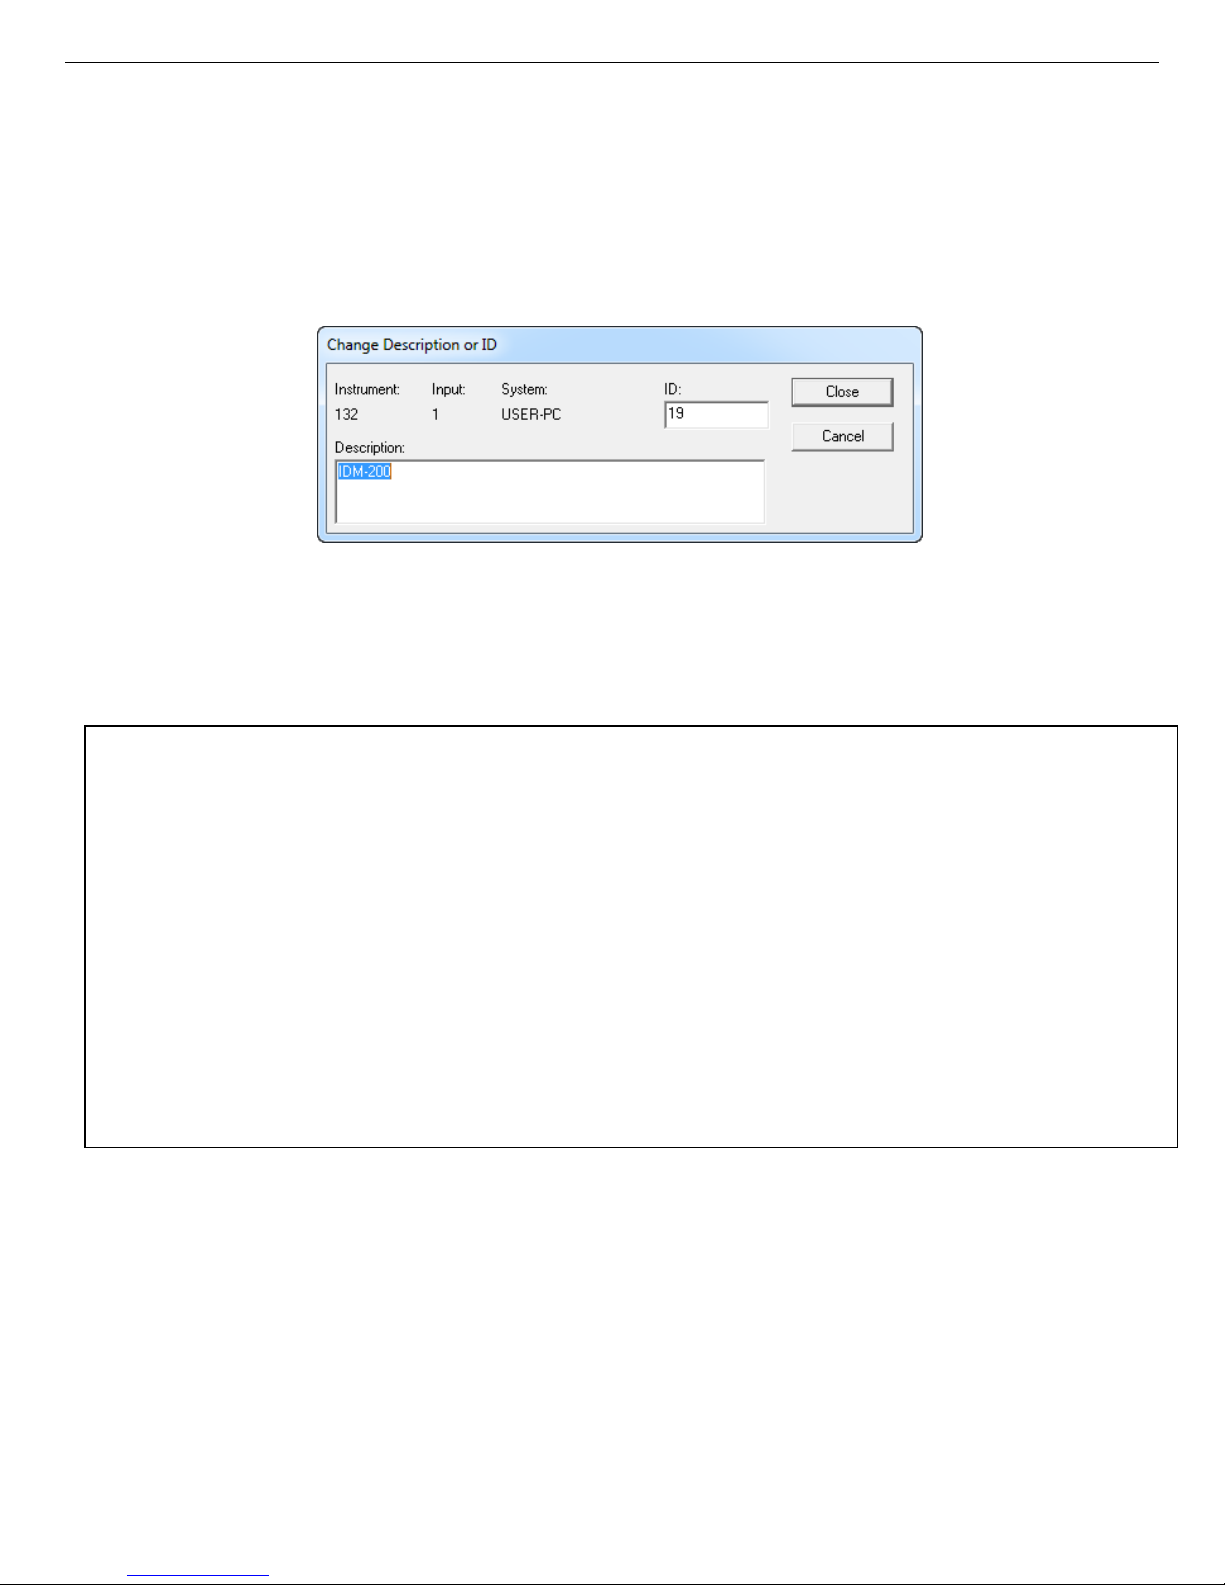
932502G / 0618 3. INSTALLATION
3.5.2. Customizing ID Numbers and Descriptions
If you wish, you can change the instrument ID Numbers and Descriptions by double-clicking
an instrument entry in the Configure Instruments dialog. This will open the Change
Description or ID dialog (Fig. 30). It shows the physical MCB location (read-only), and allows
you to change the ID Number and Description.
Figure 30. Change MCB Number or Description.
Make the desired changes and click Close. Any changes you have made to an ID number or
description will then be written back to the corresponding MCB.
NOTE FOR MULTIPLE USERS ON A NETWORK
There are two ways to reduce the chance that other users will renumber your MCBs:
! Add the -I flag to their MCB Configuration command line, as described in the CONNECTIONS
Driver Update Kit instructions. This will allow you to assign whatever ID Numbers you wish,
regardless of the numbers assigned by other users on your network. (Ideally, everyone using
ORTEC instruments on your network should make this change.)
! To prevent others from renumbering your MCBs (or performing any other actions except read-
only viewing), password-lock your MCBs with the MAESTRO Lock/Unlock Detector
command. If you lock a detector that will be controlled by a JOB stream, remember to include
the proper password-unlock commands in your .JOB file (see the MAESTRO user manual).
If a modified description has already been applied to a particular instrument, you can restore
the default description by deleting the entry in the Description field and re-running MCB Configuration. After MCB Configuration runs, the default description will be displayed.
3.5.3. Connecting to and Disconnecting from the Computer
The DSPEC 50 can be connected to and disconnected from the computer without shutting
down either. If you disconnect from the computer during data acquisition (leaving the
DSPEC 50 under power so that the high voltage stays on), the DSPEC 50 will continue data
37
Page 48

DSPEC 50® and DSPEC 502® Digital Gamma-Ray Spectrometer User’s Manual 932502G / 0618
collection. To redisplay the spectrum, simply reconnect the DSPEC 50 via the same method
(Ethernet or USB), then close and reopen the MAESTRO spectrum window for that input.
38
Page 49
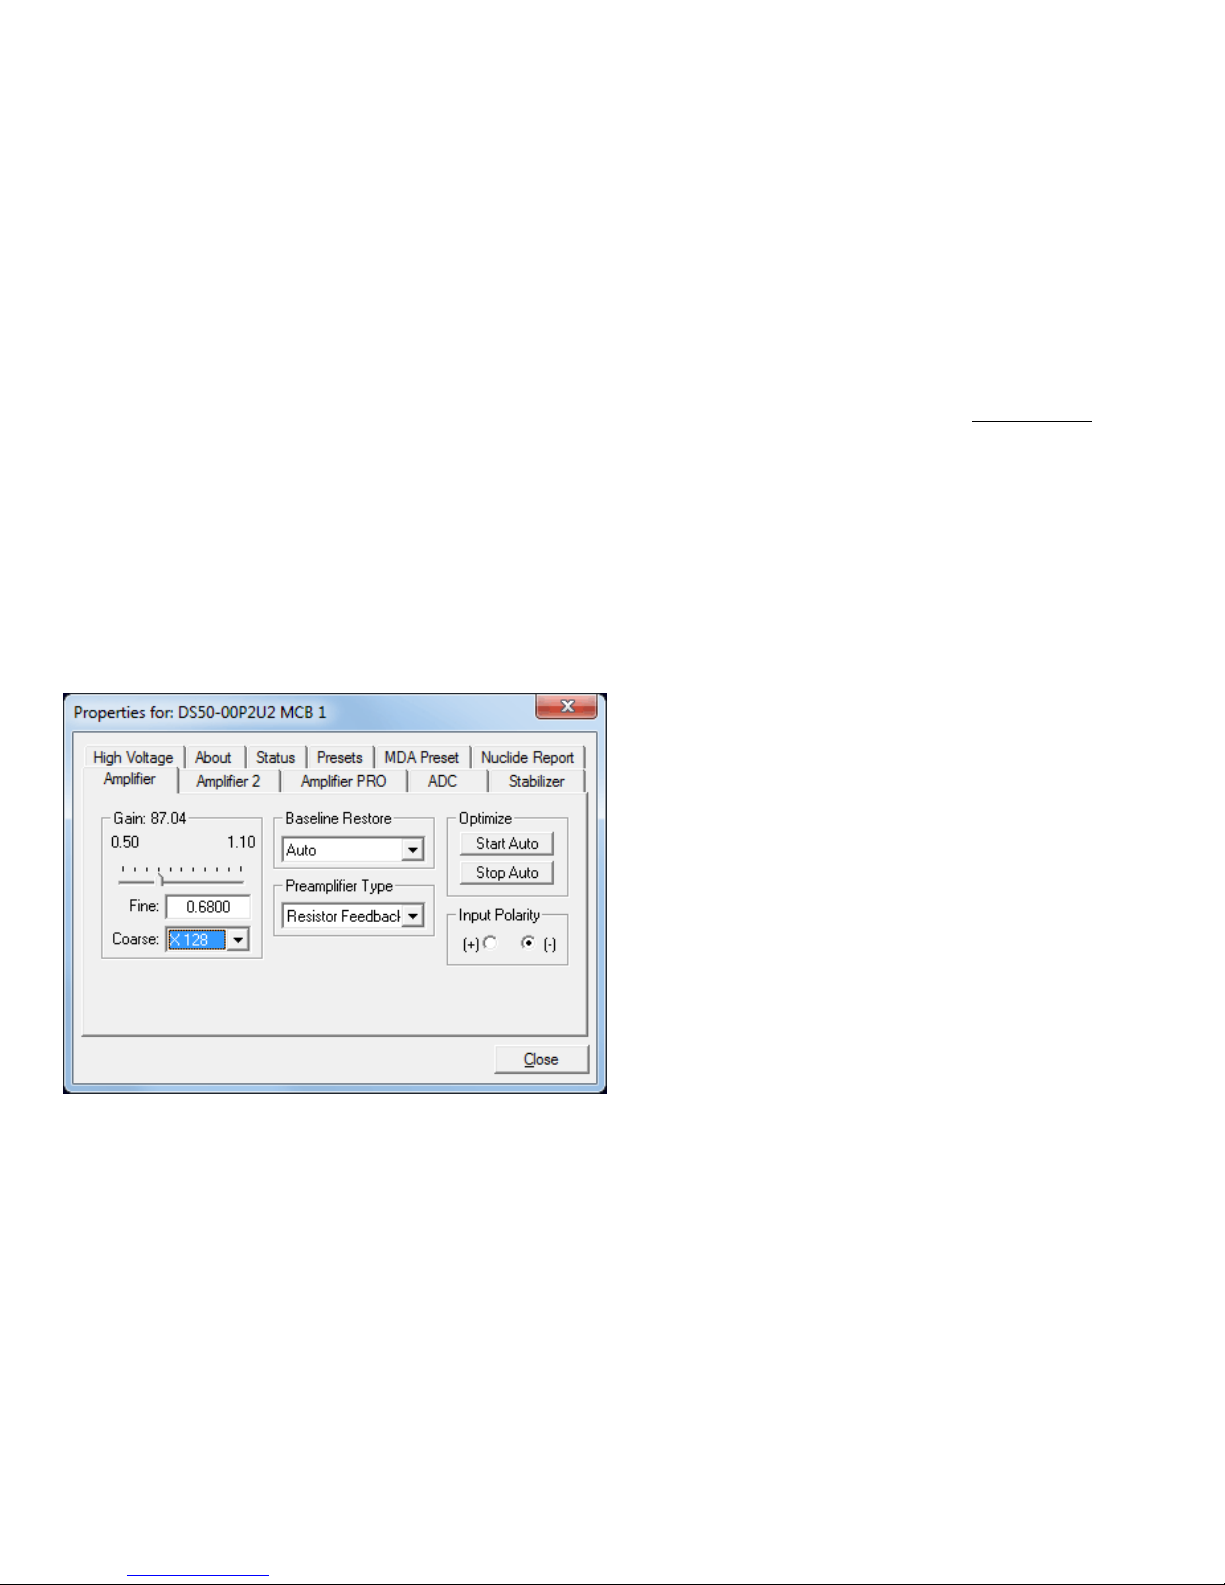
4. MCB PROPERTIES IN MAESTRO
This chapter discusses the hardware setup dialog you will see within MAESTRO and all other
ORTEC CONNECTIONS software (e.g., GammaVision, ISOTOPIC) when you click Acquire/
MCB Properties.... Data acquisition with the DSPEC 50 is completely software controlled.
The MCB Properties dialog contains all of the instrument controls including ADC setup
parameters, acquisition presets, amplifier gain adjustments, pole zero controls, detector bias
controls, and access to the InSight Virtual Oscilloscope. Just move from tab to tab and set your
hardware parameters, then click Close.
Note that as you enter characters in the data-entry fields, the characters will be underlined until
you move to another field or until 5 seconds have elapsed without further input. While the
entry is underlined, no other program or computer on the network can modify this value.
4.1. Amplifier
Figure 31. DSPEC 50 Amplifier Tab.
The Amplifier tab is shown in figures 31 and 32 for the Standard and Advanced models
respectively. This tab contains the controls for Gain, Baseline Restore, Preamplifier Type,
Input Polarity, and Optimize.
NOTE Be sure that all of the controls on the tabs have been set before clicking the Start
Auto (optimize) button. The changes you make on most property tabs take place
immediately. There is no cancel or undo for these dialogs.
Figure 32. DSPEC 50A Amplifier Tab.
39
Page 50

DSPEC 50® and DSPEC 502® Digital Gamma-Ray Spectrometer User’s Manual 932502G / 0618
Gain — Set the amplifier coarse gain by selecting from the Coarse droplist, then adjust the
Fine gain with the horizontal slider bar or the edit box, in the range of 0.5 to 1.1. The resulting
effective gain is shown at the top of the Gain section. The two controls used together cover
the entire range of amplification from 0.5 to 140.8.
Input Polarity — These buttons select the preamplifier input signal polarity for the signal
from the detector. Normally, GEM (p-type) detectors have a positive signal and GMX (n-type)
have a negative signal.
Baseline Restore — This is used to return the baseline of the pulses to the true zero between
incoming pulses. This improves the resolution by removing low frequency noise from dc shifts
or mains power ac pickup. The baseline settings control the time constant of the circuit that
returns the baseline to zero. There are three fixed choices (Auto,5 Fast, and Slow). The fast
setting is used for high count rates, the slow for low count rates. Auto adjusts the time constant
as appropriate for the input count rate. The settings (Auto, Fast, or Slow) are saved in the
DSPEC 50 even when the power is off. The time constant can be manually set on the InSight
display (see the discussion beginning on page 42).
You can view the time when the baseline restorer is active on the InSight display as a Mark
region (see the discussion on Marks, p. 44). In the automatic mode, the current value is shown
on the InSight sidebar (Fig. 34). For a low-count-rate system, the value will remain at about 90.
Preamplifier Type — Choose Transistor Reset or Resistive Feedback preamplifier
operation. Your choice will depend on the preamplifier supplied with the germanium detector
being used.
Pile-up Rejection (Advanced Models Only) — This option allows the Pile-up Rejection to be
enabled or disabled as selected. By default Pile-Up Rejection is enabled to eliminate pile up
pulses that contribute to noise in the spectrum. Note that the Pile-Up Rejection can also be
enabled or disabled using hardware commands with the DIAG program for the Standard or
Advanced models.
4.1.1. Optimize
The DSPEC 50 is equipped with both automatic pole zero logic4 and automatic flattop logic.
12
The Start Auto (optimize) button uses these features to automatically choose the best pole zero
and flattop tilt settings. Note that if you selected Transistor Reset as the Preamplifier Type
for this DSPEC 50, optimization does not perform the pole zero.
12
Patent number 5,821,533.
40
Page 51
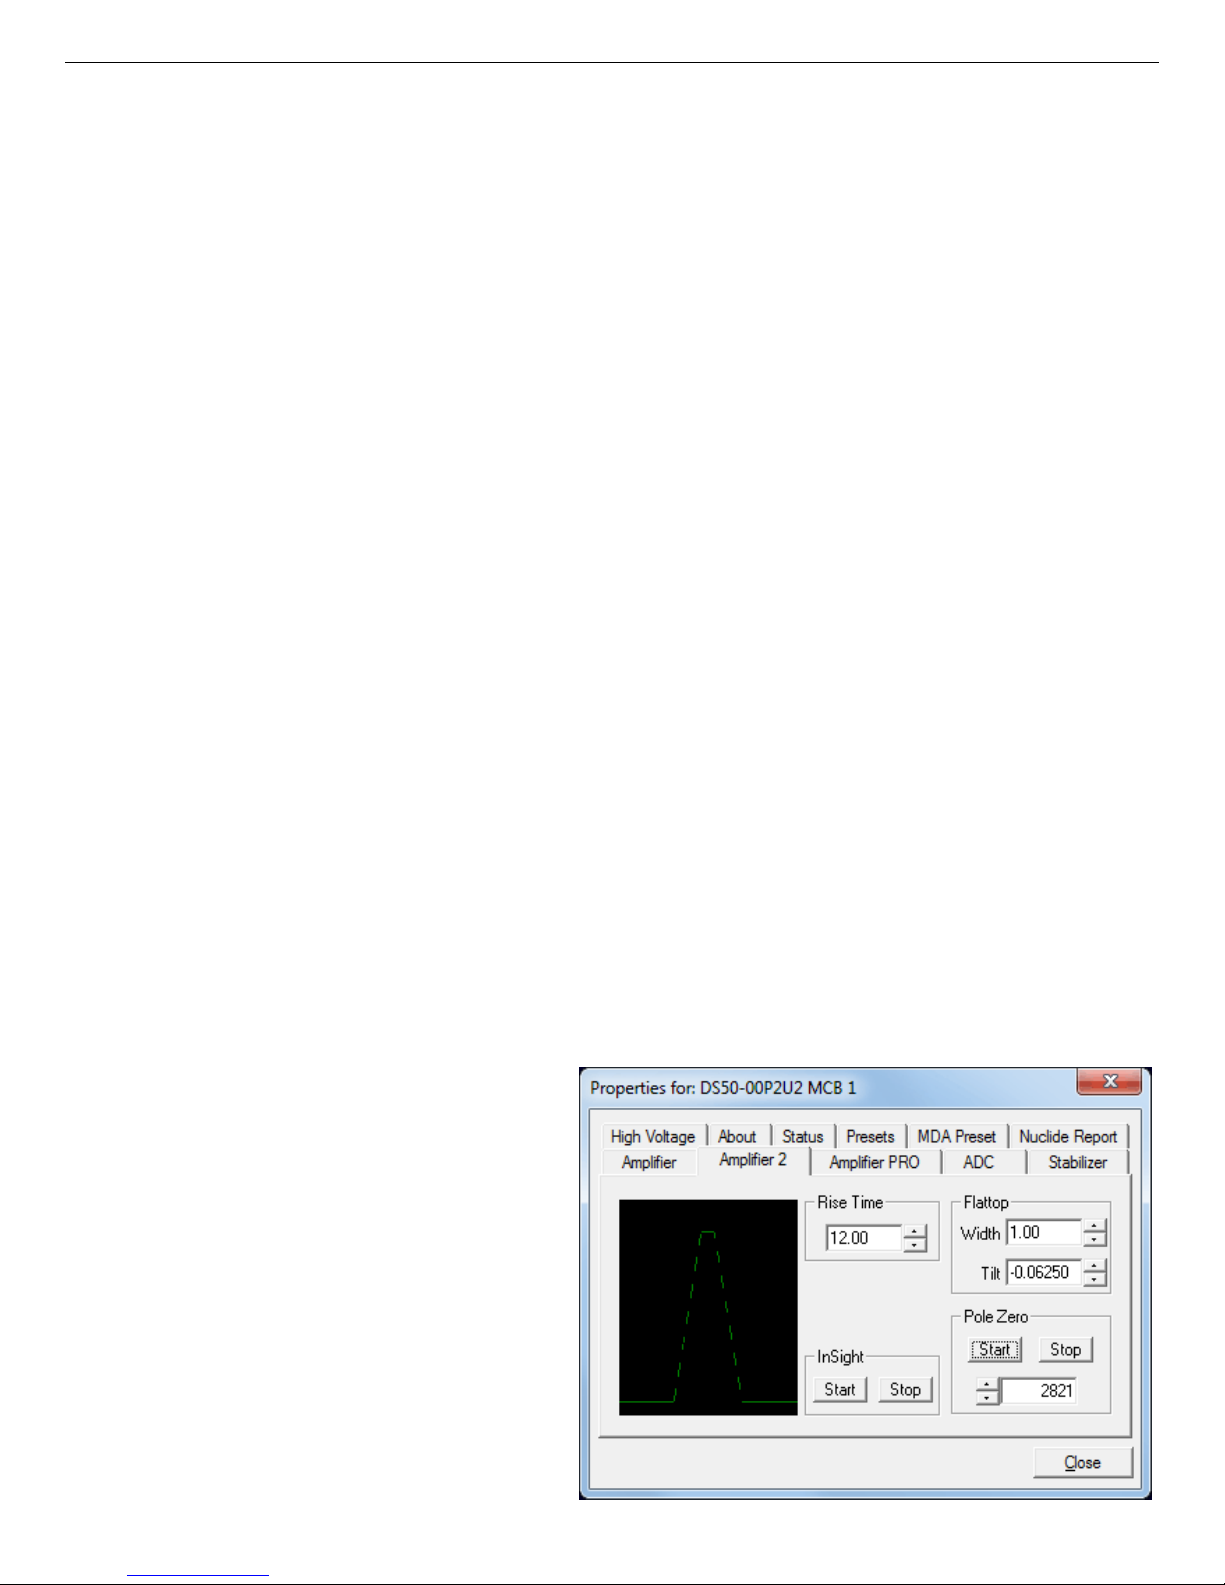
932502G / 0618 4, 5. MCB PROPERTIES IN MAESTRO
NOTE You cannot optimize with LFR mode enabled; see Section 4.3.
As with any system, the DSPEC 50 should be optimized any time the detector is replaced or if
the flattop width is changed. For optimization to take place, the DSPEC 50 must be processing
pulses. The detector should be connected in its final configuration before optimizing. A count
rate guidance message on the lower-left of the Amplifier page will help you position a radio
active source to deliver the correct count rate for optimization. The Start Auto optimization
button will be disabled (gray) until the count rate is suitable.
Select either the Resistive Feedback or Transistor Reset option and click Start Auto. The
optimize command is sent to the DSPEC 50 at this time and, if the DSPEC 50 is able to start
the operation, a series of short beeps sounds to indicate that optimization is in progress. When
optimizing is complete, the beeping stops.
During optimization, pole zeroes are performed for several rise-time values and the DSPEC 50
is cycled through all the rise time values for the determination of the optimum tilt values. All
values for all the combinations are then saved in the DSPEC 50, so you do not need to optimize
for each possible rise time. Optimization can take from 1 to 10 minutes depending on count
rate, but typically takes 5 minutes.
NOTE Be sure to repeat the optimization if you change the flattop width.
The effect of optimization on the pulse can be seen in the InSight mode, on the Amplifier 2 tab.
Note, however, that if the settings were close to proper adjustment before starting optimization,
the pulse shape may not change enough for you to see. (In this situation, you also may not
notice a change in the shape of the spectrum peaks.) The most visible effect of incorrect
settings is high- or low-side peak tailing or poor resolution.
4.2. Amplifier 2
Figure 33 shows the Amplifier 2
tab, which accesses the advanced
shaping controls including the
InSight Virtual Oscilloscope mode.
The many choices of Rise Time
allow you to precisely control the
tradeoff between resolution and
throughput; see Section 4.13. This
setting affects both the rise and
fall times, so changing it spreads
or narrows the quasi-trapezoid
Figure 33. DSPEC 50 Amplifier 2 Tab.
41
Page 52
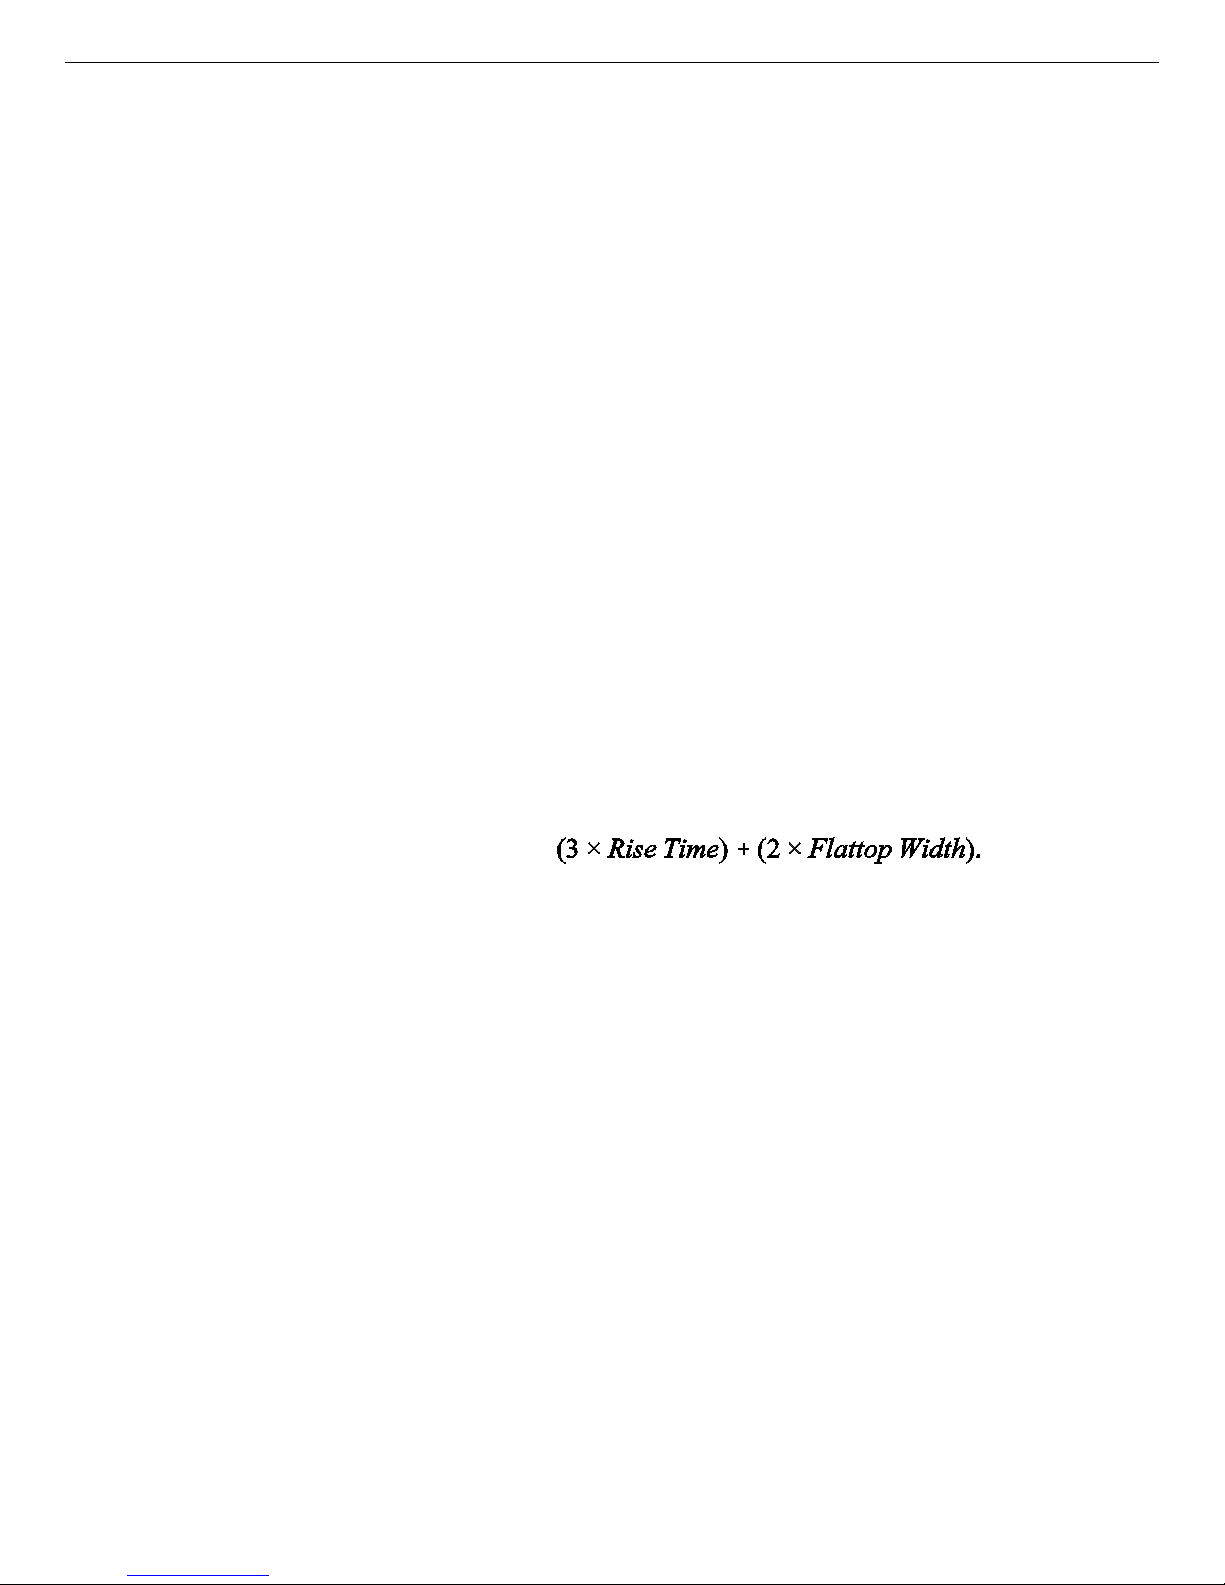
DSPEC 50® and DSPEC 502® Digital Gamma-Ray Spectrometer User’s Manual 932502G / 0618
symmetrically.
Use the up/down arrows to set the Rise Time from 0.8 ìs to 23.0 ìs. Once the unit has been
optimized according to Section 4.1.1, you can use any Rise Time without having to reoptimize.
The value of the rise time parameter in the DSPEC 50 is roughly equivalent to twice the
integration time set on a conventional analog spectroscopy amplifier. Thus, a DSPEC 50 value
of 12 ìs corresponds to 6 ìs in a conventional amplifier. Starting with the nominal value of
12.0, you should increase values of the rise time for better resolution for expected lower count
rates, or when unusually high count rates are anticipated, reduce the rise time for higher
throughput with somewhat worse resolution.
The Flattop controls adjust the top of the quasi-trapezoid. The Width adjusts the extent of the
flattop (from 0.3 to 2.4 ìs). The Tilt adjustment varies the “flatness” of this section slightly.
The Tilt can be positive or negative. Choosing a positive value results in a flattop that slopes
downward; choosing a negative value gives an upward slope. Alternatively, the optimize
feature on the Amplifier tab can set the tilt value automatically. This automatic value is
normally the best for resolution, but it can be changed on this dialog and in the InSight mode to
accommodate particular throughput/resolution tradeoffs. The optimize feature also
automatically adjusts the pole zero setting.
The dead time per pulse is approximately
In the Pole Zero section, the Start button performs a pole zero at the specified rise time and
other shaping values. Unlike the optimize feature, it performs a pole zero for only the one rise
time. The pole zero Stop button aborts the pole zero, and is normally not used.
For the more advanced user, the InSight mode allows you to directly view all the parameters
and adjust them interactively while collecting live data. To access InSight mode, click the
Start button. The InSight mode is discussed in more detail in the following section. Once data
acquisition is underway, you may wish to start the Insight mode to adjust the shaping
parameters interactively with a “live” waveform showing the actual pulse shape, or just to
verify that all is well.
4.2.1. InSight Mode
The InSight display (Fig. 34) shows the actual sampled waveform in the digital processing
units on a reference graticule. The Properties dialog remains active and can be used to change
settings while viewing the pulses.
As none of the traditional analog signals are available in the DSPEC 50, this mode is the only
42
Page 53
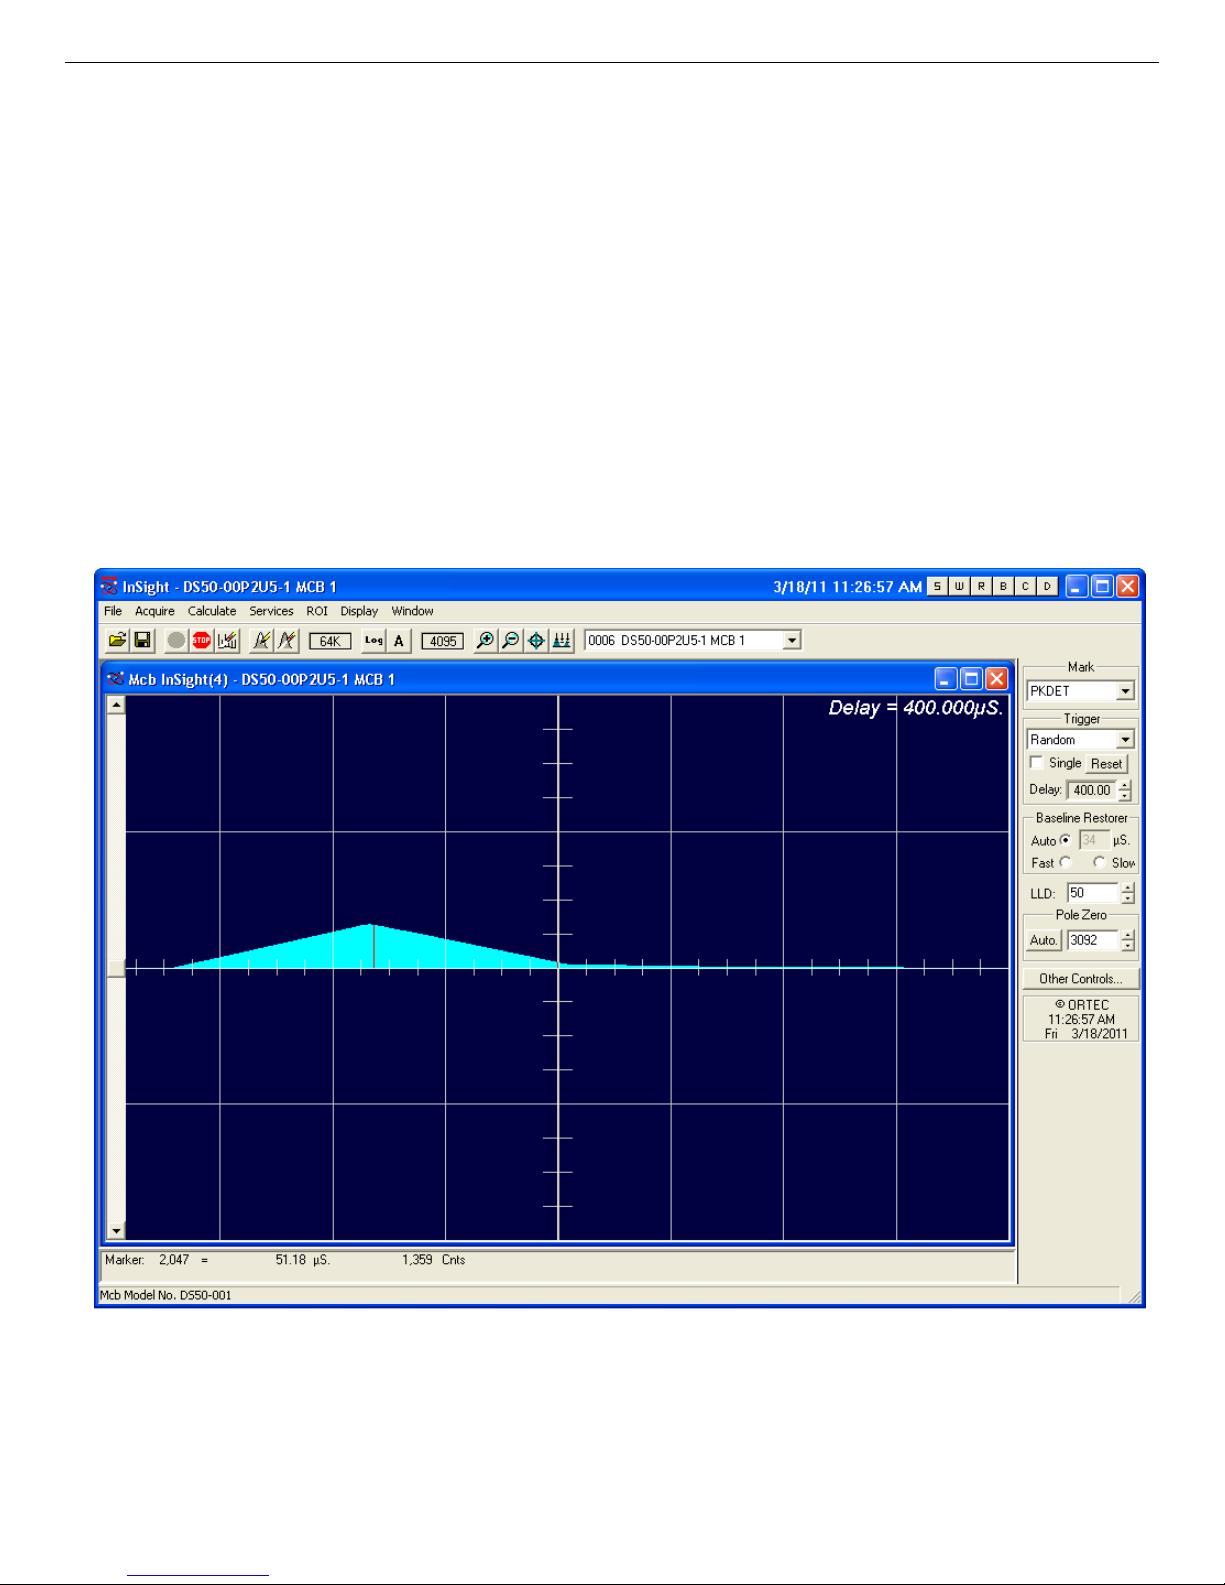
932502G / 0618 4, 5. MCB PROPERTIES IN MAESTRO
way to display the equivalent amplifier output pulse. Note that at the bottom of the window the
marker channel is displayed in units of time.
To exit the InSight mode and return to the PHA display, press <Esc> or go to the Insight
section on the Amplifier 2 tab and click Stop. The PHA mode is set to STOP when you enter
the InSight mode.
The Status Sidebar changes from the PHA mode controls to the InSight controls for adjusting
the peak display (Fig. 34). On the left is a vertical scrollbar for adjusting the vertical offset of
the waveform. The value of the offset is shown on the display. Double-clicking the mouse in
the scrollbar will set the vertical offset to the vertical value of the channel at the marker
position. This lets you conveniently zoom in on a particular part of the waveform (such as the
tail for pole zeroing).
Figure 34. DSPEC 50 InSight Mode.
In the Auto trigger mode, the display is updated every time a new pulse exceeds the trigger
43
Page 54

DSPEC 50® and DSPEC 502® Digital Gamma-Ray Spectrometer User’s Manual 932502G / 0618
level. To keep a single pulse displayed, select Single. Click Reset to refresh the display to see
the next pulse. There will usually be one or two pulses in the “pipeline” that will be displayed
before any change entered will be seen. If the trigger is turned off, the display will be redrawn
periodically, even if no pulse is there.
The Delay setting is the time delay between the pulse shown on the display and the trigger
level crossing. The value of the time delay is shown on the display.
Just as for the PHA mode display, the vertical scale can be adjusted with the vertical adjustments. The display can be set to Log mode, but the peak shapes do not have a familiar shape in
this display. The Auto mode will adjust the vertical scale for each pulse. The pulse is shown
before the amplifier gain has been applied, so the relation between channel number and pulse
height is not fixed.
The horizontal scale extends from 16 to 4095 channels. The display is expanded around the
marker position which means that in some cases the peak will disappear from the display when
it is expanded.
The display can be switched from the DSPEC 50 to another detector or the buffer. In this case
the other detector will be shown in the mode selected for it. The buffer will always be shown in
PHA mode. The display will return to the InSight mode when you return to the first DSPEC 50.
If you exit the program with the DSPEC 50 in InSight mode, it will be in InSight mode on the
next startup.
The display can include a Mark to indicate one of the other signals
shown in Fig. 35. The Mark is a solid-color region displayed similarly to
that of an ROI in the spectrum. This Mark can be used to set the timing
for the gate pulse. It can also be used to set the shaping times and flattop
parameters to get the best performance. For example, suppose you want to
get the best resolution at the highest throughput possible. By viewing the
pulses and the pileup reject marker, you can increase or decrease the rise
time to obtain a minimum of pileup reject pulses.
Figure 35. Mark
Display Selection.
4.2.1.1. Mark Types
For the Mark, choose either “points” or “filled” (to the zero line) display. This is controlled by
the selection in the Display/Preferences menu item. That choice does not affect the PHA mode
choice. The colors are the same as for the PHA mode.
None No channels are marked in the display.
PileUpReject The region marked indicates when the PUR circuit has detected pileup and
44
Page 55

932502G / 0618 4, 5. MCB PROPERTIES IN MAESTRO
is rejecting the marked pulses.
NegBLDisc This shows when the negative baseline discriminator has been triggered.
Typically this signal only marks the TRP reset pulse. The signal is used
internally in the live-time correction, baseline restoration, and pileup
rejection circuits.
BaseLineR This shows when the baseline restorer is actively restoring the baseline.
PosBLDisc This shows when the positive baseline discriminator has been triggered. The
signal is used internally in the live-time correction, baseline restoration, and
pileup rejection circuits.
Busy When the DSPEC 50 busy signal is active, Busy shows in the Mark box. It
represents the dead time.
Gate This shows when the gate signal is present on the gate input connector. If
the Gate mode on the ADC tab (see Fig. 38, 39) is set to Off, then all
regions are marked. If the mode is set to Coincidence, then the marked
region must overlap the pulse peak (that is, must start before the beginning
of the flattop and stop after the end of the flattop) for the pulse to be
counted. If the mode is set to Anticoincidence, then the marked region will
show the pulses that are accepted. That is, the rejected peaks will not be
marked. Simply put, in all modes the accepted peaks are marked.
Peak This is the peak detect pulse. It indicates when the peak detect circuit has
detected a valid pulse. The Mark occurs about 1.5 ìs after the pulse
maximum on the display.
On the lower right of the InSight display are the shaping parameter controls. The controls are
split into two groups, and the other controls... button switches between them.
One group includes Rise Time, Flattop, Tilt, and the Optimize button. The Rise Time value
is for both the rise and fall times; thus, changing the rise time spreads or narrows the quasitrapezoid symmetrically.
The Flattop controls adjust the top of the quasi-trapezoid. The Width adjusts the extent of the
flattop (from 0.3 to 2.4 ìs). The Tilt adjustment varies the “flatness” of this section slightly.
The Tilt can be positive or negative. Choosing a positive value results in a flattop that slopes
downward; choosing a negative value gives an upward slope. Alternatively, Optimize can set
the tilt value automatically. This value is normally the best for resolution, but it can be changed
45
Page 56
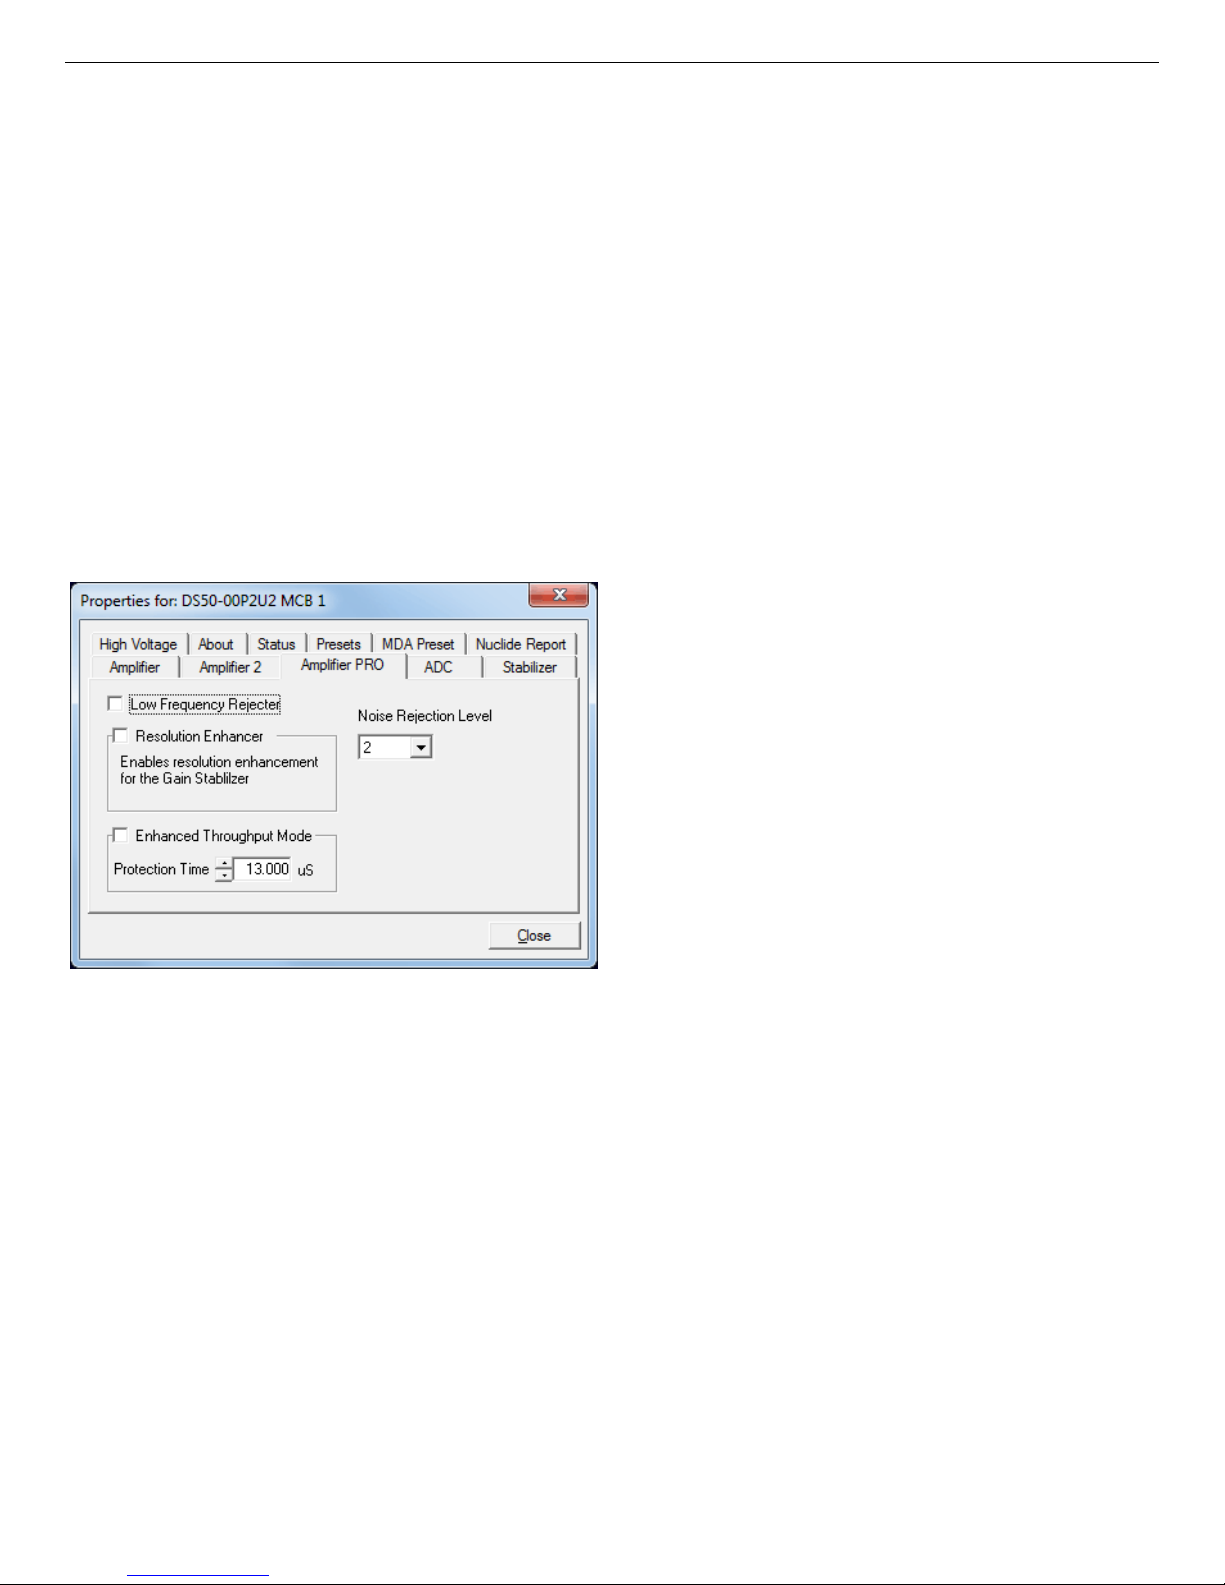
DSPEC 50® and DSPEC 502® Digital Gamma-Ray Spectrometer User’s Manual 932502G / 0618
on this dialog and in the InSight mode to accommodate particular throughput/resolution
tradeoffs. The Optimize button also automatically adjusts the pole zero setting.
4.3. Amplifier PRO
This tab (Figs. 36 and 37 for the Standard and Advanced models respectively) contains the
controls for the Low Frequency Rejector (LFR) filter, high-frequency Noise Rejection Level,
Resolution Enhancer, and Enhanced Through-put Mode. To enable a particular feature,
mark the corresponding checkbox. Any or all of these features can be used at one time,
however, the LFR and Enhanced Throughput modes must be set up before the Resolution
Enhancer is configured, as discussed below. Note that once an MCB is “trained” for the
Resolution Enhancer (see the following section), it must be “retrained” if any settings
are changed that can affect peak shape or position (e.g., bias, gain, rise time, flattop, pole zero).
Figure 36. DSPEC 50 Amplifier PRO Tab. Figure 37. DSPEC 50A Amplifier PRO Tab.
Low Frequency Rejector — This feature is discussed in detail in Section 1.5. You cannot
optimize or pole-zero the DSPEC 50 while in LFR mode. The Optimize feature must be
used with the LFR filter off. Subsequent measurements can then be taken with the LFR filter
on. Also, LFR mode affects the available range of protection times in Enhanced Throughput
Mode, as discussed in the next paragraph.
Noise Rejection Level — This setting adjusts a filter that rejects high-frequency noise from
the ambient environment. It ranges from 0 to 4. The default setting, 2; will be suitable for most
applications.
If the system is exhibiting high dead time with no source on the detector, the noise may be
induced by nearby RF interference or a result of a ground loop. If possible, resolve the source
46
Page 57
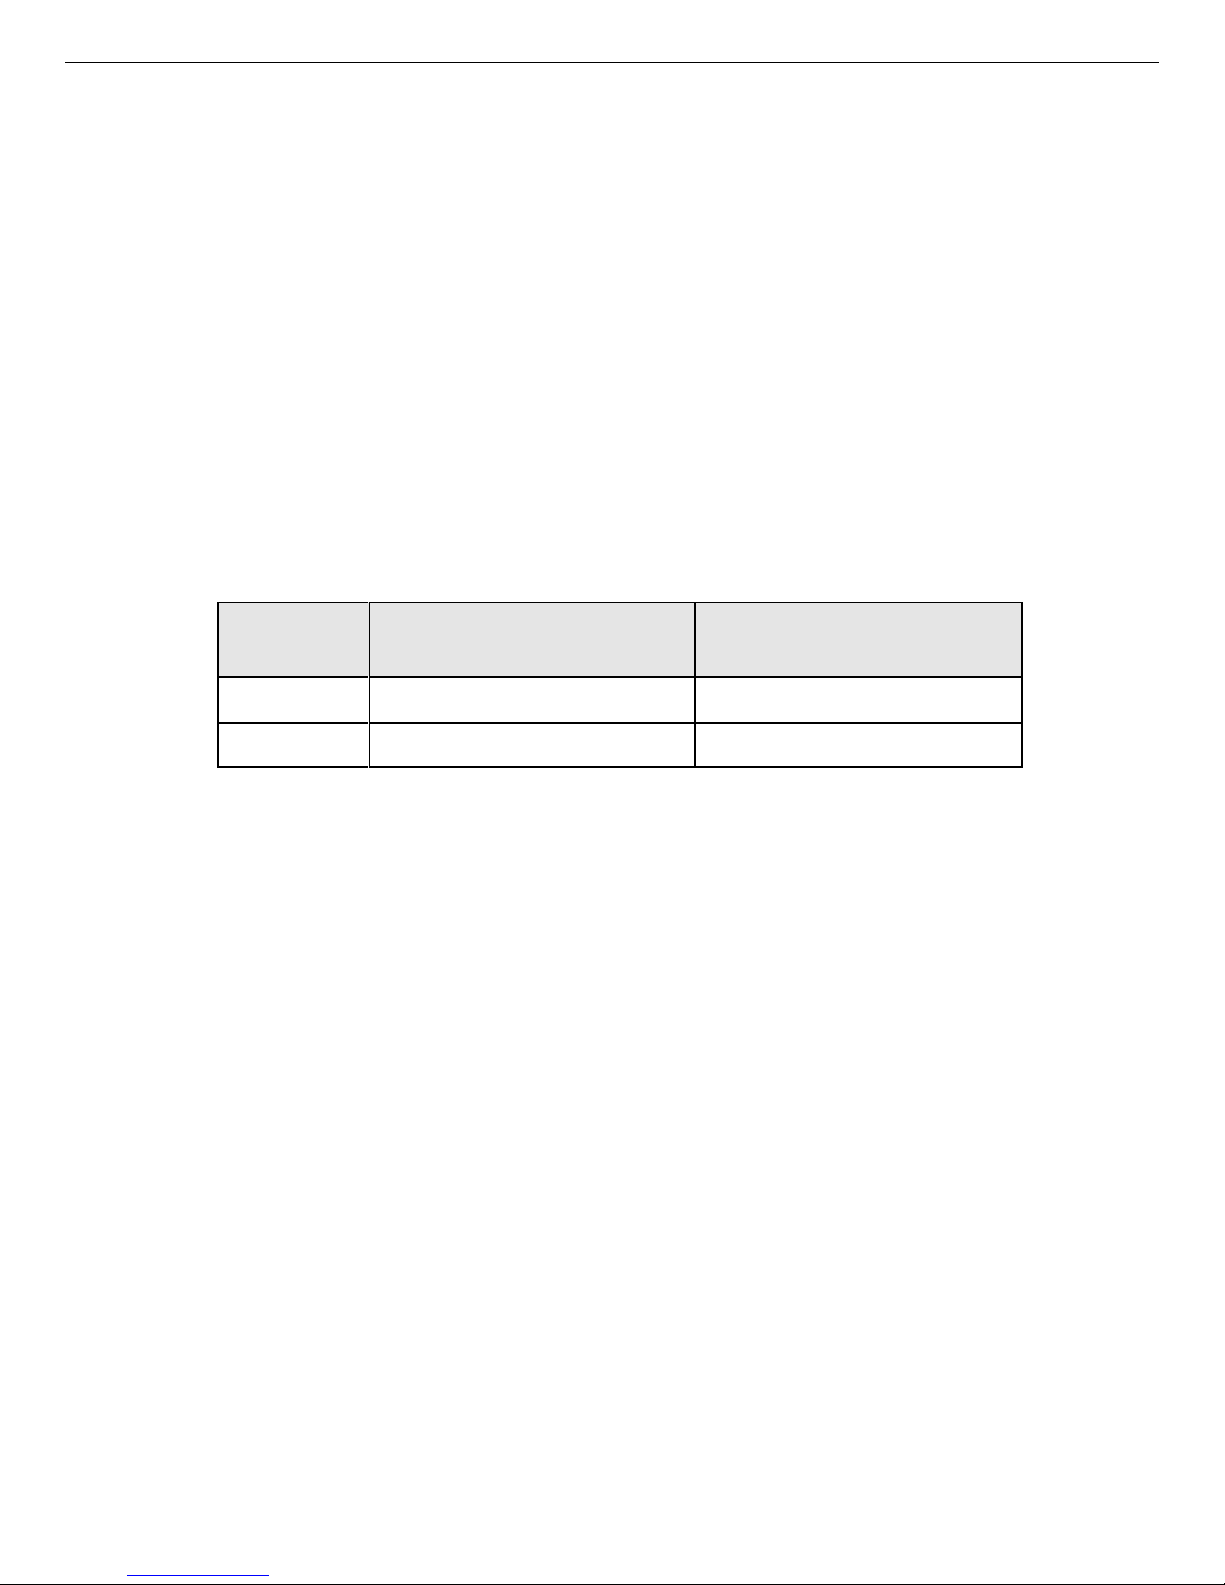
932502G / 0618 4, 5. MCB PROPERTIES IN MAESTRO
of the noise by physical means such as common grounding between detectors and instruments,
shielding cables, removing nearby motors/generators, etc. If you cannot eliminate the noise,
increase the rejection level setting until the dead time returns to the expected low value.
! Note that higher values may reduce the effectiveness of the pile-up rejector when
processing very low-energy pulses.
! On systems for which very high dead times are expected (i.e., >60%), especially with
very-low-energy sources (e.g.,
241
Am), decreasing this setting can improve the
performance of the spectrometer with respect to live-time correction and the ability to
process signals at higher input rates.
Enhanced Throughput Mode — See Section 1.4 for a discussion of this feature. The valid
Protection Time settings, in 25-ns increments, range as follows:
LFR Mode Highest Throughput
(minimum Protection Time)
Off (Rise Time + flattop) (2 × Rise Time + Flattop)
On (3 × Rise Time + 2 × Flattop) (6 × Rise Time + 3 × Flattop)
Lowest Throughput
(maximum Protection Time)
Turning on this feature automatically sets the minimum protection time (highest throughput
rate) based on your current Rise Time and Flattop settings, however, you can adjust this value
at any time. Each time you change the rise time or flattop, the DSPEC 50 will automatically set
itself to the new minimum protection time.
Inhibit Width (Advanced Models Only) —Sets a minimum inhibit signal time from 0 to 200
us in increments of 0.025 us. If the inhibit signal is still high after this time period has elapsed
then the inhibit signal remains high until the input signal goes low. The minimum inhibit
width restarts when the inhibit signal goes low and returns to high.
Manual Fast Chan Threshold (Advanced Models Only) —This setting allows setting the
fast channel threshold manually as may be desired when optimizing timing systems that trigger
off the fast channel of two or more detectors. The fast channel refers to the start of a pulse
detection as the signal increases beyond the normal noise level using a very short rise time
filter. This pulse is too noisy for spectroscopy, but it is useful in determining the pulse arrival
time. When the fast channel output exceeds the Fast Channel Threshold then a Fast Channel
event is generated and used to control Live Time, Pileup Rejection, and the Count Rate Meter.
Setting this value too low could significantly increase the system dead time. Setting this value
too high could result in peak detection without the corresponding fast channel event which
could affect pileup rejection and coincidence timing performance.
47
Page 58

DSPEC 50® and DSPEC 502® Digital Gamma-Ray Spectrometer User’s Manual 932502G / 0618
4.3.1. “Training” the Resolution Enhancer
The Resolution Enhancer can help reduce the low-side peak tailing that results from increased
charge trapping (but not other causes); see the discussion in Section 1.3. It operates by measuring the rise time (collection time) of the pulses and adjusting the gain based on the rise time.
This is done on each pulse. The gain adjustment value for the rise time is stored in a table. The
values in the table must be set by “training” the Resolution Enhancer. Marking the Resolution
Enhancer checkbox enables/disables the “learning” mode. Note that, once trained, the
enhancer operates continuously until disabled as discussed in Step (13) below. To train the
enhancer:
1) Set the bias, gain, rise time, flattop, and PZ as you would for data collection.
2) If you wish to use LFR Mode, turn it on.
3) If you wish to use Enhanced Throughput Mode, turn it on and either accept the
automatically calculated, highest-throughput protection time, based on the current rise time
and flattop; or enter the desired setting. (The latter might require one or more data
acquisitions. When finished, proceed to Step 4).
4) Clear the MCB and acquire a well-isolated peak.
5) Mark the Resolution Enhancer checkbox to turn on the learning mode.
6) You will now use the gain stabilization section of the Stabilizer tab to configure the
Resolution Enhancer (the gain stabilizer is disabled in the learning mode). Enter the Center
channel and Width of the peak acquired in Step 4; the maximum Width is 255 channels. If
you wish, use the Suggest button. The selected region should be as narrow as possible but
should completely include the peak.
7) Click Initialize to clear all the Resolution Enhancer settings. Initialization does not change
the current Center channel and Width.
8) Clear the MCB, re-start acquisition, and monitor the FWHM of the target peak, using the
Peak Info command (available by right-clicking in the spectrum window) to show the
FWHM and peak counts. Collect about 5000 counts in the peak and record the FWHM.
Clear the data and collect another 5000 counts, recording the FWHM. Repeat until the
FWHM no longer changes. Typically, the more charge trapping exhibited by the detector,
the longer the data collection time.
9) When you are satisfied that the FWHM has reached the best possible value, clear the MCB
and collect another spectrum for confirmation.
48
Page 59
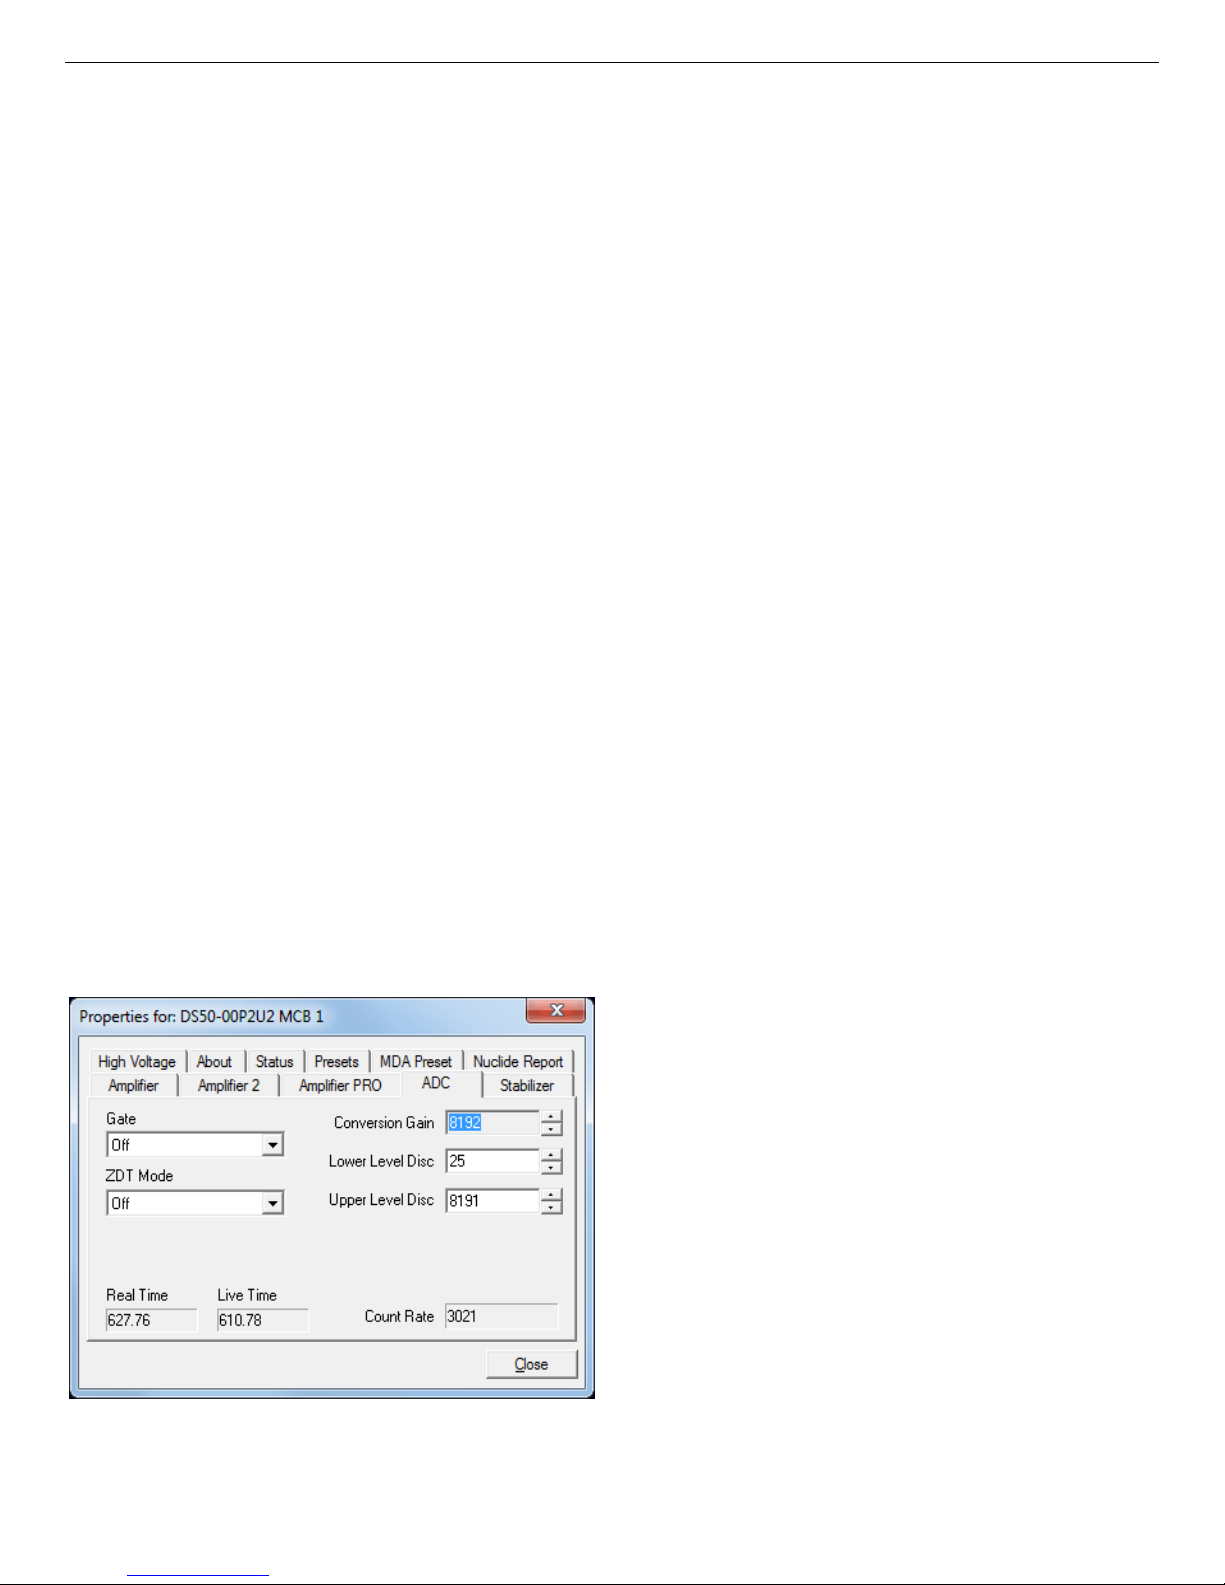
932502G / 0618 4, 5. MCB PROPERTIES IN MAESTRO
10) At this point, the Resolution Enhancer is now “trained” for the current peak shape para-
meters and the learning mode should be turned off by returning to the Amplifier PRO tab
and unmarking the Resolution Enhancer checkbox. The table of adjustments will be
stored in the DSPEC 50's memory.
11) If you change any parameters that affect peak shape, you must repeat this “training”
procedure.
12) Once the Resolution Enhancer has been trained and its checkbox has been unmarked, the
Stabilizer tab once again operates on the gain stabilizer (that is, it no longer adds values
to the table of adjustments).
NOTE The peak selected for the gain stabilizer can be different from the peak used for
training the Resolution Enhancer.
13) To turn off the Resolution Enhancer, mark its checkbox to turn on the learning mode, go
to the Stabilizer tab and click the Initialize button for the gain stabilizer. This will set the
adjustment to zero. Now return to the Amplifier PRO tab and unmark the Resolution
Enhancer box.
4.4. ADC
This tab (Fig. 38 and 39 for the Standard and Advanced tabs respectively) contains the Gate,
ZDT Mode, Conversion Gain, Lower Level Discriminator, and Upper Level Discriminator
controls. In addition, the current real time, live time, and count rate are monitored at the bottom
of the dialog.
Figure 38. DSPEC 50 ADC Tab.
Figure 39. DSPEC 50A ADC Tab.
49
Page 60

DSPEC 50® and DSPEC 502® Digital Gamma-Ray Spectrometer User’s Manual 932502G / 0618
Gate — This allows you to select a positive TTL logic gating function. With gating Off, no
gating is performed (that is, all detector signals are processed); with gating in Coincidence
mode, a gating input signal must be present at the proper time for the conversion of the event;
in Anticoincidence, the gating input signal must not be present for the conversion of the detector signal. The gating signal must occur prior to and extend 500 ns beyond peak detect (peak
maximum).
Coincidence and Gate Options (Advanced models only) — When enabled the Coincidence
option compares the Gate signal time to the Fast Channel time to determine if they are in
coincidence. The delay can be positive or negative to align the pulses depending on their
arrival times. A positive value delays the gate, and a negative value delays the fast channel.
The Window determines how closely the gate and fast channel signals must match to be in
coincidence (or anti-coincidence depending on the Gate option selected) after the delay is
applied. If the Coincidence option is disabled, or it is enabled and the coincidence condition
satisfied, then the Gate is applied based on the Delay and Window settings. In order for the
peak to be considered in Coincidence or Anti-Coincidence the Gate must be enabled when the
peak detect occurs the same as if an external gate signal were applied. The peak detect time
can be determined from the Rise Time and Flat Top settings for peak detection. Note that the
Gate cannot start until after the coincidence has been determined so the coincidence delay and
window should be accounted for when setting the Gate Delay. For example, if the coincidence
delay is negative 4 uS and the combination of Rise Time and Flat Top is 12 uS, then the Gate
Delay would have to be somewhat less than 8 uS for the Gate to be enabled after coincidence.
Since the Gate is only enabled when the more restrictive Coincidence Window has been
satisfied the Gate can be nominally set a few microseconds before and after the peak detect is
expected to occur with excellent results.
Gate Route Mode (Advanced models only) — When the Gate is in Coincidence or AntiCoincidence this option is enabled to store gated and non-gated events simultaneously. This
option will reduce the maximum ADC Conversion Gain to 32K channels. When saving the
spectrum to the ANSI N42 (2012) format (available in GammaVision 8.10 and later) the Gated,
Ungated, and Total Spectrum are all stored within the same file. This option must be checked
before spectrum acquisition begins to ensure that all events are accounted for as gated or
ungated.
ZDT Mode — See Section 1.6 for a detailed discussion of this feature. Use this droplist to
choose the Off (LTC spectrum only) or CORR_ERR (ERR and ZDT spectra) mode.13 If a
ZDT mode is selected, both spectra are stored in the same spectrum (.SPC) file. If you do not
need the ZDT spectrum, you should select Off.
13
The NORM_CORR (LTC and ZDT) mode is typically not used; see Section 1.6.2.
50
Page 61
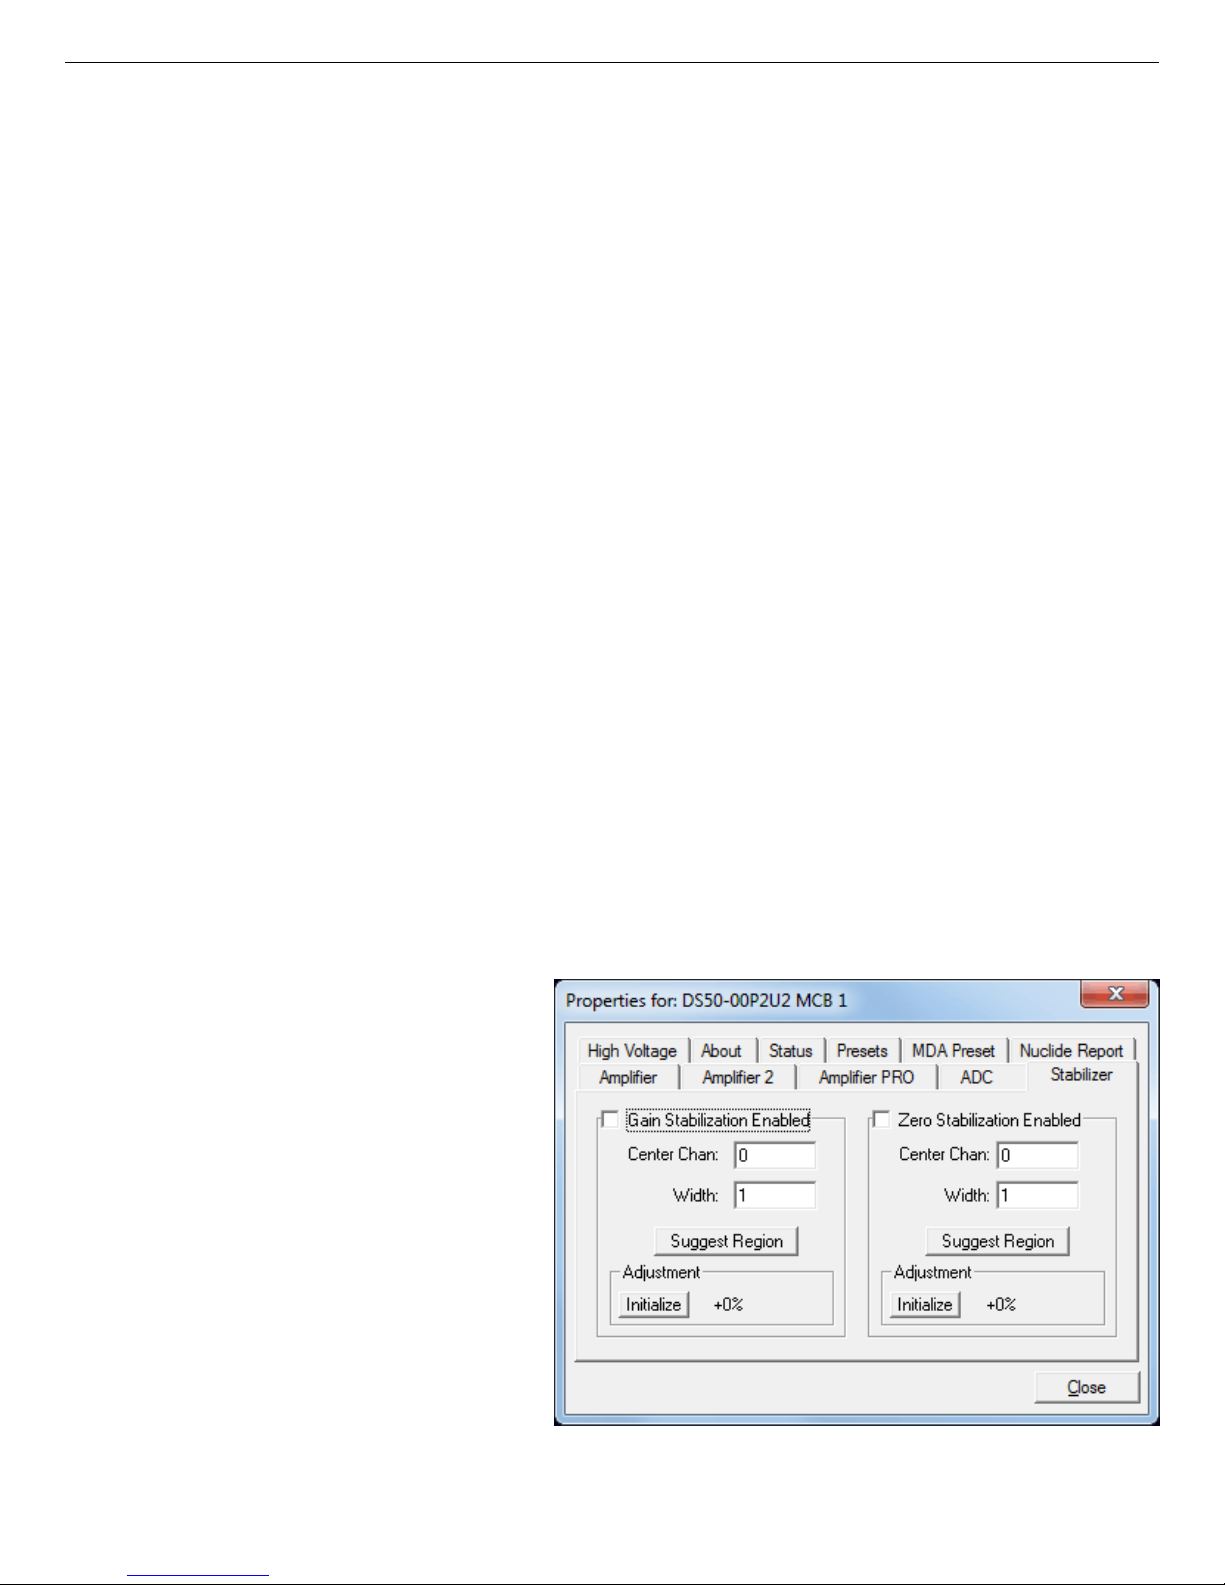
932502G / 0618 4, 5. MCB PROPERTIES IN MAESTRO
In MAESTRO, the spectrum window can show either of the two spectra. Use <F3> or
Acquire/ ZDT Display Select to toggle the display between the two spectra. In the Compare
mode, <F3> switches both spectra to the other type and <Shift+F3> switches only the compare
spectrum. This allows you to make all types of comparisons.
Conversion Gain — This sets the maximum channel number in the spectrum. If set to 16384,
the energy scale will be divided into 16384 channels. The conversion gain is entered in powers
of 2 (e.g., 8192, 4096, 2048). The up/down arrow buttons step through the valid settings for the
DSPEC 50.
Upper- and Lower-Level Discriminators — The Lower Level Discriminator sets the level of
the lowest amplitude pulse that will be stored. This level establishes a lower-level cutoff by
channel number for ADC conversions. The Upper Level Discriminator sets the level of the
highest amplitude pulse that will be stored. This level establishes an upper-level cutoff by
channel number for storage.
4.5. Stabilizer
The DSPEC 50 has both a gain stabilizer and a zero stabilizer (see Section D.2). The Stabilizer
tab (Fig. 40) shows the current values for the stabilizers. The value in each Adjustment section
shows how much adjustment is currently applied. The Initialize buttons set the adjustment
to 0. If the value approaches 90% or above, the amplifier gain should be adjusted
so the stabilizer can continue to function — when the adjustment value reaches 100%,
the stabilizer cannot make further corrections in that direction. The Center Channel
and Width fields show the peak currently used for stabilization.
To enable the stabilizer, enter the
Center Channel and Width values
manually or click the Suggest
Region button. Suggest Region
reads the position of the marker and
inserts values into the fields. If the
marker is in an ROI, the limits of
the ROI are used. If the marker is
not in an ROI: For calibrated spectra, the center channel is the marker
channel and the width is 3 times the
FWHM at this energy; and for
uncalibrated spectra, the region is
centered on the peak located within
two channels of the marker and as
Figure 40. DSPEC 50 Stabilizer Tab.
51
Page 62
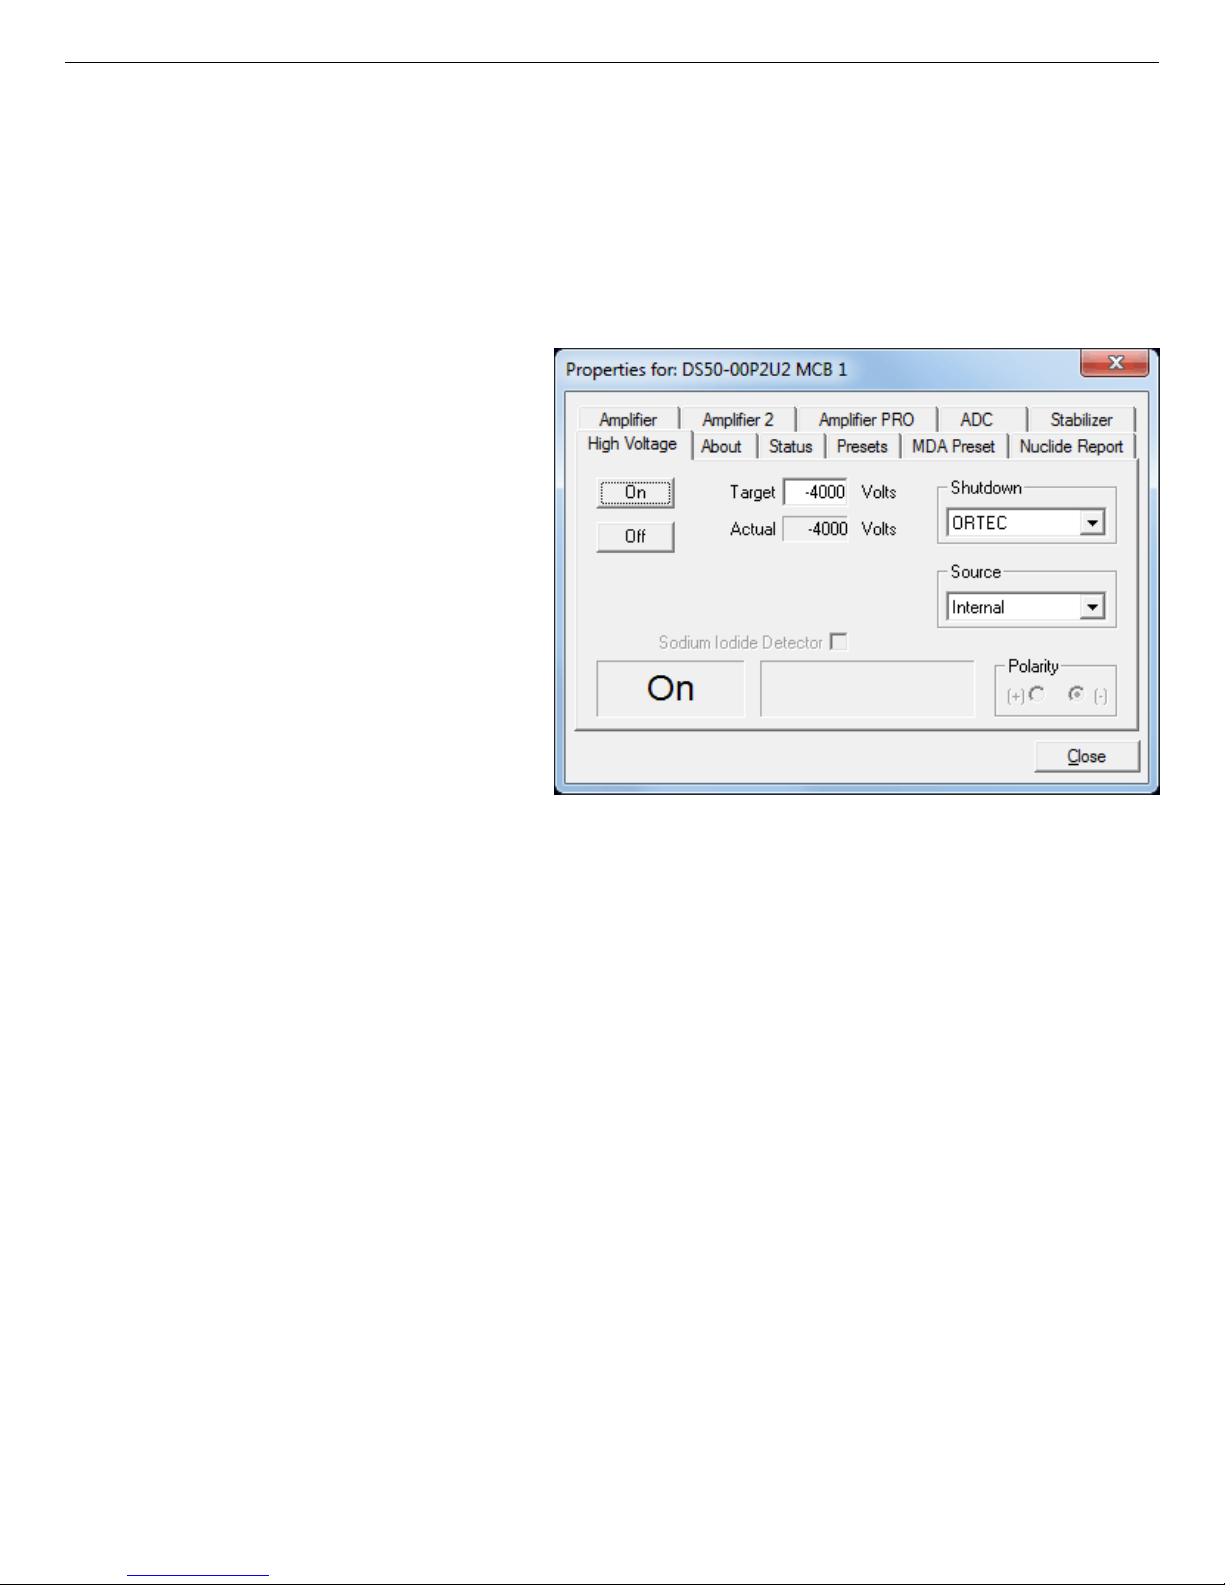
DSPEC 50® and DSPEC 502® Digital Gamma-Ray Spectrometer User’s Manual 932502G / 0618
wide as the peak. Now click the appropriate Enabled checkbox to turn the stabilizer on. Until
changed in this dialog, the stabilizer will stay enabled even if the power is turned off. When the
stabilizer is enabled, the Center Channel and Width cannot be changed. For more detailed
information on gain and zero stabilization, see Section D.2.
4.6. High Voltage
Figure 41 shows the High Voltage
tab, which allows you to turn the
HV on or off; set and monitor the
voltage; select the HV Source and
Shutdown mode; and indicate the
detector type; and Polarity. Note
that if the detector is attached via
the rear-panel DIM connector, some
of these options may be disabled or
auto-selected. For example, the
detector polarity is determined by
the SMART-1 or DIM module.
The Source is Internal for con-
Figure 41. DSPEC 50 High Voltage Tab.
ventional, non-DIM detectors;
DIM-296 for the Model 296, and
DIM/SMART for all other DIM-based detectors.
NOTE NaI detectors require the DIM-POSNAI interface and the DIM/SMART source
selection.
The shutdown types are ORTEC, TTL, and SMART. The ORTEC mode is used for all
ORTEC detectors except SMART-1 (SMART) detectors. For non-ORTEC detectors, check
with the manufacturer. The TTL mode is used for most non-ORTEC detectors.
Choose the detector Polarity (SMART-1 detectors auto-select this setting). Normally, GEM
(p-type) detectors have a positive signal and GMX (n-type) detectors have a negative signal.
To use a Sodium Iodide Detector, mark the checkbox. This changes the gain and zero
stabilizers to operate in a faster mode.
Enter the detector high voltage in the Target field, click On, and monitor the voltage in the
Actual field. Click the Off button to turn off the high voltage. The HV will not turn on if the
detector is sending a remote shutdown or overload signal. The Overload indicator means there
52
Page 63
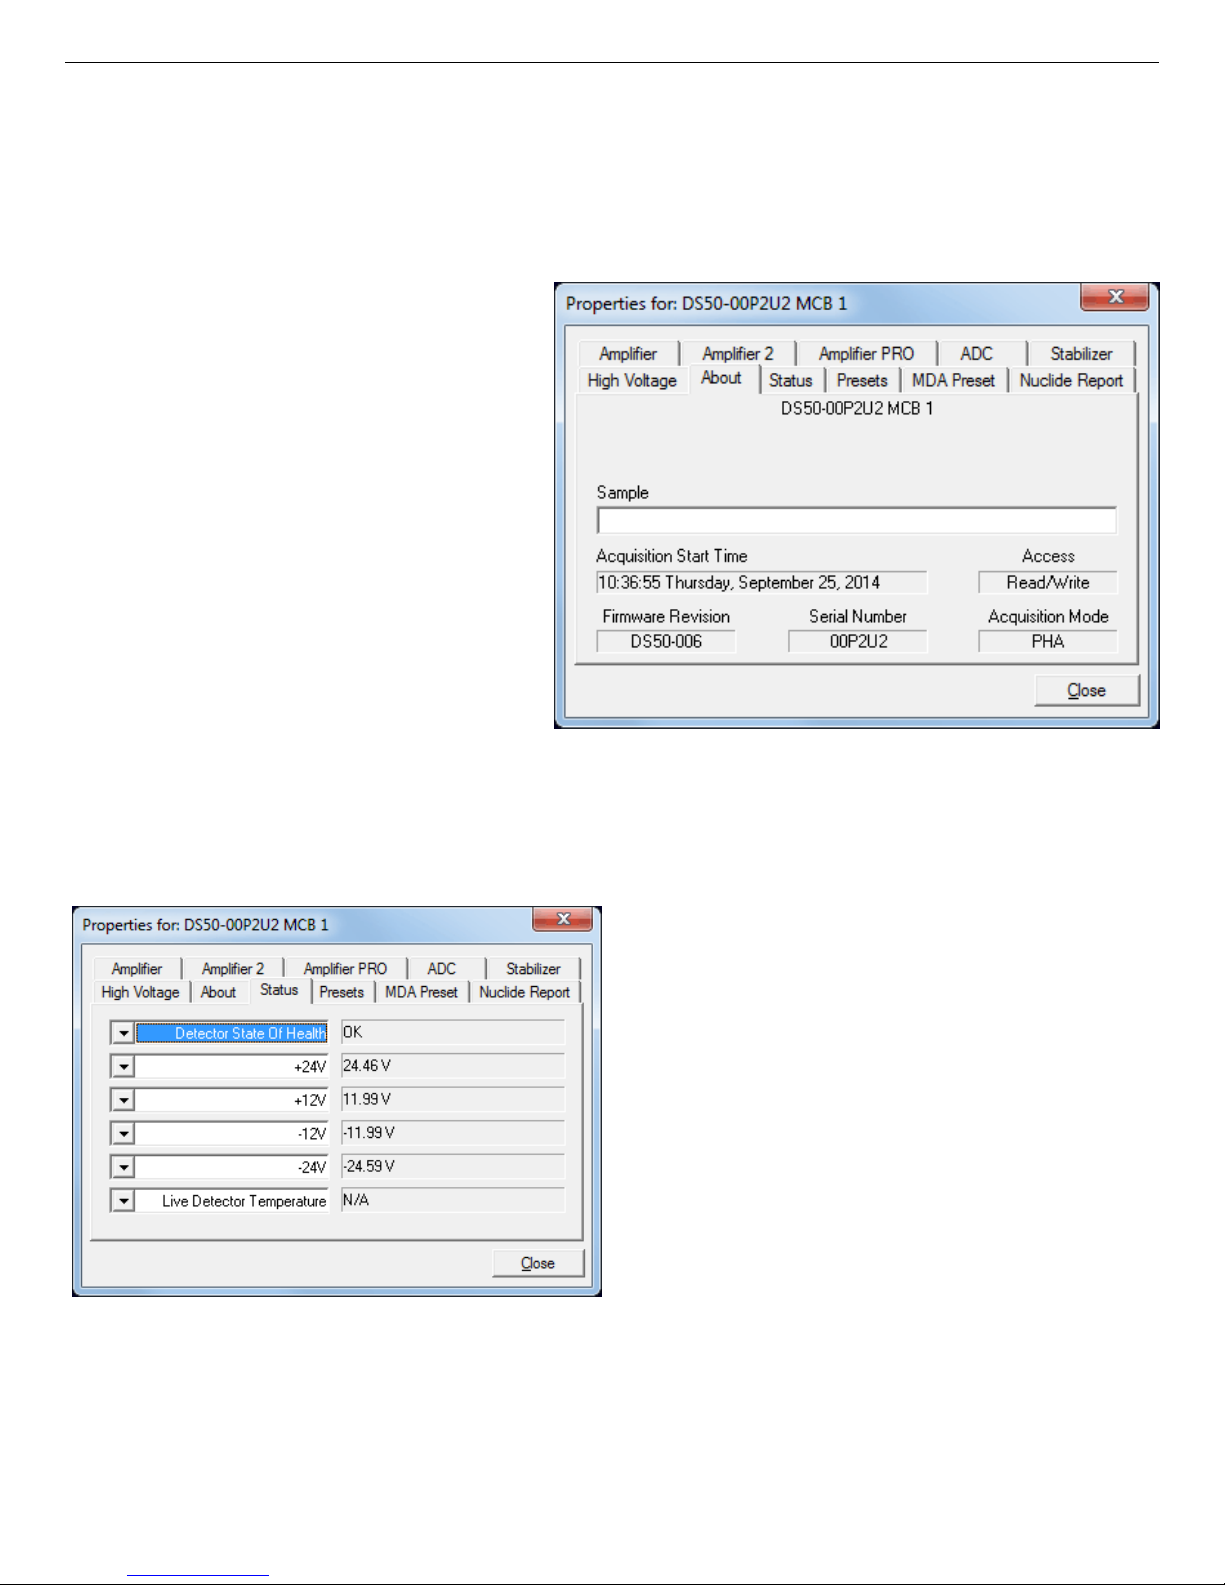
932502G / 0618 4, 5. MCB PROPERTIES IN MAESTRO
is a bad connection in your system. The Shutdown indicator means that either the detector is
warm, or you have chosen the wrong Shutdown or Source mode.
4.7. About
This tab (Fig. 42) displays
hardware and firmware information about the currently
selected DSPEC 50 as well
as the data Acquisition Start
Time and Sample description.
In addition, the Access field
shows whether the Detector is
currently locked with a password (see the password discussion in the MAESTRO User’s
Manual), Read/Write indicates
that the Detector is unlocked;
Read Only means it is locked.
Figure 42. DSPEC 50 About Tab.
4.8. Status
Figure 43. DSPEC 50 Status Tab.
Figures 43 and 44 shows the Status tab for the Standard and Advanced models respectively.
You can select any six of these to be displayed simultaneously on the Status tab. The
parameters you choose can be changed at any time, so you can view them as needed. Two types
Figure 44. DSPEC 50A Status Tab.
53
Page 64

DSPEC 50® and DSPEC 502® Digital Gamma-Ray Spectrometer User’s Manual 932502G / 0618
of values are presented: OK or ERR, and numeric value. The SOH parameters return either
OK or ERR. If the state is OK, the parameter stayed within the set limits during the spectrum
acquisition. If the parameter varied from the nominal value by more than the allowed limit, the
ERR is set until cleared by the program. The numeric values are displayed in the units reported
by the DSPEC 50. The Security, Detector temperature, and Live detector temperature
are used by SMART-1 detectors and display N/A for non-SMART-1 detectors. However, in
this release of the DSPEC 50, the Detector temperature and Live detector temperature
return N/A for both SMART-1 and non-SMART-1 detectors.
Detector State of Health
Returns OK or an error message describing a problem with detector power or bias.
Counter A (Sample Ready) (Advanced Models Only)
Displays the current input counter value for the Sample Ready port. This counter is cleared
and started with spectrum acquisition.
Counter B (Gate) (Advanced Models Only)
Displays the current input counter value for the Gate port. This counter is cleared and started
with spectrum acquisition.
+24 volts
This is the current value of the +24 volt supply.
+12 volts
This is the current value of the +12 volt supply.
!12 volts
This is the current value of the !12 volt supply.
!24 volts
This is the current value of the !24 volt supply.
High Voltage
This is the current value of the high voltage bias supply.
Figure 45 shows the Presets tab. MDA presets are shown on a separate tab.
The presets can only be set on an MCB that is not acquiring data (during acquisition the preset
field backgrounds are gray indicating that they are inactive). You can use any or all of the pre-
54
4.9. Presets
Page 65
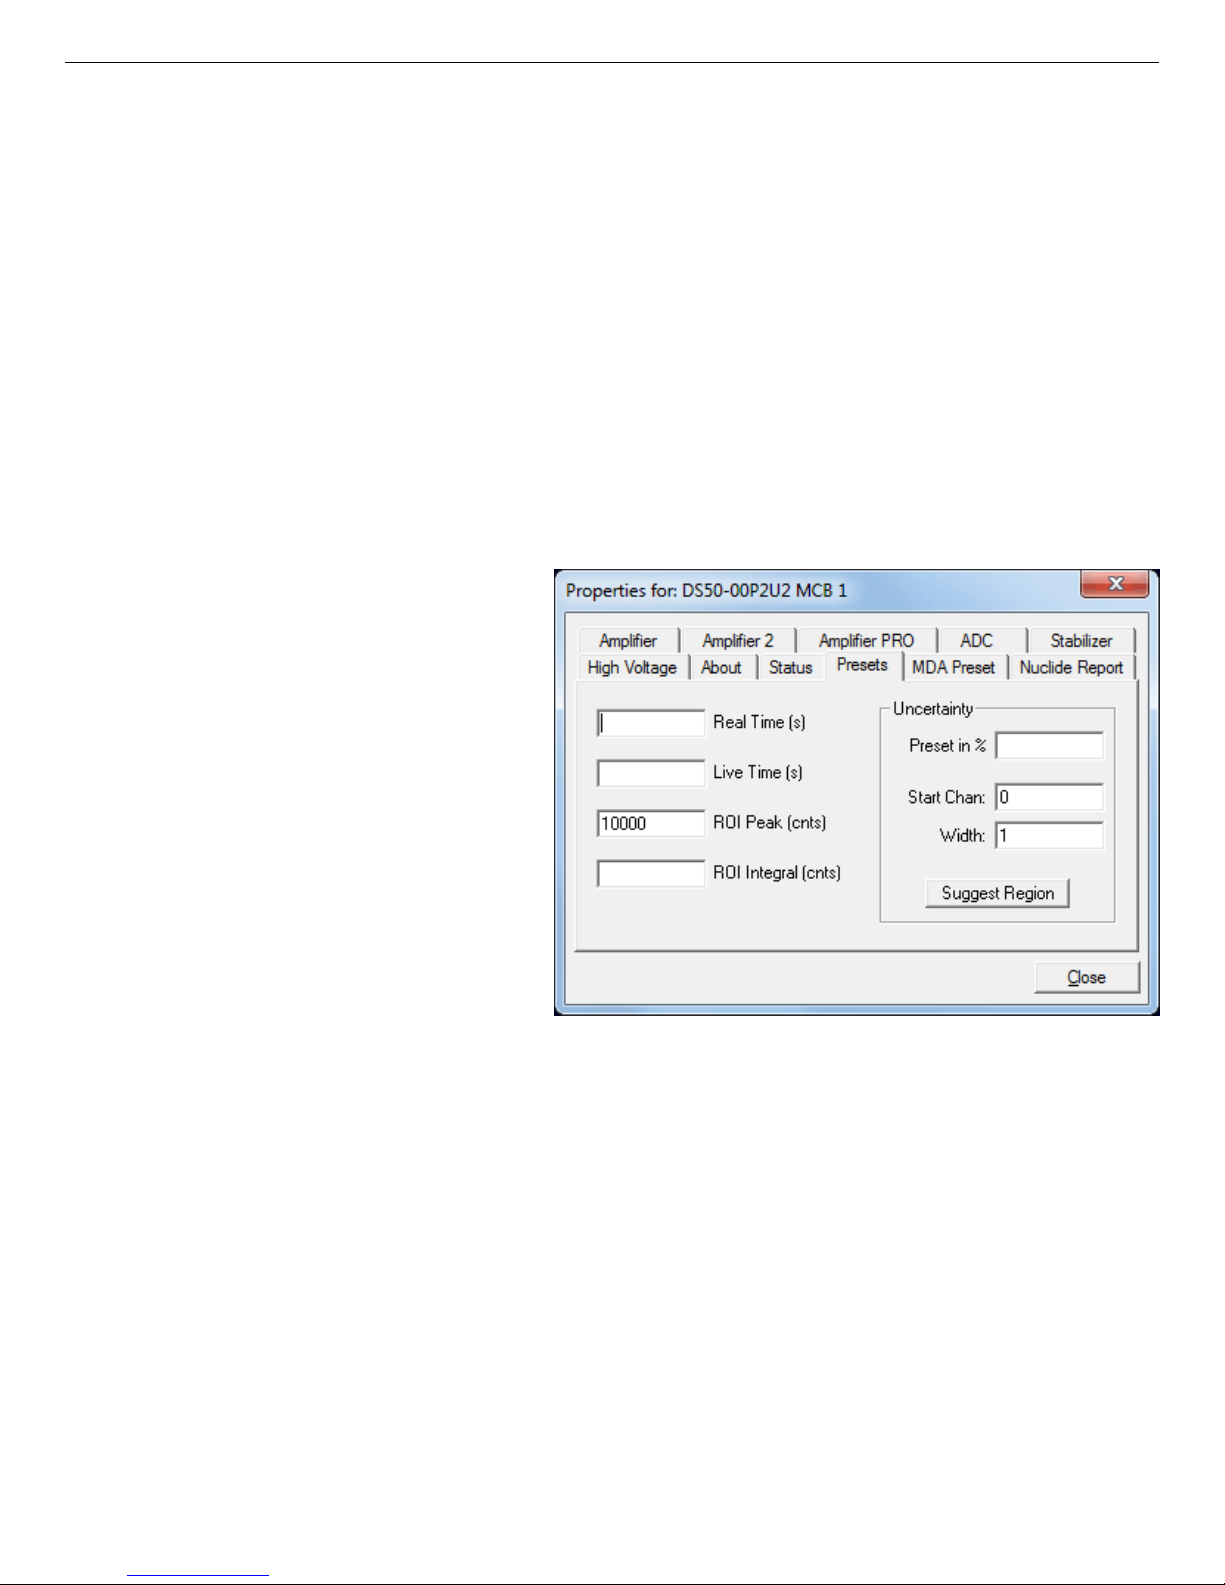
932502G / 0618 4, 5. MCB PROPERTIES IN MAESTRO
sets at one time. To disable a preset, enter a value of zero. If you disable all of the presets, data
acquisition will continue until manually stopped.
When more than one preset is enabled (set to a non-zero value), the first condition met during
the acquisition causes the MCB to stop. This can be useful when you are analyzing samples of
widely varying activity and do not know the general activity before counting. For example, the
Live Time preset can be set so that sufficient counts can be obtained for proper calculation of
the activity in the sample with the least activity. But if the sample contains a large amount of
this or another nuclide, the dead time could be high, resulting in a long counting time for the
sample. If you set the ROI Peak preset in addition to the Live Time preset, the low-level
samples will be counted to the desired fixed live time while the very active samples will be
counted for the ROI peak count. In this circumstance, the ROI Peak preset can be viewed as a
“safety valve.”
The values of all presets for the
currently selected MCB are shown
on the Status Sidebar. These values
do not change as new values are
entered on the Presets tab; the
changes take place only when you
Close the Properties dialog.
Enter the Real Time and Live
Time presets in units of seconds
and fractions of a second. These
values are stored internally with a
resolution of 20 milliseconds (ms)
since the MCB clock increments
Figure 45. DSPEC 50 Presets Tab.
by 20 ms. Real time means elapsed
time or clock time. Live time refers
to the amount of time that the MCB is available to accept another pulse (i.e., is not busy), and
is equal to the real time minus the dead time (the time the MCB is not available).
Enter the ROI Peak count preset value in counts. With this preset condition, the MCB stops
counting when any ROI channel reaches this value unless there are no ROIs marked in the
MCB, in which case that MCB continues counting until the count is manually stopped.
Enter the ROI Integral preset value in counts. With this preset condition, the MCB stops
counting when the sum of all counts in all ROI channels (regardless of the number of ROIs)
reaches this value. This has no function if no ROIs are marked in the MCB.
55
Page 66

DSPEC 50® and DSPEC 502® Digital Gamma-Ray Spectrometer User’s Manual 932502G / 0618
The Uncertainty preset stops acquisition when the statistical or counting uncertainty of a userselected net peak reaches the value you have entered. Enter the Preset in % value as percent
uncertainty at 1 sigma of the net peak area. The range is from 99% to 0.1% in 0.1% steps. You
have complete control over the selected peak region. The region must be at least 7 channels
wide with 3 channels of background on each side of the peak. Note that MAESTRO calculates
this preset once per 40 seconds. Therefore, the software will continue data acquisition up to
40 seconds after the preset has been reached, and the uncertainty achieved for a high count-rate
sample may be lower than the preset value.
Use the Start Channel and Width fields to enter the channel limits directly, or click Suggest
Region. If the marker is positioned in an ROI around the peak of interest, Suggest Region
reads the limits of the ROI with the marker and display those limits in the Start Chan and
Width fields. The ROI can be cleared after the preset is entered without affecting the
uncertainty calculation. If the marker is not in positioned in an ROI: for calibrated spectra, the
start channel is 1.5 times the FWHM below the marker channel, and the width is 3 times the
FWHM; for uncalibrated spectra, the region is centered on the peak located within two
channels of the marker and as wide as the peak.
The net peak area and statistical uncertainty are calculated in the same manner as for the
MAESTRO Peak Info command.
4.10. MDA Preset
The MDA preset (Fig. 46, 48, 50) can monitor up to 20 nuclides at one time, and stops data
collection when the values of the minimum detectable activity (MDA) for all of the userspecified MDA nuclides reach the needed value. Presets are expressed in Bq, and are evaluated
every 40 seconds. The detector must be calibrated for energy in all spectroscopy applications,
and for efficiency in all applications but MAESTRO.
The MDA presets are implemented in the MCB (i.e., the entries you make on this screen are
saved in the MCB memory), and have no direct link to MDA methods selected in the analysis
options for applications such as GammaVision, ScintiVision, ISOTOPIC, etc. The MDA preset
calculation uses the following formula:
where:
a, b, and c are determined by the MDA criteria you choose.
56
Page 67
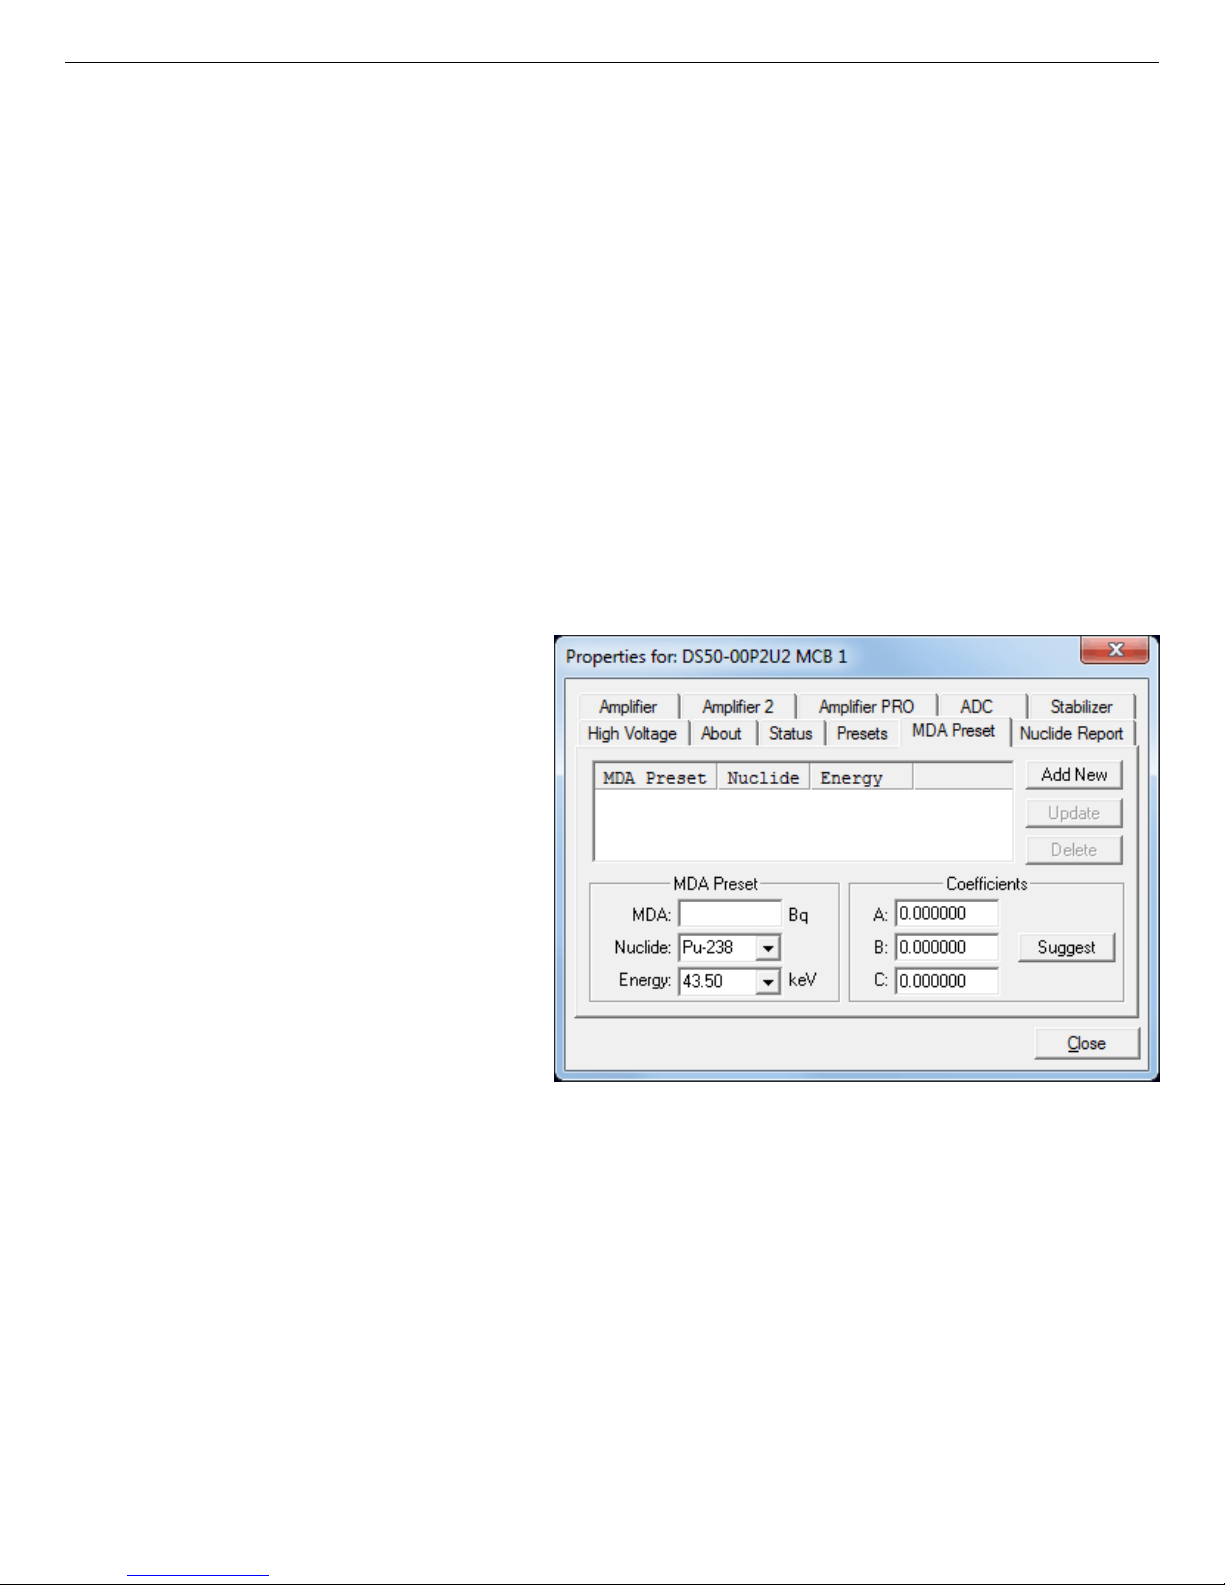
932502G / 0618 4, 5. MCB PROPERTIES IN MAESTRO
Counts is the gross counts in an ROI that is 2.5×FWHM around the target peak energy.
Live time is evaluated in 40 second intervals for the MDA presets.
CorrectionFactor is the product of the calibration efficiency at the specified peak energy and
the peak’s branching ratio (yield) as listed in the working (active) library.
NOTE MAESTRO does not support efficiency calibration. The efficiency component in
the CorrectionFactor is set to 1.0; the preset field is labeled Correction instead of
MDA; and the preset is based on counting activity (cA) instead of becquerels. You
can enter the MDA preset either in counts; or corrected for factors such as sample
volume, attenuation, or calculated efficiency. For example, if you manually
calculate the efficiency for a peak, you can enter a corrected MDA target value by
multiplying the desired MDA value times the calculated efficiency, and entering
the product as the Correction.
To add an MDA preset, enter the
preset value in the MDA or Corre-
ction field; select the Nuclide and
Energy; enter the desired values
for coefficients a, b, and c; then
click Add New.
To edit an existing preset, click to
highlight it in the table. This will
load its Nuclide, Energy, and coefficients in the lower sections of the
dialog. Change as needed, then
click Update.
To remove a preset, click to high-
Figure 46. DSPEC 50 MDA Preset Tab.
light it in the table, then click Delete.
IMPORTANT These MDA presets are not dynamically calculated. Each time you add an
MDA preset to this table, its CorrectionFactor value is calculated and stored
in the MCB’s memory. If you then load a different library, change the
efficiency calibration, or change the system geometry, the spectroscopy
application will not update the existing CorrectionFactors, and your MDA
presets may no longer be applicable. When using spectrum analysis
applications such as GammaVision, you can create an analysis options file
(.SDF) for each system geometry that you use; and include in it a set of MDA
57
Page 68
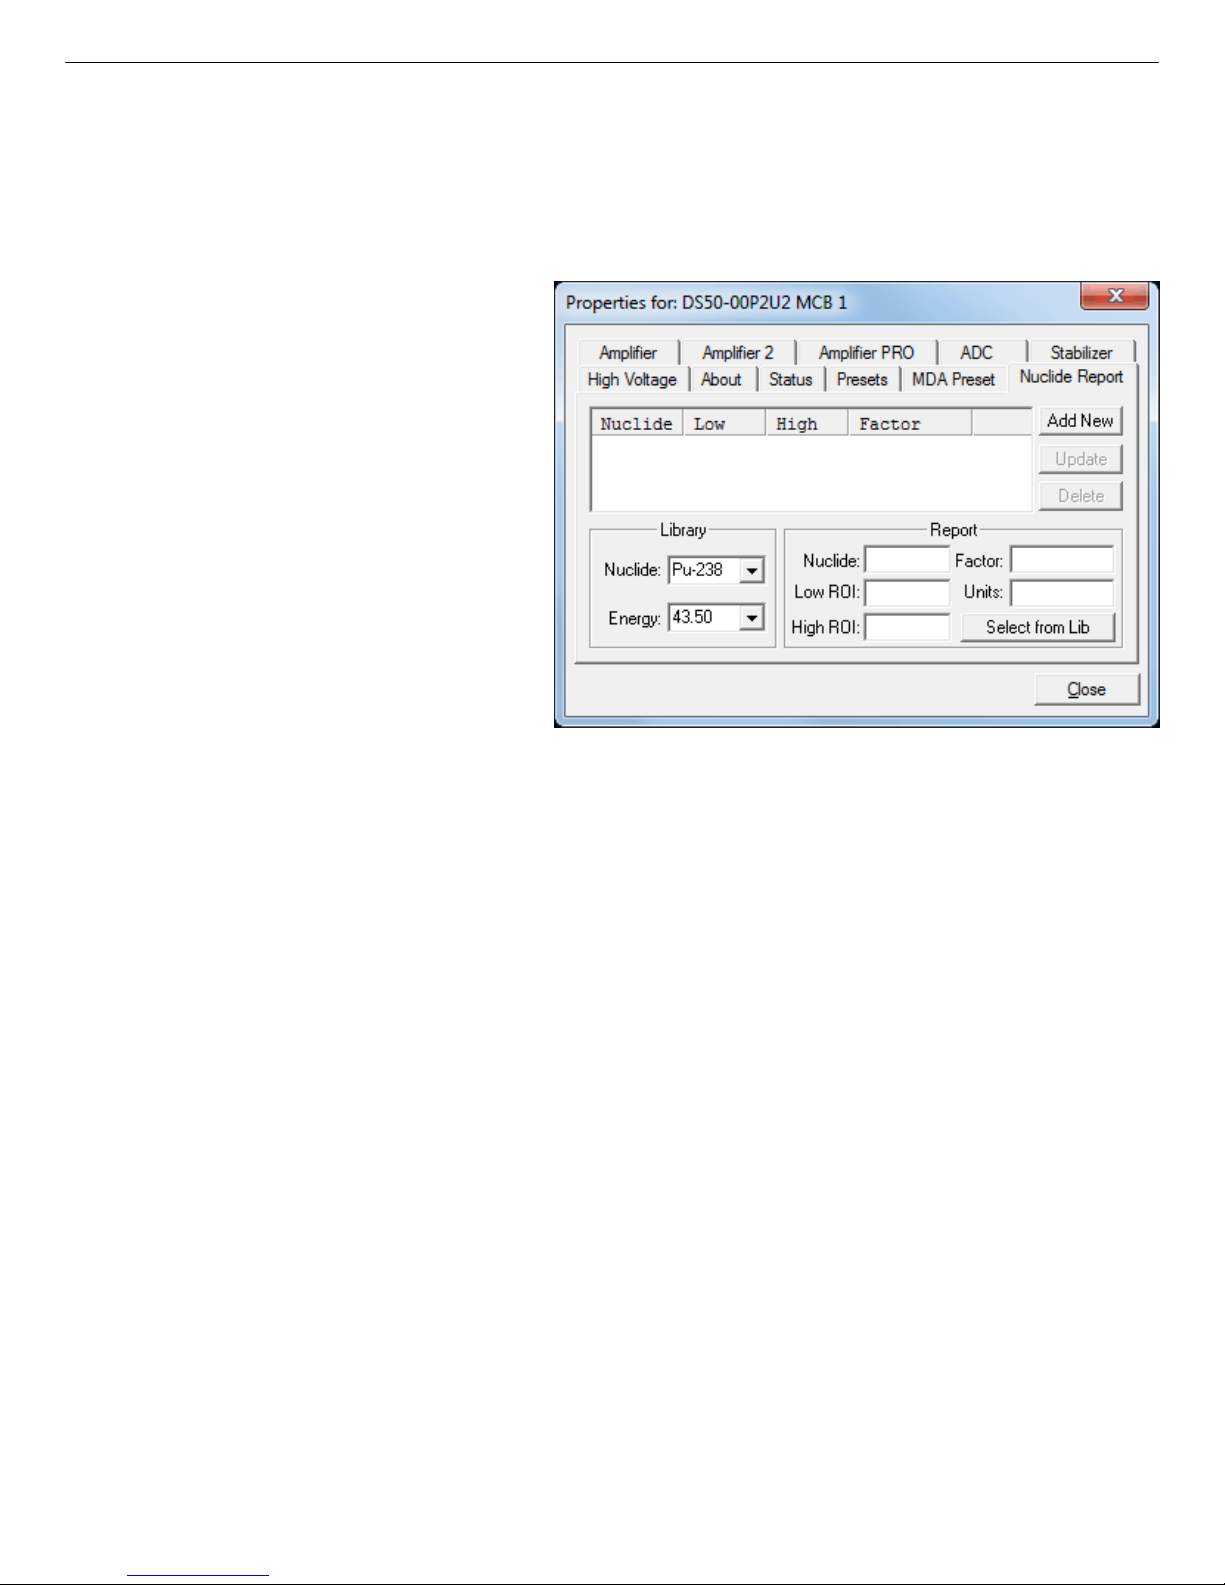
DSPEC 50® and DSPEC 502® Digital Gamma-Ray Spectrometer User’s Manual 932502G / 0618
presets specific to that geometry, efficiency calibration, and nuclide library.
You can then recall this tailored analysis options file as needed.
4.11. Nuclide Report Tab
Figure 47 shows the Nuclide
Report tab. The Nuclide Report
displays the activity of up to nine
(9) user-selected peaks. Once the
report is set up, the two lowestenergy ROIs and their respective
activity readouts are displayed
on the DSPEC 50's Spectrum
screen.
The peak area calculations in the
hardware use the same methods
as the MAESTRO Peak Info
option (see the MAESTRO user
manual), so the Nuclide Report
Figure 47. Nuclide Report Tab.
display is the same as the Peak
Info display on the selected peak in the spectra stored in the computer. The calculated value is
computed by multiplying the net peak count rate by a user-defined constant. If the constant
includes the efficiency and branching ratio, the displayed value is the activity. You enter the
nuclide label and the activity units. The report format and calculations are discussed in
Appendix D.
IMPORTANT The entries you make on this screen are saved in the MCB memory, and are
not dynamically calculated. If you change the energy calibration (i.e., if the
peak locations shift), the Nuclide Report may no longer be valid.
4.11.1. Add New
You can add Nuclide Peaks to the report manually or by selecting the peaks from the current
working library. The spectrum must be energy calibrated to use the library method.
4.11.1.1. Defining Peaks Manually
To manually define peaks, enter the Nuclide name, ROI Low (start) and High (end) channels,
multiplicative Factor and Units in the Report section; then click Add New. All nuclides in the
table use the same units, so that value need only be entered once.
58
Page 69

932502G / 0618 4, 5. MCB PROPERTIES IN MAESTRO
4.11.1.2. Selecting Peaks from the Working Library
To define report peaks using the library, select the Nuclide and gamma-ray Energy in the
Library section. This defines which gamma ray to use. Now, in the Report section, click the
Select from Lib button. Enter the Factor and Units, then click Add New to add this nuclide to
the list. The ROI for this peak will be marked in the MCB’s spectrum window, centered on the
peak energy and 3 times the width of the calibrated FWHM.
4.11.2. Edit
To change any of the current nuclides, select the nuclide in the list (use the scroll bars if
needed). This will show the current settings for this nuclide. Make any changes needed. Any or
all of the entries can be changed. When finished with the changes, click Update.
4.11.3. Delete
To remove an entry, select the entry and click Delete.
When you close the Properties dialog, all the values entered are written to the DSPEC 50 and
the two lowest-energy ROIs and corresponding activity readouts are displayed on the
DSPEC 50 screen.
4.12. Output Tab
The Output tab shown in Fig. 48 is available only on the Advanced models and allows setting
the source of output pulses on the Change Sample port. The options include Change Sample,
CRM, SCA, and ADC Gate.
Change Sample
The output pulses are established
by firmware commands such as
SET_OUTPUT_HIGH or
SET_OUTPUT_LOW, or the
CHANGESAMPLE Job command
in Maestro or GammaVision.
CRM (Count Rate Meter)
An output pulse is generated for
the width specified in the CRM
Width field whenever the Fast
Channel is triggered.
Figure 48. DSPEC 50A Output Tab.
59
Page 70
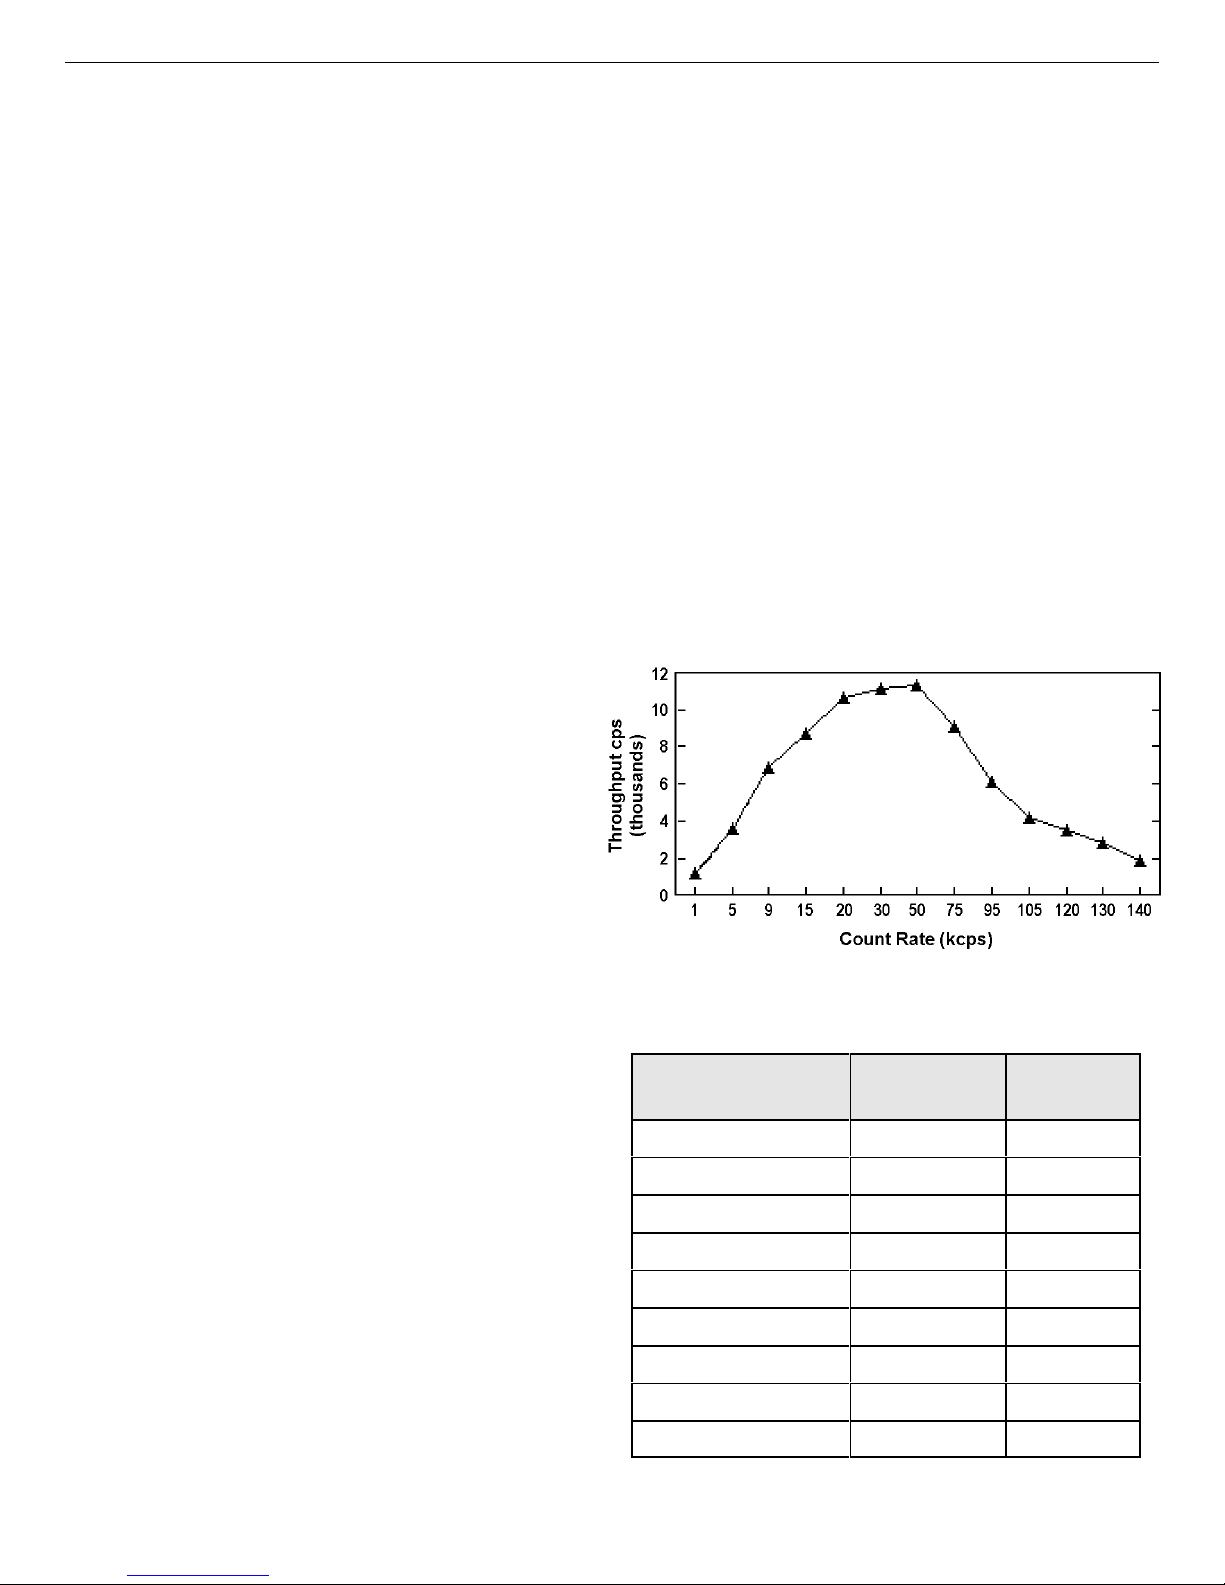
DSPEC 50® and DSPEC 502® Digital Gamma-Ray Spectrometer User’s Manual 932502G / 0618
SCA (Single Channel Analyzer)
When this option is selected the corresponding fields in the SCA section are enabled to
specify the lower and upper spectrum channels and the pulse width to generate whenever
events are processed within this region of interest. When the SCA Always On option is
checked pulses are sent to the output port continuously. When this option is not
checked, pulses are only output when spectrum acquisition is active.
ADC Gate
A TTL output pulse is generated whenever the Gate is activated during peak detection.
This output may be directed to the Sample Ready port to easily compare the Gate input
count rate to the coincidence count rate by using the Counters associated with each port.
4.13. Setting the Rise Time in Digital MCBs
To achieve the best results when using a digital spectrometer, such as the DSPEC 50, we
recommend that you set the rise time of the pulses being processed by the digital filter to the
minimum value for the resolution needed.
The pulse rise time (and also fall time) is
based on the time required for each pulse
to reach its peak value. This “peaking time”
is about twice that indicated by the conventional time constants displayed on the front
panel of commercial analog amplifiers. For
example, germanium detectors are often
specified at a 6-ìs time constant; this setting is equivalent to 12-ìs peaking (rise)
time in our digital spectrometers.
Up to some value of rise time, one
can expect improved resolution with
increasing rise time; there will,
however, be a tradeoff in maximum
throughput to memory. Figure 49 illustrates an
example of this tradeoff. ORTEC digital
spectrometers operate well above the
peak of the throughput curve. Operating there
allows these instruments to handle
an even higher rate of incoming counts,
but with less data into memory and, therefore,
a longer count time to the same detection
Figure 49. An Example of the Tradeoff Between
Throughput and Count Rate.
Table 2. Rise Time Selection Guide.
Input Count Rate
Dynamic Range
0--->20000 9000 12
0--->50000 12500 8
0--->75000 23500 4
0--->100000 37000 2.4
0--->150000 50000 1.6
0--->200k 70000 0.8
0--->220k 85000 0.6
0--->250k 100000 0.4
0--->300k 120000 0.2
Maximum
Throughput
Rise Time
(ìs)
60
Page 71

932502G / 0618 4, 5. MCB PROPERTIES IN MAESTRO
limit. It is possible to move the peak of the curve to the right (more counts to memory with
higher input count rate) by reducing the pulse rise (and fall) time, thereby trading off resolution for maximum count rate.
Table 2 is a guide to choosing a count rate that will ensure that the most efficient operation of
your digital spectrometer over the range of anticipated input count rates for your application —
that is, at or below the throughput peak — while achieving the best resolution obtainable from
the detector consistent with that requirement. Enter the rise time that best matches your
dynamic range of count rate (note that the available rise-time settings will vary by instrument;
this chart is a general guide only).
The longest rise time shown in the table is 12 ìs, even though some digital instruments can be
set for rise times as long as 23 ìs. If throughput is not an issue because all samples are low
rate, increasing the rise time beyond 12 ìs might achieve a small improvement in resolution.
For planar detectors, such as ORTEC’s GLP, Si(Li), IGLET, and IGLET-X Series, operating at
longer rise times frequently gives improved resolution.
61
Page 72

DSPEC 50® and DSPEC 502® Digital Gamma-Ray Spectrometer User’s Manual 932502G / 0618
[Intentionally blank]
62
Page 73

5. Web Interface
The Advanced models (DSPEC 50A and DSPEC 502A) include Web Page and Web Services
interfaces available for instrument control without the need for ORTEC drivers and application
software. These interfaces can be particularly useful when non-Windows Operating Systems
are desired in the user environment. Access to these features requires an ethernet connection
and a valid IP configuration to access the instrument on the network.
5.1. Web Page
The main Web Page interface shown in Fig. 50 is accessed by entering the Remote Web URL
which is displayed on the front panel Communication Control screen as described in Section
2.1.4. An internet connection is required the first time this page is accessed in order for the
spectrum display control to load.
Figure 50. DSPEC 50A Main Web Page Interface
63
Page 74

DSPEC 50® and DSPEC 502® Digital Gamma-Ray Spectrometer User’s Manual 932502G / 0618
Standard MCA Emulation functions are performed from the Home page. When accessing the
DSPEC 502 MCA1 or MCA2 is selected from the dropdown selector, and acquisitions can be
started, stopped, and cleared for the selected MCA. The Acquisition status indicator will blink
in color while acquisition is in progress and the Real Time, Live Time, and Dead Time fields
continuously update. The spectrum display can be set to automatically update at the specified
Refresh Rate when the Auto Refresh option is selected or remain static as desired depending
on the network traffic. The View Option allows for viewing the main spectrum (which is the
normal control screen that would be displayed in Maestro, GammaVision, etc.) or the
secondary spectra when acquiring in ZDT mode or Gate Route Mode which stores data in
separate memory banks.
The Download Spectrum link will save the current spectrum to the Downloads directory on
the local computer in the ANSI N42 (2012) format.
The fields and controls available from the High Voltage, ADC, Amplifier, Amplifier2,
AmplifierPro, Presets, Stabilizer, and Output pages correspond to the MCB Properties tabs
described in Section 4. Each page has an Update Settings button at the bottom to apply any
changes made on these pages to the MCA currently selected on the Main page. Note that the
information displayed on these pages are updated when the page is accessed and static
thereafter. The pages must be refreshed periodically when monitoring parameters that are
changing. For example, to observe the High Voltage ramping up after applying the target
voltage the page should be refreshed until the Actual High Voltage stabilizes.
5.2. Web Services
The Web Service is a programming interface that is hosted on the device and requires no
special drivers or software installation other than your programming environment that has the
ability to consume web services (i.e. Visual Studio, Eclipse, Python, and others). It includes
functions to control the instrument using the commands described in Section 7 as well as
retrieve the spectrum data or an entire spectrum file in the ANSI N42 (2012) format.
The process for using the Web Service is as follows:
1) Establish a Web Reference the Web Services Description Language File (WSDL) hosted
on the instrument in your development project. The methods for establishing a Web
Reference vary by development environment, so please refer to documentation for your
specific development application. The address will be the instrument IP address
followed by OrtecWS.wsdl (i.e. http://169.254.41.99/OrtecWS.wsdl).
2) Create a new object Web Service object from the Web Reference. Again, refer to your
programming environment documentation for creating objects. An example using C#
would be WSO = new WebReference1.OrtecWS()
64
Page 75

932502G / 0618 4, 5. MCB PROPERTIES IN MAESTRO
3) Establish a connection to the instrument using the OpenDet function (i.e.
WSO.OpenDet())
4) Send commands to the instrument to set hardware properties and control the instrument
using the COMMAND function. This function returns the applicable command
responses described in Section 7.
string COMMAND(int iDetIndex, string strCmd, out int iErrMac, out int iErrMic)
• iDetIndex specifies the MCA number (1 or 2).
• strCmd is any command specified in Section 7 of this user manual.
• iErrMac and iErrMic codes are returned by the function to indicate whether the
command was successful. See Section 7.1.2 to interpret the error codes.
5) The acquisition data can be accessed using the GetData function.
string GETDATA(int iDetIndex, int iView, int iStartChan, int iNumChan)
• iDetIndex specifies the MCA number (1 or 2)
• iView is the spectrum as described for the Web Page. (0=Normal View, 1=Alt1,
2=Alt2 - The content for each depends on ZDT or Gate Route Mode acquisition.)
• iStartChan is the starting channel.
• iNumChan is the number of channels to load starting from the start channel.
The spectrum data is returned as a string where each 32-bit channel counts is represented by
eight hex characters. When in PHA data acquisition mode the counts in each channel are
determined by converting the hex code in each eight characters to an unsigned decimal value.
The most significant digit is always the ROI bit, so this bit should be masked when
converting to decimal counts. When in List Mode data acquisition each 32-bit record
consisting of eight hex characters must be interpreted as described in Appendix E.
6) The full XML format N42 (2012) spectrum content can be loaded using the
GetSpectrumFile function.
string GetSpectrumFile(int iDetIndex)
• iDetIndex specifies the MCA number (1 or 2)
7) After all operations have been completed then close the detector connection using the
CloseDet function (i.e. WSO.CloseDet())
65
Page 76

DSPEC 50® and DSPEC 502® Digital Gamma-Ray Spectrometer User’s Manual 932502G / 0618
[Intentionally blank]
66
Page 77

6. SPECIFICATIONS
Display Backlit, 7 in. color touchscreen, 800 × 480 pixel resolution. Provides access to the
TCP/IP interface; and displays spectrum, stabilizer, bias, live-time, and dead-time readouts. In
addition to the control and data display screens, you may import a maximum of 9 .JPG-format
image files for timed, cyclical display.
System Gain Settings
! Coarse Gain 1, 2, 4, 8, 16, 32, 64, 128
! Fine Gain 0.5 to 1.1
The available range of gain settings supports all types of HPGe detectors. Specifically, the following maximum energy values are achievable using the standard ORTEC preamplifier (maximum to minimum gain):
! COAX 187 keV–12 MeV
! GLP/SLP 16.5 keV–1 MeV
14
Preamplifier Software-selectable as either resistive or TRP preamplifier.
Amplifier Input Polarity Software-selectable.
System Conversion Gain Software-selectable as 16384, 8192, 4096, 2048, 1024, or 512
channels. Advanced models also include 256, 32768, and 65536 settings.
Digital Filter Shaping-Time Constants
! Rise time 0.8 ìs to 23 ìs in steps of 0.2 ìs.
! Flattop 0.3 to 2.4 in steps of 0.1 ìs.
Corrections
! Dead-Time Correction Extended live-time correction according to Gedcke-Hale
method. Accuracy: area of reference peak changes <±3% from 0 to 50,000 cps.
! Zero Dead-Time (ZDT) Correction When ZDT mode is enabled, dead-time losses are
accounted for by taking very short acquisitions and applying a correction in real time —
as the data are coming in — to the number of counts in the spectrum. This technique
allows the distribution of gamma-rays to change while the acquisition is in progress, yet
14
For the legacy LO-AX and IGLET-X detector types, the respective energy ranges are 94 keV–6 MeV and
8 keV–500 keV.
67
Page 78
DSPEC 50® and DSPEC 502® Digital Gamma-Ray Spectrometer User’s Manual 932502G / 0618
the total counts in each of the peaks is correct. For a detailed discussion, see Section 1.6.
! Low-Frequency Rejector (LFR) When ON, removes low-frequency (<3 kHz) input
noise from spectrum., as discussed in Section 1.5.
! Resolution Enhancer Correct for charge trapping by “training” the spectrometer to
accommodate the particular performance of your detector; see the discussion in
Section 1.3.
! Enhanced Throughput Mode Protection time range from 0.1 ìs to 200 ìs in 25 ns
increments. See Section 1.4.
LFR Mode Highest Throughput
(minimum Protection Time)
Off (Rise Time + flattop) (2 × Rise Time + Flattop)
On (3 × Rise Time + 2 × Flattop) (6 × Rise Time + 3 × Flattop)
Lowest Throughput
(maximum Protection Time)
! List Mode In this mode, each detectable event that would normally be histogrammed as
a spectrum is sent to the computer in the form of a pulse-height value along with a time
stamp that indicates the time the pulse arrived. The data can be analyzed by the computer
in real time to determine if some significant event has occurred, or can be streamed to
disk for analysis at a later time. See Appendix E.
Linearity
! Integral Nonlinearity <±0.025% over top 99.5% of spectrum.
! Differential Nonlinearity <±1% over top 99% of range.
Digital Spectrum Stabilizer
! Stabilization Peak centroid (zero and gain) channel 2 to 16384 (65536 for Advanced
models); stabilization window width (zero and gain) ±1 to ±256 channels.
! Zero Correction Resolution ±64 channels with a minimum adjustment of 0.1 channel
out of 16384 total channels.
! Gain Correction Resolution 0.00025% (from 99.5% to 100.5% in 4096 steps).
System Temperature Coefficient
! Gain <50 ppm/EC (typically <30 ppm/EC).
! Offset <5 ppm/EC, with rise and fall times of 12 ìs and flattop of 0.8 ìs (similar to
analog 6 ìs shaping).
68
Page 79

932502G / 0618 67. SPECIFICATIONS
Maximum System Throughput >100,000 cps with LFR off, >34,000 cps with LFR on;
depends on shaping parameters.
Pulse Pileup Rejector Automatically set threshold. Pulse-pair resolution typically 500 ns. (See
the discussion of the Noise Rejection Level control on page 46.)
Automatic Digital Pole Zero Adjustment Can be set automatically or manually. Remote
diagnostics via Insight Virtual Oscilloscope mode in MAESTRO.
Digital Gated Baseline Restorer Software-controlled adjustment of the restorer rate (Fast,
Slow, and Auto).
LLD Digital lower-level discriminator set in channels. Hard cutoff of data in channels below
the LLD setting.
ULD Digital upper-level discriminator set in channels. Hard cutoff of data in channels above
the ULD setting.
Ratemeter Monitor the input count rate on the DSPEC 50 display or computer screen.
Battery Internal battery-backed up memory to maintain settings in the event of a power
interruption.
Presets Multiple presets can be set on any or all of the following:
! Real Time Stops data collection when the real time reaches this value.
! Live Time Stops data collection when the live time reaches this value.
! ROI Integral Integral count stops data collection when the sum of counts in all ROI
channels reaches this value.
! ROI Peak Peak count stops data acquisition when the count in any ROI channel reaches
this value (maximum value of 231!1 counts [2×10⁹]).
! Uncertainty Sets the required statistical accuracy on a key peak (for example: stop
counting when the activity of 60Co is known to be better than 5%).
! Multi-Nuclide MDA Stops data collection when the value of the minimum detectable
activity (MDA) for up to 20 user-specified MDA nuclides reaches the preset value. The
presets are implemented in hardware so the computer does not have to poll the
DSPEC 50. See Section 4.10, 4.12, 5.1, 5.2 for details on the MDA preset calculation.
69
Page 80

DSPEC 50® and DSPEC 502® Digital Gamma-Ray Spectrometer User’s Manual 932502G / 0618
6.1.1. Inputs and Outputs
Note that each chassis (DSPEC 50 or DSPEC 502) has only one ac input power module, USB
connector, Ethernet connector, SD card slot, and RESET port. Otherwise, each MCB has the
following set of inputs and outputs.15
DIM Multi-pin connector (13W3) carries the following:
! Preamp Power 1 W maximum (+12V, !12V, +24V, !24V, 2 GND)
! Analog In Normal amplifier input
! Inhibit For TRP or gate
! Battery Power (5 V–12 V) for DIM
! HV control
! SMART-1 HPGe detector control
NOTE NaI detectors can be used with the DSPEC 50 only in conjunction with the ORTEC
DIM-POSNAI interface module and the rear-panel DIM connector.
INPUT Rear-panel BNC accepts preamplifier signals of either polarity, with rise times less
than the selected flat top setting and exponential decay time constant in the range of 40 ìs to
infinity (including TRP and pulsed-optical [POF] preamplifiers). Input impedance >500 Ù, input
is dc-coupled and protected to ±12 V.
GATE IN Rear-panel BNC accepts 3.3 V (5 V tolerant) slow-positive NIM input; softwareselectable as off, coincidence, or anticoincidence. ADC GATE signal must precede and overlap
the flat top region by 0.5 ìs, and extend beyond the flat top region by 0.5 ìs. InSight Oscilloscope allows easy alignment of the ADC GATE signal with the digital output pulse. The
Advanced models have configurable coincidence and gate timing options to align the gate to the
peak detection time and have a counter associated with TTL pulses on the Gate port.
INHIBIT IN Rear-panel BNC connector accepts 3.3 V (5 V tolerant) reset signals from TRP or
POF preamplifiers. Positive NIM logic or TTL level can be used. Inhibit input initiates the
protection against distortions caused by preamplifier reset. This includes turning off the baseline
restorer, monitoring the overload recovery, and generating the pileup reject and busy signals for
the duration of the overload. These last two signals are used internally to provide information to
the dead-time correction circuitry.
PREAMP POWER Rear-panel, 9-pin D connector; provides ±24 V and ±12 V for preamplifier power.
15
On the DSPEC 502, some input labels are abbreviated due to space constraints; e.g., SAMPLE READY IN is
abbreviated as SMPL RDY, CHANGE SAMPLE IN becomes CHG SMPL, and so on.
70
Page 81

932502G / 0618 67. SPECIFICATIONS
HIGH VOLTAGE (one HV module per chassis)
! Positive 0–5 kV Rear-panel SHV connector, 500 V–5 kV. Computer controlled. Only
active when the unit is set for positive bias.
! Negative 0–5 kV Rear-panel SHV connector, 500 V–5 kV. Computer controlled. Only
active when the unit is set for negative bias.
SHUTDOWN IN Rear-panel BNC turns off the bias supply voltage when the detector is warm.
Software-selectable ORTEC or TTL mode (SMART-1 detectors auto-select the SMART shutdown mode). In ORTEC mode, the detector Bias Shutdown must be connected to this input or
the high voltage will not turn on.
CHANGE SAMPLE OUT Rear-panel BNC connector, TTL compatible. The output signal is
configurable with the Advanced models as described in Section 4.12.
SAMPLE READY IN Rear-panel BNC connector accepts TTL level signal from sample
changer. The Advanced models have a counter associated with TTL pulses on the Sample
Ready port.
ETHERNET Standard 10/100 Mbit Ethernet connection. Link and Activity LEDs are integrated into the connector. Use dynamic or static IP addressing.
USB Emulates a USB connection. ORTEC CONNECTIONS software supports up to 255 USB-
connected devices per computer.
SD SecureDigital™ (SD) memory card slot for uploading a maximum of 9 optional .JPG-format
image files.
RESET For system maintenance performed in conjunction with the ORTEC Global Service
Center.
6.1.2. Electrical and Mechanical
Dimensions 42.6 cm W × 35.6 cm D × 15.3 cm H (16.8 in. W × 14.0 in. D × 6.0 in. H).
Weight 11 kg (24.3 lbs).
Operating Temperature Range 0EC to +50EC, including touchscreen.
71
Page 82

DSPEC 50® and DSPEC 502® Digital Gamma-Ray Spectrometer User’s Manual 932502G / 0618
Power 100–240 V ac, 47–63 Hz, 110 watts. For 100 or 120 V ac line voltage, one fuse, 2 A
(SB) size 3AG required. For 230 or 240 V ac line voltage, two fuses, 1 A(T) size 5×20 mm
required.
CE Conforms to CE standards for radiated and conducted emissions, susceptibility, and lowvoltage power directives.
6.2. Feature Mask Bits
The following table describes the feature bits from the SHOW_FEATURES and
SHOW_FEATURES_EXT commands. If the feature is supported in the DSPEC 50 the bit is set
to 1; if the feature is not supported, the bit is 0.
Bit Meaning
0 Software-selectable conversion gain
1 Software-selectable coarse gain
2 Software-selectable fine gain
3 Gain stabilizer
4 Zero stabilizer
5 PHA mode functions available
6 MCS mode functions available
7 List mode functions available
8 Sample mode functions available
9 Digital Offset (e.g., 920)
10 Software-selectable analog offset
11 HV power supply
12 Enhanced HV (SET_HV, SET/SHOW_HV_POL, SHOW_HV_ACT)
13 Software-selectable HV range (ENA_NAI, DIS_NAI)
14 Auto PZ (START_PZ_AUTO)
15 Software-selectable manual PZ (SET/SHOW_PZ)
16 Battery-backed, real-time clock (SHOW_DATE/TIME, SHOW_DATE/TIME_START)
17 Sample changer support (SET/SHOW_OUTPUT, SHOW_INPUT)
18 One-button acquisition (ENA/DIS/SHOW_TRIG_SPEC, MOVE)
19 Nomadic (likely to move between opens)
20 Local app data (SET_DATA_APP, SHOW_DATA_APP)
21 Software-retrievable serial number
22 Power management commands
23 Battery status support (SHOW_STAT_BATT)
24 Software-selectable AMP polarity (SET/SHOW_GAIN_POLAR)
72
Page 83

932502G / 0618 67. SPECIFICATIONS
Bit Meaning
25 Support for flattop optimization (ENA/DIS_OPTI)
26 Stoppable AutoPZ (STOP_PZ_AUTO)
27 Network support (e.g., DSPEC)
28 Multi-drop serial support (e.g., MicroNOMAD®)
29 Software-selectable DPM address (SET_DPM_ADDR)
30 Multiple devices (e.g., 919)
31 Software-selectable ADC gate mode (SET_GATE...)
32 Software-downloadable firmware
33 Time histogramming functions available (e.g., 9308)
34 Software-selectable lower level discriminator
35 Software-selectable upper level discriminator
36 MCS-mode SCA input available
37 MCS-mode positive TTL input available
38 MCS-mode fast-negative NIM input available
39 MCS-mode discriminator input available
40 Software-switchable MCS-mode discriminator edge
41 Software-programmable MCS-mode discriminator level
42 Software-programmable SCA upper and lower thresholds
43 Software-selectable MCS-mode input sources
44 Uncertainty/statistical preset (SET_UNCERT_PRES)
45 Features vary by input (SHOW_FEATURES depends on device/segment;multi-input MCBs only)
46 Software-selectable HV shutdown mode (SET/SHOW/VERI_SHUT)
47 Software-selectable shaping time constants (SET_SHAP)
48 Explorable shaping time constants (SHOW_CONFIG_SHAP)
49 Advanced shaping time (SET_SHAP_RISE, SET_SHAPE_FLAT, etc.)
50 Software-selectable BLR (ENA/DIS/SHO_BLR_AUTO SET/SHO/VERI_BLR)
51 SHOW_STATUS command supported (returns $M record)
52 Overflow preset (ENA/DIS/SHO_OVER_PRES)
53 Software-enabled, MicroNOMAD-style audio clicker (ENA/DIS_CLICK)
54 Software-readable thermistor (SHOW_THERM)
55 Floating-point fine gain (SET/SHO/VERI/LIST_GAIN_FINE)
56 Software-enabled pileup rejector. (ENA/DIS/SHO_PUR, SET/VERI_WIDT_REJ)
57 Alpha-style HV power (SHOW_HV_CURRENT)
58 Software-readable vacuum (SHOW_VACUUM)
59 Acquisition alarms (ENA/DIS/SHO_ALARM)
60 Hardware acquisition trigger (ENA/DIS/SHO_TRIG)
73
Page 84

DSPEC 50® and DSPEC 502® Digital Gamma-Ray Spectrometer User’s Manual 932502G / 0618
Bit Meaning
61 Ordinal numbers for shaping times (SET_SHAP 0, SET_SHAP 1, ...)
62 Query gain ranges (LIST/VERI_GAIN_FINE, ..._COAR, ..._CONV)
63 Routable inputs (SET/SHOW_INPUT_ROUTE)
64 External dwell support (ENA/DIS_DWELL_EXT)
65 Selectable SUM or REPLACE MCS modes (ENA/DIS_SUM)
66 External start of pass support (ENA/DIS/SHO_START_EXT)
67 Explorable with MCS list commands (LIST_SOURCE, LIST_LLSCA, LIST_ULSCA)
68 Device supports the MDA preset
69 Software-selectable ADC type (Matchmaker™)
70 Has ability to daisy-chain MCBs (DART)
71 ZDT functions available (DSPEC Plus, DSPEC jr, DSPEC jr 2.0, DSPEC Pro)
72 DSPEC Plus-style Insight triggering (LIST/SET_TRIG_SAMP)
73 Multiple inputs per connection (for example, OCTÊTE® Plus)
74 Hardware count-rate meter (SH_CRM)
75 Has multiple ZDT modes (SET/SHOW/LIST_MODE_ZDT)
76 Has multi-nuclide MDA preset
77 Has MCS Replace then Sum Mode (SET_RPLSUM)
78 Has programmable external dwell voltage capability
79 No Peak Preset feature (M3CA and OASIS)
80 Programmable pulser (OASIS)
81 Programmable Vacuum/HV interlock (OASIS)
82 Programmable Current/HV interlock (OASIS) 0
83 Explorable Stabilizer (LIST_GAIN_ADJU, LIST_ZERO_ADJU)
84 Has programmable input impedance (MCS)
85 Advanced shaping-time feature has no CUSP (digiDART, DSPEC jr 2.0, DSPEC Pro)
86 Selectable HV rise-time (SET/SHOW/LIST_HV_RISE) (SBS-60)
87 —
88 Monitor command support (SHOW_MONI_MAX/LABEL/VALUE)
89 SMART-1 Detector support (SHOW_SMART_DET, SHOW_SNUM_DET, SHOW_HV_RECO)
90 Nuclide report (SET/SHOW_NUCL_COEF, SET/SHOW_ROI_NUCL, ...)
91 Interactive Display Features Such as Nuclide Report
92 Advanced Stored Spectra (SH_SPEC_COUNT, SET/SHOW_SPEC_ID, MOVE)
93 SET/SHOW_VIEW in MCBs with Dual-Port Memory or printer port interfaces, LIST_VIEW in all
MCBs
94 Connected to MCB via RS-232 (slow) port
95 No SET_HV_POSI, SET_HV_NEGA, ENA_NAI and DIS_NAI
74
Page 85

932502G / 0618 67. SPECIFICATIONS
Bit Meaning
96 Low Frequency Rejector (ENA/DIS/SHOW_LFR)
97 Resolution Enhancer (ENA/DIS/SH_RENHANCER, SET/SHOW_RETABLE idx,val)
98 SET_MODE_RELIST for Resolution Enhancer List Mode
99 Readable Sample mode time per channel (SH_TIME_SAMPLE)
100 Adjustable Sample mode time per channel (SET/LIST_TIME_SAMPLE)
101 List Mode data streamed and formatted as in digiBASE
102 Supports ETP mode (ENA/DIS/SHOW_ETP)
103 List Mode data streamed and formatted as in DSPEC PRO
104 SET/SHOW/LIST_PZ using floating point microseconds
105 Rise time, flattop width, and cusp not user changeable from property page
106 High Voltage not user changeable from property page
107 Coarse and fine gain not user changeable from property page
108 PZ and flattop tilt not user changeable from property page
109 LFR not user changeable from property page
110 Synch List Mode is available
111 DSPEC-PRO auxiliary BNC input available
112 SET_DISPLAY is NOT used to select ZDT data view
113 ID Reports (DO_ID, SHOW_REPORT, SHOW_REPO_LINES)
114 Has neutron detector (SHOW_CRM 2 returns valid number)
115
116
List Mode data streamed and formatted like DIGIBaseE
Has the ORTEC new Alpha Instrument feature set
117 Selectable HV source
118
119
120
Has noise rejection circuits in the Fast Channel (SET/SHOW/LIST_NOISE_REJ)
Has adjustable display contrast (SET/SHOW_CONTRAST)
Has SHOW_HPRDS and SHOW_VMON 3 commands for Ping-Pong acquisition
121 DSPEC 50A LIS/SET/SHO_GATE_DELAY, LIS/SET/SHO_GATE_WIDTH
122 DSPEC 50A LIS/SET/SHO_OUT_SELE
123 DSPEC 50A LIS/SET/SHO_INH_WIDTH
124 DSPEC 50A LIS/SET/SHO_OUT_WID
125 DSPEC 50A SET/SHO_SCA, SET/SHO/SCA_WID, ENAB/DISA_SCA
126
127
128
129
130
131
DSPEC 50A SET/SHO_CRM_WID
Extended feature mask available (SH_FEAT_EXT)
DSPEC 50A LIST/SET/SHOW_FAST_COIN, ENAB/DISA_FAST_COIN
DSPEC 50A ENAB/DISA/SHOW_GATE_ROUTE
DSPEC 50A SET/SHO_THRESH_FMAN, ENAB/DISA_TRESH_FMAN
DSPEC 50A Web Services APIs
75
Page 86

DSPEC 50® and DSPEC 502® Digital Gamma-Ray Spectrometer User’s Manual 932502G / 0618
[Intentionally blank]
76
Page 87

7. FIRMWARE COMMANDS AND RESPONSES
Most software communication with the DSPEC 50 will take place through the CONNECTIONS software layer.
CONNECTIONS is used by all ORTEC software and can be accessed for other software
development with our CONNECTIONS Programmer’s Toolkit with Microsoft ActiveX® Controls
(A11). Use the DLL interface call MIOComm or the ActiveX control UCONN’s Comm method
to send commands to instruments and receive responses.
! Ethernet interface — Communication consists of sending command records to the MCB
API and receiving response records from the MCB API. Both command and response
records consist of a sequence of printable ASCII characters followed by an ASCII
carriage return. All commands eventually respond with a percent response record — so
named because the response begins with an ASCII percent sign “%” — which signifies
the completion of the command (Section 7.1.3). SHOW and STEP commands respond
with a dollar response record (which begins with an ASCII dollar sign “$”) followed by a
percent response record (Section 7.1.4). All other commands result in a single percent
response record upon completion.
! USB interface — Error codes are discussed in Section 7.1.2. SHOW and STEP
commands respond with a dollar response record (Section 7.1.4).
7.1.1. Command Records
Commands consist of a command header that may be followed by numeric parameter values.
The header consists of a verb or a verb and noun separated by an underscore; or a verb, noun,
and modifier, each separated by underscores. The first four letters of a word in a command will
always be enough to uniquely identify that word when composing commands for the instrument.
For example, the command ENABLE_GAIN_STABILIZATION can be abbreviated to
ENAB_GAIN_STAB.
Numeric parameters are unsigned integer numbers that follow the command header separated by
one or more spaces. Specific commands require multiple parameters, separated by commas, that
specify numeric quantities related to the operation of the MCB, such as live time or conversion
gain. The command SET_WINDOW 0,8192 has two parameters, 0 and 8192, which set the
window of interest to start at channel 0 and continue for 8192 channels.
Some parameters are optional and are delimited by square brackets in the command prototype
line to distinguish them from mandatory parameters (e.g., SET_WINDOW [start,length]). Commands with optional parameters can be sent to the MCB without the optional parameters, in
which case the instrument behavior will be explained in the command description.
77
Page 88

DSPEC 50® and DSPEC 502® Digital Gamma-Ray Spectrometer User’s Manual 932502G / 0618
For commands across the Ethernet interface, an optional checksum may be added to the end of
any command sent to MCB API. The checksum is a 1-byte unsigned integer sum of all of the
characters in a command, treated as unsigned integers, up to and including the comma or
space(s) that separates the checksum from the command. The checksum simply appears as an
extra parameter added to the end of the command parameter list. For commands that do not normally have parameters, the checksum appears as the only parameter separated from the header by
one or more spaces. All optional parameters must be included in a command if a checksum is to
be provided so that the checksum is not mistaken by the MCB API as a parameter. For example,
the SET_WINDOW command must include the two optional parameters, start and length, if the
checksum is provided (e.g., SET_WINDOW 0,16384,209).
7.1.2. USB-Interface Error Codes
On each completion of the command, the MCB returns a macro error code and micro error code.
The macro error code represents the general class of error with 0 meaning no error, and the
micro error code represents the sub-class of error with 0 meaning no error. In case of error
condition, you can use the MIOGetLastError (DLL interface) or GetErrMajor, GetErrMinor
(ActiveX control interface).
Macro error codes:
0 Success
1 Power-up just occurred
2 Battery-backed data lost
129 Command syntax error
131 Command execution error
132 Invalid Command
For macro code 129 (syntax error) or 131 (execution error), the following apply:
1 Invalid Verb
2 Invalid Noun
4 Invalid Modifier
128 Invalid first parameter
129 Invalid second parameter
130 Invalid third parameter
131 Invalid fourth parameter
132 Invalid number of parameters
133 Invalid command
78
Page 89

932502G / 0618 7. FIRMWARE COMMANDS AND RESPONSES
134 Response buffer too small
135 Not applicable while active
136 Invalid command in this mode
137 Hardware error
138 Requested data not found
Micro error codes:
0 Success
1 Input already started/stopped
2 Preset already exceeded
4 Input not started/stopped
64 Parameter was rounded (for decimal numbers)
128 No sample data available
7.1.3. Percent Response Records
The MCB API responds to all commands with a percent response record that signifies the completion of the command. Percent response records contain two error code numbers and a 1-byte
checksum as follows:
%aaabbbccc<CR>
where % represents the ASCII % character, aaa represents the macro error code, bbb represents
the micro error code, ccc represents the checksum and <CR> represents the ASCII carriage
return character signifying the end of the record. The macro error code represents the general
class of error with 0 meaning no error, and the micro error code represents the sub-class of error
with 0 meaning no error. Following is a list of all percent responses for the DSPEC 50.
Unconditional Success:
%000000069<CR> No errors detected. Command executed as specified.
%000005074<CR> Device already started or stopped. The START or STOP
command was ignored.
%000006075<CR> Device preset already exceeded. The START command was
ignored.
%000016076<CR> START requested but amplifier not pole zeroed since last power-
up. START was attempted anyway.
%000032074<CR> START requested but high voltage not enabled START was
attempted anyway.
%000064079<CR> Specified parameter was rounded to the closest legal value.
79
Page 90

DSPEC 50® and DSPEC 502® Digital Gamma-Ray Spectrometer User’s Manual 932502G / 0618
Note that the above responses can be combined to indicate a combination of warnings such as:
%000048081<CR> Amplifier was not pole zeroed nor was high voltage enabled. The
START was attempted anyway.
%000037079<CR> Device already started and high voltage not enabled. The
command was ignored.
%000053077<CR> Device already started, high voltage not enabled and amplifier
was not pole zeroed. The command was ignored.
%000038080<CR> Device preset already exceeded and high voltage not enabled. The
command was ignored.
%000054078<CR> Device preset already exceeded, high voltage not enabled and
amplifier was not pole zeroed. The command was ignored.
Power-Up Alert: Power-up just occurred and the selftest results are:
%001000070<CR> All power-up selftest passed.
%003000072<CR> Battery backed-up data lost.
Command Syntax Errors:
%129001082<CR> Invalid command verb.
%129002083<CR> Invalid command noun.
%129003084<CR> Invalid command verb and noun.
%129004085<CR> Invalid command modifier.
%129005086<CR> Invalid command verb and modifier.
%129006087<CR> Invalid command noun and modifier.
%129007088<CR> Invalid command verb, noun, and modifier.
%129132087<CR> Invalid command (verb, noun, and modifier valid but not
together).
Communication Errors:
%130128084<CR> Command checksum incorrect (only when optional checksum
provided).
Execution Errors:
%131128085<CR> Invalid 1st command parameter.
%131129086<CR> Invalid 2nd command parameter.
%131130078<CR> Invalid 3rd command parameter.
%131132080<CR> Invalid number of command parameters.
%131134082<CR> Invalid device or segment selected.
%131135083<CR> Command not allowed while acquisition in progress.
%131136084<CR> Command not allowed in current mode of operation.
%131137085<CR> Hardware failure detected while processing command.
80
Page 91

932502G / 0618 7. FIRMWARE COMMANDS AND RESPONSES
7.1.4. Dollar Response Records
SHOW and STEP commands respond with a single dollar response record followed immediately
by a percent response record. All valid dollar response records for each command are listed in
the command dictionary.
The following list provides the general form of each dollar response record for the MCB API. In
this list, lower case letters represent numeric values. The letters “ccc” always represent an 8-bit
unsigned checksum of all characters on the record up to but not including the checksum
characters, and <CR> represents the ASCII carriage return character.
$Axxxccc<CR> xxx is a single 8-bit unsigned number.
$Cxxxxxccc<CR> xxxxx is a single 16-bit unsigned number.
$Dxxxxxyyyyyccc<CR> xxxxx and yyyyy are 16-bit unsigned numbers.
$Exxxxxccc<CR> xxxxx is a single 16-bit alarm mask.
$Fssss...<CR> ssss... is a variable length ASCII character sequence (no checksum
is sent with this record).
$Gxxxxxxxxxxccc<CR> xxxxxxxxxx is a single 32-bit unsigned number.
$IT<CR> True response to a SHOW command (no checksum).
$IF<CR> False response to a SHOW command (no checksum).
$Jxxxxxyyyyy...ccc<CR> Response to SHOW_CONFIGURATION command.
$Mxxxxxxxxxx...ccc<CR> Response to SHOW_STATUS command.
$Nxxxyyyzzzccc<CR> xxx, yyy, and zzz are 8-bit unsigned numbers.
7.1.5. Command Catalog
This section lists each command with a description of its operation. The descriptions include a
list of any unusual responses that may result. The no-errors response from a command is a
%000000069<CR> (Ethernet interface); or a macro error code of 0 and a micro error code of 0
(USB interface). Though syntax and communication error responses may result from any command, in practice, these error responses rarely occur on systems with reliable communication
hardware running debugged software.
The commands are listed in alphabetical order, each starting with a command prototype line.
Uppercase letters, numeric digits, blank space, and special symbols such as the underscore “_”
and comma 13 “,” in the prototype line are literal text to be sent to the MCB exactly as they
appear. Lowercase letters in the prototype line represent numeric values as described in the
accompanying text; they should not be sent literally to the MCB but should be replaced by an
appropriate numeric value. Lower-case letters enclosed in quotes represent alphanumeric
character strings rather than numerical values. Items in the command prototype that are sur-
rounded by square brackets “[...]” are optional items and are not always required. In this section
81
Page 92

DSPEC 50® and DSPEC 502® Digital Gamma-Ray Spectrometer User’s Manual 932502G / 0618
the term <CR> represents the ASCII carriage return character, decimal value 13, and the character “_” represents the ASCII underscore character, decimal value 95.
CLEAR
The channels of spectral data in the window of interest (see SET_WINDOW command) are
set to zero. The live time and true time counters are also set to zero. This command is
equivalent to the combination of CLEAR_COUNTER and CLEAR_DATA commands.
CLEAR_ALL
This command is equivalent to the combination of CLEAR_COUNTER, CLEAR_DATA,
CLEAR_PRESETS, and CLEAR_ROI commands.
Non-USB Execution Errors:
%131135083<CR> The command was attempted while spectrum acquisition was
in progress. No action was taken.
CLEAR_COUNTER
The live time and true time counters are set to zero.
CLEAR_DATA
The channels of spectral data in the window of interest (see SET_WINDOW command) are
set to zero. The ROI flags are not changed, nor are the presets changed.
CLEAR_LIST
Clears data and resets acquisition in List Mode. The response is the same as the CLEAR
command.
CLEAR_MDA_PRESET
Clears all MCA preset values. This command is used to quickly clear the list of MDA preset
values.
CLEAR_PRESETS
The live time, true time, ROI integral, and ROI peak presets are all set to zero (disabled).
Non-USB Execution Errors:
%131135083<CR> The command was attempted while spectrum acquisition was
in progress. No action was taken.
CLEAR_ROI
The region-of-interest flags for the channels in the window of interest (see SET_WINDOW
command) in the currently selected device (see SET_DEVICE command) are cleared.
82
Page 93

932502G / 0618 7. FIRMWARE COMMANDS AND RESPONSES
Non-USB Execution Errors:
%131135083<CR> The command was attempted while spectrum acquisition was
in progress. No action was taken.
COMPUTER
No function in the DSPEC 50; included for backward compatibility.
DISABLE_BLRE_AUTOMATIC
Disables the automatic determination of baseline restorer time constant. See also
ENABLE_BLRE_AUTOMATIC, SET_BLRE, and SHOW_BLRE.
DISABLE_ETP
Returns the DSPEC 50 to normal operation if in Enhanced Throughput (ETP) mode. See also
ENABLE_ETP, SHOW_ETP, SET_TIME_ETP, LIST_TIME_ETP, and
SHOW_TIME_ETP.
DISABLE_FAST_COIN
Disables the Fast Coincidence function used with Coincidence or AntiCoincidence gating.
DISABLE_GAIN_STABILIZATION
Stops stabilization of the gain peak while data is being acquired. The gain stabilization
adjustment is held at its current value until either gain stabilization is reenabled with the
ENABLE_GAIN_STABILIZATION command or reinitialized with the
INITIALIZE_GAIN_ STABILIZATION, SET_GAIN_PEAK or SET_GAIN_WIDTH
command. See also SHOW_GAIN_STABILIZATION.
DISABLE_HV
Turns off the high-voltage enable signal of the DSPEC 50. See the section on the bias supply
for more information about the high-voltage output. See also ENABLE_HV and
SHOW_HV.
DISABLE_HV_DIM
Disables the use of the DIM connector on the back of the DSPEC 50 and causes the
DSPEC 50 to suppress SOH information (see SHOW_HV_HEALTH command). Also, the
command disables polling of a standard DIM module (e.g. DIM-POSNAI, DIM-POSGE,
DIM-NEGGE, or DIM-296) by the DSPEC 50.
DISABLE_LFR
Returns the DSPEC 50 to normal operation if the LFR filter is enabled. See also
ENABLE_LFR and SHOW_LFR.
83
Page 94

DSPEC 50® and DSPEC 502® Digital Gamma-Ray Spectrometer User’s Manual 932502G / 0618
DISABLE_NAI
Switches the stabilizers to Ge mode. See ENABLE_NAI.
DISABLE_OPTI_NEED
Disables the reporting of an error when the DSPEC 50 has not been optimized.
DISABLE_PUR
Disables the Pile-Up Rejection Circuitry.
DISABLE_PZ_AUTOMATIC
Disables the automatic pole zero mode. See also ENABLE_PZ_AUTOMATIC.
DISABLE_PZ_NEED
Disables the reporting of an error when the DSPEC 50 has not been pole zeroed.
DISABLE_REMOTE
No function in the DSPEC 50; included for backward compatibility.
DISABLE_RENH
Returns the DSPEC 50 to normal operation if the Resolution Enhancer is enabled. See
ENABLE_RENH.
DISABLE_THRESHOLD_FMAN
Disables manual adjustment of the fast channel threshold.
DISABLE_THRESHOLD_AUTOMATIC
DISABLE_THRESHOLD_SAMPLE
DISABLE_TRIGGER_SPECIAL
No function in the DSPEC 50; included for backward compatibility.
DISABLE_TRIGGER
Disables the data acquisition trigger that was enabled by the ENABLE_TRIGGER
command. Cancels an ENABLE_TRIGGER_REP if it is issued before the acquisition starts.
See ENABLE_TRIGGER, TRIGGER, and SHOW_TRIGGER.
DISABLE_ZERO_STABILIZATION
Stops stabilization of the zero peak while data is being acquired. The zero stabilization
adjustment is held at its current value until either zero stabilization is reenabled with the
ENABLE_ZERO_STABILIZATION command or reinitialized with the
INITIALIZE_ZERO_ STABILIZATION, SET_ZERO_CHANNEL or SET_ZERO_WIDTH
commands. See also SHOW_ZERO_STABILIZATION.
84
Page 95

932502G / 0618 7. FIRMWARE COMMANDS AND RESPONSES
DISABLE_ZDT
Returns the DSPEC 50 to normal operation if in zero-dead-time (ZDT) mode. See
ENABLE_ZDT.
ENABLE_BLRE_AUTOMATIC
Enables the automatic determination of baseline restorer time constant. See also
DISABLE_BLRE_AUTO, SHOW_BLRE, and SET_BLRE.
ENABLE_ETP
Sets the DSPEC 50 to Enhanced Throughput (ETP) mode. See also DISABLE_ETP,
SHOW_ETP, SET_TIME_ETP, LIST_TIME_ETP, and SHOW_TIME_ETP.
ENABLE_FAST_COIN
Enables the Fast Coincidence function for use with Coincidence or AntiCoincidence gating.
ENABLE_GAIN_STABILIZATION
Enables the stabilization of the gain peak. See also DISABLE_GAIN_ STABILIZATION,
SHOW_GAIN_STABILIZATION, and INITIALIZE_GAIN_STABILIZATION.
ENABLE_HV
Turns on the high-voltage enable output of the DSPEC 50. See also DISABLE_HV and
SHOW_HV.
Non-USB Execution Errors:
%131137085<CR> The high voltage could not be enabled due to a high voltage
shutdown condition.
ENABLE_HV_DIM
Enables the DSPEC 50 to work with a standard DIM (e.g. DIM-POSNAI, DIM-POSGE, or
DIM-NEGGE, DIM-296). This command enables the DSPEC 50 to poll the DIM and causes
the DSPEC 50 to return SOH information to a controlling program (see
SHOW_HV_HEALTH command).
ENABLE_LFR
Sets the DSPEC 50 to LFR mode. See also DISABLE_LFR and SHOW_LFR.
ENABLE_NAI
Switches the stabilizers to NaI mode. The stabilizers use the “fine” adjustment in NaI
mode and the “very fine” adjustment in Ge mode. See DISABLE_NAI.
85
Page 96

DSPEC 50® and DSPEC 502® Digital Gamma-Ray Spectrometer User’s Manual 932502G / 0618
ENABLE_OPTI_NEED
Enables the reporting of an error when the DSPEC 50 needs optimizing.
ENABLE_PUR
Enables the Pile-Up Rejection Circuitry.
ENABLE_PZ_AUTOMATIC
Enables the automatic pole zero mode. See also DISABLE_PZ_AUTO and
SHOW_PZ_AUTO.
ENABLE_PZ_NEED
Enables the reporting of an error when the DSPEC 50 needs pole zeroing.
ENABLE_REMOTE
No function in the DSPEC 50; included for backward compatibility.
ENABLE_RENH
Sets the DSPEC 50 to Resolution Enhancer mode. See also SHOW_RENH.
ENABLE_THRESHOLD_AUTOMATIC
Enables automatic determination of the positive and negative thresholds. See also
DISABLE_THRESHOLD_AUTO, SHOW_THRESHOLD_AUTO,
SET_THRESHOLD_NEGATIVE, and SET_THRESHOLD_POSITIVE.
ENABLE_THRESHOLD_FMAN
Enables manual adjustment of the fast channel threshold.
ENABLE_THRESHOLD_SAMPLE
ENABLE_TRIGGER_SPECIAL
No function in the DSPEC 50; included for backward compatibility.
ENABLE_TRIGGER
Enables the Sample Ready connector. Acquisition will then start when an external trigger
occurs on the Sample Ready connector or when the TRIGGER command is issued. See also
TRIGGER, DISABLE_TRIGGER, SHOW_TRIGGER, SET_TRIGGER_POLARITY, and
SHOW_TRIGGER_POLARITY.
ENABLE_ZDT
Sets the DSPEC 50 to ZDT mode. See SET_MODE_ZDT for information on selecting the
ZDT mode.
86
Page 97

932502G / 0618 7. FIRMWARE COMMANDS AND RESPONSES
ENABLE_ZERO_STABILIZATION
Enables the stabilization of the zero peak. See also DISABLE_ZERO_ STABILIZATION,
SHOW_ZERO_STABILIZATION, and INITIALIZE_ZERO_STABILIZATION.
INITIALIZE
Returns the DSPEC 50 (including flash) to the factory default settings. CAUTION: If using
the DIM connector, turn off the detector bias and physically disconnect the DIM cable
from the DSPEC 50 rear panel before issuing this command.
Non-USB Execution Errors:
The INITIALIZE command simulates a power-down/power-up cycle for the MCB after a
simulated loss of battery-backed-up memory.
Response:
%003000072<CR> MCB Power-up occurred/Memory lost/No selftest errors
(Normal Response for INITIALIZE command).
INITIALIZE_GAIN_STABILIZATION
Resets the gain peak stabilization adjustment to unity (no adjustment). This value is reported
as 2048 by the SHOW_GAIN_ADJUSTMENT command. See also
SET_GAIN_ADJUSTMENT, ENABLE_GAIN_ STABILIZATION, and
DISABLE_GAIN_STABILIZATION.
INITIALIZE_ZERO_STABILIZATION
Resets the zero peak stabilization adjustment to unity (no adjustment). This value is reported
as 2048 by the SHOW_ZERO_ADJUSTMENT command. See also
SET_ZERO_ADJUSTMENT, ENABLE_ZERO_STABILIZATION, and
DISABLE_ZERO_STABILIZATION.
LIST_BLRE
Lists the valid settings of the baseline restore function. See also SET_BLRE.
Response:
BLRE 10.0 100.0 10 100 Legal settings are 10.0 to 100.0 in steps of 1.
LIST_CORR_FLAT
Lists the valid settings of the flattop width. See also SET_CORR_FLAT.
Response:
CORR_FLAT !1.0 .992 0 255 Legal settings are from !1 to 0.992 in
(255 !0 + 1 = 256) steps.
LIST_DISPLAY
Not used by the DSPEC 50; included for backward compatibility.
87
Page 98

DSPEC 50® and DSPEC 502® Digital Gamma-Ray Spectrometer User’s Manual 932502G / 0618
LIST_FAST_COIN x
Lists the valid settings for fast coincidence delay and window. If x=0 then the valid
Window settings are returned. If x=1 then the valid Delay settings are returned.
Response:
FAST_COIN 0 6.375 1 255 Valid Window settings are 0 to 6.375 uS with up to 255
steps of 0.025 uS starting with 0.025 uS minimum.
FAST_COIN -6.375 6.375 0 510 Valid Delay settings are -6.375 to 6.375 uS with up to
510 steps of 0.025 uS.
LIST_GAIN_COARSE
Lists the valid coarse-gain settings.
Response:
GAIN_COAR 1 2 4 8 16 32 64 128
LIST_GAIN_CONV
Lists legal conversion gain settings.
Response:
GAIN_CONV 512 1024 2048 4096 8192 16384
LIST_GAIN_FINE
Lists the valid fine-gain settings.
Response:
GAIN_FINE 0.45 1.0 88437 196607 0.45 to 1 in 108171 steps.
LIST_HV
Lists the valid high-voltage settings.
Response:
HV 0 5000 0 5000 0 to 5000 in 5000 steps.
LIST_INHIBIT_WIDTH
Lists the valid inhibit width settings.
Response:
INHI_WIDT 0 200 0 8000 0 to 200 uS with up to 8000 steps of 0.025 uS
LIST_MODE_ZDT
Reports the legal ZDT-mode settings. Each item in the list can be selected by sending the
SET_MODE_ZDT command with a mode number. The mode number is implied by the
location of the mode in the list. For example, the first item in the list had a mode number
of 0. To select the first item, send SET_MODE_ZDT 0. The second item has a mode number
of 1, and so on.
Response:
88
Page 99

932502G / 0618 7. FIRMWARE COMMANDS AND RESPONSES
MODE_ZDT NORM_CORR CORR_ERR Mode 0 stores the normal and corrected
spectra. Mode 1 stores the corrected and
the error spectra.
LIST_OUTPUT_WIDTH
Lists the valid output width settings.
Response:
OUTP_WIDT 0 16 0 16000 0 to 16 seconds with up to 16000 steps of 1 ms
LIST_ROI_SAMPLE
Lists the valid ROI sample settings.
Response:
ROI_SAMP PUR BLN BLRG BLD BUSY GATE RESV PKDET
LIST_SHAP_CUSP
Not used by the DSPEC 50; included for backward compatibility.
LIST_SHAP_FLAT
Lists the valid flattop width settings.
Response:
SHAP_FLAT 0.3 2.4 3 24 Settings are 0.3 to 2.4 in 22 steps of
0.1 ìs.
LIST_SHAPE_RISE
Lists the valid rise-time settings.
Response:
SHAP_RISE 0.8 23.0 4 115 Settings are 0.8 to 23 in 0.2-ìs steps.
LIST_SHUT
Lists the valid shutdown settings.
Response:
SHUTDOWN TTL ORTEC SMART
LIST_TIME_ETP
Returns the range of valid protection-time settings in the Enhanced Throughput Mode.
Response:
TIME_ETP 01 200 4 8000 Valid settings range from 0.1 ìs to 200 ìs in 25-ns
increments.
LIST_TRIGGER_SAMPLE
Lists the valid trigger sources in Insight (sample) mode.
Response:
TRIG_SAMP LLD PKD Random Gate
89
Page 100

DSPEC 50® and DSPEC 502® Digital Gamma-Ray Spectrometer User’s Manual 932502G / 0618
SET_BLRE baseline
This sets the baseline restorer time constant to the value baseline. Baseline is in microseconds with a range from 10 to 100. The specified value is only used if automatic baseline
restorer mode is disabled. See also ENABLE_BLRE, DISABLE_BLRE, and SHOW_BLRE.
Execution Warnings:
%000064079<CR> Value was rounded to the closest legal value.
SET_CORRECTION_FLAT value
This sets the flattop correction to value. The flattop correction is normally determined with
the OPTIMIZE command. See also SHOW_CORRECTION_FLAT.
SET_CRM_WIDTH xxx.xx
This sets the width of the CRM output pulse in microseconds.
SET_DATA [start, chans],value
If the optional start and chans parameters are included in this command, the range of channels specified by start and chans is loaded with value. If start and chans are not specified,
sets all channels of spectral data in the window of interest (see SET_WINDOW command)
to the specified value. ROI flags are not affected.
SET_DATA_APPLICATION “string1",”string2"
This is used to store information in the DSPEC 50 internal memory that can be used by other
programs, such as sample descriptions and energy calibrations. The Unified MCB Interface
(UMCBI) structure and ORTEC CONNECTIONS make use of this feature. String1 = the data
identifier, 32 bytes maximum; string2 = the data, 128 bytes maximum.
SET_DATE day,month,year
Sets the date stored in the battery backed-up system clock to the specified values. Day can be
any value from 1–31; month any value from 1–12; and year any value from 0–99. The current date and time are stored for a device when an acquisition is started. See also SHOW_
DATE, SET_TIME, and SHOW_TIME.
SET_DATE_START day,month,year
Sets the start date to the specified values. Normally the start date and time are set automatically whenever a device is started with the START command. See also SHOW_DATE_
START, SET_TIME_START, and SHOW_TIME_START.
SET_DELAY_COLLECTION value
Controls the pileup rejector by setting a width threshold such that if a fast channel discriminator pulse is wider than value, the pulse is rejected. This portion of the pileup rejector
90
 Loading...