

Page 1

Optical Wavelength Laboratories
OPERATIONS GUIDE
OWLTrek II Series
Optical Time Domain Reflectometers
(OTDR)
Singlemode: WTO2-S15 / WTO2-S13 / WTO2-S35
Multimode: WTO2-M85 / WTO2-M13 / WTO2-M83
Revision 3A
OWL-INC.COM
OWL
Optical Wavelength Laboratories (OWL)
N9623 West US Hwy 12
Whitewater, WI 53190
Phone: 262-473-0643
Internet: OWL-INC.COM
Page 2
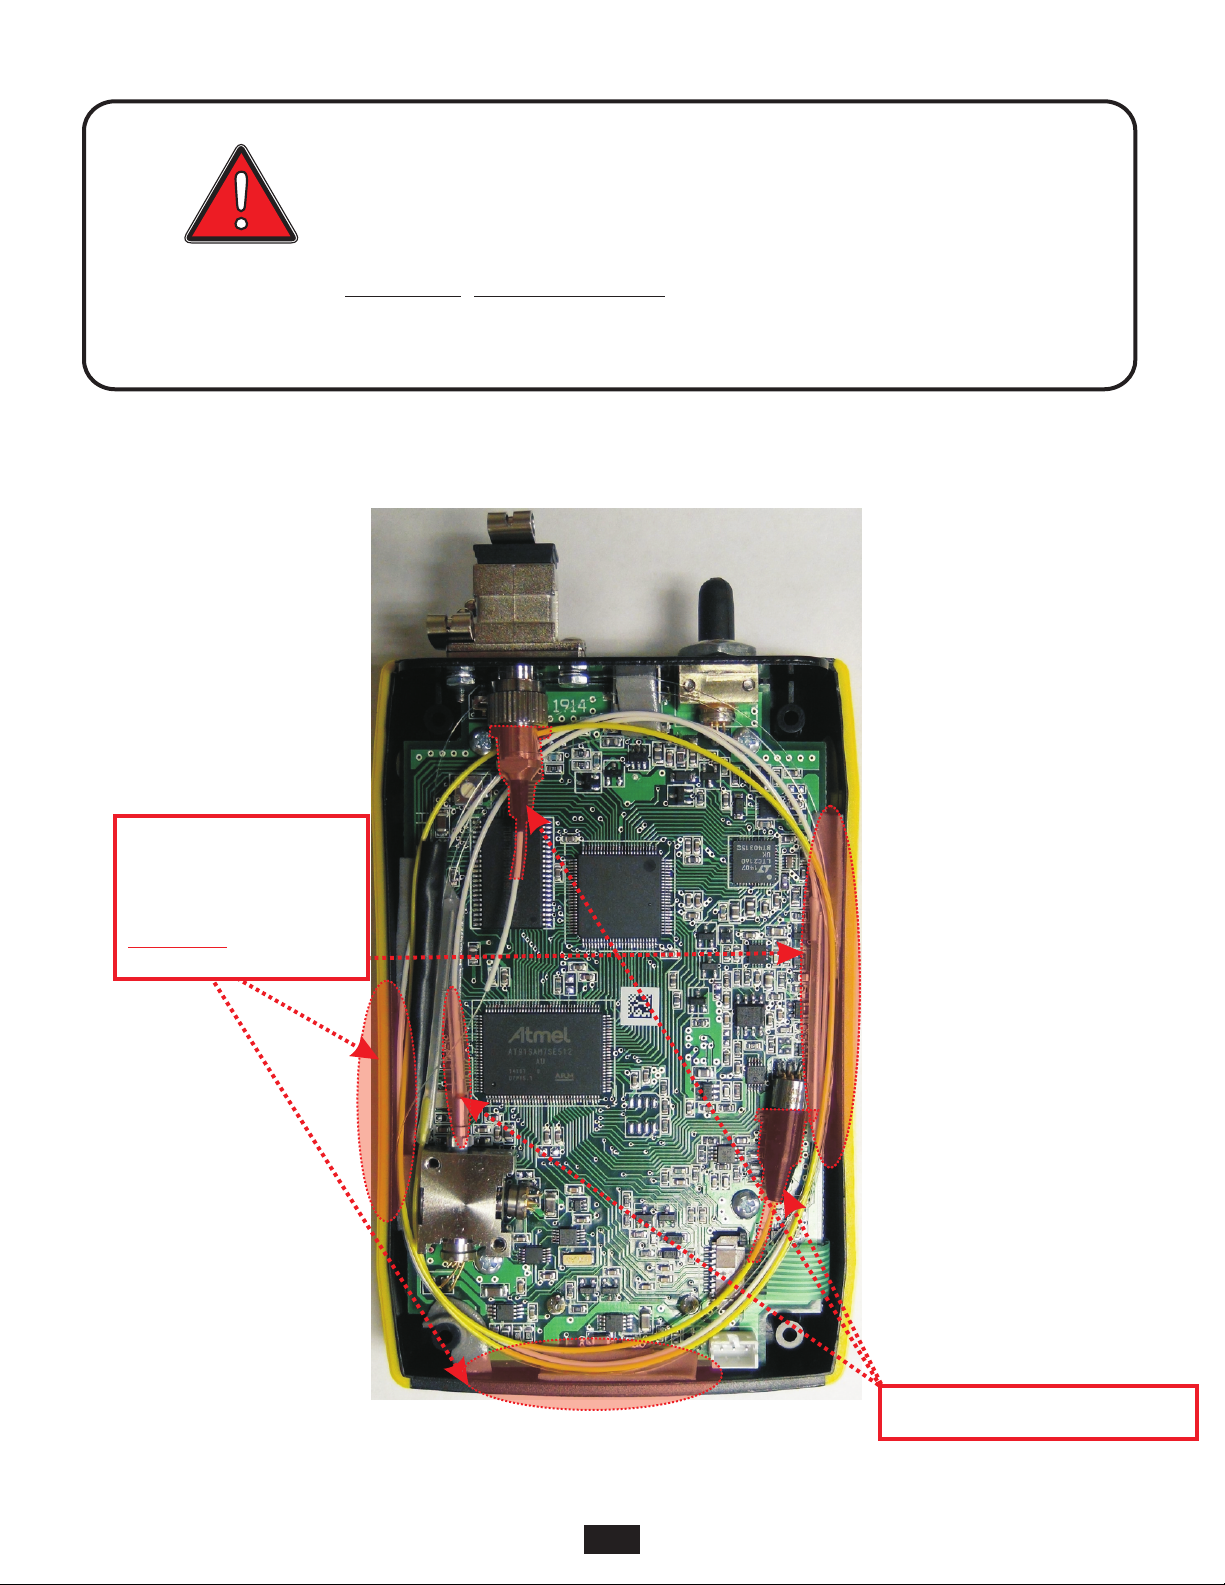
WARNING!!!
HANDLE WITH EXTREME CARE!
This device contains expensive,
This device is to from – avoid dropping this device.
highly susceptible damage impact
extremely fragile optical fibers, lasers, and photodiodes.
DO NOT OPEN THIS UNIT!
CRITICAL DAMAGE POINT
Fiber crush point near
enclosure's edge.
NOTE: This is an issue for
ALL SIDES of the enclosure
when re-sealing the unit
SENSITIVE POINTS
CRITICAL DAMAGE POINT
Fiber coupling to laser and photodiode
2
Page 3

SECTION 1: INTRODUCTION
TABLE OF CONTENTS
SECTION 1: INTRODUCTION
About This Manual . . . . . . . . . . . . . . . . . . . . . . . . . . . . 5
Before You Begin . . . . . . . . . . . . . . . . . . . . . . . . . . . . . 6
Description . . . . . . . . . . . . . . . . . . . . . . . . . . . . . . . . 7
Performance Expectations and Limitations . . . . . . . . . . . . . . . . . 7
Reflective Events . . . . . . . . . . . . . . . . . . . . . . . . . . . . 7
Fault Location . . . . . . . . . . . . . . . . . . . . . . . . . . . . 7
Fiber Length Measurement . . . . . . . . . . . . . . . . . . . . . . 7
Backscatter Events . . . . . . . . . . . . . . . . . . . . . . . . . . . 7
Backscatter Events . . . . . . . . . . . . . . . . . . . . . . . . . . 7
Attenuation Measurement . . . . . . . . . . . . . . . . . . . . . . . 7
Precautions . . . . . . . . . . . . . . . . . . . . . . . . . . . . . . . . 8
Eye Safety . . . . . . . . . . . . . . . . . . . . . . . . . . . . . . . 8
Electrical Safety . . . . . . . . . . . . . . . . . . . . . . . . . . . . . 8
Operational . . . . . . . . . . . . . . . . . . . . . . . . . . . . . . . 8
Connector . . . . . . . . . . . . . . . . . . . . . . . . . . . . . . . 8
Service . . . . . . . . . . . . . . . . . . . . . . . . . . . . . . . . . 8
Product Label . . . . . . . . . . . . . . . . . . . . . . . . . . . . . . . 8
Ports . . . . . . . . . . . . . . . . . . . . . . . . . . . . . . . . . . . 9
Buttons . . . . . . . . . . . . . . . . . . . . . . . . . . . . . . . . . . 9
Display . . . . . . . . . . . . . . . . . . . . . . . . . . . . . . . . . . 10
Indicator LEDs . . . . . . . . . . . . . . . . . . . . . . . . . . . . . . 11
SECTION 2: OTDR TESTING
Power ON/OFF . . . . . . . . . . . . . . . . . . . . . . . . . . . . . . 12
Key OTDR Trace Parameters . . . . . . . . . . . . . . . . . . . . . . . 12
Wavelength . . . . . . . . . . . . . . . . . . . . . . . . . . . . . . . 12
Index of Refraction . . . . . . . . . . . . . . . . . . . . . . . . . . . 12
Capture Mode . . . . . . . . . . . . . . . . . . . . . . . . . . . . . . 12
Pulse Width . . . . . . . . . . . . . . . . . . . . . . . . . . . . . . . 12
Number of Samples . . . . . . . . . . . . . . . . . . . . . . . . . . . 12
Dead Zone Length (m) . . . . . . . . . . . . . . . . . . . . . . . . . . 12
Range . . . . . . . . . . . . . . . . . . . . . . . . . . . . . . . . . 12
Step . . . . . . . . . . . . . . . . . . . . . . . . . . . . . . . . . . 12
Setting Test Parameters . . . . . . . . . . . . . . . . . . . . . . . . . . 13
Set Wavelength . . . . . . . . . . . . . . . . . . . . . . . . . . . . . 13
Set Index of Refraction. . . . . . . . . . . . . . . . . . . . . . . . . . 13
Setting Trace Options . . . . . . . . . . . . . . . . . . . . . . . . . . 14
Capture Mode . . . . . . . . . . . . . . . . . . . . . . . . . . . . . 14
Pulse Width . . . . . . . . . . . . . . . . . . . . . . . . . . . . . . 14
Number of Samples . . . . . . . . . . . . . . . . . . . . . . . . . . 14
Dead Zone Length (m) . . . . . . . . . . . . . . . . . . . . . . . . . 14
Range . . . . . . . . . . . . . . . . . . . . . . . . . . . . . . . . 14
Step . . . . . . . . . . . . . . . . . . . . . . . . . . . . . . . . . 14
Starting an OTDR Trace . . . . . . . . . . . . . . . . . . . . . . . . . . 15
Cursor Navigation . . . . . . . . . . . . . . . . . . . . . . . . . . . . . 15
SECTION 3: TRACE ANALYSIS
Overview . . . . . . . . . . . . . . . . . . . . . . . . . . . . . . . . . 16
Events . . . . . . . . . . . . . . . . . . . . . . . . . . . . . . . . . . 16
Fiber Length Measurement/Link Loss . . . . . . . . . . . . . . . . . . . 17
Fiber Attenuation Measurement . . . . . . . . . . . . . . . . . . . . . . 17
Reflectance Measurement . . . . . . . . . . . . . . . . . . . . . . . . 18
Trace Events Menu . . . . . . . . . . . . . . . . . . . . . . . . . . . . 18
Saturation Inversion . . . . . . . . . . . . . . . . . . . . . . . . . . . . 19
SECTION 4: TRACE STORAGE
Stored Readings . . . . . . . . . . . . . . . . . . . . . . . . . . . . . 20
Saving a Trace . . . . . . . . . . . . . . . . . . . . . . . . . . . . . . 20
Loading a Previously Stored Trace . . . . . . . . . . . . . . . . . . . . . 21
3
Page 4

SECTION 1: INTRODUCTION
TABLE OF CONTENTS
SECTION 5: OTDR SETUP
Menu System . . . . . . . . . . . . . . . . . . . . . . . . . . . . . . . 22
Navigating the Menu System . . . . . . . . . . . . . . . . . . . . . . 22
Setup Menu . . . . . . . . . . . . . . . . . . . . . . . . . . . . . . . 22
Help Topics . . . . . . . . . . . . . . . . . . . . . . . . . . . . . . . 22
Operations Menu . . . . . . . . . . . . . . . . . . . . . . . . . . . . . 23
OTDR Setup . . . . . . . . . . . . . . . . . . . . . . . . . . . . . . 23
Length Units . . . . . . . . . . . . . . . . . . . . . . . . . . . . . 23
Fiber Index . . . . . . . . . . . . . . . . . . . . . . . . . . . . . . 23
EOF Event Threshold . . . . . . . . . . . . . . . . . . . . . . . . . 23
Event Pass/Fail . . . . . . . . . . . . . . . . . . . . . . . . . . . . 23
Events Setup . . . . . . . . . . . . . . . . . . . . . . . . . . . . . . 24
Reflective Event Threshold . . . . . . . . . . . . . . . . . . . . . . 24
Loss Event Threshold . . . . . . . . . . . . . . . . . . . . . . . . . 24
Maximum Reflectivity . . . . . . . . . . . . . . . . . . . . . . . . . 24
Maximum Loss . . . . . . . . . . . . . . . . . . . . . . . . . . . . 24
Configure Options . . . . . . . . . . . . . . . . . . . . . . . . . . . . 25
Fiber ID Tone . . . . . . . . . . . . . . . . . . . . . . . . . . . . . 25
Visual Fault Locator . . . . . . . . . . . . . . . . . . . . . . . . . . 25
Set Backscatter Coefficient . . . . . . . . . . . . . . . . . . . . . . . 26
System Information . . . . . . . . . . . . . . . . . . . . . . . . . . . 27
User Information . . . . . . . . . . . . . . . . . . . . . . . . . . . . . 28
Enter User Name . . . . . . . . . . . . . . . . . . . . . . . . . . . . 28
Enter Phone Number . . . . . . . . . . . . . . . . . . . . . . . . . . 28
Display Preferences . . . . . . . . . . . . . . . . . . . . . . . . . . . . 29
Mode . . . . . . . . . . . . . . . . . . . . . . . . . . . . . . . . . . 29
Dimness . . . . . . . . . . . . . . . . . . . . . . . . . . . . . . . . 29
Brightness . . . . . . . . . . . . . . . . . . . . . . . . . . . . . . . 29
Speaker . . . . . . . . . . . . . . . . . . . . . . . . . . . . . . . . 29
Trace Clipping. . . . . . . . . . . . . . . . . . . . . . . . . . . . . . 29
Remove Tails . . . . . . . . . . . . . . . . . . . . . . . . . . . . . . 29
Power Options . . . . . . . . . . . . . . . . . . . . . . . . . . . . . . 30
Dim Time . . . . . . . . . . . . . . . . . . . . . . . . . . . . . . . . 30
Standby Time . . . . . . . . . . . . . . . . . . . . . . . . . . . . . . 30
Off Time . . . . . . . . . . . . . . . . . . . . . . . . . . . . . . . . 30
Utilities Menu . . . . . . . . . . . . . . . . . . . . . . . . . . . . . . . 31
Set System Clock . . . . . . . . . . . . . . . . . . . . . . . . . . . . 31
Set APD Bias . . . . . . . . . . . . . . . . . . . . . . . . . . . . . . 32
Format Data Flash. . . . . . . . . . . . . . . . . . . . . . . . . . . . 33
Factor Reset . . . . . . . . . . . . . . . . . . . . . . . . . . . . . . 34
Stored Traces . . . . . . . . . . . . . . . . . . . . . . . . . . . . . . . 35
SECTION 6: OPERATION/MAINTENANCE
Optical Power Meter (OPM) Operation . . . . . . . . . . . . . . . . . . . 36
Visual Fault Locator (VFL) Operation . . . . . . . . . . . . . . . . . . . . 37
Fiber ID Tone Operation . . . . . . . . . . . . . . . . . . . . . . . . . . 38
Live Mode Operation . . . . . . . . . . . . . . . . . . . . . . . . . . . 39
Manually Setting End-of-fiber (EOF) marker. . . . . . . . . . . . . . . . . 40
Cleaning the Optical Ports . . . . . . . . . . . . . . . . . . . . . . . . . 41
SECTION 7: OWLVIEW FOR OTDR SOFTWARE
Overview . . . . . . . . . . . . . . . . . . . . . . . . . . . . . . . . . 42
Installing OWLView Software. . . . . . . . . . . . . . . . . . . . . . . . 42
Installing from USB Flash Drive. . . . . . . . . . . . . . . . . . . . . . 42
Installing from Website. . . . . . . . . . . . . . . . . . . . . . . . . . 42
Launching the Software . . . . . . . . . . . . . . . . . . . . . . . . . . 43
Quick-Launch Panel . . . . . . . . . . . . . . . . . . . . . . . . . . . 43
Operating the Software . . . . . . . . . . . . . . . . . . . . . . . . . . 43
Downloading Traces from the OTDR . . . . . . . . . . . . . . . . . . . 43
Opening a Stored Trace . . . . . . . . . . . . . . . . . . . . . . . . . 44
Saving Traces. . . . . . . . . . . . . . . . . . . . . . . . . . . . . . 44
Printing Traces . . . . . . . . . . . . . . . . . . . . . . . . . . . . . 44
4
Page 5

SECTION 1: INTRODUCTION
TABLE OF CONTENTS
Printing Multiple Traces . . . . . . . . . . . . . . . . . . . . . . . . . 44
Closing Traces . . . . . . . . . . . . . . . . . . . . . . . . . . . . . 45
Working with SOR Files . . . . . . . . . . . . . . . . . . . . . . . . . 45
Exporting SOR Files. . . . . . . . . . . . . . . . . . . . . . . . . . . 45
Batch Export SOR Files . . . . . . . . . . . . . . . . . . . . . . . . . 45
Import SOR files. . . . . . . . . . . . . . . . . . . . . . . . . . . . . 45
Working with Traces . . . . . . . . . . . . . . . . . . . . . . . . . . . . 46
Button Controls . . . . . . . . . . . . . . . . . . . . . . . . . . . . . 46
Thumbnail View . . . . . . . . . . . . . . . . . . . . . . . . . . . . . 46
Trace Details . . . . . . . . . . . . . . . . . . . . . . . . . . . . . . 46
Trace Screen . . . . . . . . . . . . . . . . . . . . . . . . . . . . . . 47
Event Table . . . . . . . . . . . . . . . . . . . . . . . . . . . . . . . 47
Miscellaneous Info . . . . . . . . . . . . . . . . . . . . . . . . . . . 47
Status Bar . . . . . . . . . . . . . . . . . . . . . . . . . . . . . . . 47
Rectangle Zoom . . . . . . . . . . . . . . . . . . . . . . . . . . . . 48
Zoom In / Out . . . . . . . . . . . . . . . . . . . . . . . . . . . . . . 49
Show / Hide Cursors . . . . . . . . . . . . . . . . . . . . . . . . . . . 49
Event Analysis / Proper Cursor Placement . . . . . . . . . . . . . . . . 49
Tools Menu . . . . . . . . . . . . . . . . . . . . . . . . . . . . . . . . 49
Update Firmware . . . . . . . . . . . . . . . . . . . . . . . . . . . . 49
Change Length Units . . . . . . . . . . . . . . . . . . . . . . . . . . 49
Invert Y Axis. . . . . . . . . . . . . . . . . . . . . . . . . . . . . . . 49
Help Menu . . . . . . . . . . . . . . . . . . . . . . . . . . . . . . . . 49
SECTION 8: APPENDICES
Specifications . . . . . . . . . . . . . . . . . . . . . . . . . . . . . . . 50
Maintenance Information . . . . . . . . . . . . . . . . . . . . . . . . . 50
Repair . . . . . . . . . . . . . . . . . . . . . . . . . . . . . . . . . 50
Battery Replacement . . . . . . . . . . . . . . . . . . . . . . . . . . 50
Cleaning . . . . . . . . . . . . . . . . . . . . . . . . . . . . . . . . 50
Warranty . . . . . . . . . . . . . . . . . . . . . . . . . . . . . . . . 50
Contact Information . . . . . . . . . . . . . . . . . . . . . . . . . . . . 50
ABOUT THIS MANUAL
Throughout this manual you will find various symbols that assist with understanding the procedures outlined in this manual. Below is
a list of these symbols and a short description of their purpose:
Helpful tip
Cautionary information
Potentially dangerous condition or operation
5
Page 6

SECTION 1: INTRODUCTION
BEFORE YOU BEGIN
All personnel testing optical fibers should be adequately trained in the field of fiber optics before using any fiber optic test equipment.
If the user is not completely familiar with testing fiber optics, they should seek competent training. Such training can be acquired from
a variety of sources, such as local hands-on training classes or online courses.
Valuable information about fiber optic testing can also be gathered from reading printed literature carefully or by thoroughly reading
supplied operations manuals.
OTDR basics
The above is especially true for Optical Time Domain Reflectometers (OTDRs). OTDRs are complicated technical devices, requiring
a great amount of technical skill, knowledge, and expertise to operate. Proper setup and trace interpretation are paramount to a
successful OTDR test, and the consequences of being inadequately trained could result in a significant amount of network down-time
and repair costs.
In addition, OTDRs are delicate scientific instruments, and should be treated as such. Great care should be taken to ensure that all
optical ports are kept clean and free from debris. The reasons for this are two-fold: 1) a clean OTDR produces accurate and precise
results; and 2) if debris is allowed to build up in the OTDR test port, over time connector insertions will grind the debris into the OTDR
port endface, resulting in scratches or “pits” that require extensive and costly repairs.
The main purpose of an OTDR is to locate faults in an optical fiber that exhibits unacceptable amounts of optical loss, or is no longer
functioning properly. These faults are commonly called “events” and include anomalies such as breaks, shatters, connector
endfaces, patch panels, splices, macro-bends, and micro-bends. By knowing the precise distance to an event, the technician can
determine the nature of the event and quickly restore the network to its former working state.
There are two types of events detectable by an OTDR: Fresnel (reflective) and backscatter (non-reflective).
Fresnel events are caused by “glass-to-air” boundaries in the optical fiber, which causes a high amount of light to be reflected directly
back toward the OTDR. Common Fresnel events include breaks, shatters, connector endfaces, patch panels, or even the end of the
fiber. End-of-fiber detection can also be used to measure the end-to-end length of the fiber.
Backscatter events are caused by the intrinsic properties of the optical fiber. The make-up of the optical fiber scatters the light in all
directions, including a small amount that gets scattered back towards the OTDR. Common backscatter events are splices (either
fusion or mechanical), macro-bends, and micro-bends. Backscatter can also be used to measure the attenuation (loss) on a certain
section of an optical fiber.
OPM basics
Optical power meters (OPM) are designed to measure the amount of optical power (i.e. the “brightness” of light) exiting an optical
fiber. OPMs calibrated against government calibration standards such as NIST ensure these power measurements are accurate.
OPMs have two main functions:
Output power measurement. Connect directly to a transmitter port to verify the output power of active equipment or test light sources
is within specification. Connect to the far end of a link to: 1) ensure continuity and connector polarity; or 2) measure output power from
active equipment to ensure receiver sensitivity.
Optical loss measurement. When used with a test light source, an OPM can be “zeroed out” to measure the end-to-end loss of a fiber
link.
6
Page 7

SECTION 1: INTRODUCTION
DESCRIPTION
Upholding OWL’s commitment to high-quality, yet affordable, fiber optic test equipment, the OWLTrek II OTDR enables fiber optic
professionals to quickly and easily troubleshoot and locate optical faults in multimode and singlemode fibers.
The OWLTrek II is truly a hand-held unit, being one of the smallest OTDRs on the market today – easily able to fit into a shirt pocket –
yet having capabilities of other OTDRs costing thousands of dollars more.
Optical fiber traces are displayed on a high-resolution color LCD display which implements state-of-the-art display technology to
allow the OTDR’s high-resolution color LCD display to “flip” between portrait or landscape mode automatically simply by rotating the
device 90°. By “flipping” from portrait to landscape, the user sees a wider viewing area, displaying more trace information on the highresolution color LCD, and allowing for greater viewing detail.
Important OTDR trace parameters such as pulse width, index of refraction, and data point averaging are fully user-configurable, and
are accessible through an intuitive menu system. A minimum of 65 traces using the longest trace distance can be stored in the
OWLTrek II’s internal memory.
Powering the OWLTrek II is a re-chargeable Lithium-polymer battery that allows for hours of normal usage.
The OWLTrek II is equally suited to testing multimode and singlemode fibers in many test environments, including LAN, MAN, WAN,
FTTH, Telco, CATV, Manufacturing, and Laboratory.
Some models also include an optical power meter port used for optical power and optical loss measurement.
up to 20
PERFORMANCE EXPECTATIONS AND LIMITATIONS
REFLECTIVE EVENTS
Fault Location. The main function of the OWLTrek II OTDR is to detect the presence of highly reflective events, otherwise known as
Fresnel events, such as breaks, shatters, patch panels, or the end of the fiber link. The distance to an event is shown as a spike on the
OTDR trace, allowing the technician to quickly locate the problem and restore the network.
Fiber Length Measurement. The OWLTrek II can give the operator a general idea of the length of the optical fiber by placing the
cursors at the first and last reflective events, although the last reflective event is not guaranteed to be the end of the fiber. For
example, a severe enough break mid-span could prevent the OTDR from detecting other events beyond the break, or the OTDR trace
could show echoes or ghosts of previous Fresnel events.
BACKSCATTER EVENTS
Backscatter Events. The OWLTrek II has some ability to locate and measure backscatter events. Tweaking pulse-width and
averaging settings may enhance the OWLTrek II’s ability to detect backscatter events. However, even with optimal settings, low loss
backscatter events will become less detectable as the event gets farther away from the beginning of the fiber, especially on longer
fibers.
Backscatter events are also more difficult to measure and interpret. Proper cursor placement is vital to the accurate measurement of
backscatter events. Only individuals with OTDR training and expertise should attempt backscatter event measurement. Interpreting
OTDR traces will be covered in more detail later in this manual.
Attenuation Measurement. Backscatter can be used to measure the attenuation (or loss) of certain sections of an optical fiber by
placing the cursors at the beginning and end of the segment of fiber to be measured.
If available, however, a Power Meter / Light Source (PMLS) test kit or Optical Loss Test Set (OLTS) should always take precedence
over an OTDR for end-to-end attenuation measurements.
7
Page 8
SECTION 1: INTRODUCTION
WARNING
ASSEMBLED IN USA
Optical Wavelength Laboratories
Whitewater, WI 53190 • 262-473-0643
MODEL#: WTO2-S15
SERIAL#: WTOH100001
This product complies with the
following EU Directives:
EN 61326-1:2006
EN 61010-1:2001
OTDR: Class 1M Laser Output
VFL: Class 2 Laser Output
Do NOT stare into beam.
Output Type: FP Laser
Output 8: 1550nm
Power: 6VDC, 1 A
IEC 60825
PRECAUTIONS
Eye Safety
NEVER
look into the connector port of any fiber optic test or transmission equipment, patch cable, fiber link, or other
installed fiber. Always assume that active laser equipment is attached to optical fibers, and is powered on.
Do not run a test on the OTDR unless it is connected to the fiber under test, or the dustcap is firmly in place.
Electrical Safety
Only use appropriate AC adapters for charging this device. Use of inappropriate power adapters could cause damage to
the device, and could cause harm to the user from fire and electrical shock.
Operational
K
eep connector ferrules and optical connector ports clean to prevent irreparable damage to the OTDR port. For best
results, replace dust caps after each use.
Connector
Service
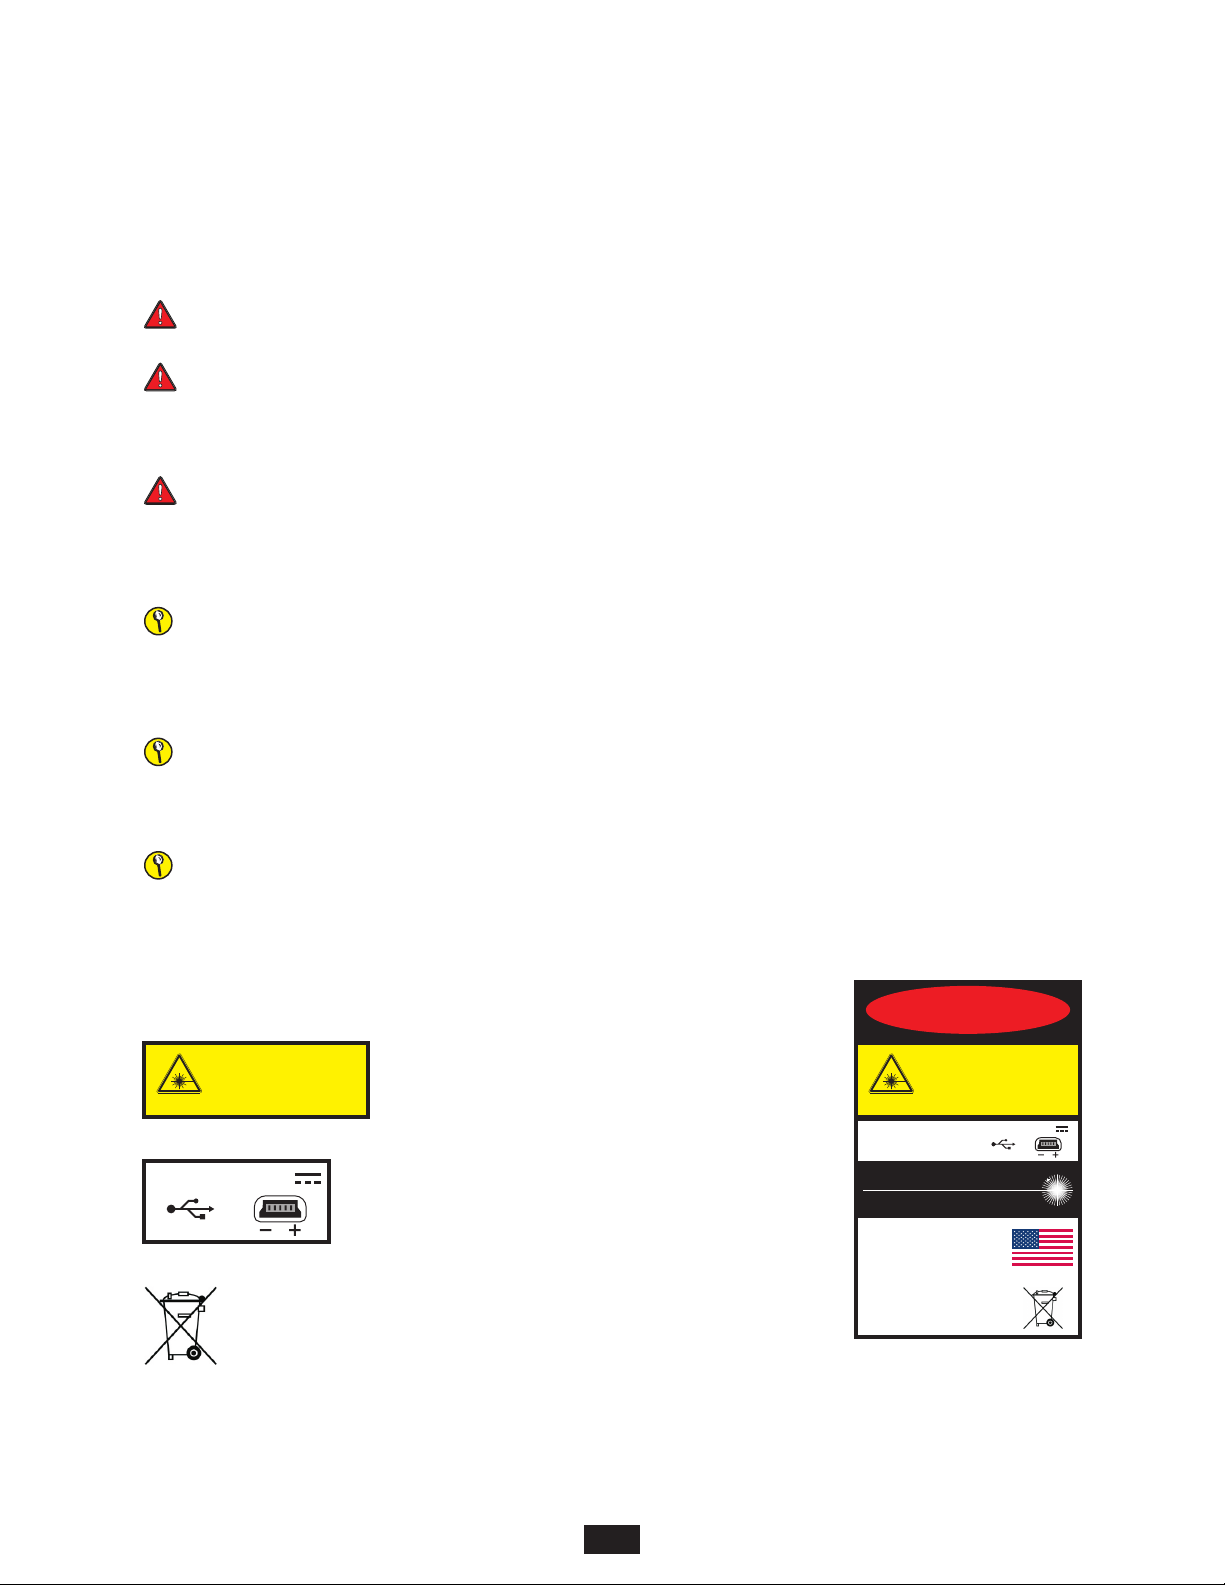
LABEL INFORMATION
On the back of each OWLTrek II OTDR is a label similar to the one shown here containing model
number, serial number, power requirements, and special cautionary information.
IEC 60825
Power: 6VDC, 1 A
For best results,
do NOT insert APC (Angled Physical Contact) connectors into the OTDR and OPM ports.
There are no user-serviceable parts in this device. Unauthorized attempts to service this product will void the product
warranty.
OTDR: Class 1M Laser Output
VFL: Class 2 Laser Output
Do NOT stare into beam.
OTDR port Class 1M Laser Output
VFL port Class 2 Laser Output. Do NOT stare into beam.
USB port 6VDC, 1A
Directive 2002/96/EC of 27 January 2003 on waste electrical
and electronic equipment (WEEE)
EU Directives EN 61326-1:2006 (EMC) and EN 61010-1:2001 (Safety)
8
Page 9
SECTION 1: INTRODUCTION
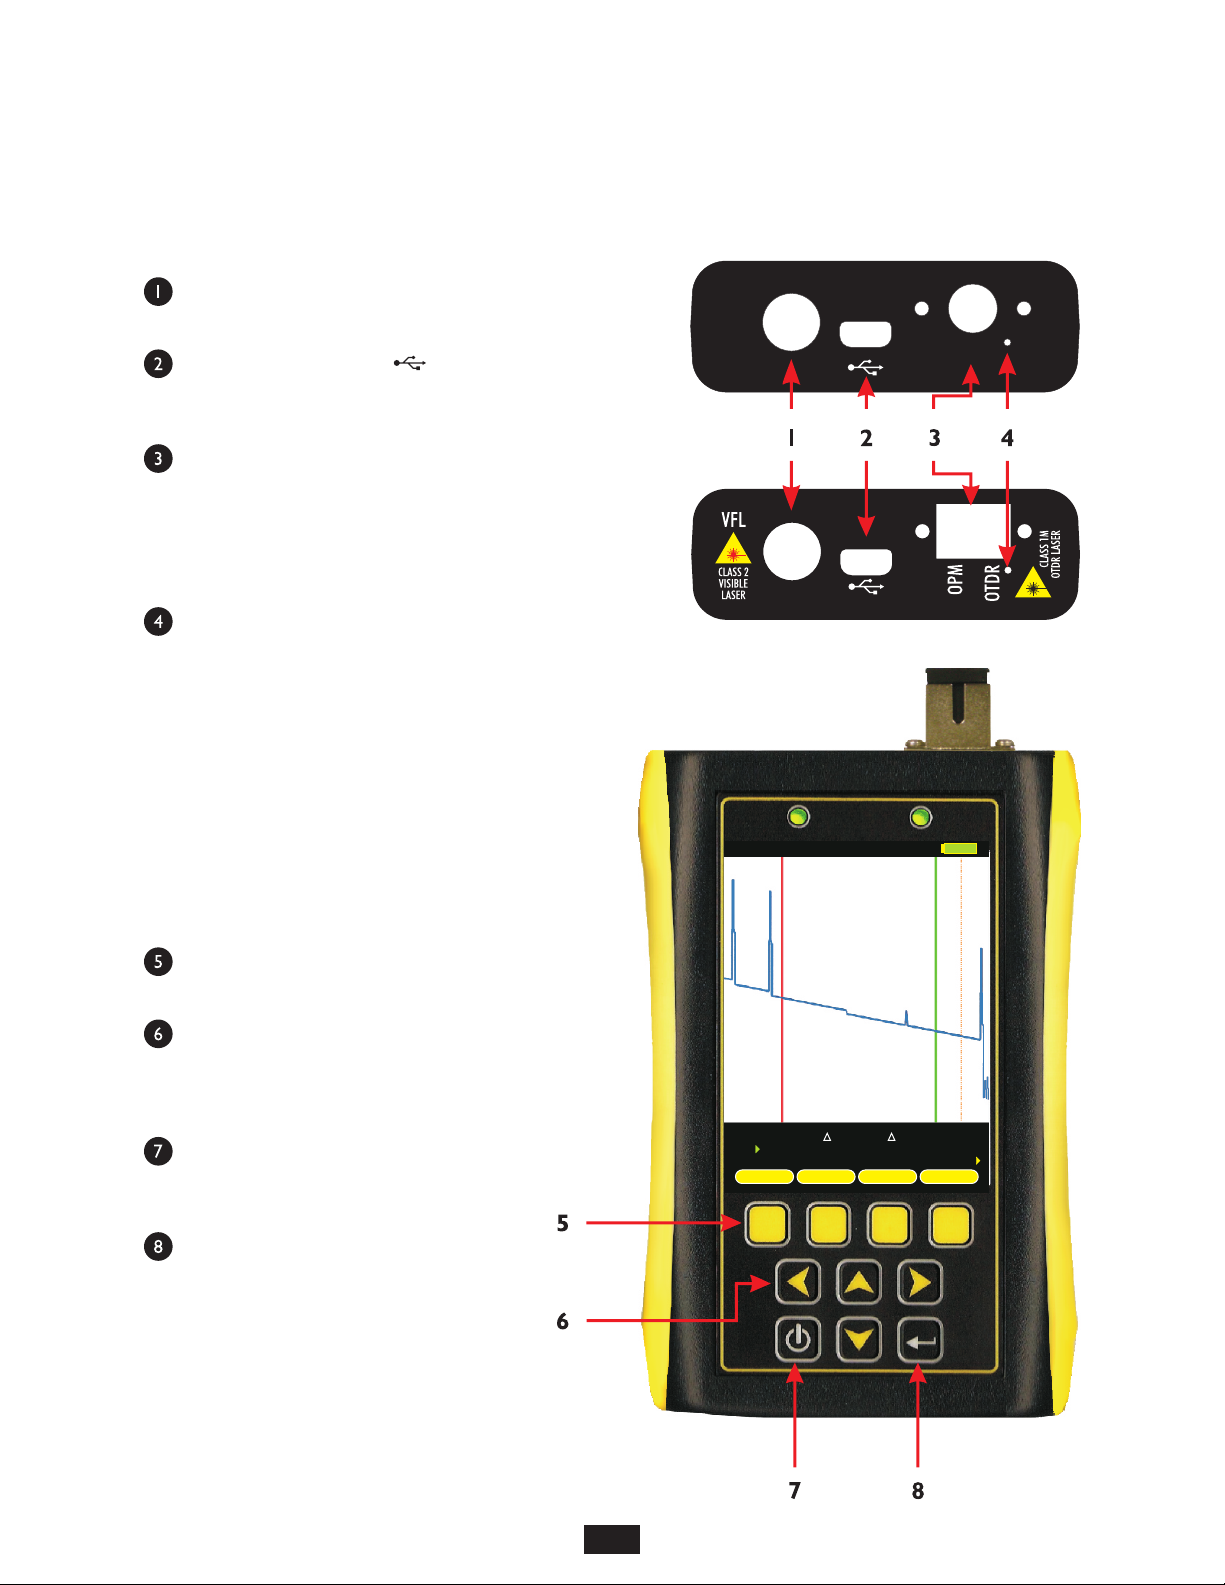
PORTS
Visual Fault Locator Port (VFL) – Visual Fault Locator port
for troubleshooting
USB Download Port ( ) – downloads data from the
OTDR to the PC for software trace analysis and digital data
storage; also used for battery charging
OTDR Port – SC connector port; connects the OTDR to the
fiber under test;
OPM / OTDR port – OTDRs that include an integrated OPM
use a duplex LC connector port; each port is labeled
appropriately
Reset Button – resets the OTDR in case of malfunction
BUTTONS
VFL
Fiber #x
OTDR
AUTO
Menu Buttons – activates the associated
menu option
Navigation Buttons – moves cursors or
menu options in the direction of the button, or
are used to zoom in or out on cursor
placement
Power Button – powers the OTDR on; press
and hold to power off; also, while the OTDR is
on, brief press will activate other functions
Enter Button – from the trace screen, this
button changes the function options menu at
the bottom of the screen. Also activates
menu options while in the menu system
1550nm
06086m
20226m
24718m
9
L mx
14140dB2.43x
RFL dBx
-81.00x
ENTER
3.34x
TESTZOOMLOCKCURSOR
Page 10
SECTION 1: INTRODUCTION
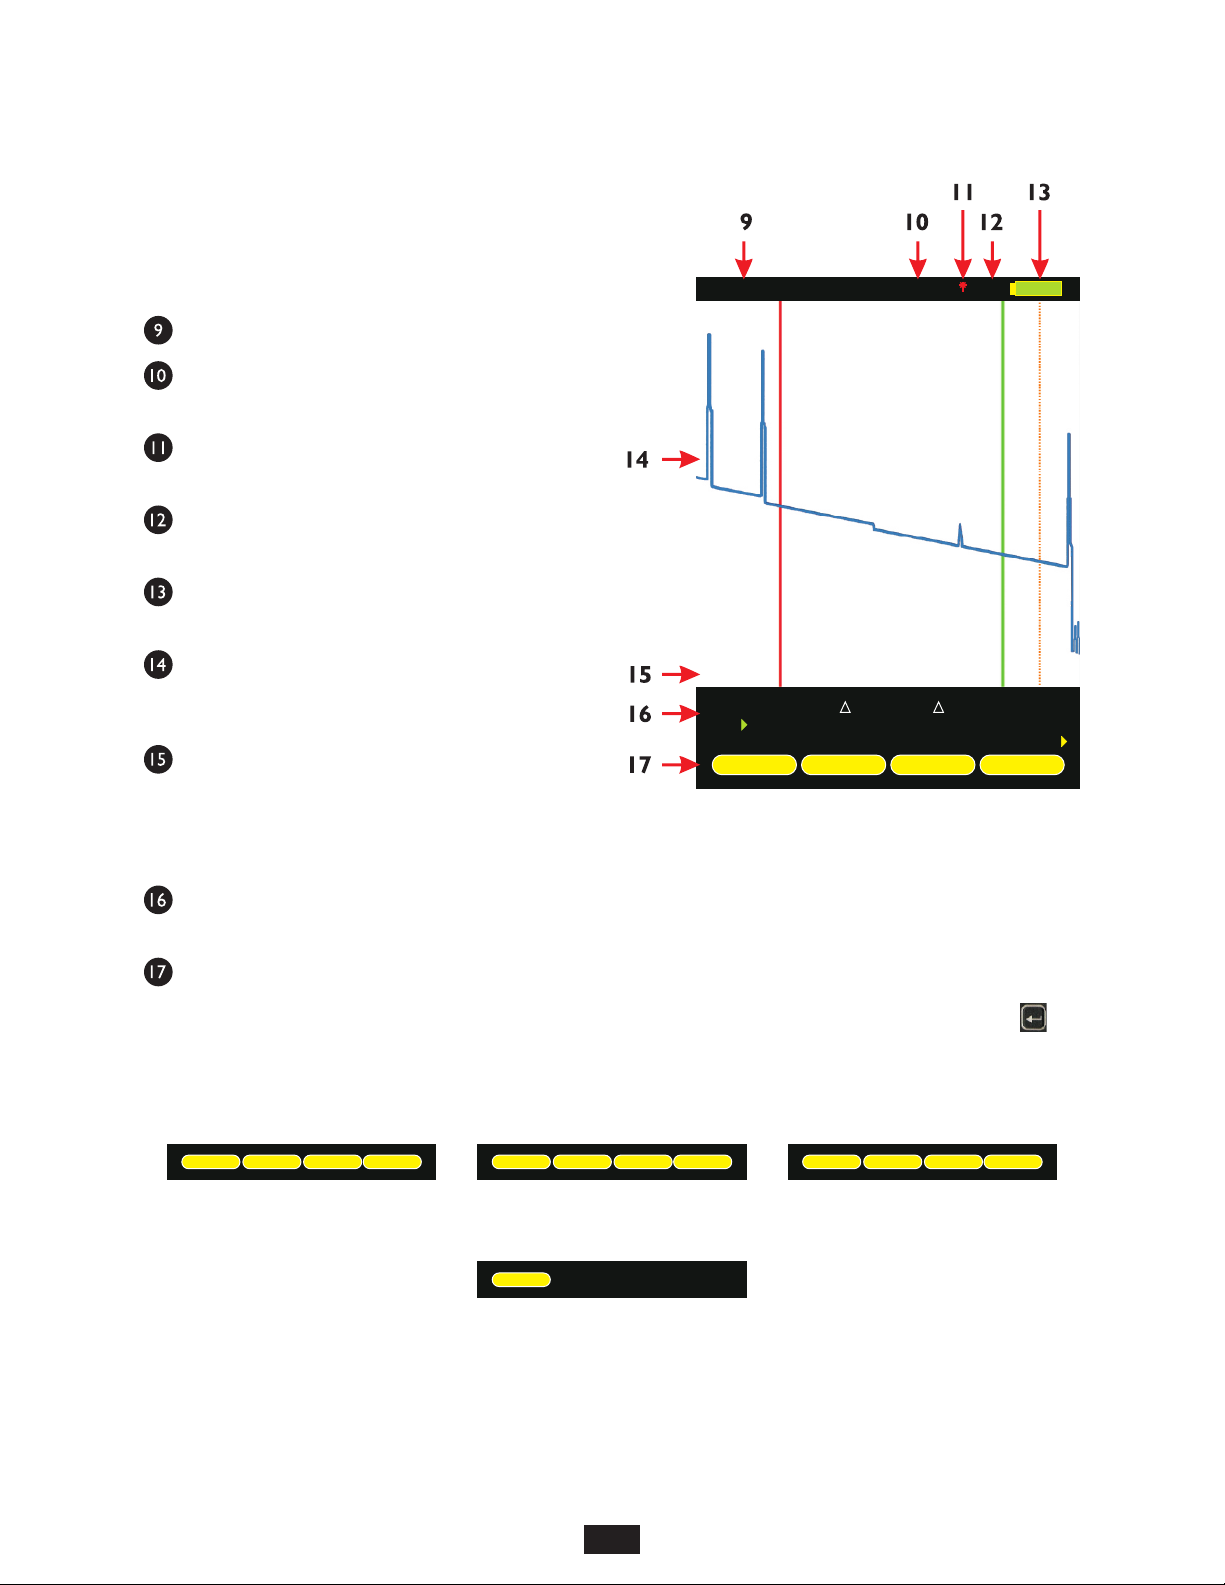
DISPLAY
Fiber ID – name of the currently loaded fiber trace
OTDR Test Mode – shows which test mode the OTDR
is in – AUTO, USER, SEMI, or FILT
VFL Indicator – shows the current VFL mode: blank =
OFF; = ON continuous; = ON flashing
Zoom Indicator – displays “H” for horizontal zooming,
and “V” for vertical zooming
Battery Life Indicator – displays the remaining
battery life
Trace Viewing Area – displays the results of the
OTDR trace(s), which users can zoom in on for more
detailed trace analysis
Trace Wavelength – shows the wavelength(s) of the
traces displayed in the trace viewing area. The active
trace wavelength will be listed on the left.
red pink
Fiber #x
1550nm
06086m
20226m
24718m
L mx
14140
AUTO
2.43x
3.34x
dB
H
RFL dBx
-81.00x
ENTER
TESTMENULOCKCURSOR
If more than one wavelength is present, the color of the trace corresponds with the color of the wavelength number
Trace Information – displays the relative position and power levels at and between the red and green cursors for the
currently active trace.
Function Options Menu – displays the on-screen menu options for trace control
Depending upon model number, there could be three or four sets of Function Options Menus. The Enter key ( ) is
used to toggle between these menus:
MENU 1 MENU 2
CURSOR SETUP
LOCK
ZOOM
TEST
LOADSAVE
INDEX
MENU 3
EOFEVENTS
MENU
VFL
MENU 4
WAVE
NOTE: the WAVE option will only be
displayed if more than one
wavelength is present
10
Page 11
SECTION 1: INTRODUCTION
INDICATOR LEDs
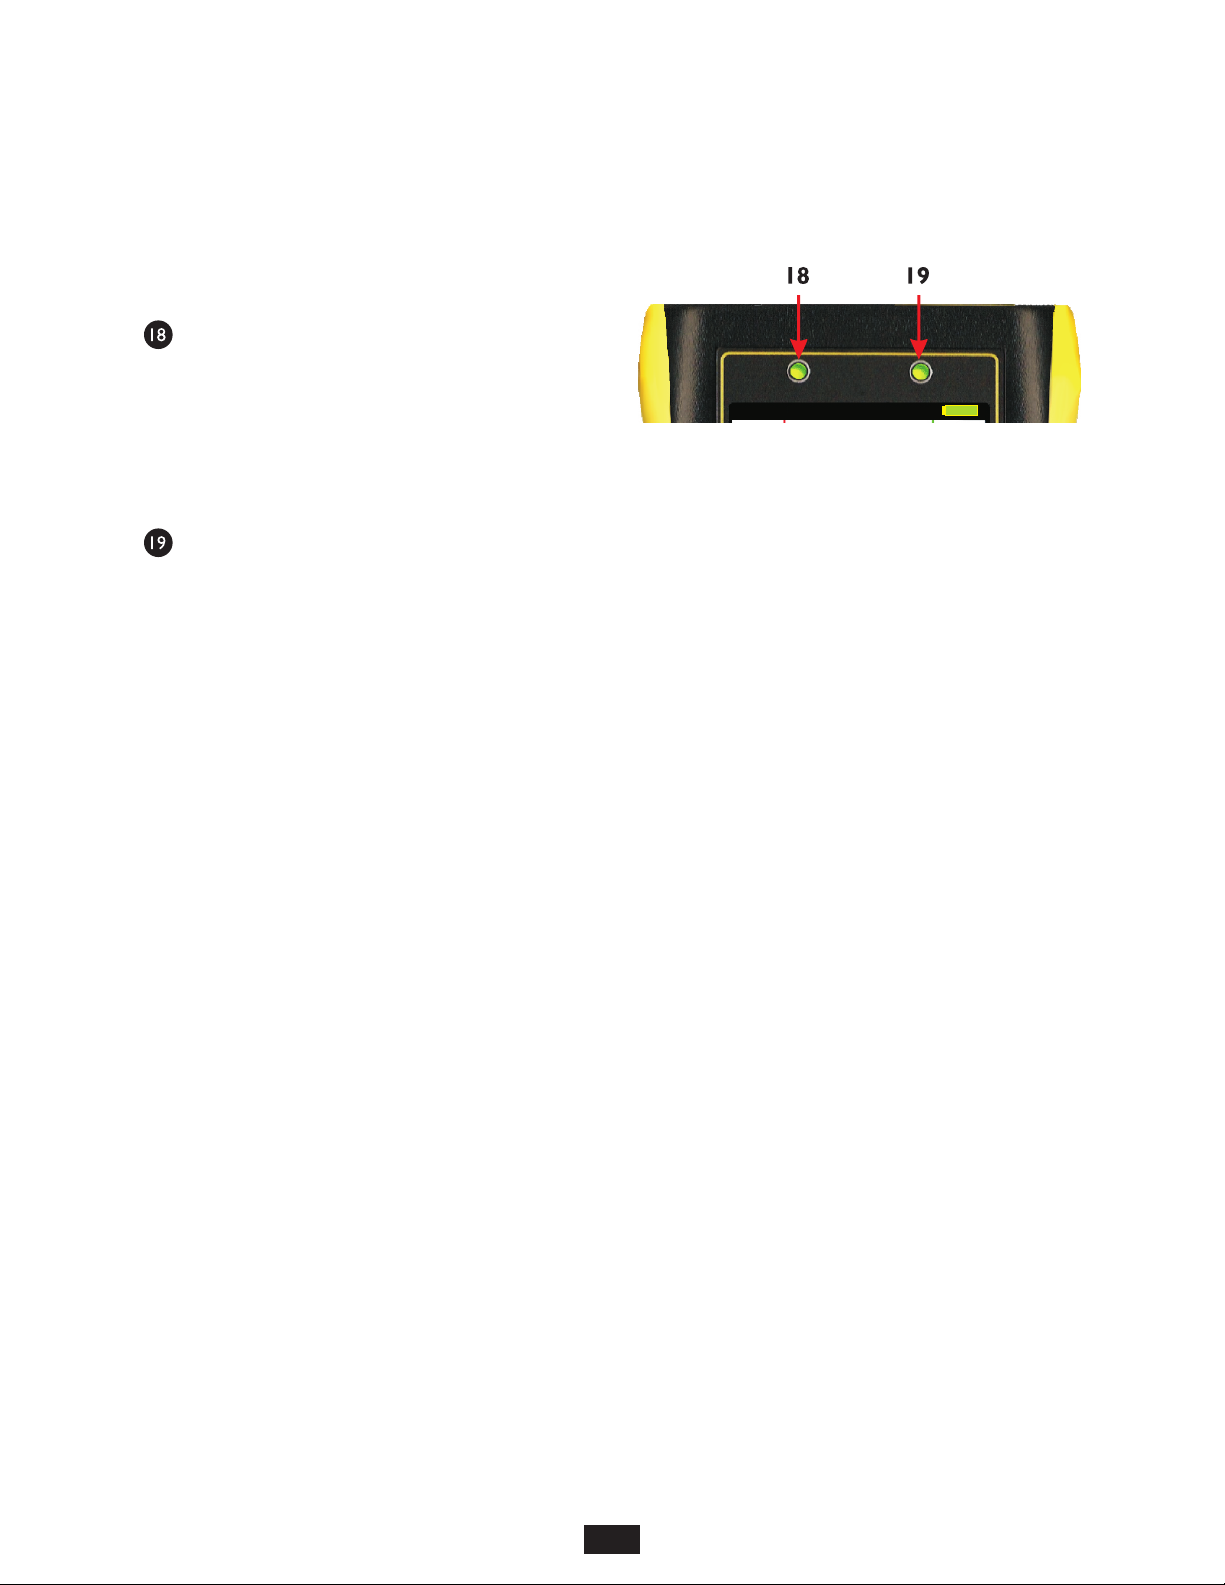
CHARGING STATUS – will be lit when charging through a
transformer or USB port
GREEN
ORANGE
RED
battery fully charged
battery charging
problem with battery and/or charger; contact OWL for service
STANDBY STATUS
Normal operation blinking
STANDBY solid; press any key to “wake up” the device
GREEN
RED
Fiber #x
AUTO
11
Page 12
SECTION 2: OTDR TESTING
POWER ON/OFF
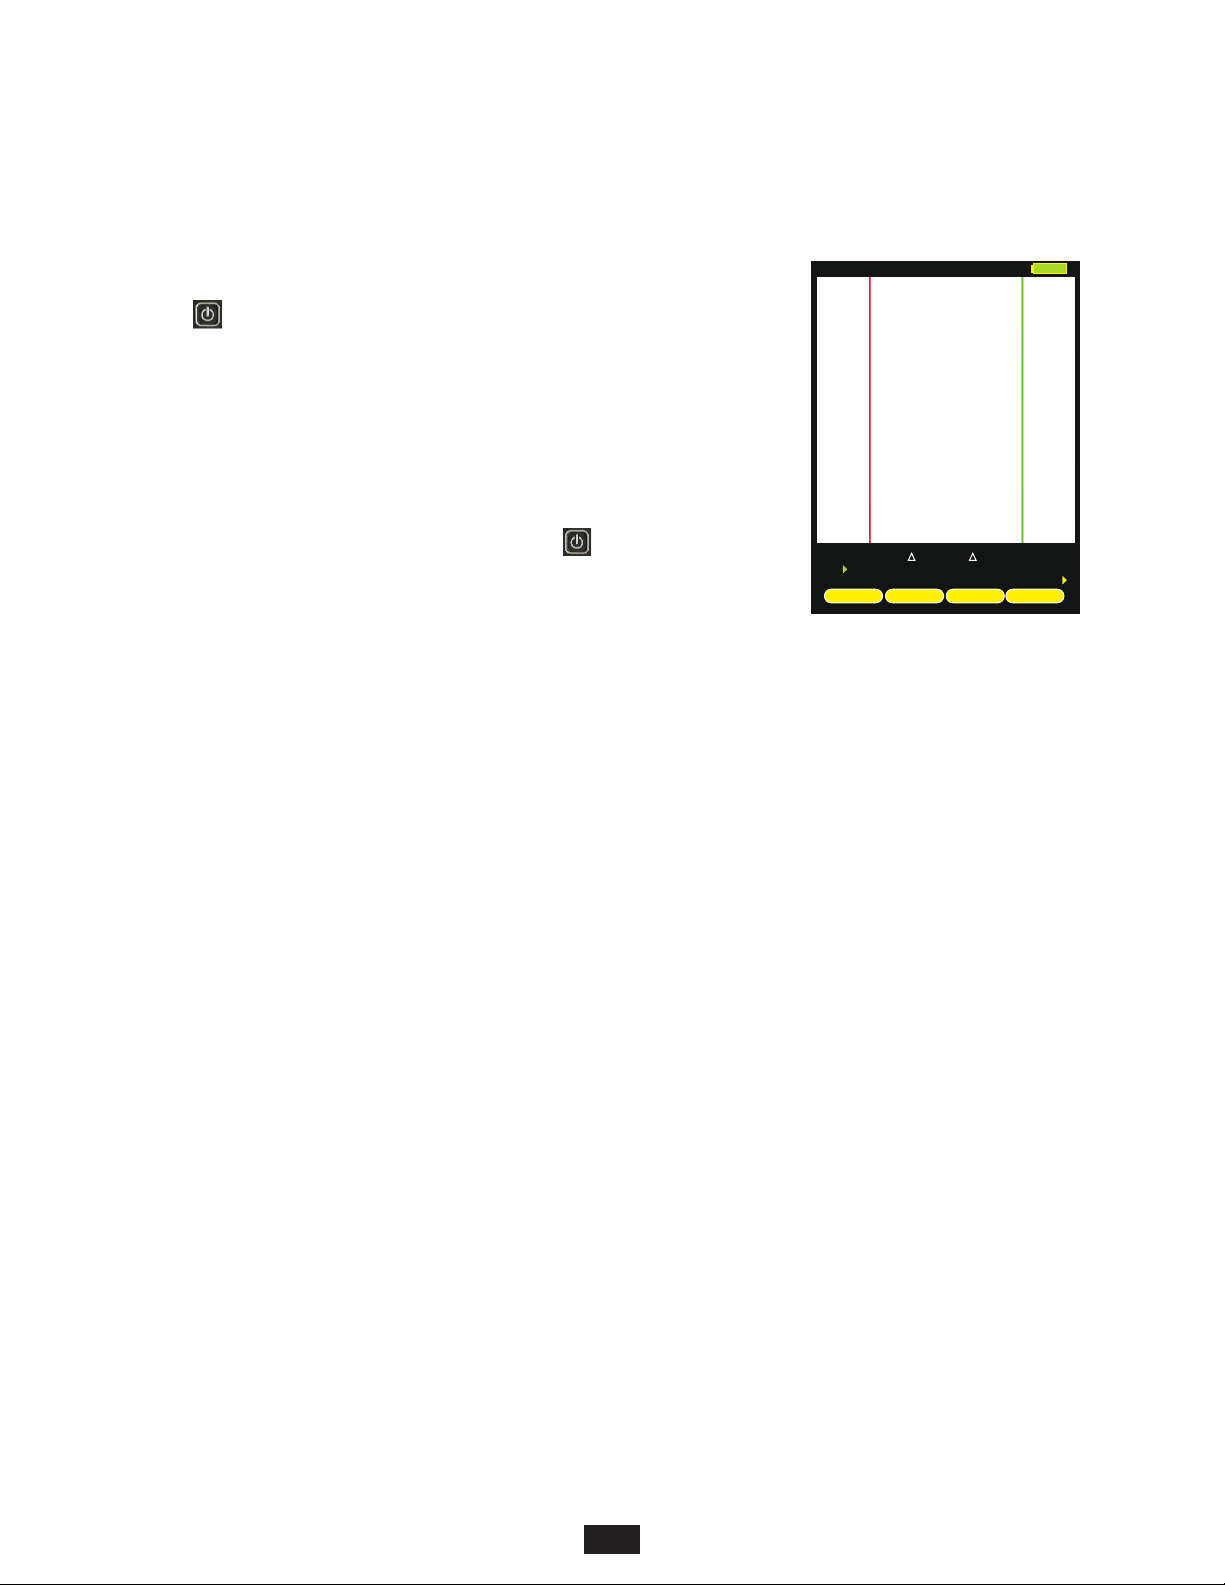
POWER ON
Fiber #x
AUTO
Press to power on the OTDR.
When the OTDR has completed startup, the trace area will either be blank, as shown at right,
or will show the previously viewed trace.
Continue below for more information about running a new OTDR trace.
POWER OFF
The OTDR may be powered off from any screen by holding .
1550nm
06081m
20221m
24711m
L mx
14140dB0.00
0.00
RFL dBx
-81.00x
ENTER
TESTZOOMLOCKCURSOR
KEY OTDR TRACE PARAMETERS
Below is a descriptive list of key OTDR trace parameters.
WAVELENGTH – range of values: Multimode: 850, 1300, BOTH; Singlemode: 1310nm, 1550nm, BOTH. Allows the user to
select one or two wavelength(s) used for testing. Wavelength selection only applies to dual-wavelength OTDR.
INDEX OF REFRACTION – range of values: 1.4000 to 1.6000. To ensure the most accurate distance to events, Index of Refraction
(IoR) should be set to the fiber manufacturer’s refractive index specification for the fiber under test. If unknown, set IoR to:
SINGLEMODE – 1.4681 (as this value falls within 99% of the IoR values for most singlemode optical fibers)
MULTIMODE – 1.4920
CAPTURE MODE – range of values: AUTO, SEMI, USER, FILT, LIVE.
AUTO all trace options are determined automatically, except dead zone length.
SEMI same as AUTO except the pulse width is not automatically determined.
USER all user configured options are used when capturing the trace.
FILT same as USER plus the software will filter (smooth) the trace to remove noise. This will help produce a cleaner
trace with less averaging required.
LIVE uses the user-defined trace settings to continuously update the trace on the screen. The trace will be updated
after the user-defined number of averages is completed. The cursors and zoom functions work in LIVE mode. To
start and exit LIVE mode, press the TEST function button.
NOTE: if connected to a PC running OWLView software, LIVE mode also updates the software trace area
PULSE WIDTH – range of values: Multimode: 1, 2, 5, 10, 20, 50, 100 m; Singlemode: 1, 2, 5, 10, 20, 50, 100, 200, 500, 1000 m.
Pulse width offers a trade-off between the ability to measure longer cable distances (longer pulse width) versus the ability to see two
events that are closely spaced (shorter pulse width). This is otherwise known as an OTDR’s event dead zone (i.e. the minimum
distance between two events where they both can be measured).
NUMBER OF AVERAGES – range of values: 256, 512, 1024, 2048, 4096. Increasing the number of averages allows the OTDR to
have better display resolution (events are easier to see, especially near the noise level), but also increases the trace acquisition time.
DEAD ZONE LENGTH(m) – range of values: 0 to 1500. Allows the user to enter the length of a dead-zone box (a.k.a. pulse
suppressor), if one is being used. If a value is entered for dead zone, the dead zone portion of the OTDR trace will be grayed out. The
active portion of the trace will begin where the dead zone ends.
RANGE – range of values: 1, 2, 5, 10, 25, 50, 65, 128 km. Allows the user to manually enter the total length of the trace. NOTE: for
best results, this value should be set to the next highest value from the actual length of the fiber under test.
STEP – range of values: 1, 2, 4 m. Trace sample spacing. Smaller steps produce more accurate distance to events, but trace
acquisition takes longer.
12
Page 13
SECTION 2: OTDR TESTING
SETTING TEST PARAMETERS
SET WAVELENGTH
When using a dual-wavelength OTDR, traces can be run at either one or two wavelengths.
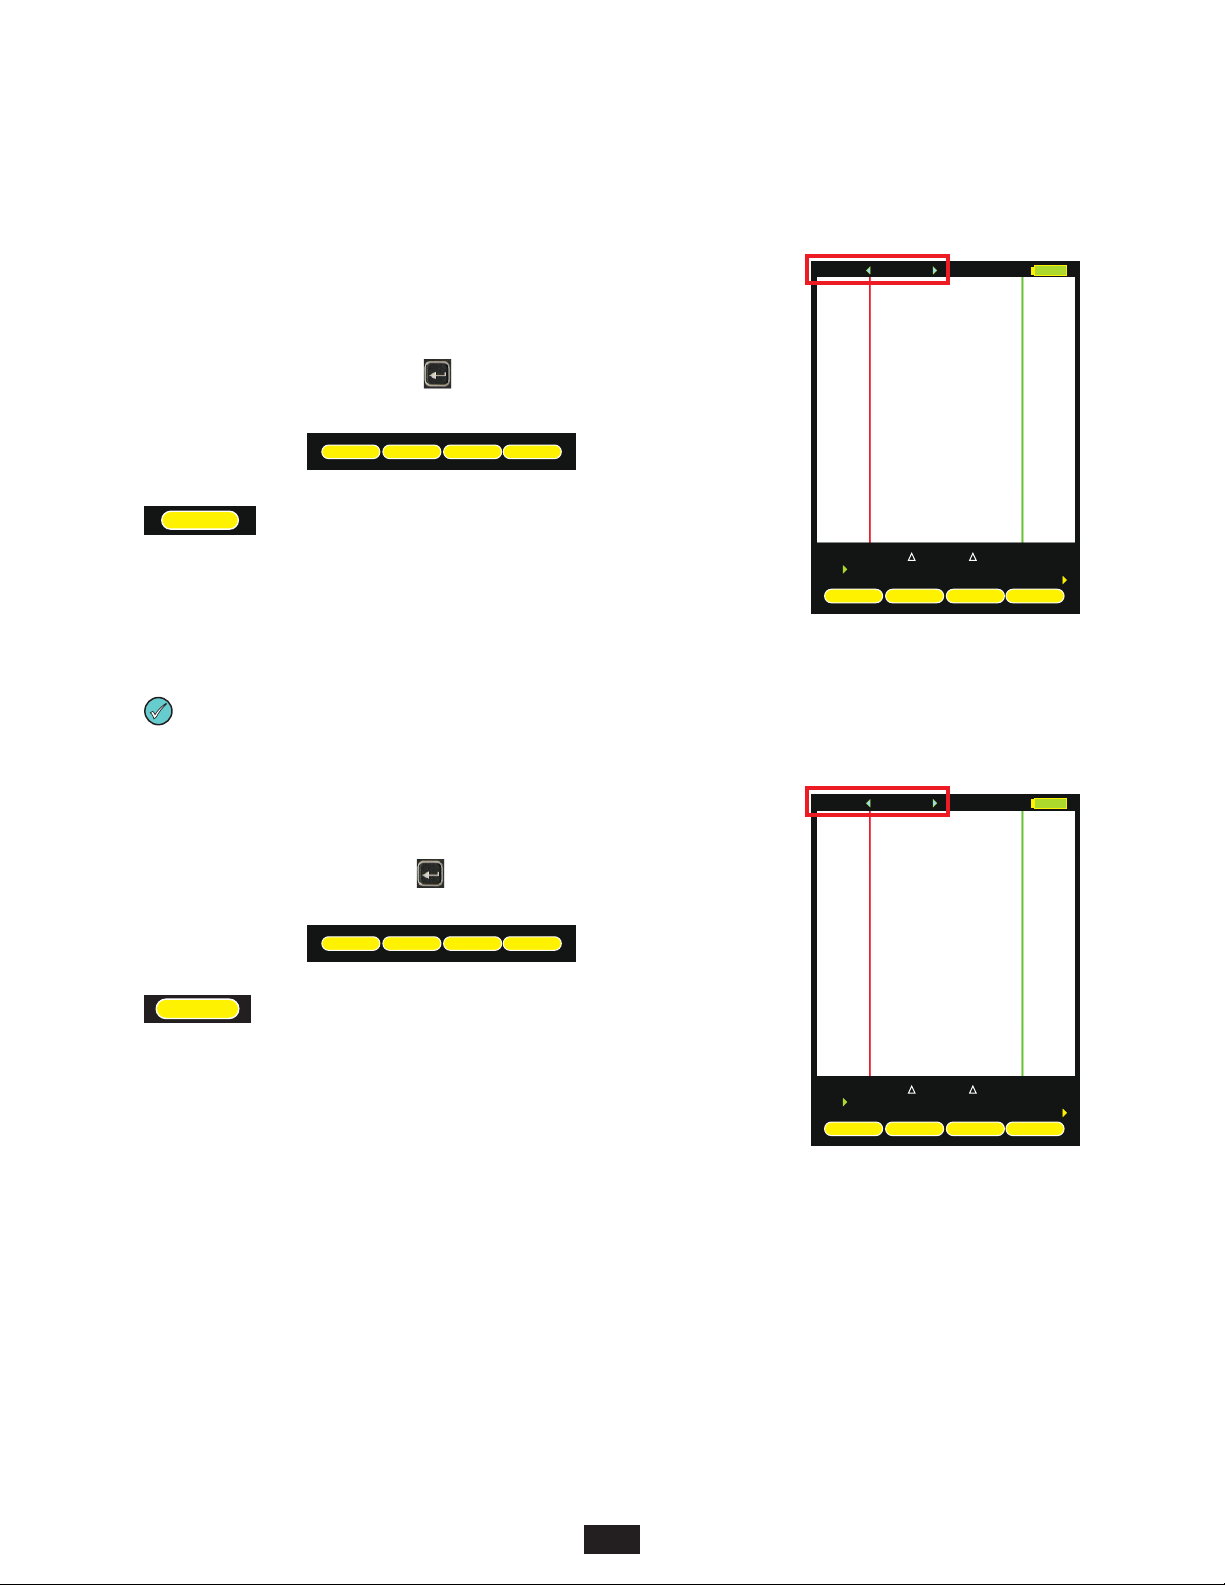
To set the trace wavelength(s), press from the trace screen until the following menu
options appear:
EOFEVENTS
MENU
WAVE
WAVE
allows the user to select one or both wavelengths to be used for testing.
Arrow keys scroll through three options: 1310nm, 1550nm, BOTH.
Press key again to exit.
The selected wavelength(s) will appear at the bottom of the trace screen. If two wavelengths
blue
are present on the trace screen, they will be displayed as either or .
The cursor information below the trace screen applies to the wavelength listed in .
brown
blue
If the OTDR only has one wavelength installed, the WAVE option will not appear.
SET INDEX OF REFRACTION
Wave: 1550nmxxx
1310nm 1550nm
06081m
20221m
24711m
Index 1.4681xxx
AUTO
L mx
14140dB0.00
EOFEVENTS
0.00
MENU
AUTO
RFL dBx
-81.00x
ENTER
WAVE
To set the index of refraction, press from the trace screen until the following menu
options appear:
INDEX
SETUP
INDEX
LOADSAVE
allows the user to change the index of refraction; setting will appear at
the top of the trace screen. Press key again to exit.
Index of refraction should be set to the optical fiber manufacturer’s index of refraction
specification. If unknown, use the suggested values below.
Suggested index of refraction values:
SINGLEMODE – 1.4681
MULTIMODE – 1.4920
1310nm 1550nm
06081m
20221m
24711m
L mx
14140dB0.00
0.00
RFL dBx
-81.00x
ENTER
SETUPINDEXLOADSAVE
13
Page 14
SECTION 2: OTDR TESTING
SETTING TEST PARAMETERS, cont.
SETTING TRACE OPTIONS
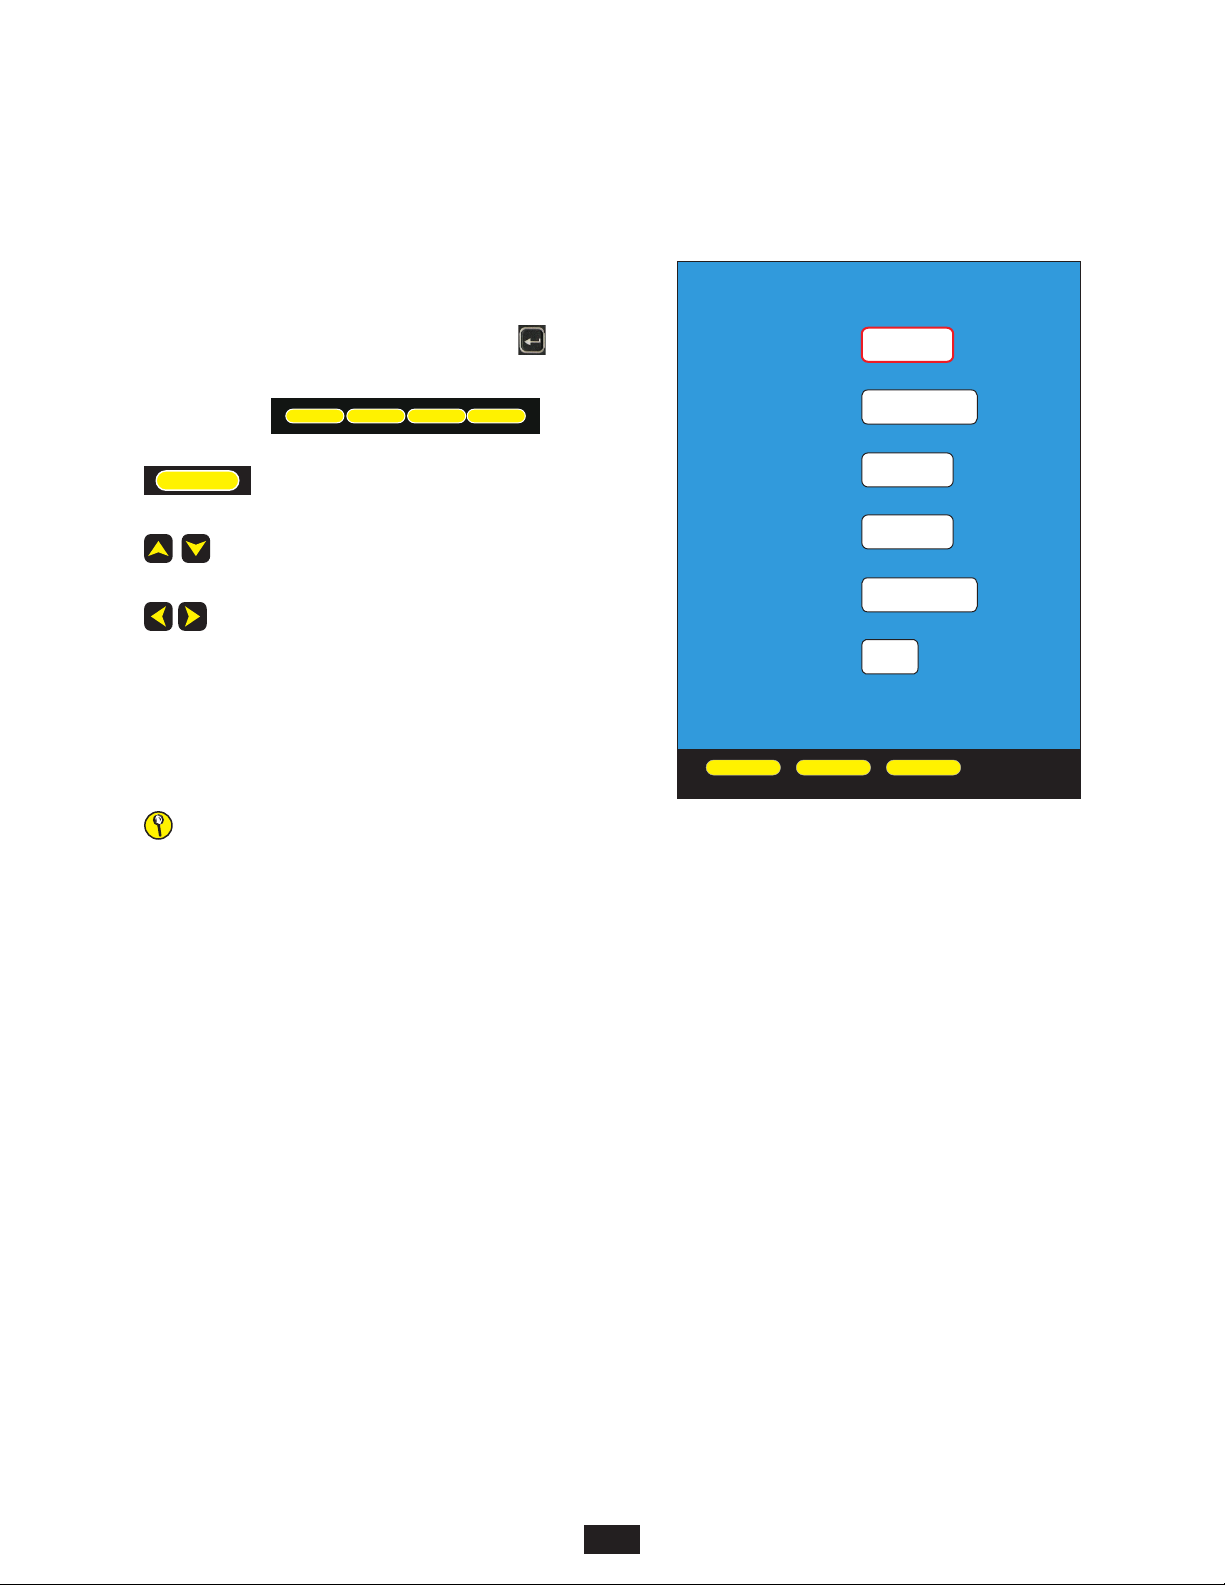
To see an additional menu of trace options, press from the trace
screen until the following menu options appear:
INDEX
SETUP
LOADSAVE
SETUP
CAPTURE MODE – Range of values: AUTO, SEMI, USER, FILT, LIVE
Capture Mode should be set to AUTO mode for a majority of testing
scenarios, so the OTDR can automatically determine the best set of trace
parameters based on the fiber link under test.
USER, SEMI, FILT, and LIVE require the user to understand
the consequences of setting trace parameters manually.
Only trained fiber optic professionals who are experienced with operating OTDRs should manually set trace parameters.
Suggestions for setting these parameters are given below.
opens the TRACE OPTIONS menu
selects the next or previous trace option
changes the value in the selected trace option
TRACE OPTIONS
XXXXXXXXXXXXXXXXXXXXXXXXXXXXXXXXXX
XXXXXXXXXXXXXXXXXXXXXXXXXXXXXXXXXX
XX XXXXXXXXXXXXXXXXXXXX
CAPTURE MODE
XXXXXXXXXXXXXXXXXXXXXXXXXXXXXXXXXX
XXXXXXXXXXXXXXXXXXXXXXXXXXXXXXXXXX
PULSE WIDTH
XX XXXXXXXXXXXXXXXXXXXXX
XXXXXXXXXXXXXXXXXXXXXXXXXXXXXXXXXX
XX XXXXXXXXXXXXXXXXXXXXXX
NUMBER OF
XX XXXXXXXXXXXXXXXXXXXXXXXXX
SAMPLES
XXXXXXXXXXXXXXXXXXXXXXXXXXXXXXXXXX
DEAD ZONE
XX XXXXXXXXXXXXXXXXXXXXXXX
LENGTH(m)
XX XXXXXXXXXXXXXXXXXXXXXXX
XXXXXXXXXXXXXXXXXXXXXXXXXXXXXXXXXX
XXXXXXXXXXXXXXXXXXXXXXXXXXXXXXXXXX
RANGE
XX XXXXXXXXXXXXXXXXXXX
XXXXXXXXXXXXXXXXXXXXXXXXXXXXXXXXXX
XXXXXXXXXXXXXXXXXXXXXXXXXXXXXXXXXX
XX XXXXXXXXXXXXXXXXXXXXXXXXXXXX
STEP
XXXXXXXXXXXXXXXXXXXXXXXXXXXXXXXXXX
XXXXXXXXXXXXXXXXXXXXXXXXXXXXXXXXXX
XXXXXXXXXXXXXXXXXXXXXXXXXXXXXXXXXX
XXXXXXXXXXXXXXXXXXXXXXXXXXXXXXXXXX
SAVE
XXSAVEXXXXQUITXXXXHELPXXXXXXXXXXXX
AUTO
1m
4096
1100
MAXkm
1m
QUIT HELP
PULSE WIDTH – range of values: Multimode: 1, 2, 5, 10, 20, 50, 100 m; Singlemode: 1, 2, 5, 10, 20, 50, 100, 200, 500, 1000 m.
Pulse width should be set to the shortest setting that allows multiple closely-spaced events to be clearly defined, while preventing any
of the trace from reaching the noise floor.
NUMBER OF AVERAGES – Range of values: 256, 512, 1024, 2048, 4096. Use the maximum number of averages unless traces
are taking to long to acquire.
DEAD ZONE LENGTH (m) – Range of values: 0 to 1500. Set this value to ‘0000’ if not using a dead-zone box (a.k.a. pulse
suppressor box). If using a dead-zone box, and you want to highlight the dead-zone box length on the trace, enter the length of the
dead-zone box in meters.
RANGE – range of values: 1, 2, 5, 10, 25, 50, 65, 128 km. Set to the next highest value from the actual length of the fiber under test.
If fiber length is unknown, select MAX km.
STEP – Range of values: 1, 2, 4 m. Use shortest STEP value for most accurate distance to events, unless trace acquisition time is
too long.
14
Page 15
SECTION 2: OTDR TESTING
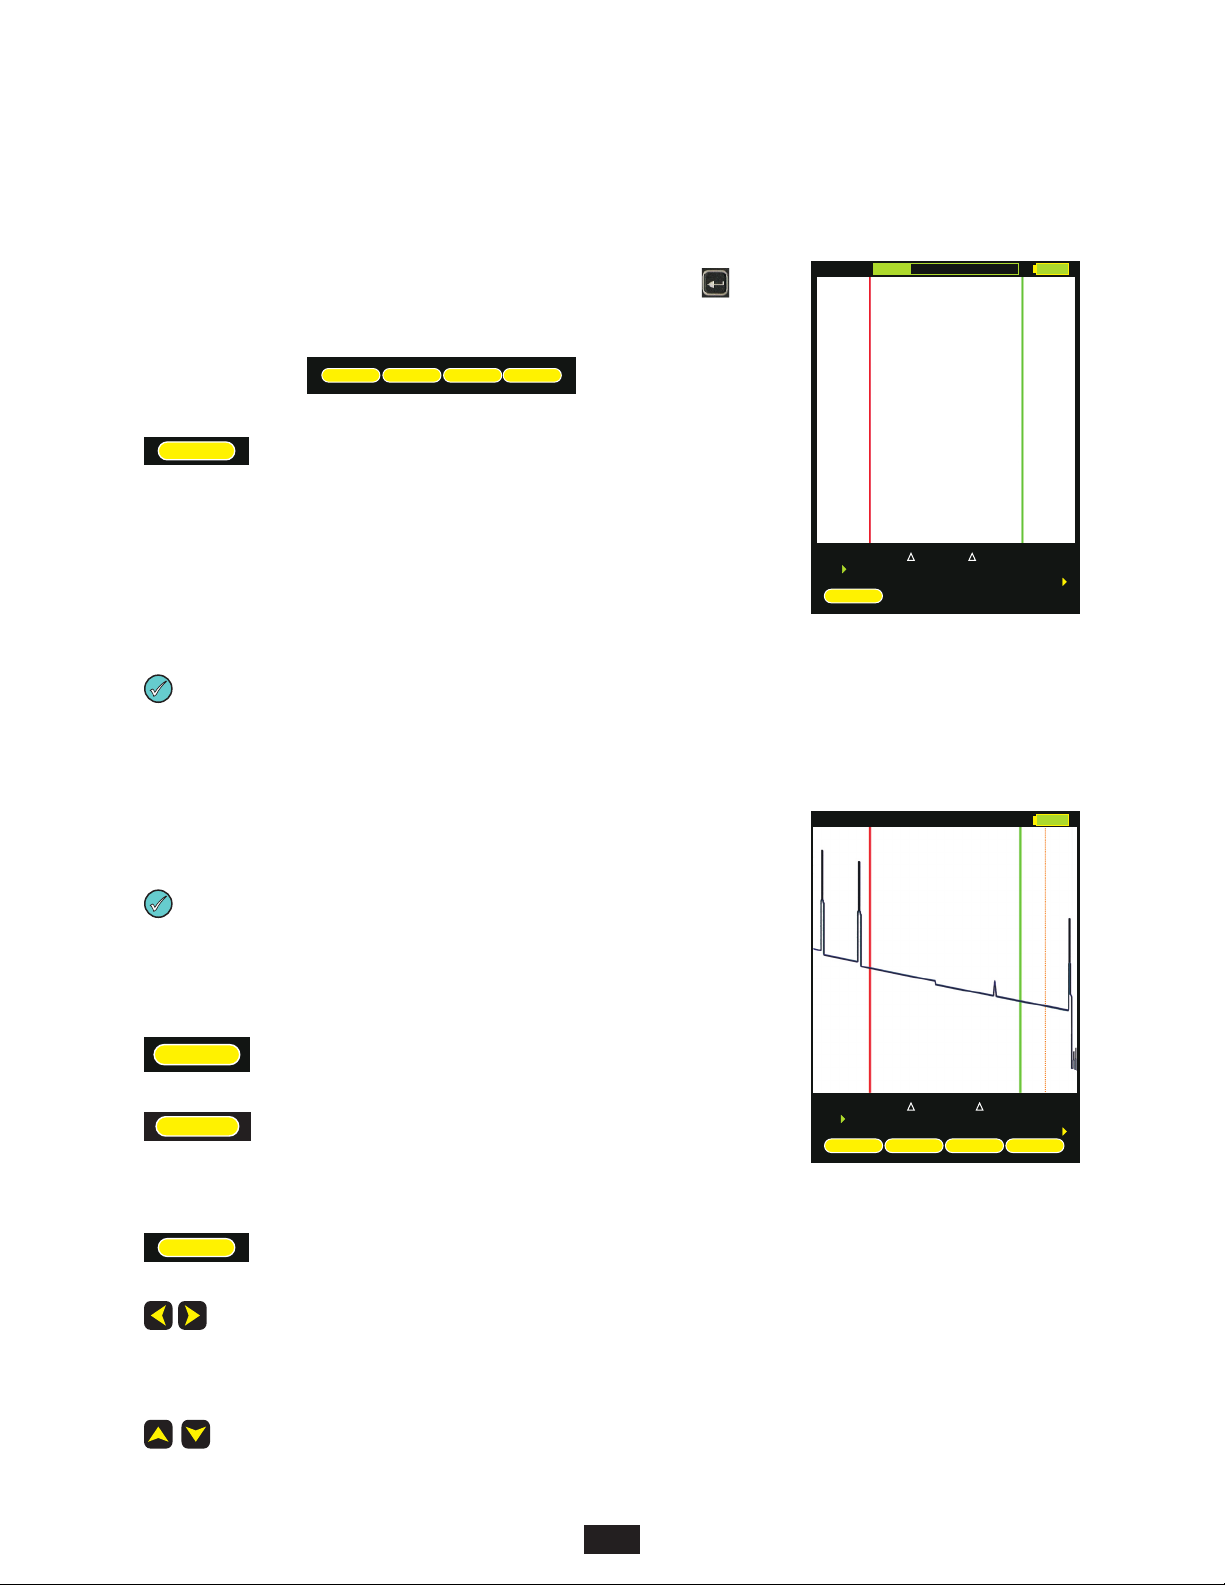
STARTING AN OTDR TRACE
Once the OTDR parameters have been set, an OTDR trace can be run. Press from the
trace screen until the following menu options appear:
ZOOM
TEST
TEST
CURSOR
LOCK
starts an OTDR trace based upon the current OTDR parameters
During the OTDR test (as shown at right):
! the ABORT soft-key appears (used to abort an OTDR trace)
! all soft-keys are disabled
! a bar graph appears at the top of the screen showing the progress of the OTDR test
! dual-wave test will run a separate trace automatically for each wavelength
starting a new trace will replace the old trace on the display with the new trace after a few seconds (depending upon the
trace length).
CURSOR NAVIGATION
Once the OTDR trace is complete, the OTDR trace will appear on the screen, and the OTDR
information – distance and optical power – will be updated.
TESTING
1550nm
06081m
20221m
24711m
ABORT
Fiber #x
L mx
14140dB0.00x
0.00x
AUTO
RFL
x
-81.00
dB
two color coded traces will appear on the screen if a dual-wavelength trace was run
Orange
green
green green
red red
Trace information is color-coded. and refer to the cursors. text refers to the
Red
difference between the two cursors. text refers to the perceived end of the fiber link
(the position of the dotted line).
CURSOR
LOCK
orange
sets the active cursor – no cursor, , , or both and
locks the active cursor at its current location; unlocks a locked cursor
Blue
When a cursor is locked, a colored padlock symbol will appear next to
the appropriate cursor information
ZOOM
sets the ZOOM mode to Horizontal (H) or Vertical (V)
WHEN ONE OR MORE CURSORS ARE SELECTED: moves the cursor(s) left or right; holding these buttons
speeds up the cursor movement
WHEN NO CURSOR IS SELECTED: screen pans left and right
WHEN ONE OR MORE CURSORS ARE SELECTED: zooms in or out on the active cursor(s)
WHEN NO CURSOR IS SELECTED: zooms in and out on the center of the screen
1550nm
06086m
20226m
24718m
CURSOR LOCK
L mx
14140dB2.34
ZOOM
3.43
RFL dBx
-81.00
ENTER
TEST
15
Page 16
SECTION 3: TRACE ANALYSIS
OVERVIEW
This section will provide a basic overview about how to analyze an OTDR trace, and will cover the different types of information that
can be gathered from an OTDR trace, including:
– event location;
– fiber length measurement;
– fiber attenuation (loss); and
– reflectance measurement.
proper interpretation of OTDR test results requires a significant amount of technical skill, knowledge, and expertise. Proper
trace interpretation is paramount to a successful OTDR test, and the consequences of interpreting a trace incorrectly could
result in a significant amount of network down-time and repair costs.
EVENTS
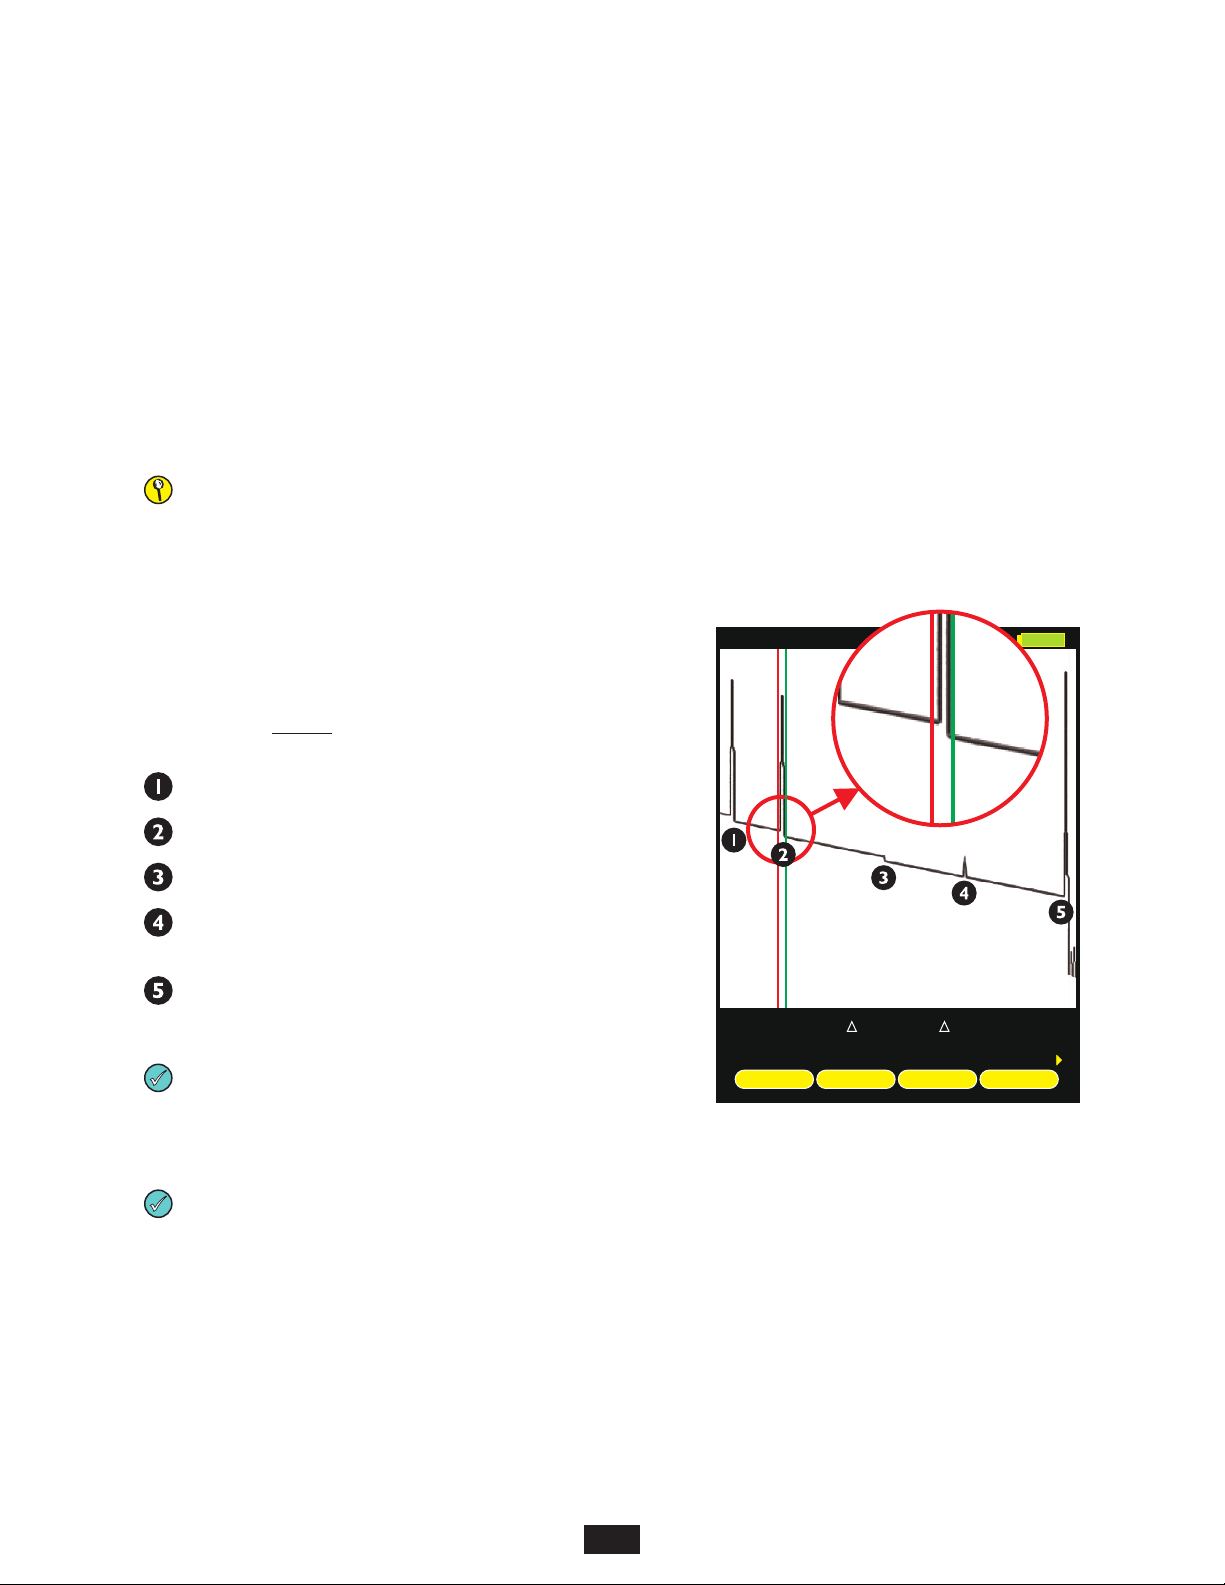
The primary function of an OTDR is to locate events along the optical fiber. On
an OTDR trace, events appear as deviations from an otherwise gently sloping
line.
Below is a list of the different events shown in the example at right, including the
type of event, and possible interpretations of the data:
Fresnel end of dead-zone box (pulse suppressor)
Fresnel patch panel using flat polish connectors
Backscatter fusion splice or macro-bend
Fresnel patch panel using APC (angled physical contact)
connectors
Fresnel end of fiber link; could also indicate a severe
break where no other events can be detected
after the break
If
the slope of the trace appears to “dip” to a lower level after the event
(events 1, 2, and 3), this could mean one of two things: 1) if the slope
of the line changes, the refractive index of the fiber preceding the
event is different from the refractive index of the fiber following the event, or 2) if the slope stays the same, then the event is
simply a loss-inducing event.
Tall spikes usually indicate flat polish connections or other highly reflective events (breaks, shatters, end of fiber, etc.), while
short spikes usually indicate angled polish connections.
Fiber #x
1550nm
06086m
6126m
24718m
CURSOR LOCK
L mx
40
0.34
7.43
ZOOM
AUTO
dB
RFL dBx
-34.26
ENTER
TEST
CURSOR PLACEMENT
Proper cursor placement is critical in determining the exact distance to an event, as well as the relative effect the event has on optical
power traveling through the event.
red
The cursor should be placed right before the slope of the line begins to spike.
green
The cursor should be placed after the event, at a point where the slope of the line returns to the normal backscatter level.
Cursor information is located below the trace. and cursor information shows the distance to each cursor. The length
information shows the distance between the cursors, and the dB number is the dB loss of the event being measured.
Red green blue
blue
16
Page 17
SECTION 3: TRACE ANALYSIS
FIBER LENGTH MEASUREMENT/LINK LOSS
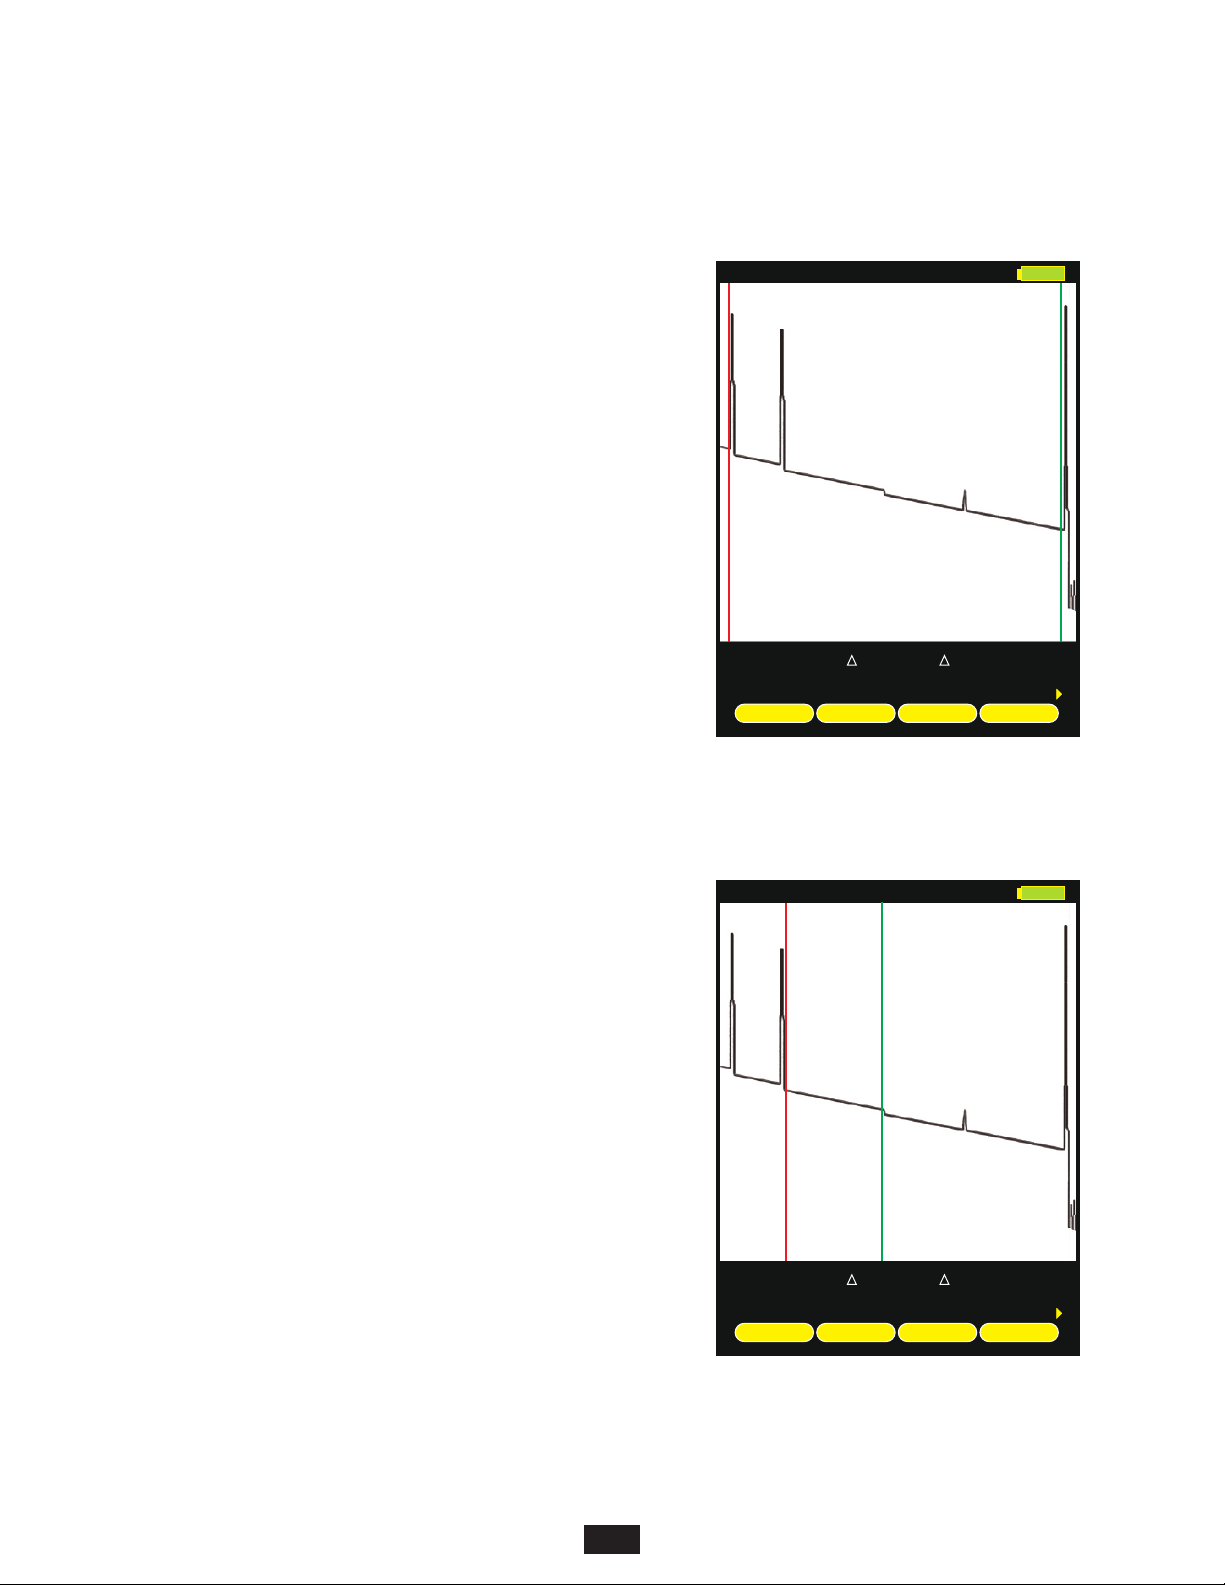
By placing the cursors at the beginning and ending points of the fiber trace, the
distance between the cursors will show a close approximation of the total length
of the optical fiber link, as well as a close approximation of the total fiber link
loss.
CURSOR PLACEMENT
Proper cursor placement is necessary to determine the end to end length and
link loss of an optical fiber link. Refer to the diagram at right when placing
cursors for fiber length measurement.
red
The cursor should be placed directly before the first reflective event,
before the slope of the line begins to spike.
green
The cursor should be placed directly before the last event, before
the slope of the line begins to spike.
Cursor information is located below the trace. and cursor
information shows the distance to the cursor, and the information shows
the distance and relative power (in dB) between the and cursors.
With cursors placed as shown at right, the length number is the
approximate end-to-end length of the fiber link, and the dB number is the
Red
blue
red
blue
blue
green
green
approximate dB loss of the link (not including the loss of the far end patch
panel.)
In this example, the total link length is , and the end-to-end link
loss (not including the far end patch panel) is .
24718 meters
7.43 dB
FIBER ATTENUATION MEASUREMENT
Fiber #x
1550nm
1m
24719m
24718m
CURSOR LOCK ZOOM TEST
24718
L mx
AUTO
dB
7.43
7.43
RFL dBx
-81.00
ENTER
The fiber attenuation, or loss, for a certain section of an optical fiber link can be
determined by placing the cursors at the beginning and end points of the
segment of fiber under test.
CURSOR PLACEMENT
Proper cursor placement is necessary to determine the attenuation of a certain
segment of fiber.
red
The cursor should be placed at the beginning of the section of fiber
under test.
green
The cursor should be placed at the end of the section of fiber under
test.
Cursor information is located below the trace. and cursor
information shows the distance to the cursor, and the information shows
the distance and relative power (in dB) between the and cursors.
With cursors placed as shown at right, the length number is the length of
fiber between the cursors, and the dB number is the dB loss of the fiber
blue
blue
Red
blue
red
between the cursors.
In this example, the section of fiber being analyzed has of loss, and is
7040 meters
.
1.76 dB
Using this information, attenuation of fiber (dB per kilometer) can also be
calculated, which can then be compared to the fiber manufacturer attenuation
specification. To determine dB/km:
1.76 dB / 7.040 km = 0.25 dB/km
green
green
L mx
AUTO
dB
1.76
7.43
Fiber #x
1550nm
4086m
11126m
24718m
CURSOR LOCK ZOOM TEST
7040
RFL dBx
-34.26
ENTER
17
Page 18
SECTION 3: TRACE ANALYSIS
REFLECTANCE MEASUREMENT
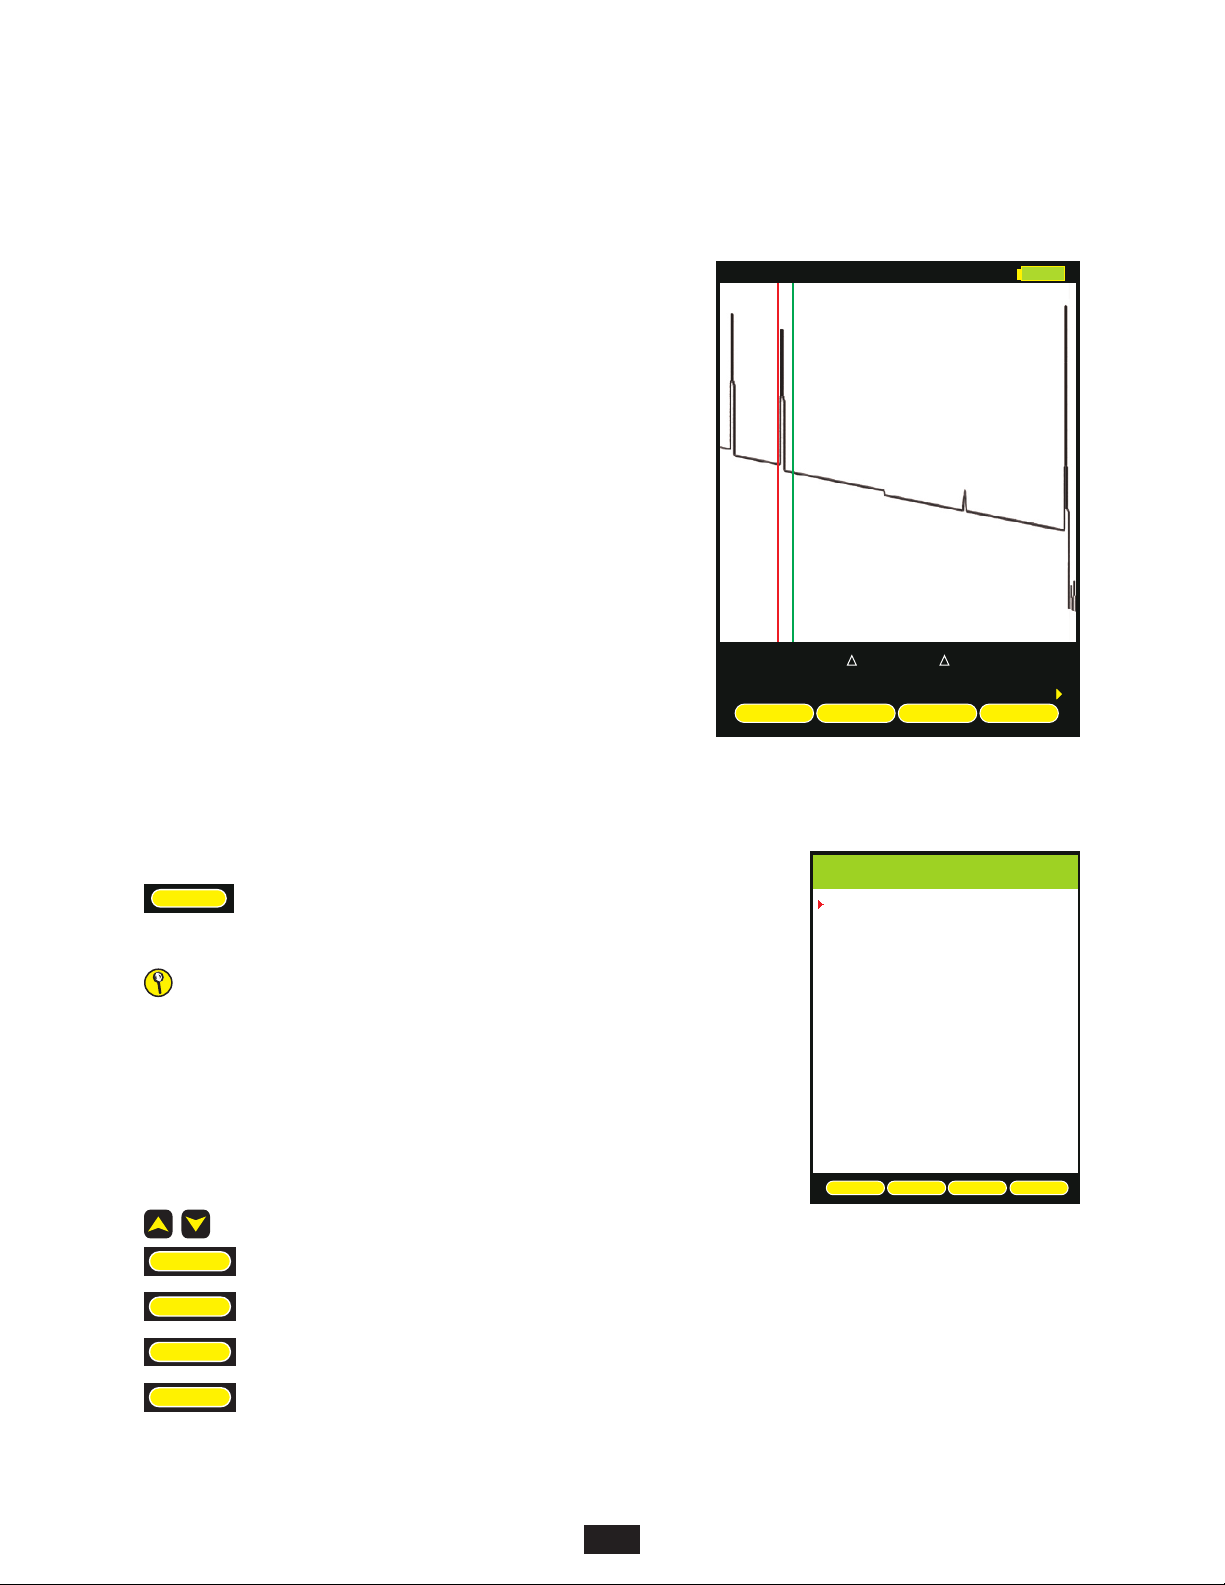
The reflectance of a specific event can be determined by placing the cursors on
either side of an event. The OTDR will show the reflectance in dB of the highest
reflective event between the cursors.
CURSOR PLACEMENT
Proper cursor placement is important when determining the reflectance of a
reflective event.
red
The cursor should be placed on the backscatter line directly before the
event, on the sloping line before the spike.
green
The cursor should be placed on the backscatter line at the point
where the backscatter line returns to its normal slope.
Cursor information is located below the trace. and cursor
information shows the distance to the cursors, and the information shows
the length, relative power, and reflectance between the and cursors.
With cursors placed as shown at right, the reflectance number is the point
blue
Red
blue
red
green
green
of highest reflectance (in dB) between the cursors.
NOTE: if multiple reflective events are included between the cursors, the
reflectance number will display the most reflective of the events.
In this example, the reflective event being measured has a reflectance of
dB
.
-34.26
TRACE EVENTS MENU
Fiber #x
1550nm1550nm
4786m
6126m
24718m
CURSOR LOCK ZOOM TEST
1340
L mx
AUTO
dB
0.52
7.43
RFL dBx
-34.26
ENTER
Automatic event location can be performed from the trace screen by accessing the
EVENTS
function option. See Section 1: INTRODUCTION – DISPLAY for more
information about function option menus.
IMPORTANT NOTE: automatic event location is only meant to be used as a
guideline for the location of possible events. It is ultimately up to the user to
verify and determine if an event actually exists at that location.
LOCATION the distance to the start of the event
TYPE type of event (reflective, loss, etc.)
REFL reflectance of the event
LOSS loss of the event
moves the cursor up and down in the list of detected events
VIEW
PAGE
DONE
WAVE
returns the user to the trace screen, zoomed in on the selected event
displays the next page of events, if there are more events than will fit on the screen
returns the user to the trace screen
view events for additional wavelength (if available)
1310nm TRACE EVENTS
Location
xxxx
24011m
x
50539m
x
VIEW
NOTE: red text in the event table
Type
REFL
LOSS
REFL
Refl
-47.38
-81.00
-17.54
14m
PAGE DONE
indicates that the event fails to
meet user-set thresholds
Loss
X
0.87
0.21
X
11.63
WAVE
Once an event has been selected from this menu, each individual event will be marked with a “tic” mark at the top of the trace area.
The type of event is denoted by color: black for loss events and for reflective events.
light blue
18
Page 19
SECTION 3: TRACE ANALYSIS
SATURATION INVERSION
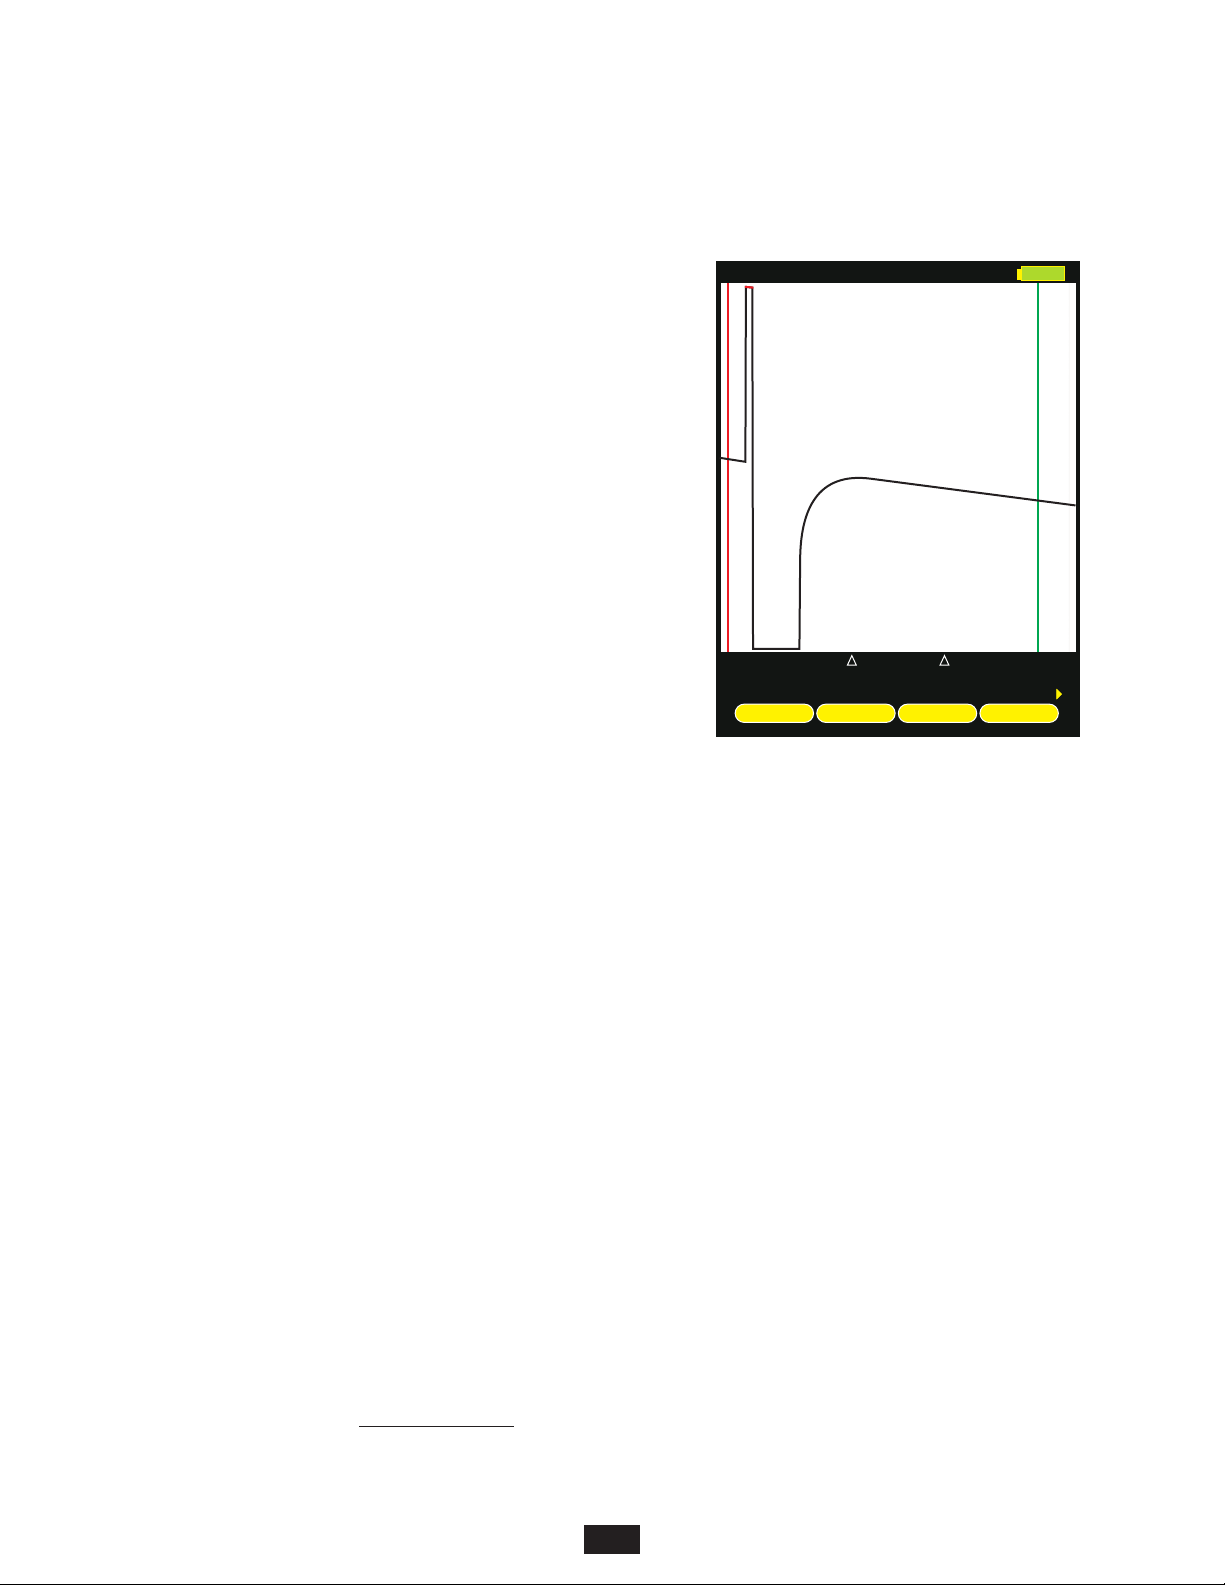
Some highly reflective events are so reflective that they “over-drive” the OTDR
circuitry, and cause the OTDR graph to appear as if the trace completely drops
out.
Fiber #x
1
AUTO
This issue is called “saturation inversion”, and only appears when overlyreflective light causes the internal OTDR circuitry to become saturated.
Every OTDR suffers from saturation issues, and many high-end OTDRs
include additional circuitry that tries to quench the saturation as it occurs.
However, irregardless of how well an OTDR can quench the saturation, the fact
remains that the reflective event requires immediate attention.
4
3
TRACE ANALYSIS
The sample trace shown here shows what typical saturation inversion looks
like. Four key points have been noted on the trace to explain what is occurring
in the OTDR:
1) The red line at the top of the reflective peak shows that the
OTDR has been saturated (please note that when the peak
has a red line, the reflectance value is not being reported
properly);
2) The flat line at the bottom of the trace shows that the OTDR has been “over-driven”, and has inverted the trace;
3) The OTDR has begun its recovery from saturation;
4) The OTDR has fully recovered from saturation, and has returned to its normal backscatter line.
In this example, the reflective event is caused by the interconnection that occurs between two connectors at a patch panel. The
connectors on either side of the patch panel are PC (physical contact).
There are several ways to address highly reflective events like this:
a) Thoroughly clean and inspect both connectors for debris or damage;
b) If the connectors appear damaged after thorough cleaning, try re-polishing the connector endfaces;
c) Re-terminate using connectors with better reflectance values (typical values shown here);
PC (physical contact) -30 to -35 dB
UPC (ultra physical contact) -45 to -50 dB
APC (angled physical contact) -55 to -60 dB (or less)
d) Replace the mating sleeve in the patch panel.
Once the inverted event has been fixed, re-test the fiber to ensure the event is no longer overly reflective.
2
4786m
6126m
24718m
CURSOR LOCK ZOOM TEST
L mx
1340
dB
0.52
7.43
RFL dBx
-30.26
ENTER
ANOTHER HELPFUL TIP
Another helpful tip for mitigating reflectance comes from the Fiber Optic Association (FOA) website:
http://www.jimhayes.com/OTDR/otdrs_d.htm
found under the section titled This "Trick" Can Help. This tip refers to the use of index-matching fluid between connectors to help
eliminate the air gap causing the overly reflective event.
19
Page 20
SECTION 4: TRACE STORAGE
STORED READINGS
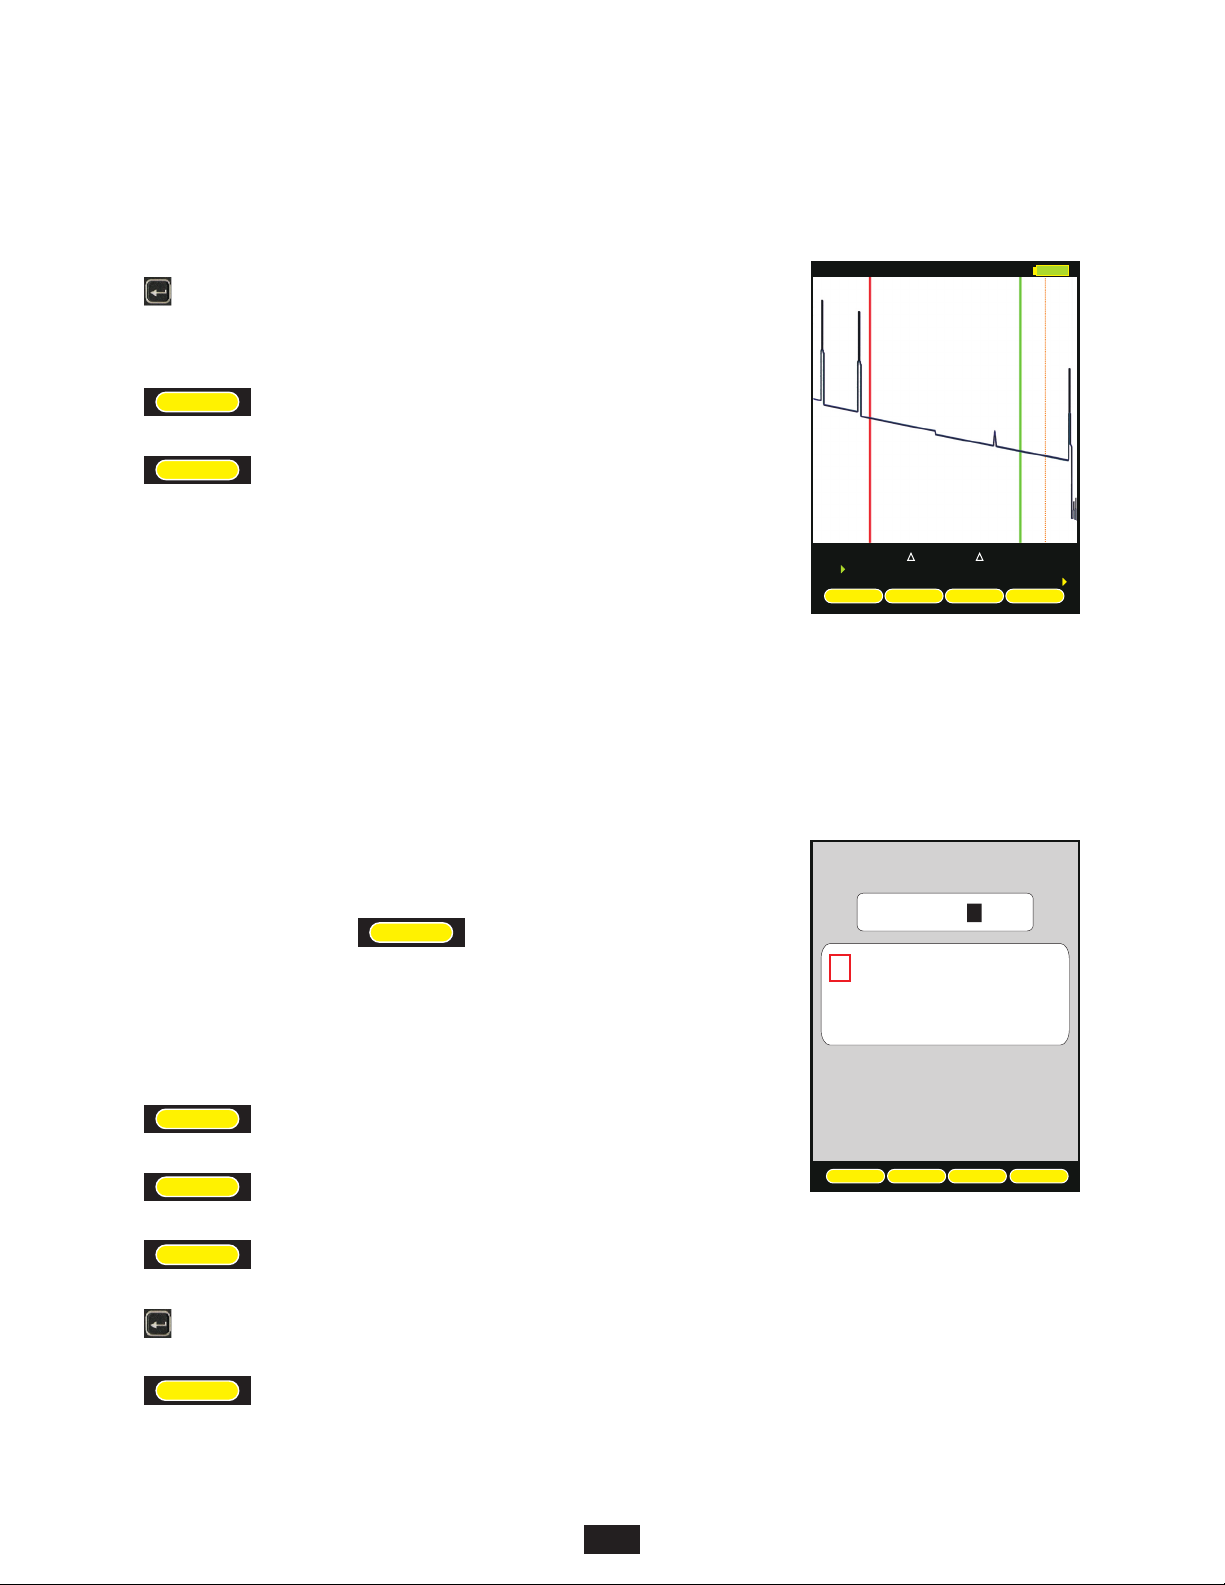
sets the Function Options Menu to allow access to Data Storage and Setup Menu
options. The following soft-keys apply to data storage functions.
SAVE
LOAD
SAVING A TRACE
LOADING A PREVIOUSLY STORED TRACE
SAVING A TRACE
Fiber #x
1550nm
SAVE
06086m
20226m
24718m
AUTO
L mx
14140dB2.34
INDEX
LOAD
3.43
RFL dBx
-81.00
ENTER
SETUP
Traces may be stored in permanent memory for later viewing or download to hard disk for
data file retrieval.
From the trace screen, press to enter the fiber name and save the currently
SAVE
displayed trace to memory.
To enter a fiber name, use the arrow keys to highlight the appropriate character on the grid.
<--
SHIFT
SPACE
BACKSPACE
TOGGLE BETWEEN UPPER AND LOWER CASE ALPHABET
FORWARD SPACE
SELECT THE HIGHLIGHTED CHARACTER
DONE
FINISHED ENTERING NAME
Enter fiber name:x x
Fiber #x
ABCDEFGHIJKLM
NOPQRSTUVWXYZ
0123456789 : ; <
Use arrows to highlight letter
then press the enter key. Tap
the power button to abort.
<-- SHIFT SPACE DONE
20
Page 21
SECTION 4: TRACE STORAGE
LOADING A PREVIOUSLY STORED TRACE
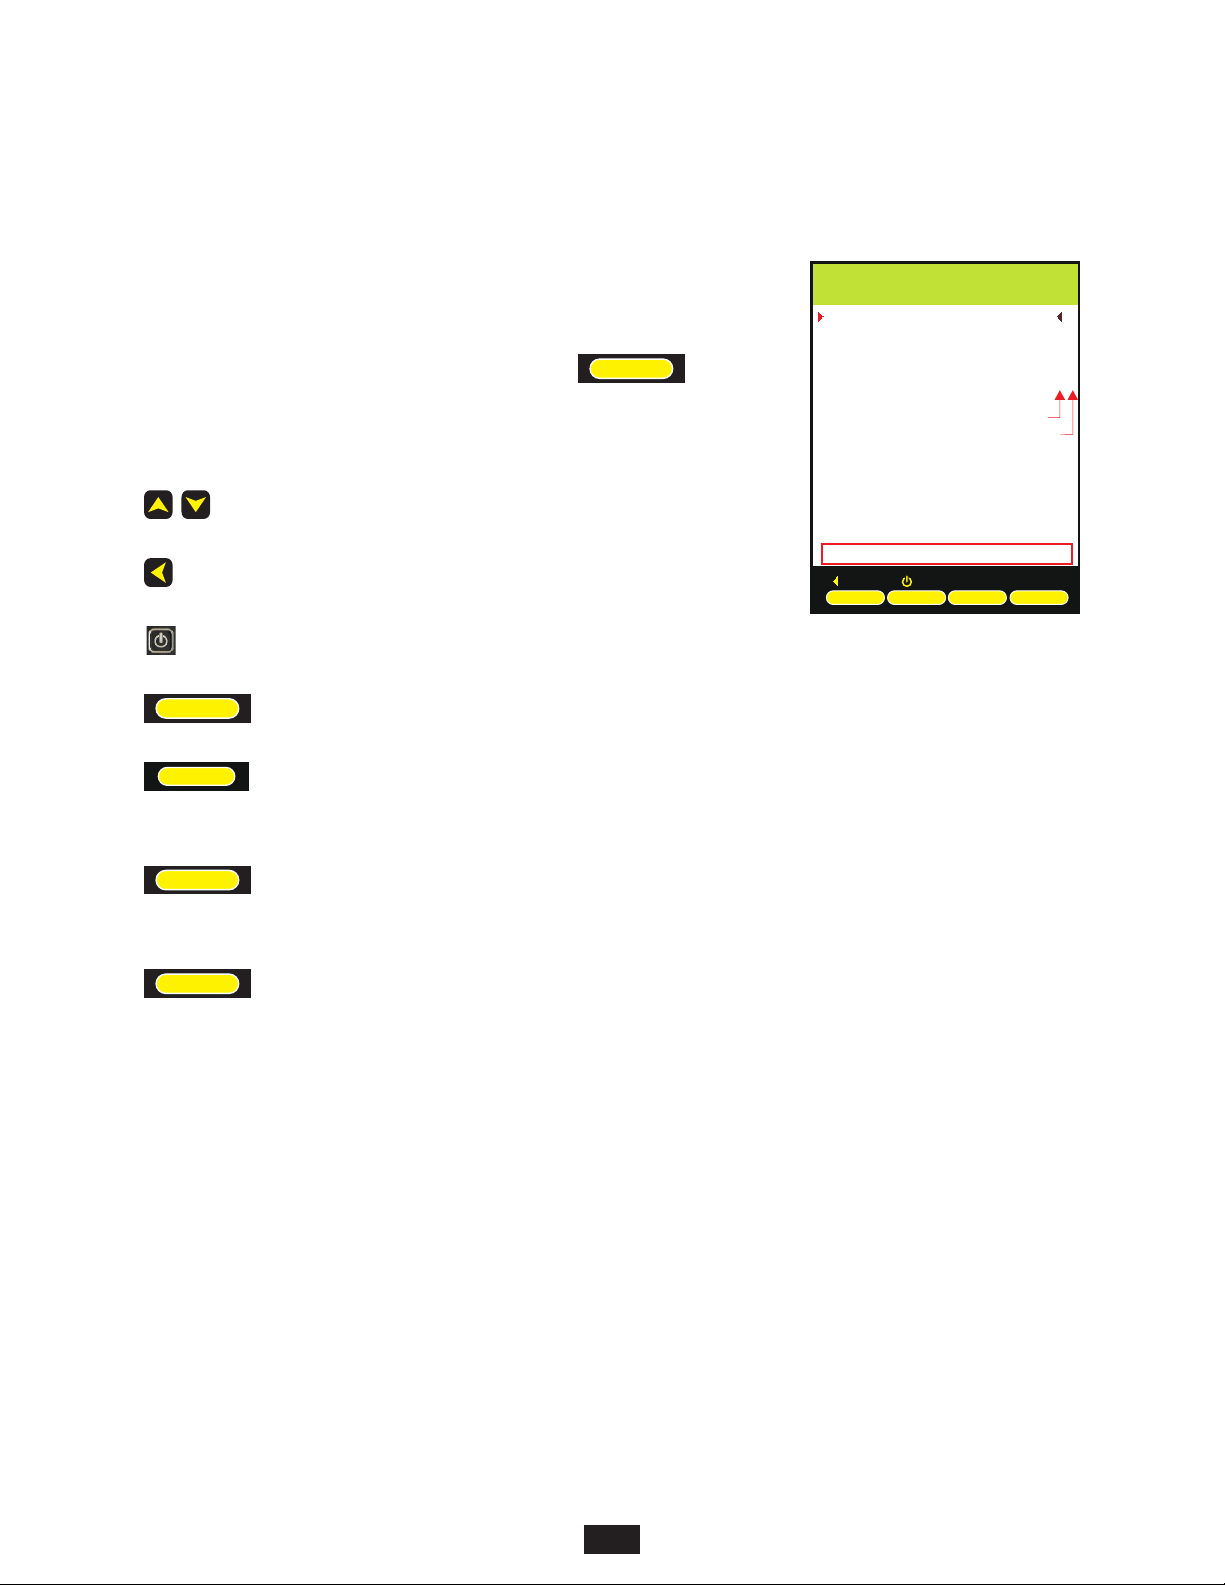
Previously stored traces can be loaded from memory for later on-screen analysis.
The STORED TRACE menu may be accessed two ways:
1)from the Function Options menu on the trace screen, press ; or
LOAD
2) select the STORED TRACES option from the SETUP MENU.
moves the cursor up and down in the list of stored traces
exits the STORED TRACES menu and returns to the trace screen
accesses context-sensitive help
LOAD
OVERLAY
loads the currently selected fiber trace into the trace screen
allows the user to overlay a previously stored trace on top of the currently loaded trace. Only one trace can be
overlaid at a time, and the overlay trace is denoted by a dark arrow to the right of the trace information. Press this
button again to clear the overlay status
Trace Namex Date Time
SM-BB-F1-F2:1
SM-BB-F1-F2:2
SM-BB-F1-F2:3
SM-BB-F1-F2:4
SM-BB-F1-F2:5
SM-BB-F1-F2:6
X
X
X
X
X
X
X
X
X
X
X
n=1.4681 L=33600 P= 10us S=1m
xx XXXXXX
STORED TRACESx
Trace Parameters
x x x x
ABORT HELP
LOAD
OVERLAY DELETE PAGE
10/05/09
10/05/09
10/05/09
10/05/09
10/05/09
10/05/09
04:16PM
04:17PM
04:19PM
04:21PM
04:24PM
04:27PM
Overlay status column
Download status column
ü
DELETE
gives the user the option: 1) to delete the currently selected fiber trace; 2) to not delete the selected trace; 3) to
delete all traces; or 4) delete only traces that have been previously downloaded (see TRACE DOWNLOAD
STATUS below)
PAGE
displays the next page of fiber traces if there are more traces than will fit on the screen
TRACE PARAMETER INFORMATION. Information at the bottom of the STORED TRACES screen shows trace parameter settings
used when the trace was taken:
n index of refraction
L fiber length
P pulse width
S step
ü
TRACE DOWNLOAD STATUS. If the trace has already been downloaded to the PC, this trace will be marked by a green
checkmark which appears at the right of each trace.
21
Page 22
SECTION 5: OTDR SETUP
MENU SYSTEM
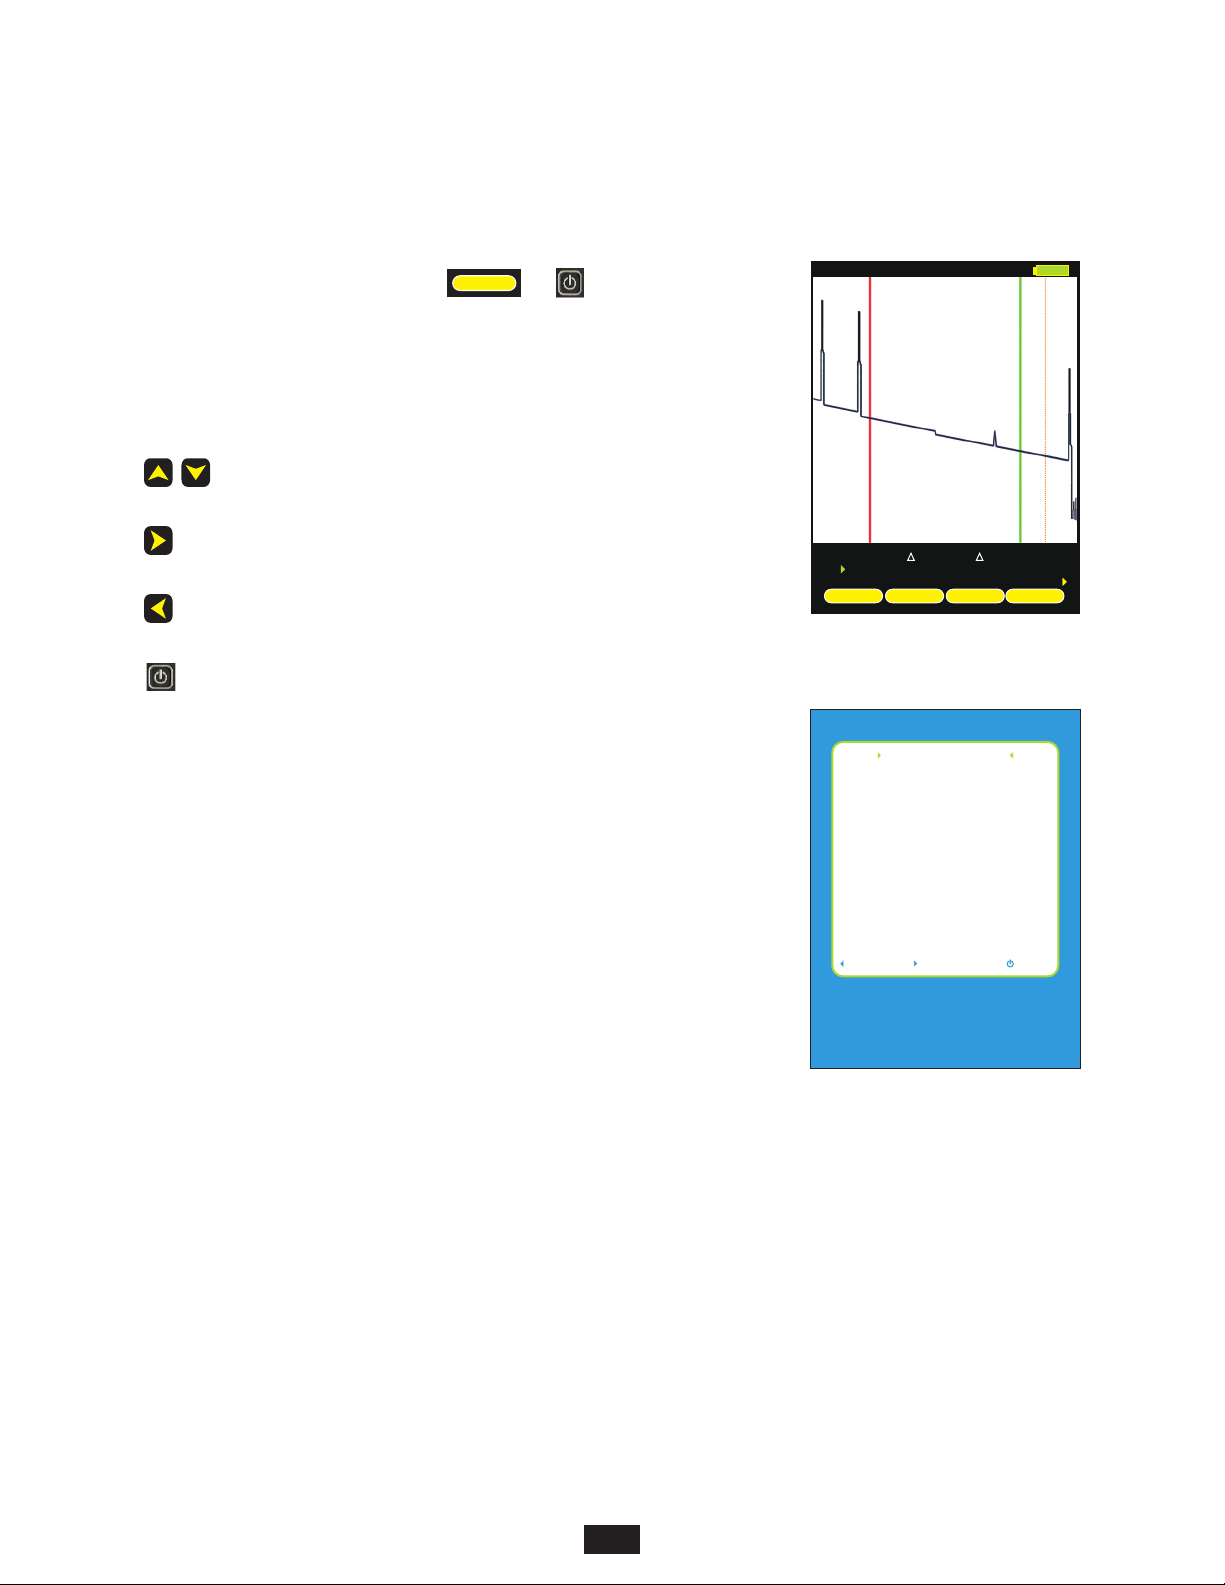
To access the SETUP MENU, either press or .
MENU
NAVIGATING THE MENU SYSTEM
The arrow keys are used to navigate throughout the various menus and help screens in the
OTDR. Green selection arrows highlight different menu options.
moves the selection arrows to the next or previous menu option
jumps to the highlighted menu option
returns to the previous menu
exits the menu system
SETUP MENU
The SETUP MENU is the main entry point into the OTDR menu system. Shown below is a
tree of menu options.
Each option will be explained in detail on the following pages.
HELP TOPICS
The OWLTrek II includes a built-in help menu that can be accessed from the SETUP MENU.
Context-sensitive help can also be accessed from various operational and menu screens
throughout the OTDR by pressing the HELP button.
Fiber #x
1550nm
06086m
20226m
24718m
XXXXXXXXXXXXXXXXXXXXXXXXXXXXXXXXXX
XXXXXXXXXXXXXXXXXXXXXXXXXXXXXXXXXX
XXXXXXXXXXXXXXXXXXXXXXXXXXXXXXXXXX
XXXXXXXXXXXXXXXXXXXXXXXXXXXXXXXXXX
XXXXXXXXXXXXXXXXXXXXXXXXXXXXXXXXXX
XXXXXXXXXXXXXXXXXXXXXXXXXXXXXXXXXX
XXXXXXXXXXXXXXXXXXXXXXXXXXXXXXXXXX
XXXXXXXXXXXXXXXXXXXXXXXXXXXXXXXXXX
XXXXXXXXXXXXXXXXXXXXXXXXXXXXXXXXXX
XXXX XXXXXX XXXXXXX xxx
XXXXXXXXXXXXXXXXXXXXXXXXXXXXXXXXXX
Enter OTDR operational
parameters
XXXXXXXXXXXXXXXXXXXXXXXXXXXXXXXXXX
XXXXXXXXXXXXXXXXXXXXXXXXXXXXXXXXXX
XXXXSELECTXXXXXXBACKXXXXXXXEXIT
OPERATIONS MENU
USER INFORMATION
DISPLAY PREFERENCES
POWER OPTIONS
UTILITIES MENU
STORED TRACES
HELP TOPICS
BACK SELECT EXIT
XXXXXXXXXXXXXXXXXXXXXXX
AUTO
L mx
14140dB2.34
SETUP MENU
3.43
RFL dBx
-81.00
ENTER
TESTMENULOCKCURSOR
22
Page 23
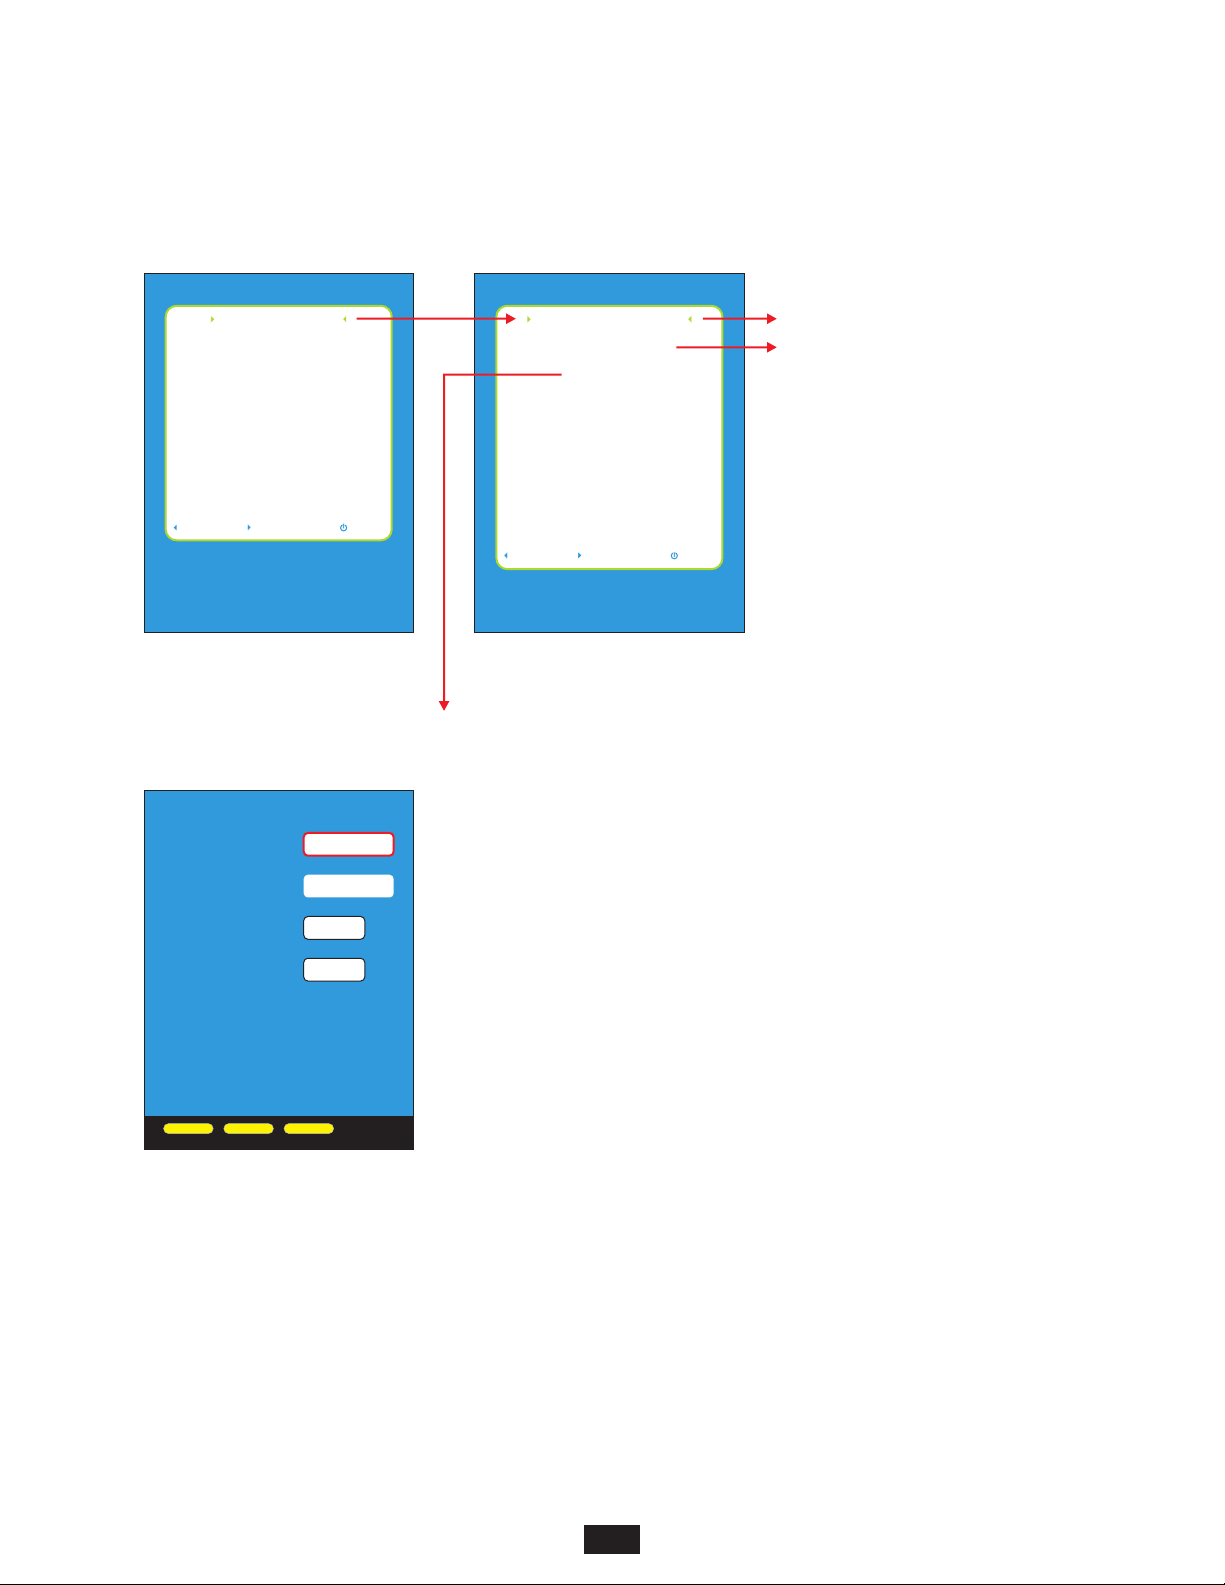
SECTION 5: OTDR SETUP
SETUP MENU ? OPERATIONS MENU
XXXXXXXXXXXXXXXXXXXXXXXXXXXXXXXXXX
XXXXXXXXXXXXXXXXXXXXXXXXXXXXXXXXXX
XXXXXXXXXXXXXXXXXXXXXXXXXXXXXXXXXX
XXXXXXXXXXXXXXXXXXXXXXXXXXXXXXXXXX
XXXXXXXXXXXXXXXXXXXXXXXXXXXXXXXXXX
XXXXXXXXXXXXXXXXXXXXXXXXXXXXXXXXXX
XXXXXXXXXXXXXXXXXXXXXXXXXXXXXXXXXX
XXXXXXXXXXXXXXXXXXXXXXXXXXXXXXXXXX
XXXXXXXXXXXXXXXXXXXXXXXXXXXXXXXXXX
XXXX XXXXXX XXXXXXX xxx
XXXXXXXXXXXXXXXXXXXXXXXXXXXXXXXXXX
Enter OTDR operational
parameters
XXXXXXXXXXXXXXXXXXXXXXXXXXXXXXXXXX
XXXXXXXXXXXXXXXXXXXXXXXXXXXXXXXXXX
XXXXSELECTXXXXXXBACKXXXXXXXEXIT
SETUP MENU
OPERATIONS MENU
USER INFORMATION
DISPLAY PREFERENCES
POWER OPTIONS
UTILITIES MENU
STORED TRACES
HELP TOPICS
BACK SELECT EXIT
XXXXXXXXXXXXXXXXXXXXXXX
XXXXXXXXXXXXXXXXXXXXXXXXXXXXXXXXXX
XXXXXXXXXXXXXXXXXXXXXXXXXXXXXXXXXX
XXXXXXXXXXXXXXXXXXXXXXXXXXXXXXXXXX
XXXXXXXXXXXXXXXXXXXXXXXXXXXXXXXXXX
XXXXXXXXXXXXXXXXXXXXXXXXXXXXXXXXXX
XXXXXXXXXXXXXXXXXXXXXXXXXXXXXXXXXX
XXXXXXXXXXXXXXXXXXXXXXXXXXXXXXXXXX
XXXXXXXXXXXXXXXXXXXXXXXXXXXXXXXXXX
XXXXXXXXXXXXXXXXXXXXXXXXXXXXXXXXXX
XXXX XXXXXX XXXXXXX xxx
XXXXXXXXXXXXXXXXXXXXXXXXXXXXXXXXXX
Enter optical power meter
mode
OPERATIONS MENU
OPTICAL POWER METER
TRACE PARAMETERS
OTDR SETUP
EVENTS SETUP
CONFIGURE OPTIONS
SET BACKSCATTER COEFF.
SYSTEM INFORMATION
BACK SELECT EXIT
SETUP MENU ? OPERATIONS MENU ? OTDR SETUP
OTDR CONFIGURATION
XXXXXXXXXXXXXXXXXXXXXXXXXXXXXXXXXX
XX XXXXXXXXXXXXXXXXXXXX
LENGTH UNITS
XXXXXXXXXXXXXXXXXXXXXXXXXXXXXXXXXX
XX XXXXXXXXXXXXXXXXXXXXX
FIBER INDEX
XXXXXXXXXXXXXXXXXXXXXXXXXXXXXXXXXX
XX XXXXXXXXXXXXXXXXXXXXXXX
EOF EVENT
XX XXXXXXXXXXXXXXXXXXX XX
THRESHOLD dB
XX XXXXXXXXXXXXXXXXXXXXXXXXXXX
EVENT
XX XXXXXXXXXXXXXXXXXXXXXXX
PASS/FAIL
METERS
1.4681
3.25
OFF
OTDR CONFIGURATION
LENGTH UNITS – options: METERS, FEET
Changes the length units displayed on the OTDR trace results screen.
FIBER INDEX – range of values: 1.4000 to 1.6000
Sets the index of refraction (IoR) for the fiber under test. This value determines the
speed of light in the fiber under test, and is used to calculate distances on the OTDR
trace. If IoR is unknown, use the following suggested values:
Suggested index of refraction values:
SINGLEMODE: 1.4681
MULTIMODE: 1.4920
Section 6: Optical Power Meter (OPM) Operation
Section 2: Key OTDR Trace Parameters
SAVE
QUIT HELP
EOF EVENT THRESHOLD – range of values: 3.25 to 9.99 dB
End of Fiber backscatter threshold is the required backscatter level prior to an event for
that event to be considered as part of the fiber and not an echo. The last event with the
required backscatter level is considered the end of the fiber.
EVENT PASS/FAIL – options: ON/OFF
When ON, applies the event threshold settings from the EVENT CONFIGURATION
setup screen. Events that do not meet event thresholds (i.e. FAIL) will be shown in red
font on the EVENTS table.
23
Page 24
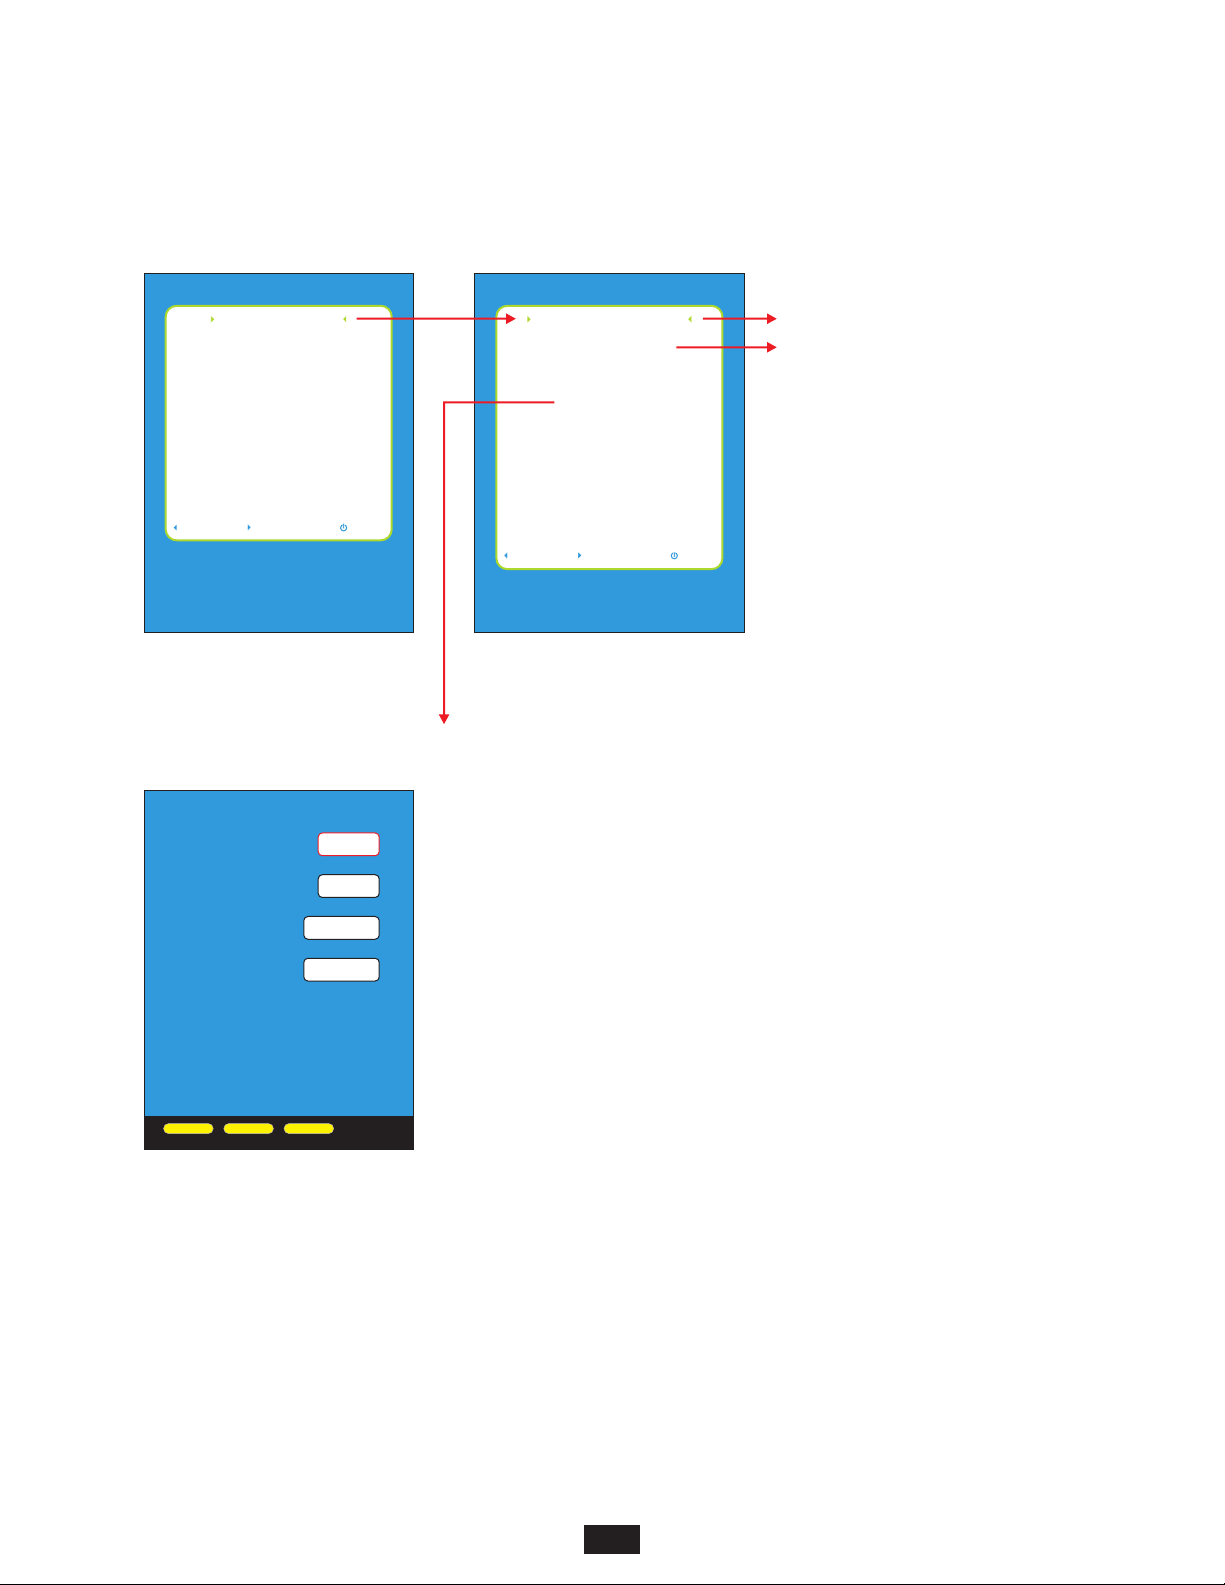
SECTION 5: OTDR SETUP
SETUP MENU ? OPERATIONS MENU
XXXXXXXXXXXXXXXXXXXXXXXXXXXXXXXXXX
XXXXXXXXXXXXXXXXXXXXXXXXXXXXXXXXXX
XXXXXXXXXXXXXXXXXXXXXXXXXXXXXXXXXX
XXXXXXXXXXXXXXXXXXXXXXXXXXXXXXXXXX
XXXXXXXXXXXXXXXXXXXXXXXXXXXXXXXXXX
XXXXXXXXXXXXXXXXXXXXXXXXXXXXXXXXXX
XXXXXXXXXXXXXXXXXXXXXXXXXXXXXXXXXX
XXXXXXXXXXXXXXXXXXXXXXXXXXXXXXXXXX
XXXXXXXXXXXXXXXXXXXXXXXXXXXXXXXXXX
XXXX XXXXXX XXXXXXX xxx
XXXXXXXXXXXXXXXXXXXXXXXXXXXXXXXXXX
Enter OTDR operational
parameters
XXXXXXXXXXXXXXXXXXXXXXXXXXXXXXXXXX
XXXXXXXXXXXXXXXXXXXXXXXXXXXXXXXXXX
XXXXSELECTXXXXXXBACKXXXXXXXEXIT
SETUP MENU
OPERATIONS MENU
USER INFORMATION
DISPLAY PREFERENCES
POWER OPTIONS
UTILITIES MENU
STORED TRACES
HELP TOPICS
BACK SELECT EXIT
XXXXXXXXXXXXXXXXXXXXXXX
XXXXXXXXXXXXXXXXXXXXXXXXXXXXXXXXXX
XXXXXXXXXXXXXXXXXXXXXXXXXXXXXXXXXX
XXXXXXXXXXXXXXXXXXXXXXXXXXXXXXXXXX
XXXXXXXXXXXXXXXXXXXXXXXXXXXXXXXXXX
XXXXXXXXXXXXXXXXXXXXXXXXXXXXXXXXXX
XXXXXXXXXXXXXXXXXXXXXXXXXXXXXXXXXX
XXXXXXXXXXXXXXXXXXXXXXXXXXXXXXXXXX
XXXXXXXXXXXXXXXXXXXXXXXXXXXXXXXXXX
XXXXXXXXXXXXXXXXXXXXXXXXXXXXXXXXXX
XXXX XXXXXX XXXXXXX xxx
XXXXXXXXXXXXXXXXXXXXXXXXXXXXXXXXXX
Configure OTDR event
parameters
OPERATIONS MENU
OPTICAL POWER METER
TRACE PARAMETERS
OTDR SETUP
EVENTS SETUP
CONFIGURE OPTIONS
SET BACKSCATTER COEFF.
SYSTEM INFORMATION
BACK SELECT EXIT
SETUP MENU ? OPERATIONS MENU ? EVENTS SETUP
EVENT CONFIGURATION
XXXXXXXXXXXXXXXXXXXXXXXXXXXXXXXXXX
REFLECTIVE
XX XXXXXXXXXXXXXXXXXXXXXX
EVENT THRESHOLD dB
XX XXXXXXXXXXXXXXX
LOSS EVENT
XX XXXXXXXXXXXXXXXXXXXXXX
THRESHOLD dB
XX XXXXXXXXXXXXXXXXXXXXX
MAXIMUM
XX XXXXXXXXXXXXXXXXXXXXXXXXX
REFLECTIVITY dB
XX XXXXXXXXXXXXXXXXXX
MAXIMUM
XX XXXXXXXXXXXXXXXXXXXXXXXXX
LOSS dB
XX XXXXXXXXXXXXXXXXXXXXXXXXXX
-77
0.05
-75.0
1.00
EVENTS SETUP
REFLECTIVE EVENT THRESHOLD – range: -58 to -85 dB
Sets the minimum event threshold in dB for reflective events. Events must have this
much reflectivity before they are marked in the event table. The smallest reflectivity
value is limited by the fiber’s currently set backscatter coefficient.
LOSS EVENT THRESHOLD – range: 0.05 to 0.50 dB
Sets the minimum event threshold in dB for loss events. Events must fall at least this
amount below the backscatter power to be marked in the event table.
Section 6: Optical Power Meter (OPM) Operation
Section 2: Key OTDR Trace Parameters
SAVE
QUIT HELP
MAXIMUM REFLECTIVITY – range: -30.0 to -80.0 dB
The maximum reflectivity an event can have before failing.
MAXIMUM LOSS – range: 0.10 to 20.00 dB
The maximum loss an event can have before failing.
NOTE: in order for these settings to take effect, remember to turn ON the EVENT
PASS/FAIL setting on the OTDR CONFIGURATION screen.
24
Page 25
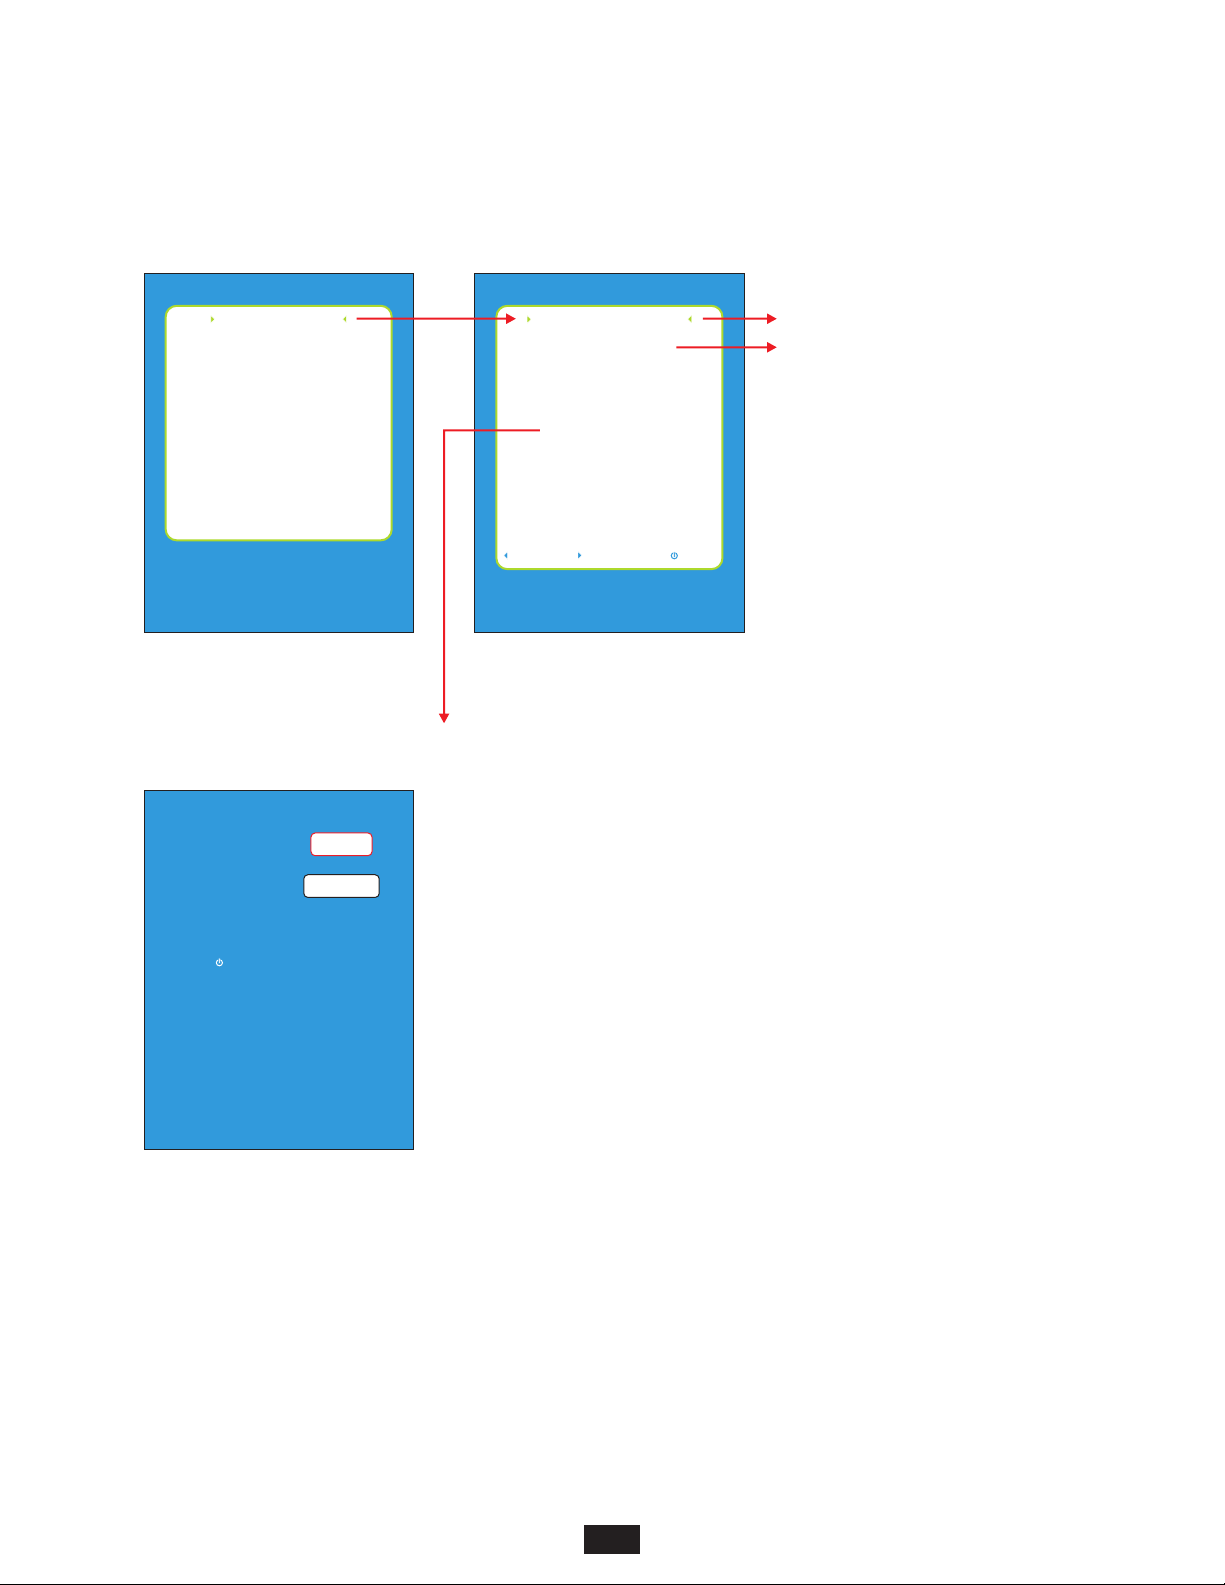
SECTION 5: OTDR SETUP
SETUP MENU ? OPERATIONS MENU
XXXXXXXXXXXXXXXXXXXXXXXXXXXXXXXXXX
XXXXXXXXXXXXXXXXXXXXXXXXXXXXXXXXXX
XXXXXXXXXXXXXXXXXXXXXXXXXXXXXXXXXX
XXXXXXXXXXXXXXXXXXXXXXXXXXXXXXXXXX
XXXXXXXXXXXXXXXXXXXXXXXXXXXXXXXXXX
XXXXXXXXXXXXXXXXXXXXXXXXXXXXXXXXXX
XXXXXXXXXXXXXXXXXXXXXXXXXXXXXXXXXX
XXXXXXXXXXXXXXXXXXXXXXXXXXXXXXXXXX
XXXXXXXXXXXXXXXXXXXXXXXXXXXXXXXXXX
XXXX XXXXXX XXXXXXX xxx
XXXXXXXXXXXXXXXXXXXXXXXXXXXXXXXXXX
Enter OTDR operational
parameters
XXXXXXXXXXXXXXXXXXXXXXXXXXXXXXXXXX
XXXXXXXXXXXXXXXXXXXXXXXXXXXXXXXXXX
XXXXSELECTXXXXXXBACKXXXXXXXEXIT
SETUP MENU
OPERATIONS MENU
USER INFORMATION
DISPLAY PREFERENCES
POWER OPTIONS
UTILITIES MENU
STORED TRACES
HELP TOPICS
BACK SELECT EXIT
XXXXXXXXXXXXXXXXXXXXXXX
XXXXXXXXXXXXXXXXXXXXXXXXXXXXXXXXXX
XXXXXXXXXXXXXXXXXXXXXXXXXXXXXXXXXX
XXXXXXXXXXXXXXXXXXXXXXXXXXXXXXXXXX
XXXXXXXXXXXXXXXXXXXXXXXXXXXXXXXXXX
XXXXXXXXXXXXXXXXXXXXXXXXXXXXXXXXXX
XXXXXXXXXXXXXXXXXXXXXXXXXXXXXXXXXX
XXXXXXXXXXXXXXXXXXXXXXXXXXXXXXXXXX
XXXXXXXXXXXXXXXXXXXXXXXXXXXXXXXXXX
XXXXXXXXXXXXXXXXXXXXXXXXXXXXXXXXXX
XXXX XXXXXX XXXXXXX xxx
XXXXXXXXXXXXXXXXXXXXXXXXXXXXXXXXXX
Configure installed options
OPERATIONS MENU
OPTICAL POWER METER
TRACE PARAMETERS
OTDR SETUP
EVENTS SETUP
CONFIGURE OPTIONS
SET BACKSCATTER COEFF.
SYSTEM INFORMATION
BACK SELECT EXIT
Section 6: Optical Power Meter (OPM) Operation
Section 2: Key OTDR Trace Parameters
SETUP MENU ? OPERATIONS MENU ? CONFIGURE OPTIONS
CONFIGURE OPTIONS
XXXXXXXXXXXXXXXXXXXXXXXXXXXXXXXXX
FIBER ID TONE:
XX XXXXXXXXXXXXXXXXXX
XXEVENT THRESHOLDXXXXXXXXXXXXXXXdB
VISUAL FAULT
XX XXXXXXXXXXXXXXXXXXXX
LOCATOR:
XX XXXXXXXXXXXXXXXXXXXXXXdB
OFF
OFF
CONFIGURE OPTIONS
FIBER ID TONE – options: OFF, ON
The OTDR can output a 2KHz tone into the fiber that can be used to identify the fiber at
the far end using a clamp meter.
Press ENTER when done
XX xxxxxxxxxx
Press for help
xx xxxxxxxxxxxxxxx
VISUAL FAULT LOCATOR – options: OFF, ON, BLINK
Red laser that can be used to identify short fiber runs from the far end, or can detect
breaks in the near end of the fiber.
25
Page 26
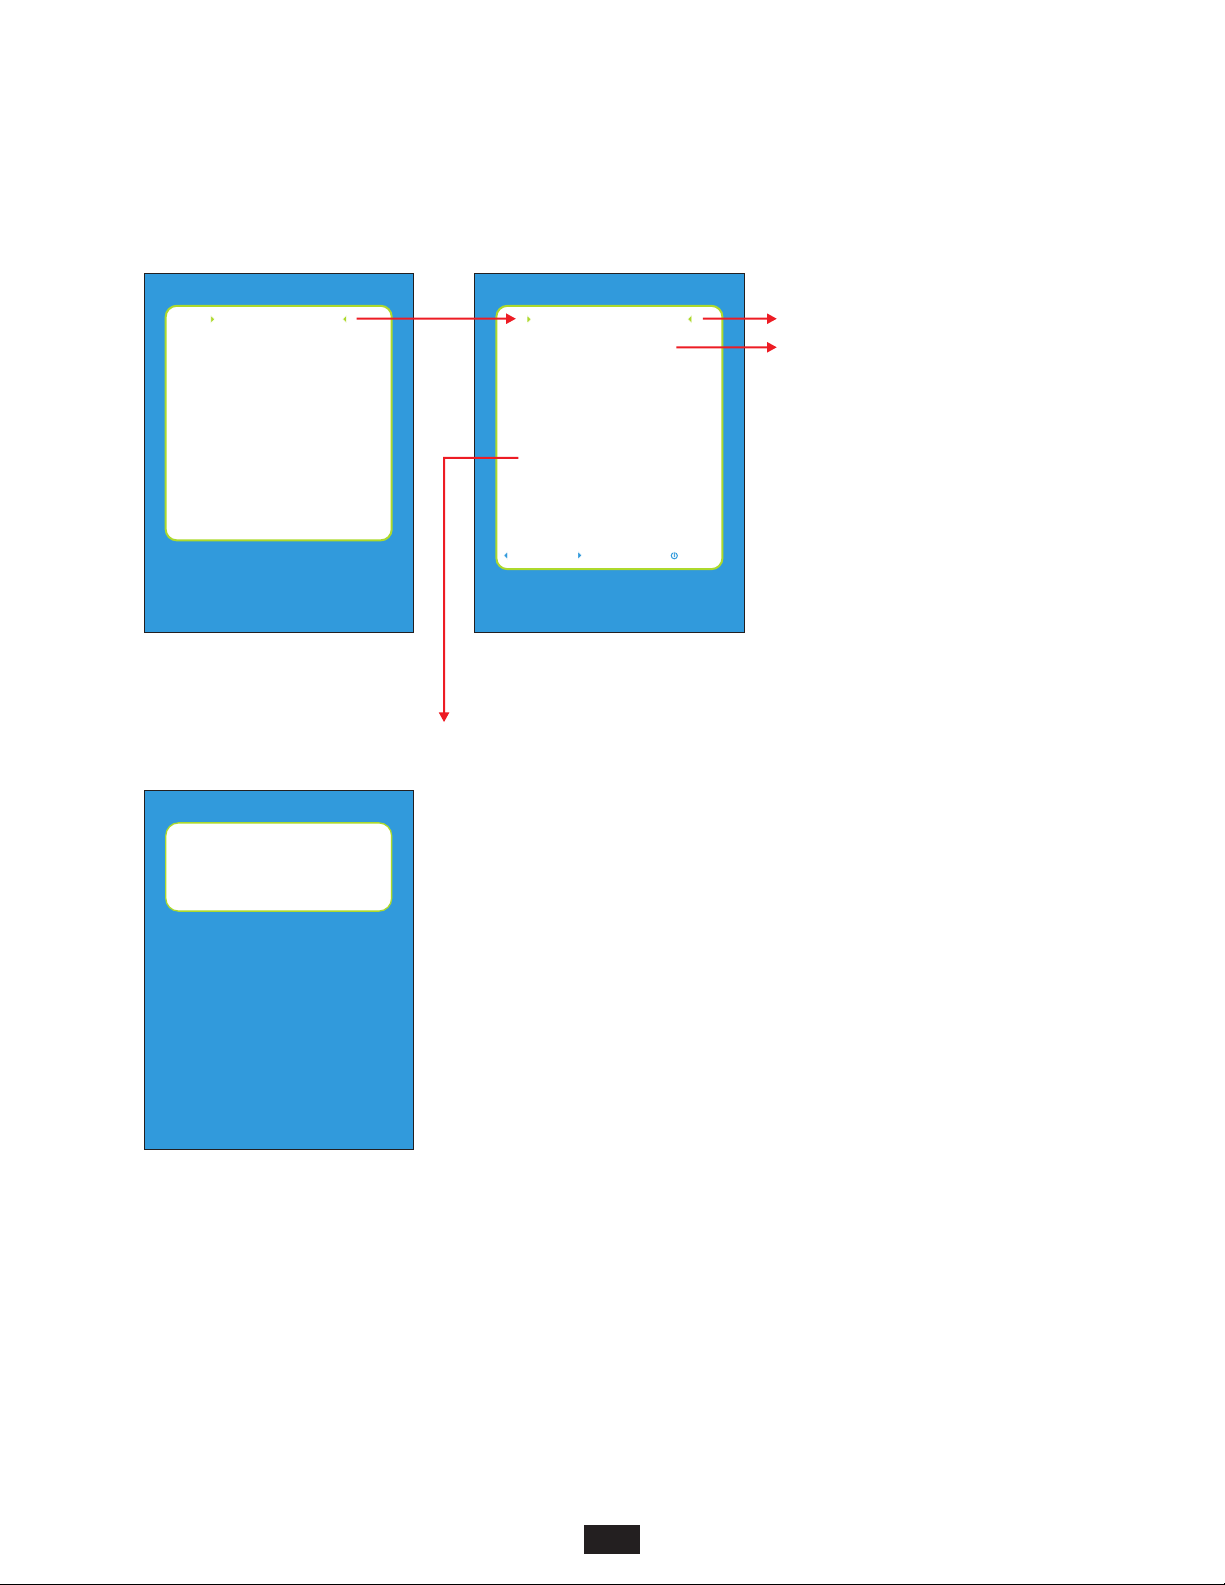
SECTION 5: OTDR SETUP
SETUP MENU ? OPERATIONS MENU
XXXXXXXXXXXXXXXXXXXXXXXXXXXXXXXXXX
XXXXXXXXXXXXXXXXXXXXXXXXXXXXXXXXXX
XXXXXXXXXXXXXXXXXXXXXXXXXXXXXXXXXX
XXXXXXXXXXXXXXXXXXXXXXXXXXXXXXXXXX
XXXXXXXXXXXXXXXXXXXXXXXXXXXXXXXXXX
XXXXXXXXXXXXXXXXXXXXXXXXXXXXXXXXXX
XXXXXXXXXXXXXXXXXXXXXXXXXXXXXXXXXX
XXXXXXXXXXXXXXXXXXXXXXXXXXXXXXXXXX
XXXXXXXXXXXXXXXXXXXXXXXXXXXXXXXXXX
XXXX XXXXXX XXXXXXX xxx
XXXXXXXXXXXXXXXXXXXXXXXXXXXXXXXXXX
Enter OTDR operational
parameters
XXXXXXXXXXXXXXXXXXXXXXXXXXXXXXXXXX
XXXXXXXXXXXXXXXXXXXXXXXXXXXXXXXXXX
XXXXSELECTXXXXXXBACKXXXXXXXEXIT
SETUP MENU
OPERATIONS MENU
USER INFORMATION
DISPLAY PREFERENCES
POWER OPTIONS
UTILITIES MENU
STORED TRACES
HELP TOPICS
BACK SELECT EXIT
XXXXXXXXXXXXXXXXXXXXXXX
XXXXXXXXXXXXXXXXXXXXXXXXXXXXXXXXXX
XXXXXXXXXXXXXXXXXXXXXXXXXXXXXXXXXX
XXXXXXXXXXXXXXXXXXXXXXXXXXXXXXXXXX
XXXXXXXXXXXXXXXXXXXXXXXXXXXXXXXXXX
XXXXXXXXXXXXXXXXXXXXXXXXXXXXXXXXXX
XXXXXXXXXXXXXXXXXXXXXXXXXXXXXXXXXX
XXXXXXXXXXXXXXXXXXXXXXXXXXXXXXXXXX
XXXXXXXXXXXXXXXXXXXXXXXXXXXXXXXXXX
XXXXXXXXXXXXXXXXXXXXXXXXXXXXXXXXXX
XXXX XXXXXX XXXXXXX xxx
XXXXXXXXXXXXXXXXXXXXXXXXXXXXXXXXXX
Set fiber backscatter
coefficient
OPERATIONS MENU
OPTICAL POWER METER
TRACE PARAMETERS
OTDR SETUP
EVENTS SETUP
CONFIGURE OPTIONS
SET BACKSCATTER COEFF.
SYSTEM INFORMATION
BACK SELECT EXIT
Section 6: Optical Power Meter (OPM) Operation
Section 2: Key OTDR Trace Parameters
SETUP MENU ? OPERATIONS MENU ? SET BACKSCATTER COEFF.
SET BACKSCATTER COEFFICIENT
XXXXXXXXXXXXXXXXXXXXXXXXXXXXXXXXXX
XXXXXXXXXXXXXXXXXXXXXXXXXXXXXXXXXX
XXXXXXXXXXXXXXXXXXXXXXXXXXXXXXXXXX
XXXXXXXXXXXXXXXXXXXXXXXXXXXXXXXXXX
The fiber backscatter
coefficient is a normalized
measure of the backscatter
properties of the fiber and is
the optical fiber.
XXXXXXXXXXXXXXXXXXXXXXXXXXXXXXXXXX
XXXXXXXXXXXXXXXXXXXXXXXXXXXXXXXXXX
XXXXXXXXXXXXXXXXXXXXXXXXXXXXXXXXXX
XXXXBACKXXXXXXSELECTXXXXXXXEXITXXX
XXXXXXXXXXXXXXXXXXXXXXXXXXXXXXXXXX
XXXXBACKXXXXXXSELECTXXXXXXXEXITXXX
XXXXXXXXXXXXXXXXXXXXXXXXXXXXXXXXXX
XXXXXXXXXXXXXXXXXXXXXXXXXXXXXXXXXX
XXXXXXXXXXXXXXXXXXXXXXXXXXXXXXXXXX
< Current Trace >
Bns : -76.00
^ UP v DOWN ENTER=DONE
X xxxx x xxxx
UTILITIES MENU
provided by the manufacturer of
XXXXSELECTXXXXXXBACKXXXXXXXEXIT
xxxxxxxxxxxxx
xxxxxxx
xxxxxxxx
xxxxxxxxxxxxxxxx
xxxx
xx
SET BACKSCATTER COEFFICIENT
<backscatter option> – options: Current Trace, (Wave1), (Wave2)
Use left and right arrow keys to change value.
Bns – range: -60.00 to -85.00 dB
Use up and down arrow to increase/decrease backscatter value.
Backscatter coefficient is a measure of the backscatter properties of the fiber under
test, and is provided by the fiber manufacturer.
Backscatter coefficient is important in accurately determining reflectance
measurements in the OTDR.
26
Page 27
SECTION 5: OTDR SETUP
SETUP MENU ? OPERATIONS MENU
XXXXXXXXXXXXXXXXXXXXXXXXXXXXXXXXXX
XXXXXXXXXXXXXXXXXXXXXXXXXXXXXXXXXX
XXXXXXXXXXXXXXXXXXXXXXXXXXXXXXXXXX
XXXXXXXXXXXXXXXXXXXXXXXXXXXXXXXXXX
XXXXXXXXXXXXXXXXXXXXXXXXXXXXXXXXXX
XXXXXXXXXXXXXXXXXXXXXXXXXXXXXXXXXX
XXXXXXXXXXXXXXXXXXXXXXXXXXXXXXXXXX
XXXXXXXXXXXXXXXXXXXXXXXXXXXXXXXXXX
XXXXXXXXXXXXXXXXXXXXXXXXXXXXXXXXXX
XXXX XXXXXX XXXXXXX xxx
XXXXXXXXXXXXXXXXXXXXXXXXXXXXXXXXXX
Enter OTDR operational
parameters
XXXXXXXXXXXXXXXXXXXXXXXXXXXXXXXXXX
XXXXXXXXXXXXXXXXXXXXXXXXXXXXXXXXXX
XXXXSELECTXXXXXXBACKXXXXXXXEXIT
SETUP MENU
OPERATIONS MENU
USER INFORMATION
DISPLAY PREFERENCES
POWER OPTIONS
UTILITIES MENU
STORED TRACES
HELP TOPICS
BACK SELECT EXIT
XXXXXXXXXXXXXXXXXXXXXXX
XXXXXXXXXXXXXXXXXXXXXXXXXXXXXXXXXX
XXXXXXXXXXXXXXXXXXXXXXXXXXXXXXXXXX
XXXXXXXXXXXXXXXXXXXXXXXXXXXXXXXXXX
XXXXXXXXXXXXXXXXXXXXXXXXXXXXXXXXXX
XXXXXXXXXXXXXXXXXXXXXXXXXXXXXXXXXX
XXXXXXXXXXXXXXXXXXXXXXXXXXXXXXXXXX
XXXXXXXXXXXXXXXXXXXXXXXXXXXXXXXXXX
XXXXXXXXXXXXXXXXXXXXXXXXXXXXXXXXXX
XXXXXXXXXXXXXXXXXXXXXXXXXXXXXXXXXX
XXXX XXXXXX XXXXXXX xxx
XXXXXXXXXXXXXXXXXXXXXXXXXXXXXXXXXX
Configure installed options
OPERATIONS MENU
OPTICAL POWER METER
TRACE PARAMETERS
OTDR SETUP
EVENTS SETUP
CONFIGURE OPTIONS
SET BACKSCATTER COEFF.
SYSTEM INFORMATION
BACK SELECT EXIT
Section 6: Optical Power Meter (OPM) Operation
Section 2: Key OTDR Trace Parameters
SETUP MENU ? OPERATIONS MENU ? SYSTEM INFORMATION
SYSTEM INFORMATION
XXXXXXXXXXXXXXXXXXXXXXXXXXXXXXXXXX
Serial Number:
XX XXXXXXXXXXX
MFG Date:
XX XXXXXXXXXXXXXX
Firmware Version:
XX XXXXXXXXXX
BootLoader Version:
XX XXXXXXXX
PCB Version:
XX XXXXXXXXXXXXXXX
Installed RAM:
XX XXXXXXXXXXXX
Display:
XX XXXXXXXXXXXXXXXX
Lasers:
XX XXXXXXXXXXXXXXXXXX
Options:
XX XXXXX
Trace Count: APD:
XX XXXXXXXXX
Date:
XX XXXXXXXXXXXXXXXXXX
10/08/15
Time:
XX XXXXXXXXXXXXXXXXXX
11:07:25
Temp C:
XX XXXXXXXXXXXXXXXXXXXXXX
H30000
09/21/15
2.01
1.03
2.0H
512KB
ILI9341
1310nm
VFL,TONE (060,060)
5, 248
29
SYSTEM INFORMATION
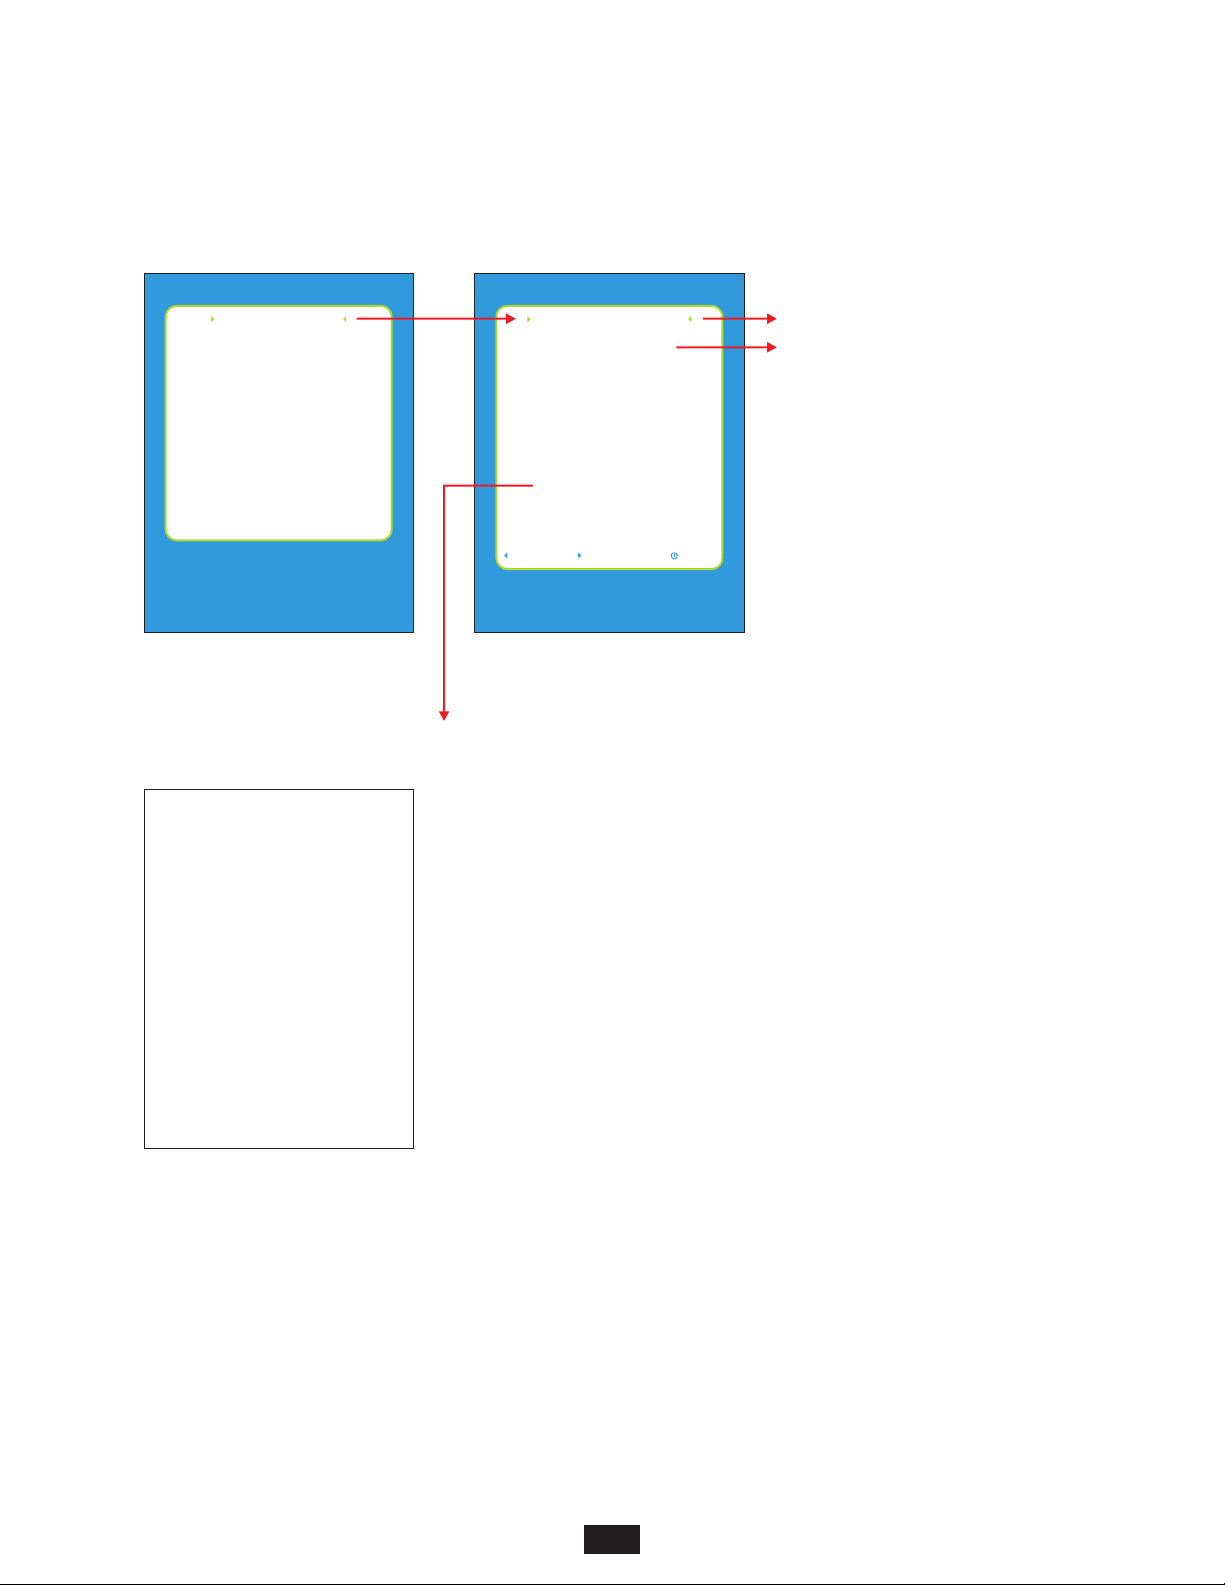
Shows information about the OTDR.
The top section contains hardware information about the OTDR.
LASERS – shows the currently installed OTDR laser wavelengths
OPTIONS – shows the currently installed optional hardware
TRACE COUNT – shows how many traces have been taken with the OTDR
DATE – current date (user configurable)
TIME – current time (user configurable)
TEMP C – current temperature in Celsius
Press the enter key to return to OPERATIONS MENU.
27
Page 28
SECTION 5: OTDR SETUP
SETUP MENU ? USER INFORMATION
XXXXXXXXXXXXXXXXXXXXXXXXXXXXXXXXXX
XXXXXXXXXXXXXXXXXXXXXXXXXXXXXXXXXX
XXXXXXXXXXXXXXXXXXXXXXXXXXXXXXXXXX
XXXXXXXXXXXXXXXXXXXXXXXXXXXXXXXXXX
XXXXXXXXXXXXXXXXXXXXXXXXXXXXXXXXXX
XXXXXXXXXXXXXXXXXXXXXXXXXXXXXXXXXX
XXXXXXXXXXXXXXXXXXXXXXXXXXXXXXXXXX
XXXXXXXXXXXXXXXXXXXXXXXXXXXXXXXXXX
XXXXXXXXXXXXXXXXXXXXXXXXXXXXXXXXXX
XXXX XXXXXX XXXXXXX xxx
XXXXXXXXXXXXXXXXXXXXXXXXXXXXXXXXXX
Enter users name and phone
number
SETUP MENU
OPERATIONS MENU
USER INFORMATION
DISPLAY PREFERENCES
POWER OPTIONS
UTILITIES MENU
STORED TRACES
HELP TOPICS
BACK SELECT EXIT
XXXXXXXXXXXXXXXXXXXXXXXXXXXXXXXXXX
XXXXXXXXXXXXXXXXXXXXXXXXXXXXXXXXXX
XXXXXXXXXXXXXXXXXXXXXXXXXXXXXXXXXX
XXXXXXXXXXXXXXXXXXXXXXXXXXXXXXXXXX
XXXXXXXXXXXXXXXXXXXXXXXXXXXXXXXXXX
XXXXXXXXXXXXXXXXXXXXXXXXXXXXXXXXXX
XXXXXXXXXXXXXXXXXXXXXXXXXXXXXXXXXX
XXXXXXXXXXXXXXXXXXXXXXXXXXXXXXXXXX
XXXXXXXXXXXXXXXXXXXXXXXXXXXXXXXXXX
BACK SELECT EXIT
XXXX XXXXXX XXXXXXX xxx
XXXXXXXXXXXXXXXXXXXXXXXXXXXXXXXXXX
USER NAME
USER MENU
USER NAME
USER PHONE
OTDR SETUP
EVENTS SETUP
CONFIGURE OPTIONS
SET BACKSCATTER COEFF.
SYSTEM INFORMATION
XXXXXXXXXXXXXXXXXXXXXXXXX
USER INFORMATION
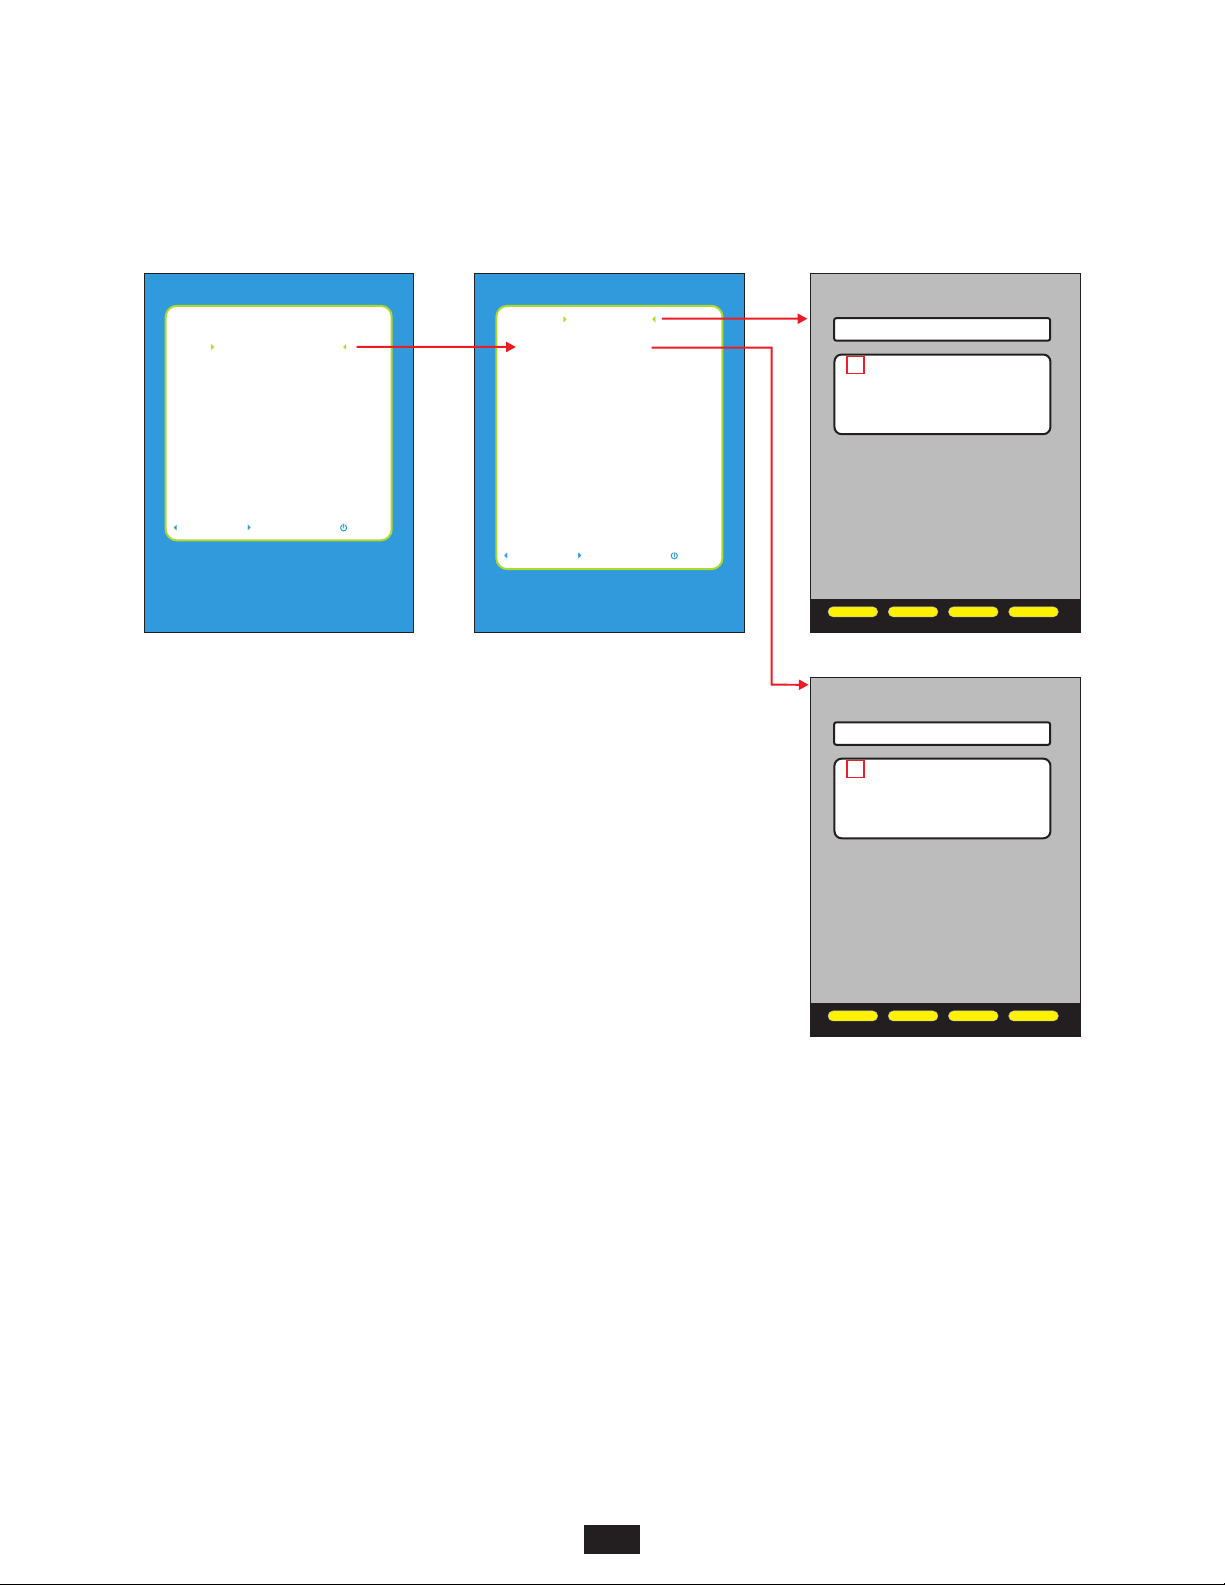
Enter user name:
Enter the name of the person or company who owns the OTDR. This information will appear
on test reports.
Up to 16 characters are allowed in the user name entry field.
See the on-screen instructions for help with text entry.
Enter phone number:
Enter the phone number of the person or company who owns the OTDR. This information
will appear on test reports.
Up to 13 characters are allowed in the phone number entry field.
See the on-screen instructions for help with text entry.
DISPLAY OPTIONS
Enter user name:
xx xxxxxxxxxxxxxxxx
XXXXXXXXXXXXXXXXXXXXXXXXXXXXXXXXXX
USER NAME
XXMODE :XXXXXXXXXXXXXXXXXXXXXXXXXX
XXXXXXXXXXXXXXXXXXXXXXXXXXXXXXXXXX
XXXXXXXXXXXXXXXXXXXXXXXXXXXXXXXXXX
ABCDEFGHIJKLM
XXBRIGHTNESS :XXXXXXXXXXXXXXXXXXXX
XXXXXXXXXXXXXXXXXXXXXXXXXXXXXXXXXX
NOPQRSTUVWXYZ
XXXXXXXXXXXXXXXXXXXXXXXXXXXXXXXXXX
XXDIMNESS: XXXXXXXXXXXXXXXXXXXXXXX
0123456789:;<
XXXXXXXXXXXXXXXXXXXXXXXXXXXXXXXXXX
Use arrows to highlight letter
XX XX
then press the enter key. Tap
XX XXX
the power button to abort.
XX XXXXXX
XXXXXXXXXXXXXXXXXXXXXXXXXXXXXXXXXX
XXTRACE CLIPPING:XXXXXXXXXXXXXXXXX
XXXXXXXXXXXXXXXXXXXXXXXXXXXXXXXXXX
XXXXXXXXXXXXXXXXXXXXXXXXXXXXXXXXXX
XXXXXXXXXXXXXXXXXXXXXXXXXXXXXXXXXX
XXXXXXXXXXXXXXXXXXXXXXXXXXXXXXXXXX
XXXXXXXXXXXXXXXXXXXXXXXXXXXXXXXXXX
XXXXXXXXXXXXXXXXXXXXXXXXXXXXXXXXXX
XXXXXXXXXXXXXXXXXXXXXXXXXXXXXXXXXX
<--
XXX<--XXXXSHIFTXXXSPACEXXXXDONEXX
xx xxxxxxxxxxxxx
XXXXXXXXXXXXXXXXXXXXXXXXXXXXXXXXXX
XXMODE :XXXXXXXXXXXXXXXXXXXXXXXXXX
XXXXXXXXXXXXXXXXXXXXXXXXXXXXXXXXXX
XXXXXXXXXXXXXXXXXXXXXXXXXXXXXXXXXX
XXBRIGHTNESS :XXXXXXXXXXXXXXXXXXXX
XXXXXXXXXXXXXXXXXXXXXXXXXXXXXXXXXX
XXXXXXXXXXXXXXXXXXXXXXXXXXXXXXXXXX
XXDIMNESS: XXXXXXXXXXXXXXXXXXXXXXX
XXXXXXXXXXXXXXXXXXXXXXXXXXXXXXXXXX
XX XX
XX XXX
XX XXXXXX
XXXXXXXXXXXXXXXXXXXXXXXXXXXXXXXXXX
XXTRACE CLIPPING:XXXXXXXXXXXXXXXXX
XXXXXXXXXXXXXXXXXXXXXXXXXXXXXXXXXX
XXXXXXXXXXXXXXXXXXXXXXXXXXXXXXXXXX
XXXXXXXXXXXXXXXXXXXXXXXXXXXXXXXXXX
XXXXXXXXXXXXXXXXXXXXXXXXXXXXXXXXXX
XXXXXXXXXXXXXXXXXXXXXXXXXXXXXXXXXX
XXXXXXXXXXXXXXXXXXXXXXXXXXXXXXXXXX
XXXXXXXXXXXXXXXXXXXXXXXXXXXXXXXXXX
XXX<--XXXXSHIFTXXXSPACEXXXXDONEXX
SHIFT SPACE
DISPLAY OPTIONS
Enter phone number:
XXX-XXX-XXXX
ABCDEFGHIJKLM
NOPQRSTUVWXYZ
0123456789:;<
Use arrows to highlight letter
then press the enter key. Tap
the power button to abort.
<--
SHIFT SPACE
DONE
DONE
28
Page 29
SECTION 5: OTDR SETUP
SETUP MENU ? DISPLAY PREFERENCES
XXXXXXXXXXXXXXXXXXXXXXXXXXXXXXXXXX
XXXXXXXXXXXXXXXXXXXXXXXXXXXXXXXXXX
XXXXXXXXXXXXXXXXXXXXXXXXXXXXXXXXXX
XXXXXXXXXXXXXXXXXXXXXXXXXXXXXXXXXX
XXXXXXXXXXXXXXXXXXXXXXXXXXXXXXXXXX
XXXXXXXXXXXXXXXXXXXXXXXXXXXXXXXXXX
XXXXXXXXXXXXXXXXXXXXXXXXXXXXXXXXXX
XXXXXXXXXXXXXXXXXXXXXXXXXXXXXXXXXX
XXXXXXXXXXXXXXXXXXXXXXXXXXXXXXXXXX
XXXX XXXXXX XXXXXXX xxx
XXXXXXXXXXXXXXXXXXXXXXXXXXXXXXXXXX
Setup display options
SETUP MENU
OPERATIONS MENU
USER INFORMATION
DISPLAY PREFERENCES
POWER OPTIONS
UTILITIES MENU
STORED TRACES
HELP TOPICS
BACK SELECT EXIT
XXXXXXXXXXXXXXXXXXXXXXXXXXXXXXXXXX
XXXXXXXXXXXXXXXXXXXXXXXXXXXXXXXXXX
XX XXXXXXXXXXXXXXXXXXXXXXXXXXXX
XXXXXXXXXXXXXXXXXXXXXXXXXXXXXXXXXX
XXXXXXXXXXXXXXXXXXXXXXXXXXXXXXXXXX
XX XXXXXXXXXXXXXXXXXXXXXXXXX
XXXXXXXXXXXXXXXXXXXXXXXXXXXXXXXXXX
XXXXXXXXXXXXXXXXXXXXXXXXXXXXXXXXXX
XX XXXXXXXXXXXXXXXXXXXXXX
XXXXXXXXXXXXXXXXXXXXXXXXXXXXXXXXXX
XXXXXXXXXXXXXXXXXXXXXXXXXXXXXXXXXX
XX XXXXXXXXXXXXXXXXXXXXXXXXX
XXXXXXXXXXXXXXXXXXXXXXXXXXXXXXXXXX
XX XXXXXXXXXXXXXXXXXXXXXXXXXX
XX XXXXXXXXXXXXXXXXXXXXXXXX
XXXXXXXXXXXXXXXXXXXXXXXXXXXXXXXXXX
XX XXXXXXXXXXXXXXXXXXXXXXXXX
XX XXXXXXXXXXXXXXXXXXXXXXXXXXX
XXXXXXXXXXXXXXXXXXXXXXXXXXXXXXXXXX
XXXXXXXXXXXXXXXXXXXXXXXXXXXXXXXXXX
XXXXXXXXXXXXXXXXXXXXXXXXXXXXXXXXXX
XXSAVEXXXXQUITXXXXHELPXXXXXXXXXXXX
DISPLAY OPTIONS
MODE
DIMNESS
BRIGHTNESS
SPEAKER
TRACE
CLIPPING
REMOVE
TAILS
SAVE
FLIP
063
255
ON
ON
ON
QUIT HELP
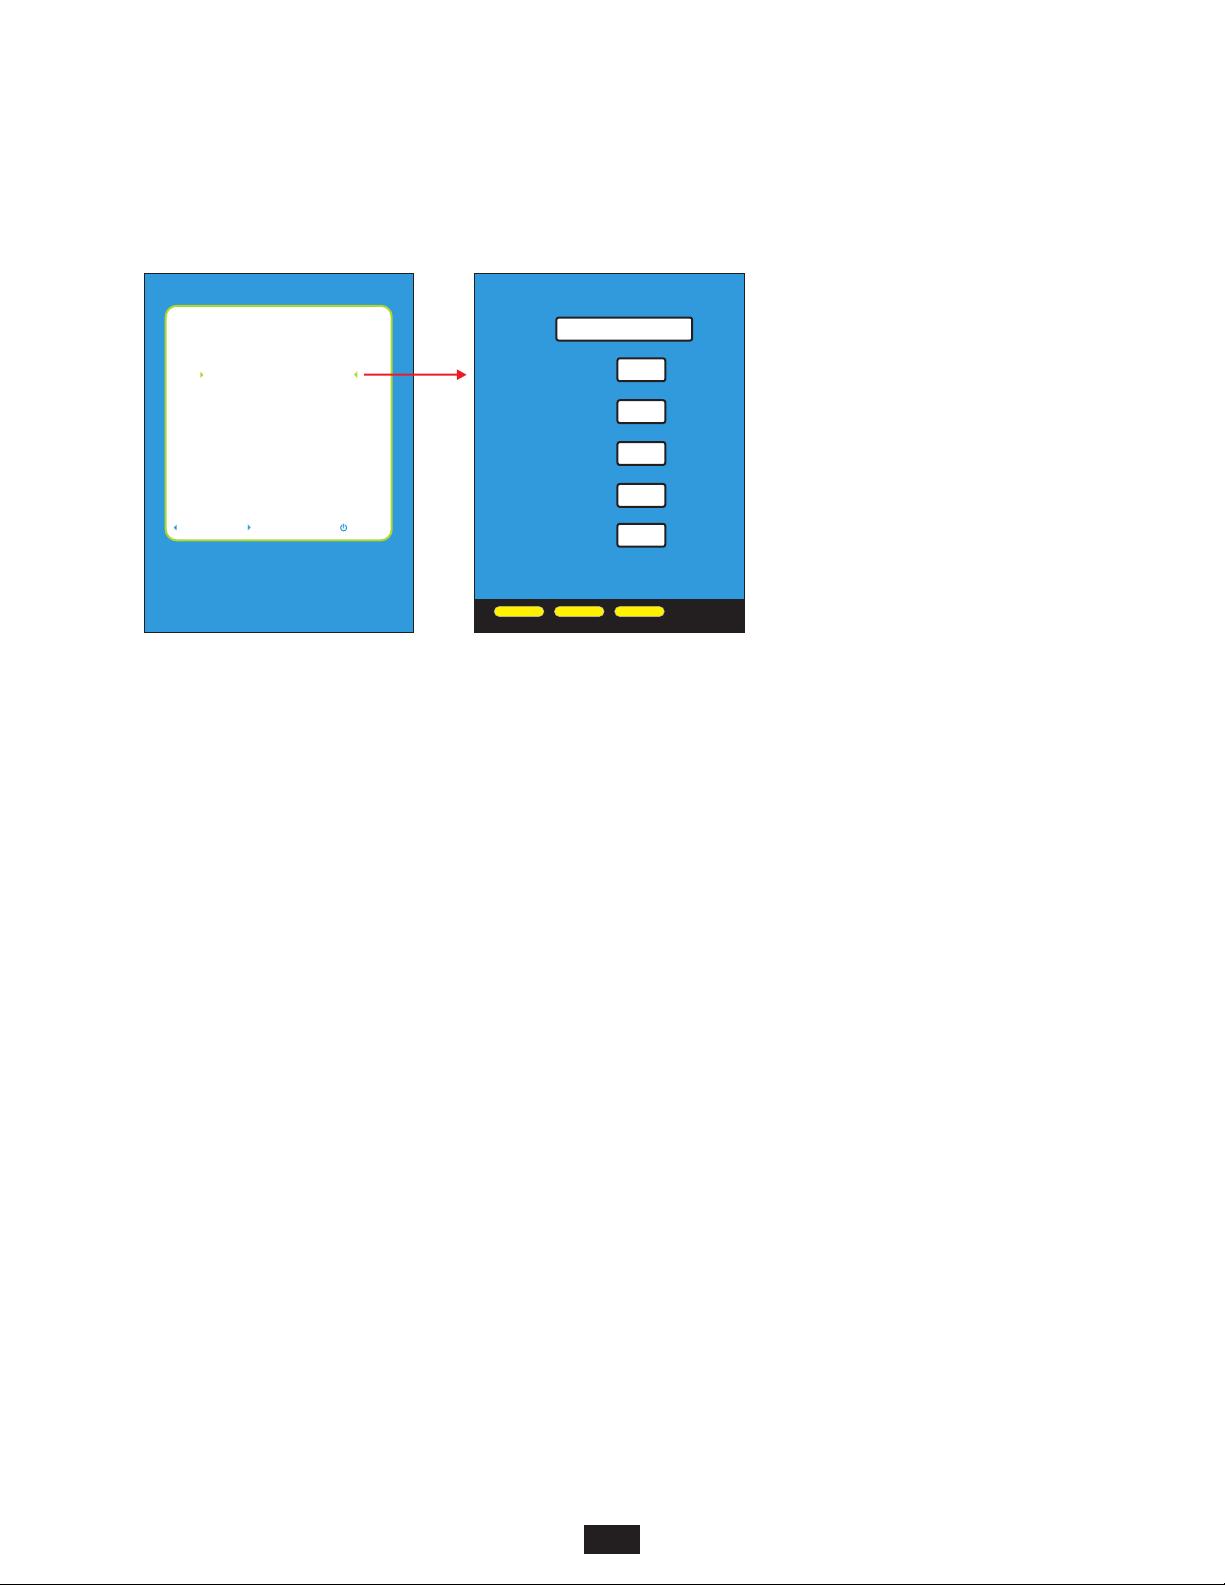
MODE – options: FLIP, PORTRAIT, LANDSCAPE
Sets the orientation of the LCD display.
FLIP LCD automatically alternates between portrait and landscape modes based upon the physical orientation of the
OTDR
PORTRAIT display is always in portrait mode
LANDSCAPE display is always in landscape mode
DIMNESS – range: 25 to 125
Sets the level of the LCD backlight during power saving mode. Range of values are 25 (dimmest) to 125 (brightest).
NOTE: higher values require more battery power
BRIGHTNESS – range: 150 to 255
Sets the level of the LCD backlight during normal operation. Range of values are 150 (dimmest) to 255 (brightest).
NOTE: higher values require more battery power
SPEAKER – options: ON, OFF
Toggles the internal speaker either ON or OFF.
TRACE CLIPPING – options: ON, OFF
Toggles trace clipping mode either ON or OFF.
On a normal OTDR trace, as the sloping line of the trace approaches the noise floor of the OTDR, the trace starts becoming less
smooth, making events harder to see near the end of the trace. Trace clipping is a method that “clips” the top of the most reflective
peaks, in order to draw the sloping line away from the noise floor. This effectively smooths out the trace, allowing smaller events to be
more easily detectable.
While trace clipping is ON, reflectance measurements of clipped events are not affected.
REMOVE TAILS – options: ON, OFF
Toggles detector tail removal either ON or OFF.
When ON, improves trace accuracy by running an additional trace at a lower APD bias voltage. Comparing the two traces reduces the
APD saturation tails that follow highly reflective events, but at the expense of slightly reduced backscatter levels and increased trace
acquisition time.
24
29
Page 30
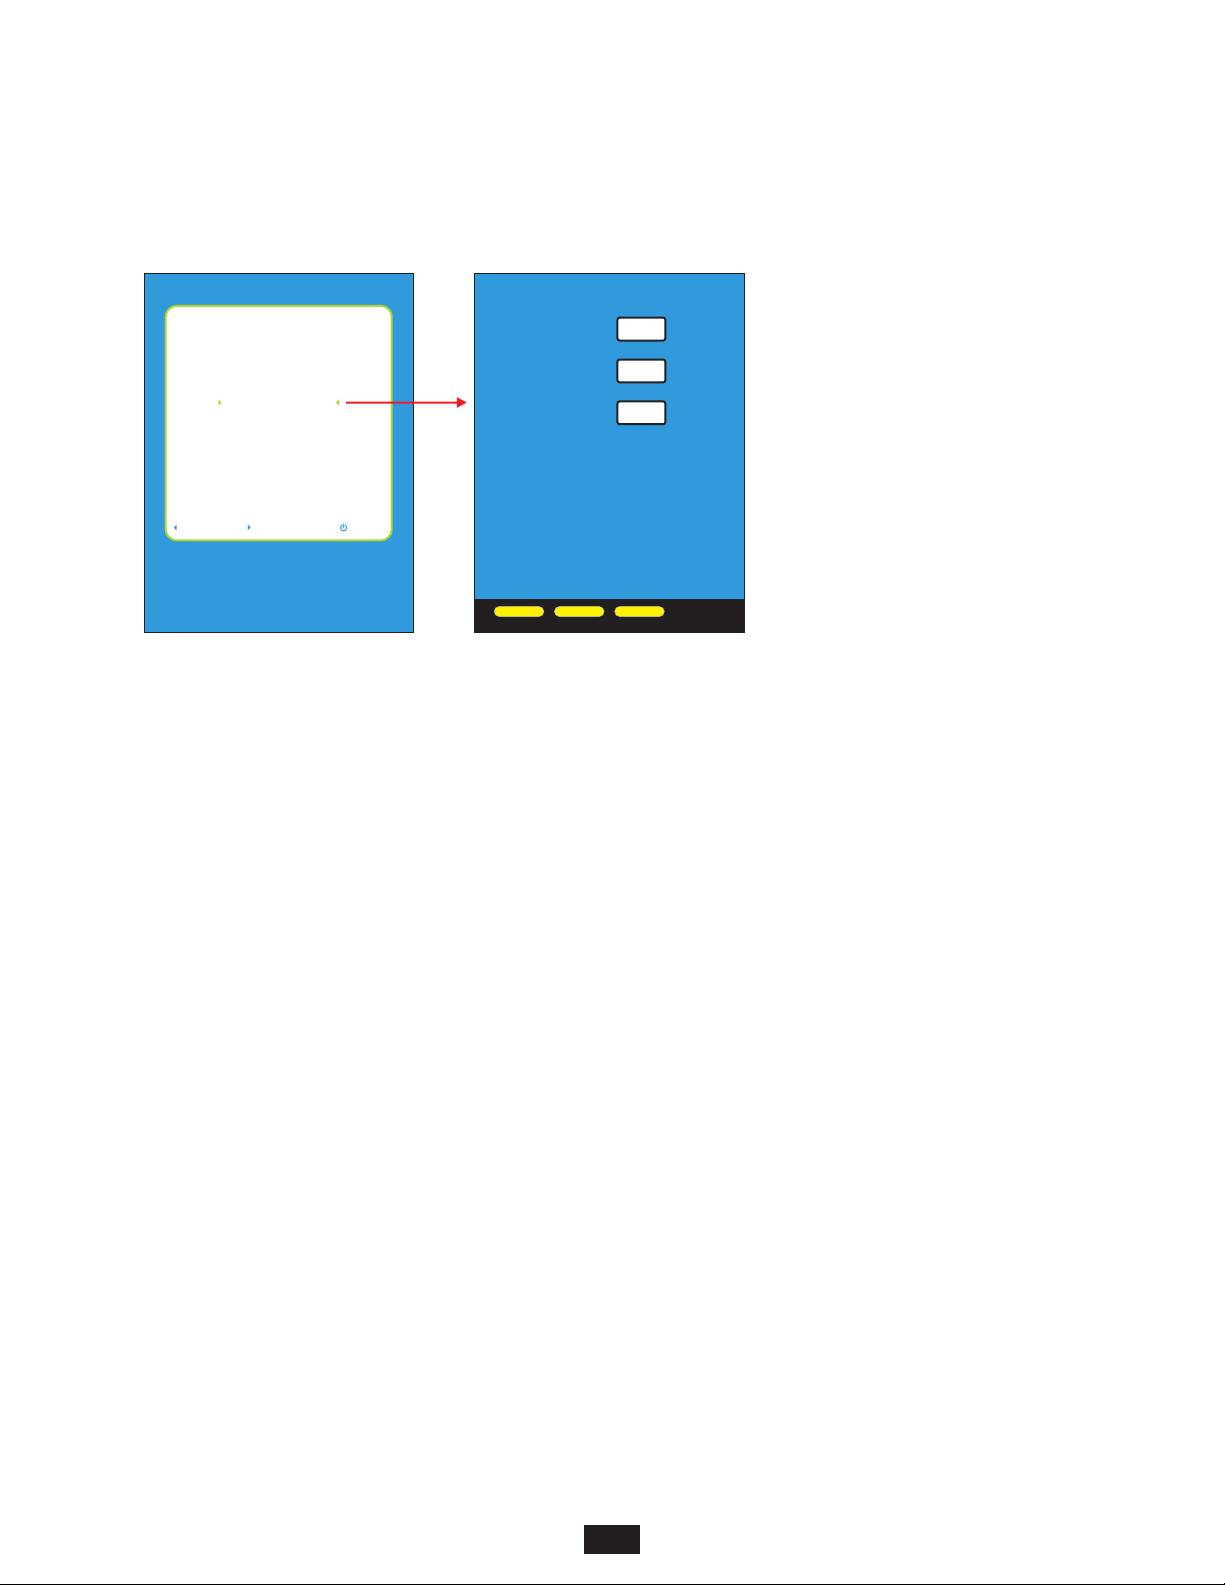
SECTION 5: OTDR SETUP
SETUP MENU ? POWER OPTIONS
XXXXXXXXXXXXXXXXXXXXXXXXXXXXXXXXXX
XXXXXXXXXXXXXXXXXXXXXXXXXXXXXXXXXX
XXXXXXXXXXXXXXXXXXXXXXXXXXXXXXXXXX
XXXXXXXXXXXXXXXXXXXXXXXXXXXXXXXXXX
XXXXXXXXXXXXXXXXXXXXXXXXXXXXXXXXXX
XXXXXXXXXXXXXXXXXXXXXXXXXXXXXXXXXX
XXXXXXXXXXXXXXXXXXXXXXXXXXXXXXXXXX
XXXXXXXXXXXXXXXXXXXXXXXXXXXXXXXXXX
XXXXXXXXXXXXXXXXXXXXXXXXXXXXXXXXXX
XXXX XXXXXX XXXXXXX xxx
XXXXXXXXXXXXXXXXXXXXXXXXXXXXXXXXXX
Setup power saving options
SETUP MENU
OPERATIONS MENU
USER INFORMATION
DISPLAY PREFERENCES
POWER OPTIONS
UTILITIES MENU
STORED TRACES
HELP TOPICS
BACK SELECT EXIT
XXXXXXXXXXXXXXXXXXXXXXXXXXXXXXXXXX
XXXXXXXXXXXXXXXXXXXXXXXXXXXXXXXXXX
XX XXXXXXXXXXXXXXXXXXXXXXXX
DIM TIME
XXXXXXXXXXXXXXXXXXXXXXXXXXXXXXXXXX
XXXXXXXXXXXXXXXXXXXXXXXXXXXXXXXXXX
XX XXXXXXXXXXXXXXXXXXXX
STANDBY TIME
XXXXXXXXXXXXXXXXXXXXXXXXXXXXXXXXXX
XXXXXXXXXXXXXXXXXXXXXXXXXXXXXXXXXX
XX XXXXXXXXXXXXXXXXXXXXXXXX
OFF TIME
XXXXXXXXXXXXXXXXXXXXXXXXXXXXXXXXXX
Times in minutes
x xxxxxxxxxxxxxxxxxxxxxx
(0=disable)
SAVE
POWER OPTIONS
xxxxxxxxxxxxxxxxxx
QUIT HELP
Power options activate after certain periods of inactivity.
DIM TIME – range: 1 to 250
Sets the time (in minutes) before the display will enter DIM mode.
STANDBY TIME – range: 2 to 250
Sets the time (in minutes) before the OTDR will enter STANDBY mode.
OFF TIME – range: 3 to 250
Sets the time (in minutes) before the OTDR will power off.
3
15
45
24
30
Page 31
SECTION 5: OTDR SETUP
SETUP MENU ? UTILITIES MENU ? SET SYSTEM CLOCK
XXXXXXXXXXXXXXXXXXXXXXXXXXXXXXXXXX
XXXXXXXXXXXXXXXXXXXXXXXXXXXXXXXXXX
XXXXXXXXXXXXXXXXXXXXXXXXXXXXXXXXXX
XXXXXXXXXXXXXXXXXXXXXXXXXXXXXXXXXX
XXXXXXXXXXXXXXXXXXXXXXXXXXXXXXXXXX
XXXXXXXXXXXXXXXXXXXXXXXXXXXXXXXXXX
XXXXXXXXXXXXXXXXXXXXXXXXXXXXXXXXXX
XXXXXXXXXXXXXXXXXXXXXXXXXXXXXXXXXX
XXXXXXXXXXXXXXXXXXXXXXXXXXXXXXXXXX
XXXX XXXXXX XXXXXXX xxx
XXXXXXXXXXXXXXXXXXXXXXXXXXXXXXXXXX
OTDR utilities menu
SETUP MENU
OPERATIONS MENU
USER INFORMATION
DISPLAY PREFERENCES
POWER OPTIONS
UTILITIES MENU
STORED TRACES
HELP TOPICS
BACK SELECT EXIT
XXXXXXXXXXXXXXXXXXXXXXXXXXXXXXXXXX
XXXXXXXXXXXXXXXXXXXXXXXXXXXXXXXXXX
XXXXXXXXXXXXXXXXXXXXXXXXXXXXXXXXXX
XXXXXXXXXXXXXXXXXXXXXXXXXXXXXXXXXX
XXXXXXXXXXXXXXXXXXXXXXXXXXXXXXXXXX
XXXXXXXXXXXXXXXXXXXXXXXXXXXXXXXXXX
XXXXXXXXXXXXXXXXXXXXXXXXXXXXXXXXXX
XXXXXXXXXXXXXXXXXXXXXXXXXXXXXXXXXX
XXXXXXXXXXXXXXXXXXXXXXXXXXXXXXXXXX
XXXX XXXXXX XXXXXXX xxx
XXXXXXXXXXXXXXXXXXXXXXXXXXXXXXXXXX
Set real time clock
XXXXSELECTXXXXXXBACKXXXXXXXEXIT
UTILITIES MENU
SET SYSTEM CLOCK
SET APD BIAS
FORMAT DATA FLASH
FACTORY RESET
MANUFACTURER SETUP
PROGRAM CPLD
HELP TOPICS
BACK SELECT EXIT
Set System Clock
Sets the current time and date in the OTDR.
Trace time and date are a part of the stored trace information and appear on test reports.
XXXXXXXXXXXXXXXXXXXXXXXXXXXXXXXXXX
XXDIM TIME:XXXXXXXXXXXXXXXXXXXXXXX
XXXXXXXXXXXXXXXXXXXXXXXXXXXXXXXXXX
XXXXXXXXXXXXXXXXXXXXXXXXXXXXXXXXXX
XXXXXXXXXXXXXXXXXXXXXXXXXXXXXXXXXX
XXOFF TIME: XXXXXXXXXXXXXXXXXXXXXX
XXXXXXXXXXXXXXXXXXXXXXXXXXXXXXXXXX
XXXXXXXXXXXXXXXXXXXXXXXXXXXXXXXXXX
XXSPEAKER :XXXXXXXXXXXXXXXXXXXXXXX
XXXXXXXXXXXXXXXXXXXXXXXXXXXXXXXXXX
XXXXXXXXXXXXXXXXXXXXXXXXXXXXXXXXXX
XXTRACE CLIPPING:XXXXXXXXXXXXXXXXX
XXXXXXXXXXXXXXXXXXXXXXXXXXXXXXXXXX
XXXXXXXXXXXXXXXXXXXXXXXXXXXXXXXXXX
XXXXXXXXXXXXXXXXXXXXXXXXXXXXXXXXXX
XXXXXXXXXXXXXXXXXXXXXXXXXXXXXXXXXX
XXXXXXXXXXXXXXXXXXXXXXXXXXXXXXXXXX
XXXXXXXXXXXXXXXXXXXXXXXXXXXXXXXXXX
XXXXXXXXXXXXXXXXXXXXXXXXXXXXXXXXXX
XXSAVEXXXXQUITXXXXHELPXXXXXXXXXXXX
XXXXXXXXXXXXXXXXXXXXXXXXXXXXXXXXXX
POWER OPTIONS
Enter Date (MM/DD/YY)
06-25-10
Enter Time (HH:MM:SS)
02:52:21:PM
QUIT
SET
24
31
Page 32
SECTION 5: OTDR SETUP
SETUP MENU ? UTILITIES MENU ? SET APD BIAS
XXXXXXXXXXXXXXXXXXXXXXXXXXXXXXXXXX
XXXXXXXXXXXXXXXXXXXXXXXXXXXXXXXXXX
XXXXXXXXXXXXXXXXXXXXXXXXXXXXXXXXXX
XXXXXXXXXXXXXXXXXXXXXXXXXXXXXXXXXX
XXXXXXXXXXXXXXXXXXXXXXXXXXXXXXXXXX
XXXXXXXXXXXXXXXXXXXXXXXXXXXXXXXXXX
XXXXXXXXXXXXXXXXXXXXXXXXXXXXXXXXXX
XXXXXXXXXXXXXXXXXXXXXXXXXXXXXXXXXX
XXXXXXXXXXXXXXXXXXXXXXXXXXXXXXXXXX
XXXX XXXXXX XXXXXXX xxx
XXXXXXXXXXXXXXXXXXXXXXXXXXXXXXXXXX
OTDR utilities menu
SETUP MENU
OPERATIONS MENU
USER INFORMATION
DISPLAY PREFERENCES
POWER OPTIONS
UTILITIES MENU
STORED TRACES
HELP TOPICS
BACK SELECT EXIT
XXXXXXXXXXXXXXXXXXXXXXXXXXXXXXXXXX
XXXXXXXXXXXXXXXXXXXXXXXXXXXXXXXXXX
XXXXXXXXXXXXXXXXXXXXXXXXXXXXXXXXXX
XXXXXXXXXXXXXXXXXXXXXXXXXXXXXXXXXX
XXXXXXXXXXXXXXXXXXXXXXXXXXXXXXXXXX
XXXXXXXXXXXXXXXXXXXXXXXXXXXXXXXXXX
XXXXXXXXXXXXXXXXXXXXXXXXXXXXXXXXXX
XXXXXXXXXXXXXXXXXXXXXXXXXXXXXXXXXX
XXXXXXXXXXXXXXXXXXXXXXXXXXXXXXXXXX
BACK SELECT EXIT
XXXX XXXXXX XXXXXXX xxx
XXXXXXXXXXXXXXXXXXXXXXXXXXXXXXXXXX
Set avalanche photodiode bias
voltage
Set APD Bias
Sets the high voltage bias of the avalanche photodiode.
UTILITIES MENU
SET SYSTEM CLOCK
SET APD BIAS
FORMAT DATA FLASH
FACTORY RESET
MANUFACTURER SETUP
PROGRAM CPLD
HELP TOPICS
SETTING APD BIAS VOLTAGE
XXXXXXXXXXXXXXXXXXXXXXXXXXXXXXXXXX
XXXXXXXXXXXXXXXXXXXXXXXXXXXXXXXXXX
XXXXXXXXXXXXXXXXXXXXXXXXXXXXXXXXXX
XXX XXXXXXXXXXXX
XXXXXXXXXXXXXXXXXXXXXXXXXXXXXXXXXX
XXXXXXXXXXXXXXXXXXXXXXXXXXXXXXXXXX
XXXXXXXXXXXXXXXXXXXXXXXXXXXXXXXXXX
XXXXXXXXXXXXXXXXXXXXXXXXXXXXXXXXXX
XXXXXXXXXXXXXXXXXXXXXXXXXXXXXXXXXX
XXXXXXXXXXXXXXXXXXXXXXXXXXXXXXXXXX
XXXXXXXXXXXXXXXXXXXXXXXXXXXXXXXXXX
XXXXXXXXXXXXXXXXXXXXXXXXXXXXXXXXXX
XXXXXXXXXXXXXXXXXXXXXXXXXXXXXXXXXX
XXXXXXXXXXXXXXXXXXXXXXXXXXXXXXXXXX
SET SYSTEM CLOCK
SET APD BIAS
BIAS VOLTAGE % : 54
UTILITIES MENU
HELP TOPICS
SELECT BACK EXIT
XXXX XXXXXX XXXXXXX
24
32
Page 33
SECTION 5: OTDR SETUP
SETUP MENU ? UTILITIES MENU ? FORMAT DATA FLASH
XXXXXXXXXXXXXXXXXXXXXXXXXXXXXXXXXX
XXXXXXXXXXXXXXXXXXXXXXXXXXXXXXXXXX
XXXXXXXXXXXXXXXXXXXXXXXXXXXXXXXXXX
XXXXXXXXXXXXXXXXXXXXXXXXXXXXXXXXXX
XXXXXXXXXXXXXXXXXXXXXXXXXXXXXXXXXX
XXXXXXXXXXXXXXXXXXXXXXXXXXXXXXXXXX
XXXXXXXXXXXXXXXXXXXXXXXXXXXXXXXXXX
XXXXXXXXXXXXXXXXXXXXXXXXXXXXXXXXXX
XXXXXXXXXXXXXXXXXXXXXXXXXXXXXXXXXX
XXXX XXXXXX XXXXXXX xxx
XXXXXXXXXXXXXXXXXXXXXXXXXXXXXXXXXX
OTDR utilities menu
SETUP MENU
OPERATIONS MENU
USER INFORMATION
DISPLAY PREFERENCES
POWER OPTIONS
UTILITIES MENU
STORED TRACES
HELP TOPICS
BACK SELECT EXIT
XXXXXXXXXXXXXXXXXXXXXXXXXXXXXXXXXX
XXXXXXXXXXXXXXXXXXXXXXXXXXXXXXXXXX
XXXXXXXXXXXXXXXXXXXXXXXXXXXXXXXXXX
XXXXXXXXXXXXXXXXXXXXXXXXXXXXXXXXXX
XXXXXXXXXXXXXXXXXXXXXXXXXXXXXXXXXX
XXXXXXXXXXXXXXXXXXXXXXXXXXXXXXXXXX
XXXXXXXXXXXXXXXXXXXXXXXXXXXXXXXXXX
XXXXXXXXXXXXXXXXXXXXXXXXXXXXXXXXXX
XXXXXXXXXXXXXXXXXXXXXXXXXXXXXXXXXX
XXXX XXXXXX XXXXXXX xxx
XXXXXXXXXXXXXXXXXXXXXXXXXXXXXXXXXX
Formats Data Storage - This
will erase all stored traces
XXXXXXXXXXXXXXXXXXXXXXXXXXXXXXXXXX
XXXXXXXXXXXXXXXXXXXXXXXXXXXXXXXXXX
XXXXSELECTXXXXXXBACKXXXXXXXEXIT
UTILITIES MENU
SET SYSTEM CLOCK
SET APD BIAS
FORMAT DATA FLASH
FACTORY RESET
MANUFACTURER SETUP
PROGRAM CPLD
HELP TOPICS
BACK SELECT EXIT
FORMATTING DATA FLASH
XXXXXXXXXXXXXXXXXXXXXXXXXXXXXXXXXX
XXXXXXXXXXXXXXXXXXXXXXXXXXXXXXXXXX
XXXXXXXXXXXXXXXXXXXXXXXXXXXXXXXXXX
XXX XXXXXXXXXXXXXXXX
XXXXXXXXXXXXXXXXXXXXXXXXXXXXXXXXXX
XXXXXXXXXXXXXXXXXXXXXXXXXXXXXXXXXX
XXXXXXXXXXXXXXXXXXXXXXXXXXXXXXXXXX
XXXXXXXXXXXXXXXXXXXXXXXXXXXXXXXXXX
XXXXXXXXXXXXXXXXXXXXXXXXXXXXXXXXXX
XXXXXXXXXXXXXXXXXXXXXXXXXXXXXXXXXX
XXXXXXXXXXXXXXXXXXXXXXXXXXXXXXXXXX
XXXXXXXXXXXXXXXXXXXXXXXXXXXXXXXXXX
XXXXXXXXXXXXXXXXXXXXXXXXXXXXXXXXXX
XXXXXXXXXXXXXXXXXXXXXXXXXXXXXXXXXX
XXXXXXXXXXXXXXXXXXXXXXXXXXXXXXXXXX
XXXXXXXXXXXXXXXXXXXXXXXXXXXXXXXXXX
SET SYSTEM CLOCK
SET APD BIAS
% COMPLETE : 30
UTILITIES MENU
HELP TOPICS
SELECT BACK EXIT
XXXX XXXXXX XXXXXXX
Format Data Flash
Initializes the internal trace storage memory. This option will erase all stored traces, and should only be used in cases where the file
system has become corrupted.
24
33
Page 34
SECTION 5: OTDR SETUP
SETUP MENU ? UTILITIES MENU ? FACTORY RESET
XXXXXXXXXXXXXXXXXXXXXXXXXXXXXXXXXX
XXXXXXXXXXXXXXXXXXXXXXXXXXXXXXXXXX
XXXXXXXXXXXXXXXXXXXXXXXXXXXXXXXXXX
XXXXXXXXXXXXXXXXXXXXXXXXXXXXXXXXXX
XXXXXXXXXXXXXXXXXXXXXXXXXXXXXXXXXX
XXXXXXXXXXXXXXXXXXXXXXXXXXXXXXXXXX
XXXXXXXXXXXXXXXXXXXXXXXXXXXXXXXXXX
XXXXXXXXXXXXXXXXXXXXXXXXXXXXXXXXXX
XXXXXXXXXXXXXXXXXXXXXXXXXXXXXXXXXX
XXXX XXXXXX XXXXXXX xxx
XXXXXXXXXXXXXXXXXXXXXXXXXXXXXXXXXX
OTDR utilities menu
SETUP MENU
OPERATIONS MENU
USER INFORMATION
DISPLAY PREFERENCES
POWER OPTIONS
UTILITIES MENU
STORED TRACES
HELP TOPICS
BACK SELECT EXIT
Factory Reset
Restores user settings to factory defaults.
XXXXXXXXXXXXXXXXXXXXXXXXXXXXXXXXXX
XXXXXXXXXXXXXXXXXXXXXXXXXXXXXXXXXX
XXXXXXXXXXXXXXXXXXXXXXXXXXXXXXXXXX
XXXXXXXXXXXXXXXXXXXXXXXXXXXXXXXXXX
XXXXXXXXXXXXXXXXXXXXXXXXXXXXXXXXXX
XXXXXXXXXXXXXXXXXXXXXXXXXXXXXXXXXX
XXXXXXXXXXXXXXXXXXXXXXXXXXXXXXXXXX
XXXXXXXXXXXXXXXXXXXXXXXXXXXXXXXXXX
XXXXXXXXXXXXXXXXXXXXXXXXXXXXXXXXXX
XXXX XXXXXX XXXXXXX xxx
XXXXXXXXXXXXXXXXXXXXXXXXXXXXXXXXXX
Reset to factory defaults
XXXXXXXXXXXXXXXXXXXXXXXXXXXXXXXXXX
XXXXXXXXXXXXXXXXXXXXXXXXXXXXXXXXXX
XXXXSELECTXXXXXXBACKXXXXXXXEXIT
UTILITIES MENU
SET SYSTEM CLOCK
SET APD BIAS
FORMAT DATA FLASH
FACTORY RESET
MANUFACTURER SETUP
PROGRAM CPLD
HELP TOPICS
BACK SELECT EXIT
FORMATTING DATA FLASH
* WARNING *
XXXXXXXXXXXXXXXXXXXXXXXXXXXXXXXXXX
XXXXXXXXXXXXXXXXXXXXXXXXXXXXXXXXXX
XXXXXXXXXXXXXXXXXXXXXXXXXXXXXXXXXX
XXXXXXXXXXXXXXXXXXXXXXXXXXXXXXXXXX
XXXXXXXXXXXXXXXXXXXXXXXXXXXXXXXXXX
XXXXXXXXXXXXXXXXXXXXXXXXXXXXXXXXXX
XXXXXXXXXXXXXXXXXXXXXXXXXXXXXXXXXX
XXXXXXXXXXXXXXXXXXXXXXXXXXXXXXXXXX
XXXXXXXXXXXXXXXXXXXXXXXXXXXXXXXXXX
XXXXXXXXXXXXXXXXXXXXXXXXXXXXXXXXXX
XXXXXXXXXXXXXXXXXXXXXXXXXXXXXXXXXX
XXXXXXXXXXXXXXXXXXXXXXXXXXXXXXXXXX
XXXXXXXXXXXXXXXXXXXXXXXXXXXXXXXXXX
XXXXXXXXXXXXXXXXXXXXXXXXXXXXXXXXXX
SET SYSTEM CLOCK
SET APD BIAS
This will restore all
user settings to factory
defaults. Proceed?
HELP TOPICS
XXXXSELECTXXXXXXBACKXXXXXXXEXIT
YES
NO
24
34
Page 35
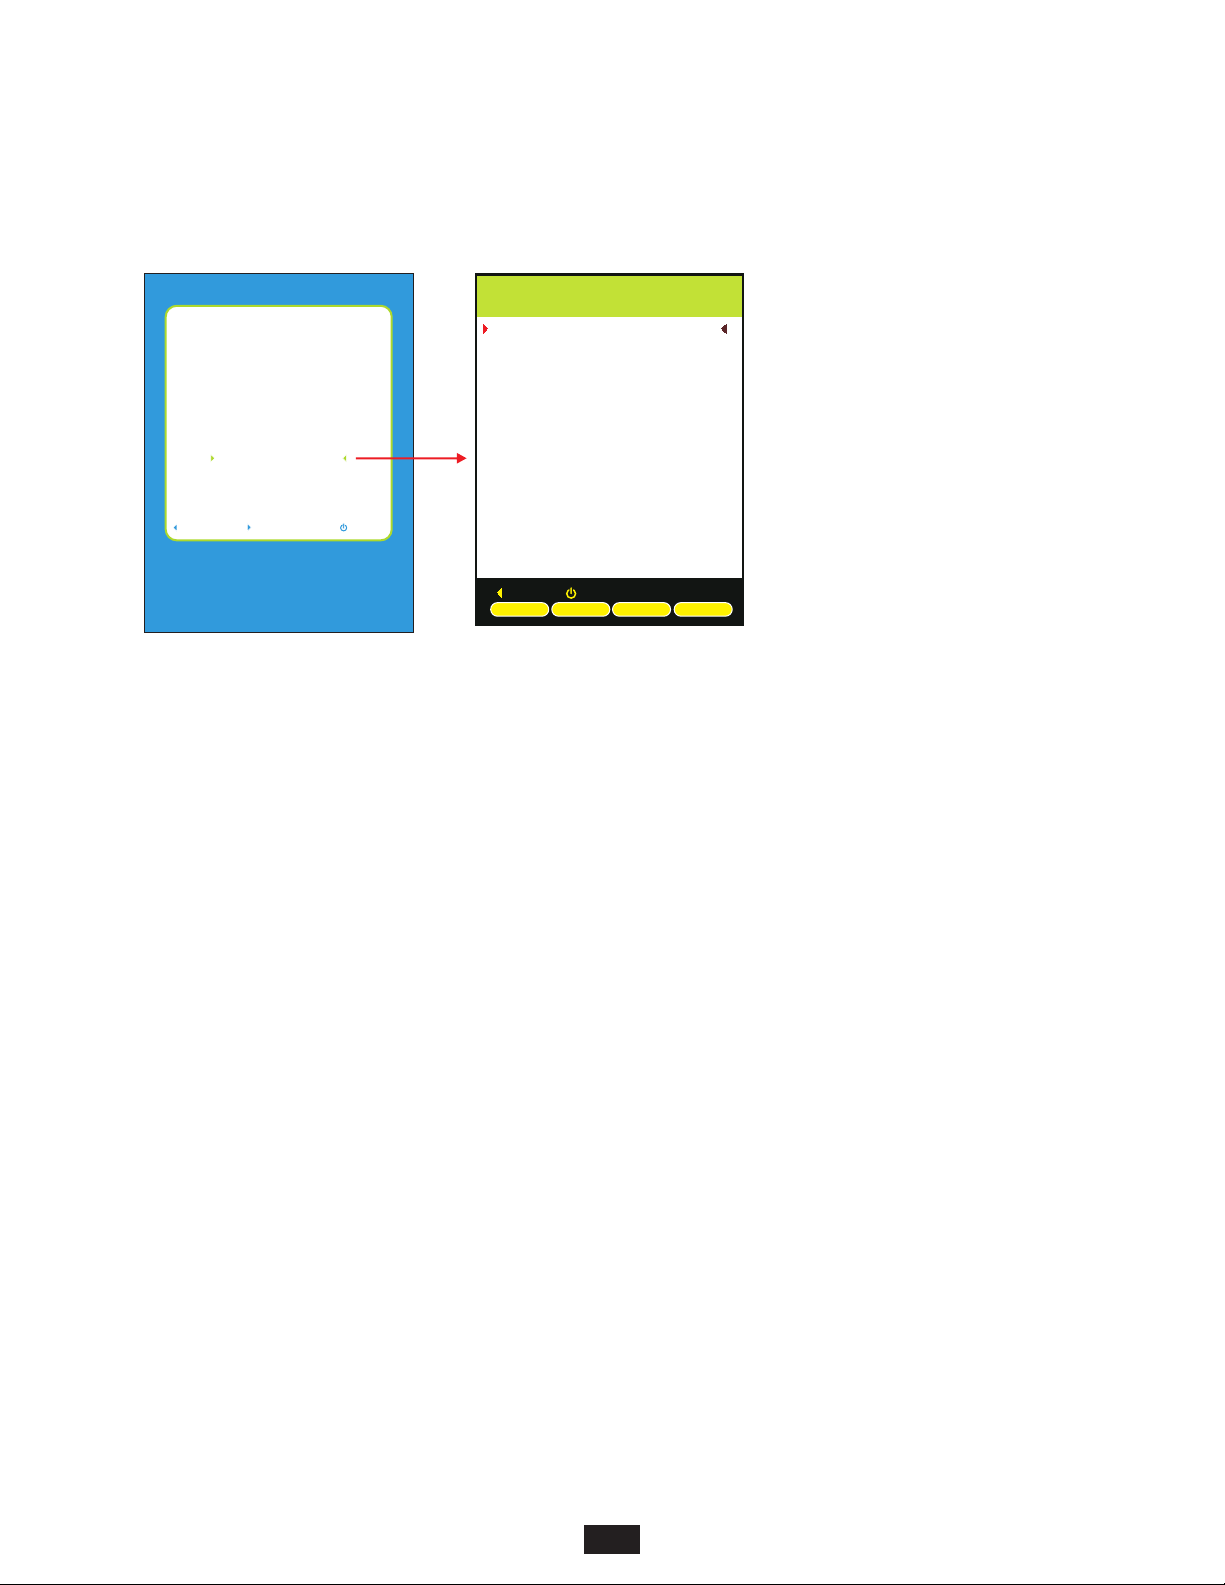
SECTION 5: OTDR SETUP
SETUP MENU ? STORED TRACES
XXXXXXXXXXXXXXXXXXXXXXXXXXXXXXXXXX
XXXXXXXXXXXXXXXXXXXXXXXXXXXXXXXXXX
XXXXXXXXXXXXXXXXXXXXXXXXXXXXXXXXXX
XXXXXXXXXXXXXXXXXXXXXXXXXXXXXXXXXX
XXXXXXXXXXXXXXXXXXXXXXXXXXXXXXXXXX
XXXXXXXXXXXXXXXXXXXXXXXXXXXXXXXXXX
XXXXXXXXXXXXXXXXXXXXXXXXXXXXXXXXXX
XXXXXXXXXXXXXXXXXXXXXXXXXXXXXXXXXX
XXXXXXXXXXXXXXXXXXXXXXXXXXXXXXXXXX
XXXX XXXXXX XXXXXXX xxx
XXXXXXXXXXXXXXXXXXXXXXXXXXXXXXXXXX
View, load, and delete
stored traces
SETUP MENU
OPERATIONS MENU
USER INFORMATION
DISPLAY PREFERENCES
POWER OPTIONS
UTILITIES MENU
STORED TRACES
HELP TOPICS
BACK SELECT EXIT
Trace Namex Date Time
SM-BB-F1-F2:1
SM-BB-F1-F2:2
SM-BB-F1-F2:3
SM-BB-F1-F2:4
SM-BB-F1-F2:5
SM-BB-F1-F2:6
X
X
X
X
X
X
X
X
X
X
X
n=1.4681 L=33600 P= 10us S=1m
xx XXXXXX
STORED TRACESx
10/05/09
10/05/09
10/05/09
10/05/09
10/05/09
10/05/09
x x x x
ABORT HELP
LOAD
OVERLAY DELETE PAGE
04:16PM
04:17PM
04:19PM
04:21PM
04:24PM
04:27PM
ü
STORED TRACES
See Section 4: TRACE STORAGE for more information on working with currently stored OTDR traces.
24
35
Page 36
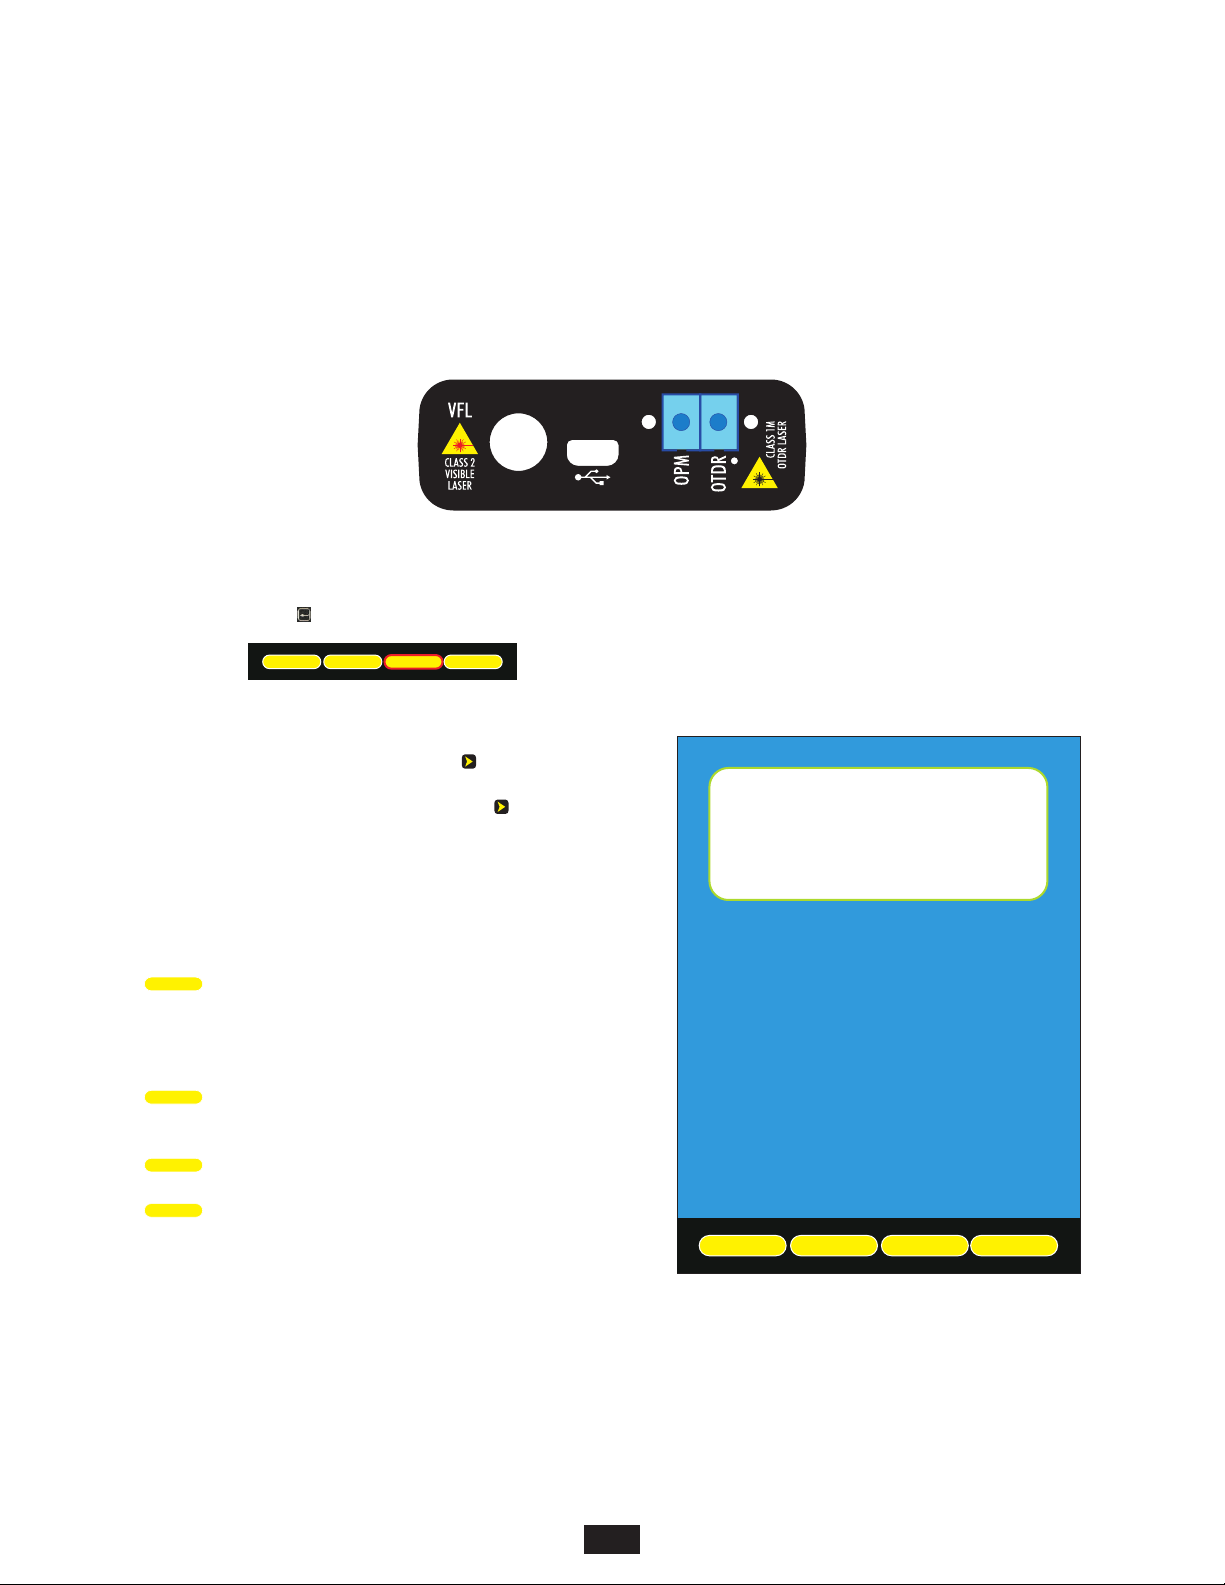
SECTION 6: OPERATION/MAINTENANCE
OPTICAL POWER METER (OPM) OPERATION
Some models of OWLTrek II OTDRs contain an optical power meter port, allowing users to measure optical power and optical loss
(when used with an external light source).
These models include a duplex LC connector, one side for the OPM and one side for the OTDR.
OPERATING THE OPM
Press the Enter key ( ) until the MENU function option appears.
EOFEVENTS
MENU
VFL
Press the MENU soft key to enter the SETUP MENU.
Highlight OPERATIONS MENU, then press to continue.
Highlight OPTICAL POWER METER, then press to continue.
The optical power meter display shows current optical power readings in
dBm and dB, and the currently selected wavelength.
UNDER incoming optical power is too low to be measured
OVER incoming optical power is too bright to be measured
WAVE
changes the currently selected wavelength. Calibrated
wavelengths include:
850, 980, 1300, 1310, 1490, 1550, and 1625nm.
ZERO
when an external test light source is connected, sets a reference
point for the currently selected wavelength.
UNITS
toggles the measurement units between dBm and dB.
EXIT
returns to the OPERATIONS MENU.
OPTICAL POWER METER
-13.45 dBm
1310nm
ZEROWAVE
UNITS
EXIT
36
Page 37
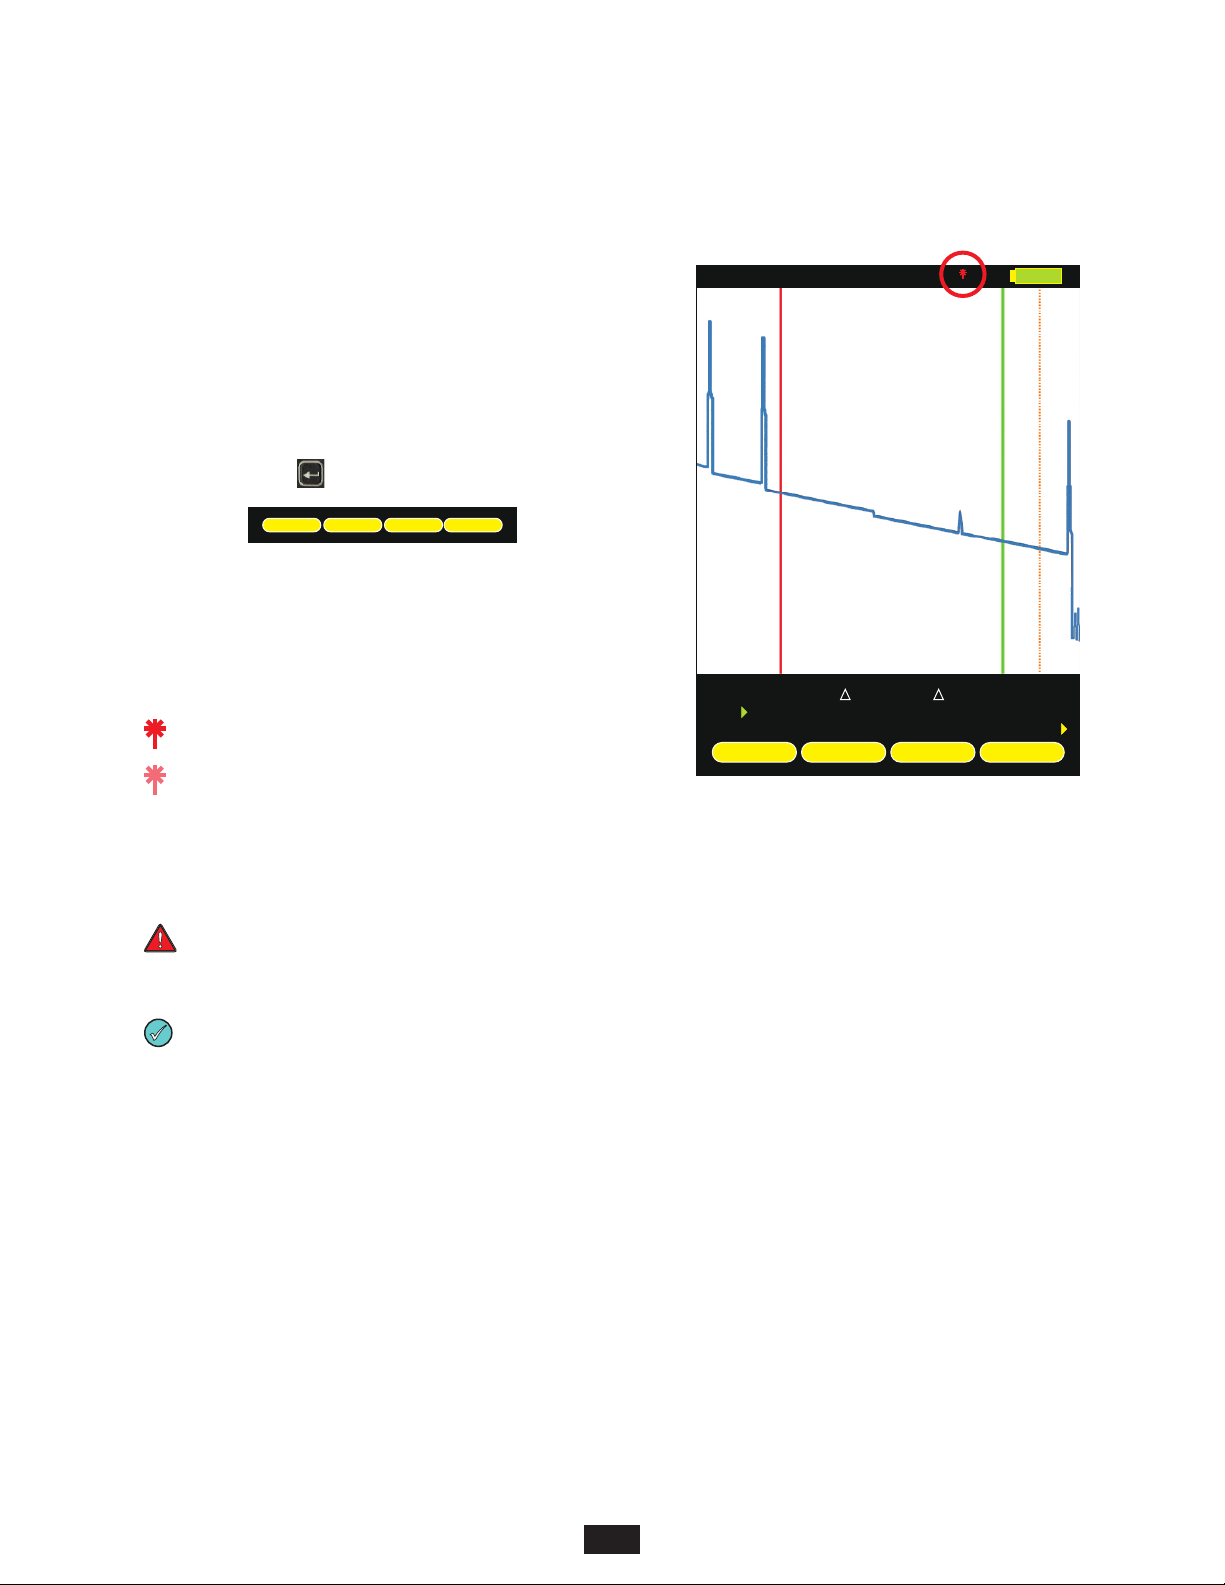
SECTION 6: OPERATION/MAINTENANCE
VISUAL FAULT LOCATOR (VFL) OPERATION
The OWLTrek II OTDR contains a visual fault locator port used for quick
troubleshooting of optical faults close to the near-end of the optical fiber
under test.
The 2.5mm universal VFL port is located on the left-hand side on the top of
the OTDR.
OPERATING THE VFL
Press the Enter key ( ) until the VFL function option appears.
EOFEVENTS
MENU
VFL
Press the VFL soft key to toggle through the different VFL modes.
The VFL status icon will appear on the trace screen above the trace area as
shown at right:
(no icon) OFF
ON
BLINK
Fiber #x
1550nm
06086m
20226m
24718m
L mx
14140
AUTO
2.43x
3.34x
dB
H
RFL dBx
-81.00x
ENTER
VFLMENUEOFEVENTS
EYE SAFETY PRECAUTIONS
look directly at the output of the VFL, and even limited exposure over time to reflected VFL light can be dangerous
NEVER
to the eye.
For best results if using the VFL for end-to-end fiber identification,
use a piece of paper to diffuse the light exiting the far-end
connector.
37
Page 38
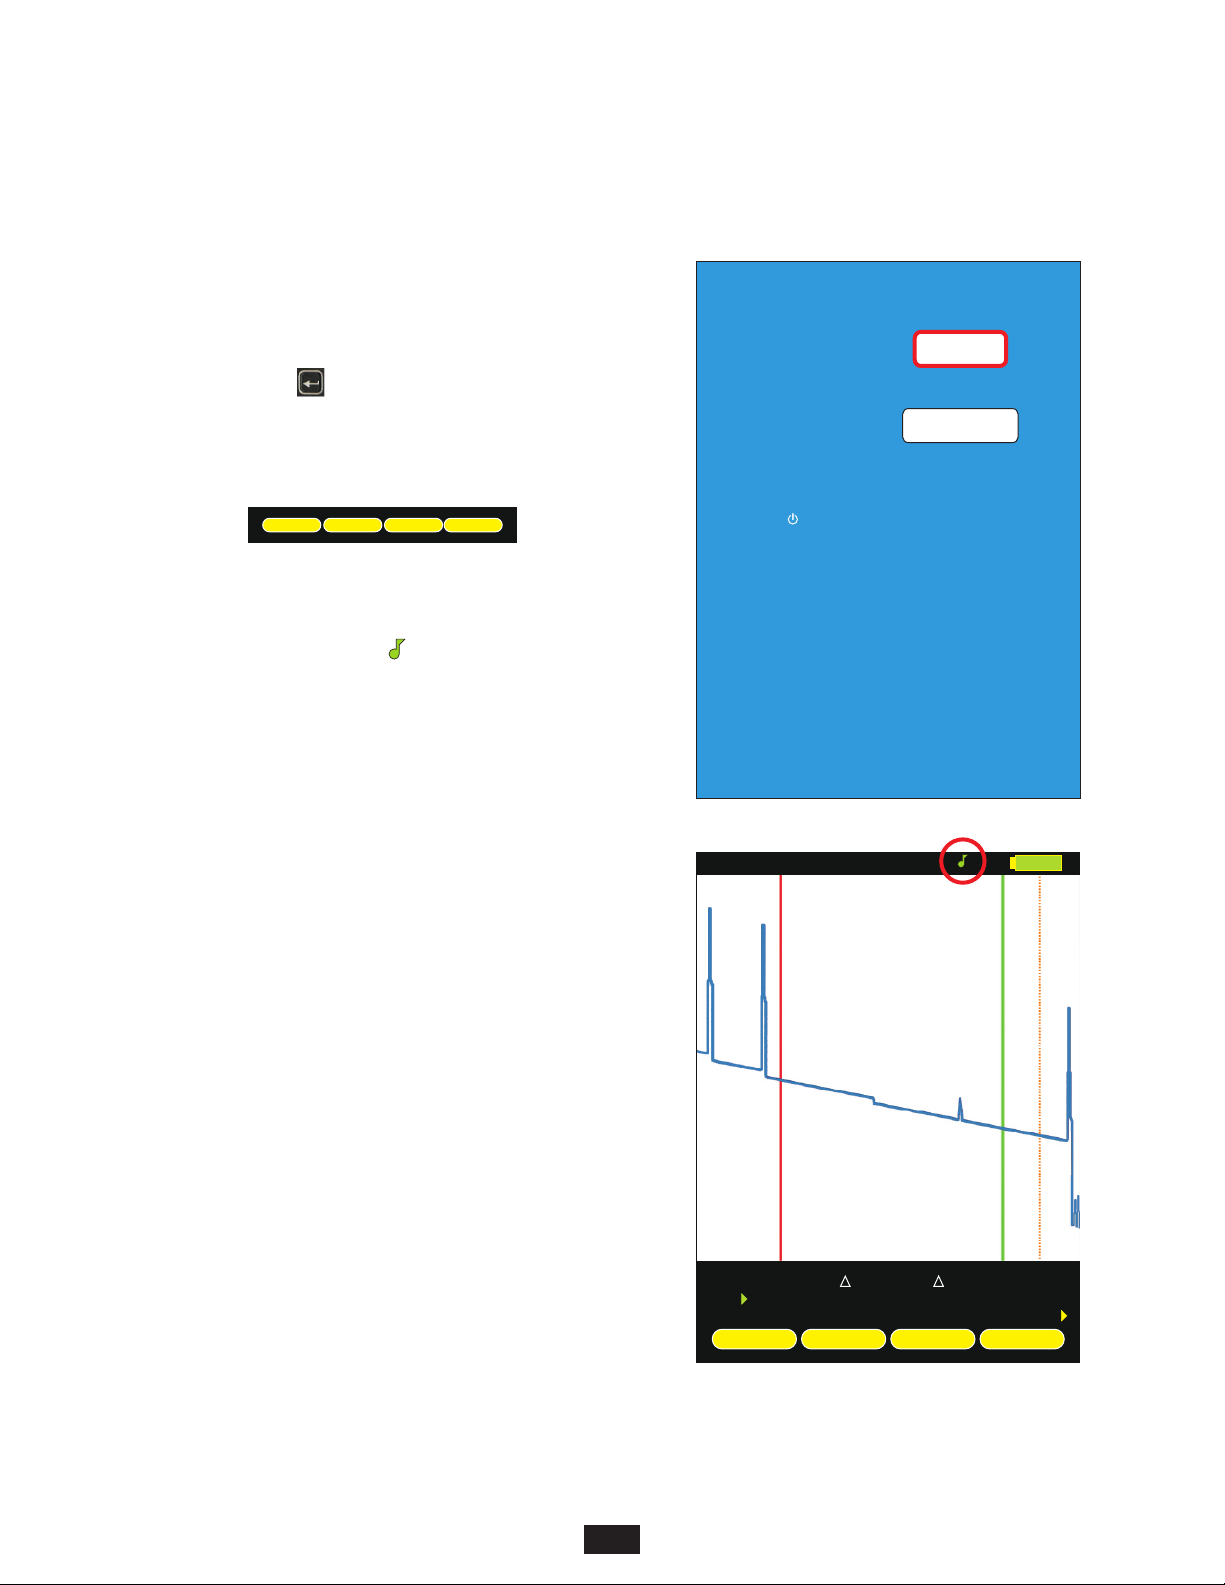
SECTION 6: OPERATION/MAINTENANCE
FIBER ID TONE OPERATION
The laser output of the OTDR port can be used to produce a 2kHz tone for use
with fiber identifiers.
SETTING THE FIBER ID TONE
Press the Enter key ( ) until the MENU function option appears.
From the SETUP MENU, follow the menu path below:
SETUP MENU >> OPERATIONS MENU >> CONFIGURE OPTIONS
EOFEVENTS
MENU
VFL
From the CONFIGURE OPTIONS menu, highlight the FIBER ID TONE
option. FIBER ID TONE has two settings: OFF and ON.
The FIBER ID TONE status icon ( ) will appear on the trace screen above
the trace area as shown at right.
CONFIGURE OPTIONS
XXXXXXXXXXXXXXXXXXXXXXXXXXXXXXXXXX
XXXXXXXXXXXXXXXXXXXXXXXXXXXXXXXXXX
XX
FIBER ID TONE:
XXXXXXXXXXXXXXXXXXXXXXXXXXXXXXXXXX
XXXXXXXXXXXXXXXXXXXXXXXXXXXXXXXXXX
VISUAL FAULT
XX
LOCATOR:
Press ENTER when done
Press for help
OFF
OFF
Fiber #x
1550nm
06086m
20226m
24718m
L mx
14140
AUTO
2.43x
3.34x
dB
H
RFL dBx
-81.00x
ENTER
VFLMENUEOFEVENTS
38
Page 39
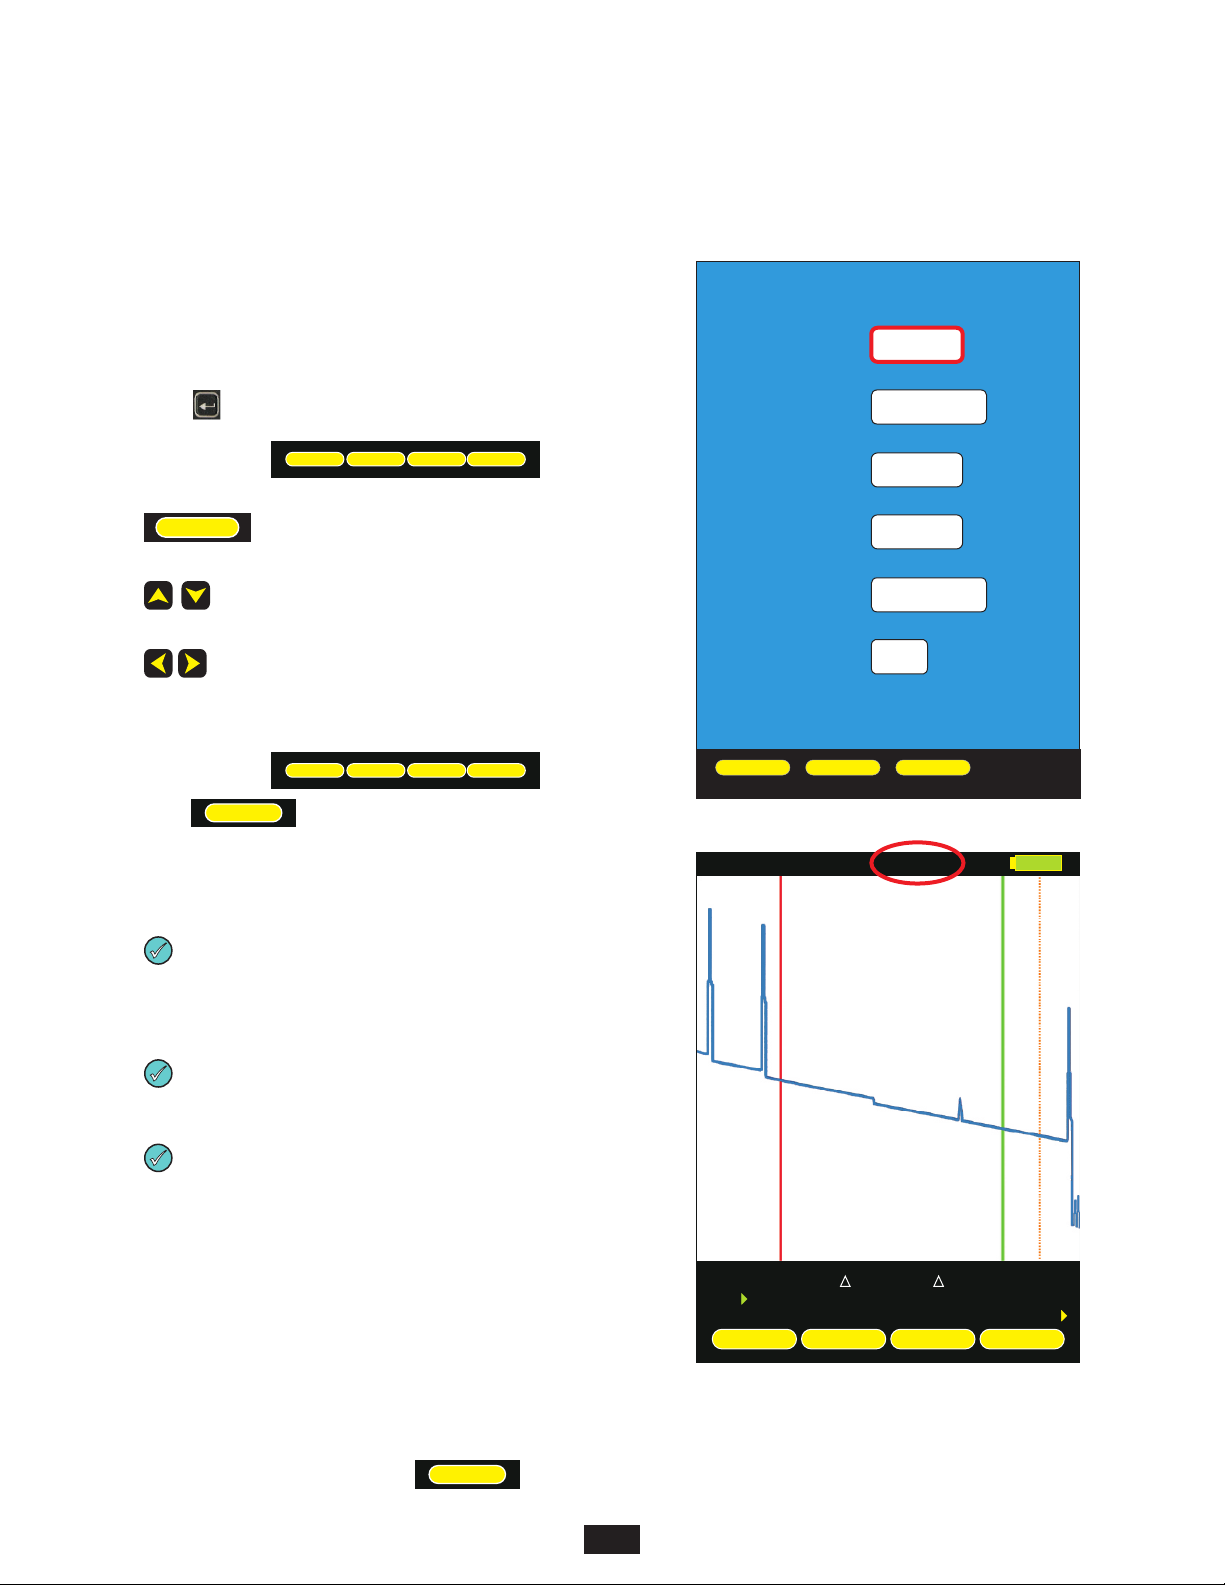
SECTION 6: OPERATION/MAINTENANCE
LIVE MODE OPERATION
LIVE MODE is an advanced feature that periodically updates the OTDR
screen while the OTDR is taking a trace, in order to view events as they
happen in real-time.
LIVE MODE OPERATION
Press from the trace screen until the following menu options appear:
INDEX
SETUP
SETUP
LOADSAVE
opens the TRACE OPTIONS menu
highlight CAPTURE MODE
change the value to LIVE
Press SAVE to return to the trace screen. The function menu should show:
LOCKCURSOR
Press to start LIVE mode. After a few seconds the OTDR
TEST
ZOOM
TEST
screen will acquire its initial trace.
After acquiring its initial trace, the trace screen will begin to update every few
seconds.
TRACE OPTIONS
XXXXXXXXXXXXXXXXXXXXXXXXXXXXXXXXXX
XXXXXXXXXXXXXXXXXXXXXXXXXXXXXXXXXX
XX XXXXXXXXXXXXXXXXXXXX
CAPTURE MODE
XXXXXXXXXXXXXXXXXXXXXXXXXXXXXXXXXX
XXXXXXXXXXXXXXXXXXXXXXXXXXXXXXXXXX
PULSE WIDTH
XX XXXXXXXXXXXXXXXXXXXXX
XXXXXXXXXXXXXXXXXXXXXXXXXXXXXXXXXX
XX XXXXXXXXXXXXXXXXXXXXXX
NUMBER OF
XX XXXXXXXXXXXXXXXXXXXXXXXXX
SAMPLES
XXXXXXXXXXXXXXXXXXXXXXXXXXXXXXXXXX
DEAD ZONE
XX XXXXXXXXXXXXXXXXXXXXXXX
LENGTH(m)
XX XXXXXXXXXXXXXXXXXXXXXXX
XXXXXXXXXXXXXXXXXXXXXXXXXXXXXXXXXX
XXXXXXXXXXXXXXXXXXXXXXXXXXXXXXXXXX
RANGE
XX XXXXXXXXXXXXXXXXXXX
XXXXXXXXXXXXXXXXXXXXXXXXXXXXXXXXXX
XXXXXXXXXXXXXXXXXXXXXXXXXXXXXXXXXX
XX XXXXXXXXXXXXXXXXXXXXXXXXXXXX
STEP
XXXXXXXXXXXXXXXXXXXXXXXXXXXXXXXXXX
XXXXXXXXXXXXXXXXXXXXXXXXXXXXXXXXXX
XXXXXXXXXXXXXXXXXXXXXXXXXXXXXXXXXX
XXXXXXXXXXXXXXXXXXXXXXXXXXXXXXXXXX
SAVE
XXSAVEXXXXQUITXXXXHELPXXXXXXXXXXXX
Fiber #x
LIVE
4096
1100
MAXkm
1m
QUIT HELP
LIVE
1m
H
The frequency of screen updates will depend upon the selected
TRACE OPTIONS. Lowering the number of samples and/or
increasing the STEP value will increase the frequency of screen
updates, but will also lower the trace resolution.
f the screen does not appear to be changing, the characteristics of
I
the fiber are not changing.
When the OTDR is connected to a PC, OWLView software allows
users to display LIVE mode on the software trace screen. This
enables users to view real-time trace updates on the large PC
monitor in order to better see events that may not be visible on the
OTDR LCD display.
To enable LIVE mode in OWLView software:
1) Launch OWLView software;
2) Click “Start Live Mode”
3) If the OTDR is not already in LIVE mode, follow the
instructions that appear on the software screen, wait for
LIVE mode on the OTDR to begin, then click “Start Live Mode” again.
When LIVE testing is complete, press again to exit LIVE mode.
TEST
1550nm
06086m
20226m
24718m
L mx
14140
2.43x
3.34x
dB
RFL dBx
-81.00x
ENTER
TESTZOOMLOCKCURSOR
39
Page 40
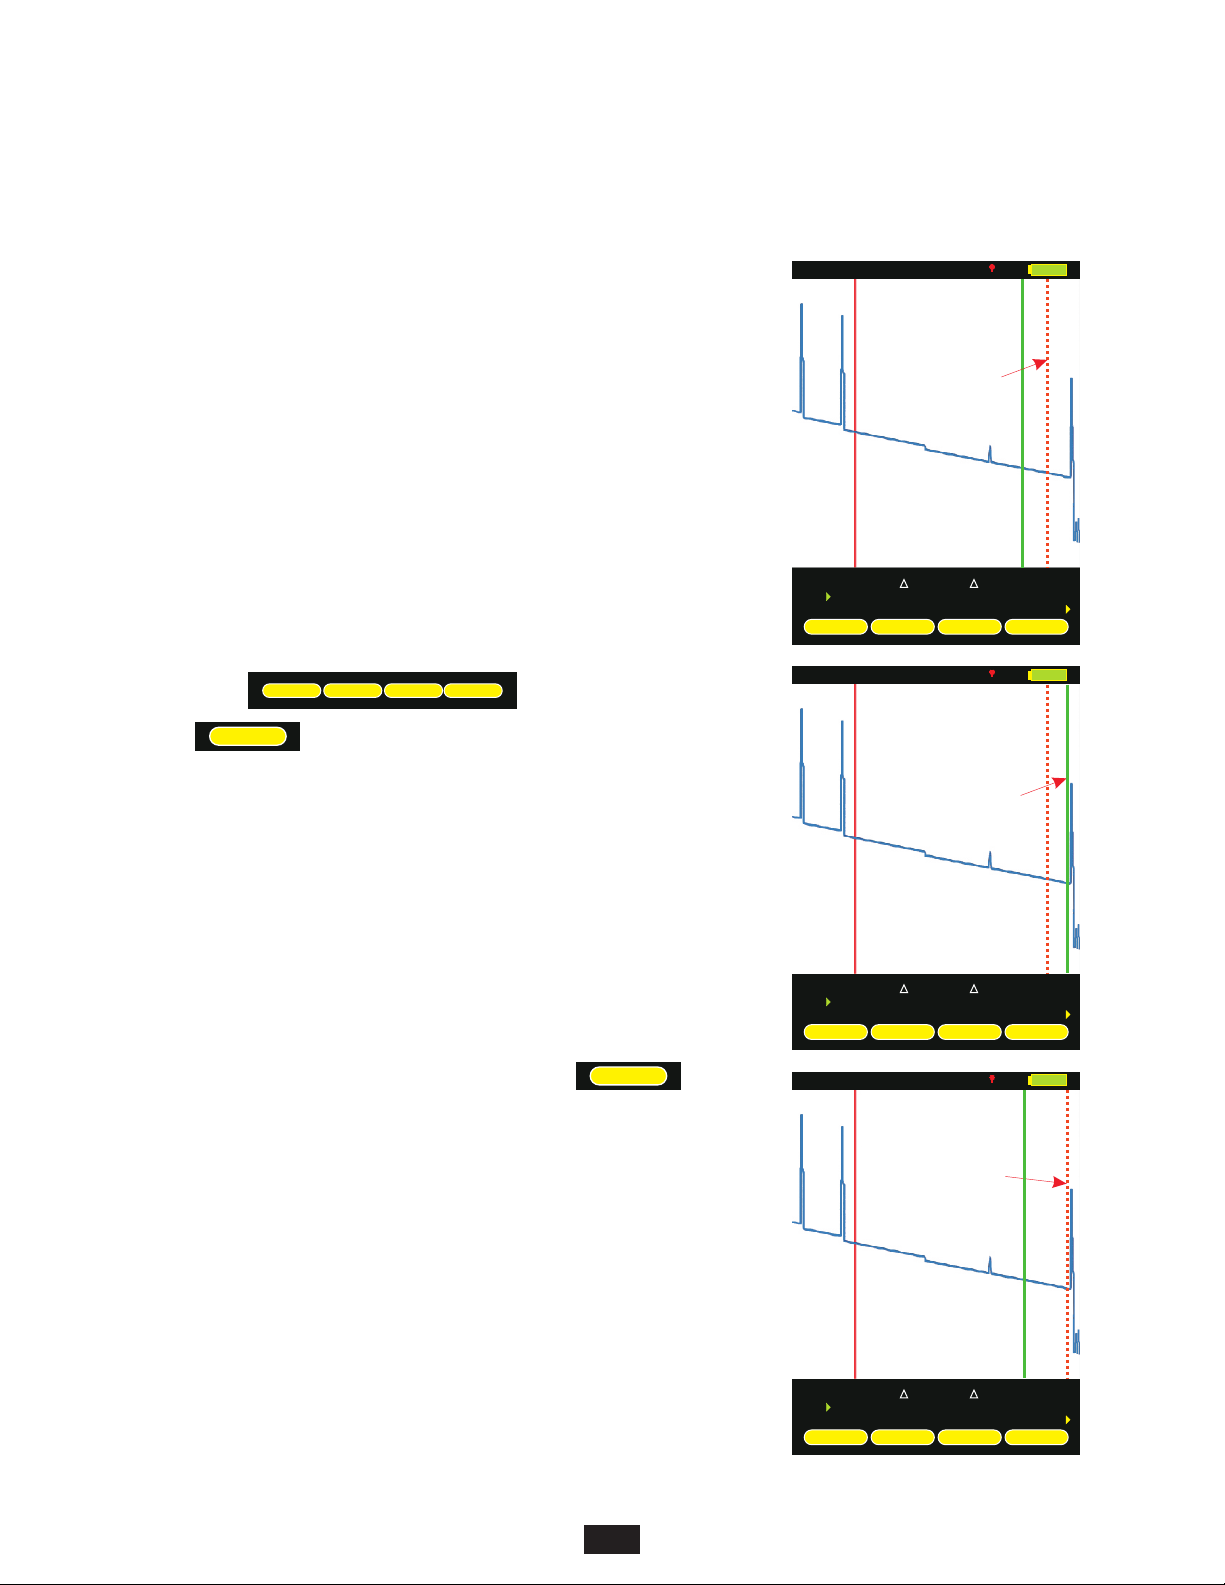
SECTION 6: OPERATION/MAINTENANCE
MANUALLY SETTING END OF FIBER (EOF) MARKER
The OTDR marks the perceived end-of-fiber event with an dotted line.
orange
However, in certain cases, the “end-of-fiber” event may be mis-marked due to factors such
as echoes that occur in the noise area of the trace.
The EOF function gives technicians a way to manually set the EOF marker to the correct
position.
SETTING EOF MARKER
Select either one (and only one) of the cursors to be the active cursor (in this example, the
green
cursor is the only active cursor).
Move this active cursor to the actual EOF position. This cursor should be positioned on the
backscatter immediately where the actual EOF event occurs.
Press the Enter key until the following menu appears at the bottom of the OTDR display:
EOFEVENTS
MENU
Press key once. A “SET END OF FIBER” message will indicate that the
EOF
VFL
OTDR is ready to re-position the EOF cursor.
(If the active cursor is not yet set in the correct EOF position, the technician can move the
active cursor at this time.)
Fiber #x
1550nm
06086m
20226m
24718m
SET END OF FIBER
14140dB2.43x
AUTO
incorrect end of
fiber position
L mx
AUTO
active cursor set
to correct EOF
3.34x
H
H
RFL dBx
-81.00x
ENTER
VFLMENUEOFEVENTS
Once the active cursor is in the correct EOF position, pre ss key again to
EOF
re-position the EOF cursor.
40
1550nm
EVENTS
Fiber #x
1550nm
06086m
20226m
24718m
06086m
20226m
24718m
L mx
14140dB2.43x
L mx
14140dB2.43x
3.34x
AUTO
EOF cursor now
in correct position
3.34x
H
RFL dBx
-81.00x
ENTER
VFLMENUEOF
RFL dBx
-81.00x
ENTER
VFLMENUEOFEVENTS
Page 41

SECTION 6: OPERATION/MAINTENANCE
CLEANING THE OPTICAL PORTS
This cleaning procedure applies to the OTDR port on the OWLTrek II OTDR.
Required Accessories:
= Isopropyl alcohol (91% or better)
= In-adapter fiber optic cleaning accessories, such as 2.5mm cleaning swabs or 2.5mm HUXCleaner™
= In-adapter fiber optic inspection scope (LCD-based, 200x magnification or greater recommended)
= Compressed Air (optional)
Below are procedures for “wet” cleaning and “dry” cleaning. For best results, a combination of these cleaning methods is
recommended.
IMPORTANT SAFETY NOTE: WHEN INSPECTING AN OPTICAL PORT, NEVER LOOK DIRECTLY OR INDIRECTLY
INTO THE PORT WITHOUT SUFFICIENT EYE PROTECTION. THE OPTICAL PORT MAY BE ENERGIZED WITH
POWERFUL INVISIBLE RADIATION THAT IS HARMFUL TO THE HUMAN EYE.
INVISIBLE LIGHT IS ESPECIALLY DANGEROUS SINCE THE EYE IS NOT AWARE OF EXPOSURE TO HARMFUL
INVISIBLE ENERGY, AND BECOMES INCREASINGLY DANGEROUS WITH PROLONGED EXPOSURE.
TO AVOID ACCIDENTAL EXPOSURE TO OPTICAL ENERGY, IT IS HIGHLY RECOMMENDED TO POWER OFF
EQUIPMENT BEFORE INSPECTING OPTICAL PORTS.
IT IS ALSO HIGHLY RECOMMENDED TO USE AN LCD-BASED FIBER INSPECTION SCOPE, WHICH CAN INSPECT
OPTICAL PORTS AND FIBER ENDFACES WITHOUT EXPOSING THE EYE TO HARMFUL OPTICAL RADIATION.
“WET” CLEAN PROCEDURE
Wet the tip of a 2.5mm cleaning swab with isopropyl
alcohol.
Carefully insert the wet tip of the swab into the optical
port.
Clean out the optical port according to the directions
provided with the swabs.
Blow dry the optical port with the compressed air. If
compressed air is not available, allow 2 minutes for
the alcohol to evaporate.
If the port is still dirty, another round of cleaning will be
necessary. You may also want to use a combination of “wet”
and “dry” cleaning to achieve best results.
“DRY” CLEAN PROCEDURE
Carefully insert a dry 2.5mm cleaning swab or a
2.5mm HUXCleaner™ into the optical port.
Clean out the optical port according to the directions
that came with the cleaning accessories.
Inspect the optical port with the in-adapter fiber optic
inspection scope to ensure the port is clear of
obstructions.
Inspect the optical port with the in-adapter fiber optic
inspection scope to ensure the port is clear of
obstructions.
If the port is still dirty, another round of cleaning will be
necessary. You may also want to use a combination of “wet”
and “dry” cleaning to achieve best results.
41
Page 42
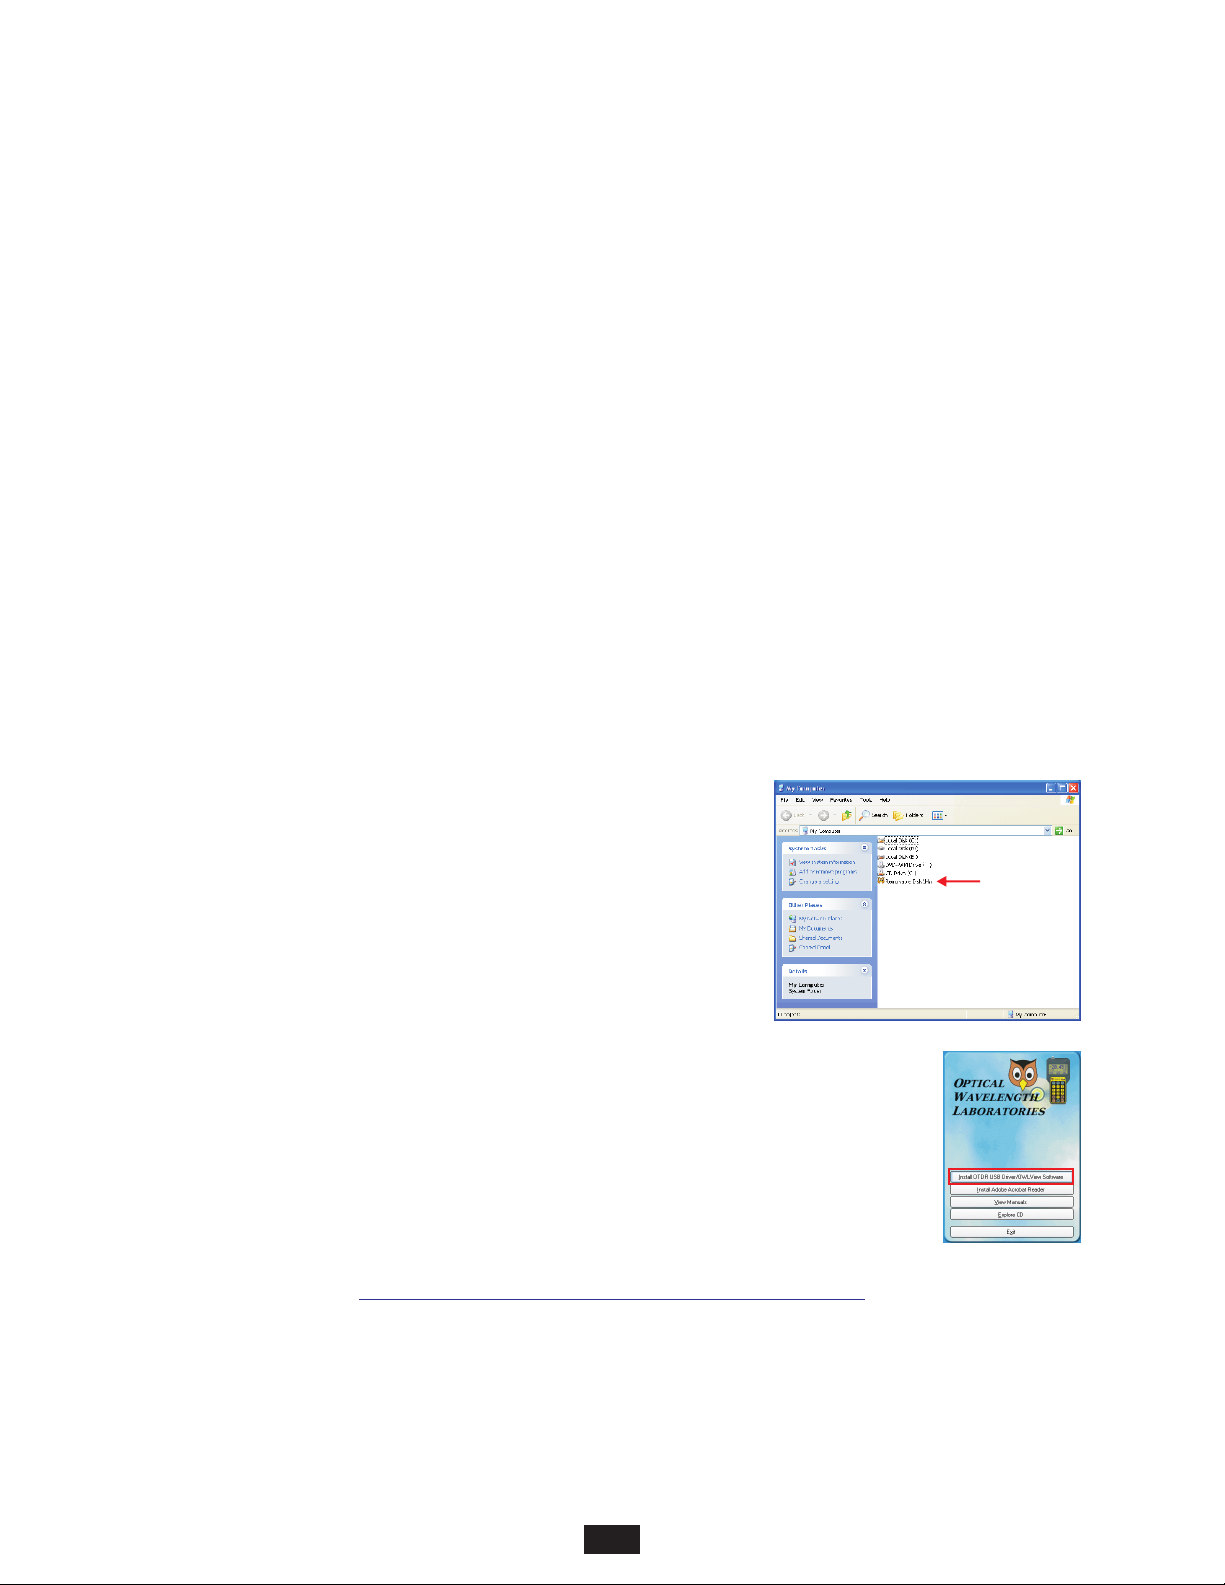
SECTION 7: OWLVIEW FOR OTDR SOFTWARE
OVERVIEW
OWLView for OTDR is a software program that is included free of charge with every OWLTrek II OTDR.
Primary functions of this software include:
– Downloading stored traces from OWLTrek II OTDRs and saving traces in native .OTD format
– View and analyze traces
– Export stored traces to SOR format (version 2)
– Import SOR files (that were previously exported with OWLView)
– Print stored traces
– View traces in real-time while OTDR is set into Live Mode
– Update firmware in OWLTrek II OTDRs
– View helpful PDF and video documentation
INSTALLING OWLVIEW FOR OTDR SOFTWARE
OWLView for OTDR can be installed onto a Windows PC or laptop from the supplied USB flash drive, or can be downloaded form
OWLs website. This installation will also install the appropriate USB driver.
TM
INSTALLING FROM USB FLASH DRIVE
1) Insert USB flash drive into a USB port on the PC or laptop (there may be a
2) Using My Computer, browse to the drive letter created when the flash drive
3) Double-click the drive letter to view the contents of the USB flash drive
4) Double-click the LaunchCD installation program
5) Click “Install OTDR USB Driver/OWLView Software button to begin the program installation.
Follow the on-screen instructions to complete the installation.
short delay while the computer installs the flash drive hardware and assigns a
drive letter to the flash drive)
Depending upon computer configuration, the flash drive may or may not run
the installation program automatically
– If the installation program runs automatically, skip to Step 5.
– If the installation program does not run automatically, continue to Step 2.
was inserted (drive letter may vary for different PC configurations)
INSTALLING FROM WEBSITE
1) Browse to OWLs website at the following location:
http://owl-inc.com/literature/sub/htm/otdr/owlview.htm
2) Click the “OWLView for OTDR Software” link to download the software.
3) Once the software in downloaded, double-click on the installation program.
Follow the on-screen instructions to complete the installation.
42
Page 43
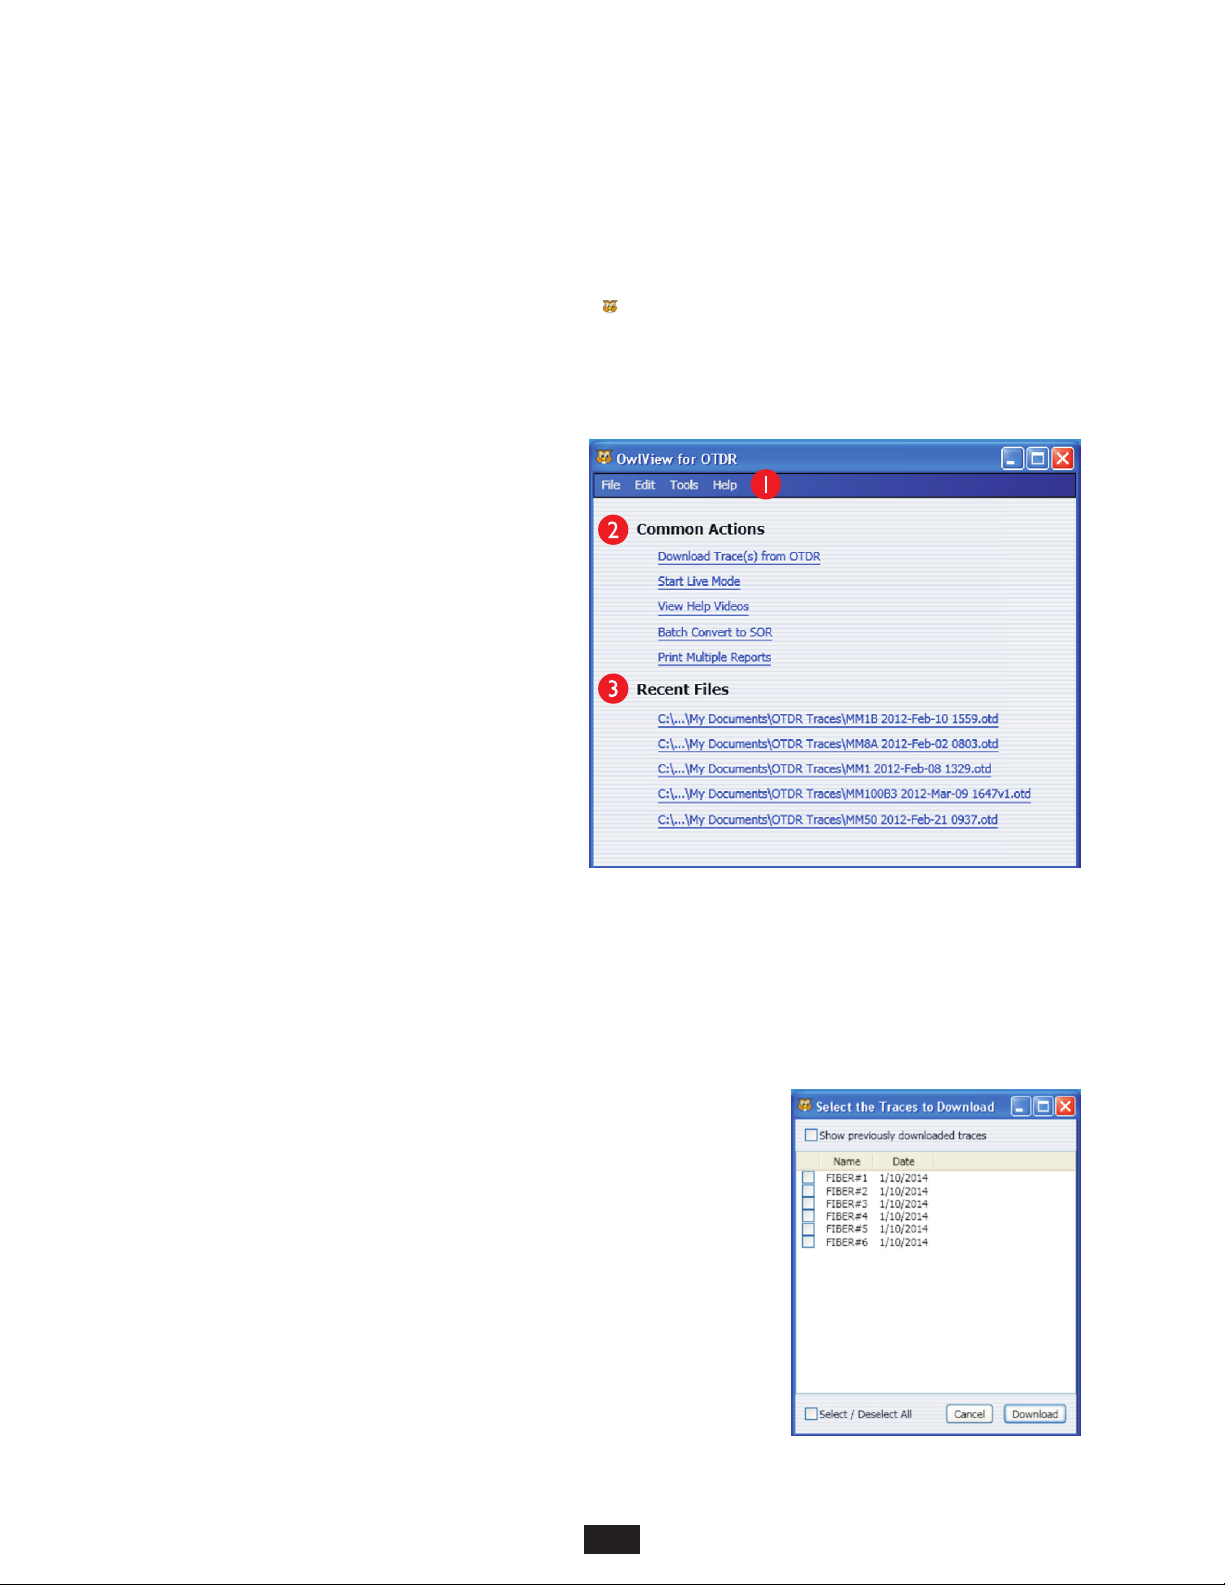
SECTION 7: OWLVIEW FOR OTDR SOFTWARE
LAUNCHING THE SOFTWARE
For Windows operating systems up to Windows 7:
For Windows 8:
TM
Start 4 Programs 4 OWL 4 OWLView for OTDR 4 OWLView for OTDR
Click Start icon. If there is no OWLView for OTDR panel, access the Apps menu.
QUICK-LAUNCH PANEL
When OWLView software is launched, a quick-launch panel
appears (as shown at right).
This panel contains three main sections:
1) traditional menu-based functions;
2) frequently-used Common Actions; and
3) recently opened trace files.
OPERATING THE SOFTWARE
DOWNLOADING TRACES FROM OTDR
1) Connect the OTDR to the PC using the supplied USB download cable.
NOTE: if prompted to install new hardware, follow the on-screen directions to complete the USB driver installation.
2) Trace download can be initiated two ways:
– Common Actions: “Download Trace(s) from OTDR”
– File menu: Download Traces...
3) The dialog box (similar to the one at right) will appear with a listing of the OTDR
4) Once traces are selected, click Download to initiate the download process.
Stored traces will automatically be saved in “My Documents” in the “OTDR Traces”
subfolder
traces that have not yet been downloaded to a PC.
NOTE: to view all traces stored in the OTDR, check the box next to “Show
previously downloaded traces”.
Select the traces to download by checking the box next to the traces.
To download all the displayed traces, check the “Select / Deselect All” box.
43
Page 44

SECTION 7: OWLVIEW FOR OTDR SOFTWARE
OPERATING THE SOFTWARE, CONT.
OPENING A STORED TRACE
1) From the trace screen, click File, Open...
The dialog box will open up to the default directory. If the traces are stored elsewhere on the PC, browse to that directory.
2) Highlight the trace name to be viewed and click “Open”, or double-click on the trace name.
The selected trace will appear in the software screen.
NOTE: only one trace may be viewed at a time.
SAVING TRACES
There are two menu options for saving traces. Traces can only be saved from the trace screen:
1) File, Save... saves the trace with the same file name in the same location.
NOTE: the File, Save... option will be disabled (”grayed out”) unless information has been added to Miscellaneous Info
2) File, Save As... allows the user to save the trace with a different file name and/or in a different location.
PRINTING TRACES
To print the currently viewed trace:
1) Click File, Print...
2) Select the printer from the “Print” dialog box
3) Click Print
NOTE: the printout will print exactly what is shown in the trace area; i.e. if the trace was zoomed in on, only the part of the trace that is
zoomed in on will print. Clicking File, Print Preview will show a preview of the trace printout.
Consult the Zoom In/Out section in this manual for more information about viewing the complete trace in the trace area.
PRINTING MULTIPLE TRACES
NOTE: printing multiple traces must be activated from the Common Actions screen. Close all traces before attempting to print
multiple trace reports.
1) From the “Common Actions” screen, click the Print Multiple Reports hyperlink
2) Browse to the folder where the trace files to be printed are located
NOTE: all the traces to be printed simultaneously with this function must be located in the same location.
3) Select all of the traces to be printed
NOTE: hold the SHIFT key to select/deselect a range of traces; hold the CTRL key to select/deselect traces one by one; or press
CTRL+A to select all traces in the folder. When using CTRL+A, de-select any additional folders that may have been highlighted.
4) Click Open to begin the print job
NOTE: when printing a large number of traces at once, a warning screen may appear. It is recommended to limit print jobs to less than
240 traces at a time.
44
Page 45
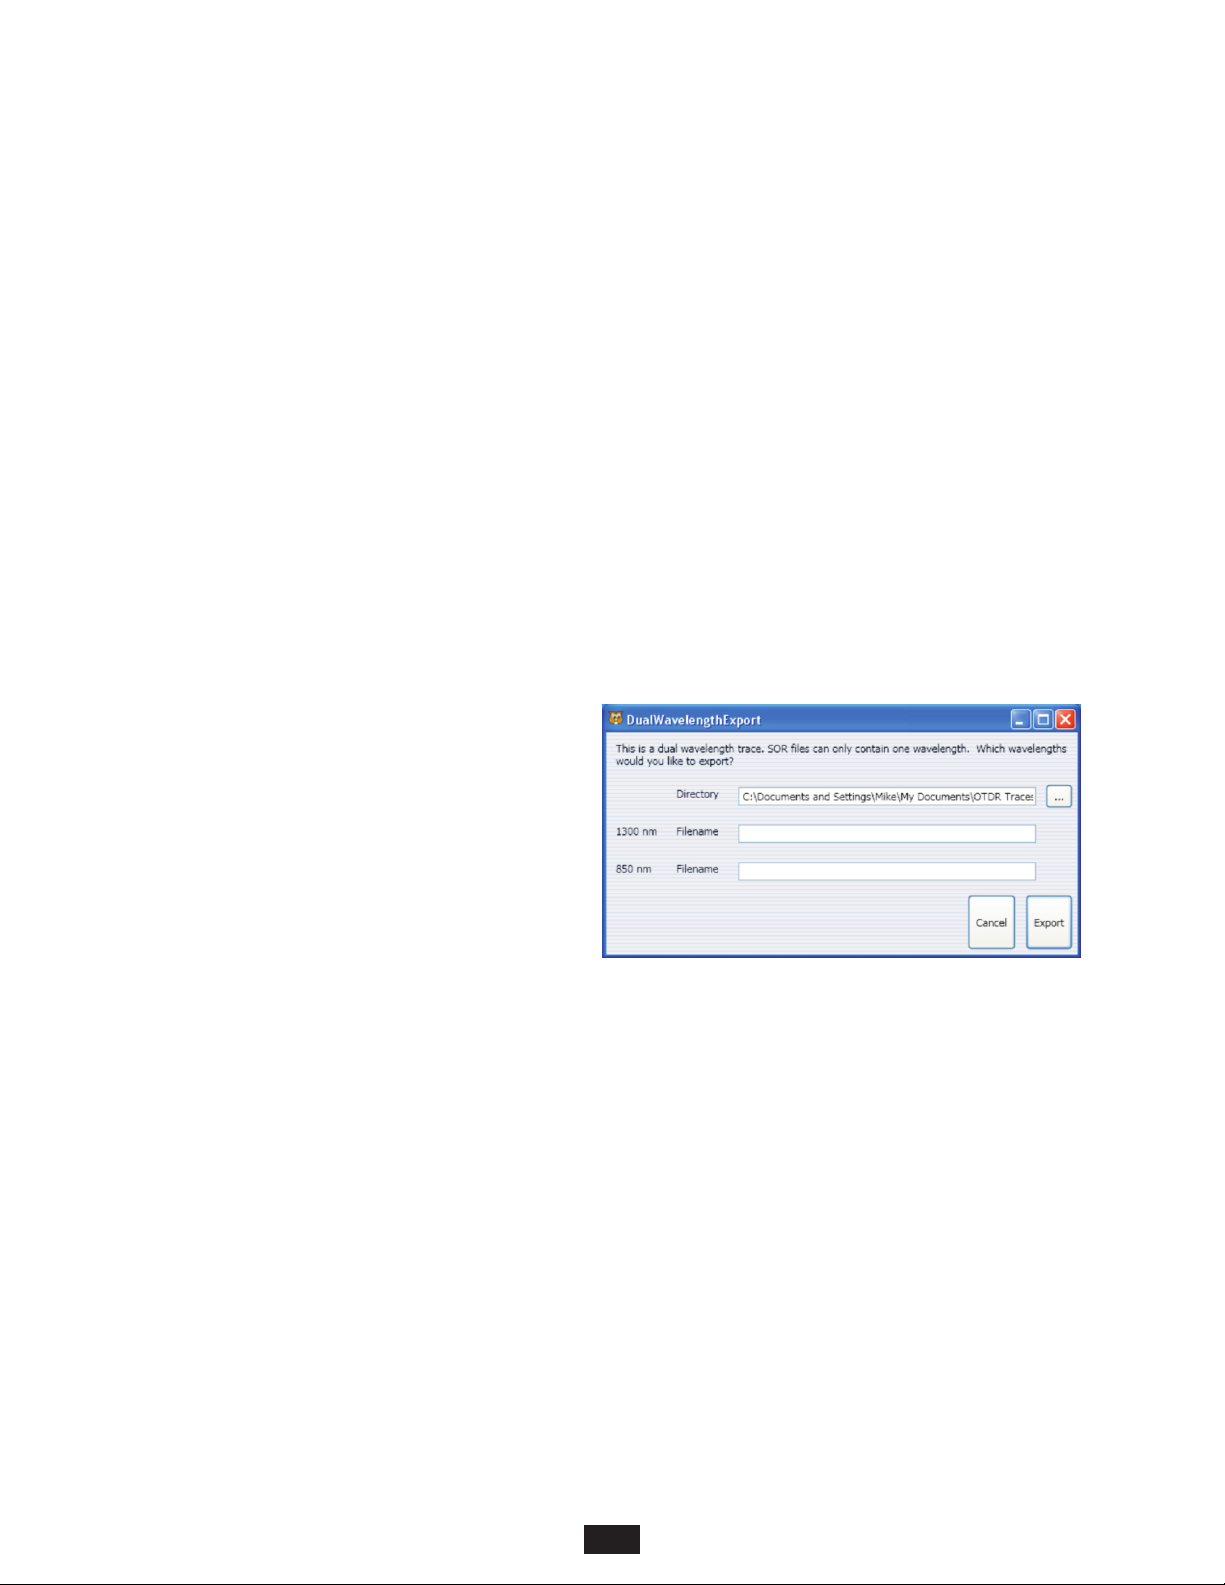
SECTION 7: OWLVIEW FOR OTDR SOFTWARE
OPERATING THE SOFTWARE, CONT.
CLOSING TRACES
To close the currently viewed trace:
1) Click File, Close
WORKING WITH SOR FILES
OWLView software can export native .OTD files into an industry-standard file format called SOR version 2. Non-OWL trace viewing
software may be able to open these SOR files for trace comparison.
EXPORT SOR FILES
To export the currently viewed trace into SOR format:
1) Click File, Export SOR file...
2a) If the trace contains one wavelength, browse to the folder where the SOR file should be stored, rename the file if necessary,
2b) If the trace contains two wavelengths, a separate
then click Save
SOR file will be created for each wavelength.
A dialog box will appear allowing the user to choose a
directory, as well as a different filename for the two
different SOR files to be created.
Click Export to save the files.
BATCH EXPORT SOR FILES
OWLView contains a function that allows a large number of .OTD files to be exported simultaneously. However, this function is limited
to traces with one wavelength only. Dual-wavelength traces must be exported one at a time.
1) From Common Actions, click the Batch Convert to SOR hyperlink
2) Browse to the folder where the SOR files will be stored
3) Click Open
IMPORT SOR FILES
NOTE: only SOR files exported with OWLView software can be imported with this function.
1) Click File, Import SOR File...
2) Browse to the folder that contains the SOR file to be imported
3) Click Open
45
Page 46
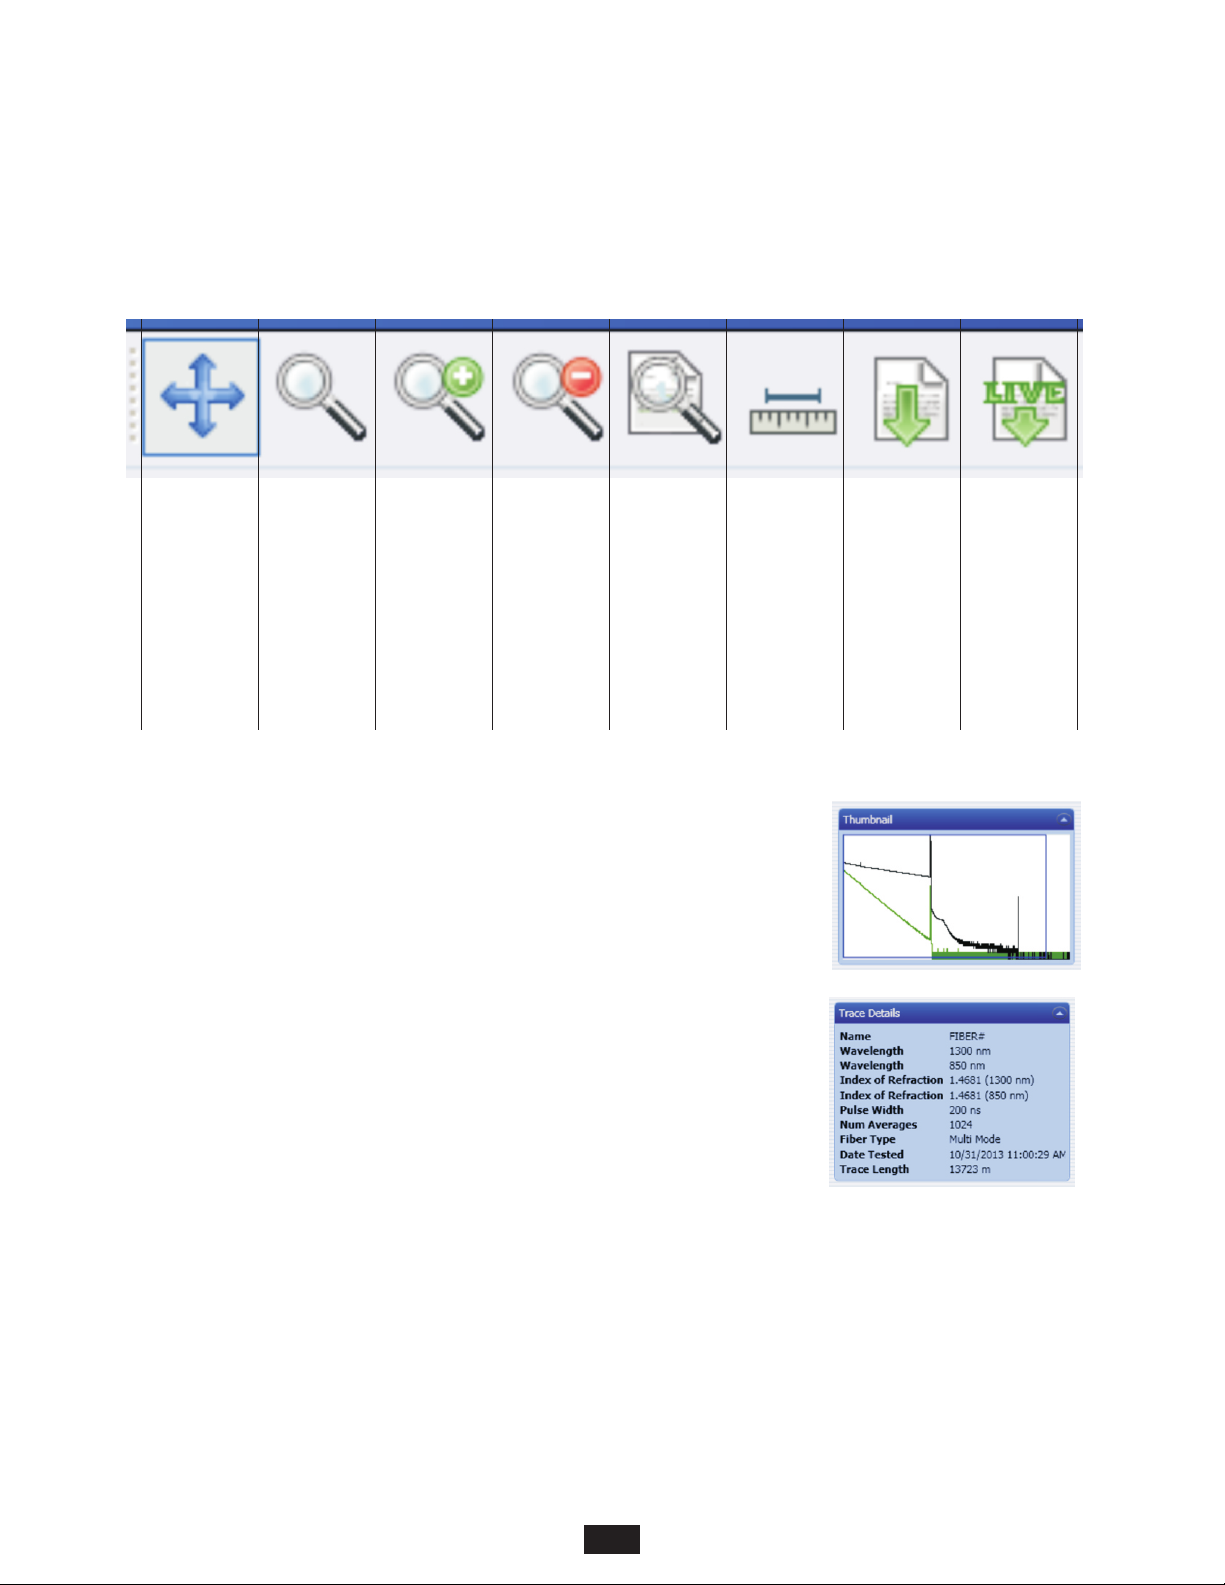
SECTION 7: OWLVIEW FOR OTDR SOFTWARE
WORKING WITH TRACES
BUTTON CONTROLS
123412341
PAN
Click and drag
using the
mouse will pan
the trace
screen
up/down and
left/right
RECTANGLE
ZOOM
Drag a
rectangle on
the trace
screen to
automatically
zoom into the
area viewed in
the rectangle
1234 1234
ZOOM IN
Click to zoom
in on the trace
screen in small
increments
1234 1234
ZOOM OUT
Click to zoom
out on the trace
screen in small
increments
FIT TO
SCREEN
Resets the
trace screen to
full zoom out
THUMBNAIL VIEW
Shows a small thumbnail of the overall OTDR trace
TRACE DETAILS
Contains information about the trace parameters used for the OTDR trace:
Name Name of trace entered when trace was stored
SHOW/HIDE
CURSORS
Shows or hides
the cursors
used for trace
analysis
DOWNLOAD
TRACES
Download
traces from the
OTDR
1234 1234
LIVE MODE
View the OTDR
trace in real-
time as it
changes on the
OTDR itself
(more on this
function later in
the manual)
Wavelength (81) First test wavelength
Wavelength (82) Second test wavelength (if applicable)
Index of Refraction (81) Index of refraction for first wavelength
Index of Refraction (82) Index of refraction for second wavelength (if applicable)
Pulse Width Shown in nanoseconds (pulse width in OTDR is shown in meters; conversion factor is 10ns per meter)
Number of Averages Sampling rate
Fiber type Type of fiber tested
Date of Test Date that the fiber was tested
Trace Length Shows the total trace length, including the noise area of the trace
46
Page 47
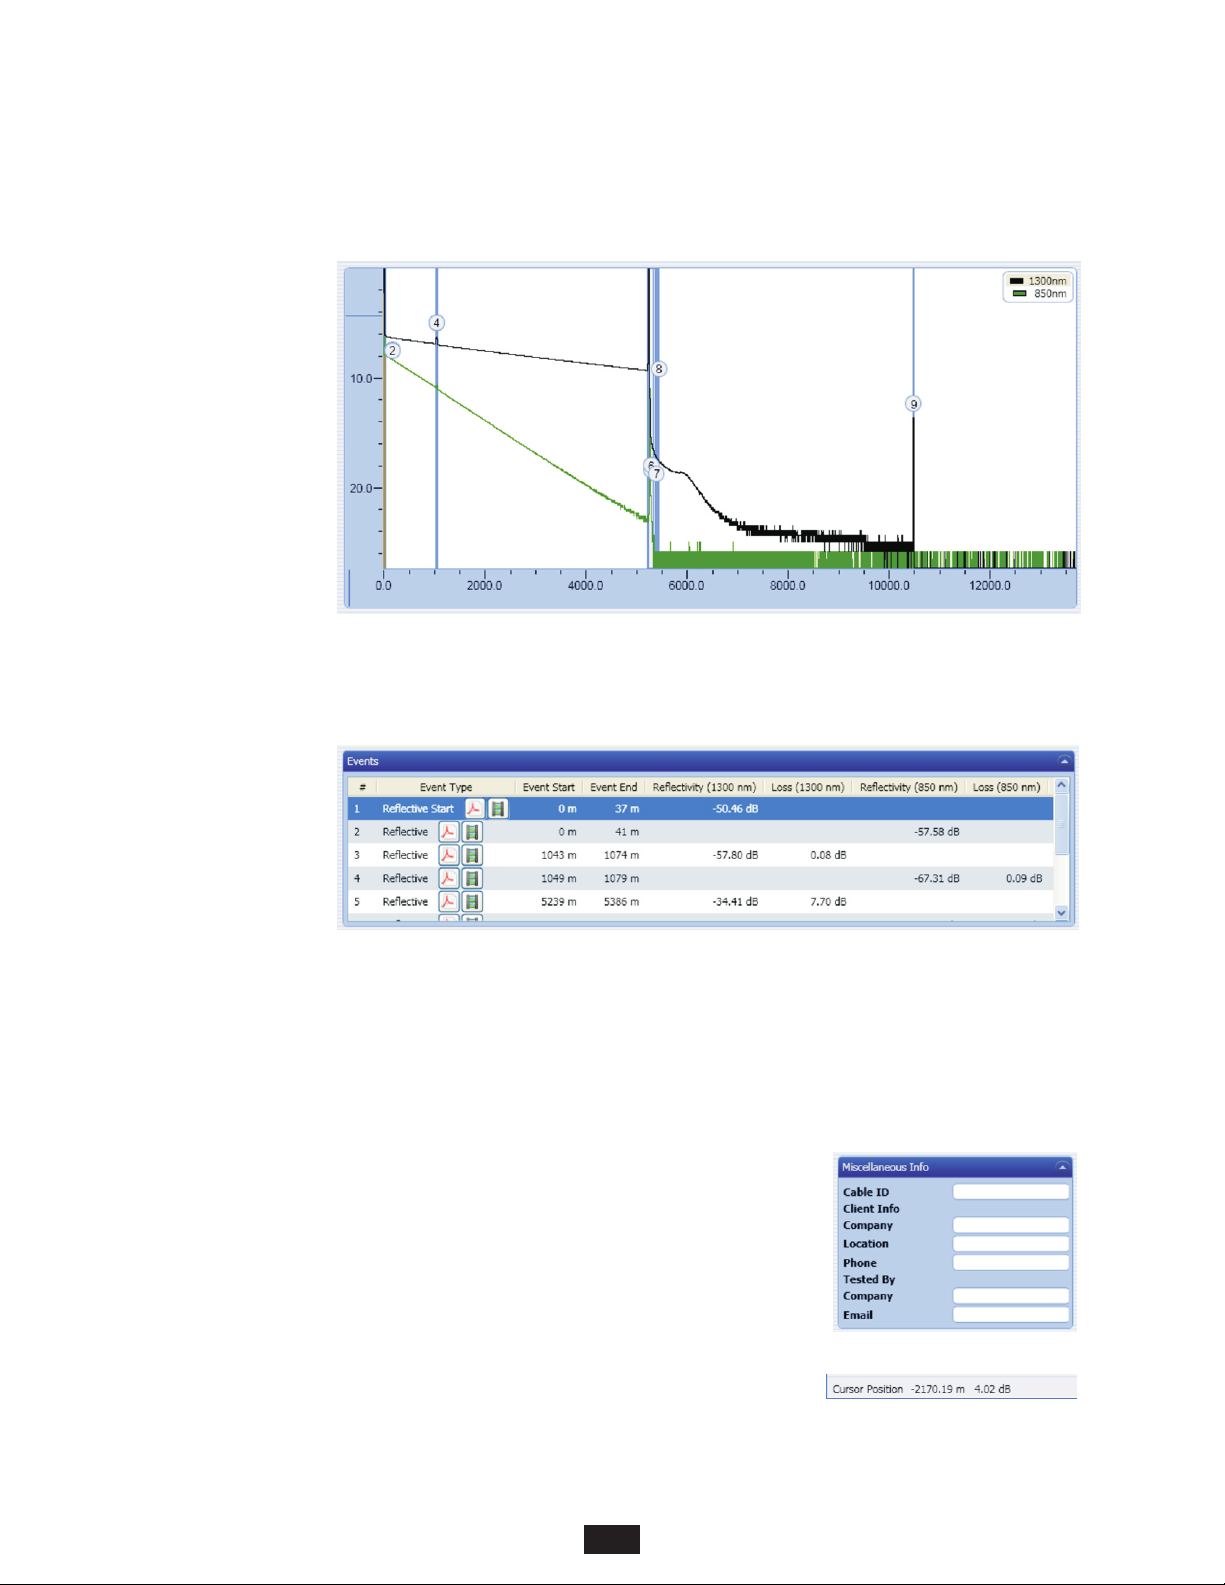
SECTION 7: OWLVIEW FOR OTDR SOFTWARE
WORKING WITH TRACES, CONT.
TRACE SCREEN
Shows the following
information:
OTDR trace(s). Each
wavelength is assigned a
different color
Wavelength legend.
Indicates the color of
each wavelength trace.
Events. Corresponds to
the event numbers in the
event table.
Distance. Shown in
either meters or feet on
the X axis.
Power level. Shown in dB on the Y axis; 0 dB (a.k.a. origin) can be set to either top or bottom of Y axis.
Cursors. When cursors are activated, they will appear on the trace screen as red and green vertical lines.
EVENT TABLE
Shows the follo wing
information:
Event #. Shows the
e v e n t n u m b e r ;
corresponds to the event
number shown on the
trace screen.
Event Type. Shows the type of event: reflective, non-reflective, reflective start, reflective end, multiple reflective, etc.
Event Start. Shows the distance to the start of the event (in either meters or feet).
Event End. Shows the distance to the end of the event (in either meters or feet).
Reflectivity. Also called reflectance; indicates how much light reflects back towards the OTDR (applies to reflective events only).
Loss. Also called attenuation; indicates how much loss occurs through the event.
MISCELLANEOUS INFO
Allows users to enter custom information about the trace.
STATUS BAR
Shows current distance and dB at the mouse cursor position.
47
Page 48
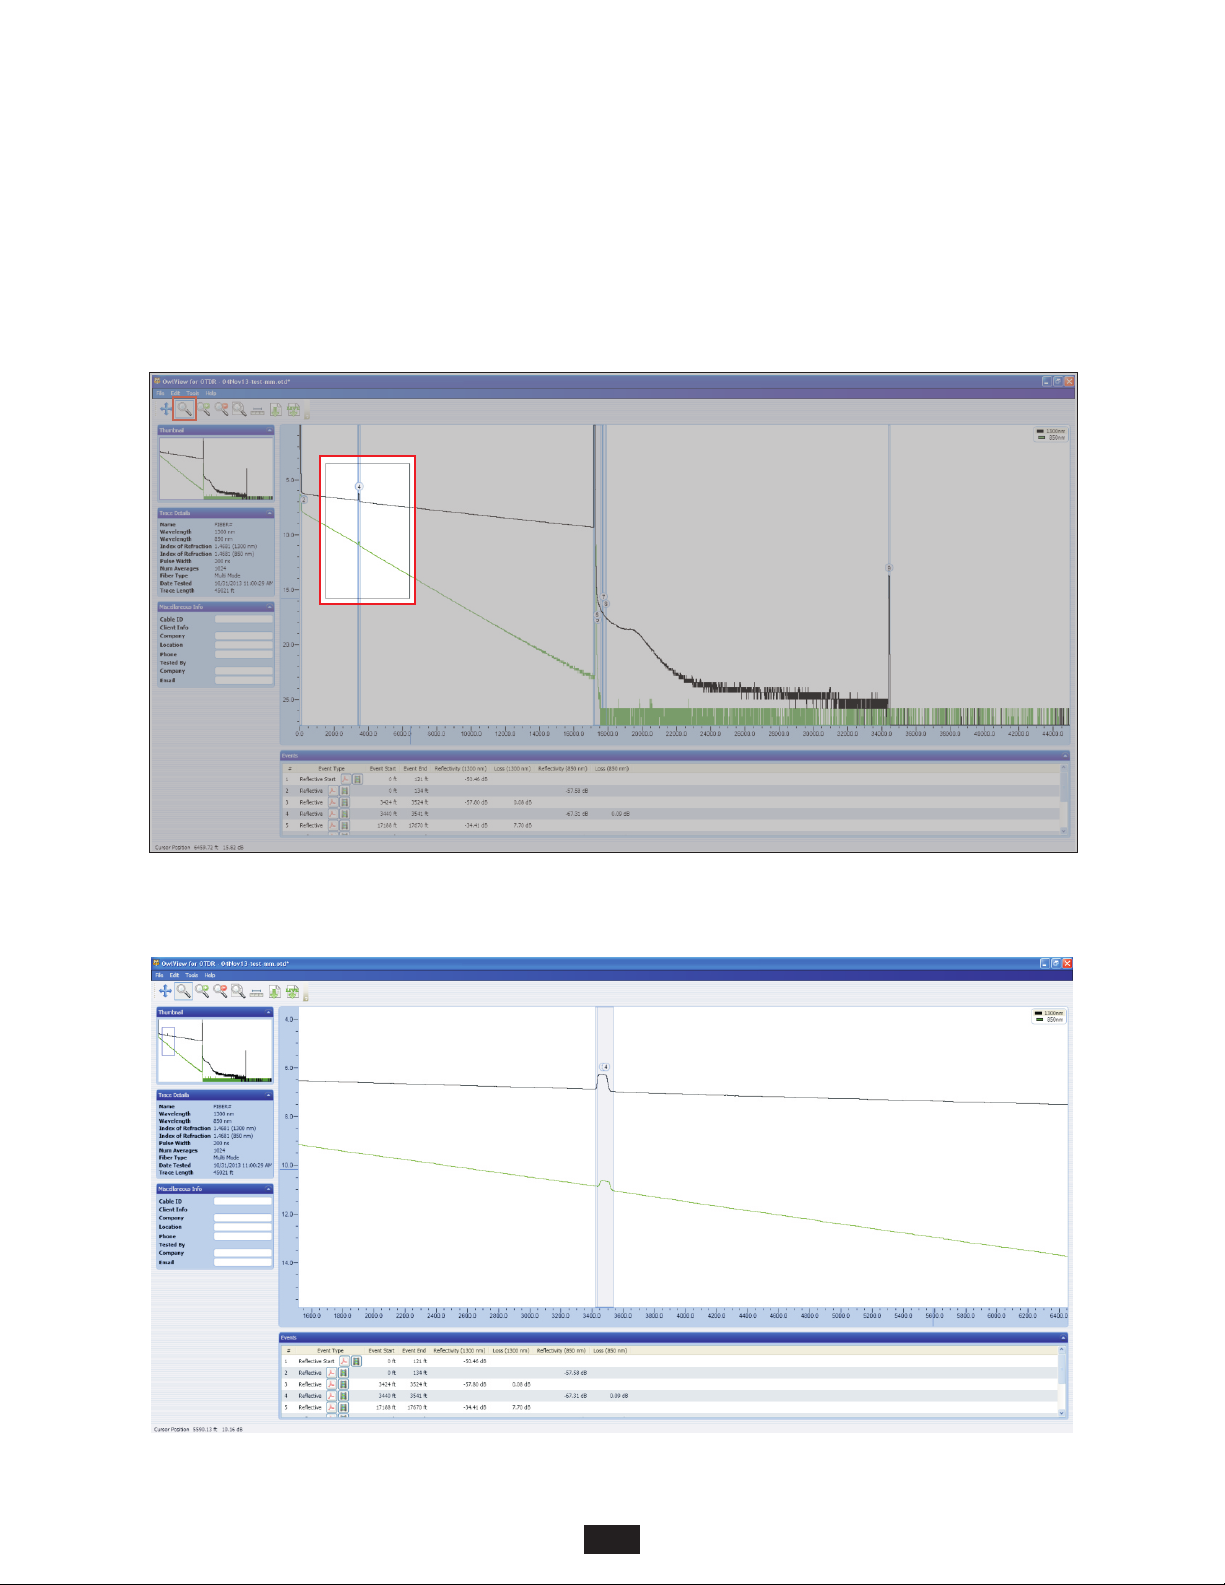
SECTION 7: OWLVIEW FOR OTDR SOFTWARE
WORKING WITH TRACES, CONT.
RECTANGLE ZOOM
The rectangle zoom feature allows the user to drag a rectangle on the OTDR trace to quickly zoom in on the portion of the trace
highlighted by the rectangle. Figure 1 below shows an example of rectangle zoom.
Figure 1
The highlighted rectangle in Figure 1 is a click-and-drag operation. Once the mouse button is released, the trace area changes to
show the area of the trace produced by the rectangle (see Figure 2 below).
Figure 2
48
Page 49

SECTION 7: OWLVIEW FOR OTDR SOFTWARE
WORKING WITH TRACES, CONT.
ZOOM IN/OUT
Clicking on the ZOOM IN and ZOOM OUT buttons zoom in and out on the trace at small increments.
SHOW/HIDE CURSORS
Clicking on the SHOW/HIDE CURSOR button either shows or hides the two cursors used for event analysis.
The cursors may be moved manually by click-and-drag.
EVENT ANALYSIS / PROPER CURSOR PLACEMENT
See Section 3: TRACE ANALYSIS for more information about event analysis and proper cursor placement.
TOOLS MENU
UPDATE FIRMWARE
The firmware of the OWLTrek II OTDR may be updated at the user’s location by clicking Tools, Update Firmware 4.
NOTE: see SYSTEM INFORMATION in Section 5 in this manual for information about how to check your OTDR’s current firmware
version.
1) Click Check for Updates... (requires internet access) to download the firmware file from the OWLTrek II OTDR firmware
2) Connect the OWLTrek II OTDR to the PC via the USB download cable.
3) Click From File... then browse to the location where the firmware update file was saved to the user’s PC.
4) Click Open to begin the firmware update
update webpage onto the user’s PC.
CHANGE LENGTH UNITS
Click Tools, Meters to view the length measurements in meters.
Click Tools, Feet to view the length measurements in footage.
The cursors may be moved manually by click-and-drag.
INVERT Y AXIS
HELP MENU
The Help menu contains links to helpful videos and PDF files, as well as information about OWLView for OTDR software.
49
Page 50
SECTION 8: APPENDICES
SPECIFICATIONS
Model #:
Model #:
Fiber Type:
Output Wavelength:
Dynamic Range (SNR=1) :
Distance Range :
Event Dead Zone :
Attenuation Dead Zone :
Maximum Data Points:
Data Point Spacing:
Pulse Width:
Index of Refraction:
Distance Accuracy:
Number of Stored Traces:
1: All price shown are in US Dollars (USD). List price is shown for US customers only. Prices outside the US may vary based on
individual countries’ import duties and taxes, currency conversion, and other value added charges.
2: Using maximum pulse width
3: Width measured 1.5dB down on each side of a reflective event using 1 meter pulse width
4: Distance from event beginning to within 0.5dB where backscatter resumes using 1 meter pulse width
5: Out to furthest reflective event
2
5
3
4
Up to 64km: 1 + (distance in meters/10000) / Over 64km: 2 + (distance in meters/10000)
WTO2-M83
Multimode
850 nm
27 dB
12 miles (20 kilometers)
1 meter
1, 2, 5, 10, 20, 50, 100 meters
Maximum trace distance: up to 200 / Minimum trace distance: 3000+
General Specifications
Display Type: High-resolution Color LCD
Display Size: 2.8” diagonal
Battery Type: Lithium Polymer
Battery Life: up to 20 hours normal usage
Dimensions: 2.87” x 4.42” x 1.25”
Weight: 10 ounces (284 g)
:
Model #
Visual Fault Locator Specifications
Output Wavelength: 650nm
Output Power: 1 mW
Operating Mode: CW / Flash
Optical Specifications
1300 nm
29 dB
Singlemode
1550nm
23 dB
2 meters (typical)
5 meters (typical)
64000
1.4000 to 1.6000
1310 nm
28 dB
80 miles (128 kilometers)
Up to 64 km: 1 meter / Over 64 km: 2 meters
x
1, 2, 5, 10, 20, 50, 100, 200, 500, 1000 meters
x
Optical Power Meter Specifications
Photodetector: InGaAs
Connector: LC
Fiber Type: Multimode / Singlemode
Wavelengths: 850, 980, 1300, 1310,
Accuracy: ±0.15 dB
Resolution: 0.01 dB
Measurement Units: dBm / dB
Measurement Range: +5 to -50 dBm (typical)
1490, 1550, 1625
(varies with wavelength)
WTO2-S35
Singlemode
1550 nm
27 dB
MAINTENANCE INFORMATION
Repair. Repair of this unit by unauthorized personnel is prohibited, and will void any warranty associated with the unit.
Battery Replacement. The OWLTrek II contains an internal Lithium Polymer battery. If the battery requires service, the device must
be sent in to OWL. Unauthorized attempts to service the battery will void the product warranty.
Cleaning. For accurate readings, the optical connector port on the OWLTrek II and the connector on the patch cable should be
cleaned prior to attaching them to each other. Minimize dust and dirt buildup by replacing the dust caps after each use.
Warranty. The OWLTrek II comes standard with a two-year factory warranty, which covers manufacturer defect and workmanship
CONTACT INFORMATION
Address:
Optical Wavelength Laboratories, Inc. Internet:
N9623 US Hwy 12
Whitewater, WI 53190 OWL-INC.COM
Phone:
262-473-0643
50
 Loading...