

Page 1

Lab Manual - Student Edition
Page 2

College Physics for APⓇ Courses
Lab Manual
Student Version
Page 3

PAPERBACK BOOK ISBN-13 9781711493350
ORIGINAL PUBLICATION YEAR 2020
10 9 8 7 6 5 4 3 2 1
OpenStax
Rice University
6100 Main Street MS-375
Houston, Texas 77005
To learn more about OpenStax, visit https://openstax.org.
Individual print copies and bulk orders can be purchased through our website.
©2020 Rice University. Textbook content produced by OpenStax is licensed under a Creative Commons Attribution
4.0 International License (CC BY 4.0). Under this license, any user of this textbook or the textbook contents herein
must provide proper attribution as follows:
● If you redistribute this textbook in a digital format (including but not limited to PDF and HTML), then you must
retain on every page the following attribution: “Access for free at openstax.org.”
● If you redistribute this textbook in a print format, then you must include on every physical page the following
attribution: “Access for free at openstax.org.”
● If you redistribute part of this textbook, then you must retain in every digital format page view (including but
not limited to PDF and HTML) and on every physical printed page the following attribution: “Access for free at
openstax.org.”
● If you use this textbook as a bibliographic reference, please include
https://openstax.org/details/books/biology-ap-courses in your citation.
For questions regarding this licensing, please contact support@openstax.org.
Trademarks
The OpenStax name, OpenStax logo, OpenStax book covers, OpenStax CNX name, OpenStax CNX logo, OpenStax
Tutor name, Openstax Tutor logo, Connexions name, Connexions logo, Rice University name, and Rice University
logo are not subject to the license and may not be reproduced without the prior and express written consent of Rice
University.
2
Page 4

OPENSTAX
OpenStax provides free, peer-reviewed, openly licensed textbooks for introductory college and Advanced Placement®
courses and low-cost, personalized courseware that helps students learn. A nonprofit ed tech initiative based at Rice
University, we’re committed to helping students access the tools they need to complete their courses and meet their
educational goals.
RICE UNIVERSITY
OpenStax, OpenStax CNX, and OpenStax Tutor are initiatives of Rice University. As a leading research university with a
distinctive commitment to undergraduate education, Rice University aspires to path-breaking research, unsurpassed
teaching, and contributions to the betterment of our world. It seeks to fulfill this mission by cultivating a diverse
community of learning and discovery that produces leaders across the spectrum of human endeavor.
PHILANTHROPIC SUPPORT
OpenStax is grateful for our generous philanthropic partners, who support our vision to improve educational
opportunities for all learners.
Laura and John Arnold Foundation
Arthur and Carlyse Ciocca Charitable Foundation
Ann and John Doerr
Bill & Melinda Gates Foundation
Girard Foundation
Google Inc.
The William and Flora Hewlett Foundation
Rusty and John Jaggers
The Calvin K. Kazanjian Economics Foundation
Charles Koch Foundation
Leon Lowenstein Foundation, Inc.
The Maxfield Foundation
Burt and Deedee McMurtry
Michelson 20MM Foundation
National Science Foundation
The Open Society Foundations
Jumee Yhu and David E. Park III
Brian D. Patterson USA-International Foundation
The Bill and Stephanie Sick Fund
Robin and Sandy Stuart Foundation
The Stuart Family Foundation
Tammy and Guillermo Treviño
3
Page 5

Table of Contents
Information for the Student 5
Lab 1: Graphing Motion 9
Lab 2: Projectile Motion 18
Lab 3: Newton’s 2nd Law 23
Lab 4: Forces 29
Lab 5: Circular Motion 34
Lab 6: Hooke’s Law and Spring Energy 40
Lab 7: Impulse and Momentum 49
Lab 8: Conservation of Momentum 55
Lab 9: Simple Harmonic Motion 62
Lab 10: Rotational Motion 67
Lab 11: Mechanical Waves 73
Lab 12: Sound Waves 78
Lab 13: Electrostatics 82
Lab 14: Ohm’s Law 90
Lab 15: Resistor Circuits 97
Lab 16: Kinetic Theory of Matter 102
Lab 17: Gases 108
Lab 18: Fluid Dynamics 117
Lab 19: Thermodynamics 125
Lab 20: RC Circuits 131
Lab 21: Observations of Magnetic Fields 137
Lab 22: Quantitative Magnetism 143
Lab 23: Electromagnetic Induction 150
Lab 24: Mirrors 157
Lab 25: Geometric Optics 165
Lab 26: Light as a Particle 171
Lab 27: Double-Slit Interference and Diffraction 177
Lab 28: Atomic Physics 185
Lab 29: Models of the Hydrogen Atom 190
4
Page 6

This content was originally authored through a collaboration with the Texas Education Agency (TEA). It is presented
here with modifications, including updates to align with the 2019 Course and Exam Description for AP Biology. These
resources are available to all verified instructors free of charge at the following hyperlink:
https://openstax.org/details/books/biology-ap-courses?Instructor%20resources.
To the Student:
Congratulations on being accepted into, and having the courage to take, an Advanced Placement biology
class! You are about to delve deep into some very detailed biology concepts. This lab manual aims to help
you better understand these concepts through hands-on experiences in the laboratory. In addition, it will
challenge you to critically think about biology concepts, scientific methods, and experimental design as
part of its inquiry-based framework.
Inquiry-based learning involves challenging yourself to learn through self-discovery. Instead of simply
presenting you with facts to memorize, this manual encourages you to ask questions about the material
that you will then answer through your own exploration. By creating your own hypotheses and then
planning and carrying out your own experiments on a variety of topics in the lab manual, you will
hopefully learn biology by satisfying your own curiosity.
In this AP lab manual, the inquiry-based structure includes the following components:
1. Pre-assessment section. This section contains a list of questions that you should answer before
starting each activity. These are meant to get you thinking about the main concepts of each lab.
The pre-assessment questions are designed to connect the concepts in each lab to your
experiences in daily life. Whether you realize it or not, you observe biology constantly in the world
around you. Therefore, you are likely familiar with more biology topics than you realize! The
pre-assessment questions are meant to tap into the biology knowledge you already have and
apply it to what you will learn in each lab. As a result, your answers to these questions may not be
graded and you will benefit greatly by discussing your answers as a class. This also allows your
teacher to measure how familiar you and your classmates are with the material.
2. Structured Inquiry. In this section, you will be introduced to an experimental system by doing a
well-laid out experiment with detailed steps. This section is meant to guide you in using the
equipment in a “safer” activity before planning and performing an entire experiment. However,
you will still be posing questions, predictions, and hypotheses in the structured inquiry. You will
also critically think about how to achieve the most accurate and reliable results during the
structured inquiry in preparation for creating your own experiments in the guided inquiry.
3. Guided Inquiry. In the guided inquiry, you will use the familiarity you gained during the structured
inquiry to perform your own self-investigation. The experimental setup of the guided inquiries is
often identical to that used in the structured inquiry. Therefore, you will be working with
equipment and methods that you have already tried in the structured inquiry. This time, you will
pick a variable to study, create a hypothesis, and fully design an experiment to test your
hypothesis. You will determine which equipment and methods you should use to collect accurate
and precise data.
5
Page 7

Once you have planned your experiment, be sure to have your plan approved by your teacher, who
will also ensure that your plan is safe and appropriate for the equipment available. Finally, you will
analyze your own data and make conclusions based on your experimental evidence. If time allows, you
will then refine and re-run your experiments or test additional hypotheses that you find interesting. In
many ways, the guided inquiry step is meant to engage you in the same processes that scientists have
used to discover information about our world and universe!
Components of Structured and Guided Inquiry Sections
To ensure that an inquiry-based approach is implemented in each activity, both the structured and
guided inquiries also contain each of the following steps at least once:
Hypothesize/Predict: This is where you will be creating hypotheses, which are questions or predictions
about what will happen during an experiment. Be sure that your hypotheses are clear, specific, and
testable.
Good hypothesis: The volume of water in a container will be higher when a 2-gram mass is added
compared to when a 1-gram mass is added.
Poor hypothesis: The volume of water in this experiment will increase as larger objects are added.
Good hypothesis: The speed of a vehicle traveling down the 30ᵒ ramp will be lower than the speed of the
vehicle traveling down the 60ᵒ ramp.
Poor hypothesis: The vehicle will travel fast down the ramp with the greater amount of slant.
Student-led Planning: Each inquiry contains at least one step where you and your lab partners will plan
how to properly conduct your experiment. During the Structured Inquiry, you will generally plan proper
techniques for getting the best results possible using the available equipment and described methods.
As with many things in life, two or more heads are often better than one, and you and your group
members should come to a consensus on a plan before proceeding. This will lay the groundwork for the
Guided Inquiry; you and your group will need to plan an entire experiment in this step.
Critical Analysis: This step typically occurs near the end of each inquiry. Here you will critically analyze
your results, judge their validity, and explain why your hypotheses were supported or not supported by
your results. You will also suggest ways that your experimental methods could have been improved to
get more accurate or precise data as well as determine new questions to ask related to your results.
A Note About Your Notebook
As part of the challenge of taking an AP course, this lab manual does not contain data tables where you
record your findings. Therefore, you will be required to design your own tables, answer assessments,
and do any other note-taking in a separate notebook. You should use the same notebook for biology lab
throughout the year. This will allow you to easily refer back to previous labs when you need to reference
earlier content. Do not put non-biology content in your biology notebook, as your teacher may collect
and grade your notebook throughout the year.
6
Page 8

Components of a Lab
Main introduction:
Each lab contains an introductory section under the title. This introduces the “big picture” concepts of
the lab as well as how they connect to everyday life. They will also introduce the pioneering physicists
and experiments that led to our current knowledge of each lab topic. Relevant equations that you will
use in the labs are also introduced here, including definitions of their variables. Many of the labs involve
measuring the value of these variables so that you can later perform your own calculations. Please read
the lab and activity introductions carefully before your lab period. Then, before the lab starts, ask your
teacher about any concepts of which you are unsure.
In this lab you will learn
This section presents learning objectives for the lab. These are the “take away points” that you should
be able to explain or perform after doing the activities. It is helpful to read these objectives before each
lab to prime yourself for what you will learn. It is then helpful to reread these at the end of each lab to
ensure that you have achieved all of the learning objectives.
Activities:
Each lab is divided into 2-3 activities. Please note that your teacher may or may not have you perform all
activities in a given lab, so pay close attention to your teacher’s instructions throughout the lab.
Safety precautions:
These bullet points list important safety issues that will prevent injury to yourself or your classmates
during the lab activities. Each activity has its own safety precautions section. Please read and
understand all safety precautions before beginning each activity!
For this activity you will need section:
This section lists all of the materials needed for each activity. Before you start the lab, make sure that
you can identify all items on this list. Also, pay close attention to your teacher’s instructions, as you may
be using different equipment for these labs than those on this list.
Activity introduction:
These are short introductions relevant to specific activities. As with the main introduction, the activity
introductions may contain formulas, equations, or other background information needed to successfully
carry out and understand the activities. As with the main introduction, please read these introductions
carefully before your lab period. Then, before the lab starts, ask your teacher about any concepts of
which you are unsure.
Process steps:
These are the steps you will perform to carry out the activities. Please read through all of the process
steps and setup diagrams before starting Step 1. Ask your teacher if there are any steps you don’t
understand prior to starting. This will help you perform the activities correctly the first time, preventing
the need to redo activities or having to leave your laboratory period with unusable data.
7
Page 9

Assessments:
The assessment sections provide questions that test your knowledge of the lab material. Your teacher
will instruct you on how to submit answers to the assessments for grading.
College Board® (CB) Standard Alignment:
College Board® standards are summarized in a table format at the beginning of each lab. The College
Board’s® AP Biology Course and Exam Description was used to provide this information.
In addition, standards tags are found on the assessments, allowing you to quickly identify which
standard is addressed by each question.
8
Page 10

Lab 1:
Graphing Motion
9
Page 11
In this lab you will learn
● how to measure the speed of an object traveling at a constant velocity
● how to differentiate between motion at a constant velocity and motion with acceleration
● how to use a position or velocity versus time plot to understand motion
Activity 1: Pre-Assessment
1. Would you expect an object that you set in motion to continue moving at a constant speed? Why or why not?
2. Discuss the answers to question 1 with the class.
Activity 1: Constant Velocity
Suppose you graphed the motion of an object using the horizontal axis for the time elapsed, in seconds, and the
vertical axis for the distance traveled. For an object traveling at constant speed, the change in distance would be
proportional to the change in time. Therefore, when you plot your data on a distance-versus-time graph, the points should
fall along a straight line. However, every measurement has some error, so the data points would not be likely to exactly
fall on a straight line. Using a line of best fit helps to average these errors and give a more accurate approximation. To
draw a line of best fit, you would use a ruler to draw a straight line that follows the trend of the data and comes as close
to all of the data points as possible. The slope of that line is given by
The slope equals the speed of the object. Because of measurement errors, some points will lie above the best-fit line and
some will lie below it. This is because the best-fit line passes through the middle of the data and averages the values. As a
result, the slope of the line of best fit provides a more accurate value of the speed than a single pair of data points would.
Safety Precautions
● Keep the cart on the track to avoid damage or injury.
For this activity, you will need the following:
● Straight track*
● Cart with spring
● Stopwatch*
● Masking tape*
● Meter stick
For this activity, you will work in pairs.
*Note—If you have access to air tracks, using them will improve your approximation of a frictionless system that can move
at a constant speed.
**Note—For increased accuracy, photogate timers or other technology can be used in place of the stopwatch and
masking tape. The distance between the photogate timers would replace the distance between pieces of masking tape,
and the timers instead of a stopwatch would record the time.
10
Page 12
Structured Inquiry
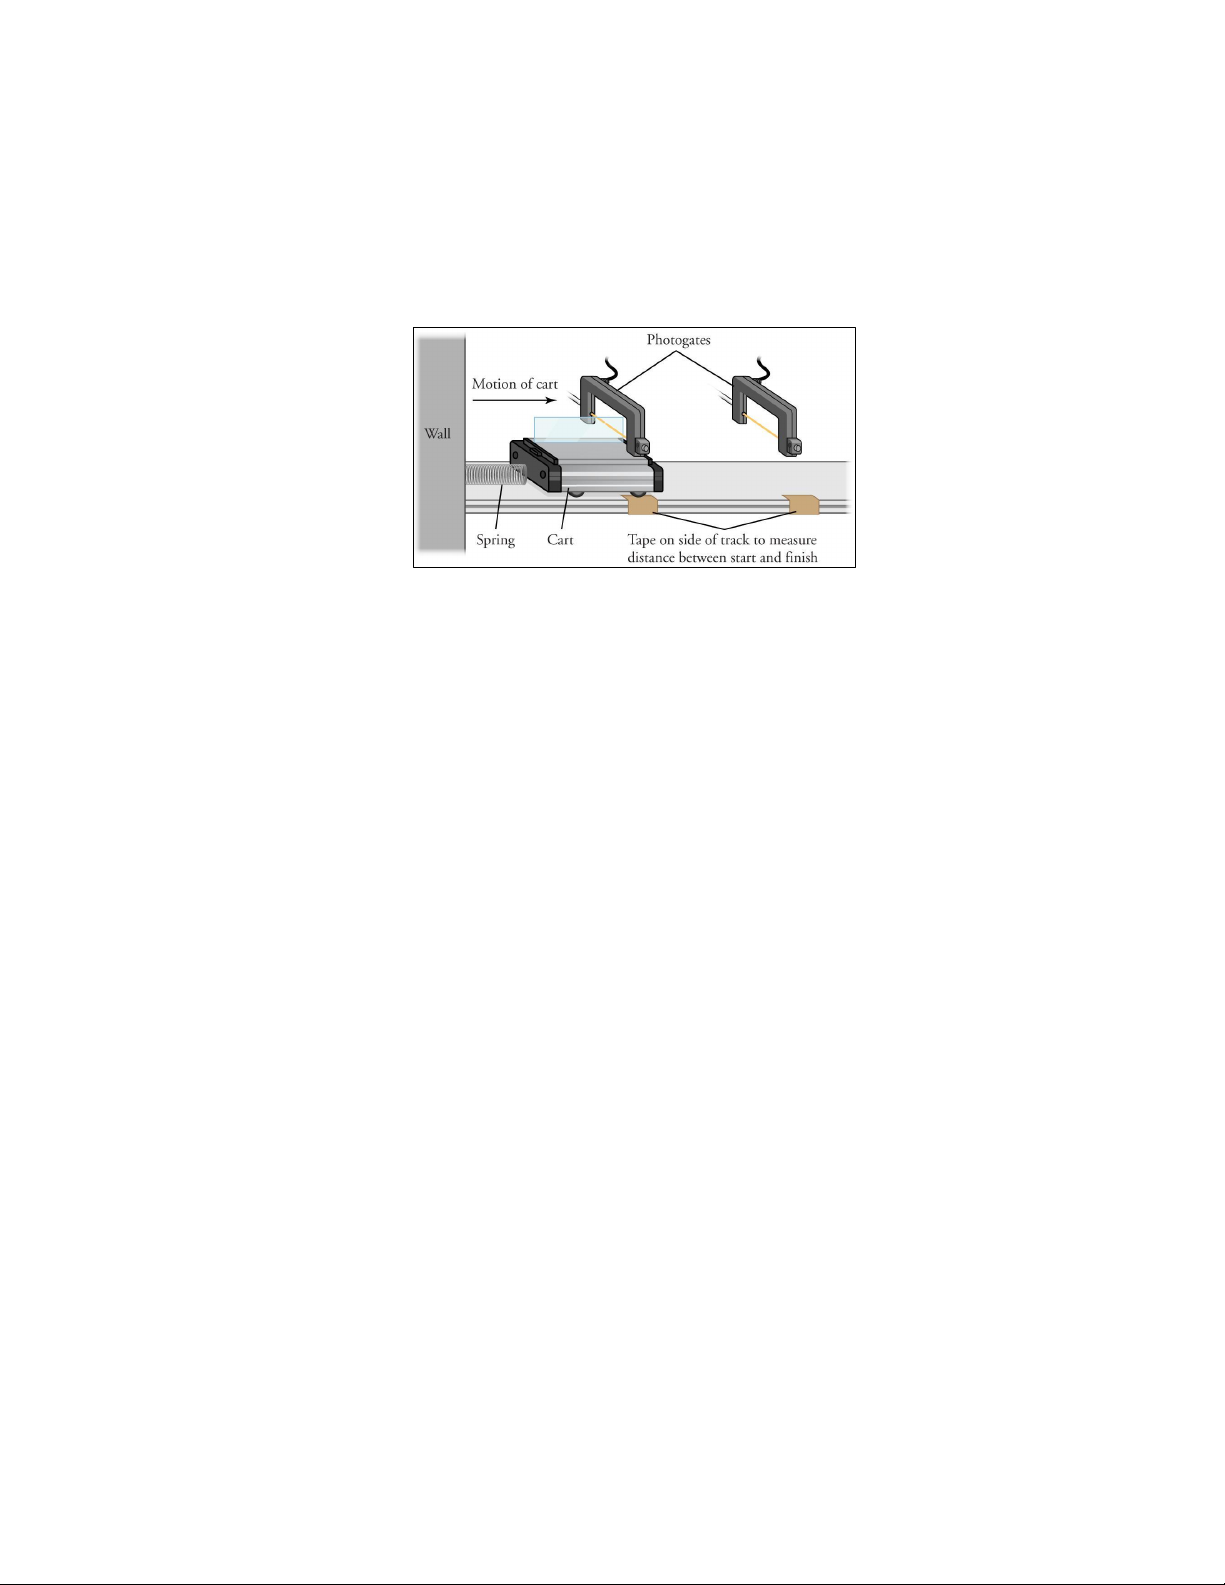
Step 1: Place your track with one end against a wall. Rest the cart against the wall, as shown in Figure 1.1, so that releasing
its spring can launch the cart. Place one piece of masking tape on the track ahead of the starting position of the cart and
another piece of tape further down the track. Measure the distance between the two pieces of tape. Create a data table in
your notebook for recording the distance and travel time for the cart’s motion. You will be moving the second piece of
tape at least three times, so you will need space in the table to record at least four separate times and distances.
Figure 1.1: The speed of the cart can be measured by using the spring to launch the cart from the wall and then measuring how long the cart takes
to travel a fixed distance. This can be done either by having it pass through two photogate timers or by using a stopwatch to measure the time of
travel between two pieces of masking tape.
Step 2: Hypothesize/Predict: Knowing that, ideally, the cart should move at a constant speed, predict how your
measurements would change as you vary the location of your second tape marker. How would this prediction differ if the
cart did not move at a constant speed? Realistically, do you expect your data to resemble the ideal situation?
Step 3: Student-Led Planning: You will now use your photogates, or a stopwatch and meter stick, to measure the speed of
your cart. You should vary the position of your second piece of tape or photogate timer to measure the speed for at least
four distances. If your class uses photogates, listen closely to your teacher’s instructions on how to use them. Discuss with
your partner what data you need to collect and how to use the data to determine the speed of the cart.
Step 4: Critical Analysis: Record the time it takes for the cart to travel each distance in the data table in your notebook.
Then calculate the speed of the cart for each trial, as well as the average speed across all trials. Were the predictions you
made in Step 2 supported by your data? Why or why not? How could you improve your results? Discuss your answers with
your partner and then write them in your notebook.
Guided Inquiry
Step 1: Hypothesize/Predict: Is this experimental setup a good choice for observing motion at a constant speed? What
potential issues does it have, and what improvements could you make?
Step 2: Student-Led Planning: Discuss with your partner how to use the data in your table to plot a graph from which you
can determine the speed of the cart. Now plot your data and use the graph to find the speed of the cart in your
experiment.
Step 3: Critical Analysis: How did the speed you calculated using your graph compare with the speeds you calculated for
each trial, and the average speed across all the trials, in your table? Which is a better method for measuring the speed of
the cart, and why? Did your graph look as you expected for an object moving at a constant speed? Discuss your answers
with your partner and record them in your notebook.
11
Page 13

Assessments
1. Consider a baseball player who hits a home run and runs around all of the bases on the field.
a. Considering that he started and ended at home plate, is the distance he traveled equal to zero? What about
the displacement? Explain.
b. Is the player’s average speed over his entire base run equal to zero
c. Based on this, is it important to know the path an object followed to calculate its speed, or do you only
need to know where and when it started and ended? Explain.
2. In a particular city, each block is 50 m long. A runner goes two blocks north in 10 seconds, then five blocks south in
20 seconds, then eight blocks north in 50 seconds.
a. Plot the runner’s distance traveled as a function of time.
b. Calculate the runner’s speed for each interval.
c. Calculate the runner’s average speed for the entire run.
12
Page 14
Activity 2: Pre-Assessment
1. What does it mean for an object to travel at constant acceleration? How could you set an object in motion at
constant acceleration?
2. Describe at least two different types of accelerated motion.
3. Discuss the answers to questions 1 and 2 with the class.
Activity 2: Constant Acceleration
An object is accelerating if its velocity is changing. The acceleration a of an object is calculated by dividing Δv, the
change in the object’s velocity, by Δt, the time over which the velocity changed
The SI unit for acceleration is m/s2, or meter per second per second. The slope of a position versus time graph for an
accelerating object is still the object’s velocity, but, by definition, the velocity of an accelerating object is changing.
However, for an object with constant acceleration, the slope of the velocity versus time graph is
and the graph should be a straight line whose slope is the acceleration.
Safety Precautions
● Keep the cart on the track to avoid damage or injury.
● Limit the angle of incline of the track to less than 10°, so that the cart reaches the end of the track at a reasonable
speed, avoiding damage or injury.
For this activity, you will need the following:
● Straight track
● Cart
● Stopwatch*
● Masking tape*
● Meter stick
● Ring stand or blocks
For this activity, you will work in pairs.
*Note —For increased accuracy, photogate timers or other technology can be used in place of the stopwatch and masking
tape. The distance between the photogate timers would replace the distance between pieces of masking tape, and the
timers instead of with the stopwatch would record the time.
13
Page 15
Structured Inquiry
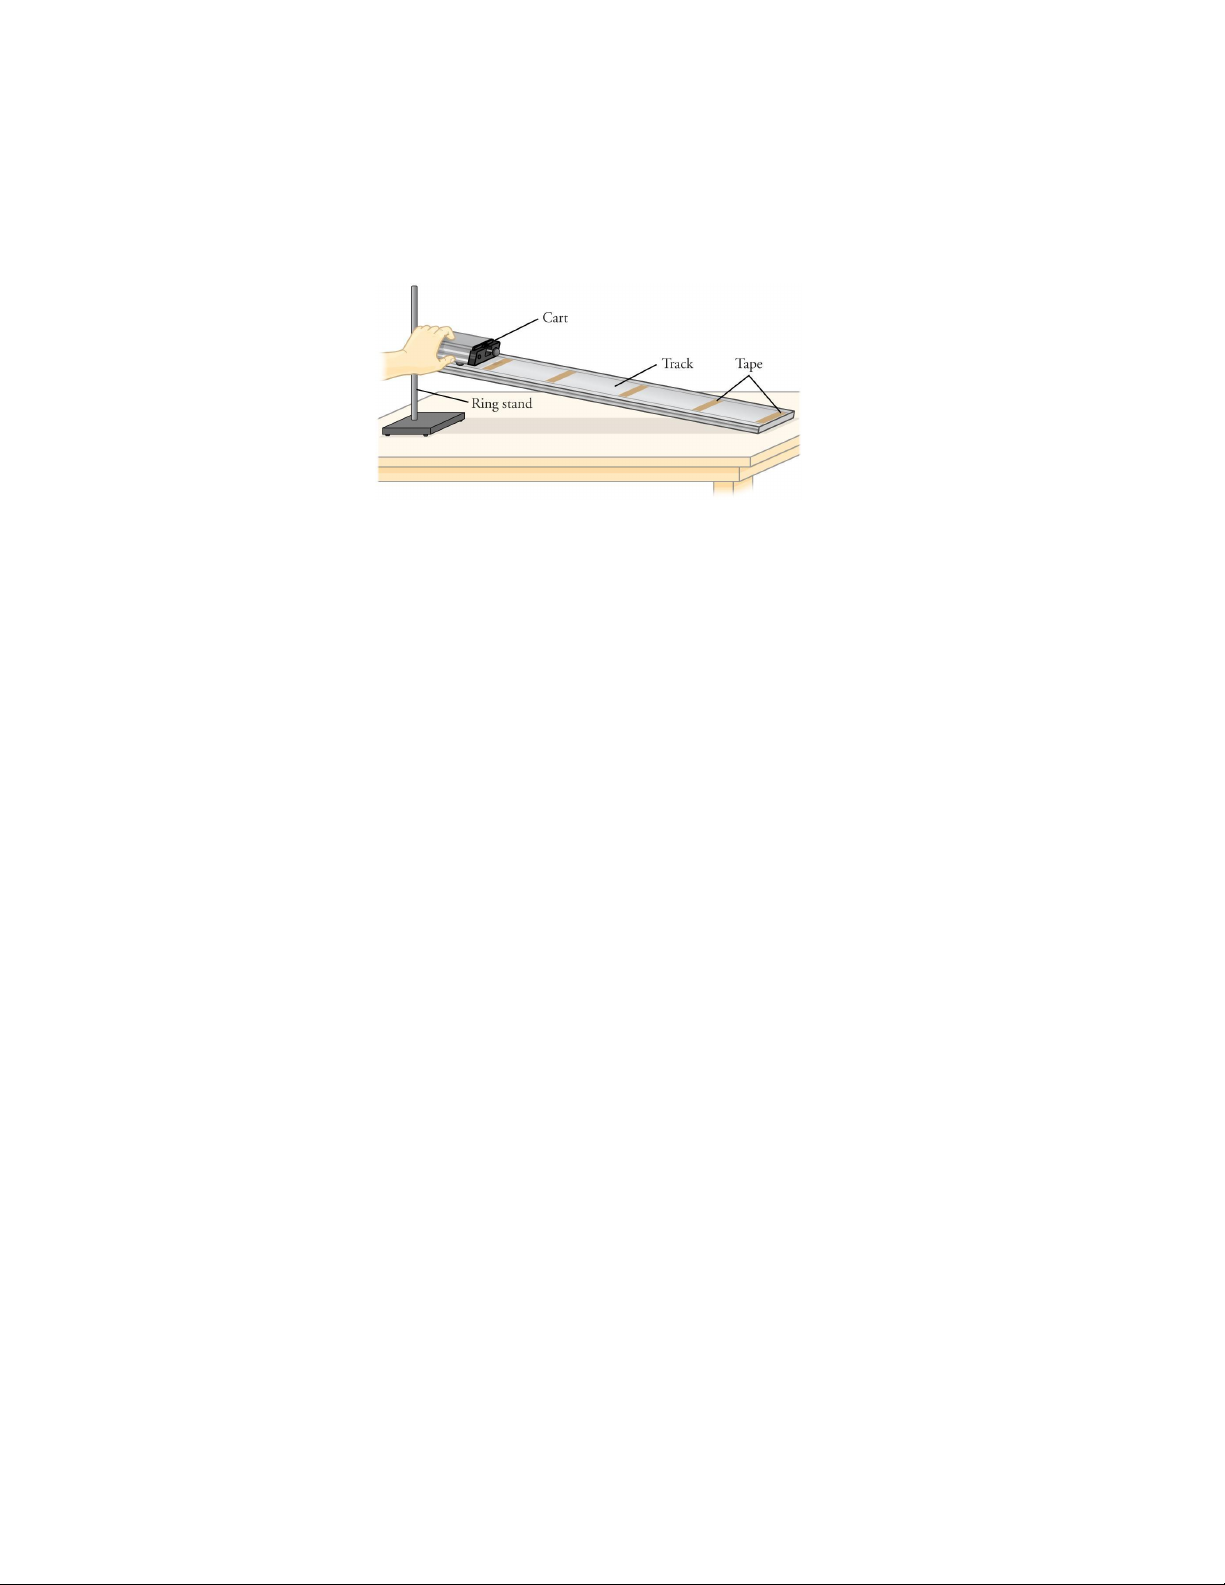
Step 1: Position the track so that one end is slightly lifted above the ground, using either the ring stand mounts or blocks.
Using your meter stick, place pieces of masking tape along the track to divide the track into five even intervals, as shown in
Figure 1.2 Create a data table in your notebook to record the distance and time for the cart’s motion.
Figure 1.2: A cart that is free to move on an incline will accelerate and will have different velocities at different locations.
Step 2: Hypothesize/Predict: Now that the track is no longer horizontal, predict what should happen to the speed of the
cart as it travels down the track. How will this differ from the motion of the cart at constant speed?
Step 3: Student-Led Planning: You will now use your stopwatch to measure the speed of the cart as it travels different
distances down the ramp, starting from rest. Discuss with your partner what data you will need to collect in each trial to
measure the average speed for the given distance. Explain in your notebook why the final speed at the end of this distance
is twice the average speed if the cart starts from rest. Be sure to think carefully about the start and end points you choose
for each measurement of the cart’s speed. Your procedure may be different if you are using photogates to time the arrival
times at several different locations in each trial.
Step 4: Record the time it took for the cart to travel between each marker in the data table in your notebook. Calculate
the final speed of the cart at the end of each interval. Given that the cart started at rest, calculate the acceleration of the
cart for each interval, and calculate an average value for the acceleration across the trials.
Step 5: Critical Analysis: Were the predictions you made in Step 2 supported by your data? Why or why not? What
methods could you have used to improve your results? Discuss with your partner and then write your answers in your
notebook.
Guided Inquiry
Step 1: Hypothesize/Predict: What makes the experimental setup here different from that in Activity 1? How will that
make your graphs different from those in Activity 1? What do you expect the position and velocity versus time graphs to
look like for your data?
Step 2: Student-Led Planning: Discuss with your partner how the data in the table you created can be used to create
position and velocity versus time graphs and how you can use these graphs to determine the acceleration of the cart. Now
plot your data and use the graph to find a value for the acceleration of the cart in your experiments.
14
Page 16

Step 3: Critical Analysis: Given that gravity accelerated the cart down the ramp, does the value you measured for the
acceleration of the cart make sense? Why or why not? Did your graphs look like you expected for an object moving with
constant acceleration? Did the value you calculated using your line of best fit agree with the average value from your trials
for the acceleration? Discuss your answers with your partner and record them in your notebook.
Assessments
1. How does the acceleration of a cart on an incline relate to the angle of the incline? Give an expression that relates
the acceleration of the cart, acceleration due to gravity, and the ramp angle. Assume that friction can be ignored.
2. If a car speeds up from rest to 30 m/s in 6.0 seconds and then returns to rest in 12.0 seconds, what is its
acceleration?
a. While speeding up?
b. While slowing down?
3. In the first activity, you observed the motion of a cart moving at constant speed. However, the cart started at rest
and then began moving. Therefore, the cart did accelerate in Activity 1 because the velocity changed. How did one
experimental procedure produce motion at constant speed whereas the other produced accelerated motion?
15
Page 17
Activity 3: Graph Matching
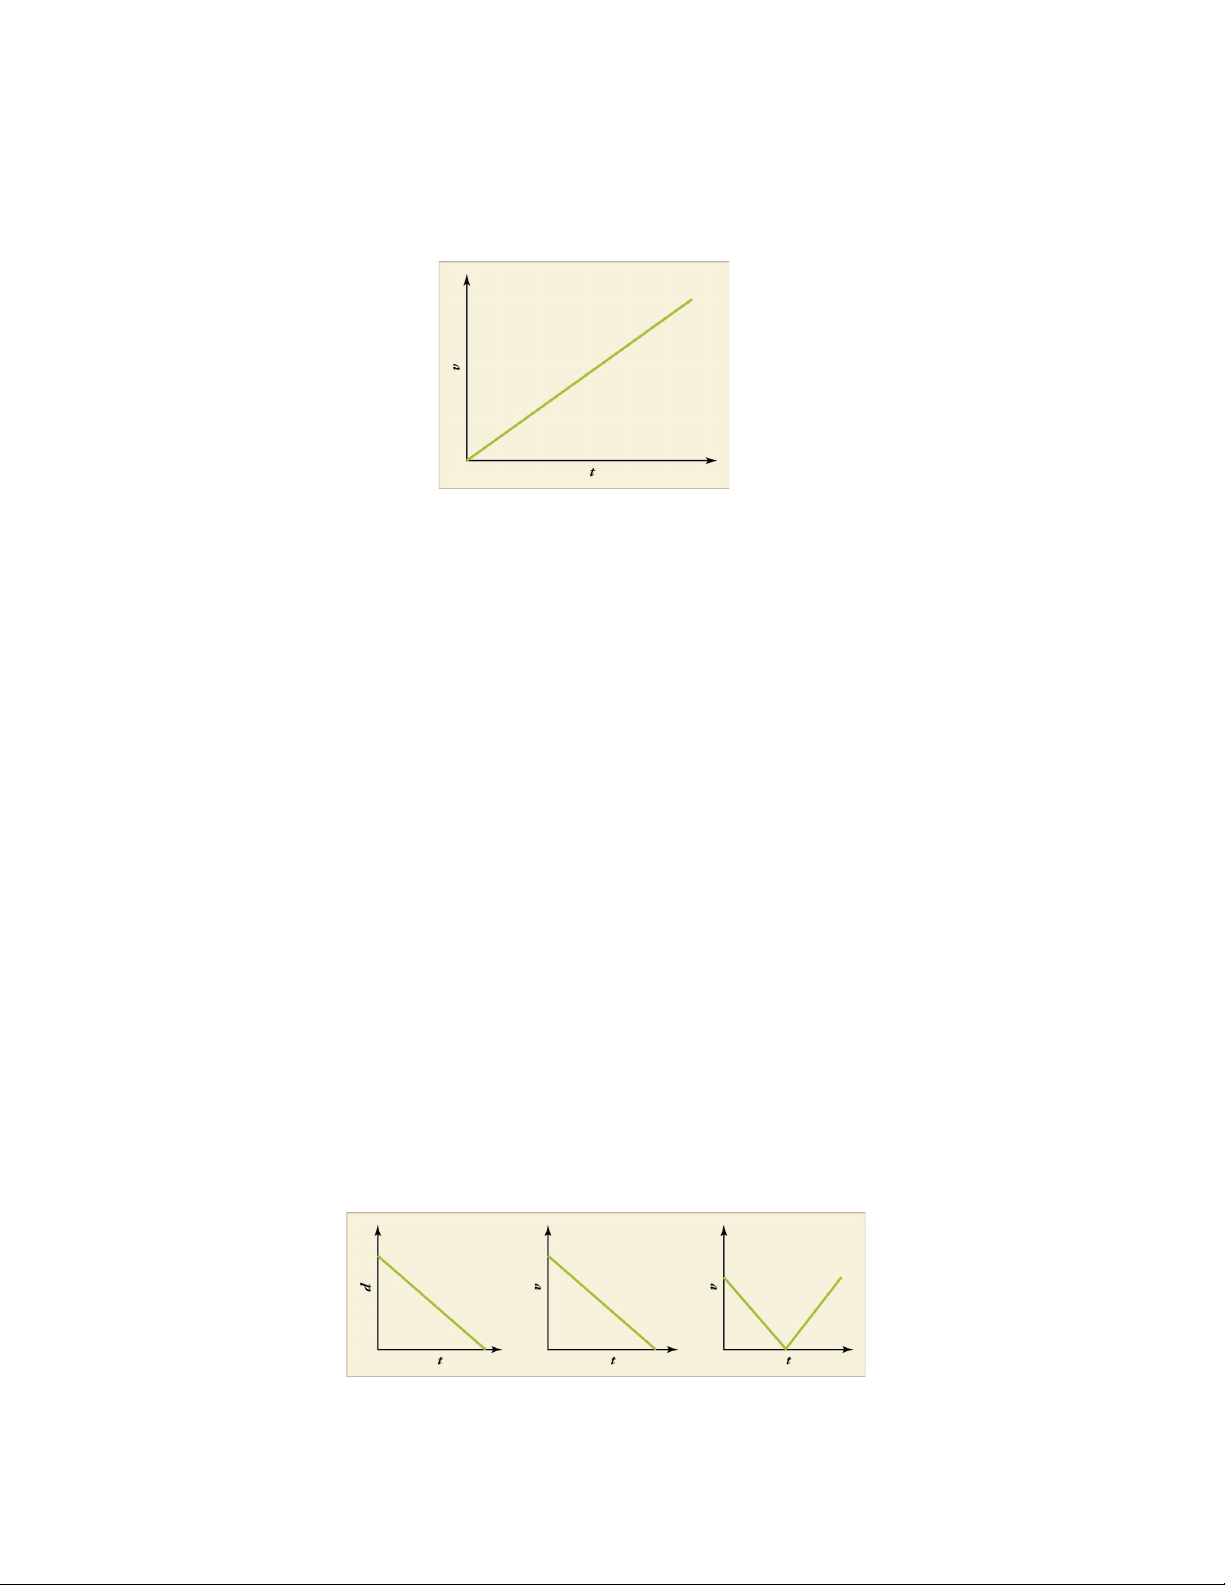
A position or velocity versus time graph can tell you about the motion of an object. Figure 1.3 is an example of a
graph with a straight line. The slope, which is the object’s acceleration, is therefore constant. The slope is positive, so the
object keeps moving faster over time.
Figure 1.3: An object speeding up with constant acceleration has a straight-line velocity versus time graph.
Safety Precautions
● Keep the cart on the track to avoid damage or injury.
● Limit the angle of incline of the track to less than 10° so that the cart reaches the end of the track at a reasonable
speed, avoiding damage or injury.
For this activity, you will need the following:
● Straight track
● Cart with spring
● Stopwatch*
● Masking tape*
● Meter stick
● Ring stand or blocks
For this activity, you will work in pairs.
*Note—For increased accuracy, photogate timers or other technology can be used in place of the stopwatch and masking
tape. The distance between pieces of masking tape would be replaced by the distance between the photogate timers, and
the time would be recorded by the timers instead of with the stopwatch.
Structured Inquiry
Step 1: Hypothesize/Predict: Look at the graphs in Figure 1.4. For each graph, describe the motion shown. Does it
describe an object accelerating or one moving at a constant velocity? In what direction is the object moving? If the object
is accelerating, is it speeding up or slowing down?
Figure 1.4: Position and velocity versus time graphs describe an object’s motion.
16
Page 18

Step 2: Student-Led Planning: You will now use the equipment from Activities 1 and 2 to get the cart to move in a way
that would produce each of the graphs in Figure 1.5. Discuss with your partner how to do this, and what measurements
you will make to recreate the motion described by the graphs.
Step 3: Critical Analysis: Record the appropriate time and distance measurements for the three graphs in data tables in
your notebook. Were the predictions you made in Step 1 supported by your data? Why or why not? How could you have
improved your results? Discuss your answers with your partner and then write them in your notebook.
Guided Inquiry
Step 1: Hypothesize/Predict: Did you choose the correct motions for the cart to recreate the motions described in the
graphs in Figure 1.5? If not, what could you change to make them better agree?
Step 2: Student-Led Planning: Discuss with your partner how the data in the tables you created can be used to recreate
the graphs in Figure 1.5. Now plot your data and compare the graphs with the expected graphs.
Step 3: Critical Analysis: Did your graphs agree with the graphs you were trying to recreate? If they differ, in what ways do
they differ? How can you change your experimental procedure to produce better agreement? Discuss your answers with
your partner and record them in your notebook.
Assessments
1. An object slows down at a constant acceleration, and then speeds up with the same constant acceleration.
a. Sketch a velocity versus time plot for this motion.
b. What experimental procedure could you use to recreate this motion with a cart and tracks?
2. Using dimensional analysis, what quantity would you find by calculating the area under a velocity-versus-time
graph?
3. Two velocity versus time graphs have the same shape, but their y-intercepts are different.
a. What must be the same about the motion of the two objects?
b. What must be different about the motion of the two objects?
17
Page 19

Lab 2:
Projectile Motion
18
Page 20

In this lab you will learn
● how to describe the trajectory of a projectile mathematically and graphically
● how to design an experimental investigation of the trajectory of a projectile
● how to analyze experimental data describing the trajectory of a projectile mathematically and graphically
Activity 1: Pre-Assessment
1. How could you calculate the velocity of an object that is travelling horizontally? What lab equipment would you use
and what data would you collect?
2. Qualitatively describe the vertical acceleration of a falling object. In which direction does a free-falling object
accelerate? How does this acceleration affect the velocity of an object initially moving upward? How does this
acceleration affect the velocity of an object initially moving downward?
3. Discuss your answers to questions 1 and 2 with the class.
Activity 1: Dart Gun Speed
The introduction pointed out that motions along perpendicular axes are independent; because of this, you need to
analyze horizontal and vertical components separately from each other. These components are the horizontal and vertical
parts of a vector. It is important to remember that the downward component of velocity changes during the dart’s motion
because of the acceleration due to gravity. In this activity, we fire a dart gun horizontally to determine the velocity at the
point at which the dart exits the gun.
Safety Precautions
● Be aware of what is in front of the dart gun. Do not shoot the dart gun if someone could get hit.
● Wear safety goggles at all times while dart guns are being fired.
For this activity you will need the following:
● Dart gun with one dart
● Tape measure or meter stick
For this activity, you will work in pairs.
Structured Inquiry
Step 1: Pick a location where you will fire your dart gun horizontally. The location should be at least 3 meters away from a
wall on which the dart will stick. Measure the height of this location from the ground in centimeters and measure how far
away from the wall the position you are firing from is in centimeters. Create a data table for your measurements and show
your calculations in your notebook.
Step 2: Hypothesize/Predict: Predict where the dart will strike the wall. Why did you make this prediction? What
knowledge have you used about motion in the vertical direction to make your prediction? Add your predictions to the
data table you created in Step 1.
Step 3: Student-Led Planning: You will now solve for the velocity at which the projectile exits the dart gun in terms of
distances you can measure. Start by looking at the kinematic equations listed in Table 2. Discuss with your partner how
you can obtain the time of flight of the dart from the distance downward it moves on its way to the wall. Write an
equation in your notebook that expresses the time of flight in terms of how far downward the dart strikes the wall if it had
traveled horizontally. Next, discuss with your partner how you will use the time of flight and other data you can measure
to find how fast the projectile left the dart gun. Write the expression for the speed in terms of the variables you can
measure and the time of flight in your notebook. Remember to separate the horizontal and vertical components of motion
in obtaining these equations.
19
Page 21

Step 4: Critical Analysis: After obtaining the necessary equations, aim the dart gun as close to horizontal as possible, fire
the dart, and collect your data. Record your data and use the data to determine the velocity of the projectile. List your
results in your data table. Were your predictions in Step 2 supported by your data? Why or why not? How could you have
improved your results? Discuss your answers with your partner and then write them in your notebook.
Guided Inquiry
Step 1: Hypothesize/Predict: How will the time of flight, and the displacement downward of the dart during flight, change
if you fire the dart horizontally from a distance closer to the wall? Will it strike higher or lower than before? How will it
change if the dart gun is farther from the wall? Why? Write your predictions and your reasoning in your notebook.
Step 2: Student-Led Planning: Assume the dart leaves the gun at the same velocity you determined in the first part of this
lab. Work with your partner to use the kinematic equations to obtain an expression for the time of flight of the dart in
terms of the distance of the gun from the wall. Write the expression in your notebook. Discuss with your partner how to
calculate, in terms of the time of flight, the distance downward that the dart should fall before reaching the wall. Then
choose two distances from the wall, one closer and one farther than you used in the first part of the lab. Calculate the
expected displacement downward from where the dart strikes the wall. Then carry out the actual measurement of this
displacement by firing the dart horizontally from the measured distances. Write your results in your notebook at each
step.
Step 3: Critical Analysis: How did the displacement downward of the dart compare with your prediction of whether it
would be higher or lower than in the first part of the lab? How well did its precise measured value compare with the value
predicted from your calculations? Discuss with your partner the possible sources of any disagreement and write your ideas
in your notebook.
Assessments
1. In your notebook, draw a position in the x-direction versus time graph, a velocity in the x-direction versus time
graph, and acceleration in the x-direction versus time graph for the dart launch experiment. Repeat this for the
y-direction for a total of six graphs. You can omit numbers on your x- and y-axes and just show the shape of each
graph line. After each graph, write a brief explanation of why the graph has the shape that it does.
2. A baseball outfielder throws a baseball horizontally with an initial velocity of 38 m/s. If the player releases the
baseball from a height of 2.25 m, how far does the baseball travel horizontally before it strikes the ground? Be sure
to include a table of horizontal and vertical variables and show all of your work.
20
Page 22

Activity 2: Marble Launch Landing Spot
In the first activity of this lab, you determined the velocity of a projectile as it left a dart gun. Each time you
performed this activity, the projectile was launched horizontally, so the vertical component of its initial velocity was
always zero. In this activity, you will launch your projectile at an angle above the horizontal direction so that its initial
velocity has a non-zero vertical component. You will predict where this angled shot strikes the floor.
Safety Precautions
● Be aware of what is in front of the marble launcher. Do not shoot the marble if someone could get hit.
● Do not fire the marble into the ceiling or windows of the classroom.
● Wear safety goggles at all times while marble guns are being fired.
● Be sure all breakable objects, including cell phones, are out of range of the marbles.
For this activity you will need the following:
● Marble launcher with one marble
● Tape measure or meter stick
● Protractor or any other tool to determine the angle of launch
● Stopwatch
For this activity, you will work in pairs.
Structured Inquiry
Step 1: First you will measure the speed of the projectile as it leaves the launcher. Pick a location where you will fire your
marble launcher vertically. Remember all of the safety precautions and only fire the marble when it is safe. Launch your
marble straight up. Use the stopwatch to time how long the marble is in the air. From the measured time of flight and the
known value of the acceleration due to gravity (g = 9.80 m/s2), calculate the speed of the projectile as it left the launcher.
(Remember that the vertical component of velocity of the marble is zero at the top of its flight.) Create a data table in your
notebook to show your measurements and calculations.
Step 2: Hypothesize/Predict: Assuming the marble exits the launcher at the same speed as in Step 1, predict how far you
think the marble will travel before hitting the floor if it is launched horizontally from a table. Mark your prediction with a
piece of tape or a similar object. Also predict where the marble would land if fired at an angle of 30o. Add your predictions
to the data table you created in Step 1.
Step 3: Student-Led Planning: You will now use the kinematic equations to solve for how far the marble will travel when
fired horizontally, given the initial speed you determined in Step 1 and the height of the launcher. Discuss with your
partner how you will use your collected and previously known data to solve for the horizontal displacement using the
kinematic equations.
Step 4: After you have solved for a displacement, mark that position with a piece of tape or a similar object. Once it is safe,
fire the marble launcher and see if your calculated value and observed value are in reasonable agreement. If they aren’t,
return to your equations to see if you can explain why before moving on to Step 5.
Step 5: Student-Led Planning: You will now solve for the horizontal displacement the marble will travel when fired at an
angle of 30o using the height of the launcher, the initial speed you determined in Step 1, and the kinematic equations.
Discuss with your partner how you will use your collected and previously known data to solve for the horizontal
displacement using the kinematic equations.
21
Page 23

Step 6: Use your protractor or a similar tool to make sure your marble launcher is positioned at the correct angle. Mark
that position with a piece of tape or a similar object. When it is safe, fire the marble launcher and see if your calculated
value and observed value are in reasonable agreement. If they aren’t, return to your equations to see if you can explain
why before moving on to Step 7. Repeat this step for two other angles that you choose and create a data table for the
angle of launch and horizontal components of initial velocity.
Step 7: Critical Analysis: After completing your calculations, record your collected data in your data table. Also include the
initial velocity of the projectile from Step 1 and the displacements solved in Steps 4 and 6. Did your data support your
predictions in Step 2? Why or why not? How could you have improved your results? Discuss your answers with your
partner and then write them in your notebook.
Guided Inquiry
Step 1: Hypothesize/Predict: The range of the projectile is how far it lands from the launcher. How does the launch angle
affect the range? Discuss with your lab partner what the range of the projectile should be if the projectile is fired straight
up and if it is fired horizontally starting just barely above the tabletop. What angle would you predict gives the maximum
range? Should the range get smaller or larger if the angle is increased from this maximum-range launch angle? What if the
launch angle is decreased? Discuss your answers and your reasoning with your partner and write them in your notebook.
Step 2: Student-Led Planning: Discuss with your partner how you will test the range produced by launch angles of 10°,
30°, 45°, 60°, and 80°. Collect your projectile range data, measured from the exit point of the launcher, for each of the five
launch angles. Write the data for each one in your data table.
Step 3: Critical Analysis: Did your data support your prediction of which angle would give the maximum range for the
projectile? What does your data show is the effect on the range if the launch angle is made larger than the angle that gave
the largest range? How about if the launch angle was made smaller? If you were to choose a distance smaller than the
maximum range, how many different launch angles would there be that make the projectile land at this distance? Discuss
your answers with your partner and write them in your notebook.
Assessments
1. If you were to know the initial velocity and the angle of launch, could you accurately predict whether or not a
basketball player could make a free throw? Explain how you would design an experiment that could determine if a
player will make or miss a free throw before the ball reaches the rim.
2. Whether a projectile is launched at 20o or 70o, it will land in the same spot as long as the projectile’s initial speed
leaving the launcher is the same. How can you explain this phenomenon?
3. Your friend is leaving your house when you discover your friend’s wallet in your room. You quickly run to your
second-story window. You call out and throw the wallet horizontally from the window, and your friend catches
it, 13.0 m away from the house. If your window is 3.5 m above the ground, how fast did you throw the wallet? Be
sure to include a table of horizontal and vertical variables and show all of your work.
22
Page 24

Lab 3:
Newton’s 2nd Law
23
Page 25
In this lab you will learn
● how to use free-body diagrams to determine and visualize experimental variables for force and motion
● how to graph velocity versus time
● how to measure and calculate velocity
● how to calculate acceleration
Activity 1: Pre-Assessment
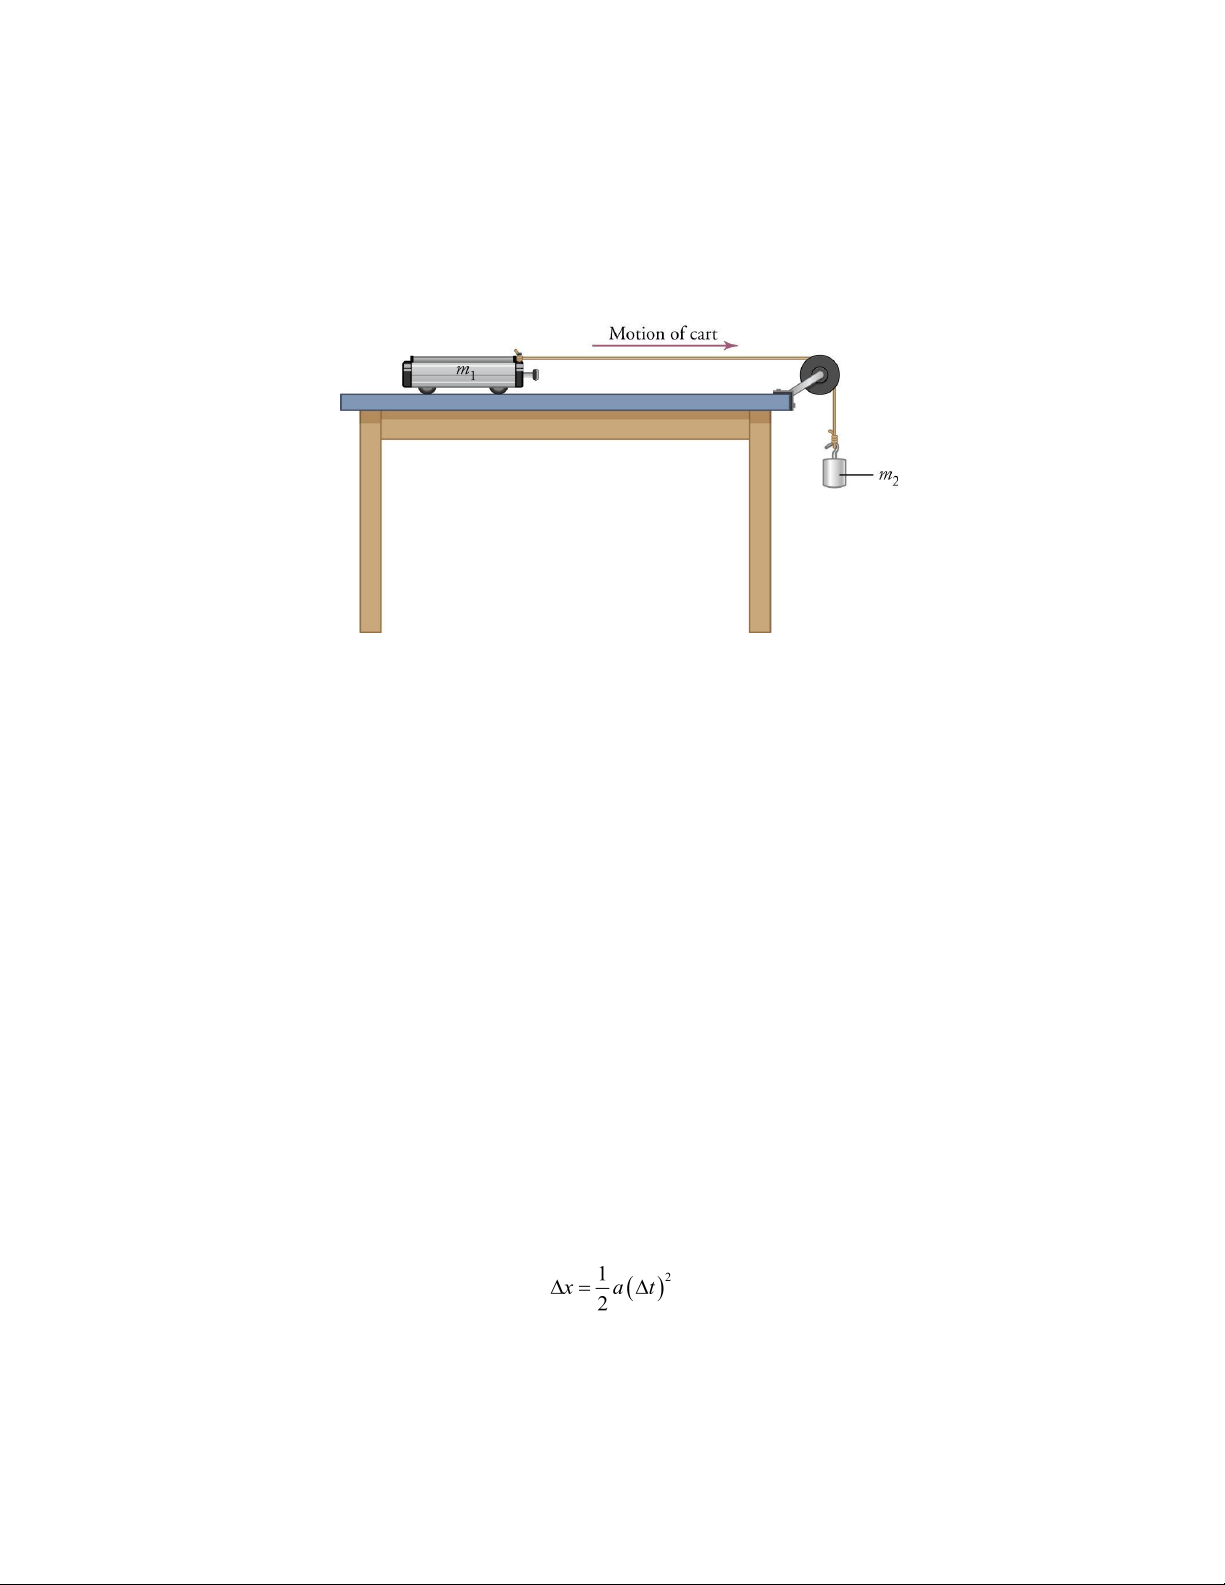
Figure 3.1: The cart of mass m1 accelerates along the table. Rate of acceleration is directly proportional to mass m2.
1. Using Figure 3.1, draw a free-body diagram, indicating all the forces acting on the cart and its cargo.
2. Answer the following questions based on Figure 3.1:
a. What is the strength of the force accelerating the system, in terms of the masses involved?
b. What is the relationship between the acceleration of mass m1 and the acceleration of mass m2?
c. Does the force accelerating the system change or remain constant until mass m2 reaches the floor? Does
the acceleration itself change?
d. What total mass does the gravitational force acting on mass m2 accelerate?
3. Imagine that you placed all the masses you intend to test as cargo in the cart, except the one that is hanging
(Figure 3.1). You then exchange the hanging mass with one from the cargo section that is heavier. How will that
affect
a. the mass that is being accelerated, and
b. the net force causing the acceleration?
4. Discuss the answers to questions 1–3 with the class.
Activity 1: Applying Constant Force
When a constant force is applied to an object or system, the object or system will accelerate at a constant rate. If
the applied force and mass of the system are known, the acceleration predicted by Newton’s Second Law can be
calculated.
In this lab, you will measure acceleration of various masses by various forces using the setup shown in Figure 3.1.
The lab cart starts at rest and accelerates at a constant rate. According to the kinematic equations, the distance Δx that
the cart travels in time Δt is then
for acceleration a. This can provide a useful method for determining the acceleration by timing the motion.
24
Page 26

Safety Precautions
● Heavy weights that fall can cause injury. It is safest to use a cart and hanging weight of modest mass whenever
possible.
● Make sure your experimental setup includes a means of stopping the cart to prevent it from rolling off the table.
For this activity you will need the following:
● Cart, weights, and pulley and string setup; note—If no pulleys are available, then dental floss over the edge of the
table will work
● Scale capable of weighing the cart and weights used
● Meter stick
● Visible tape or chalk for marking positions
● Stopwatch or video capture device
For this activity, you will work in pairs or small groups.
Structured Inquiry
Step 1: Hypothesize/Predict: Using the notation from your free-body diagram, apply Newton’s Second Law to derive an
equation predicting the acceleration of the cart for given masses m1 and m2. Ignore friction and air resistance as well as
the mass of the pulley and string.
Step 2: Student-Led Planning: You will need to determine the acceleration of the cart for several different applied forces.
The total mass should be kept the same. Discuss with your partner the details of how to accomplish that goal by timing the
travel of the cart between two lines marked by chalk or by visible pieces of tape. What precisely will you measure and how
will you analyze your data? Then, discuss with your partner what masses you will use for m2. Using the values for m2 you
selected, create a data table to structure your data. Include in the table the predicted values for each mass that you can
calculate using the equation you derived in Step 1.
Step 3: Procedure: Execute the planned experiment, repeating the procedure for each of the selected values of m2.
Record the numerical results in the prepared data table(s). Display your experimental data in a graph of acceleration
versus applied force. Plot the theoretically predicted graph line from your equation in Step 1 on the same graph for
comparison.
Step 4: Critical Analysis: Were the results from your experiment in reasonable agreement with your calculated
predictions? Why or why not? If your experimental results did not reasonably agree with your predictions, what factors do
you think affected the results? What, according to your equation in Step 1, is the meaning of the slope of the acceleration
versus force graph? Are your experimental data consistent with this? Discuss your answers with your lab partner and write
them in your notebook.
Guided Inquiry
Step 1: Hypothesize/Predict: What do you predict the acceleration vs. applied force for fixed mass should look like? If
your experimental results weren’t the same as you predicted, what factors do you think affected the results? Consider
some of the assumptions that were made about the setup when you did your initial calculations in Step 1. How much do
you think those factors affected the results? How could you alter the experiment to test this prediction? Write your ideas
in your notebook.
Step 2: Student-Led Planning: Discuss and decide as a team which modifications to the experiment you should make to
test your ideas. Check with your teacher before conducting additional experiments.
25
Page 27

Step 3: Critical Analysis: Were you able to determine how much impact the setup assumptions have on your experimental
results? Could you use this data to improve your predictions for the acceleration of the cart with different values of m2?
How?
Assessments
1. What is velocity?
2. What is acceleration?
3. What is the source of the force causing the acceleration of the system?
4. How did you change the acceleration of the cart?
5. When you increased the hanging mass, did that increase or decrease the acceleration of the cart? Why? ]
6. What measurements did you make that enabled you to calculate acceleration?
26
Page 28

Activity 2: Effect of Force on Different Masses
Newton’s Second Law tells us that the acceleration of an object or system is inversely proportional to the mass of
the object or system. The greater the mass of the system for a given force, the smaller the acceleration.
Safety Precautions
● Heavy weights that fall can cause injury. It is safest to use a cart and hanging weight of modest mass whenever
possible.
● Make sure your experimental setup includes a means of stopping the cart to prevent it from rolling off the table.
For this activity, you will need the following:
● Cart, weights, and pulley and string setup; note—If no pulleys are available, then dental floss over the edge of the
table will work
● Meter stick
● Visible tape or chalk for marking positions
● Stopwatch or video capture device
For this activity, you will work in pairs or small groups.
Structured Inquiry
Step 1: Hypothesize/Predict: The experimental setup in Figure 3.1 shows mass m1 resting on the cart and mass m2
hanging from the string. Can you predict what will happen when you change mass m1 while keeping m2 constant? Choose
a value for m2. Then, choose several values for m1 to test. Using the equation you derived in Activity 1, calculate your
prediction for the acceleration of the cart for each value of m2. Record your calculations in your notebook.
Step 2: Student-Led Planning: In Activity 1 of this lab, you established a procedure for finding the acceleration of the cart.
Using the values for m1 you selected in Step 1, create a data table to structure your inquiry.
Step 3: Procedure: Execute the planned experiment, repeating the procedure for each of the selected values of m1.
Record the numerical results in the prepared data table(s) and determine the measured acceleration of the cart for each
value of m1.
Step 4: Critical Analysis: Compare the experimental results from Step 4 to your calculated predictions from Step 2. Were
the results from your experiment in reasonable agreement with your calculated predictions? Why or why not?
Guided Inquiry
Step 1: Hypothesize/Predict: Based on what you know about Newton’s Second Law, what do you expect would happen if
you did the experiment with both masses, m1 and m2, now 1.5 times larger than before? Or, what if m1 and m2 were
multiplied by some other number, such as 0.5? By what factor would that multiply the force that accelerates the cart? By
what factor would it multiply the total mass being accelerated? Considering the effect of increasing the force along with
the effect of increasing the mass, what changes would this cause? Write your prediction and rationale in your notebook.
Step 2: Student-Led Planning: Work with your lab partner to plan an experiment to test your hypothesis on the effect of
changing the masses. Describe your planned experiment in your notebook and get your plan approved by your teacher.
Then, carry out the experiment.
Step 3: Critical Analysis: Did your results match your prediction? What is the effect on acceleration if both mass and
applied force are multiplied by the same factor, per Newton’s Second Law? How does that relate to your data? If your
results differed from your prediction, try to explain why. Discuss your answers with your lab partner and write the analysis
in your notebook.
27
Page 29

Assessments
1. When you increased the mass on the cart, did that increase or decrease the acceleration of the cart? Why?
2. Apply the same idea as in the Guided Inquiry to an object in free fall by considering replacing the object with one
k times as massive. How will this change in mass (k) affect the force of gravity? By what factor does this change
the acceleration of the object? How does this account for Galileo’s observation that all objects in free fall have
the same acceleration regardless of mass?
28
Page 30

Lab 4:
Forces
29
Page 31

In this lab you will learn
● how to design an experiment for collecting data and determine the relationship between the net force exerted on
an object, its inertial mass, and its acceleration
● how to represent forces in diagrams or mathematically using appropriately labeled vectors with magnitude,
direction, and units during the analysis of a situation
Activity 1: Pre-Assessment
1. What seems to happen when you slide something smooth, like a block, across a smooth surface? What about when
you slide the same block across a rough surface? Does the normal force change? What about the coefficient of
friction?
2. Can you measure the friction between the block and the lab bench by only measuring the acceleration of the
block? Why or why not?
3. Discuss the answers to questions 1 and 2 with the class.
Activity 1: Friction Forces
What is friction? Friction is defined as a force that acts to oppose the movement of two objects in contact with
each other. In this activity, we will be measuring the friction of a block with a rubber band around it. We will also learn
how to calculate the coefficient of friction, which is the ratio between the force of friction between two objects and the
normal force between the objects.
Safety Precautions
● There are no safety considerations for this lab.
For this activity you will need the following:
● Rubber bands
● Block
● Spring scale or digital force gauge
For this activity, you will work in pairs.
Structured Inquiry
Step 1. Measure the weight exerted by the block on the lab bench using a spring scale or digital force gauge. How does the
weight of the block relate to the normal force? Create a data table for your measurements in your notebook.
Step 2: Hypothesize/Predict: Which will be larger, the force of friction for the block at rest (static friction) or the force of
friction while the block is moving (kinetic friction)? Write your predictions in your notebook.
Step 3: Student-Led Planning: You will now measure the maximum force of static friction for the block at rest (static
friction) and the force of friction while the block is moving (kinetic friction) using the spring scale or digital force gauge.
First, you should measure the weight of the block (and its attached rubber bands) using the spring scale or digital force
gauge. Then, you should pull the block across your surface with the spring scale or digital force gauge. Do your best to pull
it at a constant speed. In successive trials, attach more rubber bands around your block to increase the friction.
Step 4: Critical Analysis: Calculate and record the coefficient of static friction and the coefficient of kinetic friction in your
data table. Were the predictions you made in Step 2 supported by your data? Why or why not? What methods could you
have used that would have improved your results? Discuss your answers with your partner and then write them in your
notebook.
30
Page 32

Note that part of the weight exerts a force down the incline, namely, mg sin θ. The sin θ component is used to obtain only
the part of the weight that is directed down the incline. In this activity, we will be measuring the forces on a cart as it
moves up an inclined plane.
Safety Precautions
● Do not roll carts at other students.
● Roll carts only on the table to prevent people from slipping on them.
For this activity you will need the following:
● Carts
● Inclined plane
● Pulley
● String
● Protractor
● Stop watch
● Meter stick
● Spring scale or digital force gauge
For this activity, you will work in pairs.
Activity 2: Pre-Assessment
1. When you push an object up an inclined plane, what forces seem to be acting on it? Why?
2. What is the direction of the normal force for an object on an inclined plane?
3. Discuss the answers to questions 1 and 2 with the class.
Activity 2: Forces on an Inclined Plane
Think about pushing an object uphill. Why is it harder to push that object up the hill than it would be to push it
across a flat surface? On the hill, some of the weight of the object is directed downhill. That is, without the push, the
object would likely roll or slide down the hill. In other words, there is a force acting against the force of the push. We can
model this situation in this lab by pulling a block up an inclined surface with a hanging weight. Consider a diagram of this
situation shown in Figure 4.1.
Figure 4.1: Lab model of a cart being pulled up a hill.
31
Page 33

Structured Inquiry
Step 1: Measure the weight of the cart using a spring scale or digital force gauge. Then, calculate the weight exerted on
the inclined plane using this weight measurement and your measurement of the angle of the inclined plane. Create a data
table for your measurements in your notebook.
Step 2: Hypothesize/Predict: Predict the value of the acceleration of the cart when a constant force is applied to it as it is
moving up the plane. Write your predictions in your notebook.
Step 3: Student-Led Planning: You will need to determine the acceleration of the cart from quantities you can measure,
such as the distance and time of travel of the cart. Assuming the acceleration of the cart is constant and that it starts from
rest, use the kinematic equations to obtain an equation you can use for this purpose. Write the equation in your
notebook. Discuss with your lab partner what you will need to do to measure the acceleration of the cart. Now, measure
the velocity of the cart as it moves up the inclined plane under a constant force at numerous places along the plane. From
this, you will calculate the acceleration. If the block is started from rest and accelerates at a constant rate, its average
velocity is related to its acceleration by , where T is its time of travel down the incline. Note that under this
situation, the final velocity will be equal to twice the average velocity, that is, . Discuss with your partner how
best to set up your experiment to measure the velocity and calculate the acceleration.
Step 4: Critical Analysis: Record the acceleration multiple times for each run in your data table. Calculate the acceleration
from this data. Were the predictions you made in Step 2 supported by your data? Why or why not? What methods could
you have used that would have improved your results? Discuss your answers with your partner and then write them in
your notebook.
Guided Inquiry
Step 1: Hypothesize/Predict: How do you think the angle of the inclined plane affects the acceleration? How would you
change the angle to increase the acceleration? Write your ideas in your notebook.
Step 2: Student-Led Planning: Now, pick four angles for the inclined plane. Conduct your experiment again. Again,
measure the velocity of each cart and then calculate the acceleration for each. Write your results in your notebook.
Step 3: Critical Analysis: How did the change in the angles affect the acceleration? Did increases in the angle coincide with
increases in the acceleration? Why? Discuss your answer with your partner and write it in your notebook.
Assessments
1. A student pushes a 1.2-kg block up an inclined plane.
a. How would you determine the normal force?
b. What would the student need to measure to calculate the acceleration of the block?
2. Suppose that your calculations result in a net force measurement of 10 N for an object that has a mass of 5 kg. Give
the equation that would allow you to calculate the acceleration and provide the acceleration for this situation.
3. An object is pushed up an inclined plane.
4. Name the forces that are exerted on the object.
5. Calculate each of the forces exerted on your cart that you gave to answer the previous question.
32
Page 34

Guided Inquiry
Step 1: Hypothesize/Predict: How do you think the number and/or orientation of rubber bands determines the coefficient
of friction? What rubber band arrangements would increase the coefficients of friction? Write your ideas in your
notebook.
Step 2: Student-Led Planning: Now, pick four arrangements of rubber bands on your blocks. Measure the normal force for
a block with each arrangement and then measure the maximum force of static friction and the kinetic friction for each.
Calculate the coefficients of static friction and kinetic friction for each. Write your results in your science notebook.
Step 3: Critical Analysis: Which arrangements of rubber bands had larger coefficients of friction? When the coefficient of
static friction increased, did the coefficient of kinetic friction also increase? What about the different arrangements of
rubber bands affected friction? Discuss your answers with your partner and write them in your notebook.
Assessments
1. A student pushes a 0.65-kg block along a smooth table.
a. Does friction occur in this scenario? Where does it occur?
b. What would the student need to measure to obtain the coefficient of kinetic friction?
2. Friction refers to the force that acts to ________ the movement of one object past another in contact with it. From
your observations, describe how static friction does this.
3. An object at rest on a table is subject to a large force. As a result of the large force, the object slides along the
table.
a. Does the object experience static friction? When?
b. Does the object experience kinetic friction? When?
33
Page 35

Lab 5:
Circular Motion
34
Page 36

In this lab you will learn
● how to use free-body diagrams to determine and visualize the variables of circular motion
● how to measure the period and radius of uniform circular motion
● how to calculate centripetal acceleration from measured variables
● how to calculate centripetal force from measured variables
Activity 1 Pre-Assessment
1. What seems to happen when you swing an object attached to a string or rope in a circle? Recall Newton’s First
Law. What prevents the object at the end of the string from continuing its motion in a straight line? What prevents
it from dropping to the ground?
2. If you know the period T of the rotation and the radius r of the circle, how can you calculate the linear or tangential
velocity of the object? From the linear or angular velocity, how can you calculate centripetal acceleration?
3. Discuss the answers to questions 1 and 2 with the class.
Activity 1: Flying Toy
When an object is in circular motion, there is a force on the object toward the center of the circle, preventing it
from continuing in the straight-line path that Newton’s First Law would otherwise predict. In this activity, you will observe
the effects of centripetal acceleration and collect data that will allow you to calculate the centripetal acceleration of a
flying pig toy as it moves along a circular path, as shown in Figure 5.1.
Safety Precautions
● Before starting, ensure that the toy will not strike people or surrounding objects while it is in motion.
● If you change the string length by replacing the string, have your teacher check that it is securely fastened before
proceeding further.
For this activity, you will need the following:
● Toy
● Meter stick
● Stopwatch precise to hundredths of a second
For this activity, you will work in groups.
Figure 5.1: The flying pig rotates in a circular path.
35
Page 37

Structured Inquiry
Step 1: Measure the length of the string used to suspend the toy pig. In your notebook, draw a free-body diagram,
indicating all the forces acting on the pig. Ignore air resistance, although note that the wings on the pig do create air
resistance. Use arrows to show the vertical and horizontal components of the forces. Identify in the diagram which force
or forces produce the centripetal acceleration.
Step 2: Hypothesize/Predict: Discuss the feasibility of measuring centripetal acceleration directly. What experimental
information will you need to collect in order to determine the centripetal acceleration? What intermediate calculations
will you need to carry out along the way? Create a data table to structure your inquiry. Include space for gathering data
and for making intermediate calculations.
Step 3: Student-Led Planning: You will now measure the period and radius of rotation of the flying pig. Discuss with your
classmates how best to measure these, maximizing accuracy and precision. Also, discuss how you will use these data to
determine the centripetal acceleration. Create a data table to record these measurements.
Step 4: Set the pig in motion and record the period of rotation and the radius of rotation in your data table.
Step 5: Critical Analysis: Were you able to calculate the centripetal acceleration? Why or why not? What methods could
you have used to improve your results? Discuss with the class and then write your answers in your notebook.
Guided Inquiry
Step 1: Hypothesize/Predict: How do you predict the centripetal acceleration would change if you increased the angular
speed (in revolutions per second) of the flying pig? How about if you changed the length of the string but kept the angular
speed the same? Write the name of each variable you can directly control in the flying pig experiment in your notebook.
Then, record your prediction of how changing each variable would change the centripetal force.
Step 2: Student-Led Planning: To test your predictions, you will need a way to observe whether the centripetal force has
been increased or decreased. Draw a free-body diagram, showing all the forces acting on the flying pig when it is in
motion. Label the angle θ that the string makes with the vertical. Keep in mind that the horizontal component of the
tension force is the centripetal force, and the vertical component of the tension force must balance the weight of the pig
toy to keep it at the same height. Discuss as a class, using free-body diagrams, how the angle of the string must change if
the centripetal force is increased. Write a summary of your arguments in your notebook.
Step 3: Student-Led Planning: Decide how you will use your observations of θ to test your predictions. After your
procedure has been approved by your teacher, carry out your experiment.
Step 4: Critical Analysis: Did your observations confirm your prediction in Step 1? If not, what may have caused the
discrepancy?
Assessments
1. (a) Compare the effect of an acceleration for a very short time in the direction of the instantaneous velocity
with the main effect if the acceleration is perpendicular to the velocity.
(b) Justify your answer with a vector diagram showing the small vector change in velocity ( ) from the
acceleration being added to the instantaneous velocity vector of the flying pig.
2. In your free-body diagram from Step 1 of the Structured Inquiry, what force acting directly on the flying pig is the
centripetal force causing the motion to be circular?
3. (a) Why were you unable to measure centripetal acceleration directly?
4. (b) What measurements enabled you to calculate centripetal acceleration? What intermediate calculations did you
have to carry out to calculate centripetal acceleration?
36
Page 38

Activity 2 Pre-Assessment
If you know the centripetal acceleration of an object in circular motion, how can you determine the centripetal force?
Remember the simple equation
Activity 2: Stopper on a String
Centripetal force is the name we use to denote the net force that pulls an object engaged in circular motion
toward the center of the circle. In the case of an object being swung on a string, the centripetal force is the horizontal part
of the tension force from the string. In the previous section, we calculated centripetal acceleration, which is related to
centripetal force through Newton’s Second Law, , where the force F can be expressed in units of newtons (N).
In this experiment, we will examine centripetal force and how it is related to the rotational period and radius of the
circular motion. The experimental apparatus shown in Figure 5.2 allows a rubber stopper to travel easily in a horizontal
plane. The stopper is pulled inward by a string that supports an adjustable amount of weight. The apparatus allows the
string to move freely through the tube to change the radius of the stopper’s circular motion.
Safety Precautions
● Before beginning, ensure the rotating stopper will not come in contact with people or surrounding objects when in
motion.
For this activity, you will need the following:
● Smooth-edged glass tube
● Stopper
● String
● Meter stick
● Stopwatch precise to hundredths of a second
● Mass scale
● Marking pen
For this activity, you will work in pairs.
Figure 5.2: The weight hanging from the string provides the centripetal force that causes the motion of the stopper to be circular.
37
Page 39

When using the stopper-on-a-string apparatus for this experiment, be sure to keep the stopper rotating in as
horizontal a plane as possible. The plane in which the stopper travels should not be slanted, because there should be no
vertical changes in the motion of the stopper. Also, the length of the string between the plastic tubing and the stopper
should stay constant while swinging, because the period of rotation depends on the radius.
Structured Inquiry
Step 1: In your notebook, draw a free-body diagram, indicating all the forces involved. Ignore air resistance. Identify which
force or forces in the free-body diagram constitute the centripetal force.
Step 2: In your notebook, write the mathematical equation giving the force F that the hanging weight exerts on the string
in terms of the hanging mass m. Similarly, write the mathematical expression for the centripetal force in terms of the mass
of the stopper and the centripetal force needed to keep it moving in a circle. Why does the radius of rotation change when
you change the rate of rotation of the stopper, and what does that imply about the relationship between mass, centripetal
acceleration, and centripetal force? Express this as an equation, and write it in your notebook.
Step 3: Hypothesize/Predict: From the first activity, the pre-assessment, and the equation you derived in step 2, predict
how the radius of the stopper's motion will change if the applied force is increased by increasing the mass hanging at the
other end of the string. Write your prediction and your reasoning in your notebook.
Step 4: Student-Led Planning: You will now measure the period and radius of rotation of the stopper on the string. Discuss
with your partner how best to measure these, maximizing accuracy and precision. How can you change the centripetal
force applied to the rotating stopper? Test at least three different applied forces. Ensure that for each measurement, you
maintain a constant radius of rotation. Add to the data table you created in Step 2 to record these measurements.
Step 5: Record the period of rotation and the radius of rotation of the stopper in your data table for each of the three
variations of applied force. You can measure the period by measuring how long it takes for a few complete rotations and
then divide by the number of rotations to obtain the period of rotation.
Step 6: Critical Analysis: Were you able to calculate the centripetal force from the period and radius of rotation? Why or
why not? Do your data support your prediction in Step 3? What methods could you have used to improve your results?
Discuss with your partner and then write your answers in your notebook.
Guided Inquiry
Step 1: Hypothesize/Predict: What factors do you think would increase or decrease the centripetal force? How could you
alter the experiment to test these factors? Write your ideas in your notebook.
Step 2: Student-Led Planning: Discuss and decide with your partner how to alter the experiment to test your ideas. Get
approval from your teacher before proceeding.
Step 3: Critical Analysis: Which factors increased or decreased the centripetal force? Which factors have no effect? Do
these observations match your prediction?
38
Page 40

Assessments
1. What is the source of the force causing the centripetal acceleration? How did you change the centripetal
acceleration?
2. What measurements enabled you to calculate centripetal force when the radius could change as you twirled the
stopper? What intermediate calculations did you have to make in order to ultimately calculate centripetal force by
this method?
3. How were you able to measure the centripetal acceleration from just the period and radius of the motion? What
intermediate calculations did you have to make to ultimately calculate centripetal force by this method?
39
Page 41

Lab 6:
Hooke's Law and Spring Energy
40
Page 42

In this lab you will learn
● how to measure a spring constant on a spring bumper of a cart ; and
● how to determine the energy of a compressed spring bumper on a cart using the law of conservation of energy
Activity 1: Pre-Assessment
1. What is meant by the term ideal spring? What factors could affect the strength of the spring? Are shorter springs
stiffer? For example, if a spring is cut in half, will each half-spring be stronger or weaker than the original spring?
2. How could you measure and compare the strengths of two or more springs qualitatively? Describe a simple
experimental procedure illustrating the qualitative behavior of an ideal spring when stretched to different lengths.
3. Discuss the answers to questions 1 and 2 with the class.
Activity 1: Hooke’s Law
Most springs exhibit linear elastic behavior, provided that applied force is not large enough to permanently deform
the spring. In a linearly elastic spring, the stretch (or compression) of the spring, measured as displacement from its
unstrained length, is directly proportional to the applied force. This is expressed in the equation
where F is the applied force in newtons, k is the spring constant, and x is the spring extension distance in meters. This
relationship is derived from Hooke’s law, named after the British physicist, Robert Hooke, who researched oscillatory
motion in the mid-seventeenth century.
A spring that behaves according to Hooke’s law is called an ideal spring. If an elastic material is stretched or
compressed beyond a certain point, it will not return to its original state and will remain permanently deformed.
Therefore, it will no longer obey Hooke’s law. The displacement beyond which permanent deformation occurs is called the
elastic limit.
Safety Precautions
● Do not place the carts on the floor where someone could slip on one.
● Be careful when stretching the springs, because you could hurt someone if the spring is released near the body,
especially near someone’s eyes or face.
For this activity you will need the following:
● Spring bumper provided with the cart
● Mass set with hanger
● Ring stand
● Table clamp (C-clamp)
● Ring-stand clamp
● Ruler in cm
For this activity you will work in pairs.
41
Page 43

Structured Inquiry
Step 1: Hypothesize/Predict: Examine the spring bumper provided with the cart. Predict whether the bumper is an ideal
spring. Explain why you made this prediction.
Step 2: Detach the spring bumper from the cart. Measure the length of unstrained spring and record that in your
notebook. Set up your experiment as shown in the diagram. (Figure 6.1)
Figure 6.1: An experimental setup to investigate whether the spring obeys Hooke’s law.
Step 3: Student-Led Planning: Measure the stretch of the spring for different weights you place on the spring. Discuss with
your partner how best to take the measurements of the spring stretch for different weights. Create a data table for your
measurements. Carry out the measurements following the procedure you decided on. Determine the spring constant
based on your data, and show your calculations in your notebook. Remember to include units in all measurements and
calculations.
Step 4: Critical Analysis: Did your data support the prediction you made in step 1? Why or why not? What methods could
you have used to improve your results? Discuss these improvements with your partner, and then write your answers in
your notebook.
Guided Inquiry
Step 1: Hypothesize/Predict: Recall that Hooke’s law can be applied both to the stretch and the compression of a spring.
Predict whether Hooke’s law holds true if you compress the spring of a bumper. Write your ideas in your notebook.
Step 2: Student-Led Planning: How can you alter your procedure to test your hypothesis in step 1? What information will
you collect, and how will you display your experimental data? Write your ideas in your notebook.
Step 3: Show your proposed procedure for testing your hypothesis from step 1 to your teacher for approval. Revise your
procedure, if needed, and complete the experiment. Record your measurements and observations in your notebook.
Determine the spring constant based on your data, and show your calculations in your notebook. Make sure to indicate
units for all measurements and calculations.
Step 4: Critical Analysis: Compare and contrast the behavior of the spring when it was stretched (structured inquiry) and
when it was compressed (guided inquiry). What was similar in compressing and in stretching the spring, and what was
different? Discuss your answers with your partner, and write them in your notebook.
42
Page 44

Assessments
1. Three different springs have the same length before being stretched. The same mass is attached to each of the
springs, as shown in the figure.
a. Which spring has the greatest spring constant? Which one has the smallest spring constant?
b. Explain your reasoning.
2. A student measures the length of a spring with several different masses attached and records the measurements
as shown in Table 6.1. Using the data, determine whether the spring is an ideal spring. Justify your answer.
Table 6.1
Mass on the spring (g) Length of the spring (cm)
40 5.5
60 6.0
80 6.5
100 7.0
120 7.5
140 8.0
160 8.5
180 9.0
43
Page 45

3. Figure 6.2 shows a graph of a force F in newtons exerted on an ideal spring, versus the displacement x from the
spring’s unstrained length, measured in meters. At the end of the experiment, the spring did not return to its
original shape.
Figure 6.2: Force exerted on a spring as a function of how it is stretched.
a. What is the range of force for which Hooke’s law applies? What is the spring constant for this range?
b. What is the spring’s elastic limit? What happens when the spring is stretched beyond this limit?
44
Page 46

Activity 2: Pre-Assessment
1. Does a spring have energy when compressed or stretched from its unstrained length? If so, is the energy potential,
kinetic, or both? How do you know? What could the elastic potential energy of the spring depend on?
2. A cart with a spring bumper is placed at the base of an inclined ramp, the spring is compressed, and the cart is
released to go up the ramp. Assuming there is no friction between the cart and the ramp, what happens to the
mechanical energy of the cart as it travels? Describe transformations of energy of the cart as it moves up the
incline.
3. Discuss the answers to questions 1 and 2 with the class.
Activity 2: Spring Energy
According to the law of conservation of energy, the total energy of a closed system (its internal energy) remains
constant. In this activity, you will use a cart with a spring bumper placed on an inclined ramp. The cart is positioned on the
ramp so that its spring is compressed against a wall (See Figure 6.4). The Earth-cart-spring system is closed and energy
exists in the compression of the spring, in the movement of the cart, and in the cart’s gravitational interaction with Earth.
Thermal energy is also present, but we can assume that it is negligible.
Initially, all of the mechanical energy is in the compressed spring, which pushes the cart up the slope. The cart
momentarily reaches its highest point where its gravitational potential energy is at its maximum. If mechanical energy is
conserved for this system, then the original spring potential energy must equal the increase in gravitational potential
energy. The gravitational potential energy of the cart is
where m is the mass of the cart, is acceleration due to Earth’s gravity, and h is the height of the cart above
its starting position. The potential energy of the spring is .
where k is the spring constant and x is the stretch or compression of the spring.
In this lab, you will measure the spring potential energy of the compressed spring and the gravitational potential
energy of the cart when it comes to rest on the incline. Then you will compare the two energies to see if mechanical
energy was indeed conserved.
Safety Precautions
● Do not place the carts on the floor where someone could slip on them.
● Be careful when stretching the springs, because you could hurt someone if the spring is released near the body,
especially near someone’s eye or face.
● Flip the cart over when it is on the table to prevent it from accidentally rolling off the table.
For this activity you will need the following:
● Cart with spring bumper
● Track or ramp with end stop
● Meter stick
● Protractor
● Stopwatch
● Masking tape or marker
For this activity you will work in pairs.
45
Page 47

Structured Inquiry
Step 1: Hypothesize/Predict: How would you predict the compression x of the spring to be related to the greatest height
the cart reaches on the incline? Use conservation of mechanical energy to write an equation relating the potential energy
of the spring, in terms of its compression, to the gravitational potential energy of the cart, in terms of the greatest height h
it reaches, including other variables as needed. Rearrange the equation so that it predicts the change in height of the cart
from the compression of the spring. Then use the equation to predict how the maximum height changes if the spring
compression is larger or smaller.
Step 2: Student-Led Planning: You will need to know the spring constant of the spring to determine the energy stored in
the compressed spring. Decide with your lab partner how to measure the spring constant of the spring by hanging a
known mass from it. Write your answer in your notebook, along with the equation for the spring constant in terms of what
will be measured. Measure the spring constant, and write your result and how you calculated it in your notebook.
Step 3: Place the cart on the inclined ramp with the spring against the end stop as shown in Figure 6.3. For each trial, you
should be able to compress and release the spring to propel the cart up the incline.
Figure 6.3: The setup for this experiment should allow you to propel the cart up the incline.
Step 4: Student-Led Planning: You will now need to collect data to test how well your energy conservation equation from
Step 1 predicts experimental results. Which variables will you adjust, and which will you merely observe and record?
Discuss with your partner how best to take the measurements of these variables. In your notebook, create a data table for
your measurements. Include in your table a column for the spring compression, a column for the change in height of the
cart, a column for the spring potential energy, and a column for the maximum gravitational potential energy of the cart.
Show your calculations in your notebook. Make sure you include appropriate units and carry out any unit conversions
needed. Proceed to carry out your planned experiment.
Step 5: Critical Analysis: Were the predictions you made in Step 1 supported by the data? Why or why not? If there was a
significant difference between the initial energy of the spring and the final gravitational potential energy of the cart, does
the difference represent a loss or gain of mechanical energy? How can you account for the energy gain or energy loss you
observed? Discuss your answers with your lab partner, and write them in your notebook.
Guided Inquiry
Step 1: Hypothesize/Predict: What is the mathematical relationship between the energy of a spring and the compression
of the spring when Hooke’s law applies? What is the relationship between the height the cart rises and its gravitational
potential energy? Use these relationships to predict the general shape of a graph of maximum cart height versus spring
compression. Discuss your answers with your lab partner and write your predictions in your notebook, including a sketch
showing the shape of the graph you expect.
Step 2: Student-Led Planning: Discuss with your lab partner how best to collect your data. Measure the maximum height
reached by the cart for several different measured values of spring compression. Record your measurements and
observations in your notebook. Plot a graph of observed height versus compression as part of your work.
46
Page 48

Step 3: Critical Analysis: How well did your experimental results agree with your predictions? Discuss with your partner
what may have caused any disagreement between your results and your predictions. Write your answers and explanations
in your notebook.
Assessments
1. The same low-friction cart is placed against the same spring on three different ramps. The spring is compressed by
the same amount each time and then released. Assume that spring mass is negligibly small compared to the mass
of the cart.
a. In Figure 6.4, draw the cart in its highest position on each ramp.
b. Provide an explanation for your drawings.
Figure 6.4: Three ramps with different slopes.
2. A low-friction cart descends the ramp from a height of 40 cm and hits an ideal spring at the bottom of the ramp,
compressing it by 2.0 cm.
a. In the second experiment, the compression of the spring is doubled. What was the initial height of the cart?
b. In the third experiment, the compression of the spring is halved. What was the initial height of the cart?
c. Explain your answers.
3. A 100 g ball is dropped from several different heights onto a vertical spring with a spring constant k = 200 N/m, as
shown in Figure 6.5.
Figure 6.5
a. Given Table 6.2, listing measurements of the heights h for each compression x from this experiment, calculate
the spring energy, PEs, and plot it as a function of compression, x. Use g=10 m/s2 to simplify calculations. What
type of graph represents this relationship?
47
Page 49

Table 6.2
h (cm) x (cm)
2.0 2.0
6.0 3.0
12.0 4.0
20.0 5.0
30.0 6.0
42.0 7.0
b. Obtain the equation giving the spring energy in terms of compression, x, and spring constant, k. Show details of
your calculations.
48
Page 50

Lab 7:
Impulse and Momentum
49
Page 51

In this lab you will learn
● how to predict the dynamic properties of an elastic collision using the principle of conservation of linear
momentum and the principle of conservation of energy
● to qualitatively predict, in terms of linear momentum and kinetic energy, how the outcome of a collision between
two objects changes depending on whether the collision is elastic or inelastic
Activity 1: Pre-Assessment
1. What do you notice happens when objects collide (like car accidents and athletes colliding on the field) in terms of
energy and direction of travel? How does this change if the objects have the same mass? What if they have
different masses?
2. Can you predict how various objects will move after a collision? What do you need to know about the objects to
predict their motion? Why is this information important?
3. Discuss the answers to questions 1 and 2 with the class.
Activity 1: Momentum
Just as objects with mass and velocity all have kinetic energy, they also all have momentum. One way to study this
momentum is to observe how the objects transfer or lose that momentum during a collision. A fast change in momentum
can cause serious harm to a living being, so learning about momentum helps us design machines, play sports more safely,
and even understand future technologies that will allow for space travel.
Before you can perform calculations with momentum, however, you must first determine if the collision is elastic
or inelastic. An elastic collision conserves internal kinetic energy; that is, no kinetic energy is lost or gained by the system.
In an inelastic collision, the internal kinetic energy changes (it is not conserved). For the purposes of this experiment, we
will assume our collisions are elastic.
Safety Precautions
● Marbles may create a hazard on the floor. Take precautions when moving around.
For this activity, you will need the following:
● Two marbles of approximately the same size
● Track or wrapping paper tube
● Masking tape
For this activity, you will work in groups of 2 to 3.
Structured Inquiry
Step 1: Find the mass of each marble given to you by your instructor. Set up the track so that it is held at a fixed angle,
approximately 30°, with the second marble centered at the very bottom of the ramp, as illustrated in Figure 7.1. Make a
drawing of the setup in your notebook.
50
Page 52

Step 2: Calculate the velocity of the first marble right before it collides with the second marble, if it is released from rest at
the top of the track. At a height, h, higher than the bottom of the ramp, the potential energy of the marble of mass, m, is
. At the bottom of the ramp, this potential energy has been converted into kinetic energy, given by .
The factor of in place of results from some of the kinetic energy of the rolling marble going into rotational motion.
Equate the two energies and solve for the velocity of the marble at the bottom of the ramp in terms of its height at the
top of the ramp.
Step 3: Obtain equations for the distance, d, from the end of the table to where it strikes the ground of the second marble
in terms of the velocity, v. Record these equations in your notebook.
Figure 7.1: The setup shown will allow you to control the side-to-side movement of the marble and the initial energy of the system. Be sure to use
more or fewer books to adjust the height in your own setup.
Step 4: Hypothesize/Predict: What will happen when the two marbles of equal mass collide at the bottom of the ramp?
How do you think mass and velocity are related to momentum? Suppose the velocity of the first marble at the bottom of
the ramp is transferred completely to the second marble. Use the kinematic equations to determine the horizontal
distance the second marble will travel before it hits the floor. Add your predictions and calculations to your notebook.
Create a data table to hold the values you recorded and calculated in this and previous steps.
Step 5: Student-Led Planning: Perform three trials of the experiment. Be sure to release the marble from the same height
each time. Then change the angle of elevation of the ramp, calculate new velocities and distances, and perform three
more trials at the new angle. Discuss with your partner how to minimize differences between trials.
Step 6: Critical Analysis: Using the data you have collected, derive an equation that relates the mass and velocity of both
objects, just before the collision, to the mass and velocity of both objects just after the collision. Were the predictions you
made in Step 3 supported by your data? Why or why not? What methods could you have used to improve your results?
Why is the collision not perfectly elastic? Where is energy lost? Discuss these questions with your partner, and then write
your answers in your notebook.
Guided Inquiry
Step 1: Hypothesize/Predict: Your instructor will now mark a spot on the floor on a sheet of paper placed at the bottom of
the ramp. With your partner, hypothesize an angle, and a 20° range of angles around it, at which you could set the ramp
so that the second marble lands on the paper. Write your ideas in your notebook.
51
Page 53

Step 2: Student-Led Planning: Using the formula you derived in Step 3 of the Structured Inquiry and your data, calculate
the angle at which you would need to place the ramp to ensure the second marble lands within the edges of the paper.
Write your results in your notebook.
Step 3: Critical Analysis: Was your team successful in landing your marble in the zone? If yes, how accurate was your
predicted range for the angle of the ramp? Calculate the distances the marble would travel if the angle were at each end
of your selected range. If not, recalculate and try again until you are successful, and, again, calculate the accuracy of your
range. Discuss your answer with your partner and write it in your notebook.
Assessments
1. A student measures several variables during a collision between two objects of equal mass and gets these results:
a. Calculate whether kinetic energy and momentum are conserved in the collision. Show all of your work.
b. Does this scenario describe an elastic or inelastic collision? Explain how you know.
2. What happens to the kinetic energy lost in an inelastic collision? Since energy cannot be created or destroyed,
what new form does the lost kinetic energy take?
3. Would a person in a car colliding with a wall feel the change in momentum more when the car’s acceleration is
large or small? Why?
52
Page 54

Activity 2: Pre-Assessment
1. Using the outcome of Activity 1, what can affect the motion of objects after a collision? What parts of a collision
can we control when designing a bumper?
2. Think about at least three different styles of bumpers you have seen on automobiles. Explain several advantages
and disadvantages to each design.
3. Discuss the answers to questions 1 and 2 with the class.
Activity 2: Bumper Design
How do car bumpers work to save the passengers of a car? Have bumper designs changed over the course of
automotive history? Look at the pictures provided here in Figure 7.2 and think about the bumpers you have seen on cars
and trucks. What makes them different? How are they the same? Now that you are thinking about momentum and how
bumpers are designed, work with a partner to brainstorm how momentum, and the related concept of impulse, is
involved in bumper design and car safety.
Safety Precautions
● Keep the cart under control at all times. Also, do not leave the cart on the floor when not in use or anywhere else
where someone could fall because of it.
For this activity, you will need the following:
● Cart
● Tape
● Paper
● Force sensor
For this activity, you will work in pairs.
Figure 7.2: Car bumpers have changed over time and come in many shapes, styles, and materials.
53
Page 55

Guided Inquiry
Step 1: Hypothesize/Predict: How do you think the shape of the bumper and the material it is made of determine how it
functions during a collision? Using the formulas you derived in the first activity, think about what elements of the collision
you can control by designing your own bumper. Write your ideas in your notebook.
Step 2: Student-Led Planning: Choose materials from those provided by your instructor to create a bumper for your cart.
Work in pairs to develop and test your bumper designs using the force sensors. Attempt to keep all variables constant
except the design of your bumper. Try to design the bumper so it would minimize the forces encountered in bringing the
moving object they are mounted on to a stop. Write your results in your notebook.
Step 3: Critical Analysis: Which bumper designs worked best in their apparent ability to bring a moving object they are
mounted on to a stop with the least force? What could have been improved? How could other materials, that you know of
that were not provided, have helped you to design a more effective bumper? Discuss your answer with your partner and
write it in your notebook.
Assessments
1. The impulse in a collision can be calculated as the average force that acts times the time it acts. What quantities
that go into this calculation can be controlled in a collision?
2. What aspect(s) of a collision are modern bumpers designed to change to reduce the impulse felt?
3. Explain how an airbag works. What concept related to Newton’s first law of motion causes the person to hit the
airbag when a collision occurs?
54
Page 56

Lab 8:
Conservation of Momentum
55
Page 57

In this lab you will learn
● how to determine if momentum is conserved during an elastic collision when a moving object collides into a
stationary object of the same mass
● how to determine if momentum is conserved during an inelastic collision when a moving object collides with
another object and comes to a complete stop
● how to determine if momentum is conserved during an elastic collision when a moving object collides with other
moving objects of different masses. Use a velocity-time graph to find out the time of the collision
Activity 1: Pre-Assessment
1. What do you think might happen to the kinetic energy and momentum of one toy car that collides with another
toy car in its path? Does the momentum of the first car change because of the collision? Does the momentum of
the second car change because of the collision? Does the kinetic energy of the first car change because of the
collision? What about the kinetic energy of the second car?
2. Think of ways to measure the time taken by the car to travel from one end of the table to another. Think of ways to
measure the distance traveled by the car before and after the collision.
3. Discuss the answers to questions 1 and 2 with the class.
Activity 1: Elastic Collision
In most collisions, we assume there are no net forces acting from outside the system, and the total momentum is
the same before and after the collision. An elastic collision is one in which the total kinetic energy is also unchanged by
the collision. Billiard balls provide a good example. When billiard balls collide, the total momentum after the collision is
the same as the total momentum before the collision. Even though one of the balls may slow down after the collision,
thereby decreasing its own kinetic energy, this is almost entirely because it transfers kinetic energy to the other ball,
which then travels with increased kinetic energy and momentum. We can take the total kinetic energy of both billiard balls
to be unchanged, making it an example of a perfect or near-perfect elastic collision.
Safety Precautions
● Inform your teacher immediately of injuries caused by moving objects.
● Clean up and inform your teacher immediately about any broken objects to prevent people from being injured.
● Objects that can roll are hazardous to step on unexpectedly. If the floor is used to roll the carts, immediately
remove any cart that rolls out of the temporary test area of the floor.
For this activity you will need the following:
● A rectangular table with a flat surface where the length of the table is longer than the width, or a large, clear floor
surface
● Two lab carts of different mass
● One ruler
● Lab scale
● Three chalk pieces of different colors
● Three stopwatches, numbered 1–3, or video camera to record the actions
For this activity you will work in pairs if using a video camera, or groups of four if using stopwatches.
56
Page 58

Structured Inquiry
Step 1: The idea behind this experiment is to compare the total momentum after a collision with the total momentum
before a collision by colliding one moving cart into a second cart at rest. You will determine the initial and final velocities
of both carts to calculate the momentum of each cart. You will also use the data you collect to calculate and compare the
initial and final kinetic energies.
To measure the velocity of each cart before and after the collision, place chalk marks on the table, one a short
distance after the place where the first cart will be released, another where the second cart is at rest, and the third a
distance after that. The chalk lines are distance markers for pressing the stopwatch as a cart passes the line. If
stopwatches are used, choose one student to be in charge of each stopwatch and one in charge of setting the cart into
motion. If a video camera is used, two lab partners can divide the tasks.
Step 2: Hypothesize/Predict: Predict what happens to the velocities and momenta of the two colliding carts when the first
cart collides with a second cart of smaller mass in its path. In which direction do you predict each cart will move after the
collision? What might happen to the velocity and momentum of the first colliding cart? What might happen to the velocity
and momentum of the second colliding cart? What would be the total momentum of the two colliding carts before and
after the collision? Will the total momentum be exactly the same or only approximately the same? Add your predictions to
the data table you create.
Step 3: Weigh each colliding cart to determine its mass. For this experiment, the first cart should have greater mass than
the second. If a video camera is not available, follow the steps below: Draw a chalk line that the first cart will cross after it
has been pushed and is rolling on its own. Place the second chalk line where the stationary cart is located, and the third
chalk line a distance after that.
Figure 8.1: Arrangement for using stopwatches to measure the velocities and momenta of a more massive cart colliding elastically with a less
massive cart.
Step 4: Student-Led Planning: What data will you need to find the velocity and momentum of each cart? How exactly will
you measure the quantities needed, and calculate the intended results from the data collected? Discuss with your lab
partner or partners, and describe your proposed method in your notebook. After you have collected your data, you will
want to calculate the total kinetic energy of the carts before collision to compare with the total kinetic energy after
collision. Describe in your notebook how you will use the data already collected to make that comparison. Decide on the
positions of the student timing each part of the motion or operating the video recorder.
Step 5: Use the scale to determine the mass of each cart, and enter the masses into your notebook. Carry out your
measurements for the case of a more massive cart colliding into a less massive one at rest. Determine the time and
distance of travel for each cart before and after collision to find the velocity and momentum of each cart before the
collision and of each cart after the collision. Record your data in the table created in your notebook.
57
Page 59

Step 6: Critical Analysis: Based on the observations and calculations in your data table, were the predictions you made in
Step 3 supported by your data? Why or why not? How did the total momentum of the two carts before collision compare
with the total momentum of the two carts after collision? How accurate were your predictions about the directions in
which the carts would move after collision? What methods could you have used to improve your results? Discuss with
your partner and then write your answers in your notebook.
Step 7: Critical Analysis: Use your data to calculate the kinetic energy each cart had before collision and the kinetic energy
each cart had after collision. How did the kinetic energy of each cart change? Calculate the total kinetic energy of both
carts before collision, and the total kinetic energy after collision. Compare how well momentum was conserved with how
well kinetic energy was conserved. Discuss with your lab partners and write your answers in your notebook.
Guided Inquiry
Step 1: Hypothesize/Predict: How do you think the results of the collision would be different if the less massive cart struck
the more massive cart at rest? How do you think the directions and relative sizes of the velocities of the two carts after
collision would depend on which has the larger mass? Write your ideas in your notebook.
Step 2: Student-Led Planning: How would you design an experiment to measure the total momentum before and after
the collision? List the objects and lab equipment that you would need to conduct your experiment. Describe how you
would measure important values, and what you would calculate from the collected data. Submit your list and research
plan to your teacher. Once your teacher approves, carry out your experiment. Collect your data in your notebook, and
determine the velocities, momenta, and total moment before and after collision. Write your results in your notebook.
Step 3: Critical Analysis: What differences did you notice when the less massive object was moving and struck a more
massive stationary object? Did the results confirm your predictions? How well was total momentum conserved? Discuss
your answers with your partner and write them in your notebook.
Step 4: Critical Analysis: Determine if your data shows conservation of total kinetic energy. Explain any significant loss or
gain of kinetic energy that you found. Discuss your answers with your partner and write them in your notebook.
Assessments
1. A student records the distance traveled by object 1 as 10 cm before and 15 cm after the collision, and the time
before and after the collision as 5.0 seconds each. If the 2 objects have a mass of 1.0 g each:
a. Does this scenario describe a loss in kinetic energy for object 1 after the collision? Why or why not?
b. Does this scenario describe a loss in momentum for object 1 after the collision? Why or why not?
2. How is the kinetic energy of an object changed if its momentum increases?
3. In an elastic collision, the total momentum of two objects before the collision is . . The mass of the first
object is 2.0 g, and its velocity is after the collision.
a. What should be the total momentum of the two objects after a perfectly elastic collision?
b. What is the momentum of the first object after the collision?
58
Page 60

Activity 2: Pre-Assessment
1. What do you think might happen to the kinetic energy and momentum of a slowly moving train car when it meets
and latches onto another train car that is free to roll but not moving? Do the momentum and velocity of the first
car change because of the collision? How? Does the total momentum of both cars change because of the collision?
Does the kinetic energy of the first car change because of the collision?
2. Think of how you can measure the kinetic energy and momentum of a small cart as it moves across the floor after
it is pushed and released.
3. Discuss the answers to questions 1 and 2 with the class.
Activity 2: Inelastic Collisions
A perfectly inelastic collision occurs when two colliding objects stick together after a collision. One example of an
inelastic collision is putty striking a wall. Upon hitting the wall, the putty stops and gets stuck. Both the momentum and
kinetic energy it had have been reduced to zero. In this case, neither kinetic energy nor momentum is preserved. Most
everyday collisions are inelastic (though not perfectly inelastic) because the kinetic energy of the colliding objects are
converted into other forms of energy, such as that associated with producing sound.
Safety Precautions
● Inform your teacher immediately of injuries caused by moving objects.
● Clean up and inform your teacher immediately about any broken objects to prevent people from being injured.
● Avoid allowing any objects, especially those capable of rolling, to remain on the floor outside of the area being
used for testing, to avoid anyone slipping and falling on them.
For this activity you will need the following:
● A rectangular table with a flat surface where the length of the table is longer than the width, or a large, clear floor
surface
● Two lab carts with hook-and-loop fastener tape attached, or a mechanical clip, so that they stick together after
collision
● A video camera to record the experiments, or a stopwatch
● One ruler
● Lab scale
● One chalk piece
● Two stopwatches
For this activity you will work in pairs.
59
Page 61

Structured Inquiry
Step 1: We will now examine what happens in a perfectly inelastic collision, when one moving cart collides into another at
rest with the same mass, and the two stick and move together. To do this, you will need to measure the velocity of the
moving cart before colliding and the velocity of the two carts together after colliding.
Step 2: Hypothesize/Predict: When a moving cart collides into another of the same mass at rest, and the two stick
together, do you predict that the total momentum will be conserved in the collision? How about the total kinetic energy?
How will the velocity of the two carts moving together compare with the velocity the one cart had when it was moving?
Discuss your predictions with your partner and write them in your notebook.
Step 3: Weigh each colliding cart to determine its mass in grams. For this experiment, both colliding carts should have the
same mass. Assure that patches of hook-and-loop fastener tape, or a mechanical clip mechanism, are in place on the two
carts so they will stick together upon collision.
Figure 8.2: Arrangement for using stopwatches to measure the velocities and momenta of two carts undergoing a perfectly inelastic collision.
Step 4: Student-Led Planning: Discuss with your lab partner how you will collect data to determine the velocity of the
single moving cart and then of the two carts moving together after collision. Place the second cart in the path of the first
cart. Start the video camera and record the entire experiment. If you do not have a video camera, you will use
stopwatches to measure the times of travel and the distances between three chalk lines drawn for this purpose. The first
chalk line should be at a location where the first cart is moving but no longer being pushed, the second at the collision
point, and the third a distance after the collision point. Record your data in your notebook. Calculate the initial velocity of
the first cart and the final velocity of the two carts. Then calculate the total momentum before and after the collision.
Step 5: Critical Analysis: Based on the observations and calculations in your data table, were the predictions you made in
Step 3 about the initial and final velocity supported by your data? Does your data support the law of conservation of
momentum? Explain any causes you can think of for any observed disagreement. What methods could you have used that
would improve your results? Discuss with your partner and then write your answers in your notebook.
Guided Inquiry
Step 1: Hypothesize/Predict: How do you think the results of the inelastic collision experiment would differ if the collision
were between carts of unequal mass? Write a mathematical expression for the total momentum of Cart 1 and Cart 2 if
Cart 1 has mass m1 and velocity v
1i
and Cart 2 has mass m2 and is not moving. Then write an expression for the total
momentum of Cart 1 and 2 stuck to each other and moving together at velocity v. Work with your partner to apply
conservation of total momentum to equate the two expressions and to solve the equation that results to predict the final
velocity in terms of the initial velocity and the two masses. Write your derivation and prediction in your notebook.
60
Page 62

Step 2: Critical Analysis: Based on the observations and calculations in your data table, were the predictions you made in
Step 3 about the initial and final velocity supported by your data? Does your data support the law of conservation of
momentum? Explain any causes you can think of for any observed disagreement. What methods could you have used that
would improve your results? Discuss with your partner and then write your answers in your notebook.
Guided Inquiry
Step 1: Hypothesize/Predict: How do you think the results of the inelastic collision experiment would differ if the collision
were between carts of unequal mass? Write a mathematical expression for the total momentum of Cart 1 and Cart 2 if
Cart 1 has mass m1 and velocity v
1i
and Cart 2 has mass m2 and is not moving. Then write an expression for the total
momentum of Cart 1 and 2 stuck to each other and moving together at velocity v. Work with your partner to apply
conservation of total momentum to equate the two expressions and to solve the equation that results to predict the final
velocity in terms of the initial velocity and the two masses. Write your derivation and prediction in your notebook.
Step 2: Student-Led Planning: Discuss with your partner how to test your prediction by collecting velocity data using
methods and equipment from this lab. Carry out the experiment, and enter the masses and measured velocities in a data
table in your notebook.
Step 3: Critical Analysis: Use your mass and velocity data in the expression for the final velocity you derived in Step 1 to
find a numerical value of the predicted velocity. How well does your prediction compare with your measured final velocity
of the two carts moving together? Comment on any reasons you can think of for any substantial disagreement. How could
you improve the accuracy of your data? Discuss your answers with your partner and write them in your notebook.
Assessments
1. A student records data about a collision between two objects. Object 1 travels a total of 2 seconds before the
collision while object 2 travels 5 seconds before the collision. If both objects have the same mass and object 1
traveled 10 cm and Object 2 traveled 25 cm before the collision,
a. does this scenario describe object 1 with greater momentum than Object 2 before and after the collision?
Why or why not?
b. does this scenario describe object 2 with greater kinetic energy than Object 1 before and after the collision?
Why or why not?
2. Is it possible for an object to have momentum but not kinetic energy, or kinetic energy without having
momentum?
3. In an inelastic collision, where a ball hits a wall, the total momentum of the ball before the collision is .
a. If this collision is inelastic, will the momentum of the ball after the collision be the same, greater, or lesser?
b. What is the momentum of the wall after the collision?
61
Page 63

Lab 9:
Simple Harmonic Motion
62
Page 64

In this lab you will learn
● how to predict what properties determine the motion of a simple harmonic oscillator and explain the dependence
of the motion on these properties
● how to design, plan, and carry out experiments that let us describe a simple harmonic motion and find its
quantitative characteristics
● how to measure simple harmonic motion and analyze data to find relationships between the properties of simple
harmonic motion, as well as, determine unknown properties from the measured data
Activity 1: Pre-Assessment
1. What properties of a simple pendulum might possibly determine the period of the pendulum oscillations?
2. What experiments can you design to check which of these properties affect the period T and which properties do
not matter?
3. Discuss the answers to questions 1 and 2 with the class.
Activity 1: Measuring the Period of a Simple Pendulum
The period of oscillation is the amount of time for the oscillating system to return to the state (position and velocity
direction) that it had at the beginning of the observation. In this activity, we will measure the period of several pendulums
using a stopwatch. The pendulums will differ in the mass of the bob and the length of the string. We will need to make
several measurements for each pendulum to reduce the uncertainty in the results.
Safety Precautions
● Be careful when swinging weights used in a pendulum so that they do not hit anyone or anything in the classroom.
For this activity you will need the following:
● String
● Set of calibrated masses
● Stopwatch or timer
● Meter stick
● Protractor
● Support rod
For this activity you will work in pairs.
Structured Inquiry
Step 1: Build a pendulum by attaching the string to the mass and mounting the other end of the string onto a rigid
nonmoving support. Then measure and record the length of the string and the mass of the pendulum bob in your
notebook.
Step 2: Hypothesize/Predict: What properties of the pendulum created in Step 1 will increase or decrease its period T?
Record your answers in the notebook.
Step 3: Student-Led Planning: You will now measure the period of the pendulum. Instead of trying to time one swing, time
how long the pendulum takes to make at least 10 swings. Then divide the measured time by the number of swings to get
the time for one complete swing. A complete swing is one cycle of motion from one side to the other and back. Discuss
with your partner the best way to make these measurements. Measure the time at least three times and use the average
of the three measurements.
63
Page 65

Step 4: Repeat your experiment using at least two other pendulums with two different bob masses and two different
lengths of string. Record the length of the string, mass of the period, and the resulting period values for each pendulum.
Step 5: Critical Analysis: In Step 2, did you accurately predict the factors that affected the pendulum period? Why or why
not? How did taking multiple trials reduce error in your measurements of the periods? Record your findings in the
notebook.
Guided Inquiry
Step 1: Hypothesize/Predict: Do you think the mass of the bob or the length of the string of a simple pendulum
determines the period T of its oscillations? Does the initial angle have any effect on T? What other factors might
possibly influence the period? Write your ideas in your notebook.
Step 2: Now, pick five masses to be used as the pendulum bobs. Build a pendulum with each of the masses. Using the
stopwatch or timer, determine the period of oscillation for each pendulum as in the structured inquiry above.
Step 3: Student-Led Planning: Now, test the same pendulums you created in Step 2, but change the initial angles of the
pendulum. Use values of the initial angle between approximately 10° and 40°. Record the new pendulum periods in a new
data table within your notebook.
Step 4: Finally, use the same mass of the bob with five different lengths of string and measure the period T for each.
Record the new pendulum periods in a new data table within your notebook.
Step 5: Critical Analysis: Which of the tested factors or properties determined the period T of the pendulum oscillations?
Discuss your answer with your partner and write it in your notebook.
Assessments
1. A student builds a pendulum with a 100 g bob and a 30 cm string. Then the student measures the period of the
pendulum oscillations starting from the initial displacement of 10°, 20°, 30°, and 40°. The period values are
found to be 1.2 s, 1.2 s, 1.3 s and 1.3 s.
a. Does the value of the initial displacement significantly affect the length of the period?
b. Does this scenario fit the model of a simple pendulum with a point mass and massless string if the mass of
the string is 1.0 g and the diameter of the bob is 2.0 cm? Why or why not?
2. What does the accuracy of a measurement indicate about the measurement?
3. A student builds a pendulum with a 100 g bob and a series of 30 cm, 40 cm, 50 cm and 60 cm strings. Then the
student measures the period of oscillation of each pendulum. The period values are found to be 1.2 s, 1.4 s, 1.5 s,
and 1.7 s.
a. Does the length of the string significantly affect the period of the pendulum’s motion? If so, describe the
dependence.
b. The mass of the bob on the 30 cm pendulum is changed to 50 g. The period is measured to be 1.3 s. Is this
data point sufficient to form a conclusion about whether the mass of the bob affects the period of the
oscillations? Why or why not?
64
Page 66

Activity 2: Determining the Value of the Free-Fall Acceleration g Using a Simple Pendulum
In the next part of the lab, we will determine the acceleration g due to gravity by measuring the value of the period
of a simple pendulum and applying Equation 4. The value of g is usually stated in textbooks to be 9.8 m/s2. It varies in the
third significant figure with elevation and from place to place. There is also a standard value of g, defined to be 9.80665
m/s2, which represents an average value at sea level at 45° latitude.
Activity 2: Pre-Assessment
1. How is the value of g related to the period of a simple pendulum?
2. What experiments can you design to determine the value of g using a simple pendulum?
3. Discuss the answers to questions 1 and 2 with the class.
Activity 2: Determining the Value of the Acceleration Due to Gravity g Using a Simple
Pendulum
In order to find a reliable value of g, we will need to measure the period of the simple pendulum and its length.
The main task is to make these measurements as accurate as possible.
Safety Precautions
● Be careful when swinging weights used in a pendulum so that they do not hit anyone or anything in the classroom.
For this activity you will need the following:
● String
● Meter stick
● A mass
● Stopwatch or timer
● Support rod
For this activity you will work in pairs.
Structured Inquiry
Step 1: Build a simple pendulum. Measure the length of the string as accurately as you can and record it in your notebook.
Step 2: Hypothesize/Predict: How will the value of g depend on the period of the pendulum? Record your answers in the
notebook.
Step 3: Student-Led Planning: You will now measure the period of the simple pendulum as accurately as possible in order
to obtain the value of the acceleration due to gravity g. Discuss with your partner the best way to set up this experiment.
Discuss possible sources of errors and ways to reduce their impact.
Step 4: Critical Analysis: Record the period of the pendulum in a number of measurements. Discuss the reduction of error
achieved by taking appropriate measures planned in the previous step. Record your findings in the notebook making
tables for the period and g for each measurement. Compare your average results with the textbook value of
, and discuss possible sources of disagreement.
65
Page 67

Guided Inquiry
Step 1: Hypothesize/Predict: If you had done the experiment to determine g with different values of the pendulum
length, how would it affect the accuracy of your results? Explain how you think this would happen. For example, what
would change if you increased the length, and would this make your time measurements more accurate or less accurate?
Write your ideas in your notebook.
Step 2: Student-Led Planning: Discuss with your partner how you can test your predictions. Make a table in your notebook
for your experiment. Build the pendulums you will test and carry out the measurements.
Step 3: Critical Analysis: What can you do to further reduce the error? Discuss your answer with your partner and write it
in your notebook.
Assessments
1. A student builds a pendulum with a 100 g bob and a 30 cm string. Then the student measures the period of the
pendulum oscillations in four tries. The period values are found to be 1.0 s, 1.0 s, 1.1 s, and 1.1.
a. What is the period of the pendulum based on the data?
b. What is the experimental value of g implied by each value of the period, the average experimental value of
g, and the average error?
c. Does the experimentally measured value of g agree with the textbook value to within the uncertainty of
measurement?
2. What can be the reason for inaccuracy in the textbook value of g?
3. What can be sources of inaccuracy in measuring the period of the simple pendulum that lead to errors in
estimating the value of the free-fall acceleration g?
66
Page 68

Lab 10:
Rotational Motion
67
Page 69

In this lab you will learn
● how to represent the rotational motion of an object descriptively and mathematically
● how to design an experimental investigation of the motion of a rotating object
● how to analyze experimental data describing the motion of a rotating object
● how to calculate the total energy of a system that includes a rotating object
Activity 1: Pre-Assessment
1. Why is the movement of a lever on its fulcrum (in Figure 10.1) considered rotational motion? Could you move the
lever so that one of its outer edges completes a full rotation? How could you measure the radius?
2. If you place a mass on the lever, what factors will affect its motion? How would placing a second mass on the other
side of the lever affect its motion? Why? How can you explain the net motion of the lever with masses on either
side of the fulcrum in terms of conservation of energy within the system of the lever and the masses?
3. Discuss the answers to questions 1 and 2 with the class.
Activity 1: Torque Lab
To investigate if the net torque on an object needs to be zero in order for it to balance and have zero angular
acceleration, we will use the set up shown in Figure 10.1. It consists of a meter stick that can rotate around the point
where a fulcrum supports it. Different weights are placed on it and it is positioned to balance. Note that the torque from
the mass tends to twist the meter stick clockwise and rotate it counterclockwise. Because the two torques act to cause
opposite rotation you will want to give one of them a minus sign relative to the other when performing calculations.
Figure 10.1: The weight of mass produces a torque tending to rotate the lever clockwise. The torque has magnitude and is given a plus
sign if it is twisting counterclockwise and a minus sign for twisting clockwise.
Safety Precautions
● Take caution with rotating levers. Be sure they are held far enough away from your face and from other students
so that they will not strike anyone when rotated.
For this activity you will need the following:
● Lever (a meter stick or similar object and a fulcrum)
● Set of standard masses or similar solid objects
● Protractor
For this activity you will work in groups of four.
68
Page 70

Structured Inquiry
Your challenge is to measure the necessary information to calculate the torque from each force, to calculate the net
torque, and to see if the condition for the meter stick to balance, with no tendency to rotate to the left or right, is for the
torques you calculate to add up to zero.
Step 1: Your goal in this lab is to collect data needed to calculate the torque clockwise and
counterclockwise. You will want to assign torques opposite signs because they twist in the opposite sense of rotation to
get the net torque. Create a data table for your measurements.
Step 2: Hypothesize/Predict: Suppose you have already balanced the weights as shown in Figure 10.1. What value would
you predict of the net torque, taken as the sum of the two torques, with their sign taken into account? Predict how the
torques will change if you move the mass m2 closer to the end of the meter stick. What effect will that have on the net
torque, taken to be the sum of the two torques, with their sign taken into account? What effect do you predict that will
have on the orientation of the meter stick?
Step 3: Student-Led Planning: You will measure the weight of the two equal masses, place them on the meter stick and
carefully slide the meter stick to a position on the fulcrum where it balances. You will then want to collect all the data
needed to calculate the net torque. The position markings on the meter stick will help. Then you will collect the same data
when the meter stick is balanced with one mass being twice the other. Note that if your fulcrum is pointy, it may not
actually balance, but the balance point can be taken to be where the lever switches from tending to rotate one way to
tending to rotate the other. Discuss with your lab partner what data you will collect in order to be able to calculate two
torques for both cases. Make a data table in your notebook.
Step 4: Proceed to collect data and enter it into the data table in your notebook. Calculate the net torque for each case,
and write it in your notebook.
Step 5: Critical Analysis: Were the predictions you made in Step 2 supported by your data? Did the net torque come out to
be close enough to zero when the meter stick was balanced? Why or why not? What methods could you have used that
improved your results? Discuss with your partner and then write your answers in your notebook.
Guided Inquiry
Step 1: Hypothesize/Predict: How do you think the experiment would have differed if you had used three weights, two at
different positions on one side and one on the other side? What would the net torque be when the meter stick is
balanced? Write your ideas in your notebook.
Step 2: Student-Led Planning: Discuss the details of your experiment to test your predictions with your lab partner. How
will you calculate the net torque when the forces are acing at three different positions? Write your answers in your
notebook.
Step 3: Critical Analysis: Did your results show the net torque to be zero when the meter stick balanced? Discuss your
answer with your partner and write it in your notebook.
69
Page 71

Assessments
1. Explain how the torque produced by a weight placed on the meter-stick lever changed if the distance of the weight
from the fulcrum was increased, and then decreased.
2. Explain how the different masses you investigated in Activity 2 affected the torque that they produced on the
lever.
3. Think about how the weight of the meter stick influences the direction in which it tends to rotate.
a. Imagine balancing the meter stick on the fulcrum without any additional masses. How would the meter
stick move if you placed the fulcrum off center? Why?
b. How did the weight of the meter stick influence its rotational motion when you were balancing the weights
on either side of the fulcrum?
70
Page 72

Activity 2: Rolling Cylinders
For a single rotating point, rotational inertia, also known as moment of inertia (I) is equal to , where m is mass and r
is the point’s distance to the axis of rotation (which can be thought of as a radius). For a whole rotating object, rotational
inertia is the sum of the moment of inertia of each point in the object. We use a capital R to distinguish the radius of the
entire spinning object from the radius (r) of any point in the object. Consult the table of rotational inertias Table 10.12 for
simplified rotational inertia formulas for objects of various shapes.
In this lab, you will use a ramp to investigate a rotating cylinder’s moment of inertia and energy. You will test how
different distributions of mass in the cylinder affect its motion. The energy of a cylinder rolling down an incline (without
slipping) can be described by the following equation
where m is the mass of the cylinder, R is its radius, and v is the linear speed of the rolling cylinder when its height has
decreased by h. You can think of I/mR2 as a geometrical factor reflecting how mass is distributed in the cylinder, since it
takes into consideration the moment of inertia as well as the mass and radius of the cylinder. At a given height, if mass is
distributed toward the edge of the cylinder, I/mR2 increases and therefore velocity decreases.
Safety Precautions
● Take caution with rolling cylinders. Do not throw cylinders. Do not allow cylinders to roll onto the floor, as they
may cause a tripping hazard.
For this activity you will need the following:
● Plank (a 3’ board or similar object)
● Books or similar objects to create a ramp with the plank
● A variety of cylindrical objects cut to 1–3 in. lengths (e.g., cardboard tubes, PVC pipe, small empty tin cans)
● Clay (in sufficient quantity to fill one cylinder)
● Stopwatch
● Tape Measure
For this activity you will work in groups of 3.
Structured Inquiry
Step 1: Set up a ramp as shown in the diagram below. Draw a starting line at the top of the ramp and measure the
distance from the starting line to the bottom of the ramp. Roll one cylinder down the ramp and record the time it takes to
travel from the starting line to the bottom using the stopwatch. Use your data to calculate the acceleration of the cylinder.
Figure 10.2: Place one end of the plank on a stack of books to create a ramp. Place a cylinder at the top of the ramp and mark a starting line where
you will release the cylinder.
71
Page 73

Step 2: Hypothesize/Predict: Predict what would happen to the acceleration down the ramp if you filled the cylinder with
clay. Discuss your prediction and your reasoning with your lab partner, and record both in your notebook.
Step 3: Student-Led Planning: Discuss with your partner how best to use the materials and your setup to test your
prediction. Create an appropriate data table in your notebook.
Step 4: Critical Analysis: Fill your cylinder with clay and use the ramp to test your prediction. Record data in your
notebook and discuss your observations. Were the predictions you made in step 2 supported by your data? What could
you have used to improve your results? Discuss with your partner and then write your answers in your notebook.
Guided Inquiry
Step 1: Hypothesize/Predict: How can you use clay to make cylinders with different moments of inertia? How could you
test the effect of moment of inertia on acceleration? Write your ideas in your notebook.
Figure 10.3: Place clay inside the cylinders in a variety of ways to create cylinders with different moments of inertia.
Step 2: Student-Led planning: Make at least two cylinders with different moments of inertia by distributing the clay
differently within the cylinders. The figures below show some different ways to distribute clay inside the cylinders to create
different moments of inertia, but you may develop some of your own ideas. Sketch your cylinders in your notebook to
show the different distributions of mass. Discuss how you will compare the acceleration of the different cylinders.
Step 3: Critical Analysis: How did the distribution of mass and differences in total mass inside each cylinder produce
different moments of inertia? How did the different distributions of mass affect each cylinder’s center of gravity? How did
your experimental design allow you to examine differences in acceleration? Discuss your answers with your partner and
write it in your notebook.
Assessments
1. Does the overall mass or radius of a cylinder affect its acceleration down the ramp? Use the conservation of energy
to justify your response.
2. Explain how the acceleration of each rotating cylinder was affected by its moment of inertia.
3. Based on your results, if you compared the acceleration of a smooth rubber ball with a hollow cylinder rolling down
the ramp, which would be faster?
72
Page 74

Lab 11:
Mechanical Waves
73
Page 75

In this lab you will learn
● how the frequency, wavelength, and speed of a wave are related
● how waves interact with each other and behave at different types of boundaries
Activity 1: Pre-Assessment
1. What happens to the speed and the wavelength of the wave when you increase its frequency? How about when
you increase the amplitude of the wave?
2. Would a wave travel at the same speed if it was traveling transversally, as opposed to longitudinally? Explain your
response.
3. Discuss the answers to questions 1 and 2 with the class.
Activity 1: Basic Properties of Waves
In this activity, we will investigate the properties of mechanical waves by using a spring toy. We will investigate the
relationship between the speed, frequency, and wavelength of a wave.
For this activity you will need the following:
● A spring toy
● A video capture device (such as a smartphone, digital camera, etc.), or a stopwatch
● Meter stick
For this activity you will work in groups of three.
Structured Inquiry
Step 1: With you and one of your partners each holding opposite ends of the spring toy, stretch the spring toy on the
floor—to about 3 to 4 meters in length. Send a wave to your partner by quickly moving the spring toy back and forth. The
third person should record how long the wave takes to travel between you and your partner. Use this result to calculate
the wave speed.
Step 2: Hypothesize/Predict: Given that the speed of a wave is a property of the medium through which it travels—for
example, the spring toy—use the value obtained for the speed in Step 1 to calculate the wavelength of the waves for a
given frequency. Record your predictions in a table.
Step 3: Student-Led Planning: You will now measure the wavelength of waves you send to your partner by using your
video capture device. Discuss with your group the best approach to accurately measure the wavelength for different
frequencies.
Step 4: Critical Analysis: Record the results of your measurements in a table. How do the measurements compare to your
prediction in the previous step? How did the wave speed compare to the speed calculated in Step 1?
74
Page 76

Guided Inquiry
Step 1: Hypothesize/Predict: How will the speed of the wave differ if you generate longitudinal waves instead of
transverse waves along the spring toy? How will the wavelength differ?
Step 2: Student-Led Planning: With your partner, pick a frequency that you will test that is easy to replicate over several
tries. Then, for your chosen frequency, send transverse waves and longitudinal waves to your partner.
Step 3: Determine the speed in each trial, and record your results in a table in your notebook. Do this at least five times.
Step 4: Critical Analysis: Did the speed differ between the transverse and longitudinal waves? Did the frequency differ?
Did the wavelength differ? Do you expect the speed of transverse and longitudinal waves to differ? Discuss your results
with your partners.
Assessments
1. Imagine a wave traveling in a given material. If the frequency of a wave is doubled, how does that change its
wavelength?
2. In what direction do transverse waves oscillate relative to the direction that the wave travels? How about
longitudinal waves?
75
Page 77

Activity 2: Pre-Assessment
1. How will two or more waves interact with each other?
2. Does the behavior of one-dimensional waves differ from that of two-dimensional waves?
3. Discuss the answers to questions 1 and 2 with the class.
Activity 2: Waves and Boundaries
In this activity we will investigate how waves interact with each other and how they behave at different
boundaries.
For this activity you will need the following:
● A spring toy
● A video capture device (such as a smartphone, digital camera, etc.), or a stopwatch
● Meter stick
● Water tank
● A card or other flat object
For this activity you will work in groups of three.
Structured Inquiry
Step 1: With you and one of your partners each holding an opposite end of the spring toy, stretch the spring toy along the
floor—to about 3 to 4 meters. Send one wave to your partner while your partner simultaneously sends one wave back to
you. Have your other partner record what happens to the amplitude as the two waves pass each other and record the
time it takes for each wave to travel to your partner and back.
Step 2: Hypothesize/Predict: If you send a wave train, more than one wave, to your partner with a given frequency, and
your partner sends a wave train to you with a different frequency, what will happen to each wave train as they pass? Does
the speed of each change for different frequencies? Why or why not?
Step 3: Student-Led Planning: Have your partner release one end of the spring toy and send a wave pulse through from
the other end. What happens to the wave as it reaches the open end? Lift the spring toy from the floor and stretch it so it
doesn’t sag too much, while your partner holds one end of the spring toy fixed. Alternatively, fix your partner’s end to a
position on the wall. Send a single pulse down the spring toy and describe the motion of the pulse before and after it
reaches the boundary—that is, your partner or the wall.
Step 4: Critical Analysis: What happens to the pulse when it reaches the boundary? Use Newton’s third law of motion to
explain the behavior of the wave at the boundary.
76
Page 78

Guided Inquiry
Step 1: Hypothesize/Predict: For a two-dimensional wave in a water tank, how will the reflected wave behave at the
boundary of the tank?
Step 2: Student-Led Planning: Use a pencil or your finger to create a circular wave in the water tank. Place a barrier, such
as a card or other flat object, perpendicular to the outward motion of the wave in the tank. Now, rotate the barrier .
Record your observations both before and after the rotation.
Step 3: Critical Analysis: From where does the reflected wave at the boundary seem to originate? How does the angle of
reflection of the wave depend on the angle of incidence?
Assessments
1. Two waves travel toward each other in a given medium, one with amplitude , the other with a smaller
amplitude . If the waves have the same frequency and phase, what equation would represent the maximum
possible amplitude of the resulting wave?
2. When two waves pass through a region where they overlap, how is the resulting wave related to the two waves?
3. How is the amplitude of the reflected wave related to the amplitude of the incident wave?
77
Page 79

Lab 12:
Sound Waves
78
Page 80

In this lab you will learn
● to use graphs of waveforms to see how waves can constructively and destructively interfere based on how they
overlap
● to design a suitable experiment and analyze data illustrating the superposition of mechanical waves—only for
pulses or standing waves
● to design a plan for collecting data to determine the exact means of interference of two waves
Activity 1: Pre-Assessment
1. How are frequency, velocity, and wavelength related? What are harmonics and how do they relate to a specified
frequency? Do you think the temperature of the medium impacts the results?
2. Using what you know of harmonics, how could you use a tuning fork (or several) and a cylinder partially filled with
an adjustable amount of water to determine the speed of sound? What data would you need to collect? Design a
data table and draw it in your notebook.
3. Discuss the answers to questions 1 and 2 with the class.
Activity 1: Speed of Sound
Sound traveling through a cylinder closed at one or both ends will resonate at specific wavelengths related to the
frequency of the sound produced. A tube partially filled with water is an example of a closed cylinder because the water
surface reflects the sound wave. Closed tubes have a fundamental resonance at a length that is ¼ of the wavelength, with
additional resonances each at ½ wavelength intervals. See Figure 12.1.
Figure 12.1: Resonances occur when the length of the column of air above the water is the correct multiple of the wavelength.
Resonant frequencies can be identified by listening to the sound coming from the top of the graduated cylinder while
setting the air inside into vibration at a specific frequency. Each frequency corresponds to a specific wavelength because
of the relationship
79
Page 81

When the length of the air column does not match a resonant wavelength, you will have interference breaking
down the wave and the sound will be muted. When the length of the air column matches the correct multiple of the
wavelength for the specified frequency, you will hear a greatly increased sound volume.
Safety Precautions
● Inform your teacher immediately of any broken glassware, as it could cause injuries.
● Clean up any spilled water or other fluids to prevent slips and falls.
For this activity, you will need the following:
● Graduated cylinder
● Water
● Tuning forks of various frequencies
● Ruler in cm
● Thermometer
For this activity, you will work in pairs.
Structured Inquiry
Step 1: Determine the frequencies of the tuning forks available to you. Knowing the various frequencies, find the first
three harmonics. Add these values to the data table for your measurements and show your calculations in your notebook.
Step 2: Hypothesize/Predict: Knowing the frequency of the tuning fork and that the speed of sound is roughly 300 m/s,
hypothesize ¼ of the wavelength to be used as the height of the air column. Add your predictions to the data table you
created in Step 1.
Step 3: Student-led Planning: You will now find the air column height, and resultant water level, for the first three
harmonics of each tuning fork using Figure 12.1 as a reference. Discuss with your partner how best to set up your
graduated cylinder to find the resonant frequencies.
Step 4: Critical Analysis: Record the air column height and related wavelength for each tuning fork and harmonic.
Calculate the speed of sound from your data to the nearest tenth of a m/s. Are the predictions you made in Step 2
supported by your data? Why or why not? Is the speed of sound you measured close to the speed of sound for the
temperature and air pressure in your classroom? (This information can be found online if you know the temperature of
your classroom.) Calculate the percent error. How could you improve your results? Discuss your answers with your partner
and write them in your notebook.
Guided Inquiry
Step 1: Hypothesize/Predict: Now that you know the speed of sound for the air of your classroom, find a song that has 3 –
4 simple notes and print out the notes for your reference. If you need help with this task, ask your instructor for
assistance. Write your song or part of your song in your notebook. You should have at least five measures of notes.
Step 2: Student-led Planning: Submit your chosen song to your teacher. Once your teacher approves, determine which
frequencies create those notes. Your teacher may allow you access to an online music synthesizer or other instrument.
Once you have determined the frequencies of the three notes, find their related wavelengths in a closed column. Write all
your results in your notebook.
80
Page 82

Step 3: Using your calculated values, create your 3 – 4 notes by filling water bottles with water to the correct levels. Test
your notes by blowing across the tops of the partially-filled water bottles. If possible, make a recording of your song on a
cell phone or other device and use it to adjust the notes until they are as close as possible to your chosen song. Then, play
your song and see if your classmates can guess it. See Figure 12.2 to identify how your setup might look.
Step 4: Critical Analysis: Were you successful at creating all of your notes and playing your song? Could your classmates
identify the song? Which notes were easier to create and why do you think this was the case? Would a different size bottle
have made this easier? Discuss your answers with your partner and write them in your notebook.
Figure 12.2: Bottles filled to different heights with liquid can be used to play music by producing sounds of specific frequencies.
Assessments
1. Assuming a student is using a graduated cylinder, find the first three resonant frequencies of each tuning fork in a
and b below. Also, what are the related air column lengths that the student should adjust to find these resonant
frequencies? Assume that the speed of sound is 343. m/s.
a. Assume the tuning fork has a frequency of 400. Hz.
b. Assume the tuning fork has a frequency of 700. Hz.
2. What limits how many harmonics you can create using the setup in this lab?
3. Describe why the closed tube resonates at ¼ of the wavelength. Use a diagram to help your explanation.
81
Page 83

Lab 13:
Electrostatics
82
Page 84

In this lab you will learn
● the direction of the electrostatic force between two charged objects
● the three ways objects can become charged
● how to identify insulators and conductors
● the factors that affect the magnitude of the electrostatic force between two charged objects
Activity 1 Pre-Assessment
1. Sometimes you get a shock after walking on a rug and touching a metal doorknob. What causes the shock? Does
the kind of shoes you wear affect whether you get a shock? Why do you feel the shock only when you touch a
doorknob, as opposed to the wooden part of a door?
2. When clothes are taken out of a dryer, sometimes two pieces of clothing stick together, and sometimes they fly
away from each other. Could charge differences cause each of these interactions to occur?
3. Discuss the answers to questions 1 and 2 with the class.
Activity 1: Static Electricity Interactions
Charged objects exert electrostatic forces on each other. In these interactions, charges of the same sign repel each
other, and charges of opposite sign attract each other. Charging of occurs in three distinct ways. In charging by friction,
surfaces that move against each other are charged. The motion provides energy to separate electrons from atoms and
move the electrons from one surface to another. The direction of electron transfer is determined by the ability of each
material's surface to hold or give up electrons.
When an object is charged, it can charge a neutral conducting object by the process of induction if the neutral
object is grounded. During charging by induction, the two objects are not touching. For example, when the negatively
charged rod shown in Figure 13.1 is brought near the neutral metal sphere, electrons inside the sphere move in response.
As a result, negative charge and positive charge accumulate in different parts of the sphere (Figure 13.1a). Adding a
grounding wire to the sphere results in movement of negative charge away from the sphere (Figure 13.1b). Breaking the
connection to the grounding wire before the charged rod is removed leaves the sphere with excess positive charge.
Finally, removing the negatively charged rod creates an even distribution of positive charge in the sphere (Figure 13.1c).
Therefore, in induction, the charged object induces an opposite charge in a neutral conductor without, itself losing any of
its excess charge.
Figure 13.1: Charging by induction. (a) A charged object near the conductor redistributes charge. (b) Grounding allows charge to leave the
conductor. (c) Removing the ground leaves an overall excess charge, and removing the charged object allows the excess charge to spread out
evenly.
83
Page 85

A charged object can also attract a neutral, non-conducting object, such as a small scrap of paper, because of
polarization. If the comb shown in Figure 13.2 has a net negative charge, its electrostatic force makes electrons stay more
on the far sides of the atoms in the paper and less on the near sides, polarizing the paper. The force of attraction between
nearby unlike charges becomes greater than the force of repulsion between slightly farther like charges, and the scrap of
paper is attracted to the comb. Note that no charge is removed during polarization.
Figure 13.2: The charges in the atoms and molecules of a piece of neutral paper stay slightly closer to the opposite charges on the comb, producing
an electric attraction.
Safety Precautions
● Be careful not to cut yourself on the sharp edge of the tape dispenser.
For this activity, you will need the following:
● Clay
● Straws with flexible necks
● Frosted transparent tape
● Plastic rod or comb
● Wool or fur cloth
● Small piece of foil
● Small piece of plastic
● Small strips of paper
For this activity you will work in pairs.
Structured Inquiry
Step 1: Charging Pieces of Tape: You can prepare charged pieces of tape and suspend them from straws to observe their
interactions. To do this, follow these steps:
1. Create two cubes of clay, each about 1 inch (2.5 cm) on each side.
2. Place two straws in each cube at the same height, as shown in Figure 13.3.
3. Bend each straw so that it has a horizontal arm as shown. The four arms will each hold a charged piece of tape.
4. Press two pieces of tape, each about 6 inches (15 cm) in length, flat on your tabletop, sticky side down. These base
pieces of tape will stay on the table.
5. Place a second piece of tape, sticky side down, on top of each base tape, and press firmly. Fold one end to act as a
handle, and write “A” on it.
6. Now add a third piece of tape on top of the A pieces of tape, sticky side down, and press firmly. Fold one end to act
as a handle, and write “B” on it.
84
Page 86

Figure 13.3: The first two charged pieces of tape are placed on the straw arms.
Step 2: Hypothesize/Predict: If your group prepares the four pieces of tape as described in Step 1, predict whether the
pieces of tape will become charged and if they will have different or similar charges. Which pieces of tape might have a
similar charge? What will be the direction of electrostatic force when each combination of two pieces of tape—AA, BB,
and AB—interact? Record your predictions in a table in your notebook.
Step 3: Student-Led Planning: Quickly tear the A and B pieces, still sticking together, from the base tape. Then pull A and B
apart quickly, and hang each piece of tape on the straw arms. Figure 13.3 shows the setup. Observe and record the
interactions between the pieces of tape in in your notebook.
Step 4: Critical Analysis: Did the pieces of tape become charged? Were the predictions you made in Step 2 supported by
your data? Why or why not? Does tape have one or two kinds of surfaces, and how does this affect charging? If the tape
became charged, what kind of charging occurred? Discuss your answers with your partner, and record the information in
your notebook.
Guided Inquiry
Step 1: Hypothesize/Predict: When a comb is rubbed with wool, the comb becomes negatively charged, and the wool
becomes positively charged. How will charged objects like these interact with the charged pieces of tape (A and B)? How
will a neutral metal object affect the charged piece of tape after they come into brief contact? How will a neutral plastic
object affect the charged piece of tape after they come into brief contact? How will a neutral paper object interact with a
charged piece of tape if there isn’t any contact but it’s held close by? Record your predictions for each of these scenarios
in a table in your notebook.
Step 2: Student-Led Planning: Choose at least two charged and two uncharged objects to create the scenarios described
in Step 1. Review the list with your teacher, and then carry out each scenario. Observe and record the interactions in the
data table in your notebook.
Step 3: Critical Analysis: Were you able to determine the charges on the A and B pieces of tape? If yes, what are their
charges? Which scenario included conduction? What happened in this scenario? Which scenario included charging by
polarization? What happened in this scenario? How did touching the tape to the foil and/or plastic affect the charge on
the tape? How were you able to determine this? Discuss your answers with your partner, and record the information in
your notebook.
85
Page 87

Assessments
1. Wood attracts electrons more strongly than nylon does. A wooden dowel is rubbed with nylon cloth, and electrons
move as a result.
a. Draw before and after pictures and describe the change in charge distribution on the dowel and cloth
before and after the electrons move. In the before picture, draw 10 negative charges and 10 positive
charges on the dowel and 10 negative charges and 10 positive charges on the cloth. Then show the change
that occurs in the after picture.
b. What kind of charging is described in part a?
2. In a science museum, a person touches a positively charged Van de Graaff sphere, and electrons move as a result.
The person’s strands of hair fly up upon becoming charged.
a. Draw before and after pictures and describe the change in a charge distribution on the positive sphere and
the person before and after the electrons move. In the before picture, draw five negative charges and 10
positive charges on the sphere, and 10 negative charges and 10 positive charges on the person. Then show
the change that occurs in the after picture.
b. Explain why the person’s strands of hair flew up.
3. A negatively charged comb attracts a neutral piece of paper suspended from a string.
a. Draw before and after pictures and describe the change in charge distribution in a piece of neutral paper
when the negatively charged comb is brought nearby. In the before picture, draw 10 negative charges and
five positive charges on the comb and five negative charges and five positive charges on the paper, evenly
distributed. Then show the change that occurs in the after picture.
b. Why is the charged comb able to attract the neutral piece of paper in this scenario?
c. When the comb is removed, the charges in the paper move until they again become evenly distributed.
Explain why this occurs.
4. You charge a comb and place it halfway between two pieces of sticky tape. You observe that both pieces of sticky
tape are attracted to the comb. However, the first piece of tape is attracted more strongly to the comb than the
second piece of tape is. Propose two possible explanations for this observation.
5. A student holds a neutral metal ball with an attached glass rod. The student brings the ball near a negatively
charged rubber rod and then touches the ball to a nearby metal faucet.
a. Create a drawing to show the charges on the rubber rod and metal ball when the two objects are held near
each other.
b. What happens when the metal ball touches the faucet?
c. What is the final charge of the metal ball, and what kind of charging occurred?
86
Page 88

Activity 2 Pre-Assessment
1. When you charged pieces of tape, you observed that they exerted electrostatic force on each other. What
variables affect the strength of electrostatic force? What variables are directly and inversely proportional to the
strength of electrostatic force? What might an equation for the strength of electrostatic force look like?
2. When electrostatic force is used on a charged balloon suspended on a string to move it upward and sideways, what
forces oppose the electrostatic force? How could you use your knowledge of these opposing forces to measure the
strength of the electrostatic force?
3. Discuss the answers to questions 1 and 2 with the class.
Activity 2: Coulomb’s Law
Electrons respond to other electrons because charged objects exert electrostatic forces on each other. The force
acts over a distance and has both direction and magnitude. Like charges repel, and unlike charges attract.
The electrostatic force acts between pairs of charged objects. The variables that affect the strength of the
electrostatic force are the magnitude of each charge, measured in coulombs, and the distance between the charges. If the
amount (magnitude) of charge is increased, the electrostatic force is stronger. If the distance between charges is
increased, the electrostatic force is weaker.
Coulomb’s law states the electrostatic force is proportional to the product of the charges and inversely
proportional to the square of the distance between them. In equation form, the force F between two charges q1 and q2 is
equal to
where F is the electrostatic force in newtons (N); q1 and q2 are the amounts of charge on two charged objects, in coulombs
(C); r is the distance between the objects in meters (m); and k is a constant, 9.0 × 10⁹ N•m2/C2. When the charges have the
same sign, the force calculated with this equation is positive; this corresponds to repulsion. If the charges are opposite,
the force is negative, which signifies attraction (the direction of the force is toward reducing the distance between the
charges).
The electrostatic force between two charged objects can be measured in a laboratory experiment. If two balloons
are charged and suspended with threads from a common attachment point, they will repel each other. The vertical and
horizontal components of the forces on the balloons are balanced, as shown in Figure 13.4. The absolute values of the
vertical components in the diagram are equal to the gravitational forces on the balloons. Gravitational force, or weight, is
equal to the mass of the balloon times the gravitational acceleration, g, 9.8 m/s2. The absolute values of the horizontal
components in the diagram are equal to the electrostatic forces on the balloons. This quantity is unknown, but it can be
calculated using trigonometry. The absolute value of electrostatic force is related to the absolute value of gravity and the
angle θ by the tangent function
Figure 13.4: The electrostatic force between two charged balloons can be observed and measured.
87
Page 89

Safety Precautions
● Do not place charged objects near electronic devices.
For this activity, you will need the following:
● Two balloons
● Marking pen
● Two pieces of thread, each 3 feet (1 m) in length
● Stand to suspend the balloons (a yardstick or meter stick with a thumbtack, laid across a space between two lab
desks can be used if a stand is not available)
● Balance that can measure the mass of the balloons
● Wool or fur cloth
● String with an attached weight that can serve as a plumb line
● Protractor
For this activity, you will work in pairs.
Structured Inquiry
Step 1: Setting Up the Balloons: Begin by setting up the balloons using the following method:
1. Label two balloons “A” and “B.”
2. Find the mass of each empty balloon and record it in Table 13.1.
3. Blow up the balloons (assume the mass of air is negligible), tie their ends, and tie each balloon to a 1 yard (1 m)
length of string.
4. Suspend each balloon from the stand. Measure the distance from the support (or plumb line) to the center of each
balloon and record it in Table 13.1. (Note that the setup data is measured now but not used until the subsequent
activity.)
Step 2: Hypothesize/Predict: Predict the motion of the balloons when they are first charged. Predict how the motion of
the balloons will change when one balloon is rubbed more times. Predict how the motion of the balloons will change
when they are placed closer and farther away from each other.
Step 3: Student-Led Planning: Discuss with your partner how you will be able to determine if your predictions are correct
and what quantities you will measure. Review your method with your teacher before you begin. Then, rub each balloon
with fur or wool cloth to charge it, and measure the distance between the balloons. Record your trials and findings in your
notebook.
Step 4: Critical Analysis: Were the predictions about the electrostatic force you made in Step 2 supported by your data?
Why or why not? Did your data support Coulomb’s law? Explain your reasoning in detail. What methods could you have
used that would have improved your results? Discuss your answers with your partner, and record them in your notebook.
Table 13.1: Data for Setup
Mass (m, in g) Distance from support to center
of balloon (l, in m)
Balloon A
Balloon B
88
Page 90

Guided Inquiry
Step 1: Hypothesize/Predict: Predict an approximate magnitude of force that you think the two charged balloons exert on
each other. Explain your reasoning for your prediction.
Step 2: Student-Led Planning: With your partner, determine a way to measure the force between the two charged
balloons and the amount of excess charge on each balloon. Review the introduction and consider other forces on the
balloons as you work on a method. Review your method with your teacher, and record it in your notebook before you
begin. Create a data table in your notebook to record your findings, and then carry out your experiment.
Step 3: Critical Analysis: Was the prediction you made in Step 1 supported by your data? Assuming both balloons have the
same amount of charge, what is the charge in coulombs on each balloon? How would you determine this? Given that an
individual electron has a charge of –1.602 × 10
–19
C and a proton has a charge of 1.602 × 10
–19
C , how many excess
individual charges are found on each balloon? Discuss your answers with your partner, and record your calculations in
your notebook.
Assessments
1. An electronic equipment company had some components fail because electric charge built up on employees and
discharged when they touched the equipment. The company has changed the flooring material and issued special
shoes to the employees to prevent the buildup of charge.
a. Describe what kind of material (conductor or insulators) the floor and shoes should be made of, and explain
why that material will prevent a buildup of charge on employees.
b. Describe what data you would collect to decide if a new material prevents a buildup of electric charge. Two
charged objects exert an electrostatic force of 0.08 N on each other. The objects are moved so that the
distance between them is halved.
c. How much electrostatic force do the two objects exert on each other after they’re moved closer together?
d. Explain the mathematical reasoning you used to obtain your answer. [
89
Page 91

Lab 14:
Ohm’s Law
90
Page 92

In this lab you will learn
● the relationship between current, voltage, and resistance in a simple circuit
● how to calculate resistance, current and voltage using Ohm’s law, as well as how to measure these
variables in an actual circuit using a multimeter
● what factors affect resistance of various materials
Activity 1: Pre-Assessment
1. What is an electric circuit? What is needed for electric charge to flow from one end of a conducting wire to
another? Does voltage produce current, or does current produce voltage?
2. What simple experimental demonstration would illustrate the cause-and-effect relationship between resistance
and current in an electric circuit? What materials would you use for your demonstration? Draw a circuit diagram to
show how you connect your materials. Explain what observations you will be making.
3. Discuss the answers to questions 1 and 2 with the class.
Activity 1 Resistance and Current
We can create a simple electric circuit using a source of electrical energy (battery), a conductor of the electrical
energy (wire) connected to the energy source, and a device that uses and transforms the electrical energy (lightbulb).
Current can be measured with an ammeter and voltage with a voltmeter. You may also use a multimeter that
combines these functions, and often some others, into a single instrument as illustrated in Figure 14.1. The current is
measured in amperes (A). One ampere is the rate of flow of one coulomb (C) of charge per second. To measure the
current, the ammeter must be inserted in the circuit so that the current passes directly through it.
Figure 14.1: A multimeter used as a voltmeter to measure electrical potential through a circuit. This multimeter measures voltage (V) and electrical
resistance (Ω) using the same wire port. However, the dial is set to measure voltage.
Described earlier was electrical resistance on a microscopic level, how it results from obstacles to the flow of
electrons in the conducting material. We now use a very common analogy that compares the flow of charge through a
conductor to the flow of water through pipes. In this analogy, the voltage is represented by the hydrostatic pressure of
water, and current is represented by the water flow. Consider a water tank with two pipes, one narrow and one wide, as
shown in Figure 14.2. Water flows through the narrow pipe at a slower rate than through the wider pipe under the same
pressure. We can regard the narrow pipe to have greater resistance to water flow. Think of this analogy as you explore the
relationship between current and resistance in a simple circuit with constant voltage.
91
Page 93

The unit of voltage is volt (V). One volt is an energy of one joule per coulomb of electric charge. A voltage of one volt
between two points means that electric charge has one joule per coulomb more energy at one point than at the other. A
voltmeter measures the voltage (electric potential difference) between two points in a circuit. Therefore, the voltmeter
must be connected across the points and is not inserted into the circuit.
Figure 14.2: The equal water pressure (hydrostatic pressure) at both pipe openings is analogous to the same voltage across two conductors. The
pipe width is analogous to the reciprocal of resistance (wider pipes resist less), and the water flow through the pipe is analogous to electric current
Electrical resistance is measured in ohms (Ω). One ohm is the resistance for which a 1 V difference in electric
potential produces 1 A of current. You can use an ohmmeter or multimeter to measure resistance. Disconnect the resistor
from the battery before measuring resistance. Then connect the leads of the ohmmeter across the resistor as shown in
Figure 14.3.
Figure 14.3: Measuring resistance with an ohmmeter
Safety Precautions
● If you choose to use a power supply rather than a battery pack, set the voltage to a fixed maximum around 5 V.
● Emphasize proper meter usage.
For this activity you will need the following:
● Battery holder(s) that can hold up to four batteries
● Four batteries
● Wire leads with alligator clip
● One miniature light bulb with corresponding bulb holder (check maximum voltage for light bulb to avoid burnout)
● Four to six different resistors
● Basic multimeters or single-value meters (ammeter and ohmmeter)
For this activity you will work in pairs.
92
Page 94

Structured Inquiry
Step 1: Hypothesize/Predict: Put together a simple circuit to light the light bulb using batteries. Suppose you inserted
different resistors into the circuit without changing the lightbulb or batteries? How do you predict this would affect the
current and the brightness of the light bulb? How do you predict changing the voltage by changing the number of
batteries in series would affect the current through the lightbulb? Write your predictions in your notebook.
Step 2: Measure resistance of all resistors, and record these values in your notebook. Construct the simple circuit shown in
Figure 14.4 with one resistor.
Figure 14.4: A simple circuit consisting of a resistor and a battery
Step 3: Student-Led Planning: Add a lightbulb into the circuit. Then, change the number of batteries in series. Observe the
effect on the light bulb, and record your observations. Discuss with your partner how best to measure the current. Create
a data table for the measurements of current and resistance in your notebook. Include correct units in all measured
values. Test the predictions you made in Step 1.
Step 4: Critical Analysis: Does your data support the predictions you made in Step 1? Does it support your statement with
calculations? Why or why not? Describe the relationship you found between the voltages across the resistor, and express
it mathematically. Discuss your answers with your partner, and then write them in your notebook. Discuss the results of
the experiment with your partner, and then write your conclusion in your notebook. Formulate the relationship you found
between the current through the resistor and the resistance both descriptively and mathematically.
Guided Inquiry
Step 1: Hypothesize/Predict: What is the mathematical relationship between voltage, current, and resistance? Write your
prediction in your notebook.
Step 2: Student-Led Planning: Decide with your partner how you can confirm your prediction experimentally. Think of
conducting several experiments. For each experiment, identify which variable(s) you will control and which variable(s) you
will vary. Design the data table for each experiment, and complete the experiments.
Step 3: Critical Analysis: What mathematical relationship between the current, voltage, and resistance do your findings in
Activities 1 and 2 suggest? How can you use your experimental data in this part of the investigation to confirm this
relationship? Discuss your answers with your partner, and write them in your notebook.
93
Page 95

Assessments
1. From their recent trip to Russia, your parents/guardians brought home an electrical samovar for making tea, as
done in traditional Russian tea ceremonies (Figure 14.5). The samovar is designed for a 220 V electric outlet. Your
family invited guests to a ceremony and plugged the samovar into the wall outlet (110 V), but water did not boil.
Why?
Figure 14.5: Traditional Russian samovar for boiling water
2. Each of the three simple circuits have the same battery. The voltages of batteries for each circuit and the current
through the first circuit are shown in Figure 14.6.
a. What is the current in the second circuit?
b. What is the current in the third circuit?
c. Explain your reasoning.
3. A light bulb filament has a resistance of 580 Ω. A voltage of 120 V is connected across the filament. How much
current is in the filament?
4. A variable resistor is connected to a battery. Each value of the resistance and the corresponding current is listed in
Table 14.1: Question 3. Use the data to determine the voltage of the battery. Explain your reasoning and
calculations.
Table 14.1: Question 3
Resistance (kΩ) Current (mA)
0.01 300
0.10 30
0.33 9.1
0.56 5.4
1.0 3.0
10.0 0.3
94
Page 96

Activity 2: Pre-Assessment
1. What is the resistance of an electric skillet that draws 12 A of current when connected to 120 V circuit? Metals are
electrical conductors, so why do they have resistance to the electric current?
2. What do we mean by an “intrinsic property of a material”? Give an example of an intrinsic property. Give an
example of a property of a material that is not intrinsic. Can you make two wires from the same material that have
different resistance? Can you make two wires from different materials that have the same resistance?
3. Discuss the answers to questions 1 and 2 with the class.
Activity 2 Resistance and Resistivity
Based on Ohm’s law, the electrical resistance of a conducting object (e.g., a wire) is defined as the ratio of the
voltage across the object to the electric current through it. Recall the analogy between the flow of charge through a
conductor and the flow of water through a pipe. The narrow pipe resists water flow more than the wide pipe. By analogy,
a thin wire has more resistance to electric current than a thick wire. The longer pipe resists water flow more than a short
pipe. By analogy, a longer wire has more resistance than a short wire. Recall that electrical resistance results from
obstacles to the flow of electrons in the conducting material. Therefore, the electrical resistance also depends on the
material composing the conductor. Electrical resistivity is an intrinsic property that quantitatively describes how strongly a
given material will oppose electric current.
In this activity you will compare resistance of wires made from different materials that have different length
and/or cross-sectional areas, and you will determine a mathematical relationship between resistance, resistivity, length,
and cross-sectional area of a resistor. We will assume that all wires have cylindrical shape. The cross-sectional area of a
cylinder is the area of a circle formed at its base. If the radius of the cylinder is r, then cross-sectional area is . The length
of the cylinder is also the height of the cylinder defined as the perpendicular distance between the bases.
Figure 14.6: The cylinder shown represents the shape of a typical wire.
Safety Precautions
● Emphasize proper meter usage.
● Note that the wire may become hot when connected to the voltage source for long periods of time.
For this activity you will need the following:
● Wires of different diameter and length (at least three different diameters per length per material, three different
lengths per diameter per material, and three different materials per length per diameter)
● An ohmmeter or multimeter
● Ruler for length measurements
● Caliper for diameter measurements
● Table of values of electrical resistivity for common metals that includes metals used in this activity
For this activity you will work in pairs.
95
Page 97

Structured Inquiry
Step 1: Hypothesize/Predict: What is the relationship between the resistance of a wire and its length? What is the
relationship between the resistance of a wire and its cross-sectional area?
Step 2: Student-Led Planning: Discuss with your partner how best to take the measurements to find each relationship you
predicted in Step 1. Think of conducting one experiment for each relationship. For each experiment, identify which
variable(s) you will control and which variable(s) you will vary. For example, to find relationship between the resistance of
a wire and its length, you should use wires of the same diameter made from the same material but in different lengths.
Design the data table for each experiment and complete the experiments.
Step 3: Critical Analysis: Discuss the results of each experiment with your partner. For each experiment, describe how the
resistance of a wire depends on the specific properties of the wire, and express this relationship mathematically. Explain
how you arrived at the mathematical formula describing each relationship.
Guided Inquiry
Step 1: Hypothesize/Predict: Which material has higher resistivity? How does the resistance of a wire depend on the
resistivity of the material from which it is made? What is the mathematical relationship between resistance and
resistivity?
Step 2: Student-Led Planning: Discuss with your partner which variable(s) you will control and which variable(s) you will
vary to test relationship between resistance and resistivity. For resistivity values, use the reference table provided by your
teacher. How will you organize your data? Display your data in the best way to test your predictions. Carry out necessary
measurements of controlled and varied variables.
Step 3: Critical Analysis: Were the predictions you made in Step 1 supported by your data? Discuss the results of the
experiment with your partner, and then write your conclusions in your notebook. Using your data, develop a
mathematical relationship between resistance and resistivity of a wire. What role does length and cross-sectional area of a
wire play in this relationship? Use your findings from previous activities to develop a formula that can be used to calculate
resistance of a wire based on resistivity of the material, length, and cross-sectional area of the wire. Confirm your formula
for wires that you have available to you.
Assessments
1. Does the resistance of a copper wire increase or decrease when both the length and the diameter of the wire are
doubled? Justify your answers.
2. Two wires have the same length and the same resistance; one is made from aluminum, and the other one is made
from copper.
a. Explain how that is possible.
b. Provide calculations to support your explanation.
3. The resistance of a particular wire is 21 Ω. It is melted down, and a new wire is made from all of the melted
material. The new wire is twice as long as the original wire. What is the resistance of the new wire?
96
Page 98

Lab 15:
Resistor Circuits
97
Page 99

In this lab you will learn
● to construct or interpret a graph of the energy changes within an electric circuit
● to apply conservation of energy concepts to the design of an experiment
● to apply conservation of energy in calculations involving the total electric potential difference for complete circuit
loops
● to apply conservation of electric charge to the comparison of electric current in various segments of an electrical
circuit
Activity 1: Brightness of Bulbs
The basic tool for analysing electronics is a circuit. Circuits are closed paths around which electrons flow. The
current of electrons is driven by a power source, such as a battery. In addition to a power source, a circuit includes a
resistance. You will be investigating two types of circuits. A series circuit is a circuit in which the resistors (e.g., light bulbs)
are placed in a series, so that there is only a single path for the electrons that passes through all the resistors. A parallel
circuit is a circuit in which the resistors are placed in parallel, so each resistor provides a different path for the electrons to
flow. You will construct a few examples of each circuit and record your observations. How do you think the number of
bulbs and circuit types determine how the bulbs will light up? How would more complicated circuit types affect your
investigation? While observing each type of circuit, consider practical situations where that type of circuit would be useful.
Safety Precautions
● Be careful with the fragile light bulbs so you do not to injure yourself with broken glass.
● Do not break or pierce batteries, as they contain poisonous chemicals.
For this activity, you will need the following:
● Several lengths of wire
● Three light bulbs
● One power source, most likely a battery
For this activity, you will work in pairs or small groups.
Structured Inquiry
Step 1: Create a simple circuit with one light bulb and one battery. Observe how bright the bulb is. Record your
observations. Discuss with your partner how best to judge the brightness of bulbs qualitatively. Create data tables as
needed in your notebook to list different arrangements of light bulbs and the brightness observed or predicted.
Step 2: Hypothesize/Predict: Knowing what you know about series and parallel circuits, predict how the brightness of the
bulbs in the circuits depicted in Figure 15.1 and Figure 15.2 will differ. Write your prediction in the table you created in
Step 1.
98
Page 100

Figure 15.1: This is how to set up two light bulbs in parallel. Note that there is an initial wire that splits into two wires. On each of these two wires,
there is a light bulb. The wires coming from the light bulb connect at a single wire.
Figure 15.2: (a) A circuit with three light bulbs in a series connection. (b) A circuit with three light bulbs in a parallel connection.
Record your observations and your experimental setup, including the number of bulbs and whether they are in series or in
parallel.
Step 3: Student-Led Planning: Construct the four circuits—two parallel circuits and two series circuits—using Figure 15.1
and Figure 15.2 as a guide. For each circuit, record your observations of bulb brightness.
Step 4: Critical Analysis: Were the predictions you made in Step 2 supported by your data? Why or why not? What
methods could you have used that would have improved your results? Discuss your answers with your partner and then
write the analysis in your notebook.
Guided Inquiry
Step 1: Student-Led Planning: Now, design four circuits with a range of arrangements, including a few mixed circuit types.
Diagram each of your circuits in your notebook and show them to your teacher.
Step 2: Hypothesize/Predict: Upon approval, rank the circuits in order of how bright the bulb will shine in each. Do you
think that all the bulbs in a circuit will shine with the same brightness? Is it possible that none of your bulbs will light up at
all? Write your rankings and answers in your notebook. Then, create data tables that you could use to test your
hypotheses.
Step 3: Construct the circuits you designed in Step 1. Observe and record your findings in your notebook.
Step 4: Critical Analysis: Which circuits had all the lights remain at the same level of brightness? Which circuits had no
lights come on? How did the circuit type and number of bulbs influence which bulbs stayed lit and which ones dimmed?
Discuss your answer with your partner and write the analysis in your notebook.
99
 Loading...