

Page 1
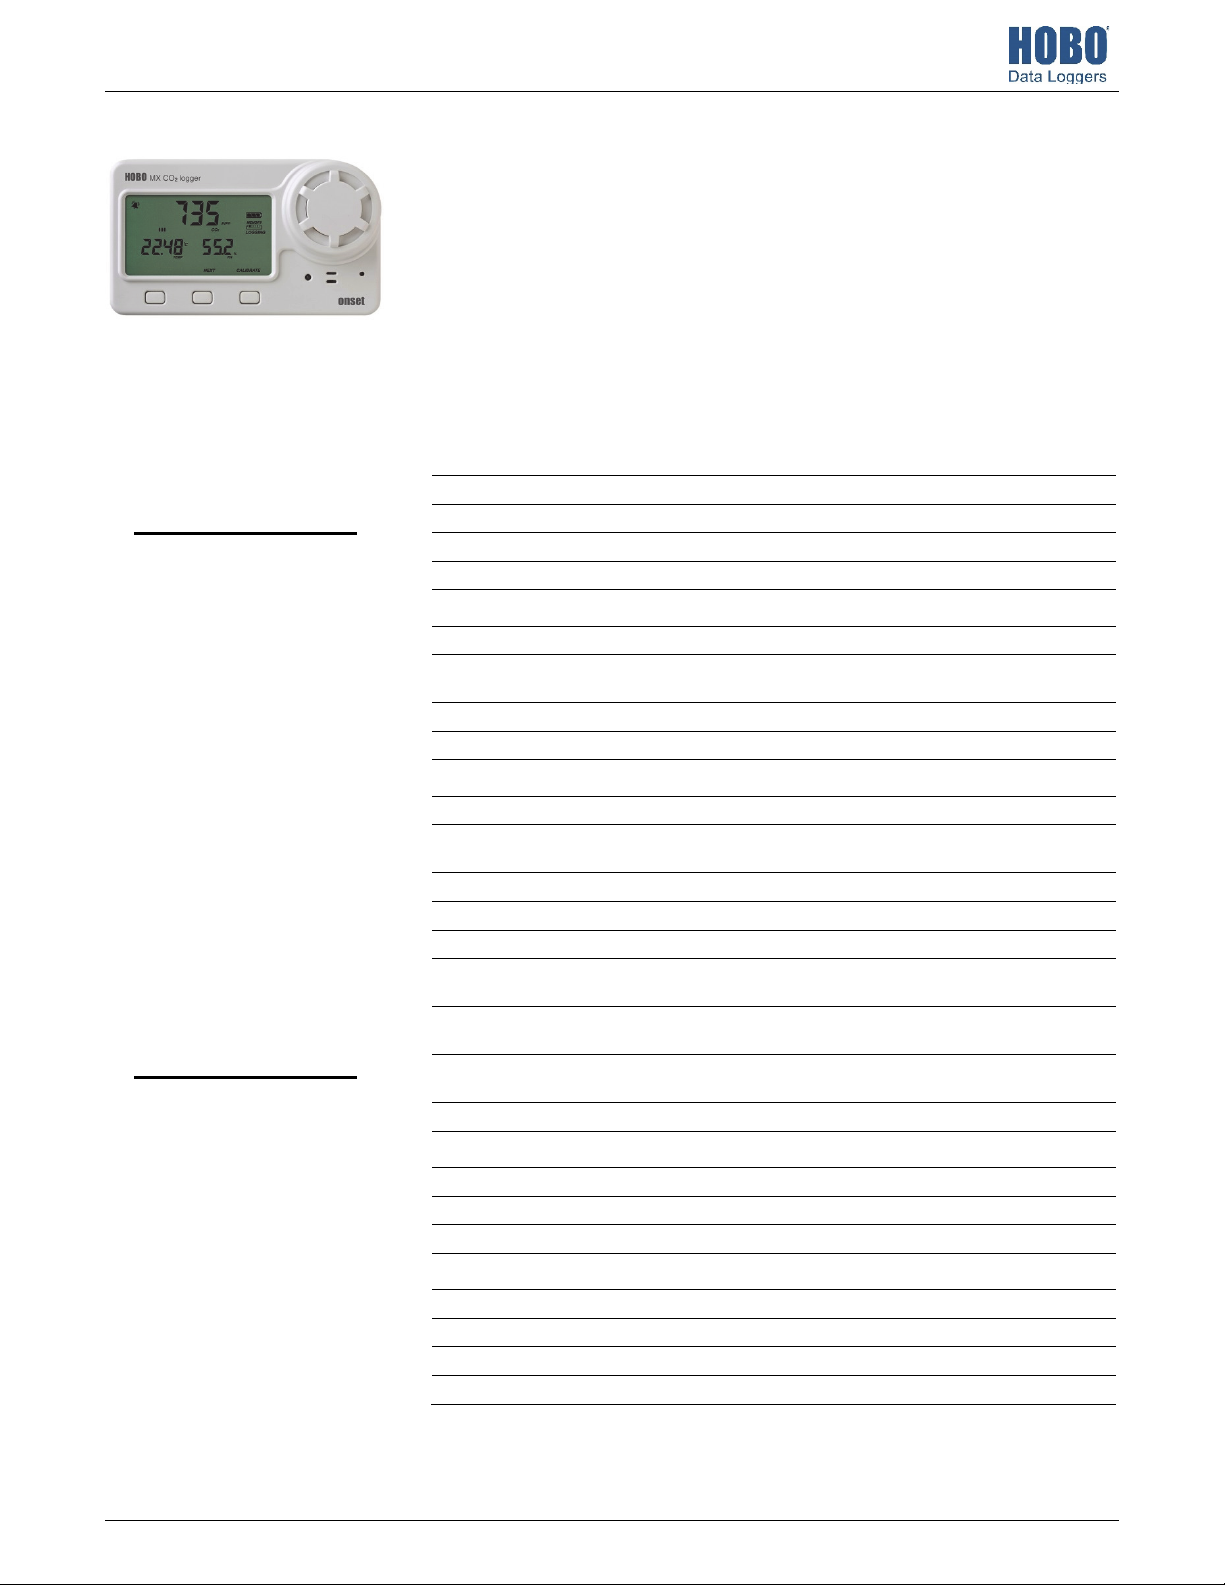
HOBO® MX CO2 Logger (MX1102A) Manual
C
The HOBO MX CO2 data logger records carbon dioxide, temperature, and relative humidity (RH)
data in indoor environments using non-dispersive infrared (NDIR) self-calibrating CO2 sensor
technology and integrated temperature and RH sensors. This Bluetooth® Low Energy-enabled
logger is designed for wireless communication and also supports a USB connection. Using the
HOBOconnect® app on your phone, tablet, or computer, or HOBOware® software on your
computer, you can easily configure the logger, read it out, and view plotted data. The logger can
calculate minimum, maximum, average, and standard deviation statistics and can be configured to
trip audible or visual alarms at thresholds you specify. In addition, it supports burst logging in
which data is logged at a different interval when sensor readings are above or below certain
limits. This logger also has a built-in LCD screen to display the current CO2 level, temperature, RH,
logging status, battery use, memory consumption, and more.
Specifications
Temperature Sensor
Range 0° to 50°C (32° to 122°F)
HOBO MX CO2 Logger
MX1102A
Included Items:
• Four AA 1.5 V alkaline
batteries
Required Items:
• Mobile device with
HOBOconnect app,
Bluetooth, OS, iPadOS®, or
Android™, or a Windows
computer with a native BLE
adapter or supported BLE
dongle
OR
• HOBOware 3.7.3 or later
and USB cable
Accessories:
• Mounting kit with
mounting brackets, screws,
tie wraps, and Command™
strip
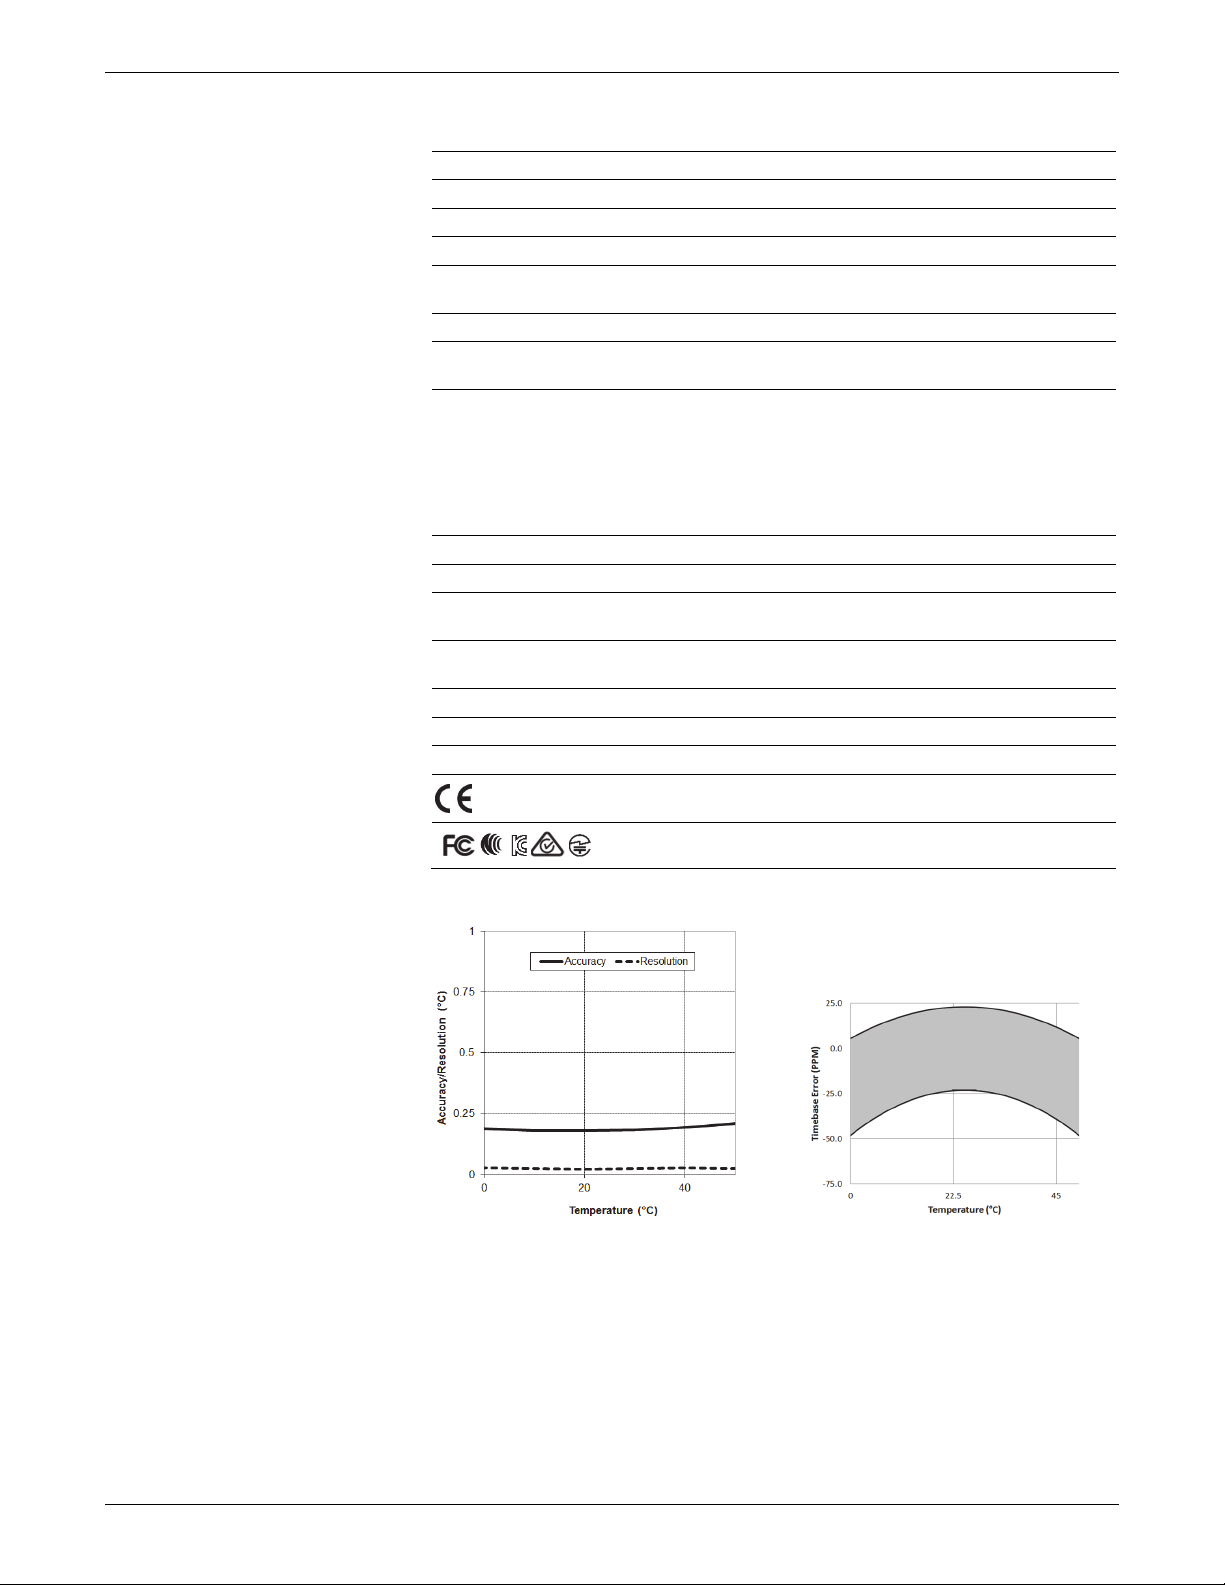
Accuracy ±0.21°C from 0° to 50°C (±0.38°F from 32° to 122°F), see Plot A
Resolution 0.024°C at 25°C (0.04°F at 77°F), see Plot A
Drift <0.1°C (0.18°F) per year
RH Sensor*
Range 1% to 90% RH (non-condensing)
Accuracy ±2% from 20% to 80% typical to a maximum of ±4.5% including
Resolution 0.01%
Drift <1% per year typical
O2 Sensor
Range 0 to 5,000 ppm
Accuracy ±50 ppm ±5% of reading at 25°C (77°F), less than 90% RH (non-
Warm-up Time 15 seconds
Calibration Auto or manual to 400 ppm
Non-linearity <1% of FS
Pressure Dependence 0.13% of reading per mm Hg (corrected via user input for
Operating Pressure Range 950 to 1,050 mbar (use Altitude Compensation for outside of this
Compensated Pressure
Range
Sensing Method Non-dispersive infrared (NDIR) absorption
Response Time
Temperature 12 minutes to 90% in airflow of 1 m/s (2.2 mph)
RH 1 minute to 90% in airflow of 1 m/s (2.2 mph)
CO2 1 minute to 90% in airflow of 1 m/s (2.2 mph)
Logger
Radio Power 1 mW (0 dBm)
Transmission Range Approximately 30.5 m (100 ft) line-of-sight
Wireless Data Standard Bluetooth Low Energy (Bluetooth Smart)
Logger Operating Range 0° to 50°C (32° to 122°F); 0 to 95% RH (non-condensing)
*Per RH sensor manufacturer data sheet
Note: The HOBO U-Shuttle (U-DT-1) is not compatible with this logger.
hysteresis at 25°C (77°F); below 20% and above 80% ±6% typical
condensing) and 1,013 mbar
elevation/altitude)
range)
-305 to 5,486 m (-1,000 to 18,000 ft)
22504-F
Find Quality Products Online at: [email protected]
www.GlobalTestSupply.com
Page 2
HOBO MX CO2 Data Logger (MX1102A) Manual
Specifications (continued)
Logging Rate 1 second to 18 hours
Logging Modes Fixed interval (normal, statistics) or burst
Memory Modes Wrap when full or stop when full
Start Modes Immediate, push button, date & time, or next interval
Stop Modes When memory full, push button, date & time, or after a set logging
Time Accuracy ±1 minute per month at 25°C (77°F), see Plot B
Power Source 4 AA 1.5 Volt batteries (user replaceable) or USB power source (5 V
Battery Life 6 months, typical with logging and sampling intervals of 5 minutes or
Memory 128 KB (84,650 measurements, maximum)
Download Type USB 2.0 interface or via Bluetooth Smart
Full Memory Download Time 20 seconds via USB; approximately 60 seconds via Bluetooth Smart,
LCD LCD is visible from 0° to 50°C (32° to 122°F); the LCD may react slowly
Size 7.62 x 12.95 x 4.78 cm (3.0 x 5.1 x 1.88 inches
Weight 267.4 g (9.43 oz)
Environmental Rating IP50
*Per RH sensor manufacturer data sheet
Note: The HOBO U-Shuttle (U-DT-1) is not compatible with this logger.
period
DC, 2 Watts)
slower; 6 months or less with logging and sampling intervals faster
than 5 minutes while logging CO
impact battery life. With app use, battery life can be reduced by
remaining connected, excessive readouts, audible alarms, and paging.
Visual/audible alarms and other events can have a marginal impact
on battery life.
may take longer the further the device is from the logger
or go blank in temperatures outside this range
The CE Marking identifies this product as complying with all relevant
directives in the European Union (EU).
See last page
. Entering burst logging mode will
2
Plot A: Temperature
Accuracy and Resolution
Plot B: Time Accuracy
Find Quality Products Online at: [email protected]
www.GlobalTestSupply.com
Page 3
HOBO MX CO2 Data Logger (MX1102A) Manual
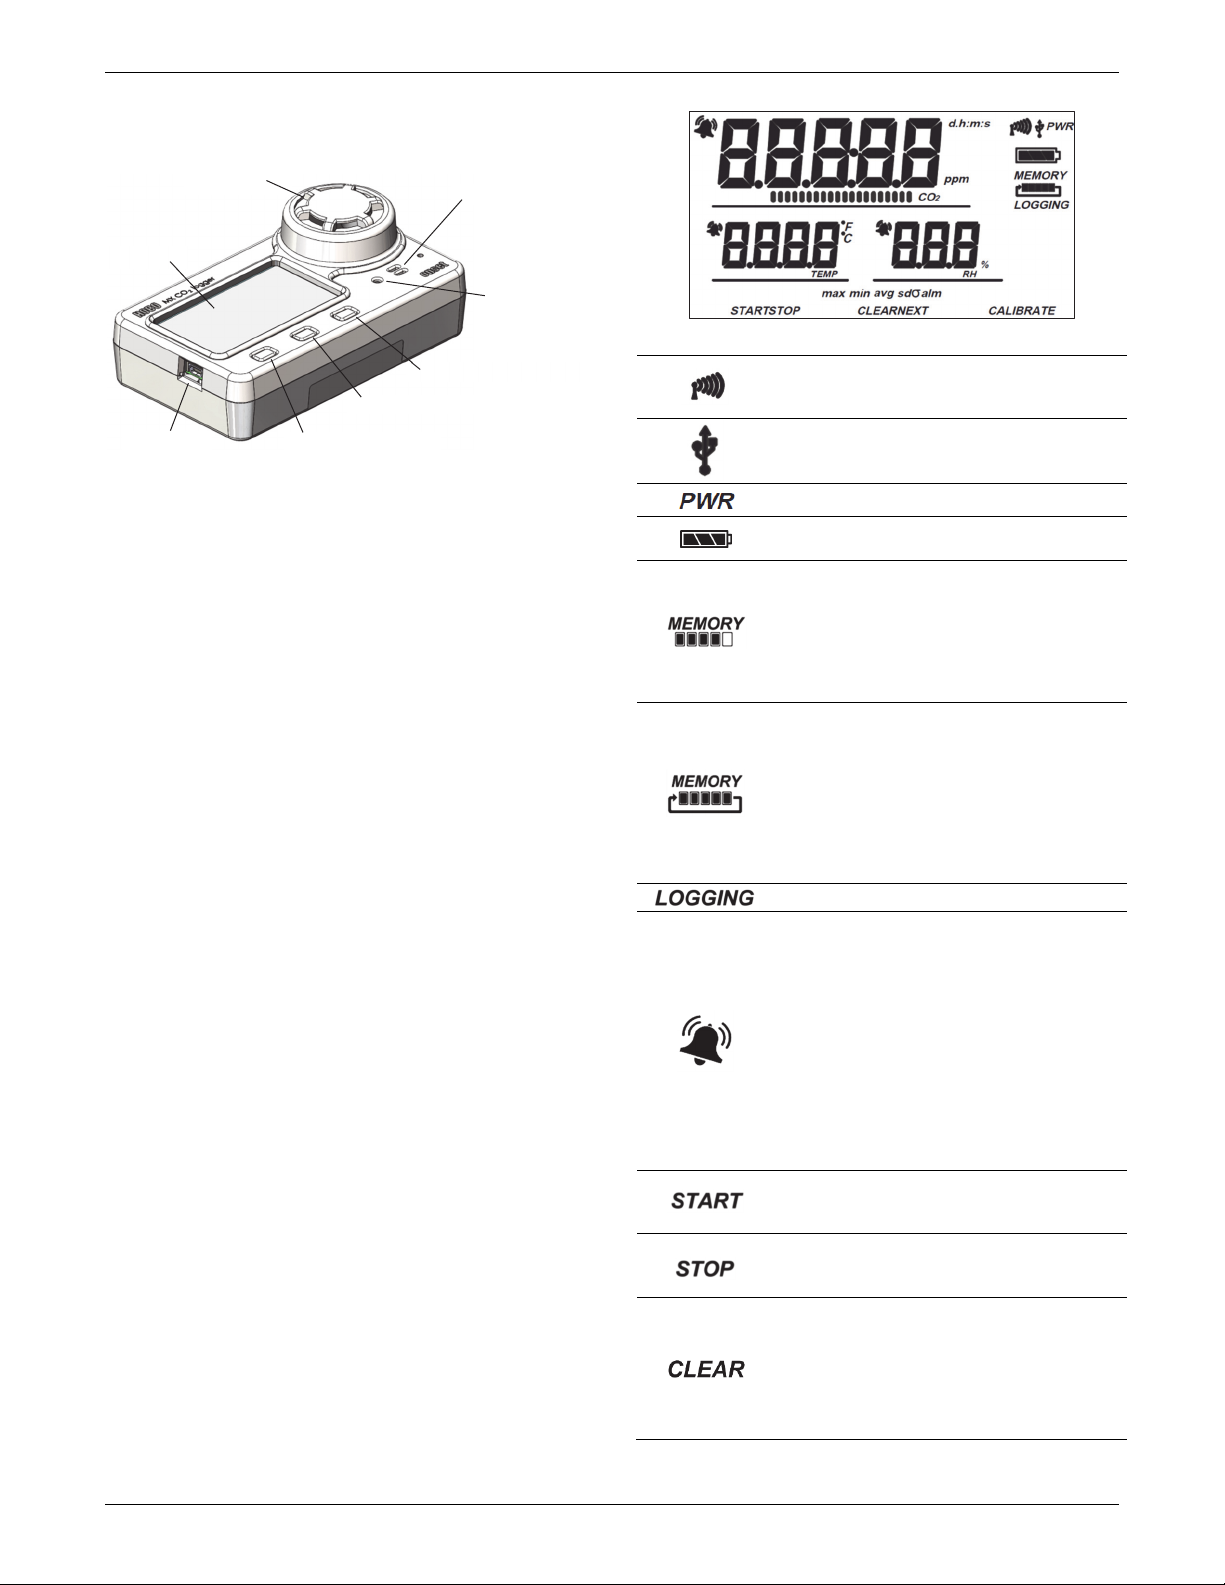
Logger Components and Operation
LCD Screen
USB Port
CO2 Sensor
Clear/Next Button
Start/Stop Button
RH Sensor
Temperature
Sensor
Calibrate Button
USB Port: Use this port to connect the logger to a computer for
use with HOBOware or to power the logger for longer
deployments or if faster logging intervals are required.
Start/Stop Button: Press this button for 3 seconds to start or
stop logging data, or to resume logging on the next even
logging interval. This requires configuring the logger with a
push button start or stop (see Choosing Logger Settings). You
can also press this button for 1 second to record an internal
event (see Logger Events), to silence a beeping alarm (see
Setting up Alarms), or to turn the LCD screen on if the option to
turn off the LCD has been enabled (see Choosing Logger
Settings).
Press both the Start/Stop button and the Clear/Next button
simultaneously for 3 seconds to reset a logger password.
Clear/Next Button: Press this button for 1 second to switch
between statistics, alarm readings, and the current sensor
readings as applicable or to silence a beeping alarm. Press this
button for 3 seconds to clear a visual alarm if the logger was
configured to maintain the alarm until the button is pressed
(see Setting up Alarms).
Calibrate Button: Press this button to start a five-minute
manual calibration process of the CO
sensor. This requires
2
configuring the logger with the manual calibration CO2 sensor
setting enabled in the app or HOBOware and bringing the
logger into a fresh air environment (see Calibrating the Logger).
Temperature Sensor: This sensor is located to the right of the
LCD screen below the large CO
sensor.
2
RH Sensor: This sensor is located behind the vented panel in
the logger case to the right of the temperature sensor.
Sensor: This sensor is located below the large vented
CO
2
circular panel to the right of the LCD screen.
LCD Screen: This logger is equipped with an LCD screen that
displays details about the current status. The example shows all
symbols illuminated on the LCD screen followed by definitions
of each symbol in the table.
LCD Symbol Description
The logger Is currently communicating with the
app via Bluetooth. The more bars there are, the
stronger the Bluetooth signal.
The logger is currently communicating with
HOBOware via USB cable.
The logger is currently being powered by USB cable.
The battery indicator shows the approximate
battery power remaining.
The logger has been configured to stop logging
when memory fills. The memory bar indicates the
approximate space remaining in the logger to
record data. When first started, all five segments
in the bar will be empty. In this example, the
logger memory is almost full (only one segment in
the memory bar is empty).
The logger has been configured to never stop
logging (wrapping). The logger will continue
recording data indefinitely, with newest data
overwriting the oldest data until the batteries die
or the logger is reconfigured. When first launched,
all five segments in the memory bar will be empty.
In this example, the memory is full (all five
segments are filled in) and new data is now
overwriting the oldest data.
The logger is currently logging.
A sensor reading is above or below the high or low
alarm limit that you configured. Press and release
the Clear/Next button until the “alm” symbol
(described later in this table) is displayed on the
screen. This symbol at left will clear depending on
how alarms were configured to be cleared in the
software. If the alarm was set to clear when the
logger is reconfigured or relaunched, this symbol
will remain on the LCD until the next time the
logger is configured (see Setting up Alarms).
Otherwise, it will clear when the sensor reading is
back within the alarm limits or by pressing the
Clear/Next button for 3 seconds.
The logger is waiting to be started. Press and hold
the Start/Stop button for 3 seconds to start the
logger.
The logger has been started with push button stop
enabled; press and hold the Start/Stop button for
3 seconds to stop the logger.
An alarm displayed on the LCD is ready to be
cleared. This will only appear if the logger was
configured to maintain the alarm until the
Clear/Next button is pressed (for 3 seconds). Note
that an audible alarm can be silenced by pressing
the Start/Stop button or Clear/Next button for 1
second.
Find Quality Products Online at: [email protected]
www.GlobalTestSupply.com
Page 4
HOBO MX CO2 Data Logger (MX1102A) Manual
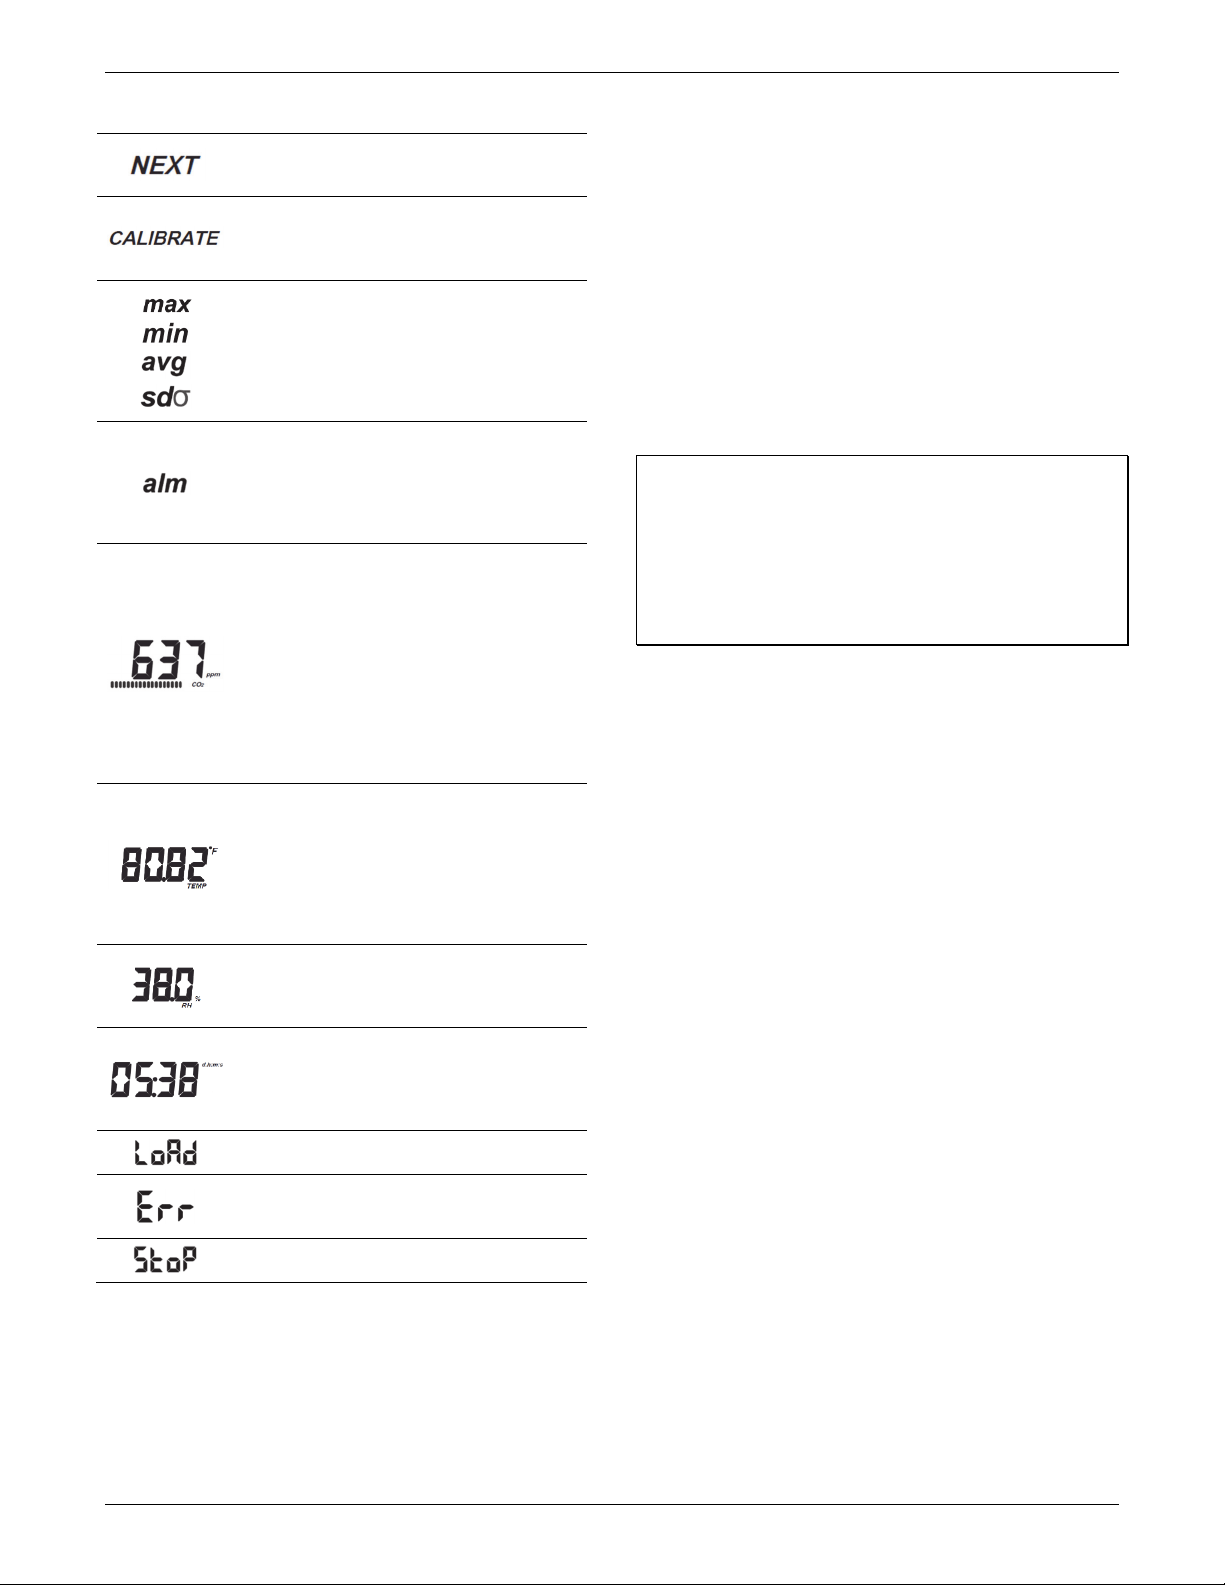
LCD Symbol Description
Press this button to view the latest statistics (if
enabled) or the sensor reading associated with a
tripped alarm.
Press this button for 5 seconds to manually
calibrate the CO
and “CO
minute manual calibration process.
These symbols show the maximum, minimum,
average, and standard deviation values most
recently calculated by the logger (if enabled).
Press the Next/Clear button for 1 second to cycle
through the available statistics and then back to
the current sensor reading (or to the alarm value if
applicable).
This is the farthest out-of-range sample displayed
during the logger deployment. Press the
Clear/Next button to view this reading. Press the
Clear/Next button again to cycle through any
statistics (defined above) and ultimately back to
the current sensor reading.
This is an example of a CO
million. If the logger is powered by battery: A new
segment appears in the status bar every 15
seconds to indicate how long until the display will
be updated. In this example, there are 18
segments. This means it has been 4 minutes and
30 seconds since the CO
the LCD. There are 30 seconds left (two segments)
before the reading will be updated on the LCD. If
the logger is powered by USB cable: The
segmented status bar is not displayed and the
current reading is updated every second.
This is an example of a temperature reading.
Temperature units are determined by the settings
in the software. To switch between Celsius and
Fahrenheit, change the units in the software and
then reconfigure the logger. Temperature readings
are updated on the LCD every 15 seconds if the
logger is battery-powered or every second if it is
USB-powered regardless of logging interval.
This is an example of an RH reading. RH readings
are updated on the LCD every 15 seconds if the
logger is battery-powered or every second if it is
USB-powered regardless of logging interval.
The logger has been configured to start logging on
a particular date/time. The display will count down
in days, hours, minutes, and seconds until logging
begins. In this example, 5 minutes and 38 seconds
remain until logging will begin.
The configure settings are being loaded onto the
logger from the software.
An error occurred while loading the configure
settings onto the logger from the software. Try
reconfiguring the logger.
The logger has been stopped with the software or
because the memory is full.
sensor (if enabled). “Calibrate”
2
” will blink on the LCD during the 5-
2
reading in parts per
2
reading was updated on
2
Notes:
• You can disable the LCD screen in the software. When the
LCD is turned off for logging, you can still temporarily
view the LCD screen by pushing the Start/Stop or
Clear/Next button. The LCD will then remain on for 10
minutes.
• When the logger is connected to the computer with the
USB cable, the LCD screen refreshes every second
regardless of logging interval.
• When the logger has stopped logging, the LCD screen will
remain on with “STOP” displayed until the logger is
offloaded (unless the LCD screen was turned off in the
software). Once the logger has been offloaded, the LCD
will turn off automatically after 2 hours.
• The LCD screen flashes “HELLO” when you page the
logger from the app (see Getting Started with the App).
• The LCD screen flashes “CHIRP OFF” when an audible
alarm is cleared.
Setting up the Logger
Important: The CO2 sensor within this logger can experience
measurement drift during storage and shipment. It is strongly
recommended that a manual calibration be performed prior to
deploying the logger. Start the logger as described in this
section and perform a manual calibration. See Calibrating the
Logger for more details; follow the manual calibration steps in
that section. Improper manual calibration can cause incorrect
sensor readings.
Install the batteries in the logger. Use a Phillips-head
screwdriver to open the battery cover on the back of the logger
and insert four AA batteries observing polarity (see Battery
Information). Screw the cover back in place.
You can use both the app and HOBOware software with this
logger. The following sections provide an overview for using the
logger with both programs. You can switch back and forth
between the two programs (for example, configure the logger
in HOBOware, and read it out in the app). However, you can
only connect to one program at a time. You cannot use the app
with the logger while it is connected to HOBOware. If you
attempt to use the logger in HOBOware while it is connected to
the app, the device will not be found. If you want to connect to
the app after using the logger with HOBOware, you will need to
disconnect the USB cable once you are done with HOBOware.
Getting Started with the App
These steps provide an overview of setting up the logger with
the app.
1. Download HOBOconnect to a phone or tablet from the App
Store® or Google Play™.
Download the app to a Windows computer
2. Open the app and enable Bluetooth in your device settings
if prompted.
3. Tap Devices and then tap the logger in the app to connect
to it.
If the logger does not appear or if it is having trouble
connecting, follow these tips:
• Make sure the logger is within range of your mobile
device or computer. The range for successful wireless
communication is approximately 30.5 m (100 ft) with full
line-of-sight.
Find Quality Products Online at: [email protected]
www.GlobalTestSupply.com
Page 5
HOBO MX CO2 Data Logger (MX1102A) Manual
• If your device can connect to the logger intermittently or
loses its connection, move closer to the logger, within
sight if possible.
• If the logger appears in the app, but you cannot connect
to it, close the app and then power down your device to
force the previous Bluetooth connection to close.
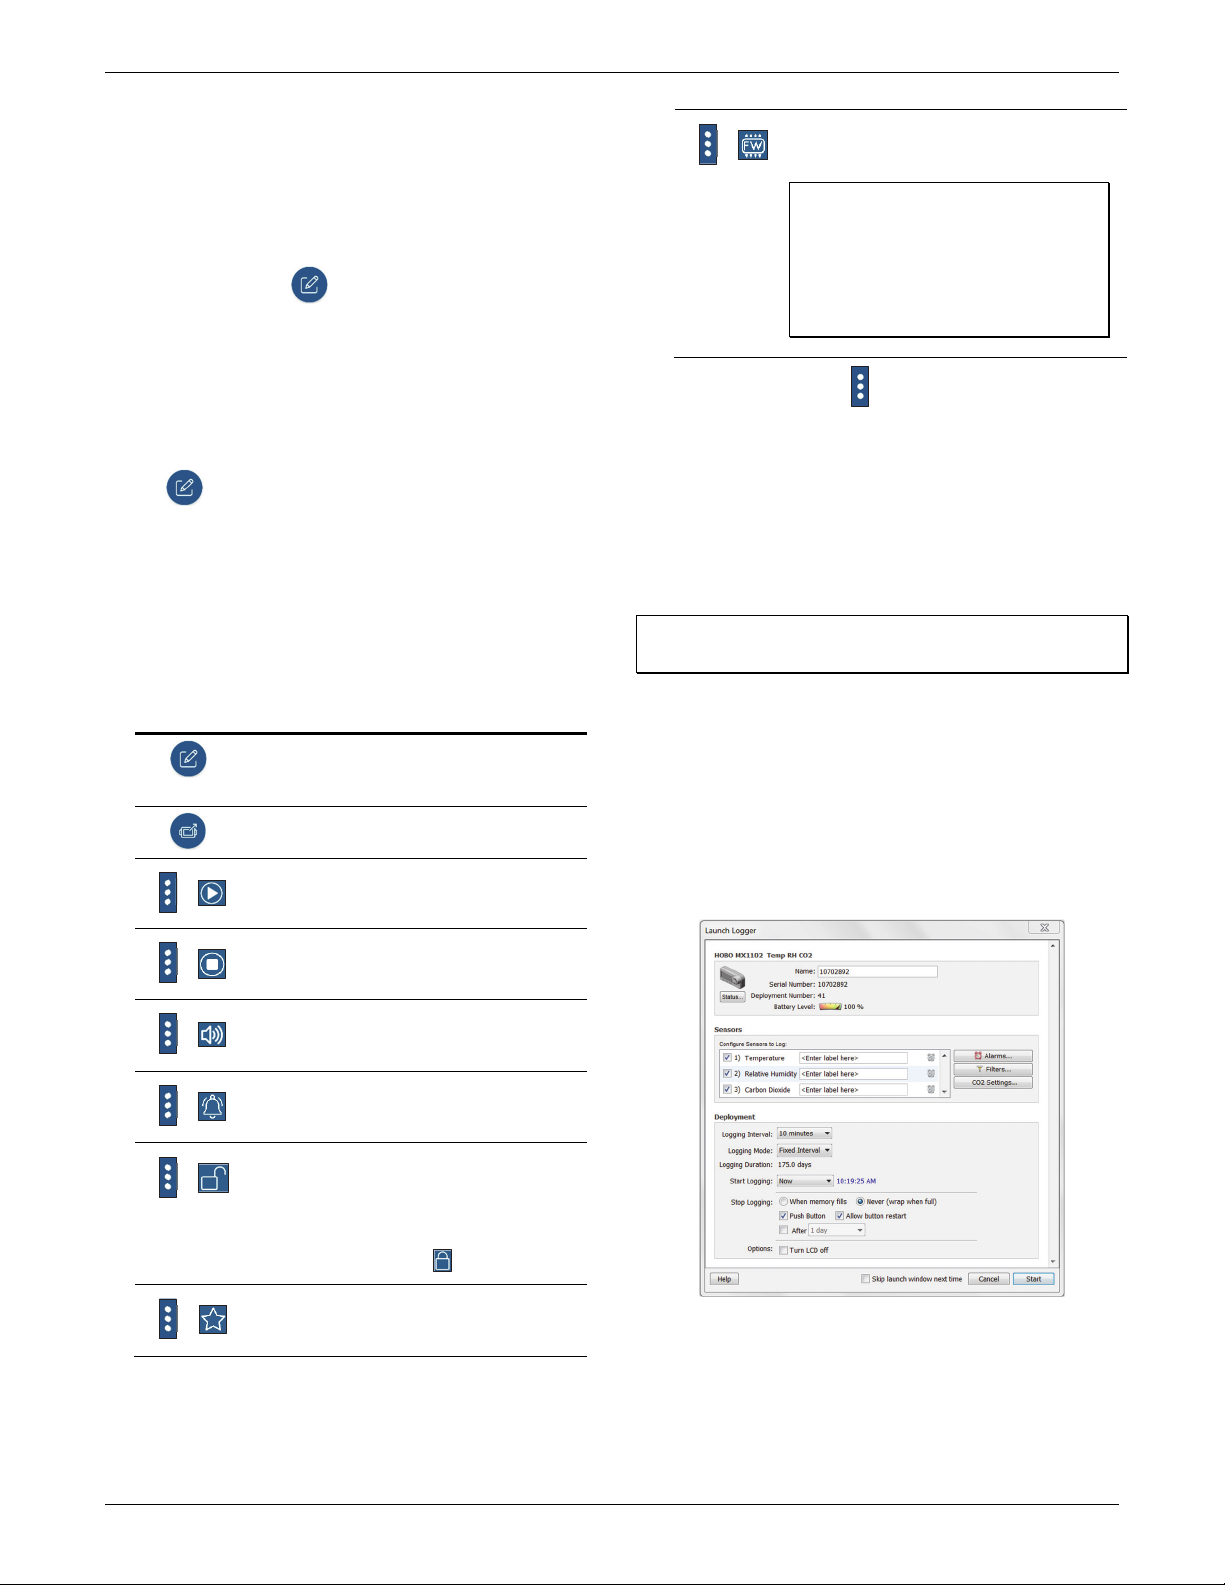
4. Once connected, tap .
5. Choose your logger configuration settings. See Choosing
Logger Settings for details on the available settings.
6. Tap the CO
sensor and select manual and/or auto
2
calibration. Select Altitude Compensation and enter the
altitude above or below sea level. Tap Save. See Calibrating
the Logger for more details on calibration settings.
7. Tap to save the configuration settings.
Logging will begin based on the settings you selected. Deploy
the logger using the included mounting materials (see
Mounting the Logger). After logging begins, you can read out
the logger at any time (see Reading Out the Logger for details).
Note: The sensor readings displayed within the app may not
match what is displayed on the logger.
When the logger is connected, you can:
Tap this: To do this:
Select logger settings and save them onto the
logger to start logging. See Configuring the
Logger.
Read out (offload) logger data. See Reading Out
the Logger.
>
>
>
>
>
>
Start logging if the logger was configured to start
with a button push. See Configuring the Logger.
Stop the logger from recording data (this
overrides any Stop Logging settings described in
Configuring the Logger).
Make the logger beep one time to help you
locate it. “HELLO” also appears on the LCD when
the logger is paged.
Stop a beeping alarm on the logger if audible
alarms are enabled as described in Setting up
Alarms.
Set a password for the logger that will be
required if another mobile device attempts to
connect to it. To reset a password,
simultaneously press both the Start/Stop button
and the Clear/Next button on the top of the
logger for 3 seconds or tap and tap Reset.
Mark the logger as a favorite. You can then filter
the list of devices to only show loggers marked as
favorites.
>
Update the firmware on the logger. A logger
readout will be completed automatically at the
beginning of the firmware update process
Important: Before updating the firmware on
the logger, check the remaining battery level
and make sure it is no less than 30%. Make
sure you have the time to complete the
entire update process, which requires that
the logger remains connected to the device
during the upgrade.
Note: Tapping this icon is only required when using the
app on an iPhone®, iPad®, or Android device.
Getting Started with HOBOware
These steps provide an overview of setting up the logger with
HOBOware. For complete details, see the HOBOware Help.
1. Install HOBOware on your computer.
2. Connect the logger to the computer with a USB cable.
Important: USB 2.0 specifications do not guarantee operation
outside the range of 0°C (32°F) to 50°C (122°F).
3. From the device menu in HOBOware, select Launch.
4. Choose your logger settings. See Choosing Logger Settings
for details on the available settings.
5. Click the CO
calibration (both are selected by default). Select “Use
Carbon Dioxide sensor altitude compensation” and enter
the altitude above or below sea level. Click OK. See
Calibrating the Logger for more details on calibration
settings.
6. Click the Start button when finished. Note that the Start
button text changes based on your Start Logging selection.
Logging will begin based on the settings you selected. Deploy
the logger using the included mounting materials (see
Mounting the Logger). After logging begins, you can read out
the logger at any time (see Reading Out the Logger for details).
Settings button and select manual and/or auto
2
Find Quality Products Online at: [email protected]
www.GlobalTestSupply.com
Page 6
HOBO MX CO2 Data Logger (MX1102A) Manual
Choosing Logger Settings
The following table lists the available settings when configuring
the logger with the app or HOBOware.
Logger Setting Action
Name Enter a name for the logger up to 20 characters.
Group (the app
only)
Logging Interval Select how often the logger will record data.
Start Logging
Options
Stop Logging
Options
Logging Mode Choose a logging mode:
This name will be used as the file name. A name
also helps identify the logger in the Loggers screen
in the app. If no name is entered, the logger serial
number is used.
Add the logger to a group to help identify the
logger.
Choose one of the following:
• Now. Logging will begin
configuration settings are loaded on the logger.
• On Next Logging Interval. Logging will begin at
the next even interval as determined by the
selected logging interval.
• On Button Push. Logging will begin 15 seconds
after you press the Start/Stop logging button on
the logger for 3 seconds.
• On Date/Time. Logging will begin at a date and
time you specify.
Choose a memory option:
• When Memory Fills. The logger will continue
recording data until the memory is full.
• Never (Wrap When Full). The logger will
continue recording data indefinitely, with
newest data overwriting the oldest. This option
is not available if the Logging Mode is set to
Burst (see Burst Logging).
Choose this stop logging option if desired:
• On Button Push. Select this if you want to be
able to stop logging by pushing the Start/Stop
button on the logger.
Choose a Stop Logging time-based option.
• Never. Select this if you do not want the logger
to stop at any predetermined time frame.
• On Date/Time. Select this if you want the logger
to stop logging on a specific date and time.
Select the date and time.
• After. Select this if you want to control how
long the logger should continue logging once it
starts. Choose the amount of time you want the
logger to log data. For example, select 30 days if
you want the logger to log data for 30 days after
logging begins.
• Fixed Logging. The logger will record data for all
enabled sensors at the selected logging interval.
• Burst Logging. In burst mode, logging occurs at
a different interval when a specified condition is
met. See Burst Logging for more information.
• In the app, select Normal if you want the logger
to log current readings. Select each statistic you
want the logger to log.
In HOBOware, select Statistics and then select
Current Reading if you want sensor readings to
be logged. Select each statistic you want the
immediately after
Logger Setting Action
logger to log.
Current readings and statistics are logged at the
logging interval rate. See Statistics Logging for
more information.
Show LCD Enable or disable to control whether the LCD
Sensor & Alarm
Setup
remains illuminated while the logger is logging. If
you disable the LCD, the logger will not show the
current reading, status, or other information while
the logger is logging. You will, however, be able to
temporarily turn the LCD screen on by pressing the
Start/Stop button on the logger for 1 second.
Enable the sensor measurement types that will be
logged: temperature, RH, and/or CO
temperature and RH are required to calculate dew
point, which is an additional data series available
for plotting after reading out the logger. You can
configure alarms for sensors. See Setting up
Alarms. If logging CO
settings. See Calibrating the Logger.
, you can select calibration
2
. Both
2
Calibrating the Logger
The CO2 sensor in the logger requires altitude compensation
and regular calibration to ensure accurate readings are being
taken in the location where it is deployed. Both auto and
manual calibration are selected by default when first
configuring the logger. Altitude compensation should be used if
you are monitoring CO
meters (1,000 feet).
Some CO
measurement drift may occur during shipment and
2
storage. A manual calibration immediately after logging begins
is recommended for best accuracy.
Important: If performing a manual calibration, be sure to follow
the instructions later in this section. Improper manual
calibration can result in incorrect sensor readings.
The following CO2 settings are available in both the app and
HOBOware:
• Manual calibration. Manual calibration is the best way to
calibrate your logger. Use this option if you want to
manually calibrate the logger to 400 ppm using the
Calibrate button on the logger. This requires taking the
logger outside in fresh air on a dry day or to an indoor
location that is unoccupied and has no connection to a
ventilation system for five minutes on a regular basis.
Press the Calibrate button on the logger for 5 seconds to
manually calibrate the CO
will blink on the LCD during the 5-minute manual
calibration process in which 300 measurements are taken
to get the average and create the offset from 400 ppm.
(See the steps later in this section for more details on
manual calibration.) This is recommended if the logger is
deployed in a building that is always occupied, if you want
the logger to be calibrated more frequently than every
eight days (the normal auto calibration schedule), or if you
want to calibrate the logger immediately after logging
begins. Note: Once a manual calibration is performed, the
24-hour auto calibration is canceled and an auto
calibration will be performed eight days from the time the
manual calibration occurred.
at elevations above or below 305
2
sensor. “Calibrate” and “CO2”
2
Find Quality Products Online at: [email protected]
www.GlobalTestSupply.com
Page 7
HOBO MX CO2 Data Logger (MX1102A) Manual
•
Auto calibration. Use this option if you want the logger to
automatically calibrate within the first 24 hours after
logging begins and then every eight days thereafter. The
logger will be calibrated based on the average of the three
measurements that follow the lowest CO2 value
CO
2
identified during the 24-hour or 8-day time period as
applicable.
Important: Accurate auto-calibration requires the building
or location where the logger is deployed to be empty at
least once during the eight-day period (for example, an
empty office building during the weekend or overnight will
typically have background CO2 levels of 400 to 450 ppm).
If the logger is deployed in an area where the CO2 level
does not go down to 400 ppm during the eight-day time
period, then manual calibration should be performed
regularly instead or inaccurate CO2 readings will be
reported. If you plan on using auto calibration but the
building will be occupied during the first day after logging
begins, then you can use the manual calibration option as
well. You can manually calibrate the logger immediately
after logging begins and use auto calibration thereafter.
Note: Every time the logger is started, auto calibration will
occur after 24 hours and then again after eight days unless
a manual calibration is performed first.
•
Altitude compensation. The CO2 sensor must compensate
for locations above or below 305 meters (1,000 feet) to
provide an accurate reading. You must enter the altitude
above or below sea level in either meters or feet when
configuring the logger if it will be deployed at a location
above or below sea level. In normal use, the CO2
measurement will vary by approximately 0.135% of the
reading for each mbar change in barometric pressure (the
sensor is calibrated at 1,013 mbar). Use altitude
compensation when deploying the logger for the best CO
accuracy possible.
To access calibration and altitude compensation settings in
the app:
1. Tap Devices and then tap the logger in the app to connect
to it.
2. Tap .
3. Tap the CO
sensor.
2
4. Select auto calibration, manual calibration, or both.
5. Select “Altitude Compensation” and enter the altitude
above or below sea level where the logger will be deployed
in either meters or feet.
6. Tap Save.
7. Tap .
To access calibration and altitude compensation settings in
HOBOware:
1. Connect the logger to the computer with the USB cable.
2. From the Device menu in HOBOware, select Launch.
3. Click the CO
Settings button.
2
4. Select auto calibration, manual calibration, or both.
5. Select “Use Carbon Dioxide sensor altitude compensation”
and enter the altitude above or below sea level where the
logger will be deployed in either meters or feet.
6. Click OK.
7. Click Start in the Launch Logger window to load settings to
the logger.
Note: If both auto calibration and manual calibration are
selected, the logger will automatically calibrate within 24 hours
after logging begins unless a manual calibration occurs during
that time period. In addition, when both calibration settings are
selected, the eight-day calibration cycle will be reset any time a
manual calibration is performed.
To manually calibrate the CO
sensor:
2
Important: If you do not follow these manual calibration
instructions as described, the sensor readings will be incorrect
and you will need to manually calibrate the logger again.
1. Take the logger outside in fresh air on a dry day where the
carbon dioxide level is 400 ppm. You can also use an indoor
location for manual calibration if it is unoccupied and is not
exposed to a ventilation system.
2. Press the Calibrate button on the logger for 5 seconds until
it beeps. The logger will then calibrate for 5 minutes. The
CO2 and Calibrate symbols on the LCD will flash while the
calibration is underway. A time- and date-stamped manual
calibration event is logged in the data at the end of the 5minute calibration sequence.
3. Once the Calibration process is complete, return the logger
to its deployment location. Repeat this process at least once
every eight days for best accuracy.
Setting up Alarms
2
You can set an alarm to trip on the logger when a sensor
reading rises above or falls below a specified value. This can
alert you to problems so you can take corrective action. To set
up a sensor alarm:
1. In the app: Connect to the logger and tap .
In HOBOware: From the device menu, select Launch. Click
the Alarms button in the Launch Logger window.
2. Select the sensor that you want to set up with an alarm
condition.
3. Enable the High Alarm if you want an alarm to trip when the
sensor reading rises above the high alarm value. Drag the
slider to the reading that will trip the alarm or type a
specific reading.
4. Enable the Low Alarm if you want an alarm to trip when the
sensor reading falls below the low alarm value. Drag the
slider to the reading that will trip the alarm or type a
specific reading.
5. Set the duration before an alarm is tripped and select one
of the following:
• Cumulative. The alarm will trip once the sensor reading is
out of the acceptable range for the selected duration any
time during logging. For example, if the high alarm is set
to 85°F and the duration is set to 30 minutes, then the
alarm will trip once the sensor readings have been above
Find Quality Products Online at: [email protected]
www.GlobalTestSupply.com
Page 8
HOBO MX CO2 Data Logger (MX1102A) Manual
85°F for a total of 30 minutes since the logger was
configured.
• Consecutive. The alarm will trip once the sensor reading
is out of the acceptable range continuously for the
selected duration. For example, the high alarm is set to
85°F and the duration is set to 30 minutes, then the
alarm will only trip if all sensor readings are 85°F or
above for a continuous 30-minute period.
6. Repeat steps 2–5 for any other sensors if desired (tap Save
in the app first).
7. Enable Audible Alarms if you want a beep to sound on the
logger every 30 seconds when the sensor alarm trips (in the
app, enable this in the configuration settings screen; in
HOBOware, select the Use Audible Alarm checkbox in the
Configure Alarms window). The beeping will continue until
the alarm is cleared from the software, a button on the
logger is pressed, or 7 days have passed. Battery life will be
slightly reduced when this setting is enabled. It is
recommended that you only enable this feature if you have
regular access to the logger so that you can easily turn off
the beeping.
8. Select one of the following options for when to clear the
alarm symbol that appears on the LCD (in the app, enable
this in the configuration settings screen; in HOBOware,
select the checkbox in the Configure Alarms window).
• Logger reconfigured or relaunched. The alarm icon will
remain visible on the LCD until the next time the logger is
reconfigured.
• Sensor is in limits. The alarm icon will remain visible on
the LCD until the sensor reading returns to the normal
range between any configured high and low alarm limits.
• Alarm button is pressed. The alarm icon will remain
visible until you press the Clear/Next button on the
logger.
9. In the app: Tap .
In HOBOware: Click OK in the Configure Alarms window and
then click Start in the Launch Logger window when ready.
Notes about alarms:
• The alarm icon will be illuminated on the logger LCD
when the alarm trips. You can also press the Clear/Next
button on the logger to view the farthest out-of-range
value during the deployment.
• Alarm limits for temperature and RH sensors are checked
every 15 seconds. The CO
15 seconds if the logger is powered by USB cable or every
5 minutes if it is powered by batteries. If you are
configuring a CO2 sensor alarm for a battery-powered
logger, it is recommended that the duration you select is
divisible by 5 and a minimum of 5 minutes.
• For USB-powered loggers, CO
for the first 15 seconds after logging begins as the CO2
sensor requires a 15-second warmup period.
• The actual values for the high and low alarm limits are set
to the closest value supported by the logger. In addition,
alarms can trip or clear when the sensor reading is within
the resolution specifications.
alarm limits are checked every
2
alarms will not be tripped
2
• When you read out the logger, alarm events can be
displayed on the plot or in the data file. See Logger
Events.
• Once cleared, an audible alarm will start beeping again if
the sensor values go out of the normal range. Even if an
audible alarm is cleared, a visual alarm may remain on
the logger LCD and in the app (if applicable) depending
on the settings selected for maintaining visual alarms or
because the alarm condition may still be in effect. In
addition, an audible alarm will continue beeping when
the sensor values have returned to the normal range
until it is cleared.
• Although an audible alarm and a visual alarm can occur
at the same time when a sensor alarm is tripped, they are
cleared in different ways. The audible alarm can be
cleared from within the software, a button on the logger
is pressed, or 7 days have passed. Meanwhile, a visual
alarm is cleared as determined by the setting selected for
maintaining an alarm in the software. This means you
could clear a beeping audible alarm and the visual alarm
will remain on the LCD and in the app (if applicable) until
the logger is reconfigured, the sensor is in limits, or the
alarm button is pressed--whichever setting you selected.
• If the logger was configured to stop logging with a button
push, any tripped alarms will be cleared automatically
when logging is stopped and no Alarm Cleared event will
be logged in the data file.
Burst Logging
Burst logging is a logging mode that allows you to set up more
frequent logging when a specified condition is met. For
example, a logger is recording data at a 5-minute logging
interval and burst logging is configured to log every 30 seconds
when the temperature rises above 85°F (the high limit) or falls
below 32°F (the low limit). This means the logger will record
data every 5 minutes as long as the temperature remains
between 85°F and 32°F. Once the temperature rises above
85°F, the logger will switch to the faster logging rate and record
data every 30 seconds until the temperature falls back to 85°F.
At that time, logging then resumes every 5 minutes at the
normal logging interval. Similarly, if the temperature falls below
32°F, then the logger would switch to burst logging mode again
and record data every 30 seconds. Once the temperature rises
back to 32°F, the logger will then return to normal mode,
logging every 5 minutes.
To set up burst logging:
1. In the app: Connect to the logger and tap .
In HOBOware: From the Device menu, select Launch.
2. Set the Logging Mode to burst logging. (If already selected
in HOBOware, click the Edit button.)
3. Select the sensor that will have burst limits.
4. Enable High Limit if you want burst logging to occur when
the sensor reading rises above a specific reading. Drag the
slider to the reading that will trigger burst logging or type a
specific reading.
5. Enable Low Limit if you want burst logging to occur when
the sensor reading falls below a specific reading. Drag the
Find Quality Products Online at: [email protected]
www.GlobalTestSupply.com
Page 9
HOBO MX CO2 Data Logger (MX1102A) Manual
slider to the reading that will trigger burst logging or type a
specific reading.
6. Set the burst logging interval. Select an interval faster than
the logging interval. Keep in mind that the more frequent
the burst logging rate, the greater the impact on battery life
and the shorter the logging duration.
7. Repeat steps 3–6 for any other sensors if desired (tap Save
in the app first).
8. In the app: Tap .
In HOBOware: Click OK in the Burst Logging window and
then click Start in the Launch Logger window when ready.
Notes about Burst Logging:
• Sensor alarms, statistics, and the Stop Logging option
“Never (Wrapping)” are not available in burst logging
mode.
• Once the logger is configured, the high and low burst
limits are checked every 15 seconds. Therefore, if you set
the logging interval to less than 15 seconds and the
sensor reading falls outside the levels, the burst logging
will not begin until the next 15-second cycle.
• If high and/or low limits have been configured for more
than one sensor, then burst logging will begin when any
high or low condition goes out of range. Burst logging will
not end until all conditions on all sensors are back within
normal range.
• The actual values for the burst logging limits are set to
the closest value supported by the logger.
• Burst logging mode can begin or end when the sensor
reading is within the resolution specifications.
• Once the high or low condition clears, the logging
interval time will be calculated using the last recorded
data point in burst logging mode, not the last data point
recorded in “normal mode.” For example, a logger has a
10-minute logging interval and logged a data point at
9:05. Then, the high limit was surpassed and burst
logging began at 9:06. Burst logging then continued until
9:12 when the sensor reading fell back below the high
limit. Now back in normal mode, the next logging interval
will be 10 minutes from the last burst logging point, or
9:22 in this case. If burst logging had not occurred, the
next data point would have been at 9:15.
• A New Interval event is created each time the logger
enters or exits burst logging mode. See Logger Events for
details on plotting and viewing the event. In addition, if
the logger is stopped with a button push while in burst
logging mode, then a New Interval event is automatically
logged and the burst condition is cleared, even if the
actual high or low condition has not cleared.
Statistics Logging
During fixed logging, the logger records data for enabled
sensors and/or selected statistics at the logging interval
selected. Statistics are calculated at a sampling rate you specify
with the results for the sampling period recorded at each
logging interval. The following statistics can be logged for each
sensor:
• The maximum, or highest, sampled value,
• The minimum, or lowest, sampled value,
• An average of all sampled values, and
• The standard deviation from the average for all sampled
values.
For example, a logger is configured with the temperature and
sensors enabled and the logging interval set to 5 minutes.
CO
2
The current reading and all four statistics are enabled. The
statistics sampling interval is set to 30 seconds. Once logging
begins, the logger will measure and record the actual
temperature and CO2 sensor values every 5 minutes. In
addition, the logger will take a temperature and CO
every 30 seconds and temporarily store them in memory. The
logger will then calculate the maximum, minimum, average,
and standard deviation using the samples gathered over the
previous 5-minute period and log the resulting values. When
reading out the logger, this would result in the following 10
data series (not including any derived series): two sensor series
(with temperature and CO2 current readings logged every 5
minutes) plus eight maximum, minimum, average, and standard
deviation series (four for temperature and four for CO2 with
values calculated and logged every 5 minutes based on the 30second sampling rate).
To set up statistics:
1. In the app: Connect to the logger and tap .
In HOBOware: From the Device menu, select Launch.
2. In the app: Tap Logging Mode and then select Fixed
Logging.
In HOBOware: Select Statistics for the logging mode.
3. Select Normal in the app or Current Reading in HOBOware
to record the current reading for each enabled sensor at the
logging interval selected. Do not select this if you only want
to log statistics.
4. Select the statistics you want the logger to record at each
logging interval: Maximum, Minimum, Average, and
Standard Deviation (average is automatically enabled when
selecting Standard Deviation). Statistics will be logged for all
enabled sensors. In addition, the more statistics you record,
the shorter the logger duration and the more memory is
required.
5. Set the statistics sampling interval. The rate selected must
be less than, and a factor of, the logging interval. For
example, if the logging interval is 1 minute and you select 5
seconds for the sampling rate, then the logger will take 12
sample readings between each logging interval (one sample
every 5 seconds for a minute) and use the 12 samples to
record the resulting statistics at each 1-minute logging
interval. Note that the more frequent the sampling rate, the
greater the impact on battery life.
6. In the app: Tap Save and then tap .
In HOBOware: Click OK in the Burst Logging window and
then click Start in the Launch Logger window when ready.
Once logging begins, press the Clear/Next button on the logger
to cycle through the current maximum, minimum, average, and
standard deviation data on the LCD screen. Note that the logger
sample
2
Find Quality Products Online at: [email protected]
www.GlobalTestSupply.com
Page 10
HOBO MX CO2 Data Logger (MX1102A) Manual
will always display the current sensor readings in the app (If
applicable) even if they are not being logged. You can plot the
statistics series once you read out the logger.
Setting a Password
You can create an encrypted password for the logger that will
be required if another device attempts to connect to it. This is
recommended to ensure that a deployed logger is not
mistakenly stopped or purposely altered by others. This
password uses a proprietary encryption algorithm that changes
with every connection.
To set a password:
1. Tap Devices and tap the logger in the app to connect to it.
2. Tap (if applicable) and then .
3. Type a password and then tap Set.
Only the device used to set the password can then connect to
the logger without entering a password; all other devices will
be required to enter the password. For example, if you set the
password for the logger with your tablet and then try to
connect to the logger later with your phone, you will be
required to enter the password on the phone but not with your
tablet. Similarly, if others attempt to connect to the logger with
different devices, then they would also be required to enter the
password. To reset a password, Press both the Start/Stop
button and the Clear/Next button simultaneously for 3 seconds
to reset a logger password, or connect to the logger and tap
(if applicable), then , and tap Reset.
Reading Out the Logger
To offload data from the logger to the app:
1. Tap Devices and tap the logger in the app to connect to it.
2. Tap . The logger will read out the data to the phone,
tablet, or computer.
3. Once the readout is complete, tap HOBO Files and select
the file to view it. Tap (if applicable) and to export
the data.
Data can also be uploaded automatically to HOBOlink, Onset’s
web-based software, via the app or the MX gateway. For
details, see the app user’s guide and see the HOBOlink help for
details on working with data in HOBOlink.
To offload date from the logger to HOBOware:
1. Connect the logger to the computer with the USB cable.
2. From the Device menu, select Readout.
3. Save the data file when prompted. See the HOBOware Help
for details on plotting and exporting data in HOBOware.
Note: Data files read out from the logger in one program are
not automatically available in the other. To open app files in
HOBOware, share the HOBO file via email and open it on the
computer with HOBOware. Files in HOBOware cannot be
viewed in the app. You can, however, export data in HOBOware
to a text or Excel file that you can open on your mobile device.
See the app user’s guide and HOBOware Help for details on
sharing or exporting data.
Logger Events
The logger records the following internal events to track logger
operation and status. You can select events to be plotted when
opening the data file in HOBOware. To plot events in the app,
tap HOBO Files and select a file to open. Tap (if applicable)
and then tap . Select the events you want to plot and tap
OK.
Internal Event Name Definition
Host Connected
Started
Stopped The logger received a command to stop
Button Up/Button
Down
Chan <#> Alarm
Tripped
Chan <#> Alarm
Cleared
New Interval The logger has entered or exited burst
Automatic
Calibration
Manual Calibration
Safe Shutdown The battery level dropped below 3.7 V; the
The logger was connected to the mobile
device or computer as applicable.
The Start/Stop button was pressed to begin
or resume logging.
recording data (from the software or by
pushing the Start/Stop button).
The Start/Stop button was pressed for
1 second.
A sensor alarm has tripped; <#> is the sensor
number, where 1 is CO
and 3 is RH.
A sensor alarm has cleared; <#> is the sensor
number, where 1 is CO
and 3 is RH. This event also contains the
value that was furthest out of range for the
sensor before the alarm cleared, which is
only available in a shared or exported file.
logging mode.
The CO2 sensor has been calibrated
automatically; the data file will show the
offset calculated in PPM during the
calibration.
The CO
sensor has been manually
2
calibrated; the data file will show the offset
calculated in PPM during the calibration.
logger performs a safe shutdown.
, 2 is temperature,
2
, 2 is temperature,
2
Mounting the Logger
There are several ways to mount the logger using the materials
included:
• Attach Command strips to the back of the logger to
mount it to a wall or other flat surface.
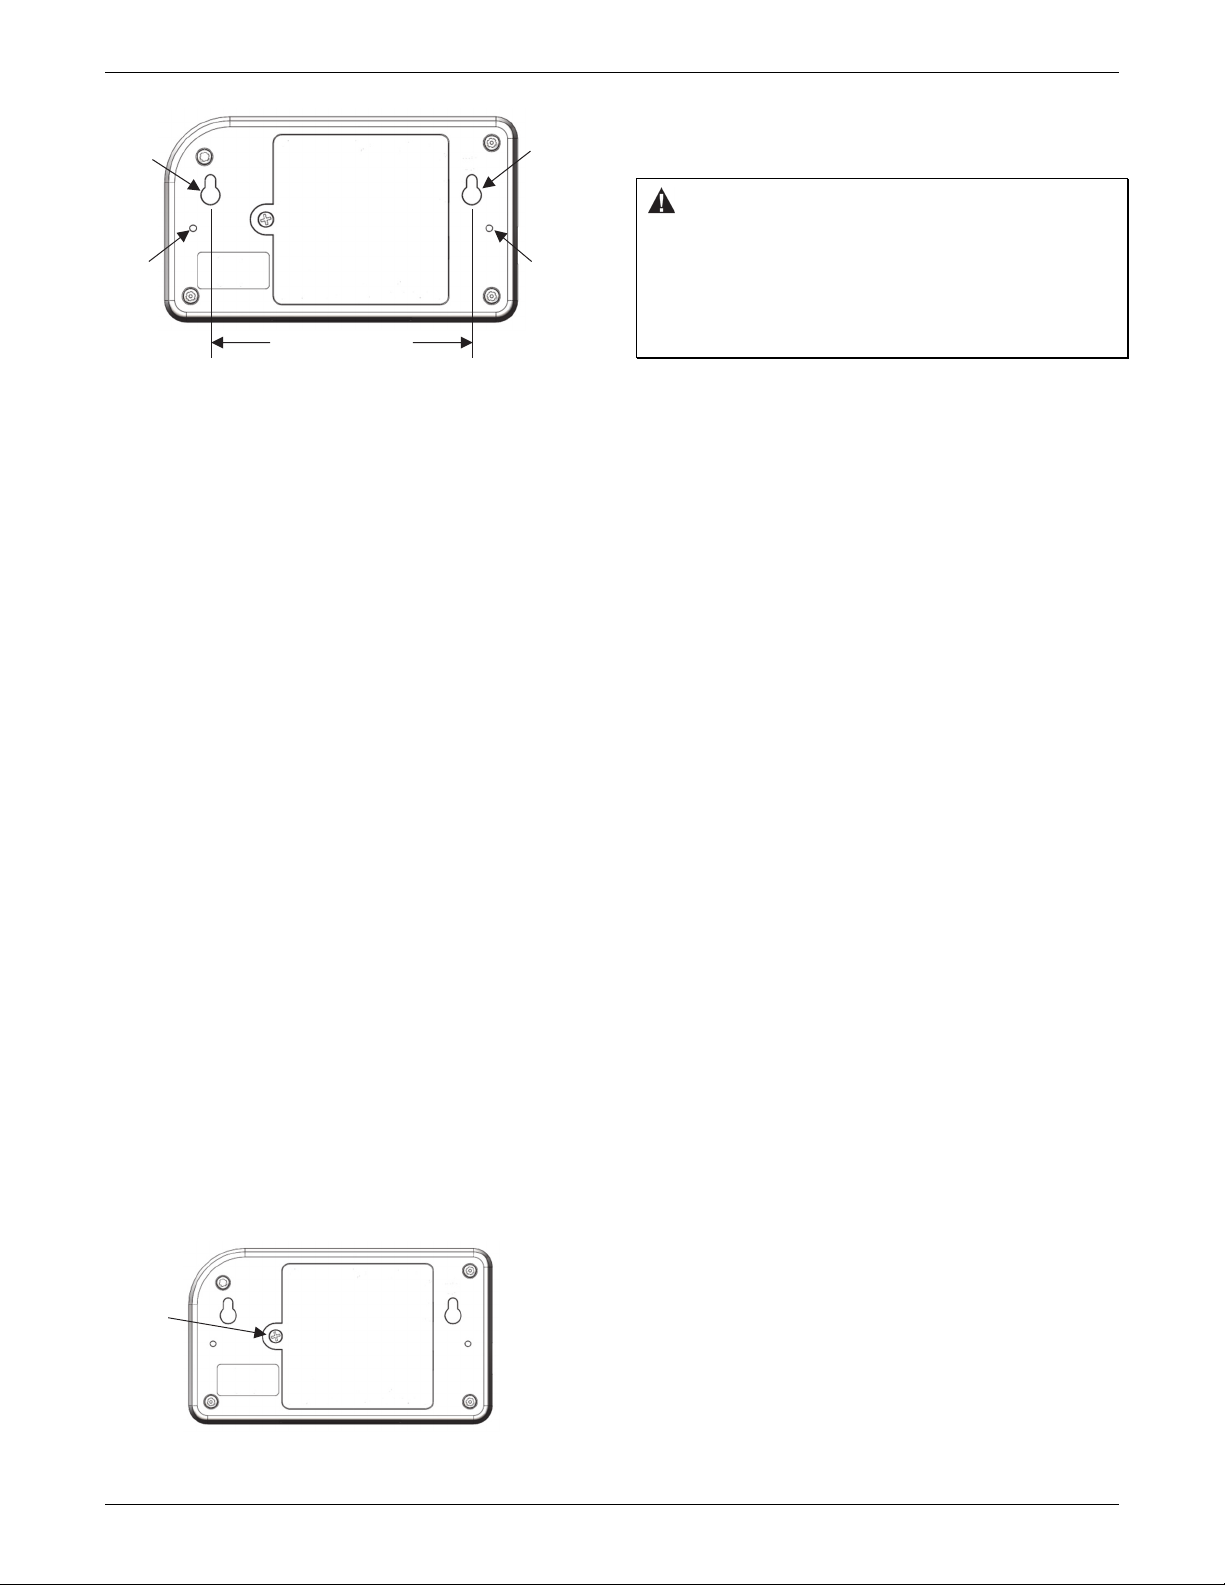
• Screw in the brackets onto both sides of the logger using
the two small holes labeled in the diagram below and
then use tie wraps to mount it to a pole or pipe.
• Mount the logger to the wall or a flat surface using two
screws and the included template. The dimensions are
also shown in the following example.
Find Quality Products Online at: [email protected]
www.GlobalTestSupply.com
Page 11
HOBO MX CO2 Data Logger (MX1102A) Manual
Wall
mounting
hole
Bracket
mounting
hole
mounting
Bracket
mounting
9.53 cm (3.75 inches)
Protecting the Logger
The logger is designed for indoor use and can be permanently
damaged by corrosion if it gets wet. Protect it from
condensation. If the message FAIL CLK appears on the LCD
screen, there was a failure with the internal logger clock
possibly due to condensation. Remove the battery immediately
and dry the circuit board.
Note: Static electricity may cause the logger to stop logging.
The logger has been tested to 8 KV, but avoid electrostatic
discharge by grounding yourself to protect the logger.
Battery Information
The logger requires four user-replaceable AA 1.5 V alkaline or
optional lithium batteries for operation at the extreme ends of
the logger operating range. Expected battery life varies based
on the ambient temperature where the logger is deployed, the
logging or sampling interval, frequency of offloading and
connection to a mobile device, number of channels that are
active, audible alarms duration, use of burst mode or statistics
logging, and battery performance. New batteries typically last 6
months with logging and sampling intervals greater than 5
minutes.
Deployments in extremely cold or hot temperatures, or a
logging or sampling interval faster than 5 minutes can impact
battery life. Estimates are not guaranteed due to uncertainties
in initial battery conditions and operating environment.
The logger can also be powered by the USB cable if faster
logging intervals are desired or when the remaining battery
voltage is too low for it to continue logging. Connect the logger
to the computer, click the Readout button on the toolbar in
HOBOware, and save the data as prompted. Replace the
battery before launching the logger again.
To install or replace the batteries:
1. Use a Phillips-head screwdriver to unscrew the battery
cover on the back of the logger.
Remove this
screw to
replace the
batteries
Wall
hole
hole
3. Insert four new batteries observing polarity.
4. Screw the battery cover back in place.
WARNING: Do not cut open, incinerate, heat above 85°C
(185°F), or recharge the lithium batteries. The batteries may
explode if the logger is exposed to extreme heat or conditions
that could damage or destroy the battery case. Do not dispose
of the logger or batteries in fire. Do not expose the contents of
the batteries to water. Dispose of the batteries according to
local regulations for lithium batteries.
Note: CO2 sensor readings may temporarily appear as 0 ppm in
the app when replacing the batteries until the logger begins
logging again.
2. Remove any old batteries.
Find Quality Products Online at: [email protected]
www.GlobalTestSupply.com
 Loading...