

Bode 100
User Manual
Smart Measurement Solutions
®

Version: ENU1006 05 02 — Year: 2017
© OMICRON Lab, OMICRON electronics. All rights reserved.
This manual is a publication of OMICRON electronics.
All rights including translation reserved. Reproduction of any kind, e.g., photocopying, microfilming,
optical character recognition and/or storage in electronic data processing systems, requires the explicit
consent of OMICRON electronics. Reprinting, wholly or in part, is not permitted.
The product information, specifications, and technical data embodied in this manual represent the
technical status at the time of writing and are subject to change without prior notice.
Windows is a registered trademark of Microsoft Corporation. OMICRON Lab and Smart Measurement
Solutions are registered trademarks of OMICRON electronics.
2
OMICRON Lab

Contents
Contents
1 Safety instructions 5
1.1 Operator qualifications ................................................................................................................ 5
1.2 Rules for use ............................................................................................................................... 6
1.3 Designated use ........................................................................................................................... 6
1.4 Disclaimer ................................................................................................................................... 6
1.5 Cleaning ...................................................................................................................................... 6
2 Compliance statements and recycling 7
2.1 Compliance statement ................................................................................................................ 7
2.2 Information for disposal and recycling ......................................................................................... 7
3 Bode 100 and accessories 8
3.1 Delivered items ........................................................................................................................... 8
3.2 Optional accessories ................................................................................................................... 9
4 Technical data 10
4.1 Absolute maximum ratings .......................................................................................................... 10
4.2 Bode 100 specifications .............................................................................................................. 11
4.3 Power requirements .................................................................................................................... 12
4.4 System requirements .................................................................................................................. 12
4.5 Environmental requirements ....................................................................................................... 13
4.6 Mechanical data .......................................................................................................................... 13
5 Device overview 14
5.1 Connectors .................................................................................................................................. 14
5.2 Block diagram ............................................................................................................................. 16
5.3 Functional description ................................................................................................................. 17
5.4 Hardware revisions ..................................................................................................................... 17
6 Bode Analyzer Suite introduction 18
6.1 Start screen ................................................................................................................................. 18
6.2 Main window ............................................................................................................................... 19
6.2.1 Measurement configuration .......................................................................................... 21
6.2.2 Trace configuration ....................................................................................................... 23
6.2.3 Ribbon controls ............................................................................................................. 25
6.2.4 Status bar ..................................................................................................................... 27
6.3 Chart context menu ..................................................................................................................... 28
6.4 Options menu .............................................................................................................................. 29
6.5 Hardware setup ........................................................................................................................... 32
7 Measurement types and applications 34
7.1 Gain measurement introduction .................................................................................................. 35
7.2 Impedance measurement introduction ........................................................................................ 37
7.3 Vector Network Analysis ............................................................................................................ 41
7.3.1 Transmission / Reflection ............................................................................................ 41
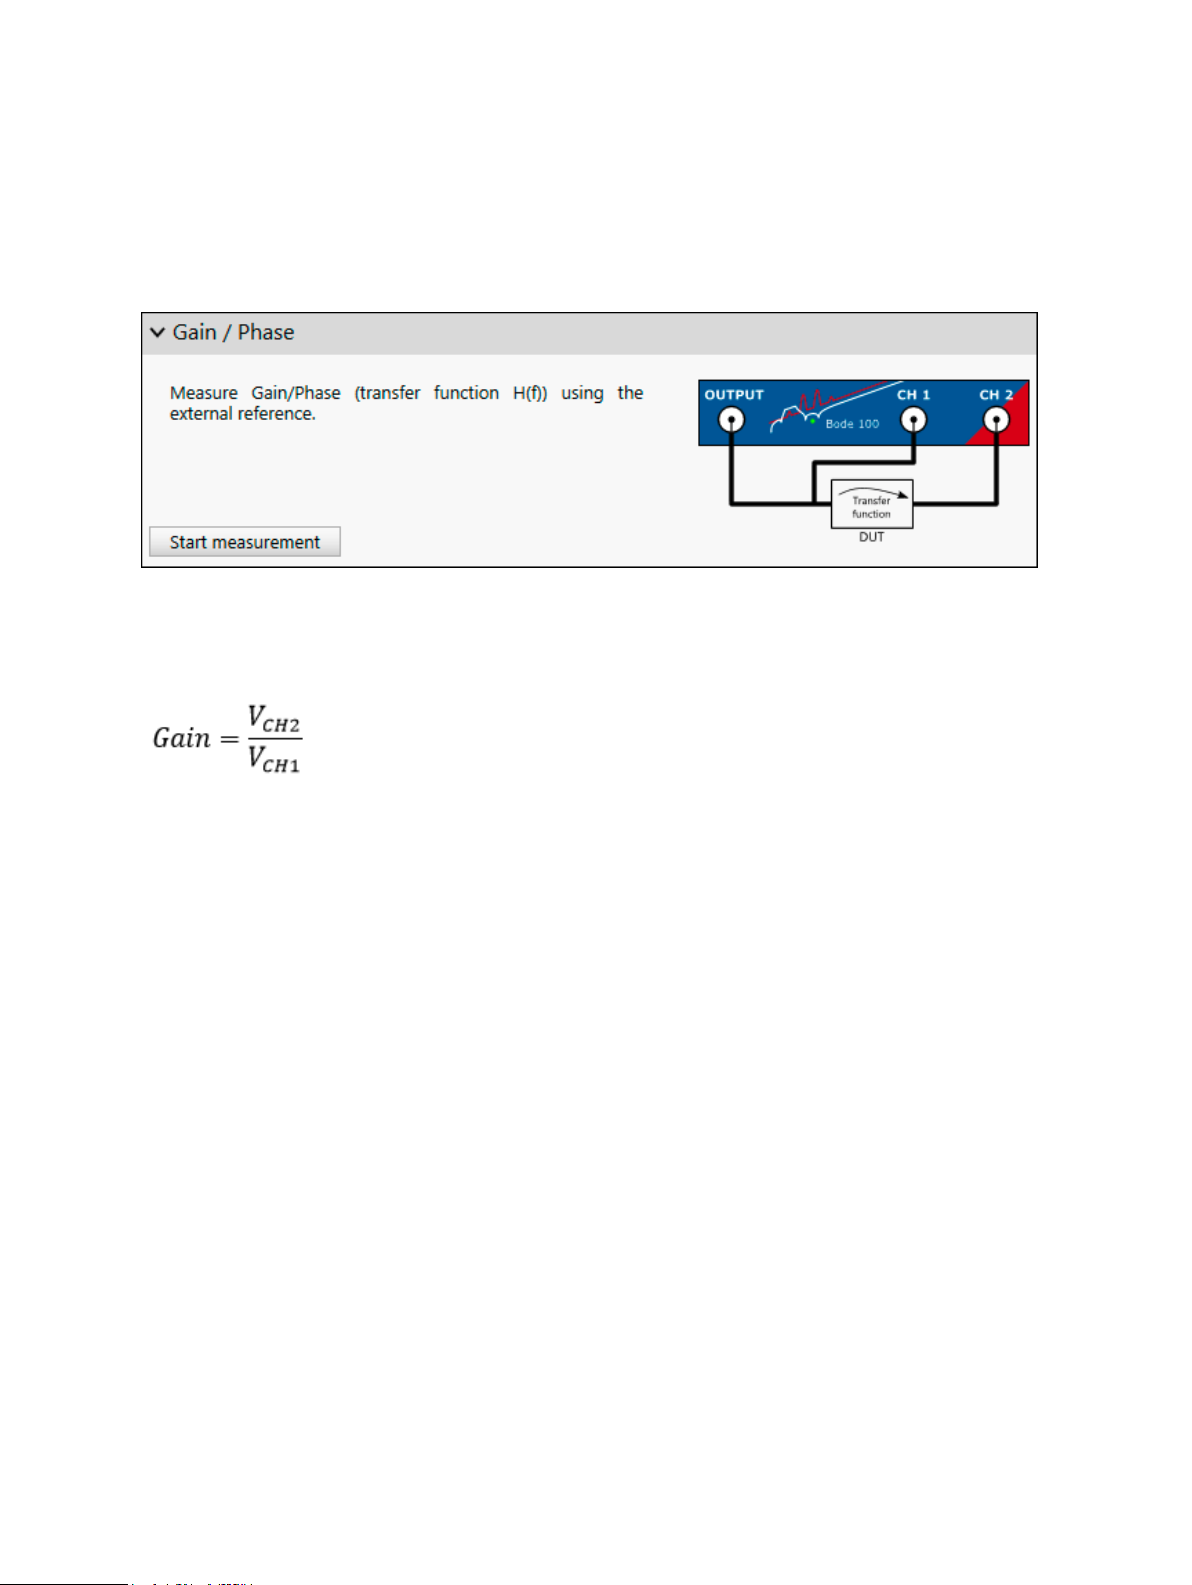
7.3.2 Gain / Phase ................................................................................................................. 47
7.3.3 Reflection with external coupler .................................................................................... 48
7.4 Impedance analysis ................................................................................................................... 49
7.4.1 One-Port ....................................................................................................................... 49
7.4.2 Impedance Adapter ...................................................................................................... 59
7.4.3 Shunt-Thru .................................................................................................................... 64
7.4.4 Shunt-Thru with series resistance ............................................................................... 65
7.4.5 Series-Thru ................................................................................................................... 66
7.4.6 Voltage/Current ............................................................................................................. 67
OMICRON Lab
3

7.4.7 External Bridge ............................................................................................................. 68
8 Calibration 69
8.1 Internal device calibration ........................................................................................................... 69
8.2 Performing a Gain Calibration ..................................................................................................... 70
8.2.1 Calibrating a Transmission (S21) measurement .......................................................... 71
8.2.2 Calibrating a Gain/Phase measurement ....................................................................... 73
8.3 Performing an Impedance Calibration ........................................................................................ 75
8.3.1 Calibrating a Reflection or One-Port Impedance measurement ................................... 78
8.3.2 Calibrating an External Coupler or External Bridge measurement ............................... 80
8.3.3 Calibrating an Impedance Adapter measurement ........................................................ 82
8.3.4 Calibrating a Shunt-Thru or Series-Thru measurement ............................................... 84
8.3.5 Calibrating a Voltage/Current measurement ................................................................ 86
8.4 Further calibration information ................................................................................................... 87
8.4.1 Difference between Full-Range and User-Range calibration ....................................... 87
8.4.2 Enabling and disabling a calibration ............................................................................. 89
8.4.3 Re-performing a calibration .......................................................................................... 90
8.4.4 Full-Range calibration below 10 Hz .............................................................................. 90
8.4.5 Automatic deletion of calibration ................................................................................... 91
8.4.6 Saving calibration data ................................................................................................. 91
9 Bode Analyzer Suite functions 92
9.1 Exporting and saving measurement data or settings .................................................................. 92
9.1.1 Loading and saving the equipment configuration ........................................................ 92
9.1.2 Use the copy to clipboard functions to export data ....................................................... 92
9.1.3 Exporting measurement data to CSV or Excel files ...................................................... 94
9.1.4 Generating a Touchstone file ........................................................................................ 96
9.1.5 Generate a PDF report ................................................................................................. 97
9.2 Signal source settings ................................................................................................................. 98
9.3 Using the interactive chart ........................................................................................................... 101
9.3.1 Configure the diagrams ................................................................................................ 101
9.3.2 Zooming the measurement curve ................................................................................ 103
9.3.3 Optimize the axis scaling ............................................................................................. 106
9.4 Working with cursors and the cursor grid .................................................................................... 109
9.5 Using the memory traces ............................................................................................................ 111
9.6 Using the trace configuration ...................................................................................................... 114
9.7 Cursor calculations ...................................................................................................................... 116
9.7.1 Non-Invasive Stability Measurement ............................................................................ 116
9.7.2 Fres-Q Calculation ........................................................................................................ 118
9.8 Using probes ............................................................................................................................... 120
9.9 Unwrapped phase ....................................................................................................................... 123
9.10 Check for updates ....................................................................................................................... 125
10 Automation interface 126
11 Troubleshooting 127
Support 128
Index 129
4
OMICRON Lab
Safety instructions
1 Safety instructions
Before operating Bode 100 and its accessories, read the following safety instructions carefully. If you
do not understand some safety instructions, contact OMICRON Lab before proceeding. When working
with Bode 100, observe all safety instructions in this document. You are responsible for every
application that makes use of an OMICRON or OMICRON Lab product. Any miss-operation can result
in damage to property or persons. Maintenance and repair of Bode 100 and its accessories is only
permitted by qualified experts either at OMICRON Lab or at certified repair centers.
Following these instructions will help you to prevent danger, repair costs and possible down time due
to incorrect operation. Furthermore, it ensures the reliability and life-cycle of Bode 100.
Use Bode 100 in observance of all existing safety requirements from national standards for
accident prevention and environmental protection.
Reading the Bode 100 manual alone does not release you from the duty of complying with all national
and international safety regulations relevant for working with Bode 100, for example, the regulation
EN50191 "Erection and Operation of Electrical Test Equipment”.
WARNING
Bode 100 is a SELV device (SELV = Safety Extra Low Voltage according to IEC
60950).
► Do not apply hazardous voltage levels >50 VDC or >25 VAC to the inputs of
Bode 100.
► Ensure that voltage and current probes used with Bode 100 are properly grounded
in accordance with their manufacturer's guidelines.
► When working with voltage or current probes, always connect the Bode 100's
ground terminal (available for HW Rev. 2 or higher) with a solid connection of at
least 3.6 mm² cross-section and not longer than 10 m to the ground terminal in the
laboratory.
► Be aware that no indication on Bode 100 shows that the output is active. This could
be especially critical if amplifiers are connected to Bode 100.
1.1 Operator qualifications
• Testing with Bode 100 must only be carried out by qualified, skilled and authorized personnel.
• Personnel receiving training, instructions, directions, or education on Bode 100 must be under
constant supervision of an experienced operator while working with the equipment.
• Testing with Bode 100 must comply with the internal safety instructions as well as additional
relevant documents.
OMICRON Lab
5

1.2 Rules for use
• Bode 100 is exclusively intended for the application area specified in this document. The
manufacturer/distributors are not liable for damage resulting from a use other than the specified
operation. The user alone assumes all responsibility and risk.
• Use Bode 100 only when it is in a technically sound condition.
• Do not open Bode 100 or remove any of its housing components.
• Do not carry out any modifications, extensions or adaptations to Bode 100.
• Use Bode 100 in observance of all existing safety requirements from national and international
standards for accident prevention and environmental protection.
• Always keep the manual either printed or as PDF file at the site where Bode 100 is used. The
manual must be read by all people working with Bode 100. In addition to the manual and the
applicable regulations for accident prevention in the country and at the site of operation, heed the
accepted technical procedures for safe and competent work.
1.3 Designated use
Bode 100 and its accessories are especially designed for swept frequency measurements of
electronic circuits in laboratory and manufacturing environments.
Examples for typical applications are:
• Measurement of the complex transfer function of amplifiers, filters and attenuators
• S-Parameter measurement in the 50 Ohm domain
• Stability assessment of control loops
• Determination of resonance frequencies of piezo elements and quartz crystals
• Impedance measurement of inductors, capacitors and resistors
1.4 Disclaimer
The advisory procedures and information contained within this document have been compiled as a
guide to the safe and effective operation of Bode 100. It has been prepared in conjunction with
application engineers and the collective experience of the manufacturer.
The in-service conditions for the use of Bode 100 may vary between customers and end-users.
Consequently, this document is offered as a guide only. It shall be used in conjunction with the
customers own safety procedures, maintenance program, engineering judgment, and training
qualifications.
Using Bode 100 or its accessories in a manner not specified by the manufacturer may result in
damage to property or persons.
1.5
Cleaning
Use a cloth dampened with isopropanol alcohol to clean Bode 100 and its accessories.
6
OMICRON Lab
Compliance statements and recycling
2 Compliance statements and recycling
2.1 Compliance statement
Declaration of Conformity (EU)
The equipment adheres to the guidelines of the council of the European Community for meeting the
requirements of the member states regarding the electromagnetic compatibility (EMC) directive and
the RoHS directive.
FCC compliance (USA)
This equipment has been tested and found to comply with the limits for a Class A digital device,
pursuant to part 15 of the FCC Rules. These limits are designed to provide reasonable protection
against harmful interference when the equipment is operated in a commercial environment. This
equipment generates, uses, and can radiate radio frequency energy and, if not installed and used in
accordance with the instruction manual, may cause harmful interference to radio communications.
Operation of this equipment in a residential area is likely to cause harmful interference, in which case
the user will be required to correct the interference at his own expense. Changes or modifications not
expressly approved by the party responsible for compliance could void the user's authority to operate
the equipment.
Declaration of compliance (Canada)
This Class A digital apparatus complies with Canadian ICES-003. Cet appareil numérique de la classe
A est conforme à la norme NMB-003 du Canada.
2.2 Information for disposal and recycling
Bode 100 and all of its accessories are not intended for household use. At
the end of its service life, do not dispose of the test set with household
waste!
For customers in EU countries (incl. European Economic Area)
OMICRON test sets are subject to the EU Waste Electrical and Electronic
Equipment Directive (WEEE directive). As part of our legal obligations
under this legislation, OMICRON offers to take back the test set and to
ensure that it is disposed of by an authorized recycling facility.
For customers outside the European Economic Area
Please contact the authorities in charge for the relevant environmental
regulations in your country and dispose Bode 100 and all of its
accessories only in accordance with your local legal requirements.
OMICRON Lab
7
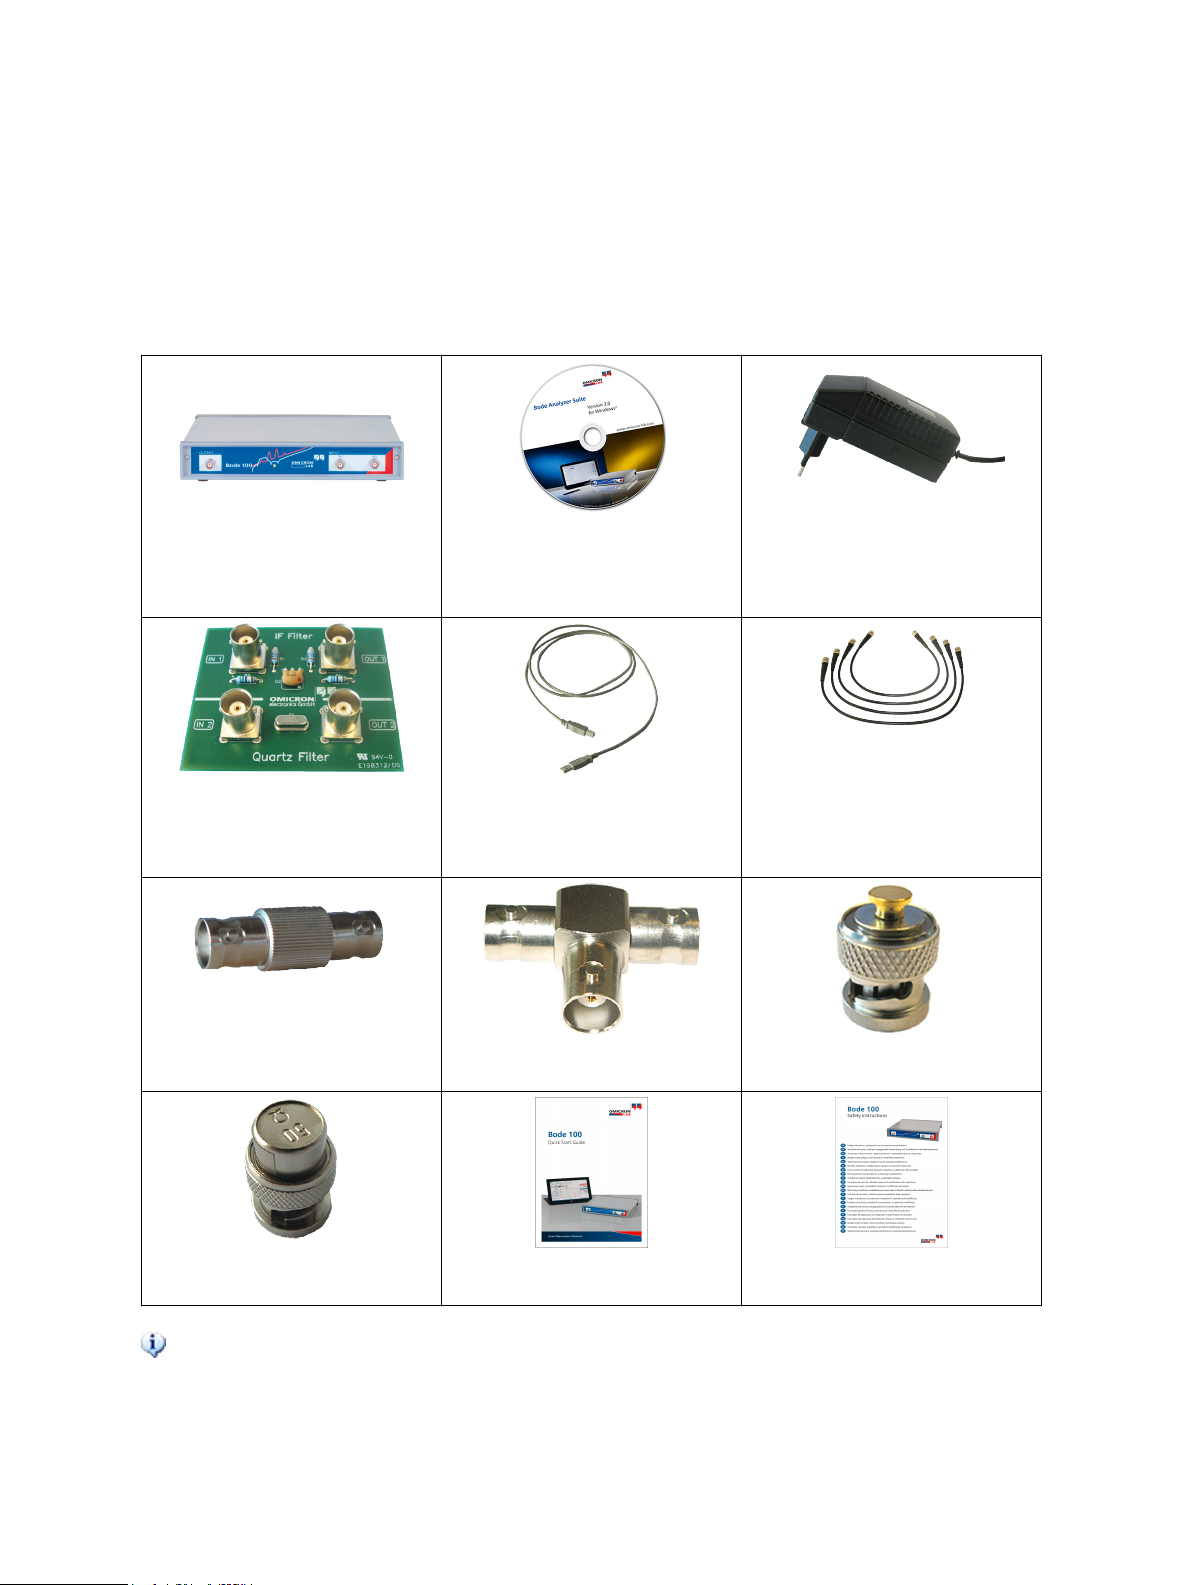
3 Bode 100 and accessories
3.1 Delivered items
Bode 100
multi functional test set
Bode Analyzer Suite on DVD Wide-range AC power supply
including mains input plugs for
different national standards
4 pc. BNC 50 Ω cable (m-m)
Test objects
(Quartz filter and IF filter) on
PCB
BNC straight adapter (f-f)
BNC 50 Ω load (m)
The delivered items may vary a bit from the look shown above. Please refer to the packing
list received with the Bode 100 for further information
Bode 100 Quick Start Guide
USB Cable
BNC T adapter (f-f-f)
BNC short circuit (m)
Multilingual safety instructions
8
OMICRON Lab

3.2 Optional accessories
B-WIT 100 Wideband Injection Transformer
The B-WIT 100 is used to inject signals into control loops. Its main
application is in the stability analysis of switched mode power
supplies and linear voltage regulators.
B-SMC impedance adapter for surface mount components
The B-SMC extends the impedance measurement range of
Bode 100. It enables you to easily measure components for
surface mounting such as ceramic capacitors or chip resistors.
B-WIC impedance adapter for thru hole type components
The B-WIC extends the impedance measurement range of
Bode 100. It enables you to perform impedance measurements for
thru hole type components such as inductors or crystal oscillators.
Bode 100 and accessories
B-AMP 12 amplifier
12 dB amplifier to boost the output signal of Bode 100 for
applications where more than 13 dBm are needed.
B-RFID measurement adapters
The B-RFID adapters allow standard compliant measurement of
the resonance frequency and Q-factor of RFID antennas.
For more information on the above mentioned Bode 100 accessories and recommended
accessories manufactured by partner companies visit www.omicron-lab.com.
OMICRON Lab
9
4 Technical data
In this section you can find the most important technical data for the Bode 100 Revision 2.
Technical data can change without notice.
You can download a detailed technical data sheet for Bode 100 from the OMICRON Lab website
www.omicron-lab.com → Bode 100 → Technical Data
4.1
NOTICE
Exceeding the absolute maximum ratings listed below might result in a permanent damage of the
device.
Table 4-1: Absolute maximum ratings
Characteristic Absolute Maximum Rating
DC Power Input
DC supply voltage +28 V
Max. DC supply reverse voltage -28 V
INPUT CH 1, INPUT CH 2 connectors (high Z input impedance selected )
Maximum DC input signal 50 V
Maximum AC input signal 1 Hz...10 MHz: 50 Vrms
INPUT CH 1, INPUT CH 2 connectors (50 Ω input impedance selected)
Maximum input power 1 W
Maximum input voltage 7 Vrms
OUTPUT connector
Maximum reverse power 0.5 W
Maximum reverse voltage 3.5 Vrms
Absolute maximum ratings
1 MHz...2 MHz: 30 Vrms
2 MHz...5 MHz: 15 Vrms
5 MHz...10 MHz: 10 Vrms
10 MHz ... 50 MHz: 7 Vrms
10
OMICRON Lab
Technical data
4.2 Bode 100 specifications
In this section you can find the most important technical data for the Bode 100. This
technical data is valid for Bode 100 R2 (Hardware revision 2). To find out what hardware
revision you use, please check 5.4 Hardware revisions on page 17.
Technical data can change without notice. You can download a detailed technical data sheet
from the OMICRON Lab website www.omicron-lab.com → Bode 100 → Technical Data
Table 4-2: Bode 100 specifications
Characteristic Rating
OUTPUT
Voltage range -30 dBm...13 dBm
7 mVrms...1 Vrms at 50 Ω load
14 mVrms...2 Vrms at high impedance load
Frequency range 1 Hz...50 MHz
Wave form sinusoidal
Source impedance 50 Ω
Connector BNC
INPUT CH 1, INPUT CH 2
AC measurement range 100 mVrms full scale with 0 dB input attenuation
10 Vrms full scale with 40 dB input attenuation
Frequency range 1 Hz...50 MHz
Input impedance Selectable via software:
• 50 Ω
• 1 MΩ ±2% || 40...55 pF
Connectors BNC
Input attenuators Selectable via software:
0 dB, 10 dB, 20 dB, 30 dB, 40 dB
Receiver bandwidth Selectable via software:
1 Hz, 3 Hz, 10 Hz, 30 Hz, 100 Hz, 300 Hz, 1 kHz,
3 kHz , 5 kHz*
*only Bode 100 R2
Dynamic Range > 100 dB (10 Hz receiver bandwidth)
Gain Error < 0.1 dB (calibrated)
Phase Error < 0.5 ° (calibrated)
PC interface
Universal serial bus USB 2.0 or higher
Connector USB type B socket
OMICRON Lab
11

4.3 Power requirements
Table 4-3: Power requirements
Characteristic Rating
DC input
Supply voltage range +9 ... 24 V
Minimum DC supply power 10 W
Connector Coaxial power socket
Inner Diameter: 2.5 mm
Outer Diameter: 5.5 mm
Polarity
Inner conductor: Positive voltage
Outer conductor: Ground
We strongly recommend you to use the power supply delivered with Bode 100.
4.4 System requirements
Table 4-4: System requirements
Characteristic Minimum PC Configuration
Processor Intel Core-I Dual-Core (or similar)
Memory (RAM) 2 GB, 4 GB recommended
Graphics resolution Super VGA (1024x768)
higher resolution recommended
Graphics card DirectX 11 with Direct2D support
USB interface USB 2.0
Operating System Microsoft Windows 7 SP1 or higher
12
OMICRON Lab
Technical data
4.5 Environmental requirements
Table 4-5: Environmental requirements
Characteristic Condition Rating
Temperature Storage -35 ... +60 °C / -31...+140 °F
Operating +5 ... +40 °C / -41...+104 °F
For specification 23 °C ±5 °C / 73 °F ±18 °F
Relative humidity Storage 20 ... 90 %, non-condensing
Operating 20 ... 80 %, non condensing
4.6 Mechanical data
Table 4-6: Mechanical data
Characteristic Rating
Dimensions (w x h x d) without connectors 26 cm x 5 cm x 26.5 cm / 10.25 " x 2 " x 10.5 "
Weight < 2 kg / 4.4 lbs
OMICRON Lab
13

5 Device overview
Bode 100 is a USB controlled vector network analyzer. The system consists of the Bode 100 hardware
and the Bode Analyzer Suite software. In the following the Bode 100 hardware is described in detail.
To learn more about the Bode Analyzer Suite, please check out 6.1 Start screen on page 18 ff.
5.1
NOTICE
To avoid damage of Bode 100 make sure that the absolute maximum ratings defined in chapter
4.1 Absolute maximum ratings on page 10 are not exceeded at any time.
For save operation it is strongly recommended only to use the power supply delivered with
Bode 100.
Bode 100 provides the following three connectors at the front panel:
• OUTPUT: signal output (BNC socket)
• CH 1: channel 1 signal input (BNC socket)
• CH 2: channel 2 signal input (BNC socket)
Connectors
CAUTION
To ensure save operation and to prevent injuries it is recommended to connect
Bode 100 to ground using the ground connector at the rear panel at all times.
Figure 5-1: Bode 100 front view
14
OMICRON Lab
Device overview
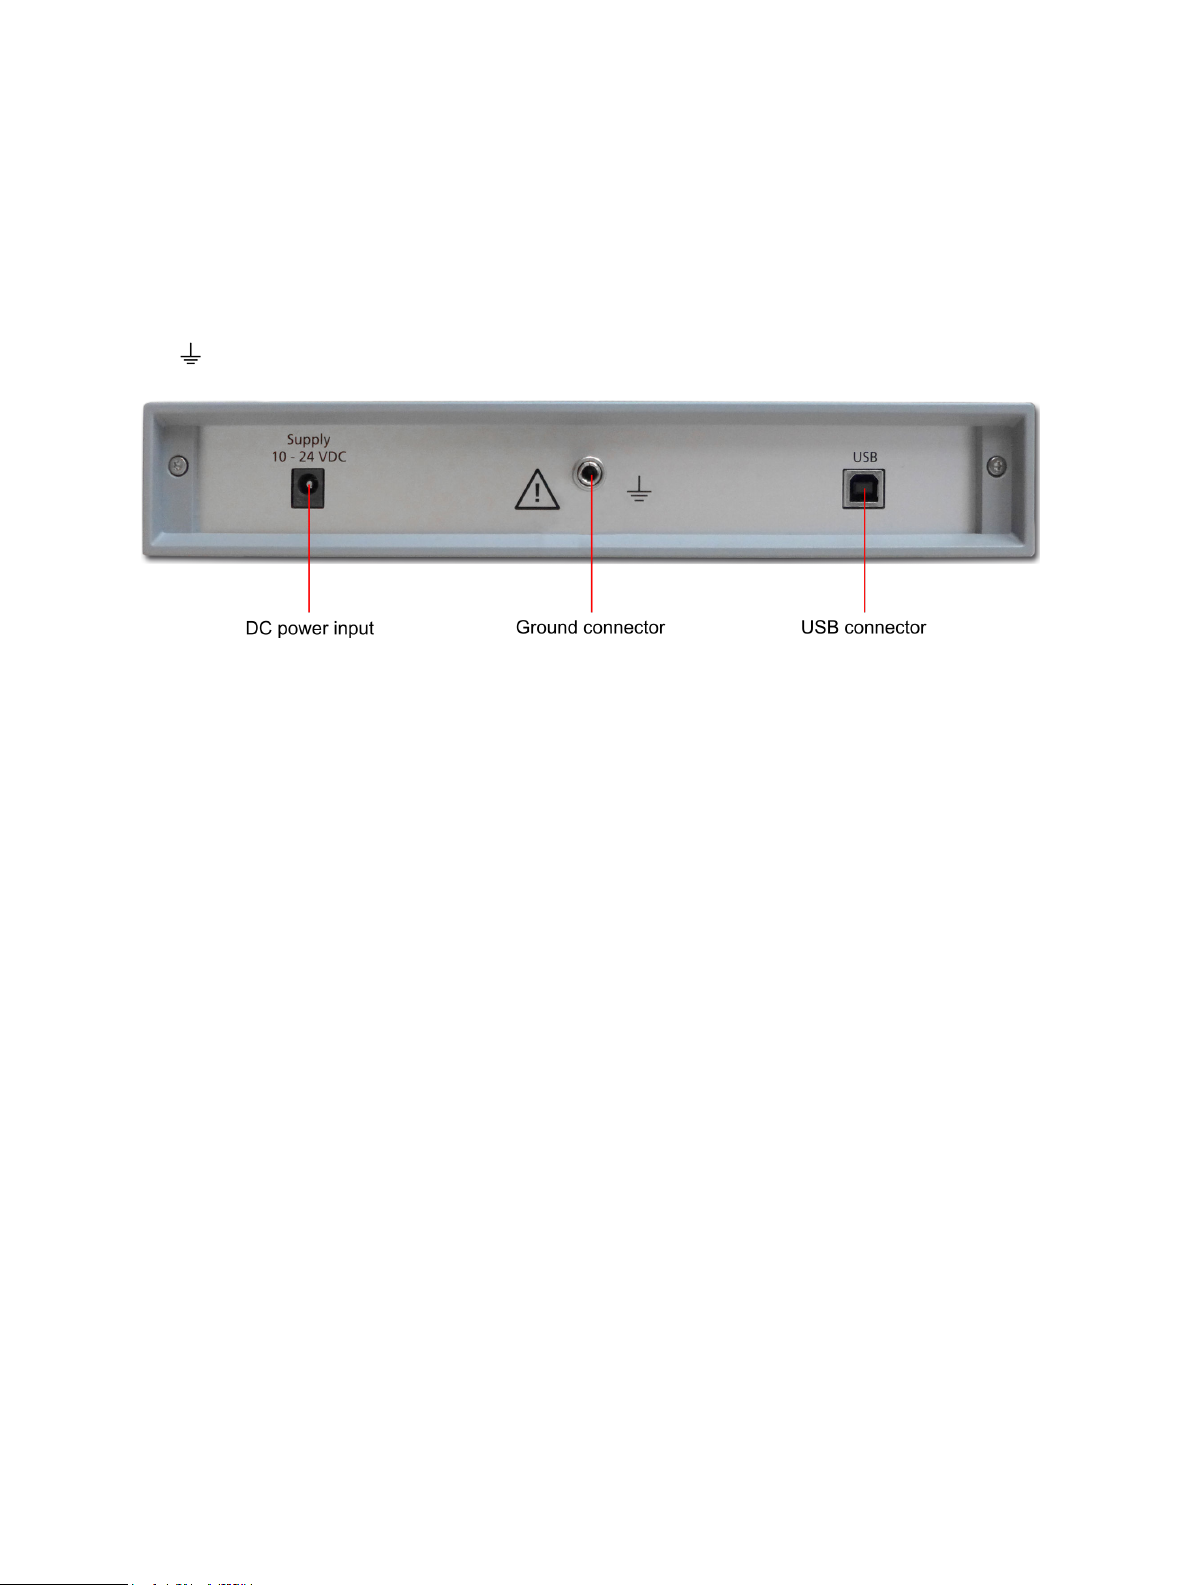
Bode 100 provides the following three connectors at the rear panel:
• DC power input:
input for DC voltages from 10 V to 24 V (5.0 mm power supply plug with 2.5 mm pin)
• USB: data interface (USB type B port)
• : Equipotential ground connector for external ground connection (4 mm banana-socket)
Figure 5-2: Bode 100 rear view
OMICRON Lab
15
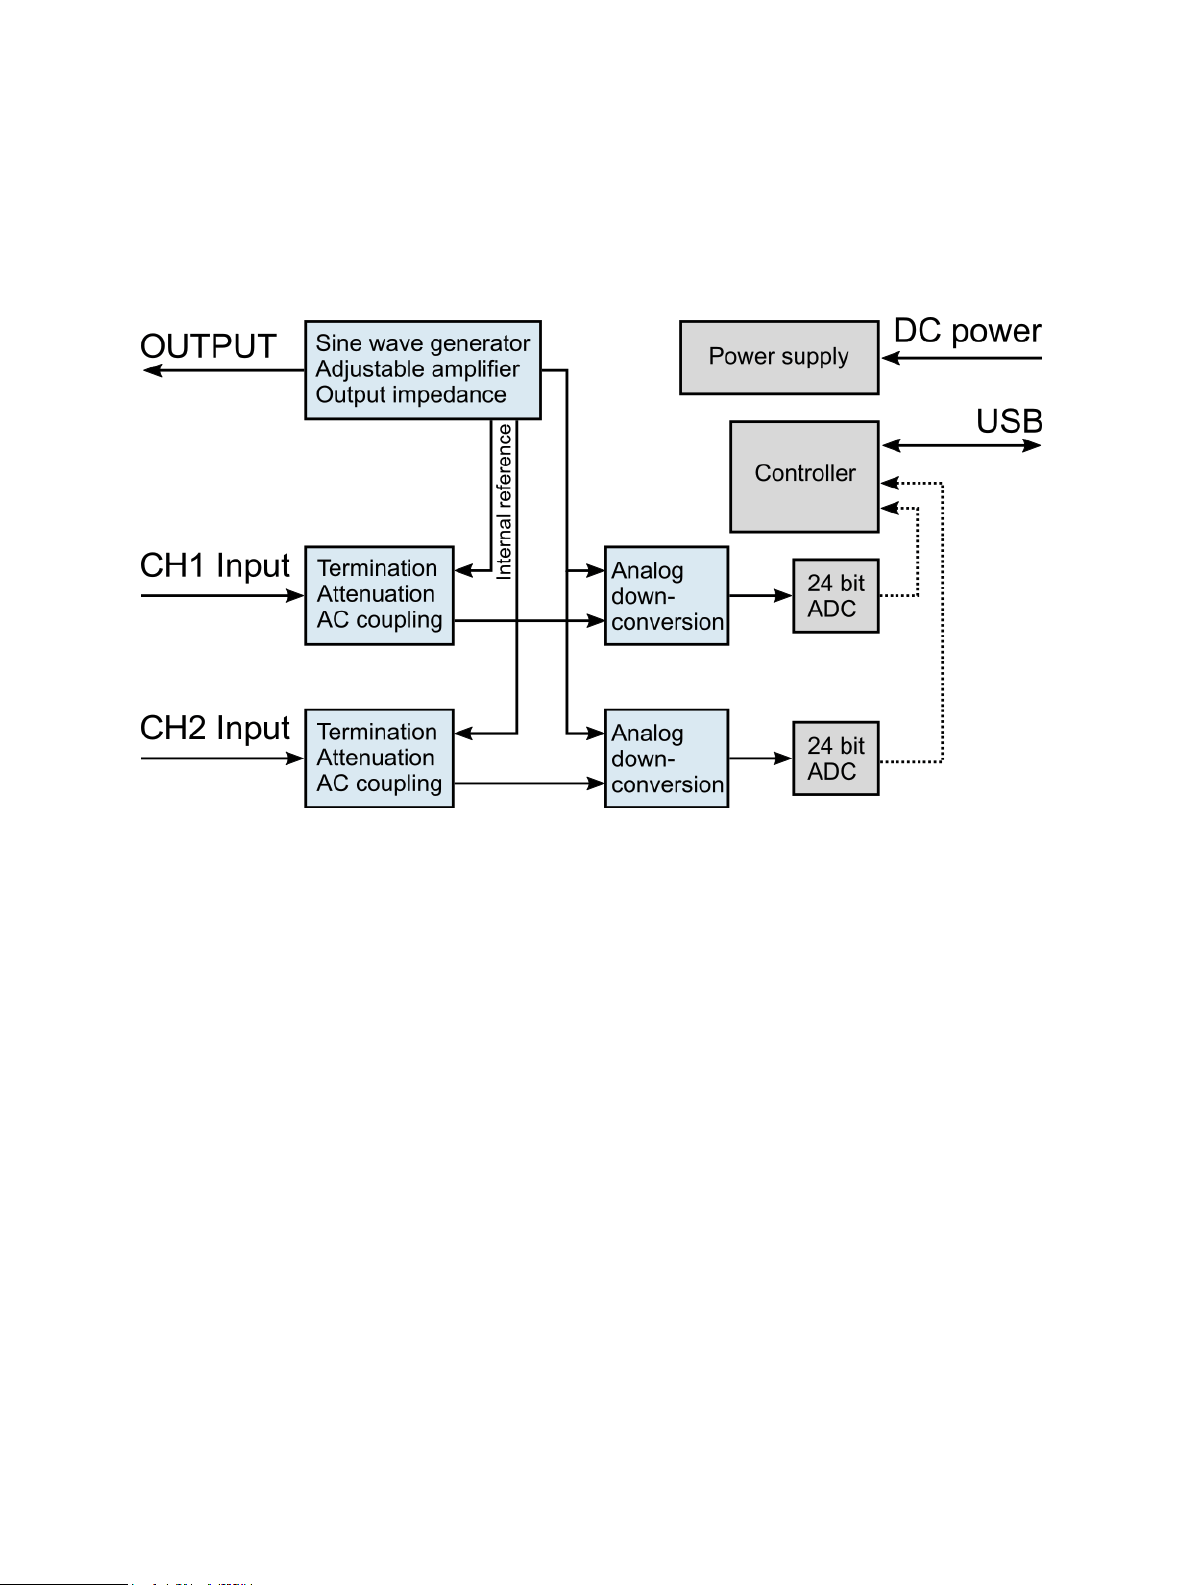
5.2 Block diagram
Bode 100 is a flexible device that features the following mayor building blocks:
Figure 5-3: Bode 100 block diagram
• Signal source:
The signal source of Bode 100 consists of an adjustable DDS sine-wave generator and adjustable
amplifiers. The output impedance of Bode 100 is 50 Ω.
Internal reference connections allow to directly connect the source signal to the receivers.
• Channel inputs:
Each of the Bode 100 input features adjustable attenuators for best signal / noise ratio and
software-switchable termination. Channel termination can be either 50 Ω or 1 MΩ. Without 50 Ω
terminations the inputs are AC coupled.
• Down conversion & sampling:
The input signal is down-converted to an intermediate frequency and sampled by a 24bit ADC.
The sampled data is sent to the PC and evaluated by the Bode Analyzer Suite.
More details on the hardware configuration can be found in 6.5 Hardware setup on page 32.
16
OMICRON Lab
Device overview
5.3 Functional description
The flexible hardware concept of Bode 100 allows to use it for several applications such as:
• Transmission / Reflection measurements
• Gain / Phase (transfer function) measurements
• Impedance measurements
The device operates in a wide frequency range from 1 Hz to 50 MHz. Bode 100 creates a sine-wave
at a frequency and measures two voltages. The creation of the sine wave and both voltage
measurements are synchronized such that magnitude and phase relation of the two measured
voltages can be derived.
From the magnitude and phase ratio of the two voltages, the Bode Analyzer Suite calculates
Impedance, Reflection, Admittance, Transmission or complex Gain values of the DUT (Device Under
Test).
For a complete list of all possible measurements that you can perform with Bode 100
see 7 Measurement types and applications on page 34.
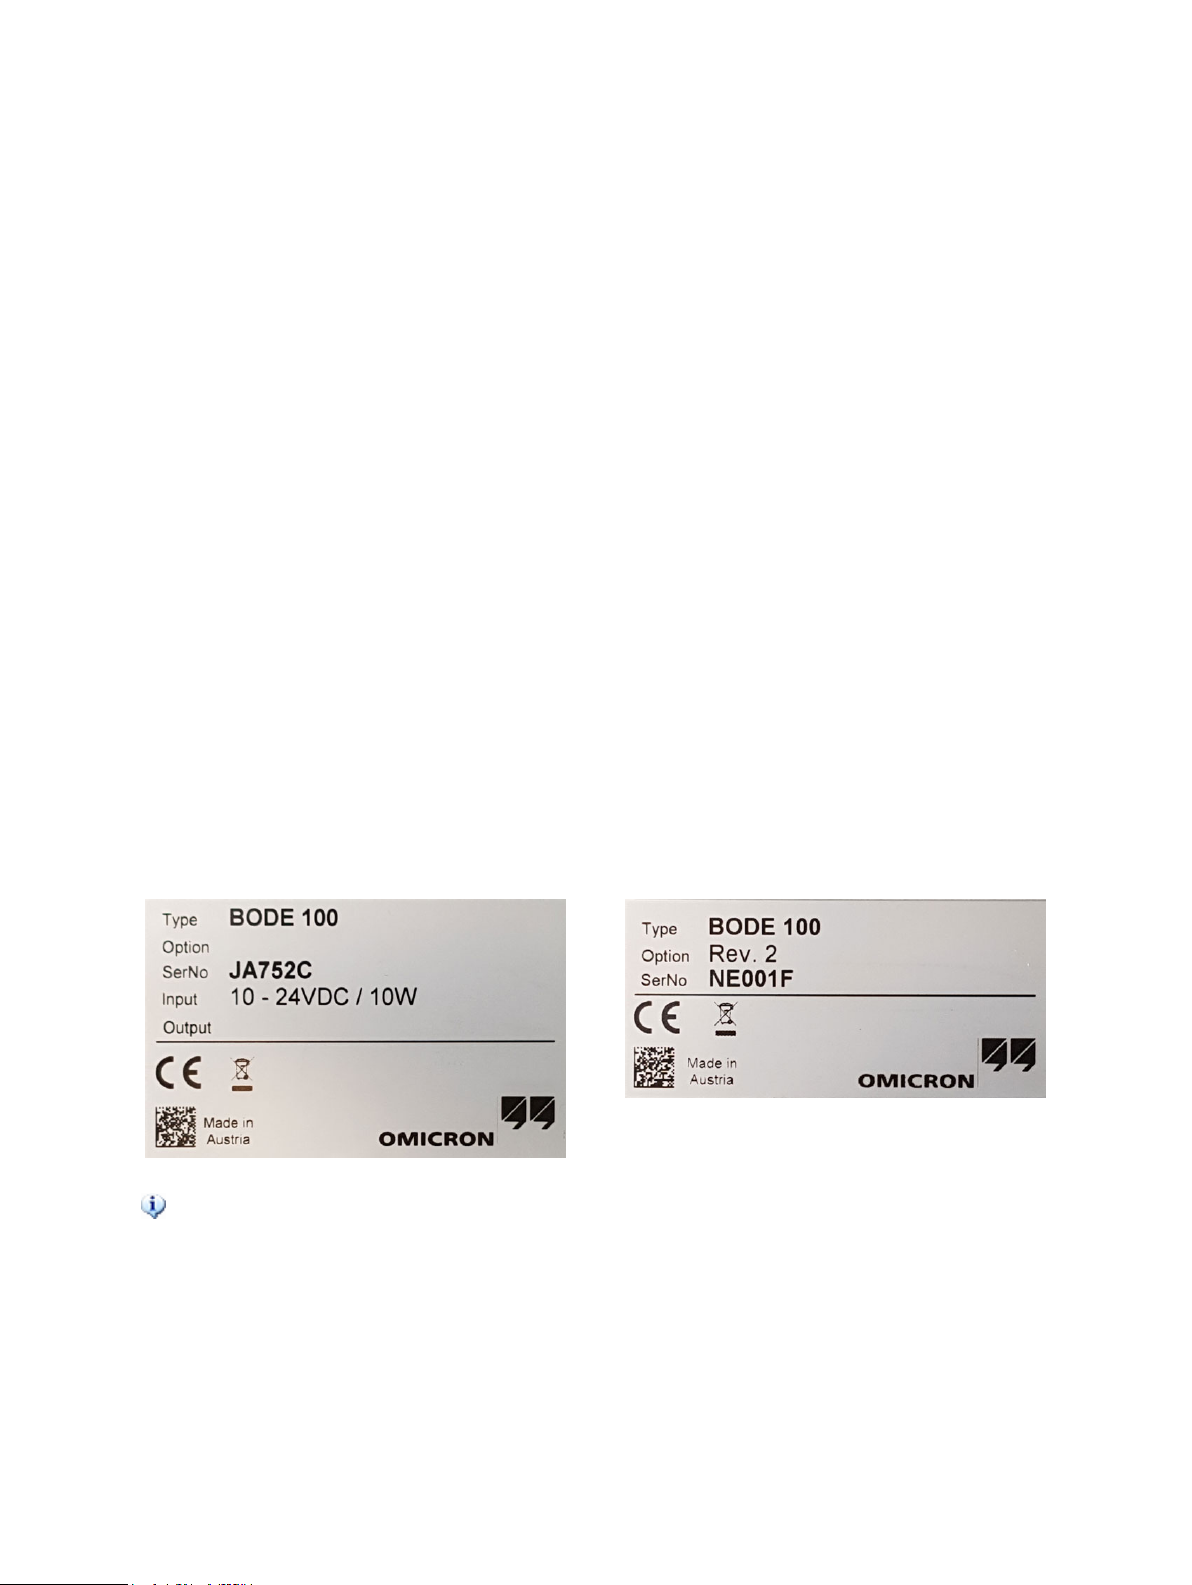
5.4 Hardware revisions
Currently there are two mayor hardware revisions of Bode 100 available. Revision 1 and Revision 2.
To find out if you are using a Bode 100 R1 or a Bode 100 R2, check the identification plate on the
bottom of the device.
Below typical identification plates for a Bode 100 R1 and a Bode 100 R2 are shown.
Bode 100 R1 Bode 100 R2
Your identification plate might look slightly different. The important information is visible in the
Option field. If Option is Rev. 2, you are using a Bode 100 R2. If Option is empty, you are
using a Bode 100 R1.
OMICRON Lab
17

6 Bode Analyzer Suite introduction
In this section you will learn the basics of the Bode Analyzer Suite. The window structure and the main
functionality is explained.
Step-by-step examples
Hint: Get a quick introduction to the Bode Analyzer Suite and how to use Bode 100 by following the
step-by-step examples. The following examples are available in this manual:
• Perform a Transmission / Reflection measurement on the IF filter DUT,
see Transmission / Reflection measurement example on page 42.
• Perform a one-port impedance measurement on the Quartz filter DUT,
see One-Port measurement example on page 51
• Measure impedance of an inductor using the impedance adapter,
see Impedance Adapter example on page 59
6.1 Start screen
When starting the Bode Analyzer Suite, the Start screen is shown.
Figure 6-1: Bode Analyzer Suite Start screen.
18
OMICRON Lab

Bode Analyzer Suite introduction
The Start screen allows the following user interactions:
• Choose the device to use (1.). This field is only visible if you have a Bode 100 device connected to
your PC.
• Open a recent file or other file (2.). On your first start-up the demo-files are listed here. Check out
the examples that explain the content of the demo-files.
• Select one of the available measurement modes (3.) and start a measurement.
Hint: If you prefer to automatically start a measurement instead of entering the Start screen,
choose your default startup measurement mode by clicking on Set default startup and
choosing your preferred startup mode. You can also choose a .bode3 file to be your default
startup configuration.
6.2 Main window
After starting a measurement the Main window of the Bode Analyzer Suite is opened.
Figure 6-2: Bode Analyzer Suite Main window.
OMICRON Lab
19

The Main window is structured into six main regions:
1. Measurement configuration
The measurement configuration allows to configure the measurement frequencies and some
hardware setup elements such as the source level, the attenuators and the receiver bandwidth.
2. Chart region
In the chart region the measurement results are displayed. You can use the Trace settings on the
right hand side to choose the result that shall be displayed. Different formats such as Magnitude or
Phase as well as different diagrams such as Polar, Nyquist or Smith can be selected. To learn
more about the result diagrams, have a look at 9.3 Using the interactive chart on page 101.
3. Trace settings
Choose what measurement and which result format is displayed in a trace. Additional memory
traces or math traces are also controlled in this region. Lear more about how to configure traces
and memories in 9.5 Using the memory traces on page 111 and 9.6 Using the trace
configuration on page 114.
4. Ribbon bar
The ribbon bar contains the file operation commands as well as the buttons to start and stop a
measurement. Further possibilities are the hardware setup, calibration, view settings, memory
operations and cursor commands.
5. Cursor grid
The cursor grid displays the values of the movable cursors that are attached to the traces shown in
the result diagrams. To learn more about how to use the cursors, check out 9.4 Working with
cursors and the cursor grid on page 109.
6. Status bar
The status bar shows the connection state of the hardware and the receiver levels. Further
possibilities are signal source control and internal device calibration control.
20
OMICRON Lab

6.2.1 Measurement configuration
Frequency
In Frequency sweep mode you can change either Start
frequency and Stop frequency or Center and Span.
Get from zoom updates Start frequency and Stop
frequency with the current zoom window range.
Furthermore, the sweep mode can be Linear or
Logarithmic and the number of points in the sweep can
be chosen.
In Fixed Frequency mode only the Source frequency
can be adjusted. In this case the Bode 100 will display a
vector chart instead of a frequency dependent chart.
Source level
Choose between a constant or variable output level
(shaped level) and set the source level. The variable
output level feature is only available in Frequency
sweep mode. It allows to define different source levels
for different frequency points. To learn more about the
source control, refer to 9.2 Signal source settings on
page 98.
Attenuators
Set the input attenuators for Receiver 1 (Channel 1) and
Receiver 2 (Channel 2). If the measurement mode
supports two measurements (Transmission and
Reflection) you can set the attenuators for each
measurement. Possible attenuator values are 0 dB,
10 dB, 30 dB and 40 dB. Increase the attenuators when
you experience an overload, reduce the attenuators to
improve signal to noise ratio.
Receiver bandwidth
Set the maximum Receiver bandwidth used for the
measurement. Receiver bandwidth will be reduced
internally if the measurement frequency is smaller than
the Receiver bandwidth setting.
Select a high Receiver bandwidth to increase
measurement speed.
Reduce Receiver bandwidth to reduce noise and to
catch narrow-band resonances.
Bode Analyzer Suite introduction
OMICRON Lab
21

Nominal impedance
The nominal impedance or characteristic impedance
value is used to calculate the Reflection factor. See also
7.2 Impedance measurement introduction on page 37.
Note that this field is only visible if a reflection
measurement is performed.
Measurement mode
Shows what measurement mode is currently used. All
available measurement modes are explained in
7 Measurement types and applications on page 34.
22
OMICRON Lab

Bode Analyzer Suite introduction
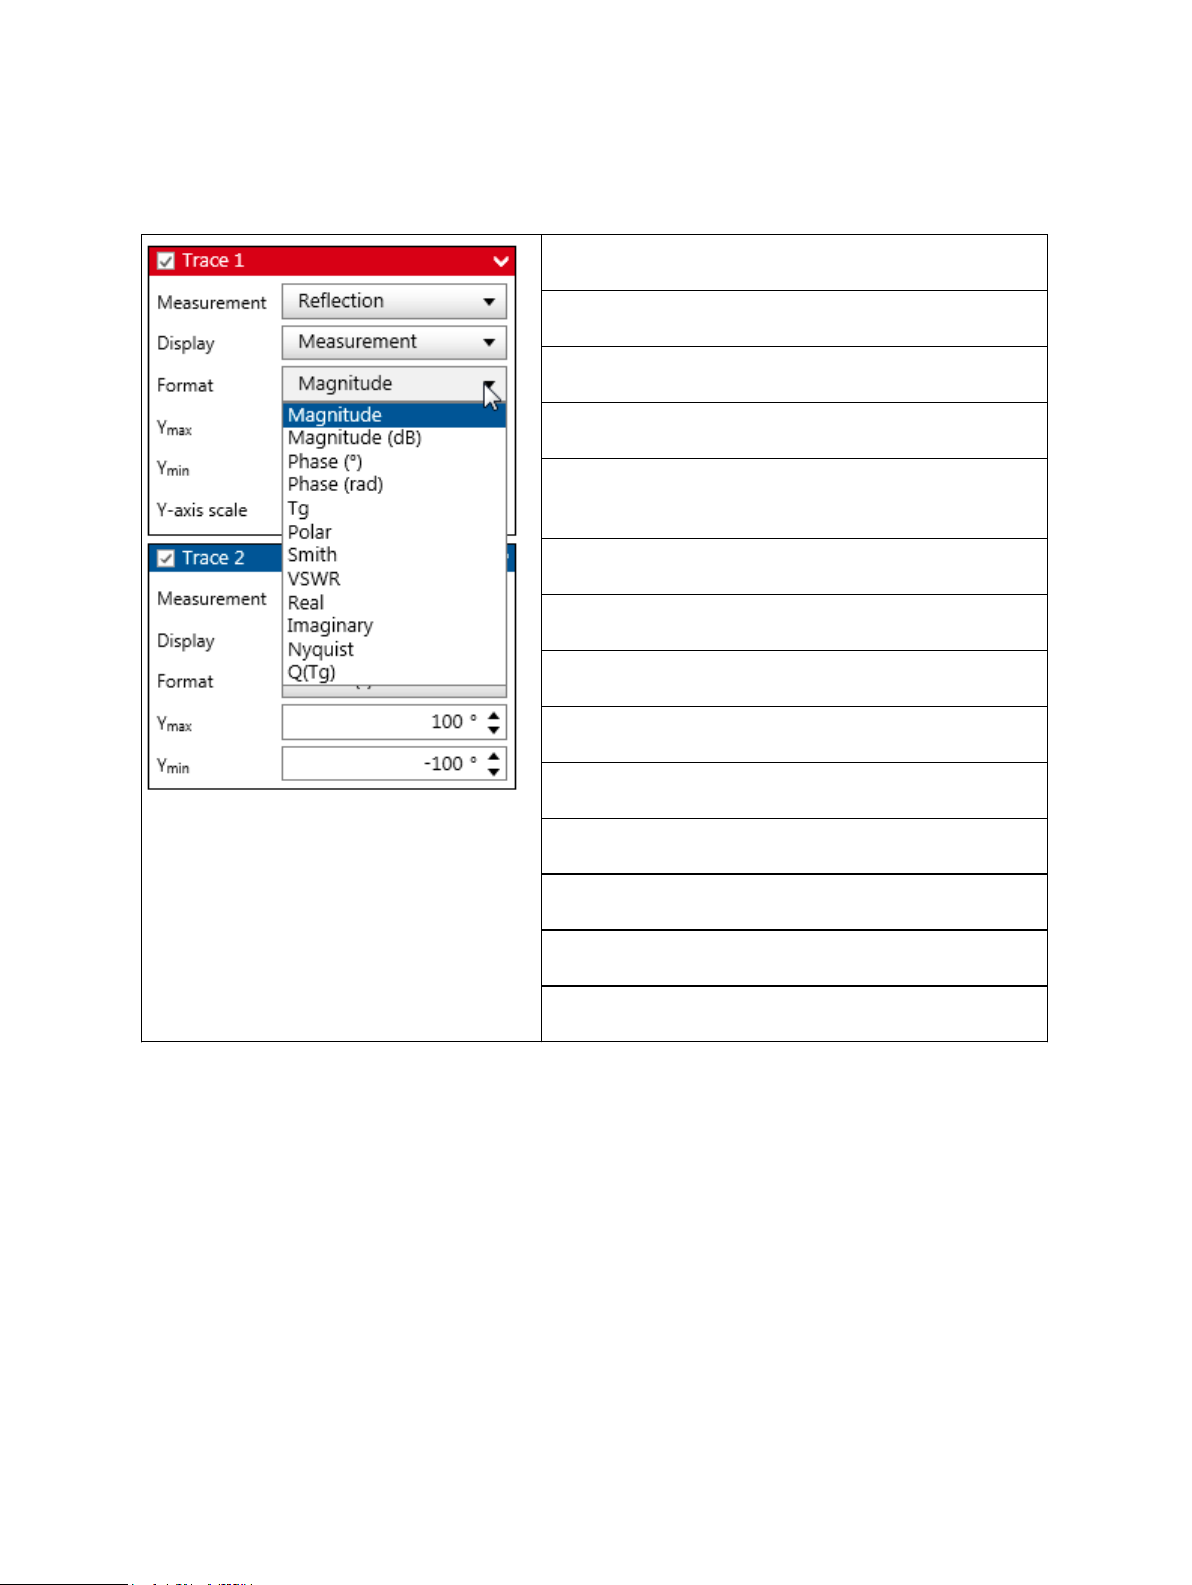
6.2.2 Trace configuration
In a Frequency Sweep measurement, the right hand side of the Bode Analyzer Suite shows the Trace
configuration. The Trace configuration allows to choose what measurement (Gain, Impedance,
Reflection, Admittance) is performed and how it is displayed in the chart.
Trace configuration box: The Trace configuration box displays the trace-name
and contains the following trace-display settings:
Measurement: Impedance, defines that Trace 1
measures impedance.
Display: Measurement, indicates that the chart shows
the measured trace.
Note that memory curves are displayed as well.
Format: Magnitude, defines that Trace 1 displays the
Magnitude of Impedance.
Ymax: 100 Ω, The upper limit of the y-axis displayed in
the diagram.
Ymin: 1 mΩ, The lower limit of the y-axis displayed in
the diagram.
Y-axis scale : Log(Y), Currently the y-axis is set to a
logarithmic scaling.
Learn more about the trace configuration box in
9.6 Using the trace configuration on page 114.
Memory configuration box: The memory configuration box allows to control the
memory curves:
Click to copy the current measurement data to
Memory 1.
Click to delete the Memory 1 trace.
Click to link the cursors to Memory 1.
Furthermore it can be selected with which trace (in
which diagram) the memory is shown.
Learn more about the memory curves in 9.5 Using the
memory traces on page 111.
Hint: By clicking the inner border of the Measurement configuration or Trace configuration
you can collapse these configuration areas to create a bigger chart area. You can fold out
the configurations anytime by clicking the respective areas at the side of the chart area. For
more details refer to the figure below.
OMICRON Lab
23

Figure 6-3: Collapsing the measurement and trace configuration areas
24
OMICRON Lab

6.2.3 Ribbon controls
The Bode Analyzer Suite ribbons feature the following commands:
Home ribbon
• New: Create a new measurement
• Open: Open a different measurement file
• Save: Save the current file
• Save as: Choose a different file name to save file
• Export: Export measurement data
• Report: Create a PDF print-report
A detailed explanation on the single file operations can be found in
9.1 Exporting and saving measurement data or settings on
page 92.
• Continuous: Starts a continuous measurement
• Single: Performs one single measurement
Bode Analyzer Suite introduction
Memory ribbon
• Stop: Stops a running measurement
• Transmission/Gain: Open the hardware setup used for the gain
measurement
• Impedance/Reflection: Open the hardware setup used for the
impedance measurement
For more information regarding the hardware setup, please check
out Hardware setup .
• Full-Range: Perform a Full-Range calibration
• User-Range: Perform a User-Range calibration
For more information regarding the calibration, please check out
8 Calibration on page 69
Copy the current measurement data to a new or existing memory
trace.
OMICRON Lab
Show all available memory traces in the diagram.
25
Hide all available memory traces. They will not be shown in the
diagram.
Delete all memory traces.
You can find more information about the use of the memory traces in 9.5 Using the memory traces on
page 111.
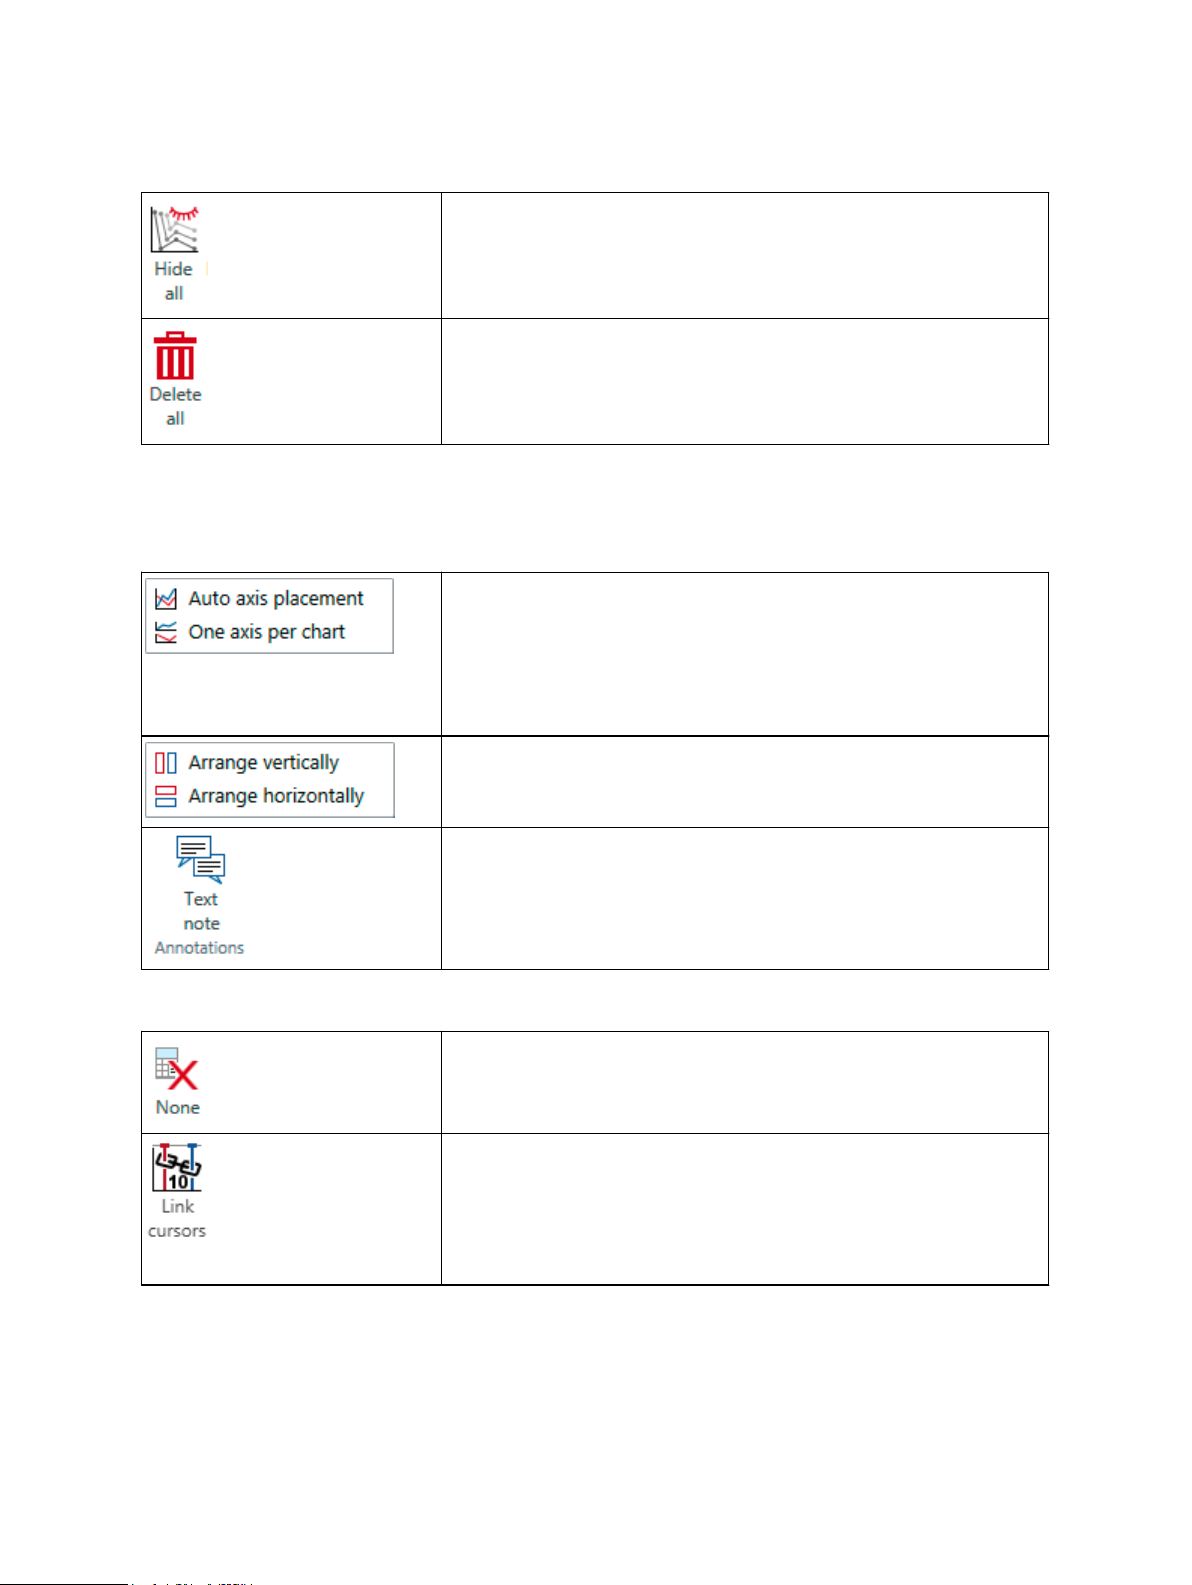
View ribbon
• Auto axis placement attempts to merge two traces with two
axes into one diagram.
• One axis per chart places only one trace into one diagram. So
for every trace there is an own diagram. You can find more
information about this setting in 9.3.1 Configure the
diagrams on page 101.
• Arrange multiple diagrams side by side.
• Arrange multiple diagrams from top to bottom other.
Cursor ribbon
Open a text field to add text notes to the current measurement.
Activate a cursor calculation. For more details please check out
cursor calculations.
Activate cursor linking. Cursor linking maintains a constant distance
between two cursors. By moving one cursor, the second one will
follow automatically. Use this feature to e.g. measure the slope at
crossover frequency in a bode plot. You can select either decade
(x10) or octave (x2) or constant linear distance which will maintain
the current frequency delta value.
26
OMICRON Lab
Bode Analyzer Suite introduction
6.2.4 Status bar
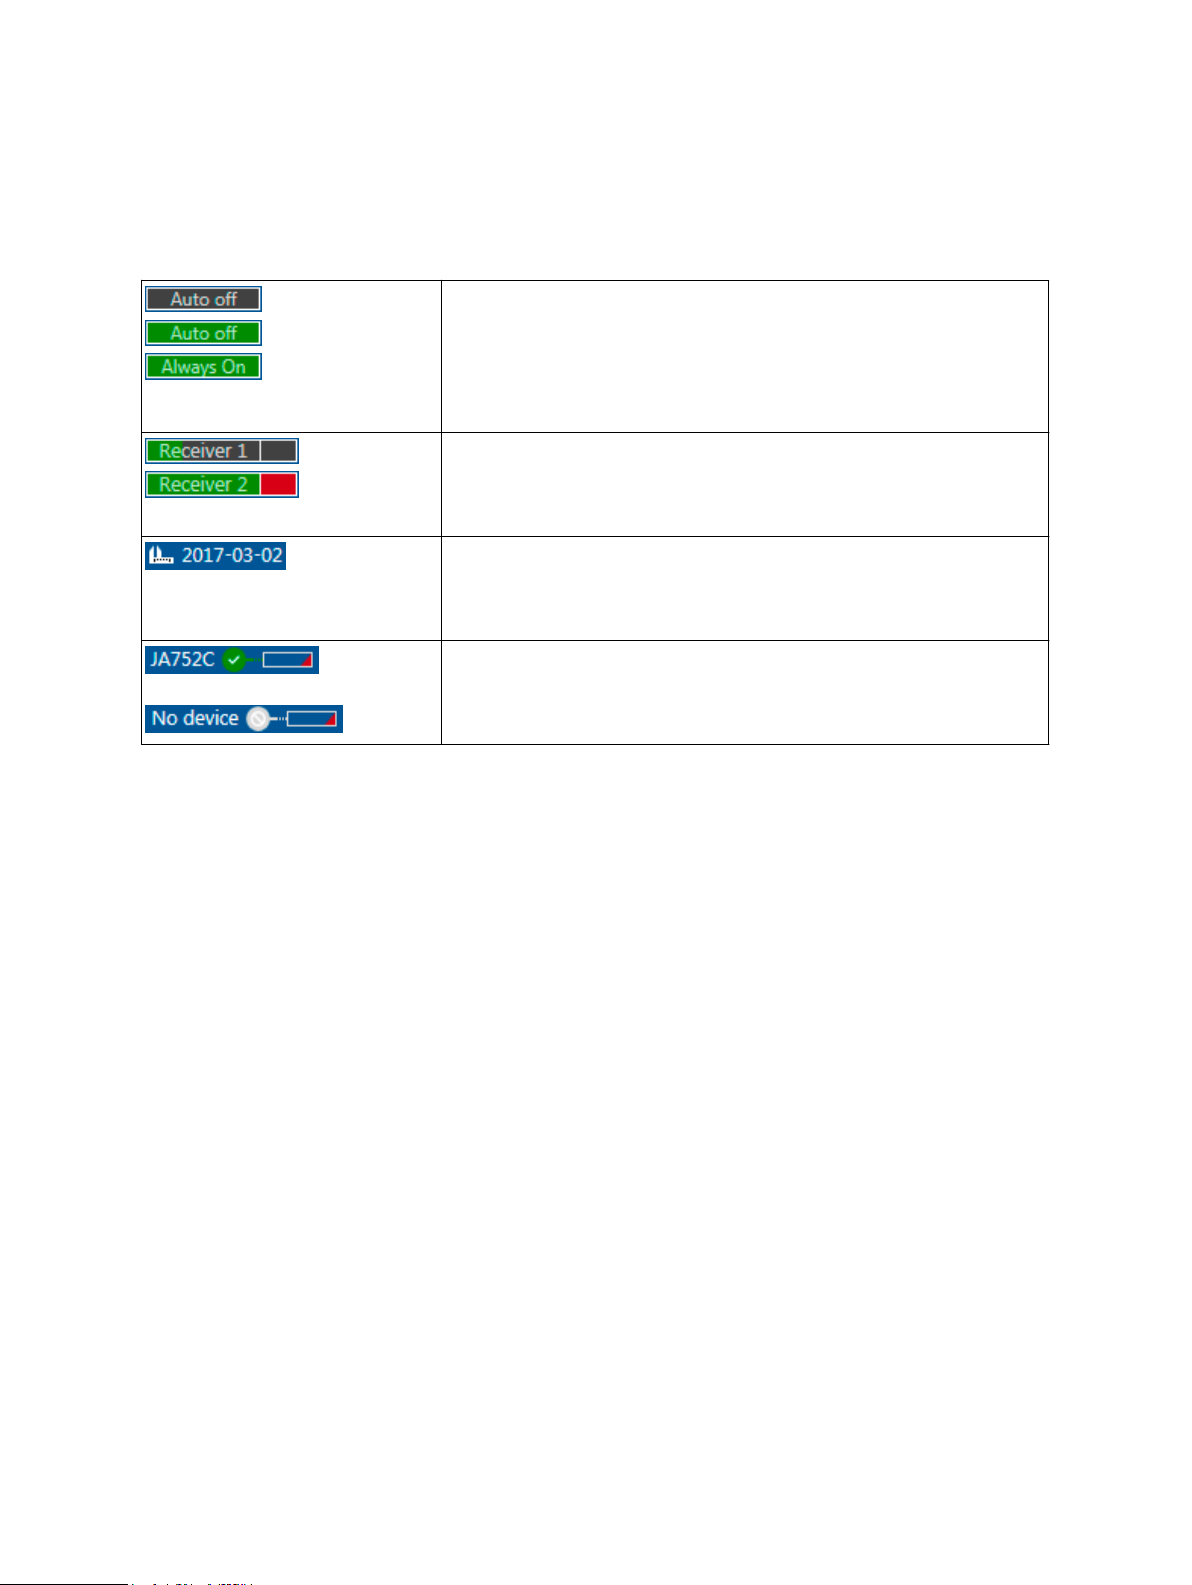
The Status bar has several displays and interactive control elements. These are:
Source indicator
The source indicator shows if the signal source of Bode 100 is
switched on. By moving the mouse over the indicator, a pop-up
allows to change between Auto off and Always on setting. More
details regarding the source setting can be found in 9.2 Signal
source settings on page 98.
Overload indicators
The overload indicators show the signal level at the receivers of
Bode 100. Red color indicates an overload of the receiver. An
overload warning will be shown in the chart in such a case.
Internal device calibration indicator
Shows the date of the last performed internal device calibration.
Move the mouse over the indicator in order to perform a new
internal device calibration.
Device connection indicator
Displays the serial number of the connected device. If no device is
connected, "No device" is shown. Move the mouse over the
indicator in order to search or re-connect to a Bode 100 device.
OMICRON Lab
27

6.3 Chart context menu
By right clicking into the chart you get access to a context menu that allows quick access to several
functions:
Reset Zoom: Resets the x-axis to the start and
stop frequency and the y-axes to the predefined
Ymin and Ymax values. See 9.3.2 Zooming the
measurement curve on page 103 for details.
Optimize: Optimizes the Ymin and Ymax values
once to ensure that the current measurement
curve fills the chart area in an optimum way.
Auto Optimize: Optimizes the Ymin and Ymax
values continuously to ensure that the
measurement curve always fills the chart area in
an optimum way.
Reset Axes: Resets the Y-axes to their predefined startup values.
See 9.3.3 Optimize the axis scaling on page 106
for detail on these functions.
Copy image to clipboard: Copies a image of the
current chart to the clipboard.
Copy data to clipboard: Copies all
measurement points of Trace 1 or Trace 2 to the
clipboard for further processing in a spread sheet
software.
Copy settings to clipboard: Copies all
measurement settings to the clipboard in text
format.
See 9.1.2 Use the copy to clipboard functions to
export data on page 92 for details on these
functions.
Cursor 1 & Cursor 2: Allows to access several
cursor functions to position the cursors to the
maximum, minimum or zero crossing of the
measurement traces.
See 9.4 Working with cursors and the cursor
grid on page 109 for details on these functions.
28
OMICRON Lab
Bode Analyzer Suite introduction
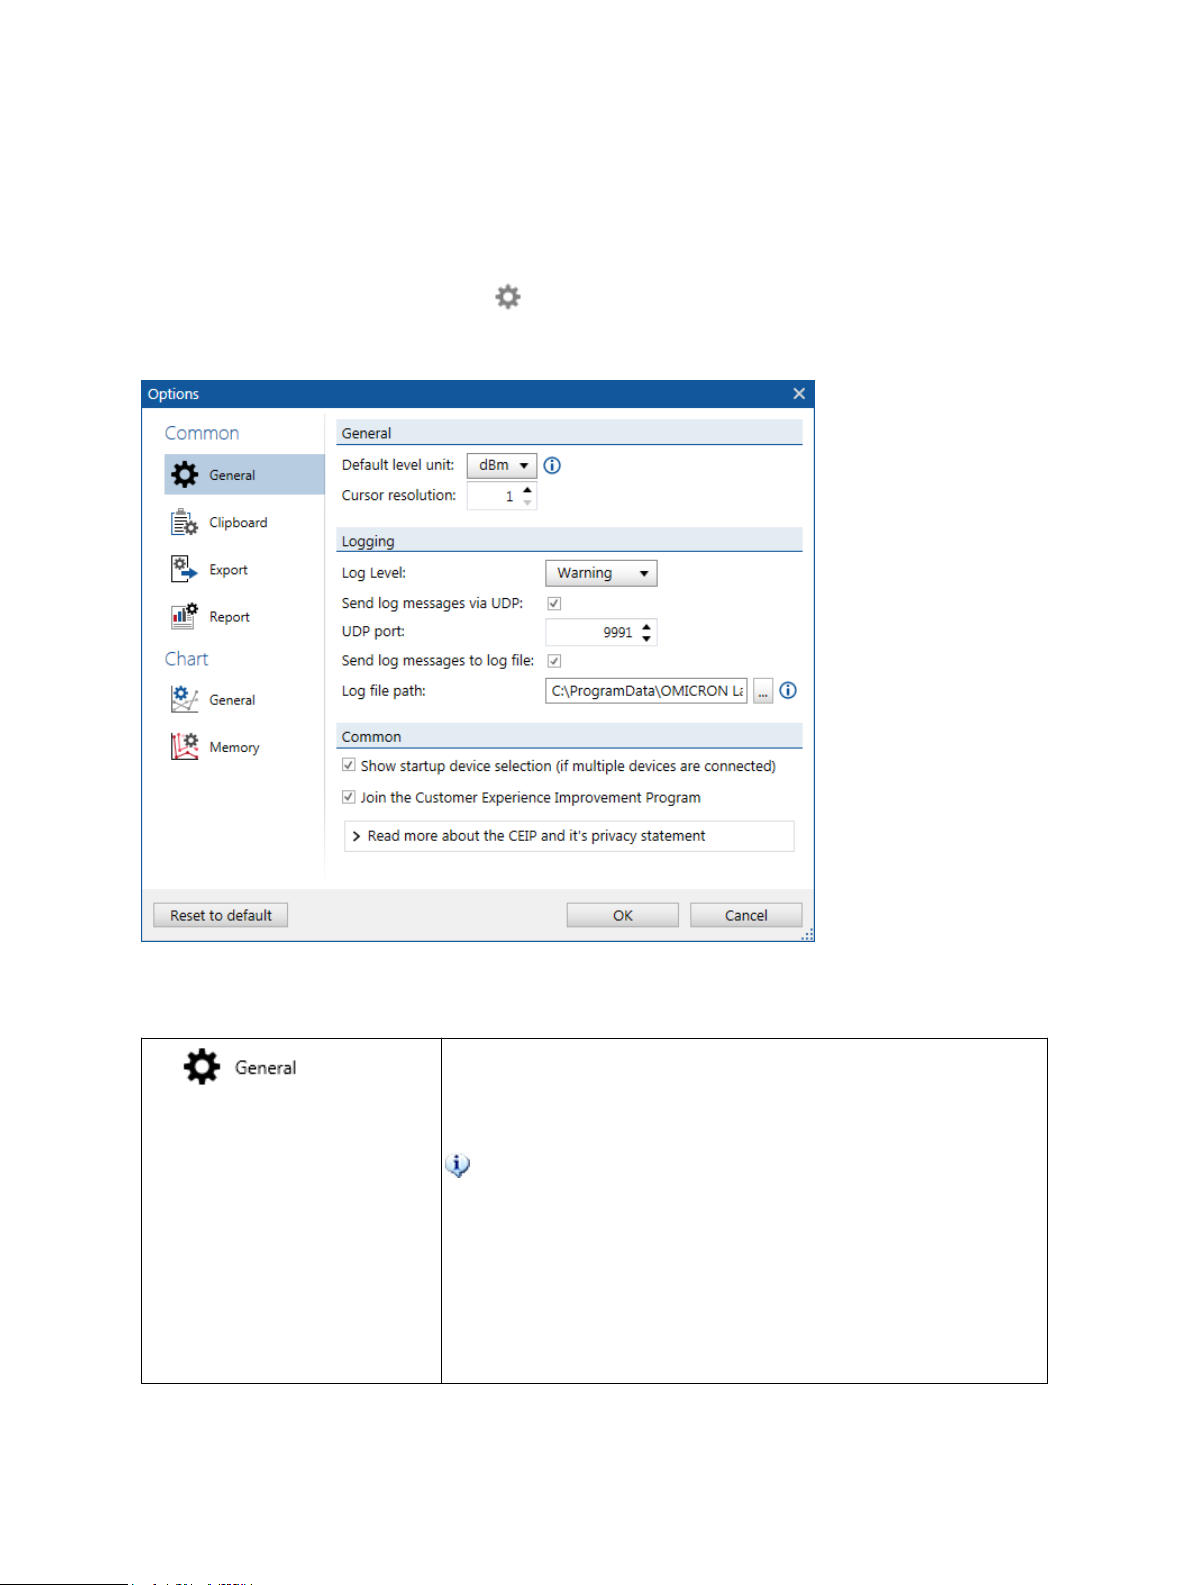
6.4 Options menu
The Options menu allows you to modify several functions of the Bode Analyzer Suite. You can access
the Options menu by either clicking the icon in the top right corner of the Bode Analyzer Suite's
main window or by clicking File → Options.
Figure 6-4: Bode 100 Options menu
In the Common section of the Options Menu you can change the following settings:
General:
Default level unit: allows you to change the unit for Bode 100's
source level setting. You can choose dBm, Vpp or Vrms.
dBm defines the power dissipated into 50 Ω load.
Vpp and Vrms are the voltage output levels present when
a 50 Ω load is connected at the output. Due to the
source's output impedance the output voltage will change
depending on the impedance of the connected load. See
more in 9.2 Signal source settings on page 98.
Cursor resolution: Defines the number of digits behind the
decimal separator for all values shown in the cursor grid.
OMICRON Lab
29
Logging:
Log Level:This function allows you to define the severity level of
the events stored in the log-file. Default is Warning.
Do not use the log-levels Verbose or Debug, except if told
by the OMICRON Lab support team.
UDP Logging: allows you to enable event logging via UDP and to
define the used UDP port.
Logging to a file: allows you to enable the logging of events to a
log file and to define the location of the log file on your computer's
hard drive.
Common:
Allows you to enable the device selection in the start up screen and
to change your preference in relation to the Customer Experience
Improvement Program.
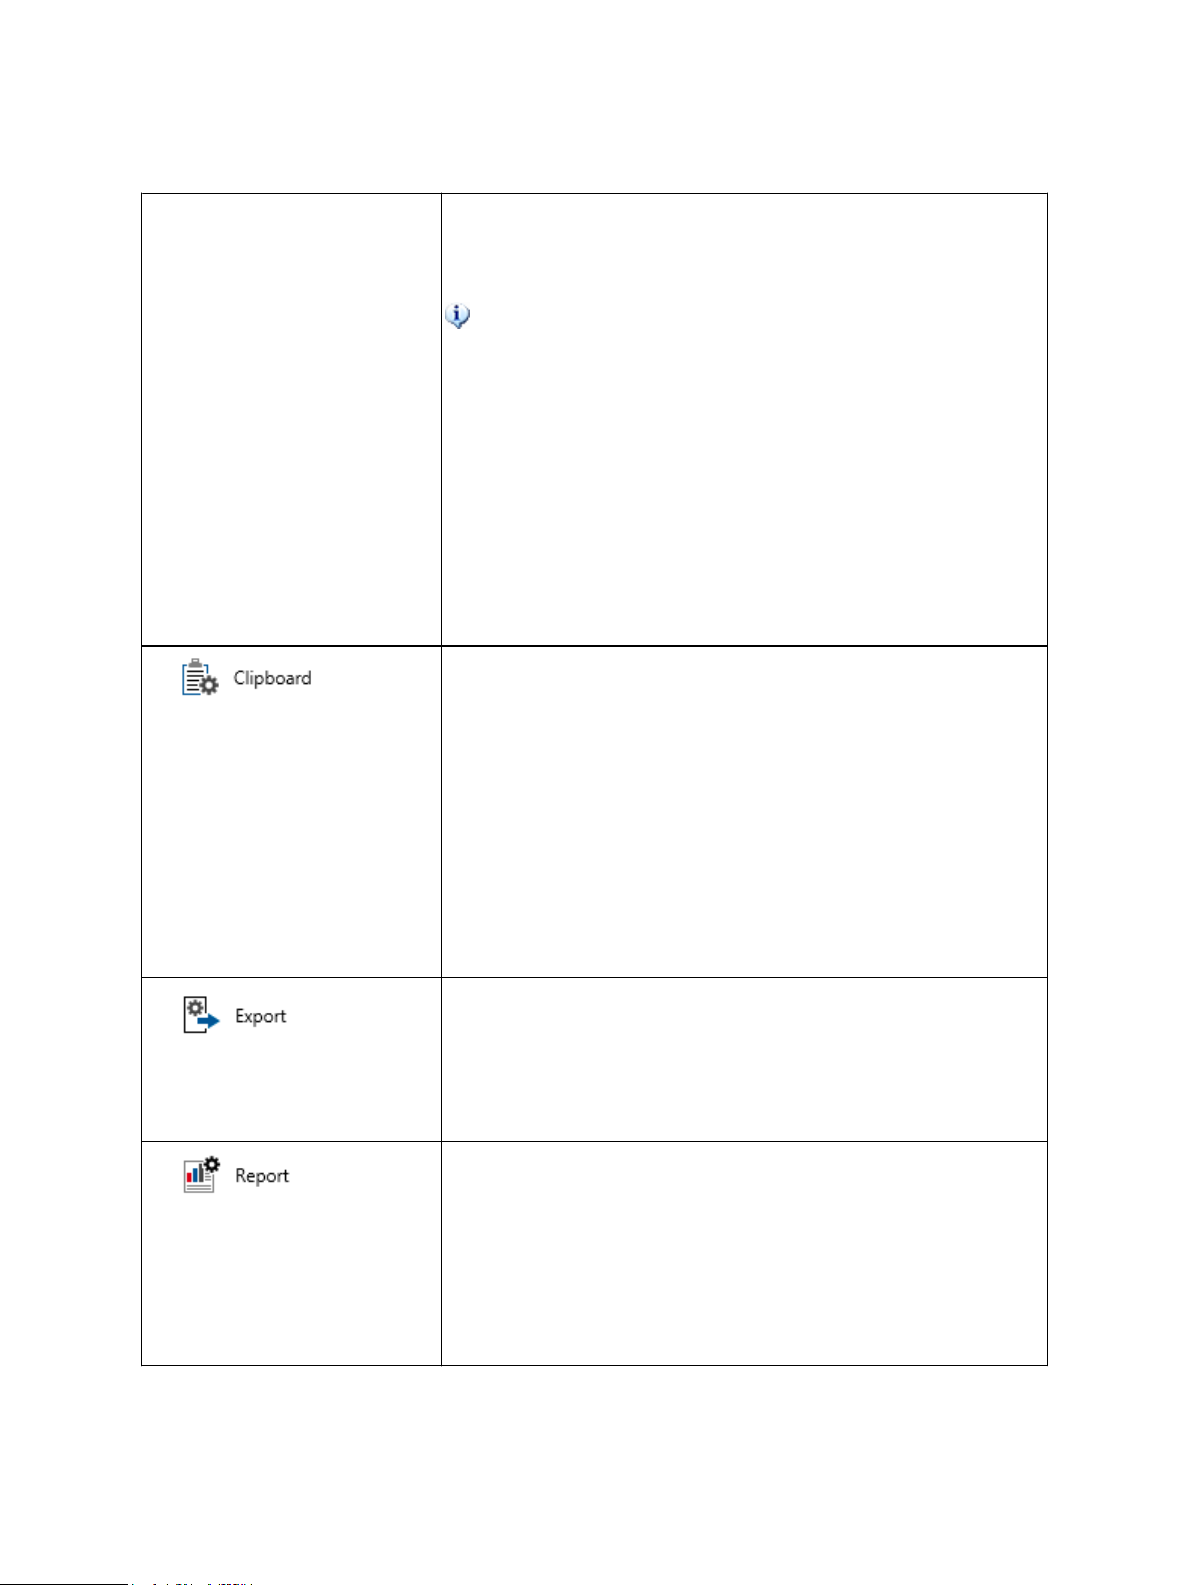
Chart:
In this section you can optimize the size of the text fonts and the
thickness of the measurement traces in the exported chart .
Further on, you can enable the inclusion of the chart legend and
the cursor grid. In addition the position of the cursor grid in the
exported chart and the image file format can be defined.
Data:
In this section you can choose the decimal separator and the field
separator for the clipboard export.
Find more information in 9.1.2 Use the copy to clipboard functions
to export data on page 92.
In this section you can define several parameters for the CSV-
Export, Excel-Export and Touchstone-Export of the measured
data. These parameters are the default values that will be used for
all future exports you perform.
Find out more in 9.1.3 Exporting measurement data to CSV or
Excel files on page 94.
Here you can choose if comments, the cursor table, the chart
legend or shaped level are included in the report or not.
Additionally, you can choose if you want to use a custom report or
the standard report. Finally you can select if the report should be
opened after its generation and the program that should be used to
display the report.
Detailed information is available in 9.1.5 Generate a PDF report on
page 97.
30
OMICRON Lab
Bode Analyzer Suite introduction
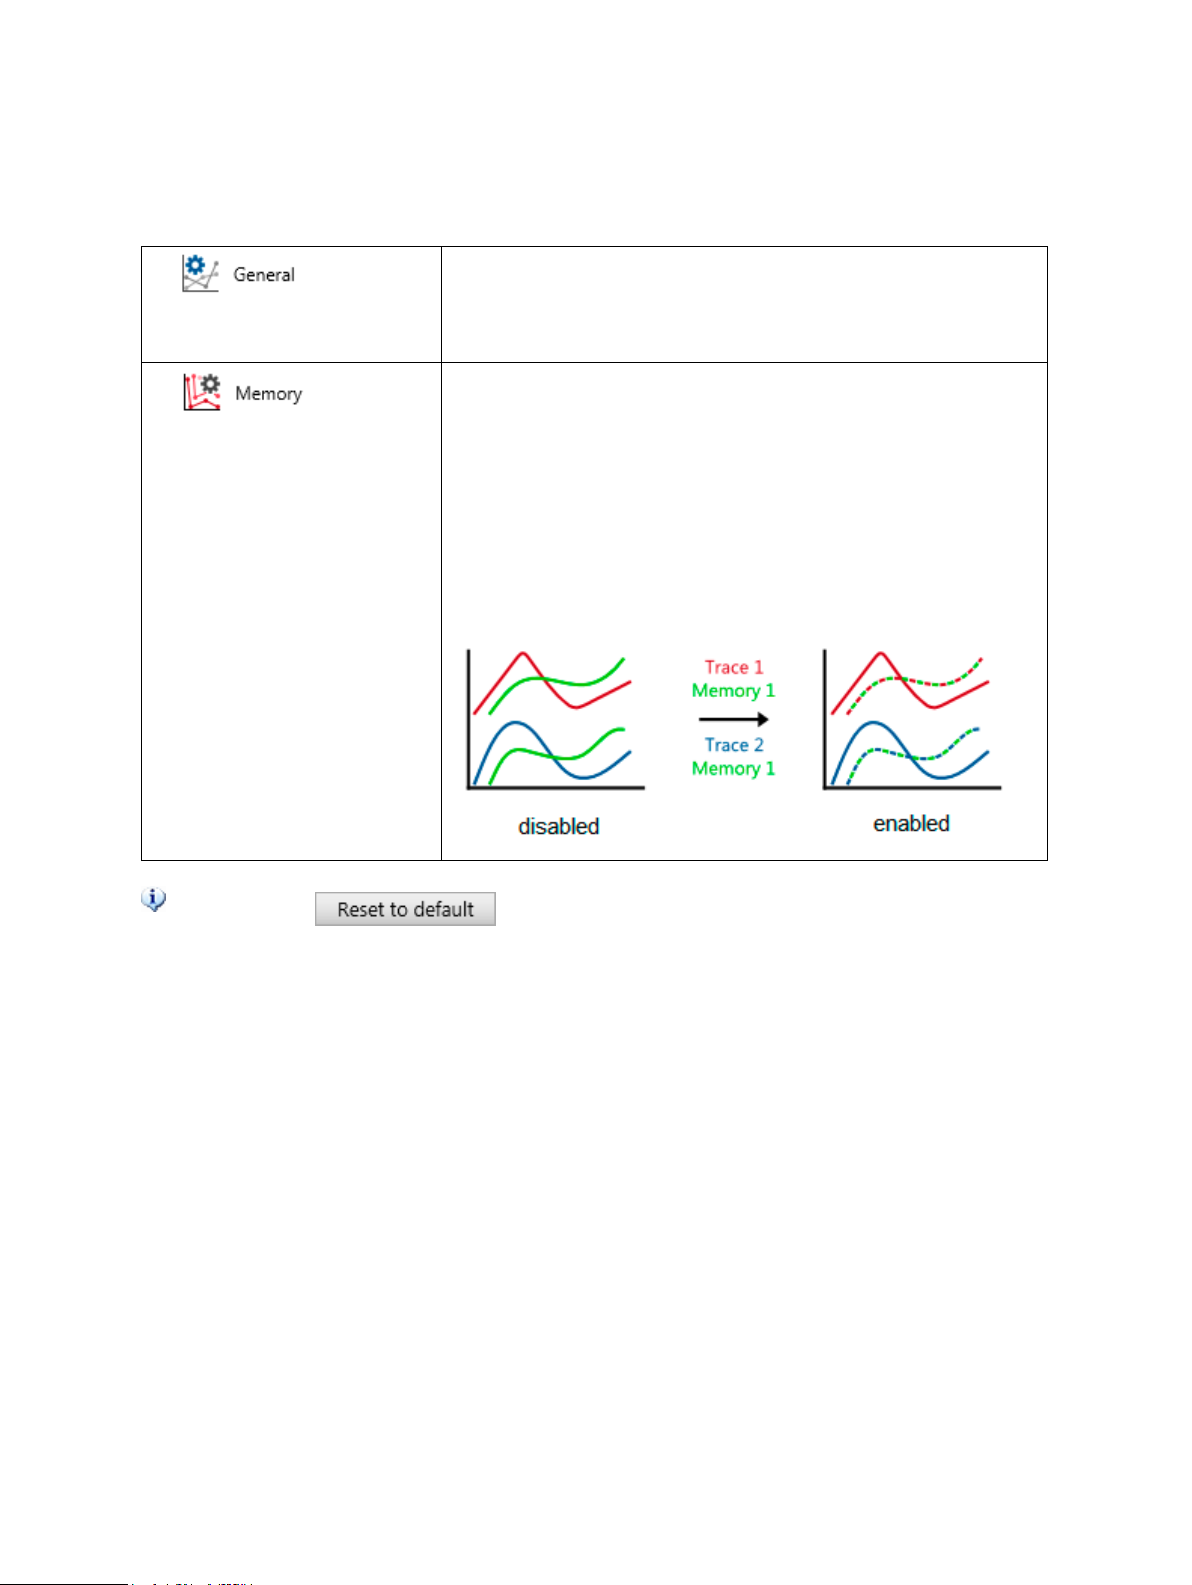
In the Chart section of the Options Menu you can change the following settings:
The sections in this unit allow you to optimize the quality and
appearance of the charts displayed in the Bode Analyzer Suite.
Further on, you can select if the axis labels are displayed in
scientific or engineering format.
General:
Here you can select the maximum number of memory traces,
the default memory line pattern (e.g. solid or dashed) as well as
if the deletion of a memory trace needs to be confirmed or not.
Alternating memory trace color mode:
By enabling this mode you can make it easier to find out to which
trace a memory belongs. If activated each memory alternates the
memory color and the color of the trace it belongs to as shown
below:
Hint: Click to switch back to the default settings of all options at any
time.
OMICRON Lab
31
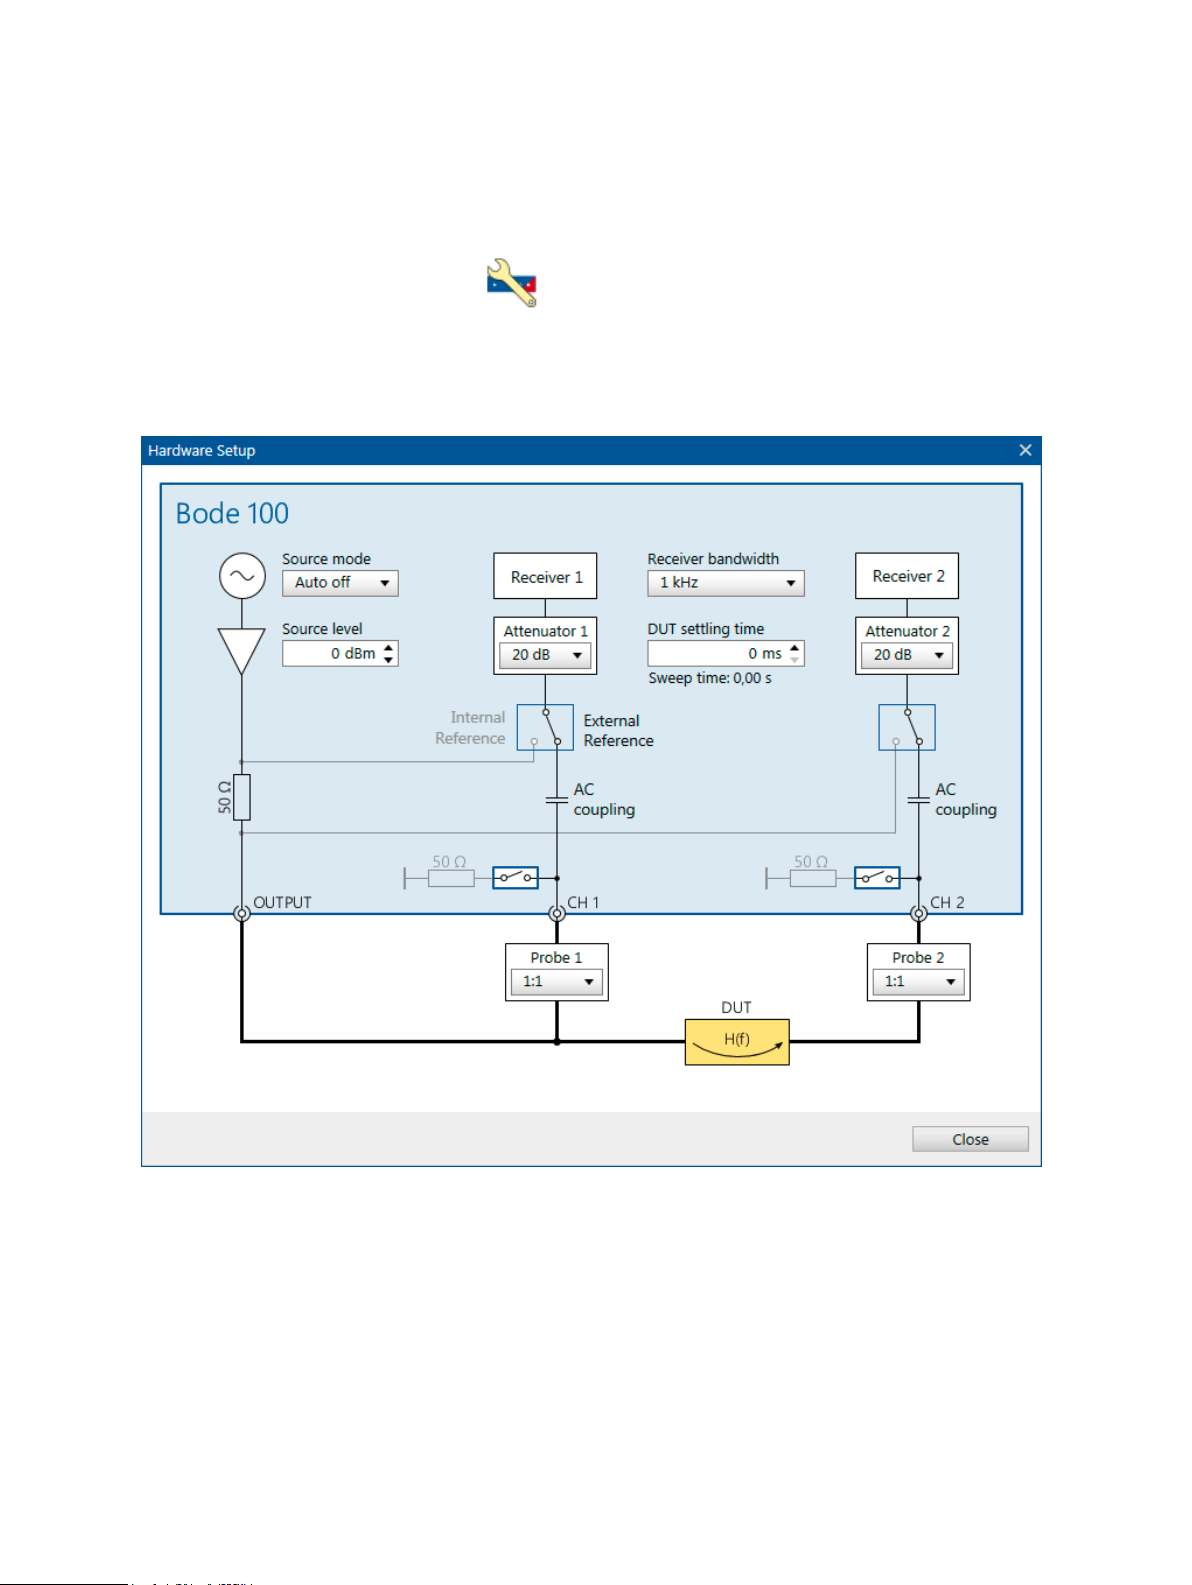
6.5 Hardware setup
By clicking on the Hardware setup icon , the hardware setup dialog is opened.
The hardware setup dialog shows the internal connections of Bode 100 as well as the external
connection to the DUT. Depending on the selected measurement mode, hardware settings such as
Channel termination, Receiver connection or an external Probe factor can be changed by clicking on
the icons shown in the Hardware setup dialog.
Figure 6-5: Hardware setup dialog in Gain/Phase measurement mode.
Depending on the measurement mode, some of the following settings can be changed by the user:
• Source mode: Choose between Auto off or Always on. More details on the source behavior of
Bode 100 can be found in 9.2 Signal source settings on page 98.
• Source level: Set the constant source level or the reference level when the shaped level function
is used.
• Receiver bandwidth: Select the receiver bandwidth used for the measurement.
32
OMICRON Lab

Bode Analyzer Suite introduction
• DUT settling time: Time between applying the measurement signal and starting to measure at the
receiver. A DUT settling time is needed if the DUT introduces a significant time delay before the
output reaches its final reaction to the input stimulus.
• Attenuator 1 and Attenuator 2: Select the input attenuators.
• Reference switch: Receiver 1 and Receiver 2 can be connected either internally or externally
depending on the measurement mode.
• Termination switch: When switched on, the Channel 1 and Channel 2 inputs are terminated with
50 Ω. If the switch is open, the input impedance is 1 MΩ.
• Probe 1 and Probe 2: Some measurement modes allow you to manually enter a probe factor. For
more details on using probes see 9.8 Using probes on page 120.
OMICRON Lab
33

7 Measurement types and applications
Bode 100 allows measuring Gain as well as Impedance, Reflection and Admittance. The following
chapters introduce you to the basics of the Gain and Impedance / Reflection / Admittance
measurements.
For an easy use, the Bode Analyzer Suite supports different measurement types / modes for different
applications. The available measurements are listed in the start screen of the Bode Analyzer Suite
(see 6.1 Start screen on page 18).
The available measurement modes are grouped in the Vector Network Analysis Tab and the
Impedance Analysis Tab:
Vector Network Analysis
The Vector Network Analysis Tab contains the following measurement types:
1. Transmission / Reflection
2. Gain / Phase
3. Reflection with external coupler
Impedance Analysis
The Impedance Analysis Tab contains the following measurement types:
1. One-Port
2. Impedance Adapter
3. Shunt-Thru
4. Shunt-Thru with series resistance
5. Series-Thru
6. Voltage / Current
7. External Bridge
In the following chapters all measurement types are explained in detail.
34
OMICRON Lab

Measurement types and applications
7.1 Gain measurement introduction
Bode 100 offers two different ways of measuring Gain. Either with the internal reference or the
external reference. Internal reference means that Receiver 1 is internally connected to the Bode 100
signal source picking up the source voltage. External reference means that Receiver 1 is routed to the
front panel input Channel 1.
Depending on the Receiver 1 connection, Gain is measured as shown in the following table:
Receiver 1 is set to internal reference Receiver 1 is set to external reference
Bode 100 measures
Bode 100 measures
Where V0 is the internal source voltage. If
Channel 2 is terminated with 50 Ω (default), Gain
equals the scattering parameter S21 of a two-port
DUT (Port 1 is connected to Bode 100 output and
port 2 is connected to Bode 100 Channel 2).
If Channel 2 is set to high-impedance, a
Thru-connection from Output to
Channel 2 will result in +6 dB. To
normalize to 0 dB you can use Thrucalibration.
The following two measurement modes can be used to perform a Gain measurement:
1. Transmission / Reflection: This mode allows both, measurements with internal and external
reference connection.
2. Gain / Phase: Is used to measure Gain from Channel 1 to Channel 2 (Frequency Response
Measurement).
Since the gain result is a complex number you can choose how gain shall be displayed. You can
select the result formats by clicking the drop down Format in the trace configuration box.
Gain therefore equals the transfer function of a 2port DUT if Channel 1 is connected to the DUT
input port and Channel 2 is connected to the DUT
output port.
OMICRON Lab
35

In a gain measurement the following result formats are available:
Gain Result Formats
Magnitude: Displays the magnitude of the measured
Gain.
Magnitude (dB): Displays the magnitude of the
measured Gain in dB
Phase (°): Displays the phase of the measured Gain in
degrees.
Phase (rad): Displays the phase of the measured Gain
in radians.
Tg: Displays the group delay of the measured Gain in
seconds (see Gain result format equations for details).
Polar: Displays the measured Gain in a polar chart.
Real: Displays the real part of the measured Gain.
Imaginary: Displays the imaginary part of the
measured Gain.
Nyquist: Displays the measured Gain in a Nyquist
chart.
Q(Tg): Displays the Q-factor derived from group delay.
This value is used for NISM (see cursor calculations on
page 116 for details).
Gain result format equations
The Gain results are calculated based on the following equations:
Gain H:
where h is the magnitude of gain H and φ the phase of H.
ω is the angular frequency with the frequency f.
Group delay Tg is calculated by symmetric difference quotient
Q(Tg) is the quality factor derived from the group delay
36
OMICRON Lab

Measurement types and applications
7.2 Impedance measurement introduction
Bode 100 offers several ways of measuring Impedance, Reflection or Admittance. Impedance,
Reflection and Admittance are directly related to each other by the following equations:
Admittance Y is the reciprocal of the impedance Z.
The reflection coefficient Γ is calculated from the measured
impedance Z and the nominal impedance Z0.
Z0 can be changed by the user in the measurement configuration. The nominal impedance
Z0 field is only visible if a measurement trace is set to Reflection.
The Impedance Analysis modes allow you to display the measurement results in various formats. You
can select the result formats by clicking the drop down Format in the trace configuration box.
Depending on the chosen measurement the following result formats are available:
Impedance Result Formats
Magnitude: Displays the magnitude of the measured
impedance in Ohms.
Magnitude (dB): Displays the magnitude of the
measured impedance in dBΩ.
Phase (°): Displays the phase of the measured
impedance in degrees.
Phase (rad): Displays the phase of the measured
impedance in radians.
Tg: Displays the group delay of the measured
impedance in seconds (see Gain result equations for
details).
Polar: Displays the measured impedance in a polar
chart.
Real: Displays the resistance of the measured
impedance in Ohms.
Imaginary: Displays the reactance of the measured
impedance in Ohms.
Rs: Displays the equivalent series resistance (ESR) of
the measured impedance in Ω. This value equals the
Real part of impedance.
Ls: Displays the equivalent series inductance (ESL) of
the measured impedance in Henry.
OMICRON Lab
37

Admittance Result Formats
Cs: Displays the equivalent series capacitance (ESC) of
the measured impedance in Farad.
Q: Displays the Q-factor of the measured impedance
(see Impedance result equations for details).
Nyquist: Displays the measured impedance in a
Nyquist chart
Q(Tg): Displays the Q-factor derived from group delay.
This value is used for NISM (see Cursor calculations for
details).
tan(δ): Displays the tan(δ) of the measured admittance.
(see Impedance result equations for details).
Magnitude: Displays the magnitude of the measured
admittance in Siemens.
Magnitude (dB): Displays the magnitude of the
measured admittance in dBS.
Phase (°): Displays the phase of the measured
admittance in degrees
Phase (rad): Displays the phase of the measured
admittance in radians
Tg: Displays the group delay of the measured
admittance in seconds (see Gain result equations for
details).
Polar: Displays the measured admittance in a polar
chart.
Real: Displays the conductance of the measured
admittance in Siemens.
Imaginary: Displays the susceptance of the measured
admittance in Siemens
Rp: Displays the equivalent parallel resistance of the
measured admittance in Ohms.
Lp: Displays the equivalent parallel inductance of the
measured admittance in Henry.
Cs: Displays the equivalent parallel capacitance of the
measured admittance in Farad.
Q: Displays the Q-factor of the measured admittance
(see Impedance result equations for details).
Nyquist: Displays the measured admittance in a
Nyquist chart.
Q(Tg): Displays the Q-factor derived from group delay
(see Cursor calculations for details).
tan(δ): Displays the tan(δ) of the measured admittance.
(see Impedance result equations for details)
38
OMICRON Lab
Reflection Coefficient Result Formats
Measurement types and applications
Magnitude: Displays the magnitude of the measured
reflection coefficient.
Magnitude (dB): Displays the magnitude of the
measured reflection coefficient in dB
Phase (°): Displays the phase of the measured
reflection coefficient in degrees.
Phase (rad): Displays the phase of the measured
reflection coefficient in radians.
Tg: Displays the group delay of the measured reflection
coefficient in seconds (see Gain result equations for
details).
Polar: Displays the measured reflection coefficient in a
polar chart.
Smith: Displays the measured reflection coefficient
respectively impedance in a Smith chart.
VSWR: Displays the voltage standing wave ratio of the
measured reflection coefficient.
Real: Displays the real part of the measured reflection
coefficient.
Imaginary: Displays the imaginary part of the
measured reflection coefficient.
Nyquist: Displays the reflection coefficient in a Nyquist
chart.
Q: Displays the Q-factor of the measured reflection (see
Impedance result equations for details).
Nyquist: Displays the measured reflection in a Nyquist
chart.
Q(Tg): Displays the Q-factor derived from the group
delay (see Cursor calculations for details).
OMICRON Lab
39

Result format equations
The Impedance / Admittance / Reflection results are calculated based on the following equations:
ImpedanceZ:
where R is the real part of the impedance (resistance) and X the imaginary part of the
impedance (reactance).
ω is the angular frequency with the frequency f.
Series equivalent resistance Rs equals the real part of impedance
Series equivalent capacitance Cs
Series equivalent inductance Ls
Series circuit quality factor Q
tan(d) of impedance
Admittance Y:
where G is the real part of the admittance (conductance) and B the imaginary part of
the admittance (susceptance).
ω is the angular frequency with the frequency f.
Parallel equivalent resistance Rp
Parallel equivalent capacitance Cp
Parallel equivalent inductance Lp
Parallel circuit quality factor Q
tan(d) of admittance
40
OMICRON Lab
Measurement types and applications
Reflection Coefficient Γ:
Voltage Standing Wave Ratio VSWR
Tg as well as Q(Tg) are calculated in the same way as for the gain measurement (see 7.1 Gain
measurement introduction on page 35).
7.3
Vector Network Analysis
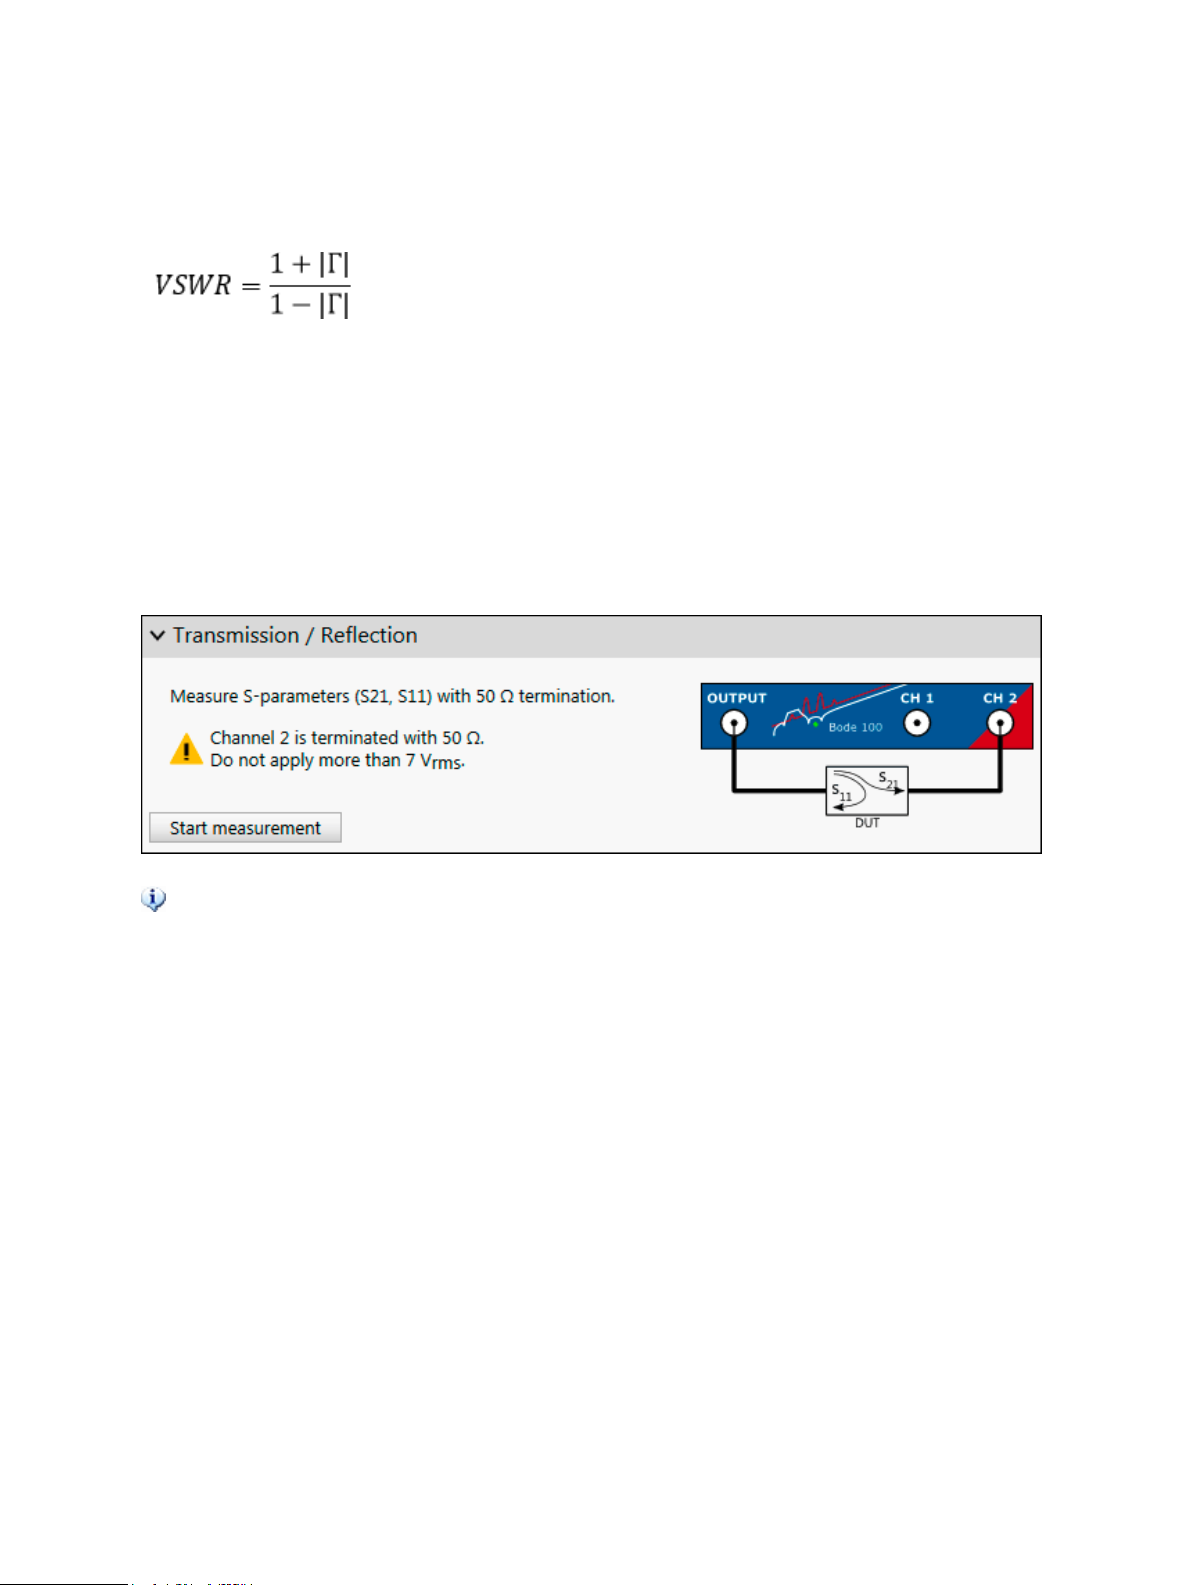
7.3.1 Transmission / Reflection
The Transmission / Reflection measurement mode is designed to measure the S-parameters S21 and
S11 in the 50 Ω domain.
The Transmission / Reflection measurement mode allows to measure both, Transmission
(Gain) and Reflection (Impedance). It is possible to select e.g. a Gain measurement in Trace
1 and an Impedance measurement in Trace 2. Bode 100 will then sequentially measure Gain
and Impedance.
Therefore some hardware settings are available twice. Once for the Gain measurement and once for
the Impedance measurement.
Also the hardware setup dialog is available twice. Once for the Gain measurement and once for the
impedance measurement.
For details on how the Gain is calculated, please check 7.1 Gain measurement introduction on
page 35.
Calibration in the Transmission / Reflection measurement mode
The Transmission / Reflection measurement mode does not require calibration to perform a
measurement. However, to remove the influence of your connection cables the measurement mode
offers Gain (Thru) as well as Impedance (Open, Short, Load) calibration. Gain calibration applies to a
Gain measurement and Impedance calibration applies to a Impedance/Reflection/Admittance
measurement. When measuring at high frequency or with long cables it is strongly recommended to
perform a calibration. For more details regarding the Gain calibration please refer to 8 Calibration on
page 69.
OMICRON Lab
41
Typical applications
Typical applications for the Transmission / Reflection measurement mode are:
• Measuring Transmission and Reflection of filters such as IF filters or EMI filters.
• Comparing results from measurements with internal and external reference connection
(the Transmission / Reflection measurement mode is the only measurement mode that allows
changing the Receiver 1 connection).
• Measuring Gain of RF amplifiers in the 50 Ω domain.
Transmission / Reflection measurement example
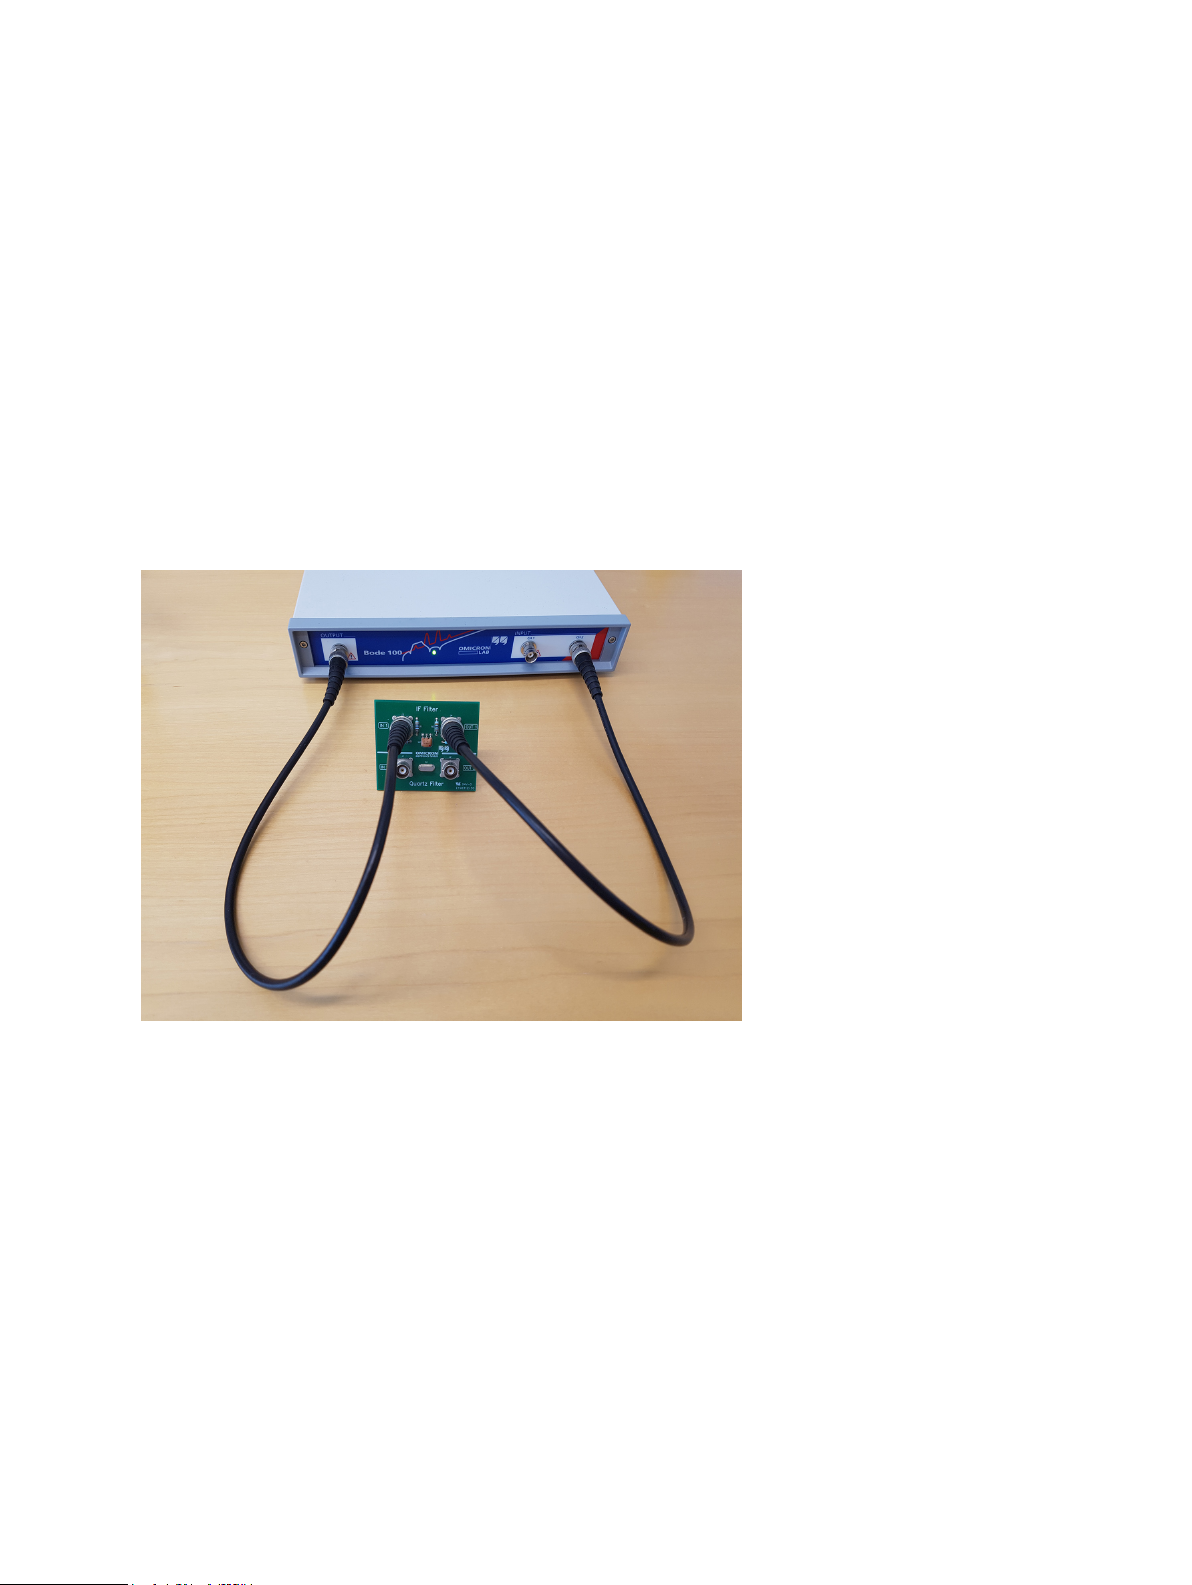
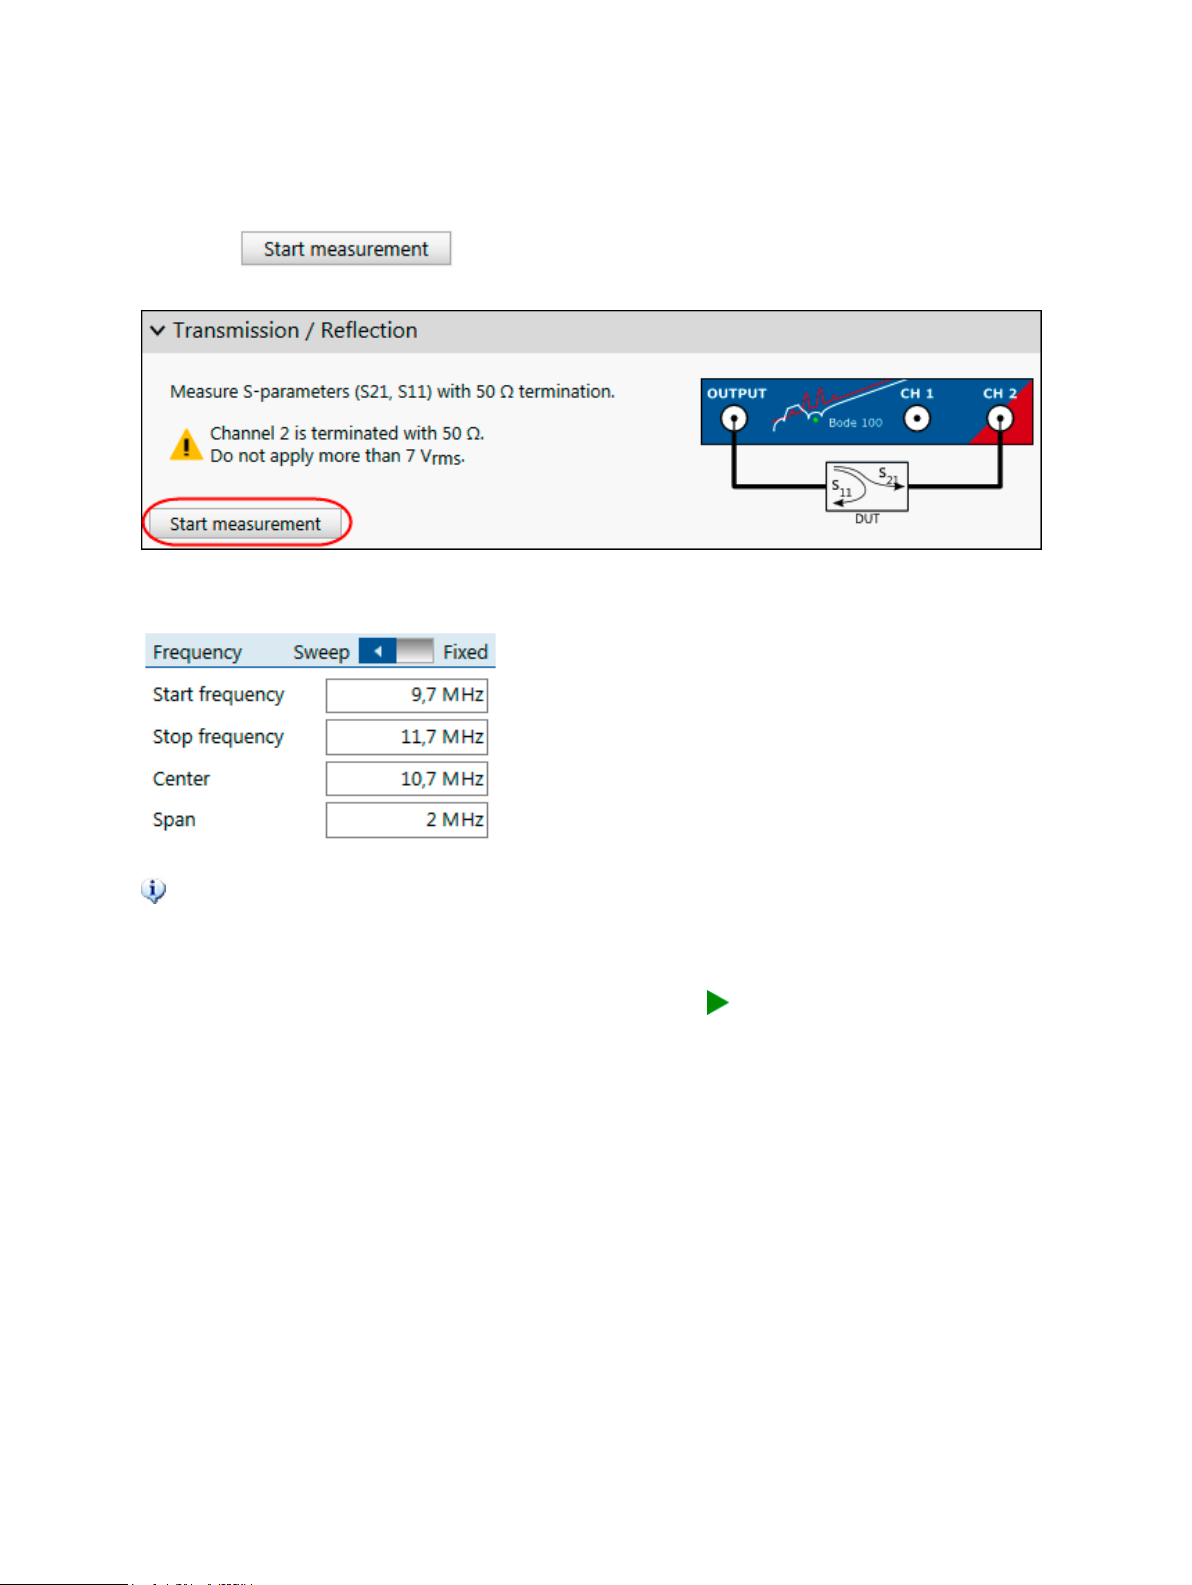
Follow the steps described below to perform a Transmission / Reflection measurement:
Connect the test object "IF Filter" to Bode 100 using two BNC cables as shown in the figure below.
Figure 7-1: Connecting the test object IF Filter to Bode 100
42
OMICRON Lab
Measurement types and applications
Now start the Bode Analyzer Suite and enter the Transmission / Reflection measurement mode by
clicking on .
Before starting the measurement set the Start and Stop frequency to the values shown below:
After setting the Start and Stop frequency the Center frequency as well as the frequency
Span are set automatically. Alternatively you can enter the Span and Center and the Start
and Stop frequency are updated accordingly
Now you are ready to start your first measurement. Simply click in the home ribbon. As a result you
will see a first measurement comparable to the one shown in the figure below.
OMICRON Lab
43

Figure 7-2: S-Parameter measurement of a 10.7 MHz IF filter
Trace 1 (red curve) shows the Magnitude of the Gain (= Magnitude of S21) while Trace 2 (blue curve)
shows the Magnitude of Reflection (= Magnitude of S11). You can change Format for both traces to
display other results such as Phase or Real and Imaginary components
To optimize the chart you can right click onto the chart and select Optimize as shown below. For more
information on the chart's context menu check out 6.3 Chart context menu on page 28.
44
OMICRON Lab

Measurement types and applications
Figure 7-3: Context menu of chart
OMICRON Lab
45

Further on you can use the cursors to perform measurements. To do so simply drag the cursors to the
point you want to measure (1.) and check out the results in the cursor grid (2.) as shown in 7-4 on
page 46. For more cursor functions visit 9.4 Working with cursors and the cursor grid on page 109.
Figure 7-4: Use of cursors and cursor grid
Congratulations you have performed your first measurement with the Bode 100. You can load the
settings for the measurement by clicking File → Open → and then navigating to: "%APPDATA%
\OMICRON Lab\Bode Analyzer Suite\Demo Files\". The file you will need is: TransRefl_IF-
Filter.bode3
Hint: The Transmission / Reflection is the most flexible measurement setup for the
Bode 100. By selecting this setup you can switch between internal and external reference.
Further on, you can switch the input impedance of input CH1 and input CH2 between 50 Ω
and high impedance.
46
OMICRON Lab
Measurement types and applications
7.3.2 Gain / Phase
The Gain / Phase measurement mode is designed to measure the transfer function of a DUT using the
external reference connection. This means that both Channel 1 and Channel 2 are active.
The Gain Measurement
Bode 100 measures
Gain therefore equals the transfer function of a 2-port DUT if Channel 1 is connected to the DUT input
port and Channel 2 is connected to the DUT output port. The inputs Channel 1 and Channel 2 are set
to 1 MΩ by default.
Details on the gain measurement can be found in 7.1 Gain measurement introduction on page 35.
Calibration
The Gain / Phase measurement mode does not require calibration to perform a measurement.
However, to remove the influence of probes and cables Gain (Thru) calibration is recommended. For
more details regarding the Gain calibration please refer to 8 Calibration on page 69.
Typical applications
Typical applications for the Gain / Phase measurement mode are:
• Measuring the transfer function of filters or other circuits.
• Measuring in-circuit transfer functions using high-impedance probes.
• Measuring the transfer function of amplifiers etc.
• Measuring loop stability of power supplies.
OMICRON Lab
47
Measurement example
For detailed measurement examples using the Gain / Phase measurement mode, please check out
the application notes at www.omicron-lab.com/BodeManualAppNotes. The following application notes
use the Gain / Phase measurement mode:
• DC/DC Converter Stability Measurements
• Bipolar Transistor AC Current Gain Measurement
• Op-Amp measurements
• PSRR Measurement
• And many more...
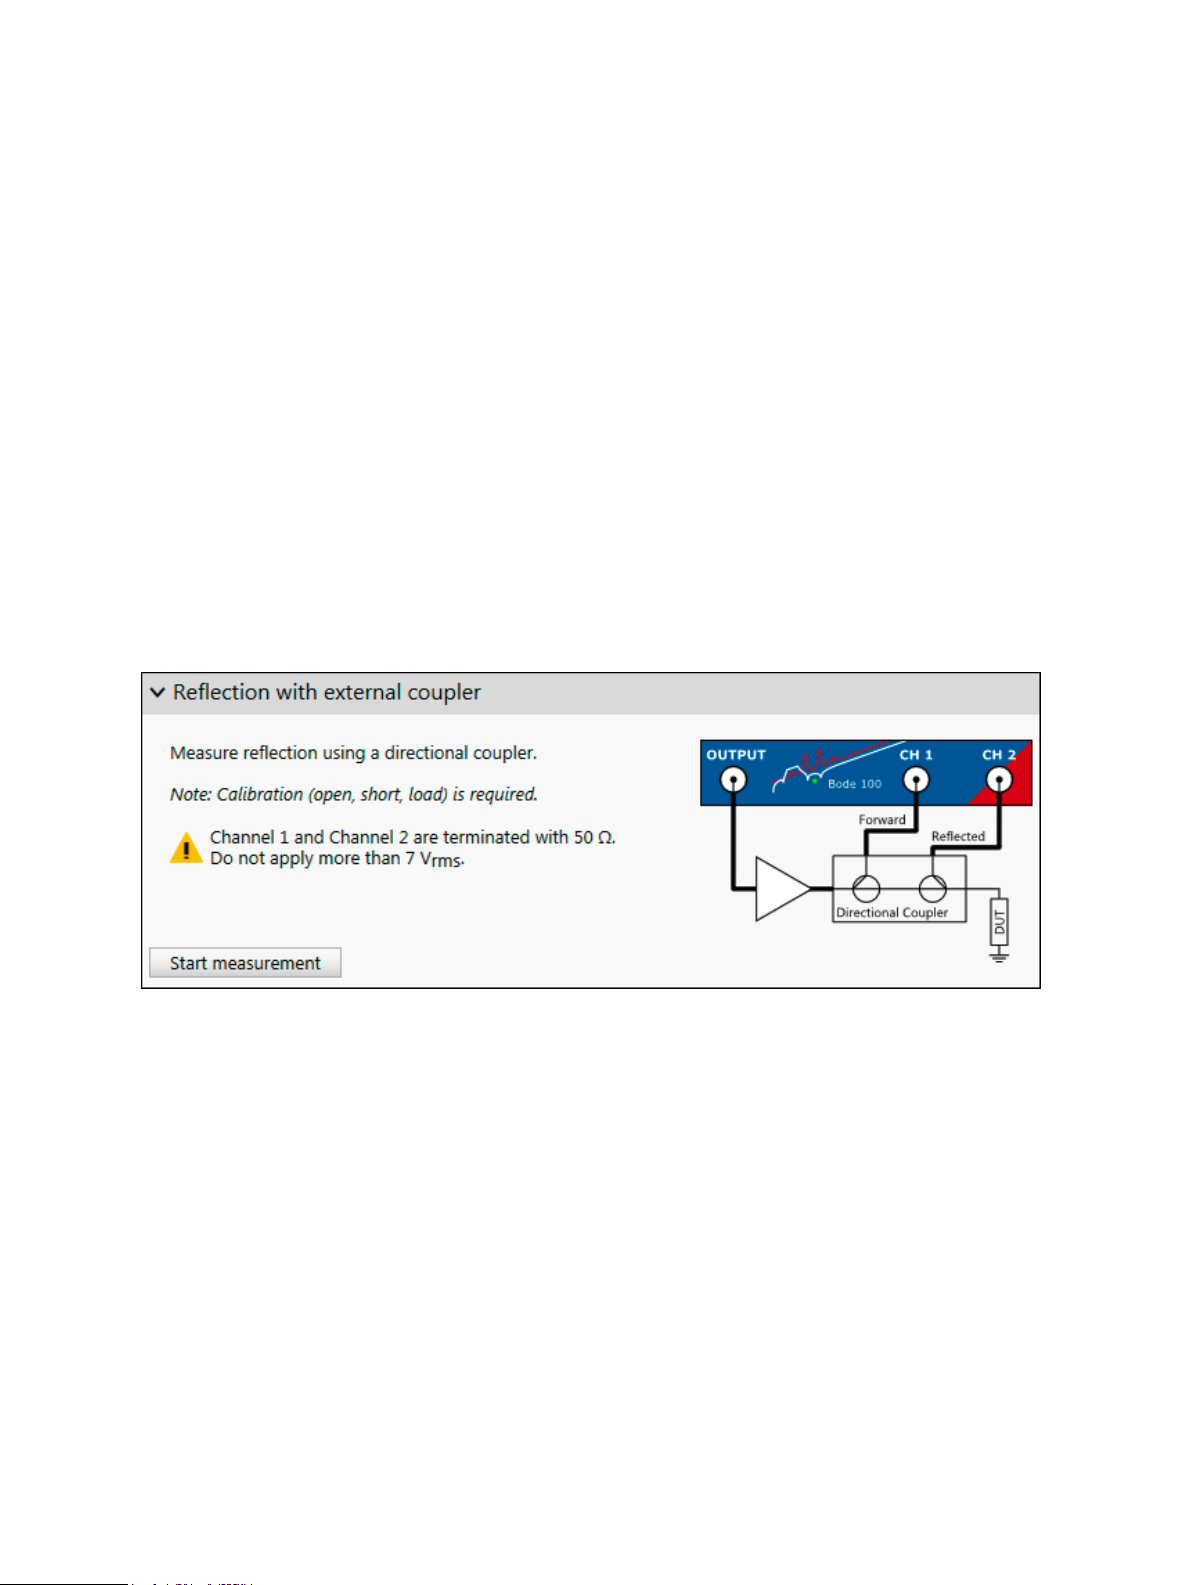
7.3.3 Reflection with external coupler
The External coupler measurement mode is designed to measure reflection using an external coupler.
This offers the possibility to use an external amplifier and protect the inputs of Bode 100 by using an
external directional coupler.
Calibration
Please note that the external coupler measurement mode requires an impedance calibration (Open,
Short, Load). For more details on how to perform an impedance calibration see 8.3.2 Calibrating an
External Coupler or External Bridge measurement on page 80.
Typical applications
Typical applications for the external coupler measurement mode are:
• Measuring medium-wave antennas.
• Measuring impedance with high-power amplifiers.
Measurement example
For a detailed measurement example using the external coupler measurement mode, please check
out the medium wave antenna measurement application note at
www.omicron-lab.com/BodeManualAppNotes.
48
OMICRON Lab

Measurement types and applications
7.4 Impedance analysis
7.4.1 One-Port
The One-Port measurement mode is designed to perform quick impedance, admittance and reflection
measurements. One advantage of the One-Port impedance measurement mode is that no external
calibration is required. Bode 100 can measure impedance directly at the output port.
Measurement information
Bode 100 derives the impedance by evaluating the internal source voltage and the output voltage.
Receiver 1 as well as Receiver 2 are internally connected. General details on impedance
measurements with Bode 100 can be found in 7.2 Impedance measurement introduction on page 37.
OMICRON Lab
49
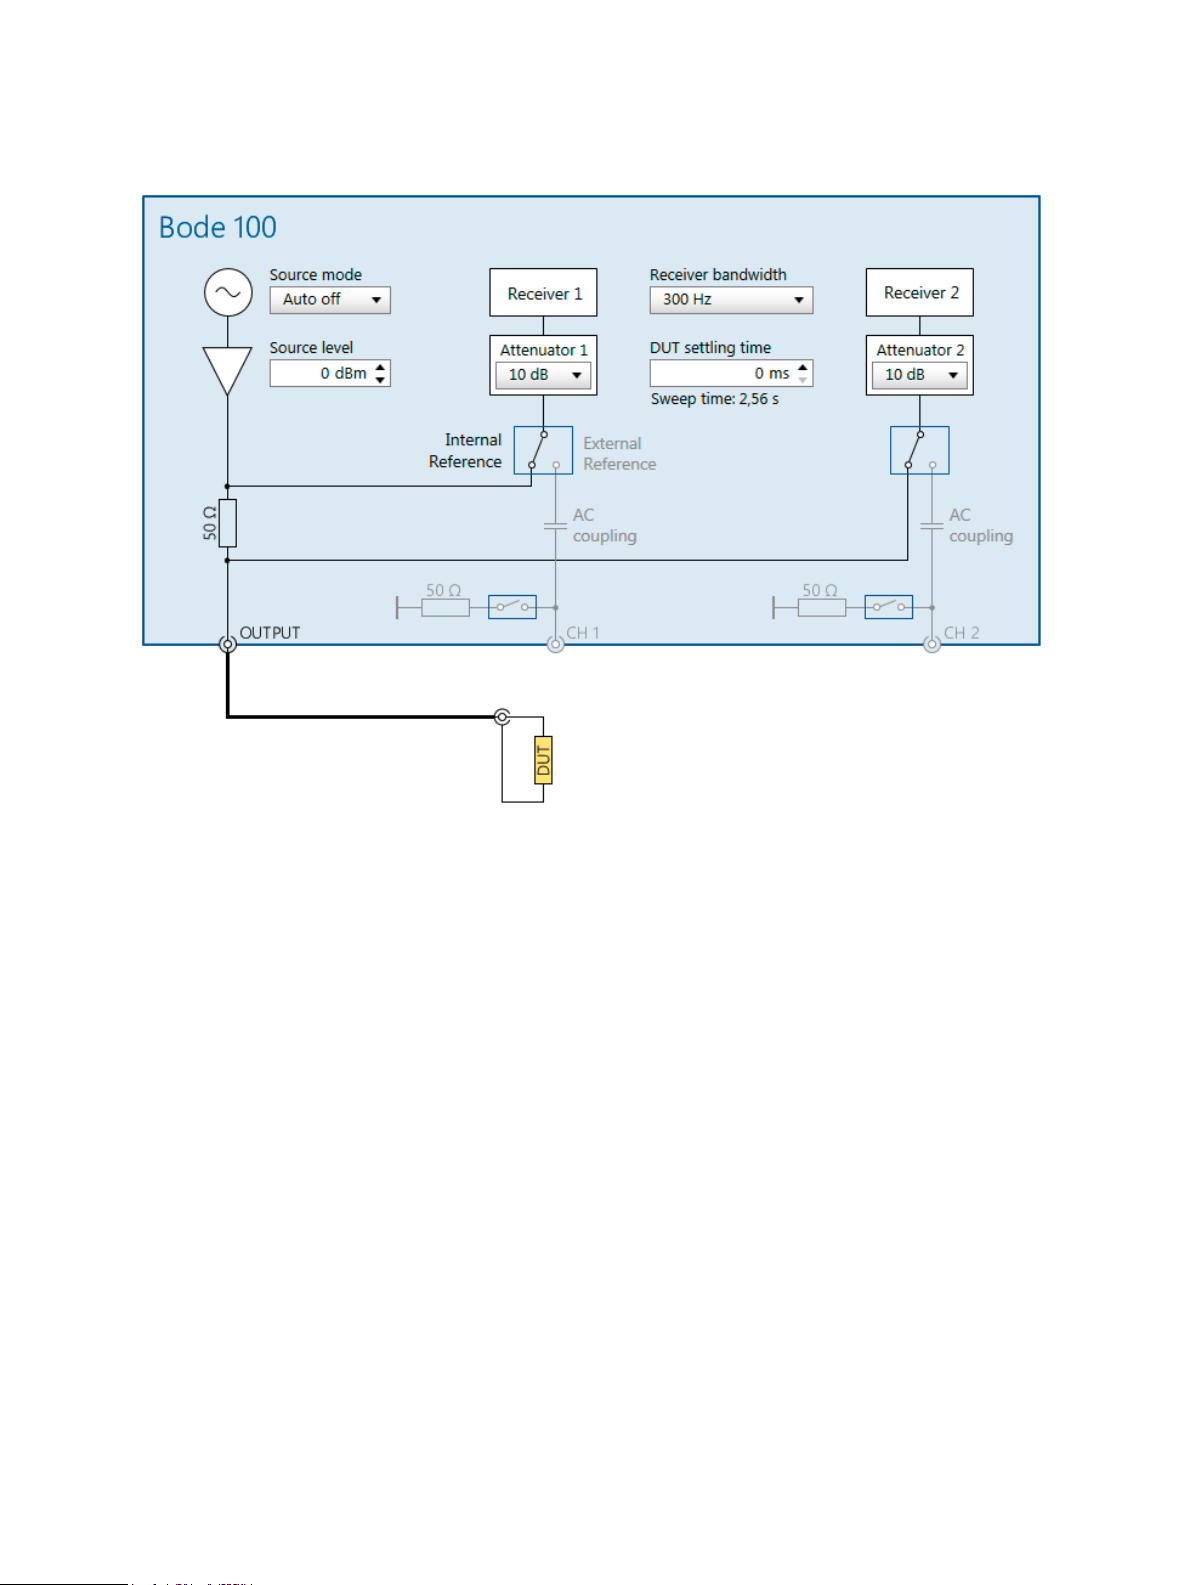
Figure 7-5: Hardware setup of the One-Port measurement mode.
Since the output impedance of Bode 100 is 50 Ω, the one-port measurement provides highest
sensitivity for a DUT having an impedance close to 50 Ω. The method is generally suitable to measure
impedance values between roughly 500 mΩ and 10 kΩ.
For measurements close to the limits of this method it is highly recommended to perform a careful
User-Range calibration to achieve best results.
Calibration
The One-Port impedance measurement mode does not require calibration to perform a measurement.
However, to achieve highest accuracy a calibration is recommended. Furthermore a calibration allows
to move the reference plane from the output port of Bode 100 to the end of a connection cable. This
compensates the effect of the connection cable.
For more details on how to perform an Impedance calibration please refer to 8.3.1 Calibrating a
Reflection or One-Port Impedance measurement on page 78.
Typical applications
Typical applications for the One-Port impedance measurement mode are:
• Measuring impedance of passive components.
• Measuring impedance of cables, piezo-elements or any one-port DUT.
50
OMICRON Lab

Measurement types and applications
One-Port measurement example
In this measurement example we will determine the series ans parallel resonance frequency of a 12
MHz quartz filter. Further on, we will display the quartz filter's reflection curve in a Smith chart.
Connect the input IN 2 of the test object "Quartz Filter" to the OUTPUT of Bode 100 using a BNC
cable. Further on, connect the BNC short delivered with Bode 100 to the corresponding output OUT 2.
The complete setup is shown in the figure below.
Figure 7-6: Connecting the test object Quartz Filter to Bode 100
Now start the Bode Analyzer Suite and enter the One-Port measurement mode by clicking Impedance
Analysis and then .
OMICRON Lab
51

Before starting the measurement set the Center frequency, frequency Span and the Number of
points to the values shown below.
Further on, select sweep linear:
Now click in the home ribbon. As a result you will see a first measurement comparable to the one
shown in the figure below.
52
OMICRON Lab

Measurement types and applications
Figure 7-7: Impedance measurement of the test object Quartz Filter
Trace 1 (red curve) shows the Magnitude of the Quartz Filter's impedance while Trace 2 (blue curve)
shows the Phase of the Quartz Filter's impedance.
Before continuing the measurement please switch of Trace 2 by unchecking the corresponding check
box .
To determine the parallel and series resonance of the Quartz filter we need to zoom in. You can do this
by clicking into the chart on the top left corner of the intended zoom area, keep the mouse button
pressed and pull it to the lower right corner of the intended zoom area as shown.
OMICRON Lab
53

In the zoomed window you will see that you are not having enough frequency points. By pressing
you can set the start and stop frequency of the measurement to
match the zoomed window. Right Click into the chart and select Optimize. Repeat these steps until
you achieve a chart as shown in 7-8 on page 54
Figure 7-8: Optimizing the frequency resolution with Get from zoom
For more information on the zoom functions and optimizing check out 9.3.2 Zooming the
measurement curve on page 103 and 6.3 Chart context menu on page 28.
54
OMICRON Lab
Measurement types and applications
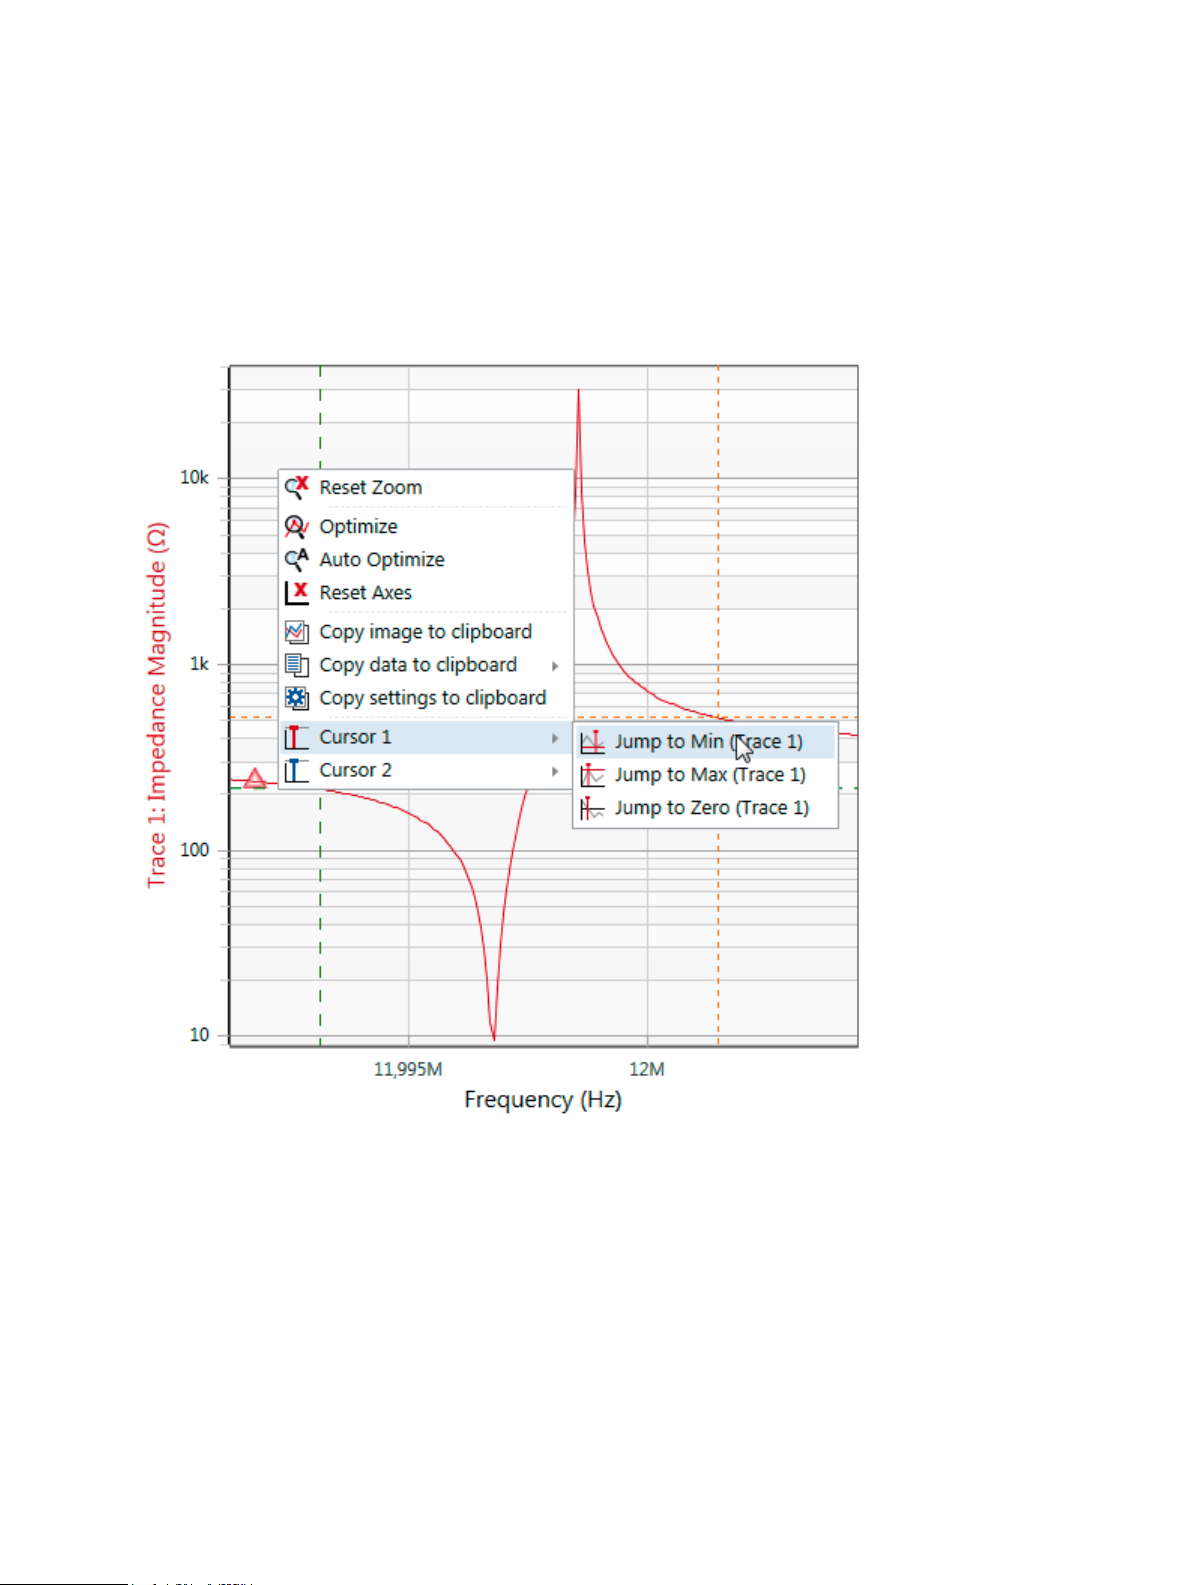
After you have optimized the chart you can measure the series resonance and parallel resonance
using the cursors. To do so right-click into the chart area close to the red curve and choose Cursor 1
and then Jump to Min (Trace 1). Then right-click into the chart area once more and choose Cursor 2
and then Jump to Max (Trace 1)
Figure 7-9: Using the cursor jump functions
For more information on cursor functions visit 9.4 Working with cursors and the cursor grid on
page 109.
OMICRON Lab
55

Now let's have a look at the measurement result:
Figure 7-10: Series and parallel resonance frequency of the quartz filter
To determine the series and parallel resonance frequencies check out the cursor grid as shown in
7-8 on page 54:
• Series resonance frequency (Cursor 1 - green): 11.996768 MHz
• Parallel resonance frequency (Cursor 2 - orange): 11.998572 MHz
• Offset between the series and parallel resonance frequency (Delta C2-C1): 1.8 kHz
Your measurement results can be slightly different since each quartz filter behaves a little bit
different.
One characteristic of resonance frequencies is that the inductances and capacitances compensate
each other. This means that at the series and parallel resonance the impedance of our quartz filter
should be purely resistive. An elegant way to check this is to display the quartz filters reflection curve
as a Smith chart.
56
OMICRON Lab

Measurement types and applications
Smith charts were developed at a time when it was still difficult to directly measure the frequency
swept impedance of measurement objects. The Smith chart is used to determine the impedance at a
certain point of the reflection curve. To display the Smith chart of our quartz filter's impedance apply
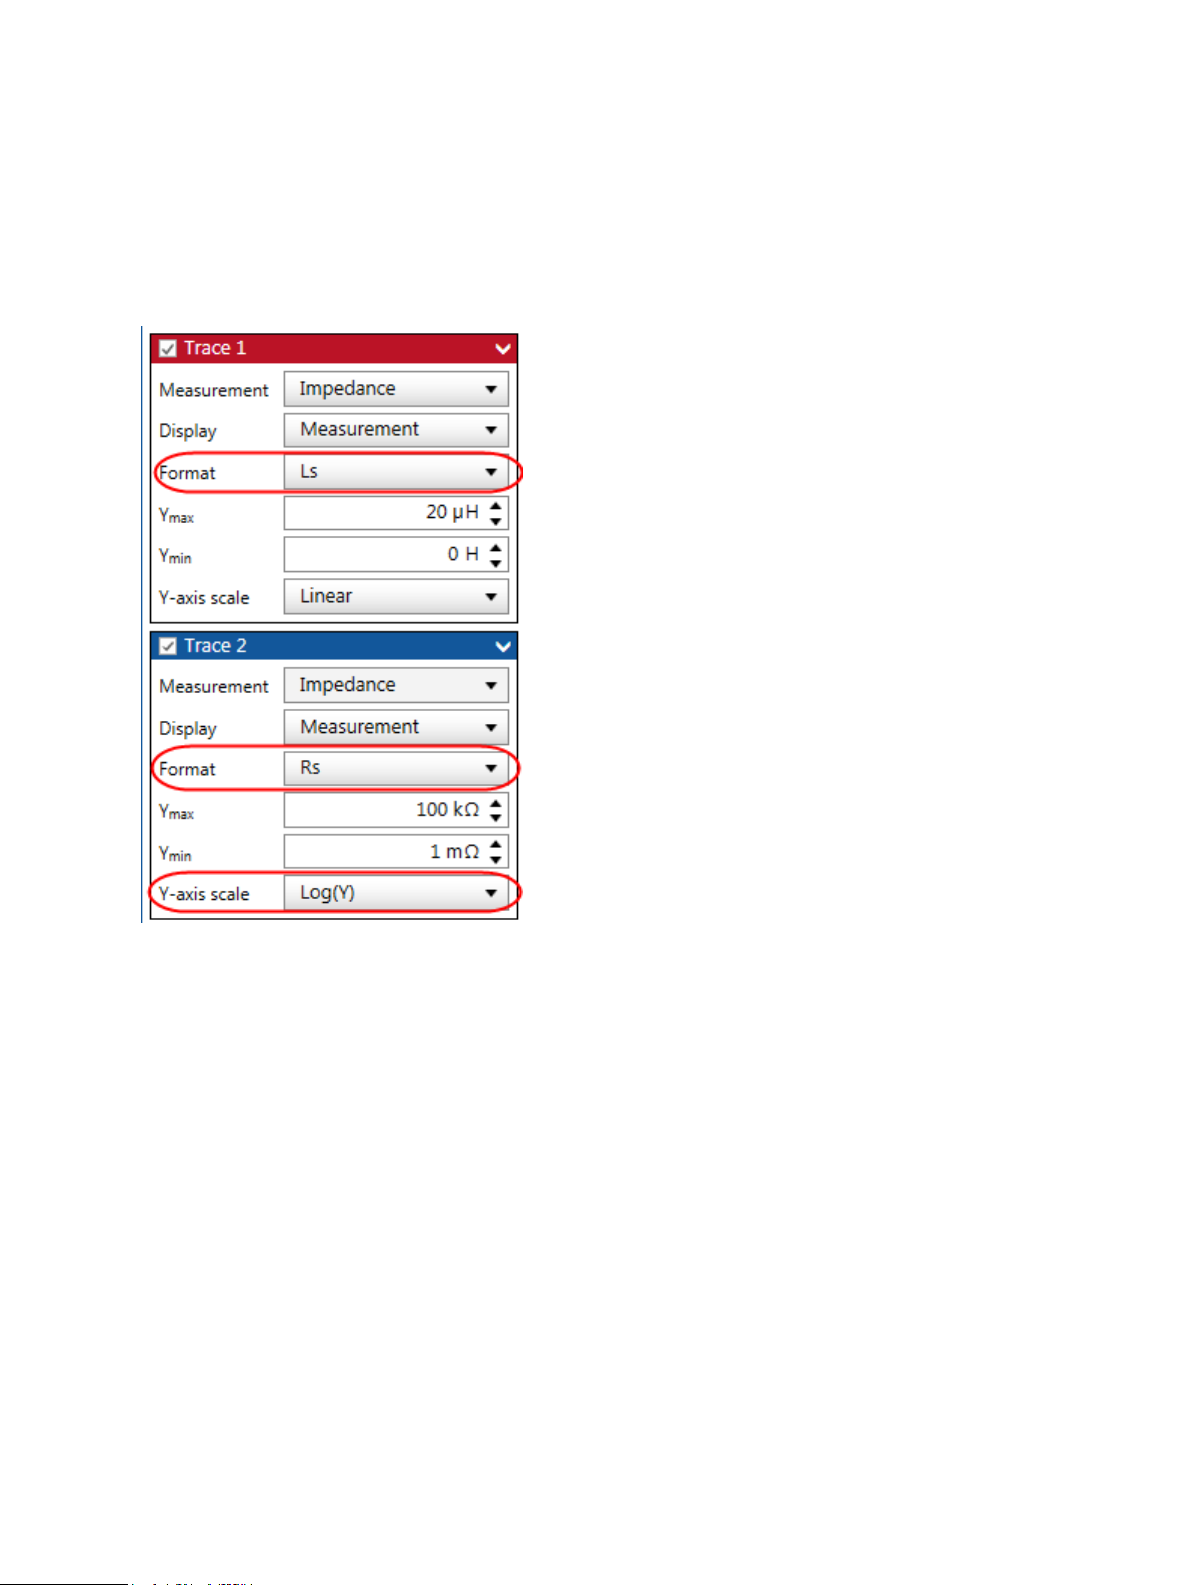
the settings shown below to Trace 1:
After applying the settings a smith chart like the one shown below will be displayed:
OMICRON Lab
57
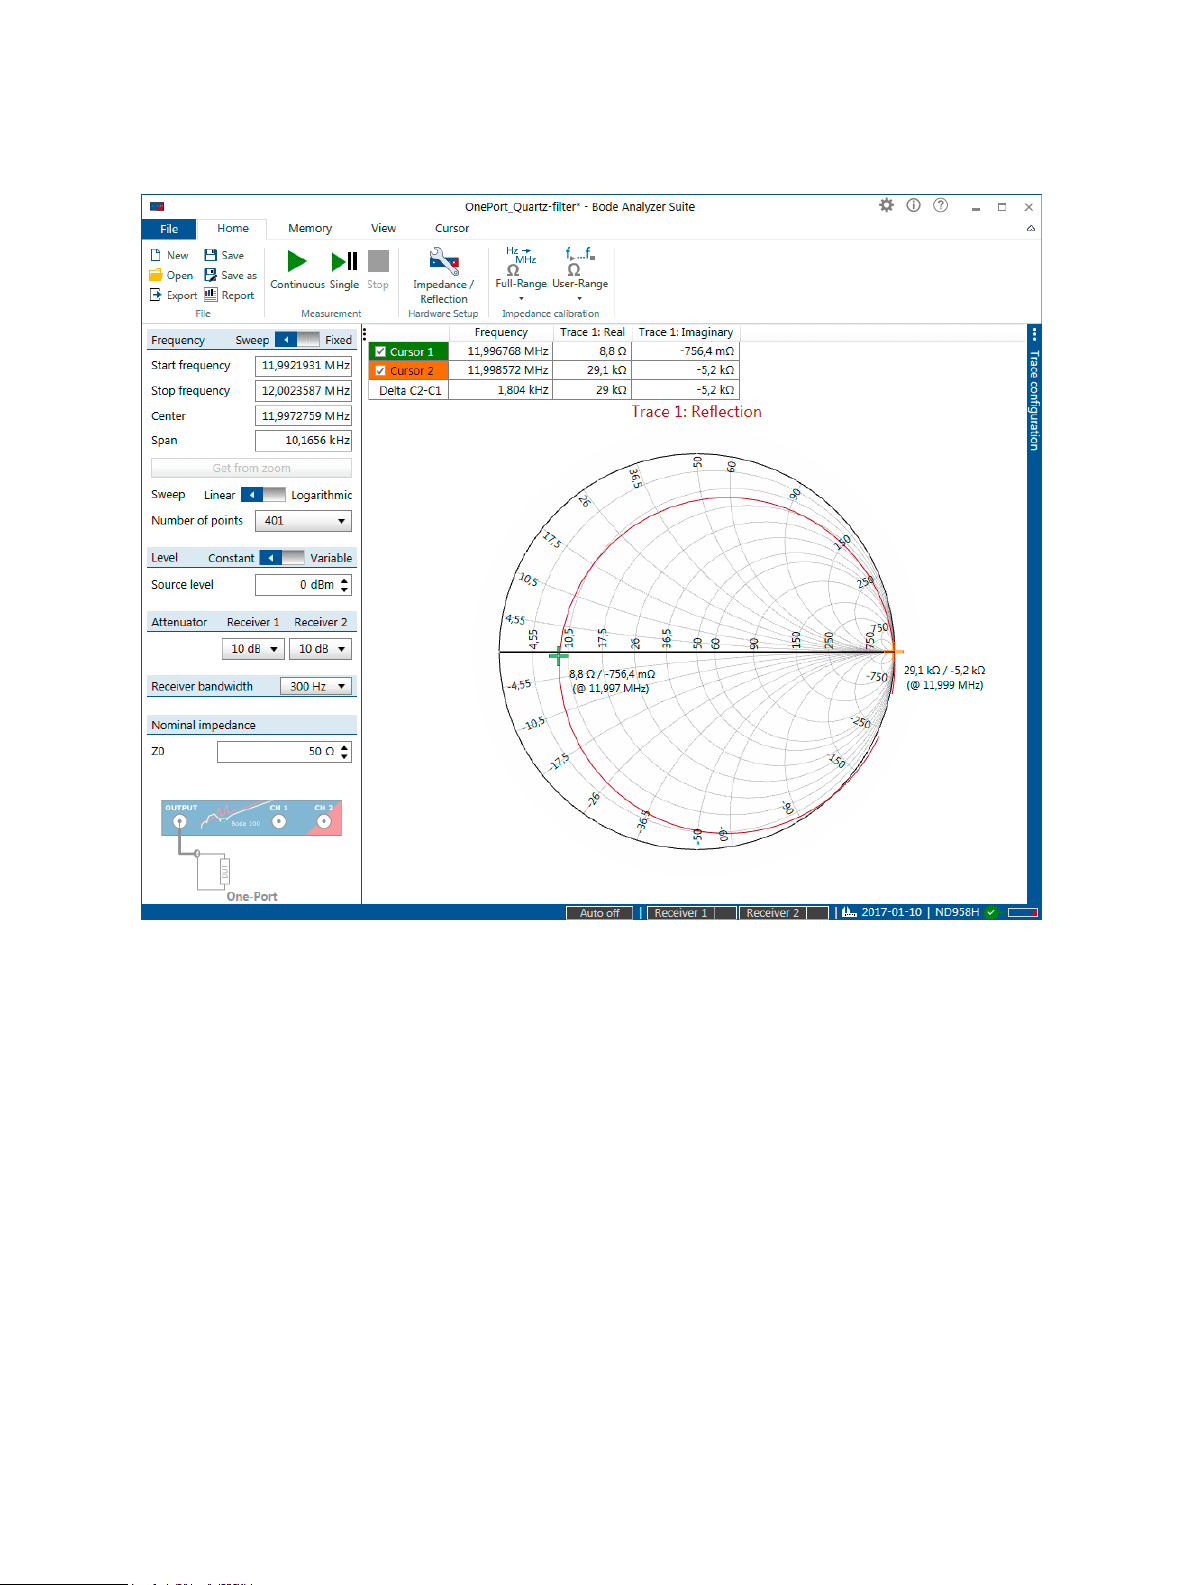
Figure 7-11: Smith chart of the 12 MHz Quartz Filter
As you can see both cursors are very close to the horizontal (=resistive) axis of the Smith chart.
However, you can also see that the imaginary part for both measurements is not exactly 0 Ω. The
reason for this is the chosen number of frequency points and the frequency resolution resulting from it.
Fell free to use more points and zooming to determine the exact frequencies at which the imaginary
part of the impedance becomes 0 Ω
Congratulations you have performed your impedance measurement with the Bode 100. You can
load the settings for the measurement by clicking File → Open → and then navigating to:
"%APPDATA%\OMICRON Lab\Bode Analyzer Suite\Demo Files\".
The file you will need is: OnePort_Quartz-Filter.bode3.
58
OMICRON Lab
Measurement types and applications
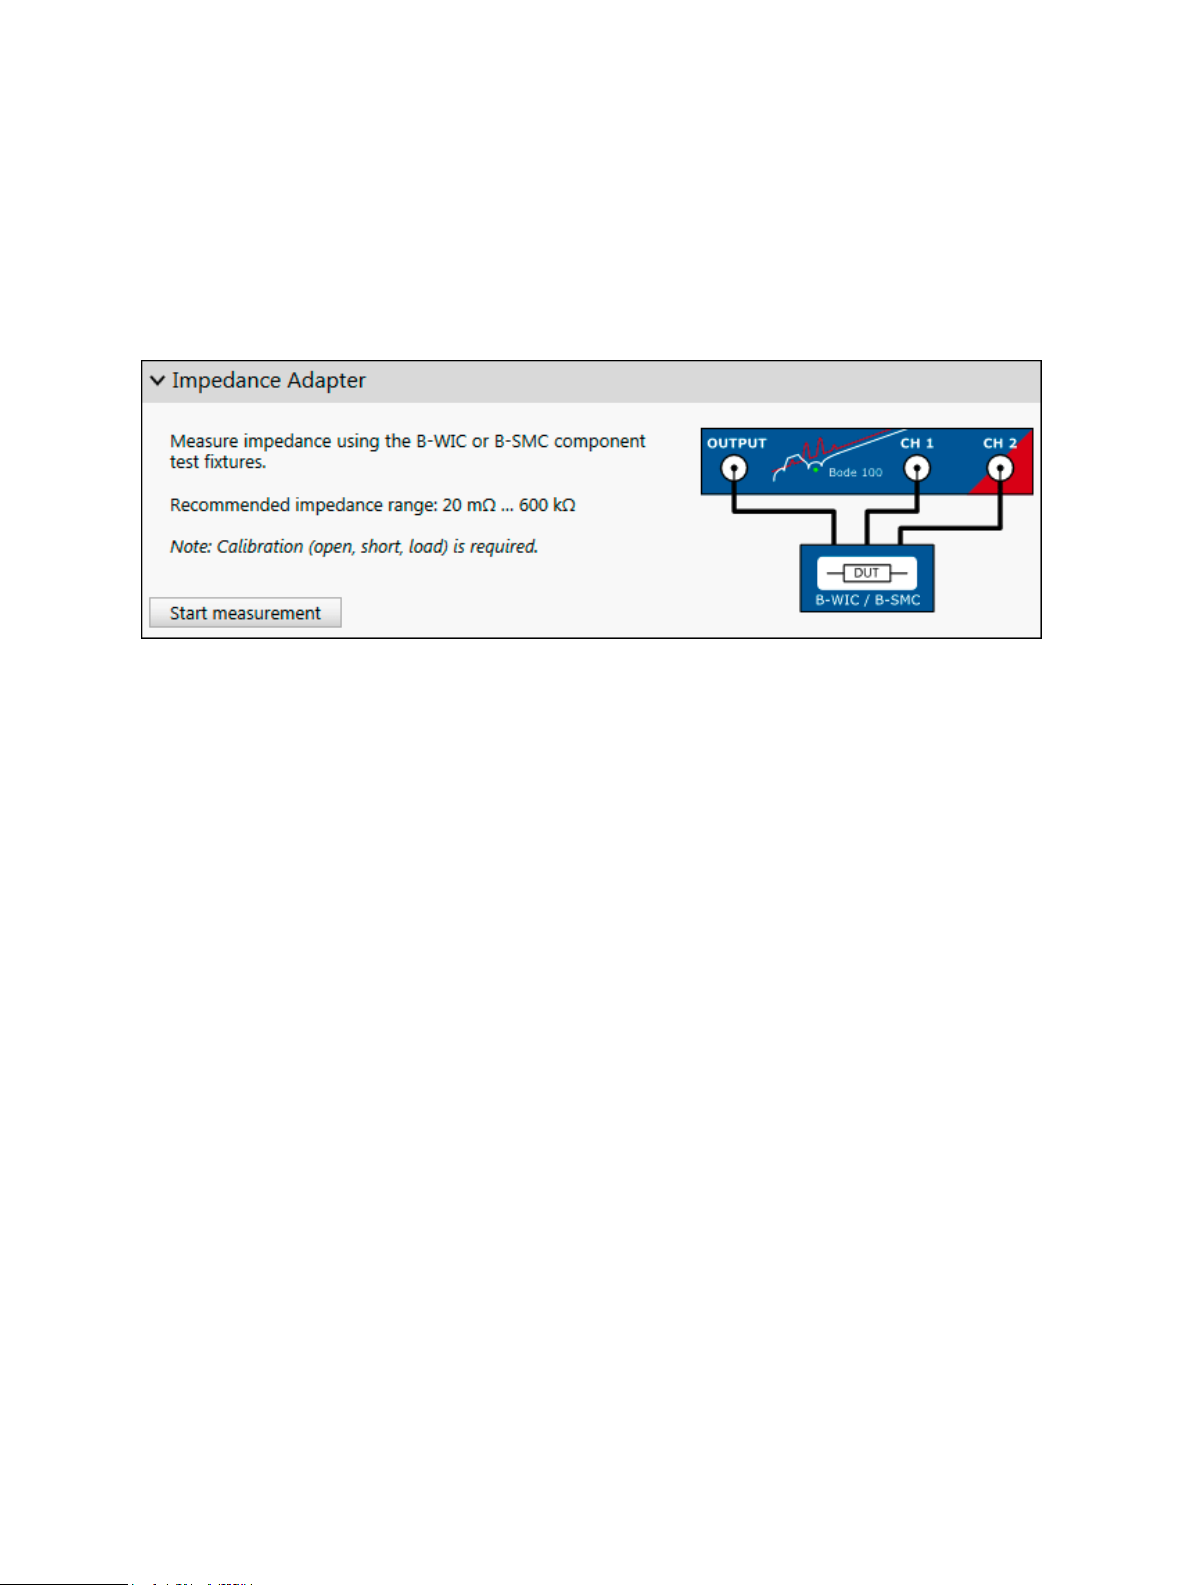
7.4.2 Impedance Adapter
The impedance adapter measurement mode is especially designed for measurements with the
OMICRON Lab impedance test fixtures B-WIC and B-SMC. The impedance adapter measurement
mode ensures that Bode 100 is configured correctly to achieve best results when measuring with both
B-WIC and B-SMC.
Calibration
The impedance adapter measurement mode requires impedance (open, short, load) calibration.
For more details on how to calibrate the B-WIC or B-SMC impedance adapter, please refer to
8.3.3 Calibrating an Impedance Adapter measurement on page 82.
Measurement information
With B-WIC and B-SMC, the dynamic range of both input channels is used. This widens the usable
impedance measurement range to 20 mΩ to 600 kΩ.
It is recommended to use the 0.5 m BNC cables delivered with Bode 100 to connect B-WIC or B-SMC
to the Bode 100.
B-WIC and B-SMC are designed to measure physically small DUTs. Stray-fields between the DUT and
the grounded housing of the impedance adapters might introduce a systematic measurement error.
The error is negligible when measuring physically small objects. To measure physically big DUTs it is
recommended to use a grounded measurement configuration such as shown in 7.2.1 One-Port on
page 49.
Typical applications
Typical applications for the impedance adapter measurement mode are:
• Measuring impedance of capacitors, inductors and other passives (THT and SMC).
• Measuring impedance piezo-elements or quartz elements.
Impedance Adapter measurement example
In this measurement example we will determine the inductance (Ls) and the equivalent series
resistance (Rs) of an inductance with the B-WIC impedance measurement adapter for through-holetype components. Connect the B-WIC to Bode 100 using three BNC cables as shown below.
OMICRON Lab
59
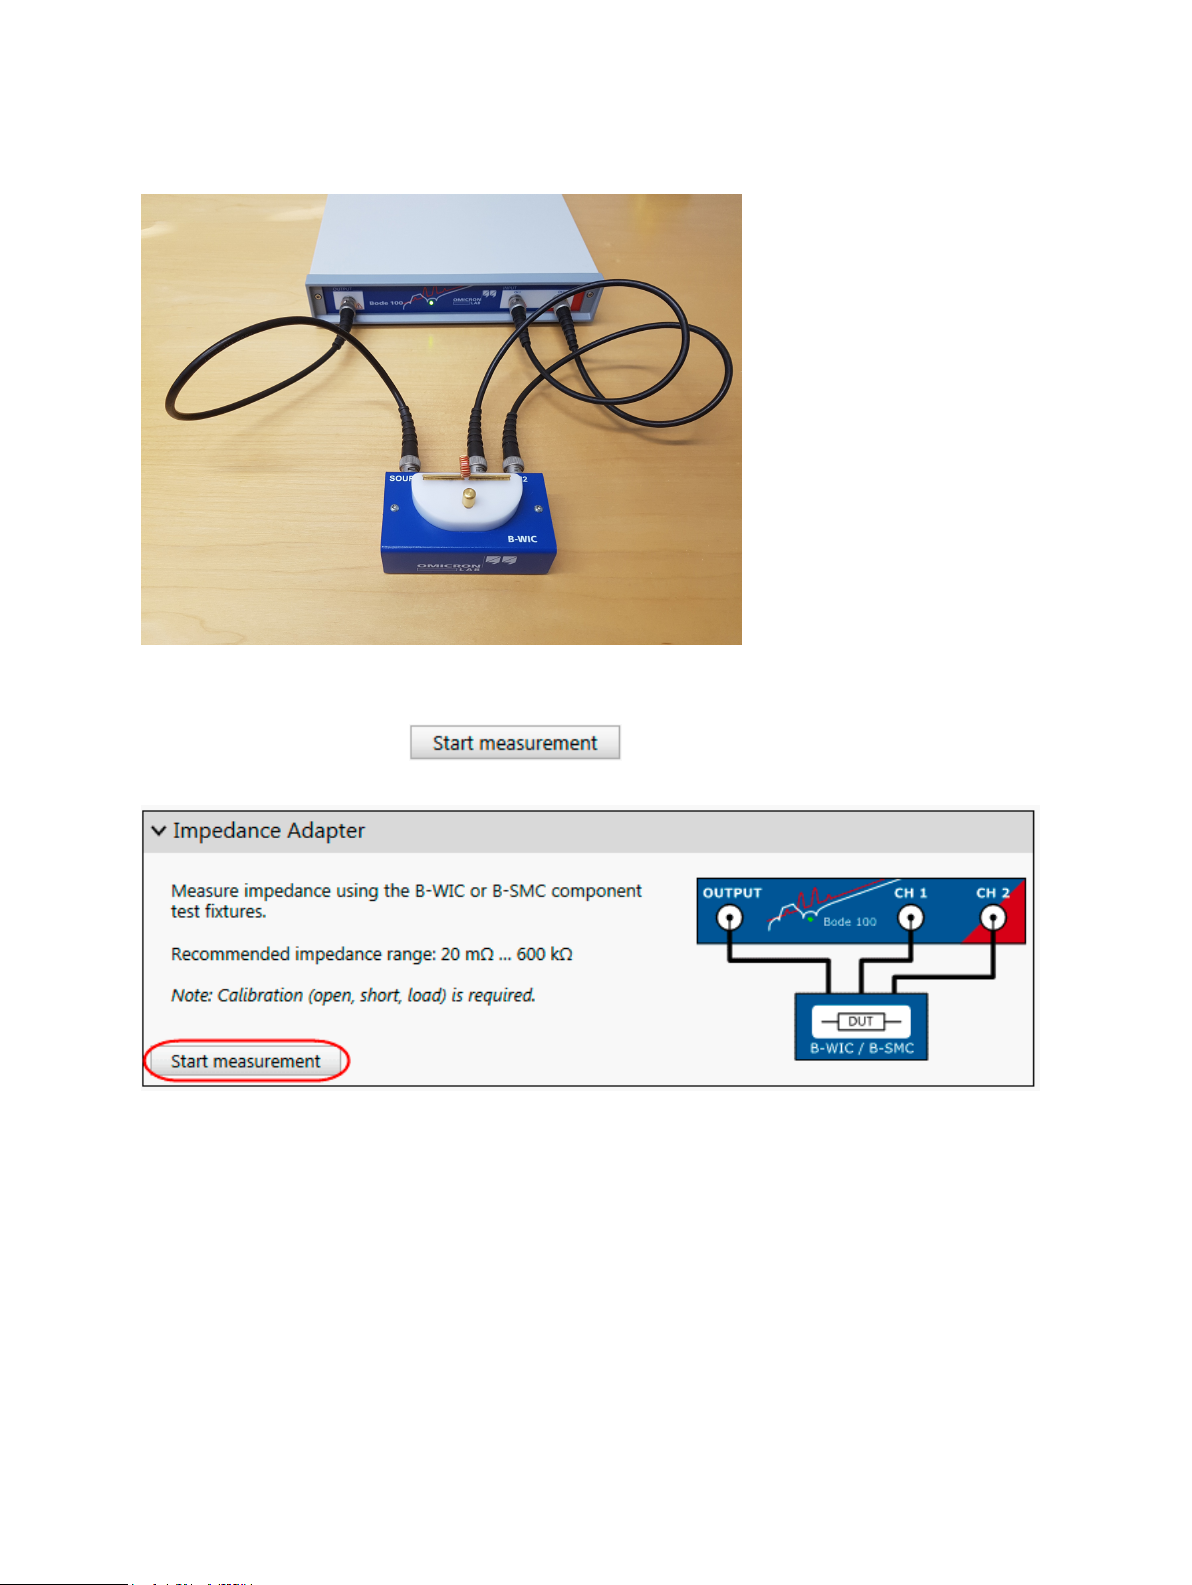
Figure 7-12: Connecting the B-WIC to Bode 100
Now start the Bode Analyzer Suite and enter the Impedance Adapter measurement mode by clicking
Impedance Analysis and then .
Before you can start a measurement you have to perform a Full range calibration. To do so please
follow the steps described in Impedance Adapter Calibration on page 82.
After having performed the calibration please put the inductor you want to measure into the
impedance measurement adapter as shown in 7-12 on page 60.
Since it is not known in what frequence range the examined inductor is working please change the
stop frequency to 50 MHz.
60
OMICRON Lab

Measurement types and applications
Now click in the home ribbon. As a result you will see a first measurement comparable to the one
shown in the figure below. For sure your result will look different since you are using a different
inductor.
Figure 7-13: Impedance measurement of an Inductor
OMICRON Lab
61
Trace 1 (red curve) shows the Magnitude of the inductor's impedance while Trace 2 (blue curve)
shows the phase of the inductor's impedance. The magnitude curve is rising with 20 dB per decade,
this indicates that we are really measuring an inductor. To measure the resistance Rs and inductance
Ls of the inductor simply change the format for Trace 1 and Trace 2 as shown.
To get a better view on the Ls and Rs it is recommended to switch to two diagrams. To do so follow
the instructions described in 9.3.1 Configure the diagrams on page 101.
62
OMICRON Lab
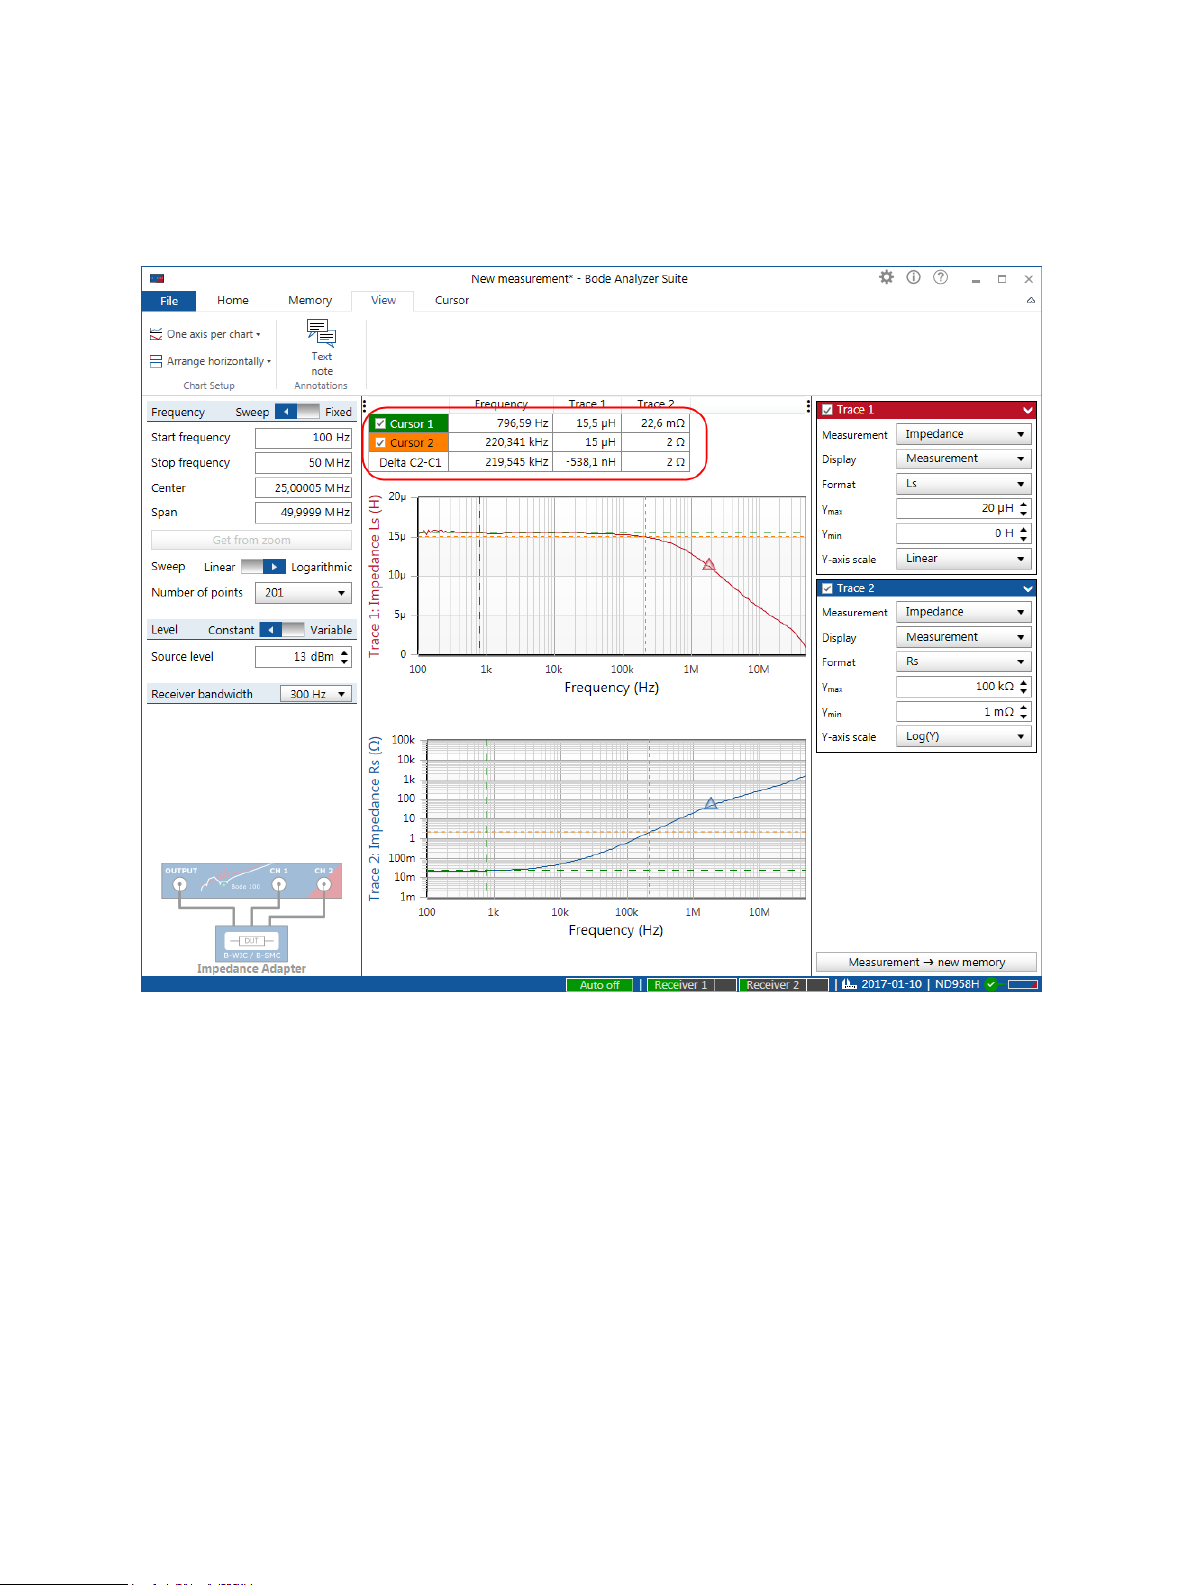
Well, and now we have our result:
Measurement types and applications
Figure 7-14: Measurement of a 15µH inductor with the B-WIC impedance adapter
By using the cursors we can gather the following information on the measured inductor:
• The inductor has an inductance of 15 µH up to 220 kHz
• The resistance of the inductor starts around 20 mΩ and rises up to 2 Ω at 220 kHz
• Above 220 kHz the inductance starts to drop and slightly above 50 MHz the inductor will have its
resonance frequency and become capacitive.
OMICRON Lab
63
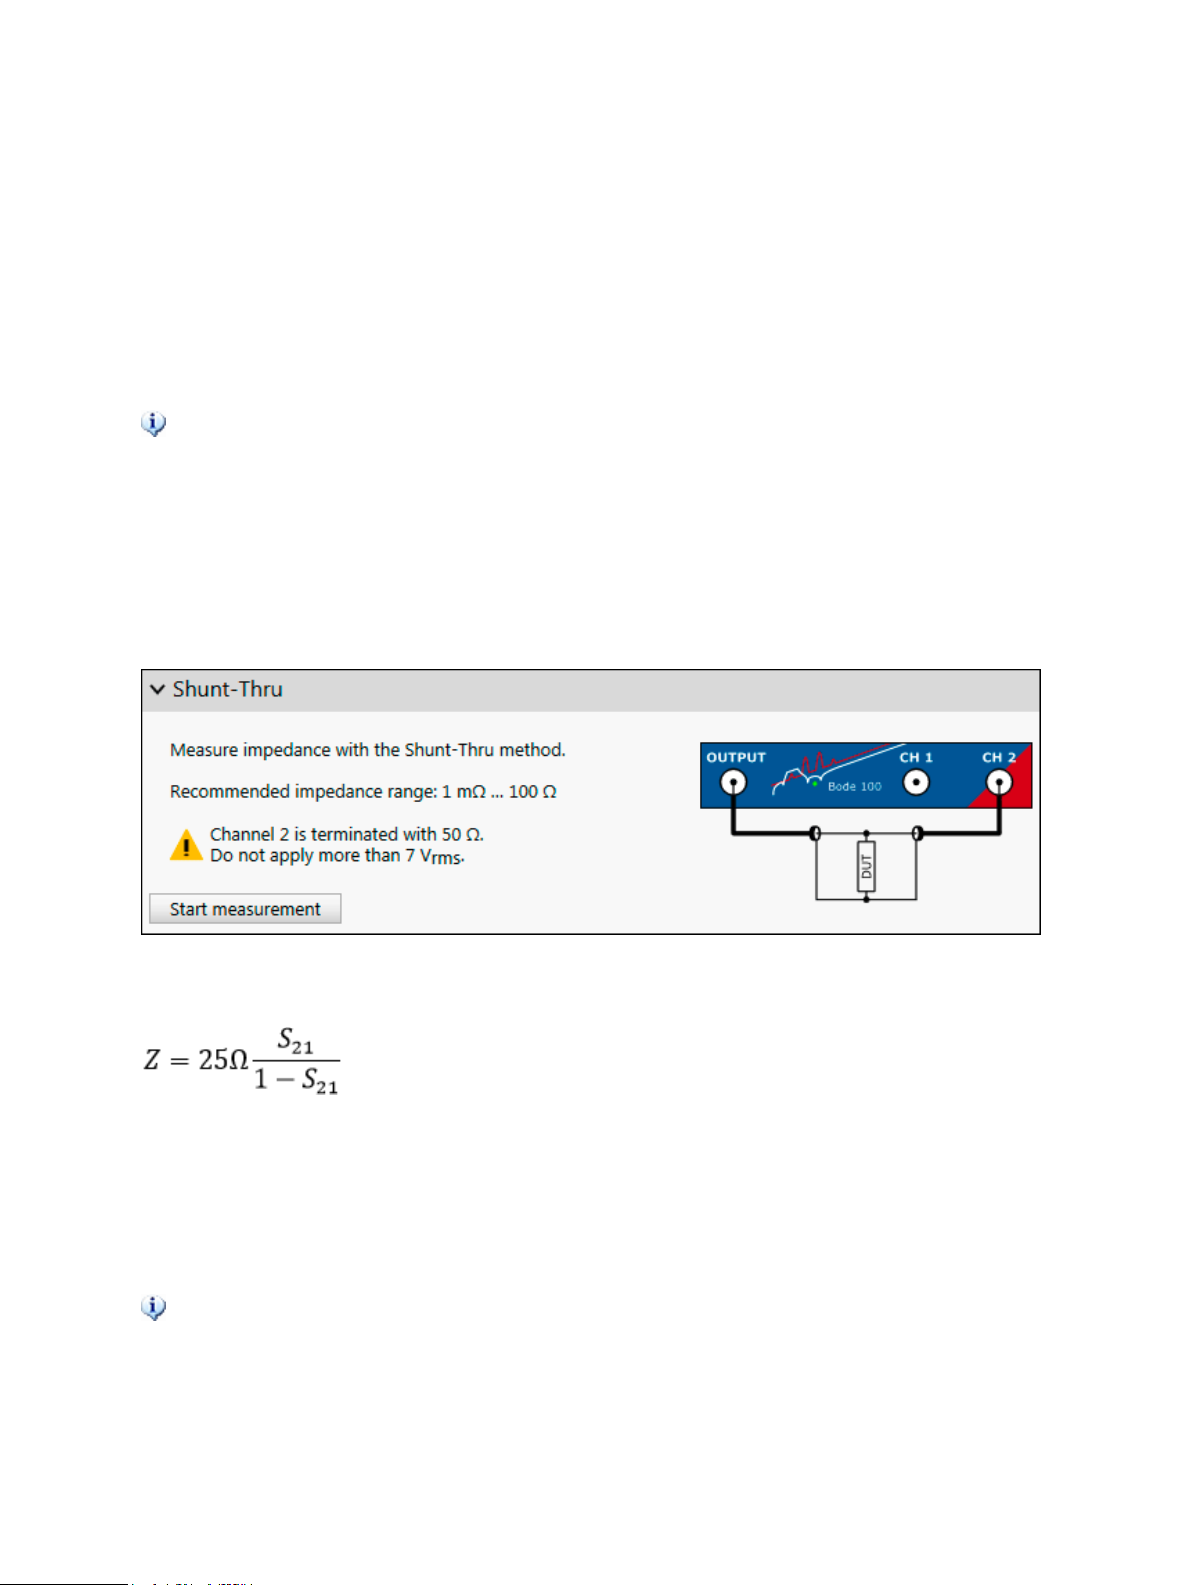
Congratulations you have successfully used the B-WIC impedance measurement adapter with the
Bode 100. You can load the settings for the measurement by clicking File → Open → and then
navigating to: "%APPDATA%\OMICRON Lab\Bode Analyzer Suite\Demo Files\".
The file you will need is: ImpAdapt_Inductor.bode3.
Attention: Since your setup will be different the file should only be used to explore the different
measurement formats offered by Bode 100. Before you execute an own measurement you will have
toperform a new calibration.
For a detailed measurement example using the impedance adapter measurement mode to
measure capacitors, please check out the ESR measurement application note at
www.omicron-lab.com/BodeManualAppNotes
7.4.3 Shunt-Thru
The Shunt-Thru measurement mode is especially suitable to measure very small impedance values. It
is basically an S21 transmission measurement in a special configuration. The impedance is calculated
from the measured S21 parameter.
Measurement information
Bode 100 measures S21 gain and calculates impedance Z using the equation:
The Shunt-Thru measurement configuration emulates a 4-wire kelvin connection. The output drives a
current thru the device under test that is shunted between the output signal and GND. Channel 2
measures the voltage drop that occurs at the DUT. This measurement mode offers highest sensitivity
for low-impedance value DUT. The recommended impedance measurement range starts at roughly
1 mΩ. With amplifiers or pre-amplifiers also µΩ measurements can be performed.
Shunt-Thru measurement configuration offers low sensitivity for high impedance DUTs. It is not
recommended to measure impedance values much higher than 100 Ω.
The Shunt-Thru configuration inherently suffers a ground-loop error at low frequencies. The
current flowing thru the cable shield of the connection to Channel 2 ground introduces a
measurement error that can become significant at frequencies below 10 kHz when
measuring very low impedance values. To suppress respectively reduce the ground-loop
error at low frequencies, use a common-mode choke or common-mode transformer.
64
OMICRON Lab

Measurement types and applications
Calibration
The Shunt-Thru measurement is basically a Gain measurement that is transformed to an impedance.
Therefore two calibrations are possible. Either a Thru-calibration or an Open, Short, Load calibration.
Thru calibration calibrates the underlying S21 measurement and removes the effect of the cable
connection to the DUT.
Open, Short, Load calibration shifts the reference plane directly to the calibration plane.
For more details on calibrating a Shunt-Thru measurement, please refer to 8.3.4 Calibrating a Shunt-
Thru or Series-Thru measurement on page 84.
Typical applications
A typical application for the Shunt-Thru measurement mode is the ESR measurement of ultra-low ESR
decoupling caps.
7.4.4 Shunt-Thru with series resistance
Shunt-Thru with series resistance is very similar to the normal Shunt-Thru measurement mode. For
more details regarding the normal Shunt-Thru measurement mode, please see 7.2.3 Shunt-Thru on
page 64.
Measurement information
Bode 100 measures S21 gain and calculates impedance Z using the equation:
Compared to the normal Shunt-Thru measurement mode, the series resistors increase the maximum
measurable impedance. This is of advantage when one needs to measure from roughly 10 mΩ to
some kΩs.
The higher the series Resistors Rs are chosen, the higher the maximum recommended impedance is.
However, at the same time the lower impedance limit rises.
OMICRON Lab
65
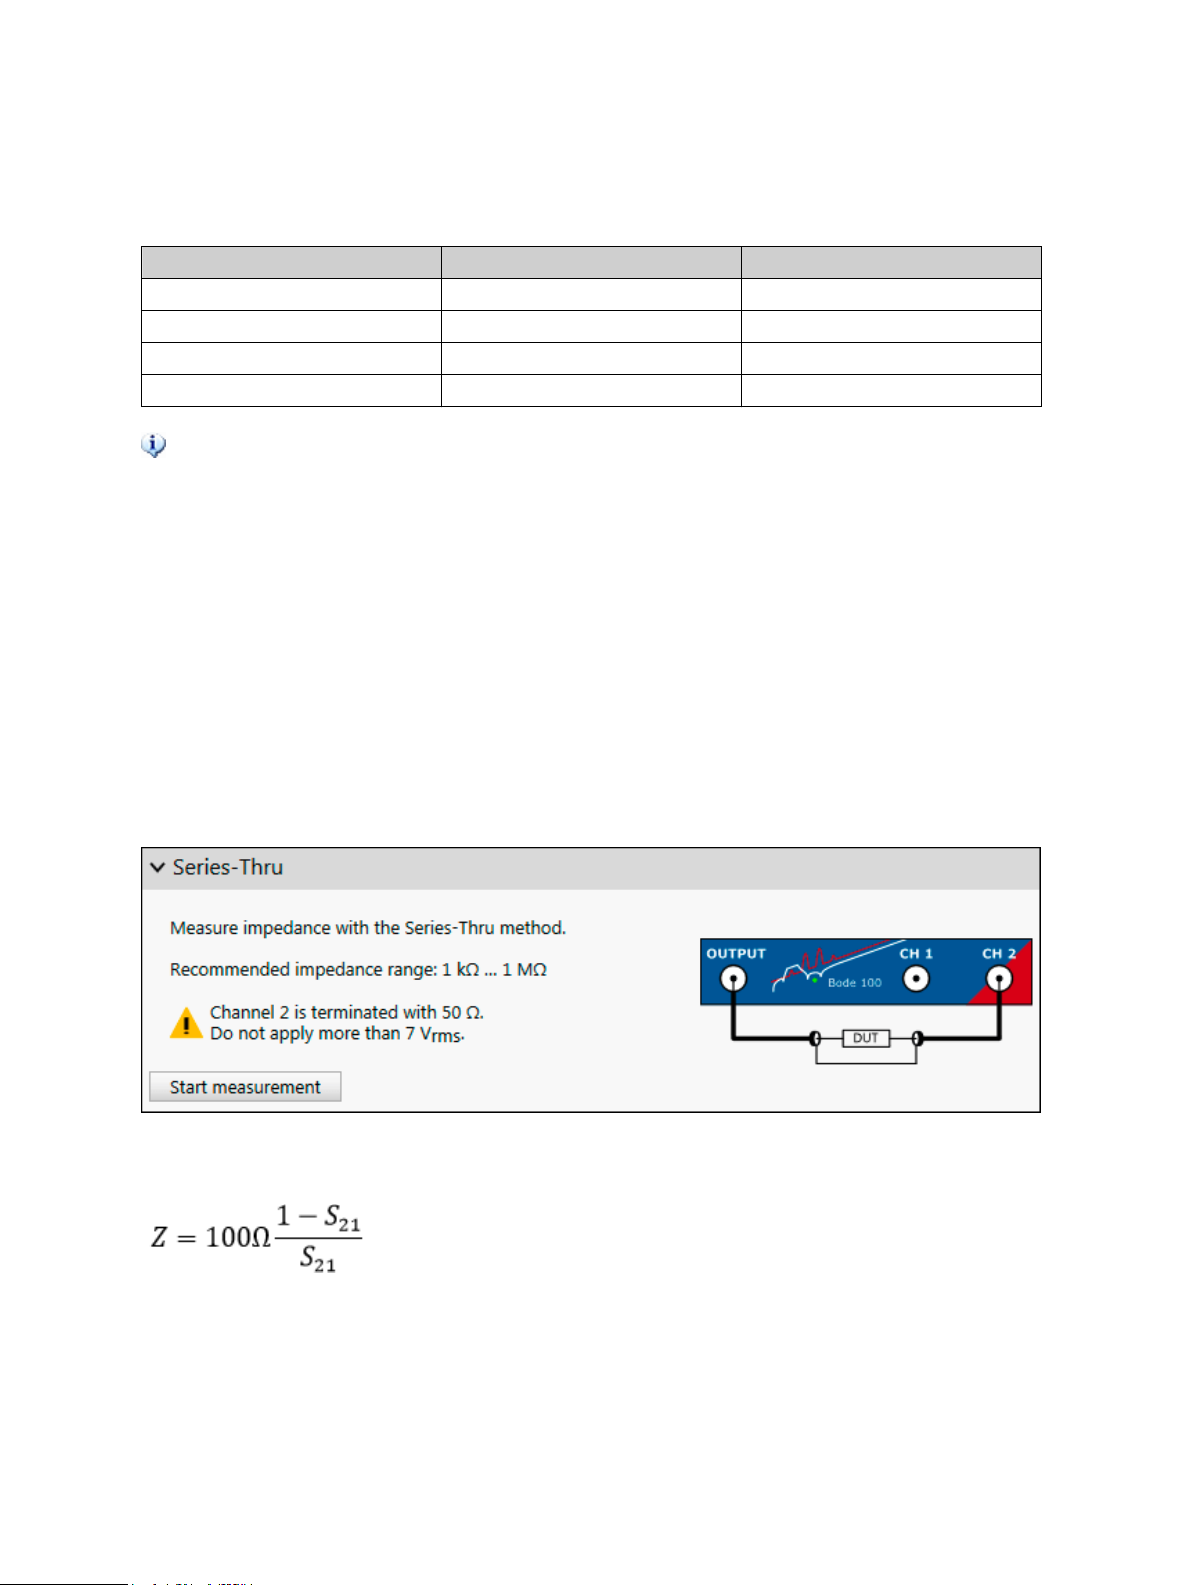
The following table shows some Rs values and their influence on the impedance measurement range:
Series Resistor Rs Lower Z Limit Upper Z Limit
200 Ω 5 mΩ 1125 Ω
450 Ω 10 mΩ 2250 Ω
499 Ω 11 mΩ 2480 Ω
950 Ω 20 mΩ 4500 Ω
The Shunt-Thru with series resistor configuration suffers from the same systematic error as
the normal Shunt-Thru configuration. Please refer to 7.2.3 Shunt-Thru on page 64 for more
details about the cable-braid-error.
Calibration
The Shunt-Thru with series resistor measurement requires at least one Thru calibration.
Thru calibration must be performed with the series resistors included.
For more details on calibrating a Shunt-Thru measurement, please refer to 8.3.4 Calibrating a Shunt-
Thru or Series-Thru measurement on page 84.
7.4.5 Series-Thru
The Series-Thru measurement configuration is especially suitable to measure very high impedance
values. It is basically an S21 transmission measurement in a special configuration. The impedance is
calculated from the measured S21 parameter.
Measurement information
Bode 100 measures S21 gain and calculates impedance Z using the equation:
The Series-Thru configuration offers high sensitivity for high-impedance DUTs. Impedance values in
the MΩ region can be measured. Using an output amplifier further increases the upper impedance
measurement limit.
Shunt-Thru measurement configuration is not suitable for low-impedance DUTs. It is not
recommended to measure impedance values below roughly 1 kΩ.
One advantage of the series-thru connection is that a shielded test-setup can easily be constructed.
66
OMICRON Lab

Measurement types and applications
Calibration
The Series-Thru measurement is basically a Gain measurement that is transformed to an impedance.
Therefore two calibrations are possible. Either a Thru-calibration or an Open, Short, Load calibration.
Thru calibration calibrates the underlying S21 measurement and removes the effect of the cable
connection to the DUT.
Open, Short, Load calibration shifts the reference plane directly to the calibration plane.
For more details on calibrating a Series-Thru measurement, please refer to 8.3.4 Calibrating a Shunt-
Thru or Series-Thru measurement on page 84.
Typical applications
A typical application for the Series-Thru measurement is the measurement of DUTs with low
conductivity (high impedance).
7.4.6 Voltage/Current
The Voltage/Current measurement mode is basically a Gain measurement with external reference
similar to the Gain/Phase measurement mode. However, the fact that the Gain is treated as an
impedance result offers all impedance result formats such as L, C and Q calculations.
Measurement information
Bode 100 measures Gain and transforms it directly to impedance Z using:
The voltage/current measurement is very flexible. The usable impedance measurement range cannot
be generalized since it strongly depends on the used probes and connections. Using highly sensitive
current sensing, very high impedance values can be measured. Using very sensitive voltage
measurements, very low impedance values can be measured.
Calibration
The Voltage/Current measurement is basically a Gain measurement that is transformed to an
impedance. Therefore two calibrations are possible. Either a Thru-calibration or an Open, Short, Load
calibration.
Thru calibration calibrates the underlying gain measurement and removes gain and phase shifts of the
probes. A 1 Ω resistor is needed to perform a Thru calibration in the Voltage/Current measurement
mode.
Open, Short, Load calibration shifts the reference plane directly to the calibration plane.
OMICRON Lab
67

For more details on calibrating a Voltage/Current measurement, please refer to 8.3.5 Calibrating a
Voltage/Current measurement on page 86.
Typical applications
The Voltage/Current measurement is suitable for a high variety of measurement applications. It is the
mode of choice for every impedance measurement that measures voltage and current separately.
Typical measurements are:
• Input impedance measurement of active circuits such as power supplies.
• Output impedance measurement of active circuits such as power supplies.
Measurement example
For detailed measurement examples using the voltage/current measurement mode, please check out
the Non-Invasive stability application note at www.omicron-lab.com/BodeManualAppNotes.
7.4.7 External Bridge
The external bridge measurement mode offers you the possibility to use an arbitrarily designed
impedance measurement bridge specifically designed for your special purpose.
Calibration
The external bridge measurement mode requires impedance (open, short, load) calibration.
For more details on how to calibrate the an external bridge, please refer to 8.3.2 Calibrating an
External Coupler or External Bridge measurement on page 80.
Measurement information
The external bridge measurement mode is similar to the Impedance Adapter measurement mode but
allows you to change the channel termination and input attenuators to adjust them according to your
needs.
Measurement example
For a detailed measurement example using the external bridge measurement mode, please check out
the High-impedance measurement application note at www.omicron-lab.com/BodeManualAppNotes.
68
OMICRON Lab

Calibration
8 Calibration
This section explains how to compensate unwanted effects of the measurement setup and how to
improve the accuracy of your measurement results. Bode 100 offers the following possibilities to
calibrate a test setup or the device itself:
Factory calibration / adjustment
Bode 100 can be adjusted / re-calibrated at OMICRON. For details regarding this factory calibration,
please contact the OMICRON Lab support or your local OMICRON Lab contact.
Internal device calibration
In addition to the external software calibration Bode 100 features an internal device calibration that
compensates the device-internal signal path drift by performing internal measurements.
External calibration
External calibration can be used to compensate e.g. the frequency response of probes, cables or the
test setup. Depending on the used measurement mode Bode 100 offers Gain calibration as well as
Impedance calibration.
Hint: To achieve maximum accuracy, do not change the attenuators after having performed
an external calibration.
8.1 Internal device calibration
Internal device calibration is required by the system and is automatically performed at the first use of a
Bode 100 on a computer. Bode 100 performs an internal path compensation based on stable
reference elements in the device. The correction data is evaluated and stored on the PC for future
measurements. In the Bode Analyzer Suite the date of the last internal device calibration is shown in
the status bar .
It is recommended to re-perform the internal device calibration on a regular basis to improve
measurement accuracy especially when no external calibration is performed. Furthermore it
is necessary to start a new internal device calibration whenever the environmental
conditions, such as temperature, change.
Manually starting a new internal device calibration
To perform a new internal device calibration, move the mouse over the calibration indicator in the
status bar . A pop-up with a button appears:
Press the button Click here to perform a new internal device calibration and the device will start a
new internal calibration. The calibration takes roughly 1 min. During the calibration you cannot perform
any measurements with Bode 100.
OMICRON Lab
69

8.2 Performing a Gain Calibration
Gain calibration (also called Thru calibration) is used to remove the gain and phase error introduced
by the connections between the measurement instrument and the DUT in a gain or transmission
measurement.
To achieve maximum accuracy, do not change the attenuators after having performed an
external calibration.
Hint: Thru calibration can also be used in impedance measurements that are based on a
gain measurement. These measurement modes are e.g. Shunt-Thru, Series-Thru or Voltage/
Current. When performing a Thru calibration in such a mode, the underlying gain
measurement is calibrated and afterwards the calibrated gain result is transformed to
impedance.
Performing the calibration
In order to calibrate a gain measurement, please proceed as follows:
1. Build up the calibration setup. For details on the calibration setup, please see 8.2.1 Calibrating a
Transmission (S21) measurement on page 71 or 8.2.2 Calibrating a Gain/Phase
measurement on page 73.
2. In the Bode Analyzer Suite, click on the Gain calibration icon (either User-Range or Full-Range).
To learn more about the difference between User-Range and Full-Range calibration please check
8.3.1 Difference between Full-Range and User-Range calibration on page 87.
3. The calibration dialog opens and the calibration state shows Not Performed.
4. Ensure that the calibration setup is connected properly and press Start.
5. Wait until the calibration has completed and the calibration state shows Performed.
6. Close the calibration dialog.
70
OMICRON Lab

Calibration
7. The calibration icon now shows a green background fill.
This means calibration is activated.
8. You can now connect your DUT and perform a calibrated measurement.
8.2.1 Calibrating a Transmission (S21) measurement
This section shows how to calibrate a Gain, Transmission or S21 measurement performed in the
Transmission / Reflection measurement mode.
The Transmission / Reflection mode offers the possibility to measure Transmission and
Reflection sequentially.
Note: The gain or Thru calibration is only applied to the gain measurement. If you want to
calibrate the Impedance, Reflection or Admittance measurement, refer to 8.3.1 Calibrating a
Reflection or One-Port measurement (see page 78).
In the Transmission / Reflection measurement mode Channel 1 is not in use by default. Receiver 1 is
connected internally to the signal source through the internal reference. The Channel 2 termination is
set to 50 Ω, therefore by default the Gain result equals the transmission S-parameter S21 from the
OUTPUT port to the CH2 port. If you choose to measure with the External reference connection,
please refer to 8.2.2 Calibrating a Gain/Phase measurement on page 73.
OMICRON Lab
71

The following picture shows a typical transmission calibration setup. The DUT is replaced by a Thruconnector.
Figure 8-1: Gain, respectively Thru calibration setup in a transmission measurement.
The factory calibration of Bode 100 moves the reference plane exactly between two cables
of 0.5 m length. So you can measure S21 using the delivered cables having a well calibrated
test-setup.
72
OMICRON Lab

Calibration
8.2.2 Calibrating a Gain/Phase measurement
In this section you learn how to calibrate a gain measurement in the Gain/Phase measurement
mode.
The Gain/Phase measurement mode uses Channel 1 and Channel 2 of Bode 100 to measure the
transfer function of a DUT. Channel 1 must be connected to the input of the DUT and Channel 2 to the
output of the DUT. The transfer function of the DUT (complex gain) is then measured by dividing the
voltage at Channel 2 by the voltage at Channel 1.
The cables or probes that connect Channel 1 and Channel 2 to the DUT introduce a gain and phase
shift to the measurement signal.
The connection introduces a measurement error if the gain and phase shift of the two probes or cables
is not identical.
A gain respectively Thru calibration removes the gain and phase error that is caused by non-similar
probes or connections.
The following pictures show a typical gain calibration setup with BNC cables. Both channels are
connected to the same signal.
Figure 8-2: Thru calibration setup for gain/phase measurement with BNC cables.
The following picture shows a typical gain calibration setup using external voltage probes. Both probes
must be connected to the same signal during Thru calibration.
OMICRON Lab
73
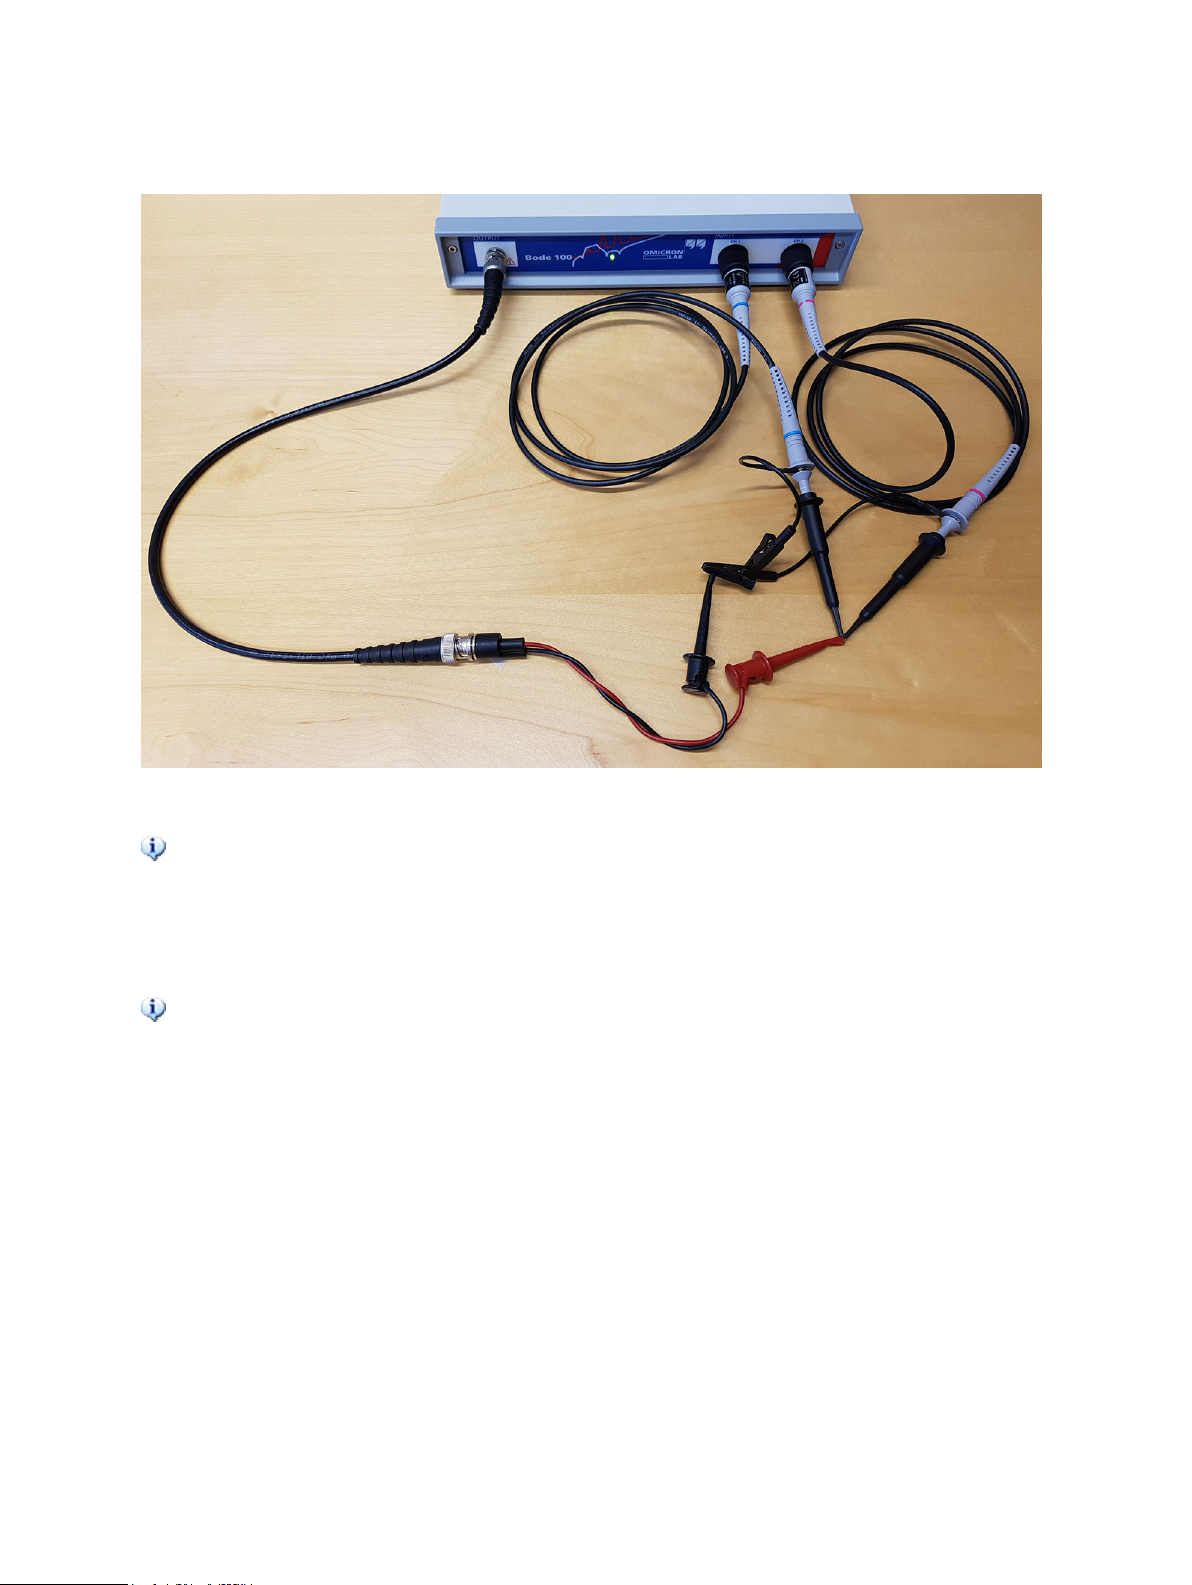
Figure 8-3: Thru calibration setup for gain/phase measurement using scope probes.
Hint: If you use external scope probes, you can also adjust the probes manually using the
compensation screw at the probe tip. To do so, perform a continuous gain/phase sweep over
the frequency range of interest and adjust the probe compensation until you receive a flat
0 dB and 0 ° line. Mark the probes with Channel 1 and Channel 2 such that you can re-use
the similarly adjusted probes.
Hint: When measuring a transfer function directly in a circuit you can always check your
calibration by connecting both probes to the same point in the circuit. The result must show
0 dB and 0 °. Please note that this measurement might be influenced by additional noise
from the circuit.
74
OMICRON Lab
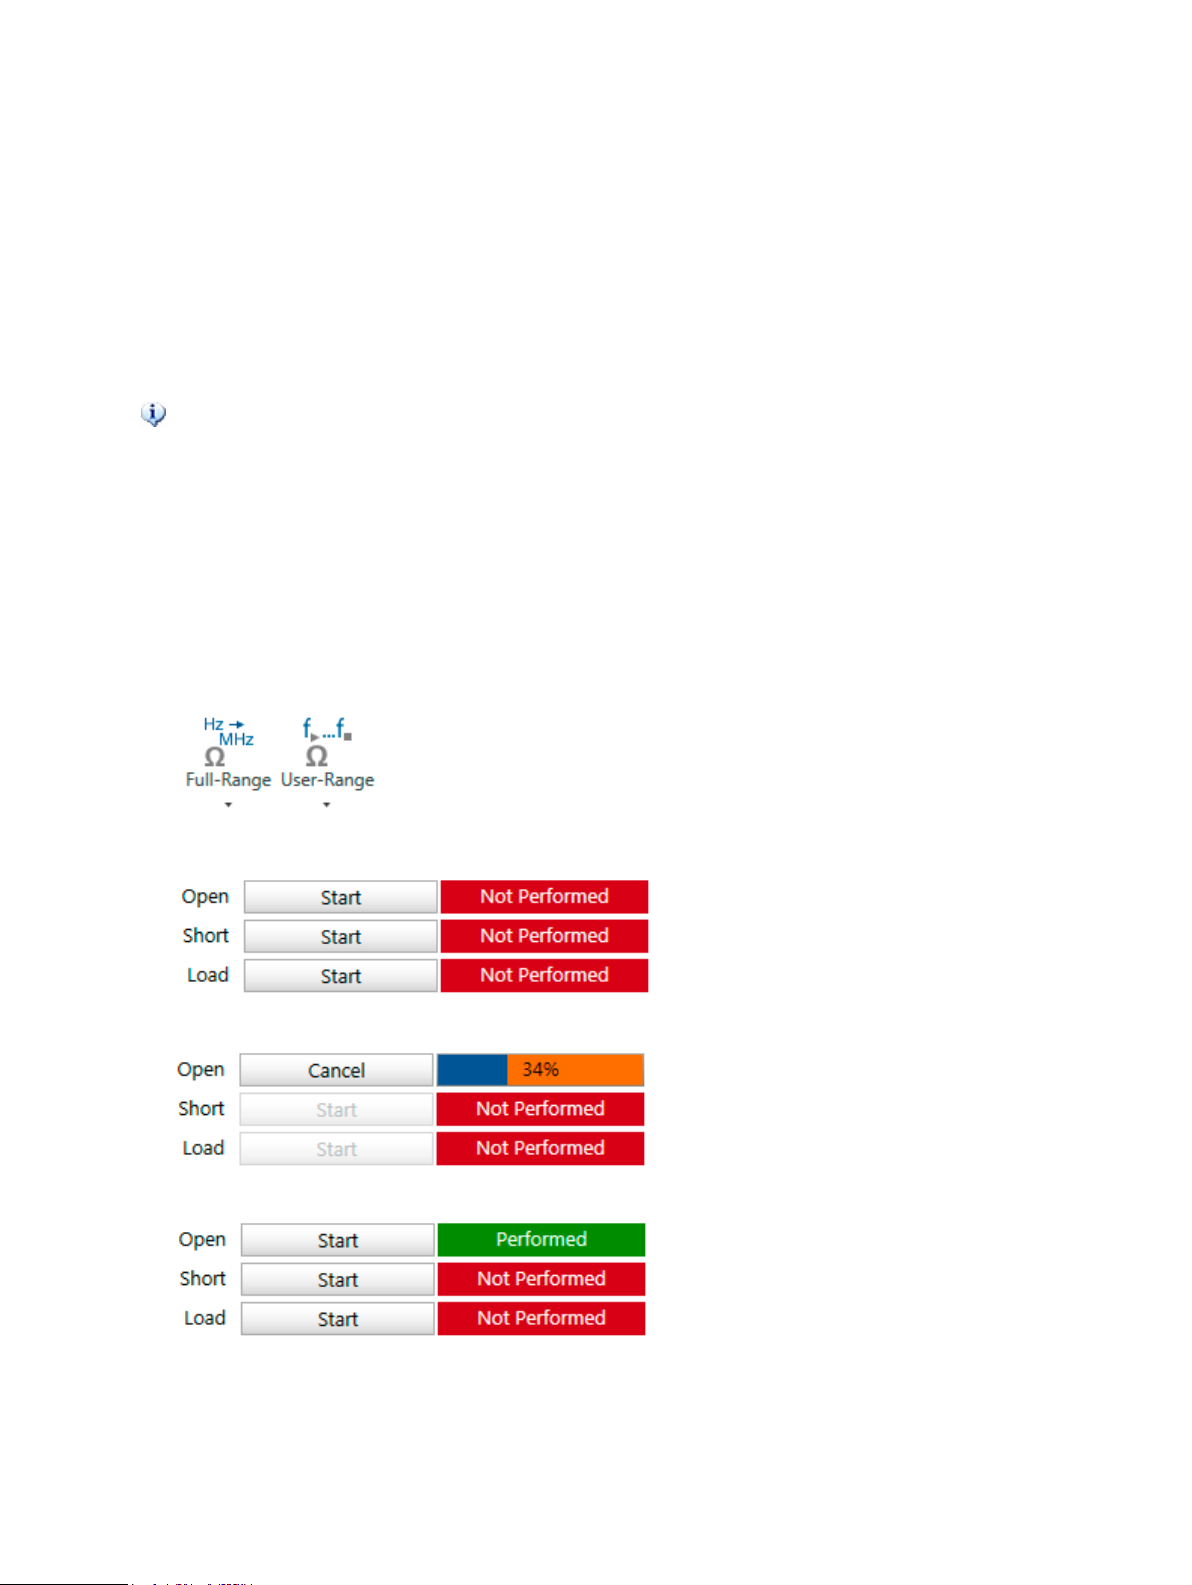
Calibration
8.3 Performing an Impedance Calibration
Impedance calibration (also called Open/Short/Load calibration or OSL calibration) can be used to
compensate the parasitics of a measurement setup such as an external directional coupler or a
measurement bridge. Furthermore it can be used to shift the reference plane of a one-port reflection
measurement from the Bode 100 output port to the end of a cable of arbitrary length. This is achieved
by measuring known Open, Short and Load elements.
To achieve maximum accuracy, do not change the attenuators after having performed an
external calibration.
Performing a Open/Short/Load calibration
In order to perform an Open/Short/Load calibration please proceed as follows:
1. Build up the calibration setup. For details on the correct calibration setup, please check the
following chapters.
2. In the Bode Analyzer Suite, click on an Impedance calibration icon (either User-Range or FullRange). To learn more about the difference between Full-Range and User-Range calibration
please see 8.3.1 Difference between Full-Range and User-Range calibration on page 87.
3. In the calibration dialog, the calibration state shows Not Performed for all three calibration points.
Connect the Open calibrator and press Start.
Wait until the Open calibration has completed and the calibration state shows Performed.
4. Connect the Short calibrator and press Start.
5. Connect the Load calibrator and press Start.
OMICRON Lab
75

6. Close the calibration dialog after Open, Short and Load have been performed.
7. The calibration icon now shows a green background fill.
This means that the calibration is active now. You can connect your DUT and perform a calibrated
measurement.
Advanced Settings in Open/Short/Load calibration
The calibration dialog offers an Advanced Settings region that can be unfolded by clicking on the
arrow .
76
OMICRON Lab
In the Advanced Settings region you can change the following values:
1. The Load Resistor value represents the value of the resistor used for Load calibration.
2. Short Delay Time is the time delay of the Short element used for Short calibration.
• The default settings for Load Resistor and Short Delay Time depend on the
measurement mode.
• If you change a value from its default a warning sign will be shown
• Changing Load Resistor or Short Delay Time will delete the corresponding calibration!
Calibration
OMICRON Lab
77
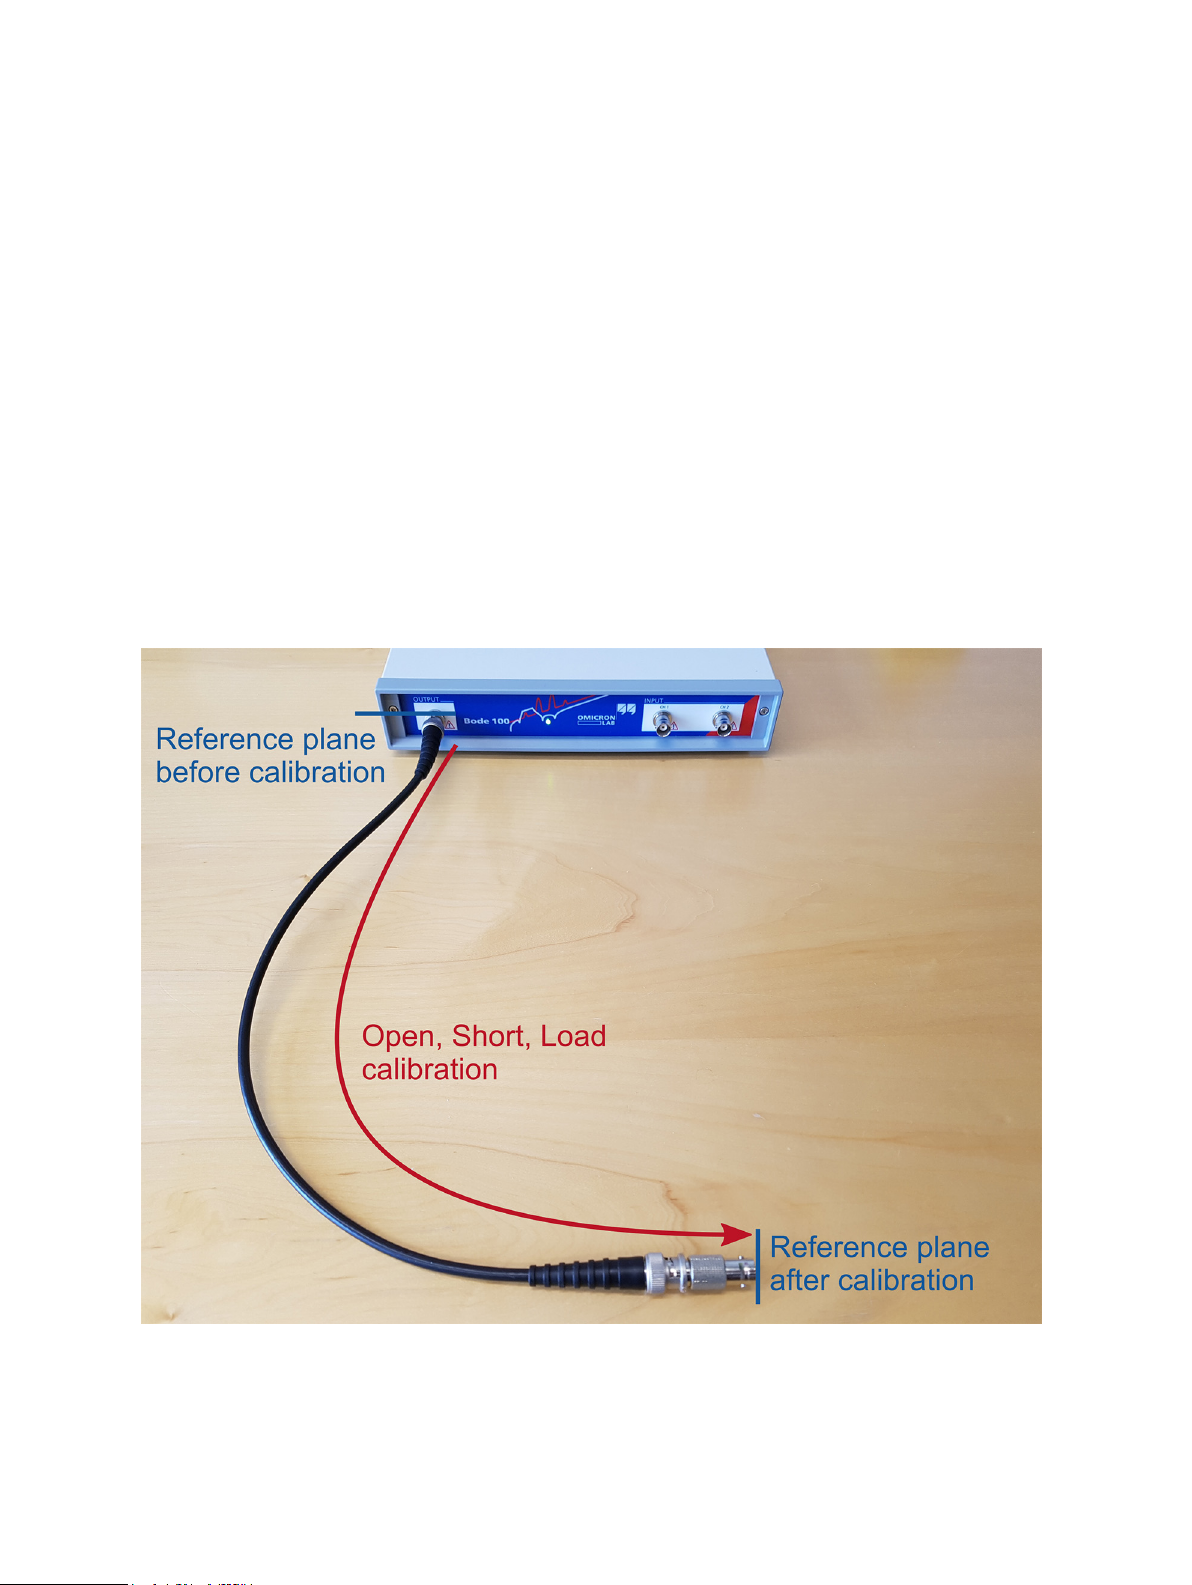
8.3.1 Calibrating a Reflection or One-Port Impedance measurement
In this section you learn how to calibrate an Impedance, Reflection or Admittance measurement in the
Transmission / Reflection measurement mode or in the One-Port impedance measurement
mode.
The Transmission / Reflection mode offers the possibility to measure Transmission and Reflection
sequentially. Please note that the Impedance (Open/Short/Load) calibration is only applied to a
Impedance, Reflection or Admittance measurement. If you want to calibrate a Gain measurement
please refer to 8.2.1 Calibrating a Transmission (S21) measurement (see page 71).
In the Transmission / Reflection measurement mode or in the One-Port impedance measurement
mode both receivers are internally connected to the 50 Ω source resistance. Bode 100 is internally
calibrated such that it measures the Impedance/Reflection directly at the OUTPUT port of the device.
The reference plane is directly at the OUTPUT port (BNC connector).
When connecting a DUT with a coaxial cable, the cable introduces additional impedance and timedelay. To compensate these effects, the reference plane can be moved to the end of the cable by
performing an Open/Short/Load calibration at the end of the cable.
Figure 8-4: Shifting the reference plane by performing Open, Short and Load Calibration
78
OMICRON Lab
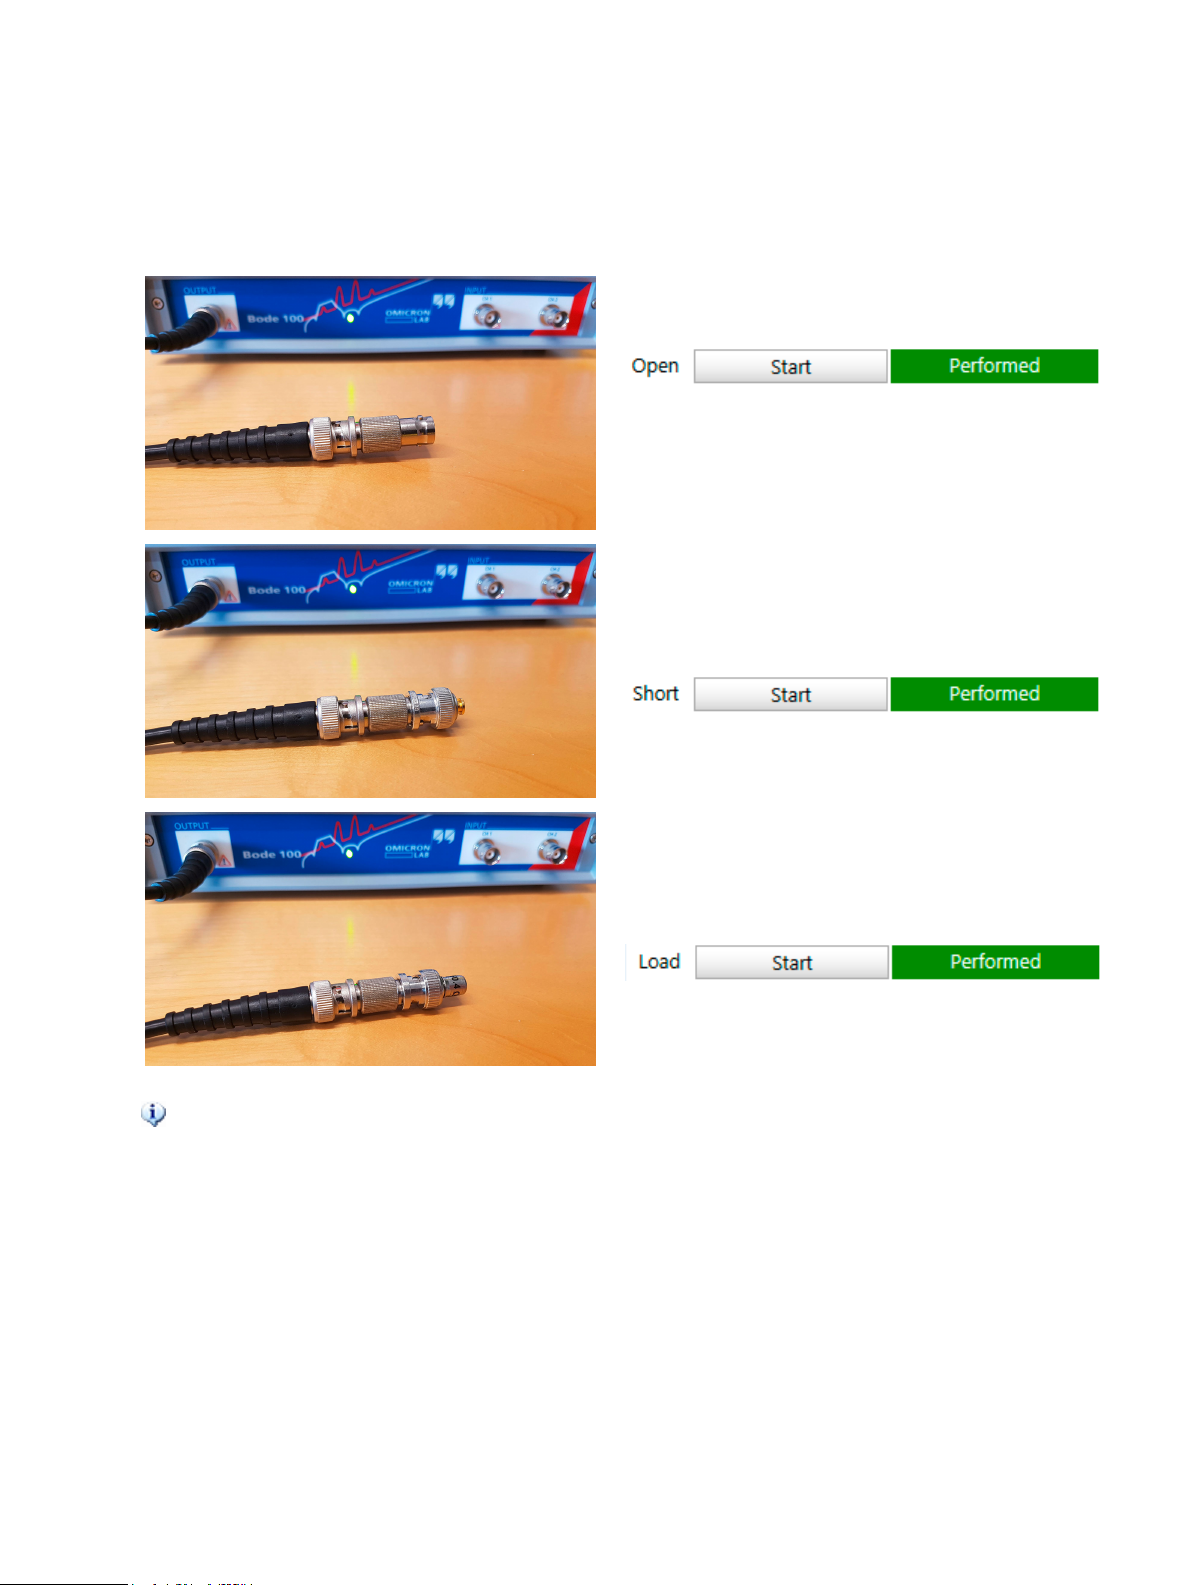
To do so, perform Open, Short and Load calibration
as shown in the pictures below:
Calibration
Connect Open and press Start.
Wait until the Open calibration has performed.
Check if your Short element fits to the Short
Delay Time Setting (50 ps default).
Connect Short and press Start.
Wait until the Short calibration has performed.
Check if your Load element fits the Load
Resistance Setting (50 Ω default).
Connect Load and press Start.
Wait until the Load calibration has performed.
Hint: The load delivered with the Bode 100 is marked with its exact impedance. You can
improve the calibration accuracy by entering this value in the Advanced Settings area.
The Short Delay Time in the Advanced Settings area has been chosen to match the Short
elements delivered with Bode 100. If your short is marked with Rosenberger you can set the
Short Delay Time to 40 ps, if it is marked with Radiall to 60 ps.
OMICRON Lab
79

8.3.2 Calibrating an External Coupler or External Bridge
measurement
In this section you learn how to calibrate an Impedance, Reflection or Admittance measurement in the
External Coupler measurement mode or in the External Bridge impedance measurement mode.
In the External Coupler measurement mode and the External Bridge impedance measurement
mode both receivers are connected to the input Channel 1 and Channel 2. Therefore all three ports of
Bode 100 must be used in these measurement modes.
A directional coupler or a resistive measurement bridge is never ideal and therefore introduces errors
caused by e.g. the frequency response of the coupler or bridge. By using Open, Short and Load
calibration, a Reference plane at the output of the coupler or bridge can be established such that all
frequency dependencies of the coupler or bridge are compensated. In the following example we show
how to remove an external measurement bridge by performing Open, Short and Load calibration at
the measurement port of the bridge. The same method can be applied to a directional coupler having
forward and reflected ports.
The External Coupler measurement mode as well as the External Bridge measurement
mode require an impedance calibration. You cannot start a measurement without having
performed Open, Short and Load calibration.
Figure 8-5: Removing a coupler / bridge by performing Open, Short and Load Calibration
80
OMICRON Lab
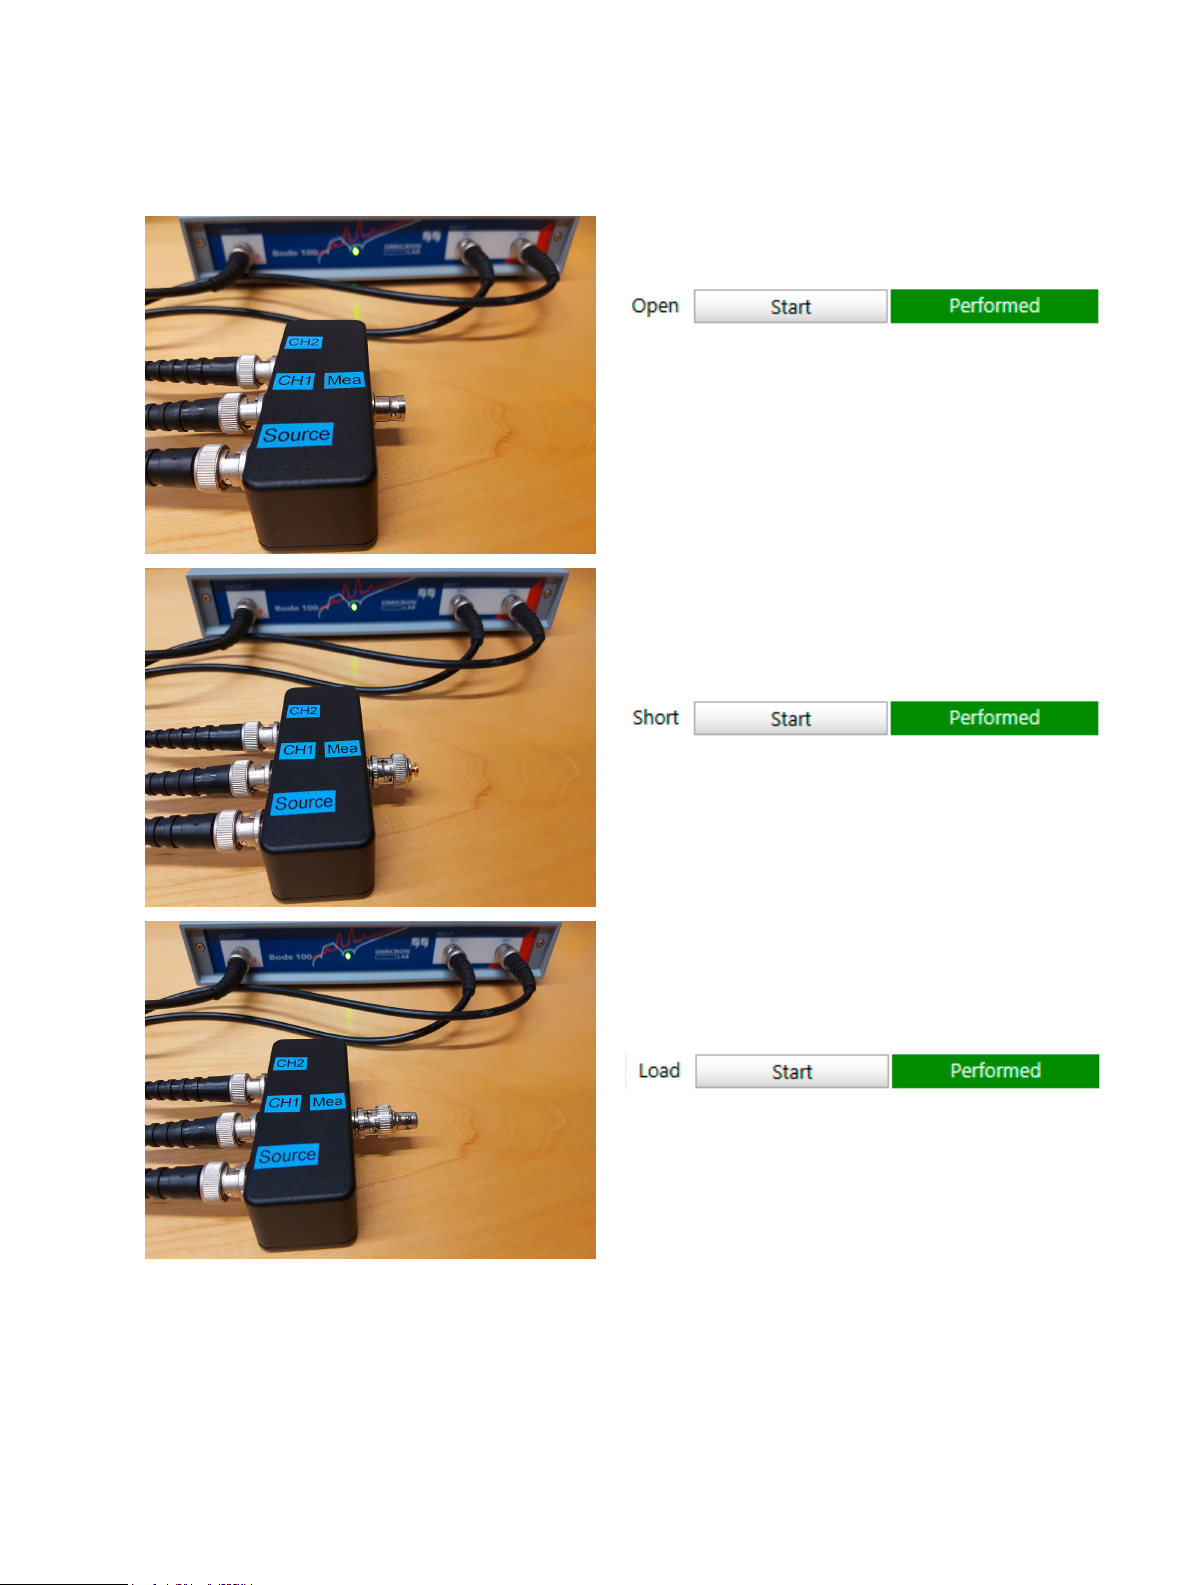
Calibration
Connect Open and press Start .
Wait until the Open calibration has performed.
Check if your Short element fits to the Short
Delay Time Setting (50 ps default).
Connect Short and press Start.
Wait until the Short calibration has performed.
OMICRON Lab
Check if your Load element fits the Load
Resistance Setting (50 Ω default).
Connect Load and press Start.
Wait until the Load calibration has performed.
81

8.3.3 Calibrating an Impedance Adapter measurement
In this section you learn how to calibrate an Impedance, Reflection or Admittance measurement in the
Impedance Adapter measurement mode.
In the External Coupler measurement mode and the External Bridge impedance measurement
mode both receivers are connected to the input Channel 1 and Channel 2 at the front panel of
Bode 100.
The Impedance Adapter measurement mode is designed for component impedance measurements
performed with the B-WIC and B-SMC impedance test-fixtures from OMICRON Lab.
B-WIC and B-SMC contain a resistive measurement bridge, which is specifically optimized for
Bode 100.
The Impedance Adapter measurement mode requires impedance calibration. You cannot
start a measurement without having Open, Short and Load calibration performed.
Figure 8-6: Calibrating the B-WIC impedance test fixture by performing Open, Short and Load
Calibration
The following pictures show how to perform Open, Short and Load calibration steps for the B-WIC and
B-SMC impedance test fixtures. Note that in the Impedance Adapter measurement mode the default
value for Load Resistor is 100 Ω and the default value for Short Delay Time is 0 ps.
82
OMICRON Lab

Open (B-WIC) Open (B-SMC)
Short (B-WIC) Short (B-SMC)
Calibration
Load (B-WIC) Load (B-SMC)
OMICRON Lab
83

8.3.4 Calibrating a Shunt-Thru or Series-Thru measurement
In this section you learn how to calibrate an Impedance, Reflection or Admittance measurement in the
Shunt-Thru or Series-Thru measurement mode.
Shunt-Thru and Series-Thru are based on a S21 Transmission measurement. Bode 100 measures
S21 and the Bode Analyzer Suite calculates impedance from the S21 measurement. Details on the
calculation can be found in 7.2.3 Shunt-Thru on page 64 and 7.2.5 Series-Thru on page 66.
You can either calibrate the underlying S21 measurement using Thru calibration or you can use Open/
Short/Load calibration to move the reference plane directly to the DUT.
Shunt-Thru and Series-Thru allow both, Thru or Open/Short/Load calibration.
However, only one calibration can be active at a time!
Even if both calibrations have been performed only one calibration is applied.
You must select the calibration you want to apply using the slider in the calibration dialog.
If the arrow points to the left, Thru calibration is applied.
If the arrow points to the right, Open/Short/Load calibration is applied (see example below).
Shunt-Thru calibration connections
Calibrating Thru:
Thru calibration can e.g. remove the gain and
phase error introduced by the connection cables
including a coaxial common mode transformer
that is generally used in this measurement to
suppress the cable-braid error.
Calibrating Open/Short/Load:
84
Open calibration.
OMICRON Lab

Calibration
Short calibration.
Note that the inductance of the short connection
is assumed to be zero. Short Delay Time is 0 s by
default. This means that inductance of the short
connection will be subtracted from the
measurement result. This might be important to
consider when you try measuring several nH of
parasitic inductance.
Load calibration.
Default Load Resistor value is 50 Ω.
Series-Thru calibration connections
Calibrating Thru:
Calibrating Open/Short/Load:
Thru calibration can e.g. remove the gain and
phase error introduced by the connection cables.
Open calibration.
Note that the capacitance of the Open is
assumed to be zero. If you try to measure very
low capacitance, the parasitic capacitance of the
Open can introduce an error. Try keeping it as
small as possible.
Short calibration.
Note that the inductance of the short connection
is assumed to be zero. Short Delay Time is 0 s by
default.
OMICRON Lab
85

Load calibration.
Default Load Resistor value is 50 Ω.
For more details and practical examples on how to perform calibration in the Shunt-Thru or SeriesThru measurement mode, please refer to the corresponding application notes on www.omicron-
lab.com.
8.3.5 Calibrating a Voltage/Current measurement
In this section you learn how to calibrate an Impedance, Reflection or Admittance measurement in the
Voltage/Current measurement mode.
The Voltage/Current measurement mode is based on an Gain measurement. Bode 100 measures
Gain from Channel 1 to Channel 2. Impedance equals Gain if Channel 1 receives a current signal and
Channel 2 receives a voltage signal. The Bode Analyzer Suite allows to either calibrate the underlying
Gain measurement using Thru calibration or to use Open/Short/Load compensation to move the
reference plane directly to the DUT.
The Voltage/Current measurement allows both, Thru or Open/Short/Load calibration.
However, only one calibration can be active at a time!
Even if both calibrations have been performed only one calibration is applied.
You must select the calibration you want to apply using the slider in the calibration dialog.
If the arrow points to the left, Thru calibration is applied.
If the arrow points to the right, Open/Short/Load calibration is applied (see example below).
Voltage/Current calibration connections
Calibrating Thru:
86
Use a 1 Ω resistor for Thru calibration. 1 Ω results
in 1 V/A. Thru calibration can e.g. remove the
gain and phase error introduced by the probes.
However, it does not correct for systematic
measurement errors in the measurement setup
such as a voltage drop on the current probe or
the current flowing through the voltage probe.
These errors cannot be removed by one
calibration measurement. In such a case you can
use Open/Short/Load calibration to reduce these
errors.
OMICRON Lab

Calibrating Open/Short/Load:
Calibration
Open calibration.
Short calibration.
Note that the inductance of the short connection
is assumed to be zero. Short Delay Time is 0 s by
default.
Load calibration.
Default Load Resistor value setting is 50 Ω.
For more details and practical examples on how to perform calibration in the Voltage/Current
measurement mode, please refer to the corresponding application notes on
www.omicron-lab.com.
8.4 Further calibration information
8.4.1 Difference between Full-Range and User-Range calibration
Full-Range calibration and User-Range calibration differ only in the frequencies that are used to
measure the correction factors.
Full-Range calibration measures the correction factors over the "full" frequency range of the
instrument at factory-predefined frequencies.
User-Range calibration measures the correction factors at exactly the same frequency range and
frequency points that are used in the measurement currently configured by the user.
OMICRON Lab
87

Figure 8-7: User-Range calibration; measurement frequencies and calibration frequencies are
congruent.
Figure 8-8: Full-Range calibration; correction factors are interpolated at measurement frequencies.
If Full-Range calibration is applied, the correction factors are available at the pre-defined frequencies
only. Correction factors for the measurement frequencies are calculated by interpolating between the
measured points.
Full-Range calibration is by default performed from 10 Hz to 50 MHz. If you need to calibrate
below 10 Hz, check out 8.3.4 Full-Range calibration below 10 Hz on page 90
In a single-frequency measurement the User-Range calibration will contain only one
frequency.
In a frequency sweep measurement the User-Range calibration contains exactly the same
amount of points as the sweep measurement.
Advantage of the Full-Range calibration
Full-Range calibration allows you to change the measurement frequencies without losing the
calibration. Since the correction values are interpolated, they can be interpolated for all frequencies
chosen in the measurement.
Advantage of the User-Range calibration
User-Range calibration does not use interpolation. The correction values are measured at exactly the
same frequencies as used in the measurement. This results in highest accuracy especially when using
long cables or narrow-band probes that show significant gain/phase shift in the measurement range.
User-Range calibration is deleted immediately when the measurement frequencies are
changed!
88
OMICRON Lab

Calibration
8.4.2 Enabling and disabling a calibration
After a calibration has been performed, the calibration is automatically activated by the Bode Analyzer
Suite. Since a calibration can be manually enabled or disabled, the calibration icons indicate the
current state of a calibration. In the following table the calibration states are explained based on the
Gain calibration. The same rules apply to impedance calibration:
Full-Range Gain calibration is not performed (not available) and not active.
The icon has no background fill and no border.
Full-Range Gain calibration has been performed and is active.
The green border indicates that the calibration is available (has been performed).
The green background fill indicates that the calibration is activated.
Full-Range Gain calibration is enabled but not active.
The green border indicates that the calibration is available (has been performed)
and was enabled by the user.
Since there is no background fill, the calibration is not active. This can happen if a
User-Calibration overrules the Full-Range calibration. Both calibrations have been
enabled but the software decides to use the User-Range calibration (see
information below).
Full-Range Gain calibration is available but not enabled and not active.
The gray border indicates that the calibration is available (has been performed) but
it is currently not enabled and therefore also not activated.
User-Range calibration and Full-Range calibration can be performed and activated at the
same time. However, if a valid User-Range calibration has been performed, the Bode
Analyzer Suite will automatically choose the User-Range calibration to be active.
Example:
OMICRON Lab
Both, Full-Range and User-Range Gain calibration have been
performed.
Therefore both calibration icons have a green border.
The software however chooses User-Range calibration to be active.
This is indicated by the green fill of the User-Range icon. By clicking on
the Full-Range calibration icon, the user could force the Full-Range
calibration to be active.
89
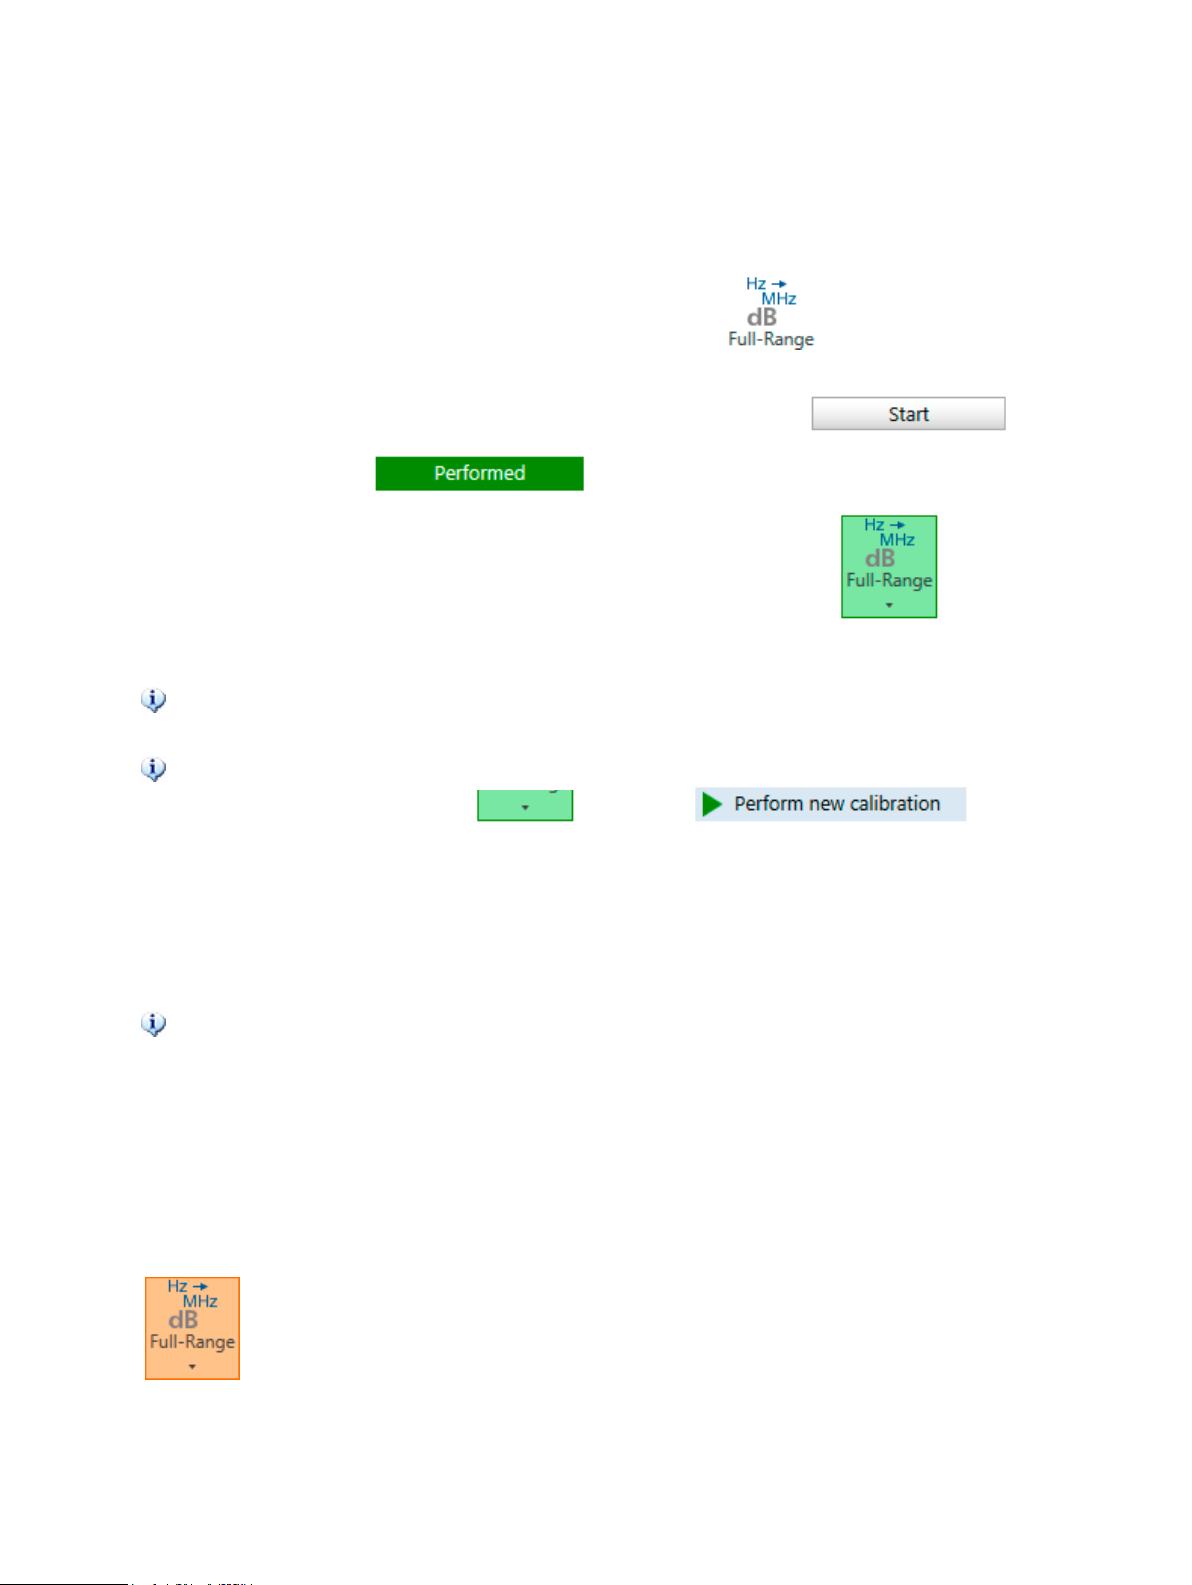
8.4.3 Re-performing a calibration
A calibration can be performed by clicking on the corresponding calibration icon in the Home ribbon.
• Clicking on a calibration icon (e.g. Full-Range Gain calibration ) opens the calibration
dialog
• The calibration measurement can be started by clicking the start button .
• After the calibration is the calibration dialog can be closed
• The calibration icon turns green indicating that the calibration is now active .
From now on, this calibration is used for the measurement.
A calibration can be disabled and enabled by clicking on its calibration icon.
To re-performed a calibration, open the calibration dialog by clicking on the arrow on the
bottom of the calibration icon . Then select .
Calibration can then be re-performed by pressing the Start button.
8.4.4 Full-Range calibration below 10 Hz
Full-Range calibration measures between 10 Hz and 50 MHz at factory pre-defined frequencies. FullRange calibration normally starts at 10 Hz to reduce calibration time.
If you decide that frequencies between 1 Hz and 10 Hz must be included in the Full-Range
calibration, you must set the Start Frequency to a value <10 Hz before executing the FullRange calibration.
Alternatively User-Range calibration might be more applicable in that case.
Full-Range calibration frequency range:
• If Start Frequency is set ≥10 Hz, then Full-Range calibration will run from 10 Hz to 50 MHz
• If Start Frequency is set <10 Hz, then Full-Range calibration will run from 1 Hz to 50 MHz
If a Full-Range calibration has been performed at a Start Frequency >10 Hz and Start
Frequency is changed to a value <10 Hz after calibration, the correction value at 10 Hz
will be extrapolated to 1 Hz. This is indicated by an orange Full-Range calibration icon.
Re-performing calibration will run the calibration from 1 Hz and the icon will turn green
again.
Note that the calibration takes significantly longer when it starts at 1 Hz.
90
OMICRON Lab

Calibration
8.4.5 Automatic deletion of calibration
In order to avoid false measurements or an invalid calibration, the Bode Analyzer Suite automatically
deletes calibration as soon as a setting makes the calibration invalid. The following lists show which
settings will delete a calibration when they are changed.
Deleting User-Range calibration
User-Range calibration is automatically deleted when one of the following settings is changed:
• Measurement frequencies (Start Frequency, Stop Frequency, Center Frequency, Span)
• Sweep Mode (Linear or Logarithmic)
• Number of Points (in the frequency sweep)
• Channel termination (1 MΩ or 50 Ω)
• Reference / receiver connection (Internal or External)
• External probe factor
Deleting Full-Range calibration
Full-Range calibration is automatically deleted when one of the following settings is changed:
• Channel termination (1 MΩ or 50 Ω)
• Reference / receiver connection (Internal or External)
• External probe factor
8.4.6 Saving calibration data
User-Range and Full-Range calibration data is saved to the .bode3 file.
The calibration data (correction values) as well as the calibration states (activated or not) are stored to
the file. When opening a bode-file the Bode Analyzer Suite attempts to load the external calibration
data and calibration states from the file.
The Bode Analyzer Suite attempts to load the calibration from the bode-file even when the
calibration has been performed with a different Bode 100 device.
Hardware incompatibilities between Bode 100 R1 and Bode 100 R2
• Full-Range calibration from Bode 100 R1 is not compatible to Full-Range calibration of
Bode 100 R2. Full-Range calibration will be deleted automatically when opening a bode-file
created with a different hardware revision.
• User-Range calibration is not compatible in the frequency range from 3 kHz to 30 kHz. A UserRange calibration that contains frequencies in that range will be deleted automatically when
opening a bode-file created with a different hardware revision.
OMICRON Lab
91

9 Bode Analyzer Suite functions
The following chapters contain information about important features of the Bode Analyzer Suite. Read
through these chapters to learn how to use Bode 100 efficiently.
9.1
The Bode Analyzer Suite supports a variety of possibilities to save measurement configurations and
measurement data. In the following these are explained in detail.
Exporting and saving measurement data or settings
9.1.1 Loading and saving the equipment configuration
You can store all settings of Bode 100 including the device configuration, measurement settings,
calibration and measurement data and the graphical display settings by clicking the Save toolbar
button.
This functionality allows you to store multiple equipment configurations for repetitive
measurement tasks. With the equipment configurations stored, you can load the respective
files for each measurement instead of setting the Bode 100 manually.
A file saved by the Bode Analyzer Suite 3 has the file extension .bode3. The Bode Analyzer Suite 3
supports loading files with the following file extensions:
• .bode3 files created with Bode Analyzer Suite 3
• .bodex files created with Bode Analyzer Suite 2.42 or 2.43
• .bodz files created with Bode Analyzer Suite 2.41
• .bode files created with Bode Analyzer Suite 2.41 or older
You can save and load .bode3 files on different Bode 100 devices. Note, however, that
calibration data might be deleted when opening the .bode3 file with a different hardware
revision. More details can be found in Hardware incompatibilities between Bode 100 R1 and
Bode 100 R2 on page 91.
9.1.2 Use the copy to clipboard functions to export data
The Bode Analyzer Suite offers several possibilities to quickly export data via the clipboard. The
following information can be copied to the clipboard to ease your documentation work:
• An image file of the result diagram
• The measured trace data
• The equipment settings in form of text
Copy a chart image to the clipboard
Right-click the chart or diagram you want to copy and select .
92
OMICRON Lab
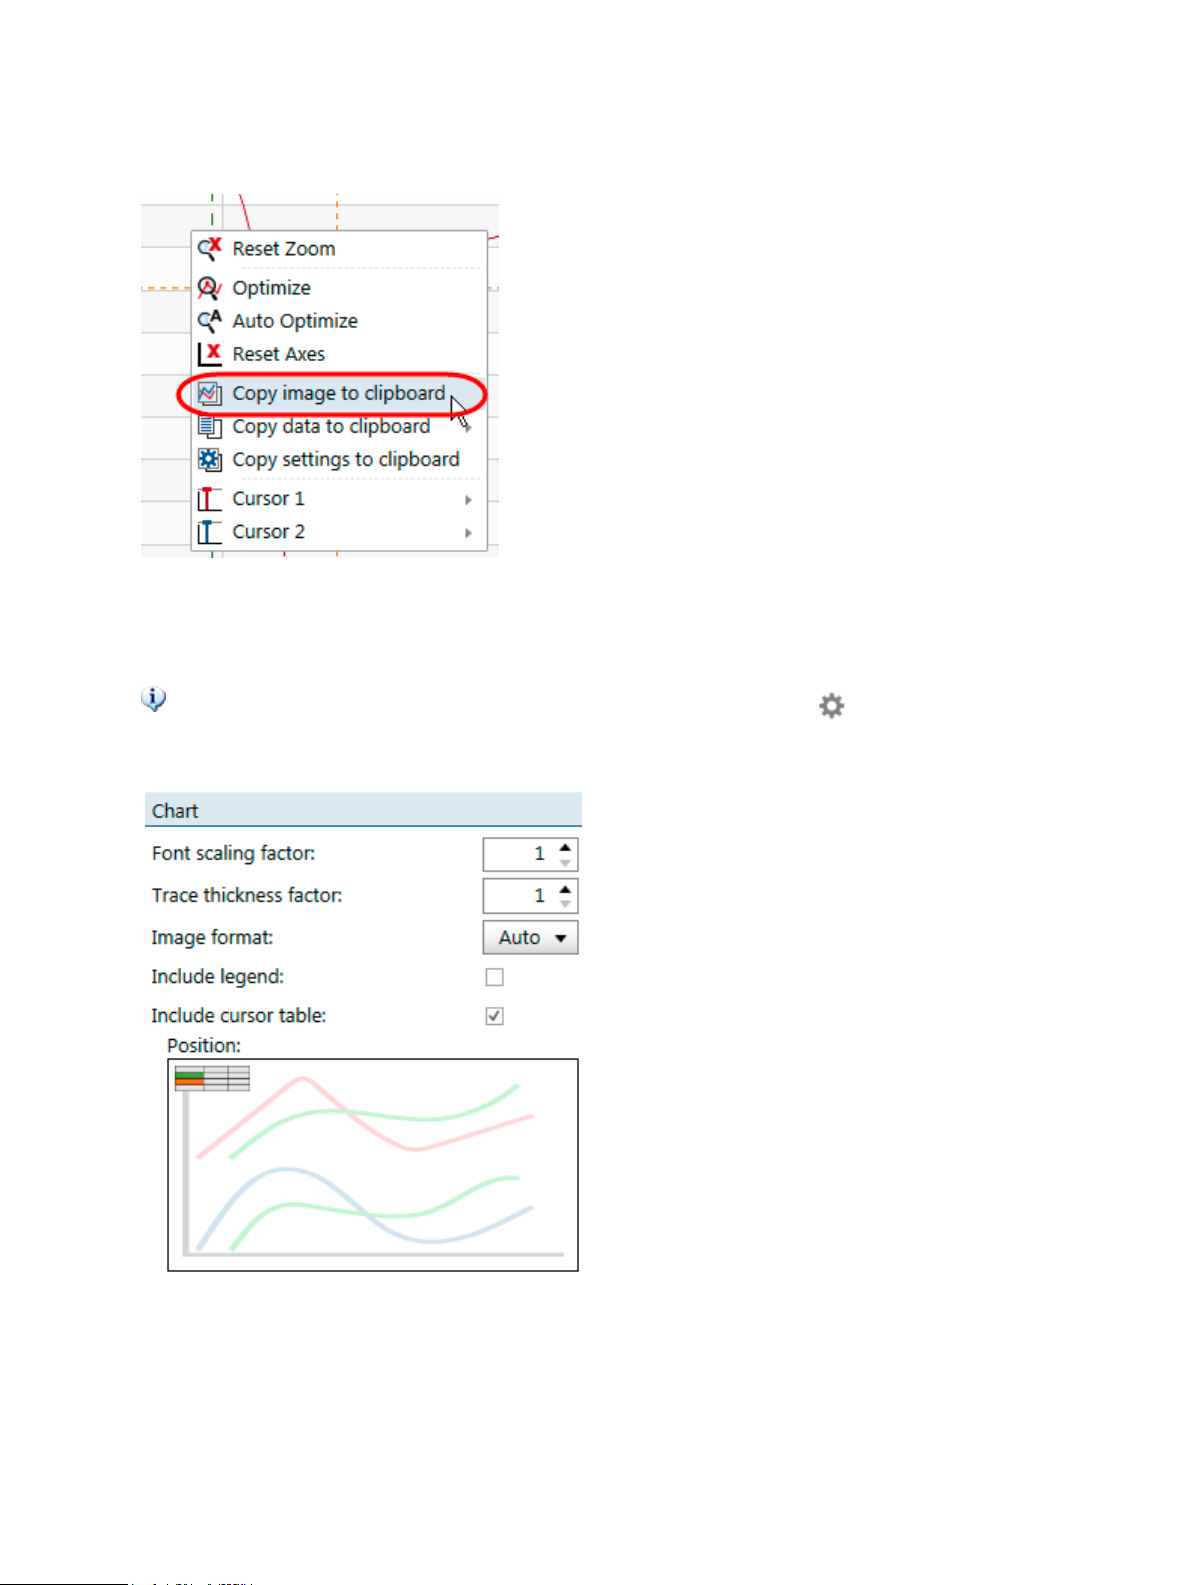
Bode Analyzer Suite functions
This will place an image file of the clicked diagram to the Microsoft Windows clipboard that can be
pasted to e.g. Microsoft Word. All frequency sweep charts, fixed frequency charts and the shaped
level chart can be copied as an image to the clipboard.
Hint: You can configure how the chart image looks like by using the Options →
Clipboard.
Font scaling factor: Use this number to increase
the font size of axis labels in the copied diagram.
Trace thickness factor: Use this number to
increase the weight of the trace line in the copied
diagram.
Image format: Bode Analyzer Suite will use the
vector graphics format EMF for the diagram image
if possible. In case you experience issues with the
EMF files, you can also change the image format
to PNG.
Include legend: Activate the checkbox to include
a legend. This is of advantage when multiple
traces are present in the diagram.
Include cursor table: Activate the checkbox to
include the cursor table in the copied image. In
addition you can specify the position of the cursor
table in the interactive picture below the checkbox.
OMICRON Lab
93
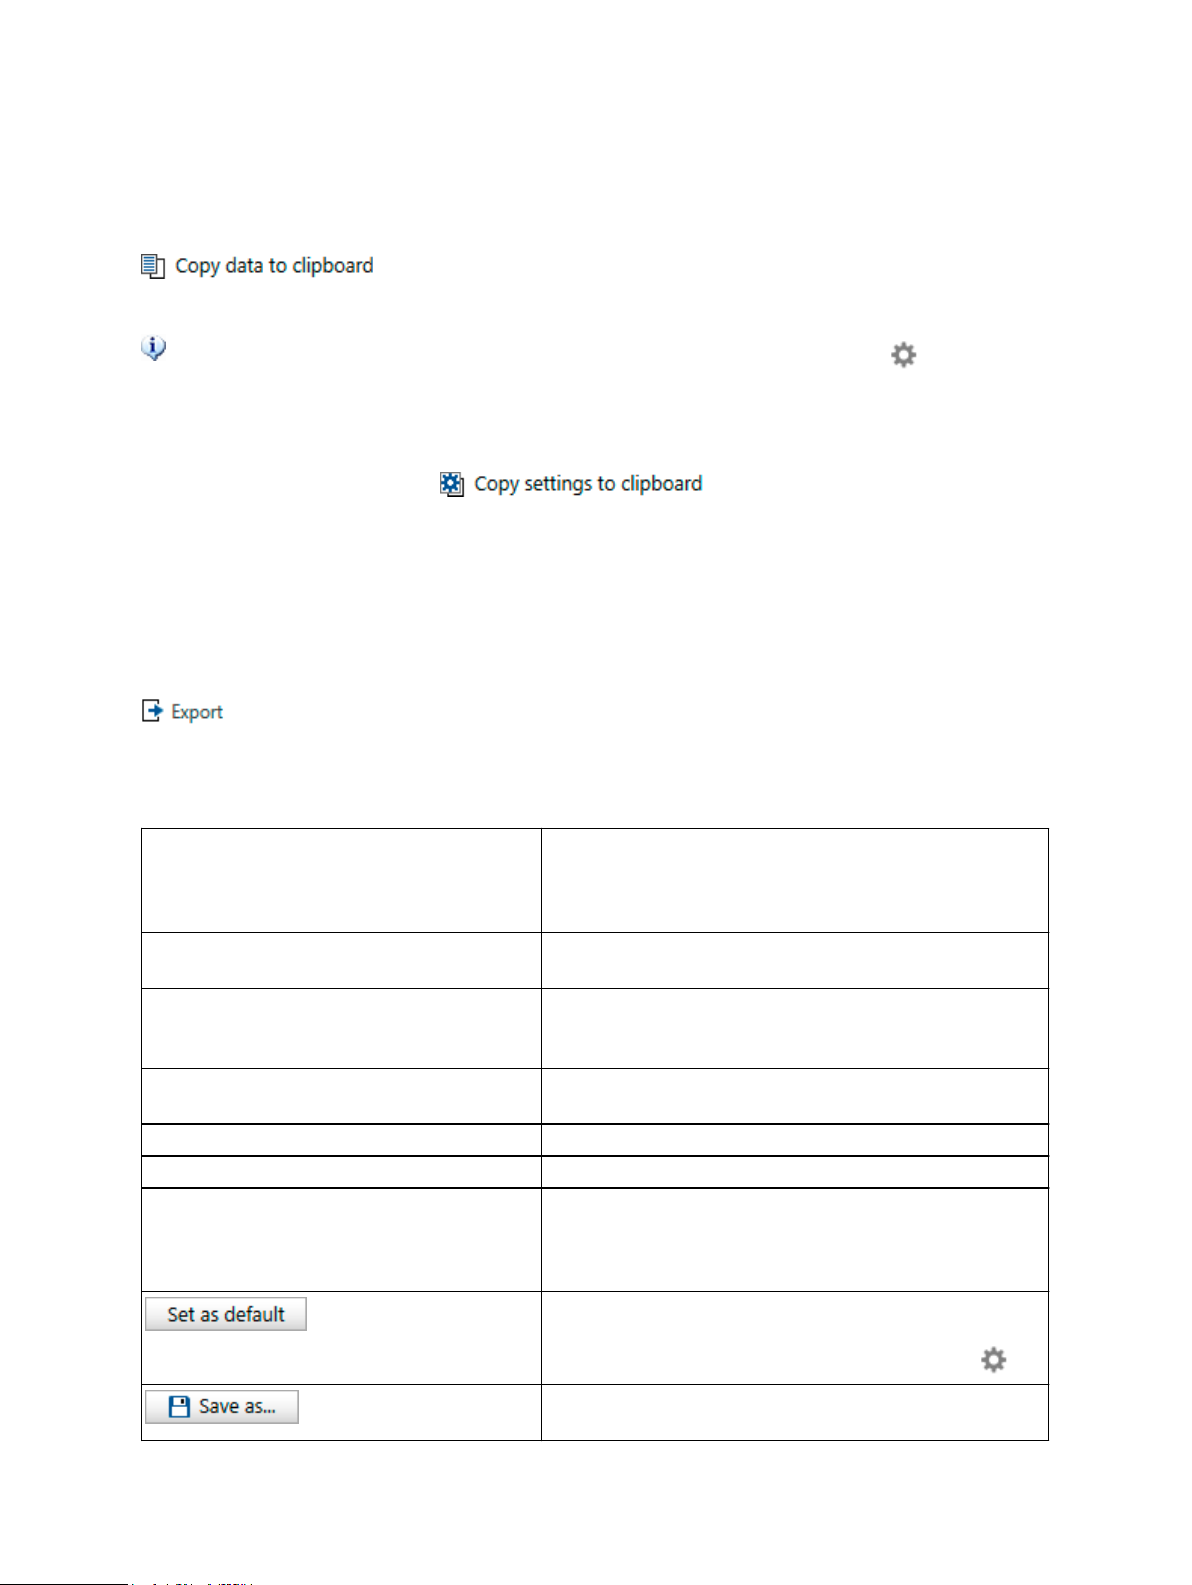
Copy trace data to the clipboard
Right-click either in the chart or directly on the trace name to copy the measured data to the clipboard.
Copied data can directly be pasted in a spreadsheet program for further
data processing.
Hint: You can configure the decimal separator and the field separator under Options →
Clipboard.
Copy settings to the clipboard
Right-click in the chart and select . This will copy a text block to the
clipboard that contains the current equipment settings. The text block is similar to the settings header
included in the CSV or Excel file export.
9.1.3 Exporting measurement data to CSV or Excel files
If you need to further process the measurement data the Bode Analyzer Suite offers to save the
measurement data either as a CSV file or in form of an Microsoft Excel compatible spreadsheet file. To
save your measurement data as a .csv or .xlsx file, click on the Export Icon in the Home ribbon
.
Exporting a CSV file
In the CSV export pane you can choose the following options:
Include settings header Include a header in the csv file that contains device
settings.
Note: The height of the header is not constant. Please
take care when parsing the csv file automatically.
Include active memory traces All memories that are currently visible in the Bode
Analyzer Suite will be exported to the csv file.
Include output level Includes the output level as the second column (after
frequency) of the csv file. Might be important for shaped
level measurements.
Include real & imaginary values Real and Imaginary are included independently of the
currently chosen display format in the GUI.
Decimal separator Choose your decimal separator of choice.
Field separator Configure the separator between two values / fields.
Open file after saving Activate this function to open the exported file with an
external program. When activated a text box appears
that allows you to choose your program file. Leave the
text box empty to use the default Windows program.
Press this button to store your settings for future
exports. You can find the default settings also in the
options dialog accessible in the main window via .
Press the Save as button to specify a file name and
save your export file.
94
OMICRON Lab
Bode Analyzer Suite functions
Exporting an Excel file
In the Excel export pane you can choose the following options:
Include settings header Include a header in the csv file that contains device
settings. Note: The height of the header is not constant.
Please take care when parsing the csv file
automatically.
Include active memory traces All memories that are currently visible in the
Bode Analyzer Suite will be exported to the csv file.
Include output level Includes the output level as the first column of the csv
file. Might be important for shaped level measurements.
Include real & imaginary values Real and Imaginary are included independently of the
currently chosen display format in the GUI.
Open file after saving Activate this function to open the exported file with an
external program. When activated a text box appears
that allows you to choose your program file. Leave the
text box empty to use the default windows program.
Press this button to store your settings for future
exports. You can find the default settings also in the
options dialog accessible in the main window via .
Press the Save as button to specify a file name and
save your export file.
OMICRON Lab
95

9.1.4 Generating a Touchstone file
Bode Analyzer Suite 3.0 offers the possibility to create Touchstone files from the measured data. This
offers you the possibility to use measured data directly in simulators that provide Touchstone import.
You can find the Touchstone export using the icon in the Home ribbon.
The Touchstone export pane offers the following options:
Network parameter Choose between S, Y and Z parameters.
Number of ports Either 1-Port or 2-Port touchstone file can be created.
Network data Select the measurement trace or memory trace data
that corresponds to the network parameter.
Bode Analyzer Suite does not check if the
data is valid. Please take care that you choose
the correct measurement for your network
parameters. If the frequencies of the traces or
memories are not equally spaced, they cannot
be selected since Touchstone only allows one
frequency column for all network parameters.
Network data format MA...Magnitude and Angle (Default)
DB...Magnitude in dB and Angle
RI...Real and imaginary
Frequency unit Select Hz, kHz, MHz or GHz. Hz is default.
Touchstone version Default is Touchstone V2. A Touchstone V2 file can be
saved under the extension .ts, .s1p or .s2p depending
on the number of ports. The file extension .ts is default.
A Touchstone V1 file has either the .s1p or .s2
extension.
Number format Choose SixDigitsFixed or SixDigitsScientific
Open file after saving Activate this function to open the exported file with an
external program. When activated a text box appears
that allows you to choose your program file. Leave the
text box empty to use the default Windows program.
Press this button to store your settings for future
exports. You can find the default settings also in the
96
options dialog accessible in the main window via .
Press the Save as button to specify a file name and
save your export file.
OMICRON Lab

Bode Analyzer Suite functions
9.1.5 Generate a PDF report
If you need to print a measurement report or save it as a PDF document, you can use the PDF export.
To do so, click the icon in the Home ribbon.
The PDF report pane offers the following options:
Include legend Activates a chart legend in the diagrams. This is of
advantage if you have many curves in the diagrams.
However it can reduce the diagram size slightly.
Include cursor table Activates an additional cursor table in the diagram.
Include shaped level Include information about the output level in the report.
Include comments Includes the text notes from the main window in the
report. Note: Only plain text is included in the report.
Use the CUSTOM template No: Bode Analyzer Suite automatically selects the
optimal report template for your measurement.
Yes: Bode Analyzer Suite uses the custom template that
can be modified.
Note: In this case the custom template will be used no
matter what type of measurement you perform and how
many charts are displayed in the main screen.
You can find the custom template file at:
%appdata%\OMICRON Lab\Bode Analyzer Suite
\ReportTemplates\template_sweep_custom_1.xlsx
Open file after saving Is activated by default. If you don't enter a program path
in the text field below, the default Windows program for
PDF files will be used to open your saved PDF report.
Press this button to store your settings for future
exports. You can find the default settings also in the
options dialog accessible in the main window via .
Press the Save as button to specify a file name and
save your report.
OMICRON Lab
97

9.2 Signal source settings
Signal source mode
The signal source of Bode 100 can be set two to different operation modes:
1. Auto off (default)
2. Always on
In Auto off mode, the source will be automatically turned off whenever it is not used, respectively
when a measurement is stopped.
In Always on mode the signal source stays on after a measurement has finished. This means that
e.g. the last frequency point in a sweep measurement defines the signal source frequency and level.
You can change the source mode either in the hardware setup or by moving the mouse over the
source indicator in the status bar .
The source indicator shows both, the current setting and if the source is on or off. A gray background
indicates that the source is switched off. A green background color indicates that the signal source is
running. The following states are possible:
Source mode is Auto off and source is currently off
Source mode is Auto off and source is currently on
Source mode is Always on and source is on
Source mode is Always on but source is still in off-state. Source will be
switched on as soon as the next measurement has been executed.
Output level unit
Bode 100 by default uses dBm as the output level unit. 1 dBm equals 1 mW at 50 Ω load.
You can also choose Vrms or Vpp as output unit however, please don't forget that the real
output voltage of Bode 100 depends on the impedance connected to the output. The inner
50 Ω source impedance of Bode 100 introduces a voltage drop that depends on the
impedance connected at the output port.
The output level unit can be changed in the options. Click on and select the default level unit of
your choice: .
You can choose Vrms which is the root mean square of the output voltage at 50 Ω load. Again the real
output voltage depends on the load you connect to the output. The internal source voltage is 2 times
higher than the displayed value. Choose Vpp to display the output voltage in peak-to-peak voltage.
Again, the value is valid when a 50 Ω load connected to the output.
Changing the level unit only affects new files / measurements that are created after changing
the unit. The level unit is part of the settings stored in the .bode3 file.
98
OMICRON Lab

Bode Analyzer Suite functions
Shaped level
The shaped level feature of Bode 100 allows changing the output level over frequency.
To use the shaped level feature, click on the slider selector to switch between constant and variable
level .
After switching to variable, the Output level text field changes its name to Reference level and the
Shape level button appears: .
Click on the Shape level button to enter the shaped level dialog shown in the figure below:
Figure 9-1: Shaped level dialog
In the shaped level dialog you can perform the following actions:
1. Interactive shaped level diagram
Shows the shaped level curve. Use your mouse to enter new shaped level points by doubleclicking or right-clicking into the diagram. Shaped level points can be moved by drag-and-drop in
the diagram. The blue line in the diagram shows the reference level line which allows you to shift
the entire shaped level curve up and down.
2. Shaped level points table
The table contains all shaped level points. Points added via mouse click into the diagram will show
up in the table. You can also use the table to enter new points manually.
3. Reference level
The reference level allows you to shift the entire shaped level curve up and down by either
entering a different reference level value or by moving the blue reference level line in the diagram.
OMICRON Lab
99
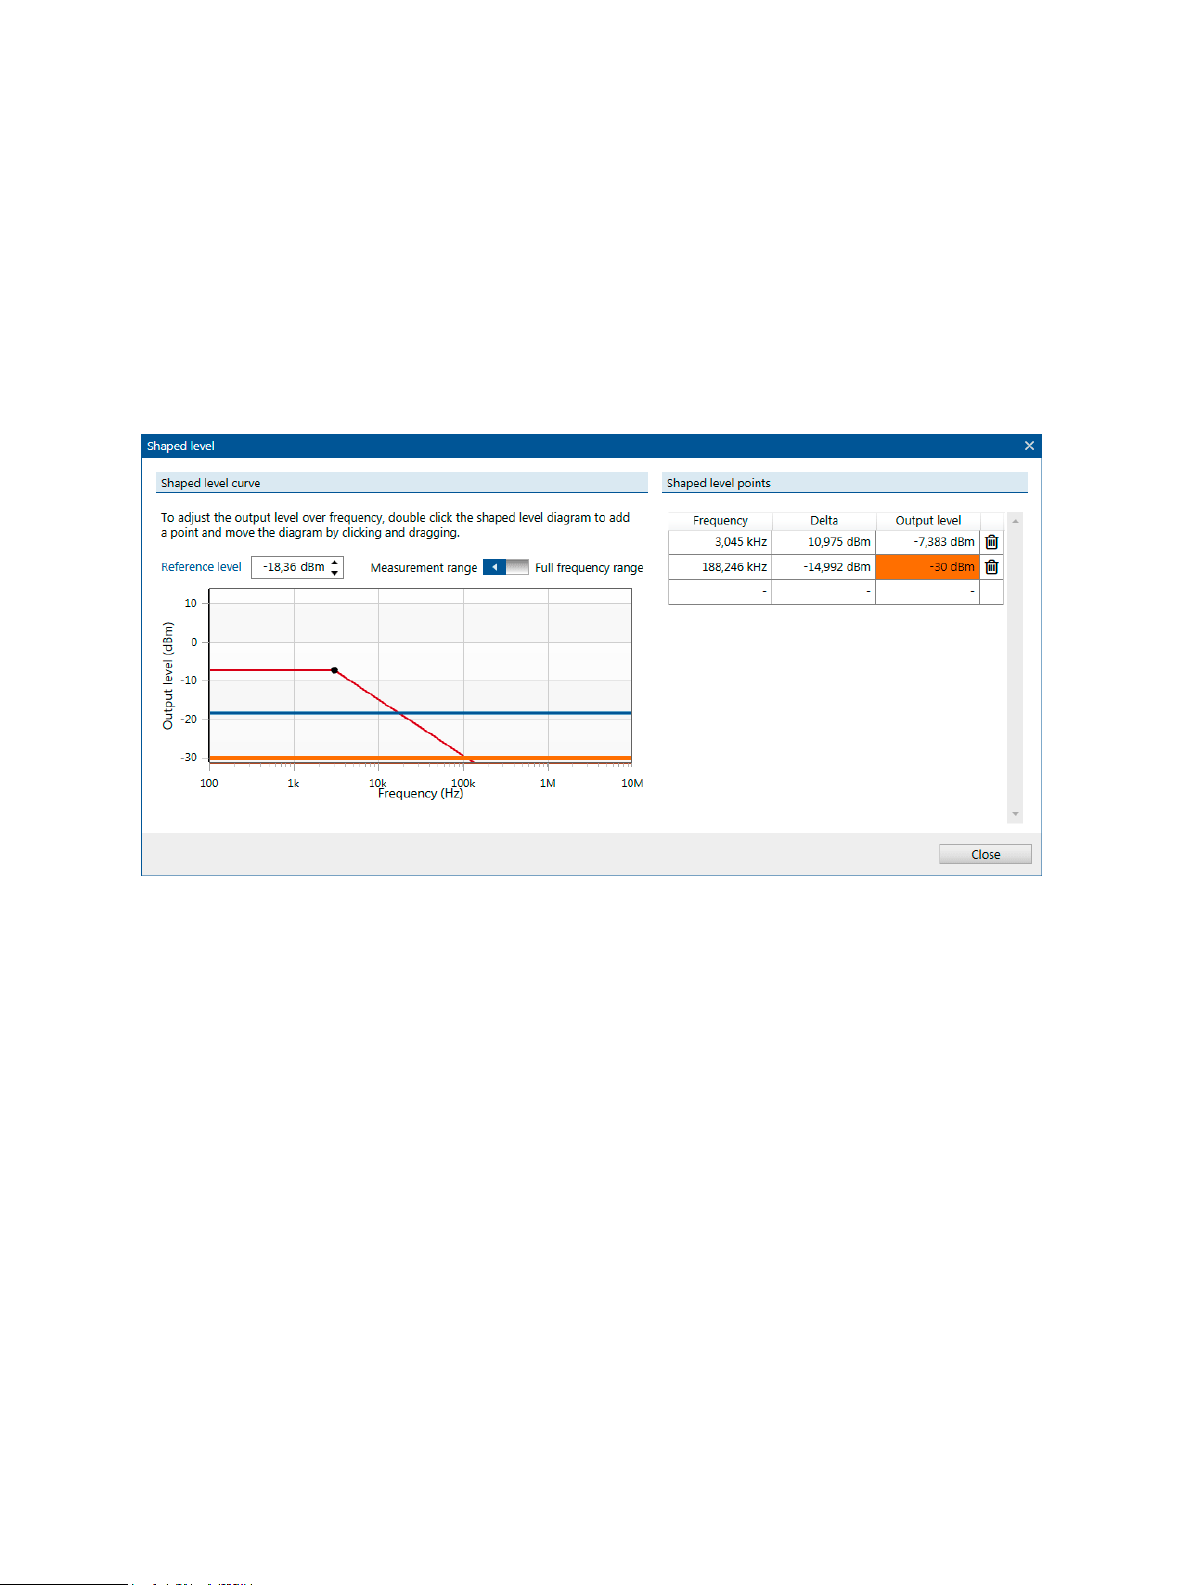
The output level is calculated by the equation:
Output level = Reference level + Delta
When changing the reference level it might happen that the calculated Output level is higher than the
maximum output level of Bode 100 or lower than the minimum output level of Bode 100. In such a
case the level is automatically limited to the device limits.
This is indicated by an orange limit line and an orange cell color in the shaped level dialog as shown in
the following figure:
Figure 9-2: Output level limited to the minimum output level of the device
100
OMICRON Lab
 Loading...