

Page 1
IBM PC
DASYLab Data Acquisition System
Laboratory
SWD-DASYLAB
Starts at
$
1299
⻬ Acquisition: Analog
and Digital Input,
Counters and Timers;
RS-232 and RS-485,
as well as IEEE-488
Instruments
⻬ Control: Binary Logic,
Status Display and
PID Control
⻬ Signal Generation:
Used with DACs as
a Programmable
Function Generator
and Simulations
⻬ Analysis: Complex
Real-Time Data Analysis
⻬ Display Formats
Include Strip Chart,
Scope, Digital and
Analog Meters
⻬ Customized Reports
and User Interface
⻬ DDE and ODBC to
Communicate with
Other Programs
⻬ DASYLab Plus Also
Features Worksheet
Test Manager, FFT
and Filter Modules,
and Action Modules
for Event-Based Actions
Solve Acquisition Problems
in Just a Few Minutes
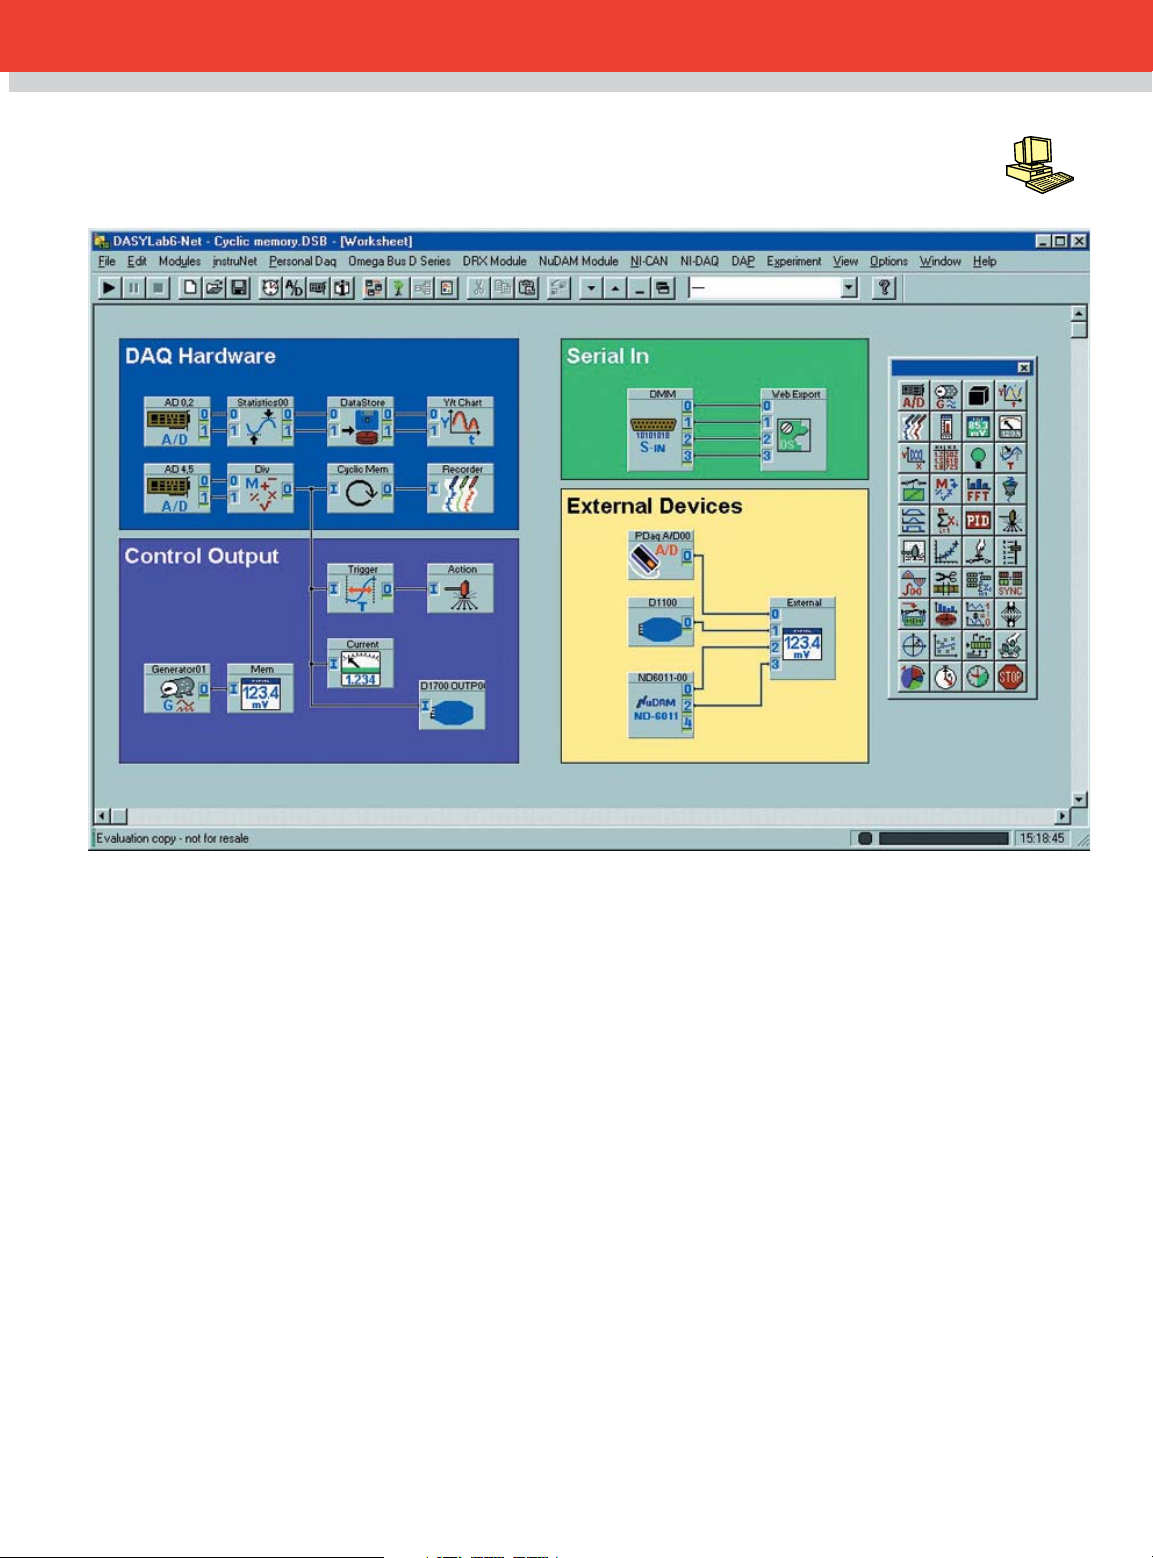
The easy-to-use DASYLab software
helps you solve complex data
acquisition and control scenarios
easily and quickly by working with a
flowchart directly on the screen.
Module icons are placed on the
screen and connected with wires in
a schematic diagram, which
represents the flow of data through
the system. Each icon represents
an input, operation or output
function. Real-time acquisition rates
B-13
of up to 800KHz and on-line display
of up to 300KHz can be achieved.
The actual rates depend on the
data acquisition board and other
hardware used.
Acquisition, Control,
and Analysis Modules
The versatility of DASYLab lies
in its rich set of function modules.
These include analog input (ADC),
analog output (DAC), triggers,
digital I/Os, function generators,
action operation*, digital filters*,
spectral/FFT analysis*, and
mathematical, statistical and logical
operations. Output modules allow
for file writing, DDE output, and
various types of displays, including
strip charts, x-y graphs, digital and
analog meters, and bar graphs.
User definable icons include the
ability to create a Black Box icon
containing many icons, enhancing
the usability for large worksheets.
The module icons can be
connected manually or, using the
integrated Autorouter feature, wire
paths will be determined
automatically.
Page 2
The Display
Results of acquisition and
analysis can be displayed in
strip charts, t-y graphs, and
x-y graphs with a selectable
system of coordinates. Linear,
logarithmic, and polar
coordinates are available. The
results can also be displayed as
bar graphs, analog and digital
meters, and status lamps. The
operator can interact with the
displays while the system is
running, changing the X, Y or
time scales, selecting data
channels to be displayed, or
even looking back in time on
the chart recorder. With
DASYLab Plus, those changes
to the displays can be done
automatically based on
system events.
Signal Generation
You can test your DASYLab
flowcharts by using simulated
signals from the signal generator
by temporarily replacing the
ADC icon with the signal
generator. This, in combination
with the mathematical functions,
can be used to generate
complex wave forms. In
addition, a sequence generator
is available that allows you to
generate even more arbitrary
functions, combining ramps
and curves.
B
Control
PID control, and binary logic
control can be defined using the
module icons. Pulse generators
can be used for exact time
dependent control, even with
complex control signals.
Events and Actions*
There are a class of modules
that allow you to cause events in
the system based on user action
acquired or calculated data.
These events can automatically
cause certain action. Using the
action modules, you can print a
display window, change the
characteristics of a display
window, or even change the
whole display. You can
automatically notify the operator
of problems and suggest
remedies.
*DASYLAB-FULL only
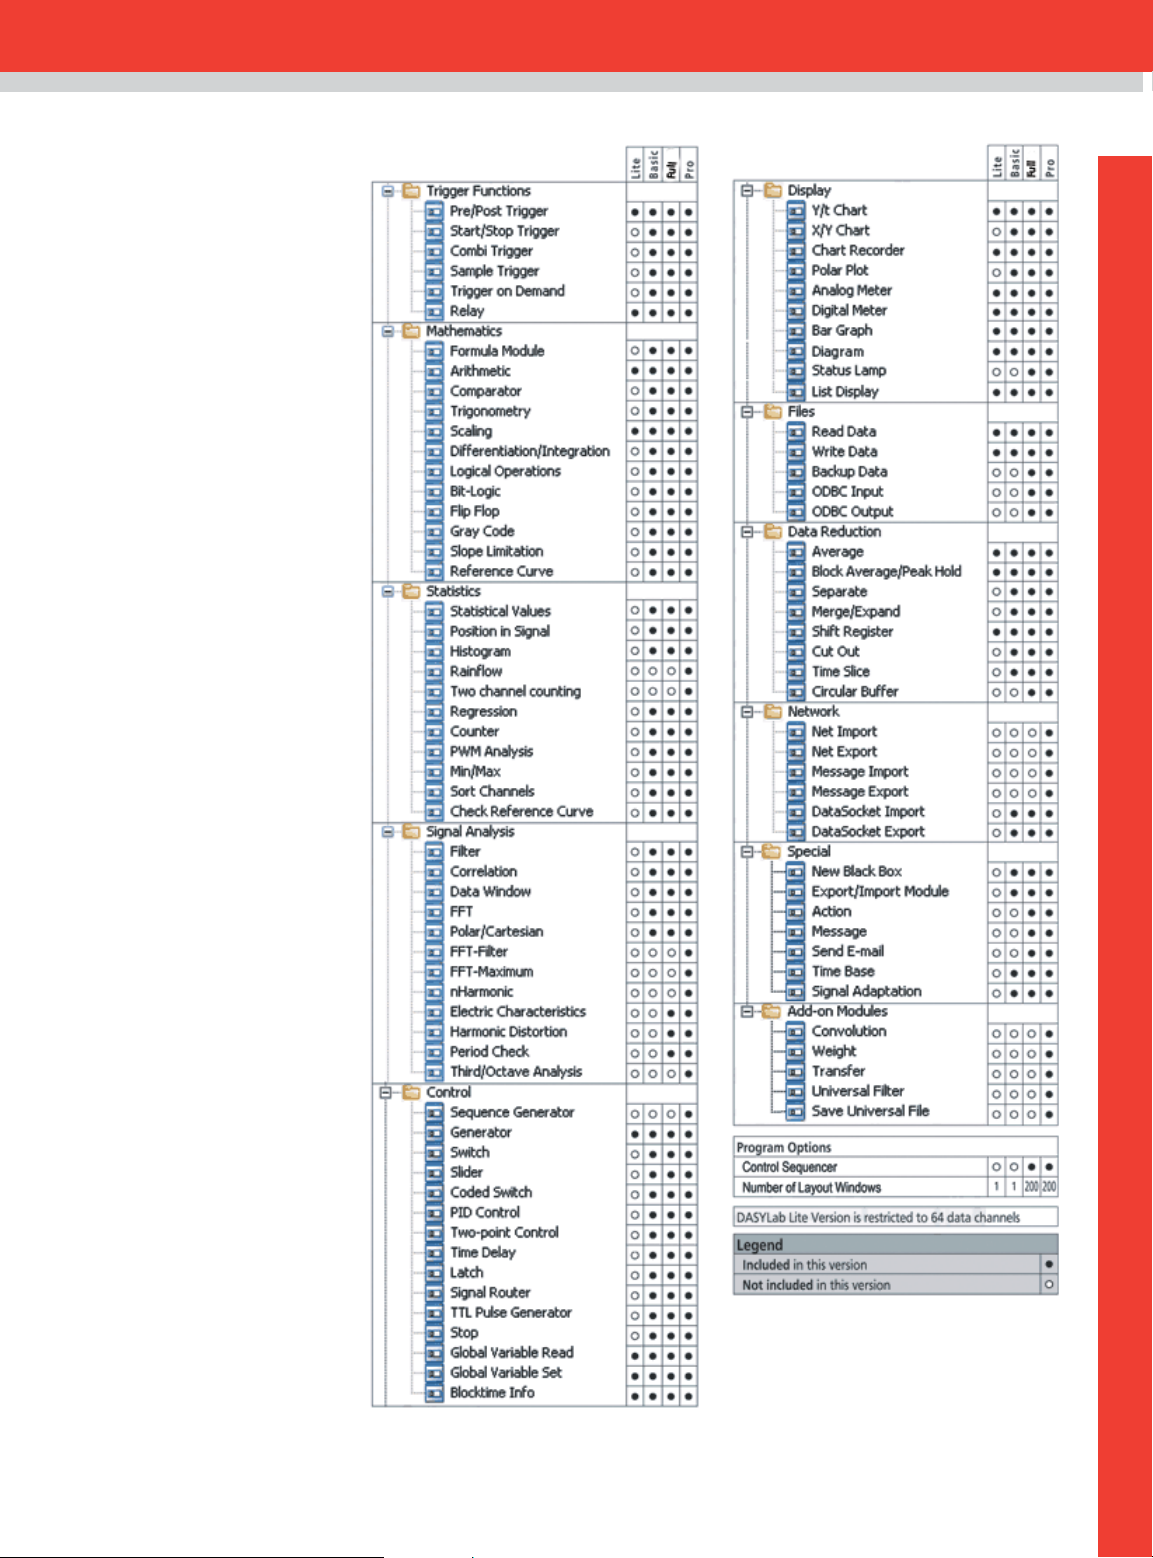
The chart above shows the versions
and which modules are provided with
each version
B-14
Page 3

Input
Output
Module DASY Lite DASYLab DASYLab Full DASYLab Pro
Analog Input ••• •
Analog Output ••• •
Digital Input ••• •
Digital Output ••• •
Counter Input ••• •
Frequency Output ••• •
RS-232 Input ••• •
RS-232 Output •• •
ICOM (TCP/IP) Input ••• •
ICOM (TCP/IP) Output •• •
IEEE488 Input •• •
IEEE488 Output •• •
DDE Input ••• •
DDE Output ••• •
OPC DA Input ••• •
OPC DA Output ••• •
Saving and Loading Data
Data can be saved to disk in several
formats via the file I/O icon.
Importing of data from disk during a
real-time run is also supported from
files of several formats.
Store and retrieve data from
standard ODBC databases. Using
the DDE (Dynamic Data Exchange)
interface, DASYLab can act
as a server, transferring data
on-line to other DDE-compatible
Windows programs.
Controlling Your Test Sequence*
The Worksheet Test Manager
allows you to control the sequence
of tests, the order in which they are
performed, and provides a high
level view of the series of tests.
Analysis Toolkit Option*
Add a variety of high-end
functions,including the Transfer
Function, Octave analysis,
Rainflow Statistical Analysis, and
Setpoint/Sequence Generation.
DDE IMPORT
Other programs such as Visual
BASIC can control the DASYLab
application by starting, pausing,
and stopping the experiment.
RS-232/RS-485/OPC
Read data from a wide variety
of instruments including scales,
balances and data recorders.
HARDWARE SUPPORTED
CIO-CTR05/10, CIO-DAS08/16
family, CIO-DAS800/1400/1600,
CIO-DAS6402, CIO-DAC family,
CIO-DI024/48/96/192 family,
CIO-DISO48, CIO-EXP16/32,
CIO-DAS-TC, DRX series,
DAQ/DAQP/QTC series,
PCI-DIO24/48/96 family,
PCI-DAS08/1000/1200/1600/6402
family, PCI-DAS-TC, INET
series, WB-DYNARES family,
OMR series,
D1000/2000/3000/4000/5000
series, OMB-DAQBOOK family,
OMB-TEMPBOOK-66,
OMB-WAVEBOOK, DAQBOARD,
OMB-DBK family, DataShuttle,
OMB-DAQ-54/55/56 and the
OMB-DAQ-3000 series.
DASYLab Lite
DASYLab Lite is an economical
version of DASYLab that provides
only the most basic functions and
is limited to 64 data channels.
To Order
Model Number Price Descriptionz
SWD-DASYLAB $1299 DASYLab software
SWD-DASYLAB-PRO 2499 DASYLab Plus with Analysis Toolkit
SWD-DASYLAB-FULL 1799 DASYLAB Plus software, with realtime FFTs and filters, Actions, Worksheet
SWD-DASYLITE 499 DASYLab Lite
Ordering Example: SWD-DASYLAB software, $1299.
(Specify Model Number)
Test Manager, 200 Layouts
B-19
Page 4

One Omega Drive | Stamford, CT 06907 | 1-888-TC-OMEGA (1-888-826-6342) | info@omega.com
EPG05
www.omega.com
UNITED KINGDOM
www. omega.co.uk
Manchester, England
0800-488-488
UNITED STATES
www.omega.com
1-800-TC-OMEGA
Stamford, CT.
CANADA
www.omega.ca
Laval(Quebec)
1-800-TC-OMEGA
GERMANY
www.omega.de
Deckenpfronn, Germany
0800-8266342
Karviná, Czech Republic
FRANCE
www.omega.fr
Guyancourt, France
088-466-342
CZECH REPUBLIC
www.omegaeng.cz
596-311-899
BENELUX
www.omega.nl
Amstelveen, NL
0800-099-33-44
More than 100,000 Products Available!
Temperature
Calibrators, Connectors, General Test and Measurement
Instruments, Glass Bulb Thermometers, Handheld Instruments
for Temperature Measurement, Ice Point References,
Indicating Labels, Crayons, Cements and Lacquers, Infrared
Temperature Measurement Instruments, Recorders Relative
Humidity Measurement Instruments, RTD Probes, Elements
and Assemblies, Temperature & Process Meters, Timers and
Counters, Temperature and Process Controllers and Power
Switching Devices, Thermistor Elements, Probes and
Assemblies,Thermocouples Thermowells and Head and Well
Assemblies, Transmitters, Wire
Flow and Level
Air Velocity Indicators, Doppler Flowmeters, Level
Measurement, Magnetic Flowmeters, Mass Flowmeters,
Pitot Tubes, Pumps, Rotameters, Turbine and Paddle Wheel
Flowmeters, Ultrasonic Flowmeters, Valves, Variable Area
Flowmeters, Vortex Shedding Flowmeters
pH and Conductivity
Conductivity Instrumentation, Dissolved Oxygen
Instrumentation, Environmental Instrumentation, pH
Electrodes and Instruments, Water and Soil Analysis
Instrumentation
Data Acquisition
Auto-Dialers and Alarm Monitoring Systems,
Communication Products and Converters, Data
Acquisition and Analysis Software, Data Loggers
Plug-in Cards, Signal Conditioners, USB, RS232, RS485
and Parallel Port Data Acquisition Systems, Wireless
Transmitters and Receivers
Pressure, Strain and Force
Displacement Transducers, Dynamic Measurement
Force Sensors, Instrumentation for Pressure and Strain
Measurements, Load Cells, Pressure Gauges, Pressure
Reference Section, Pressure Switches, Pressure Transducers,
Proximity Transducers, Regulators,
Strain Gages, Torque Transducers, Valves
Heaters
Band Heaters, Cartridge Heaters, Circulation Heaters,
Comfort Heaters, Controllers, Meters and Switching
Devices, Flexible Heaters, General Test and Measurement
Instruments, Heater Hook-up Wire, Heating Cable
Systems, Immersion Heaters, Process Air and Duct,
Heaters, Radiant Heaters, Strip Heaters, Tubular Heaters
click here to go to the omega.com home page
 Loading...