

Page 1
www.omega.com
e-mail: info@omega.com
User’s Guide
RD-MV100 SERIES
Recorder
OMEGA
Shop online at
CARE
Extended Warranty
Program
SM
Page 2

Servicing North America:
USA: One Omega Drive, P.O. Box 4047
ISO 9001 Certified Stamford CT 06907-0047
TEL: (203) 359-1660 FAX: (203) 359-7700
e-mail: info@omega.com
Canada: 976 Bergar
Laval (Quebec) H7L 5A1
TEL: (514) 856-6928 FAX: (514) 856-6886
e-mail: info@omega.ca
For immediate technical or application assistance:
USA and Canada: Sales Service: 1-800-826-6342 / 1-800-TC-OMEGA
®
Customer Service: 1-800-622-2378 / 1-800-622-BEST
®
Engineering Service: 1-800-872-9436 / 1-800-USA-WHEN
®
TELEX: 996404 EASYLINK: 62968934 CABLE: OMEGA
Mexico: En Espan˜ ol: (001) 203-359-7803 e-mail: espanol@omega.com
FAX: (001) 203-359-7807 info@omega.com.mx
Servicing Europe:
Benelux: Postbus 8034, 1180 LA Amstelveen, The Netherlands
TEL: +31 (0)20 3472121 FAX: +31 (0)20 6434643
Toll Free in Benelux: 0800 0993344
e-mail: nl@omega.com
Czech Republic: Rudé armády 1868, 733 01 Karviná 8
TEL: +420 (0)69 6311899 FAX: +420 (0)69 6311114
Toll Free: 0800-1-66342 e-mail: czech@omega.com
France: 9, rue Denis Papin, 78190 Trappes
TEL: +33 (0)130 621 400 FAX: +33 (0)130 699 120
Toll Free in France: 0800-4-06342
e-mail: france@omega.com
Germany/Austria: Daimlerstrasse 26, D-75392 Deckenpfronn, Germany
TEL: +49 (0)7056 9398-0 FAX: +49 (0)7056 9398-29
Toll Free in Germany: 0800 639 7678
e-mail: germany@omega.com
United Kingdom: One Omega Drive, River Bend Technology Centre
ISO 9002 Certified Northbank, Irlam, Manchester
M44 5EX United Kingdom
TEL: +44 (0)161 777 6611 FAX: +44 (0)161 777 6622
Toll Free in United Kingdom: 0800-488-488
e-mail: sales@omega.co.uk
OMEGAnet®Online Service Internet e-mail
www.omega.com info@omega.com
It is the policy of OMEGA to comply with all worldwide safety and EMC/EMI regulations that
apply. OMEGA is constantly pursuing certification of its products to the European New Approach
Directives. OMEGA will add the CE mark to every appropriate device upon certification.
The information contained in this document is believed to be correct, but OMEGA Engineering, Inc. accepts
no liability for any errors it contains, and reserves the right to alter specifications without notice.
WARNING: These products are not designed for use in, and should not be used for, patient-connected applications.
Page 3
MV100 Quick Reference
This quick reference should be used as a supplement to the User’s Manual
M3641.
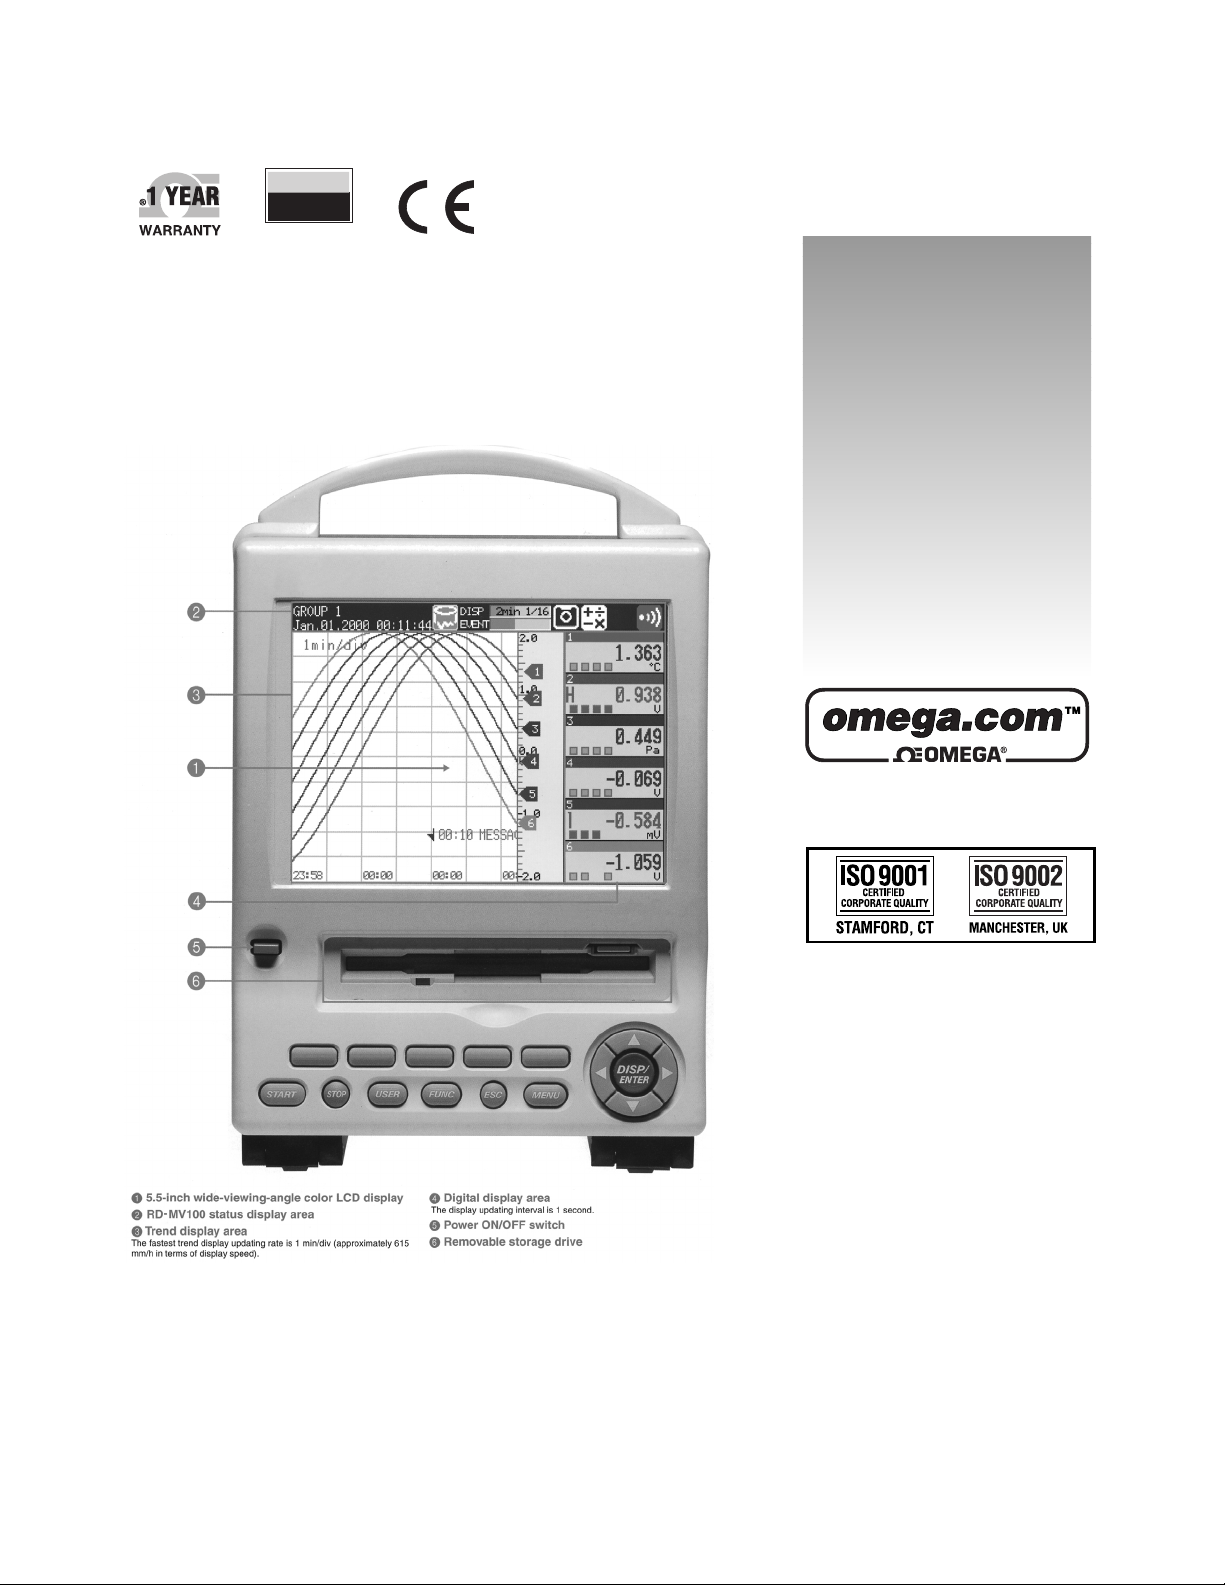
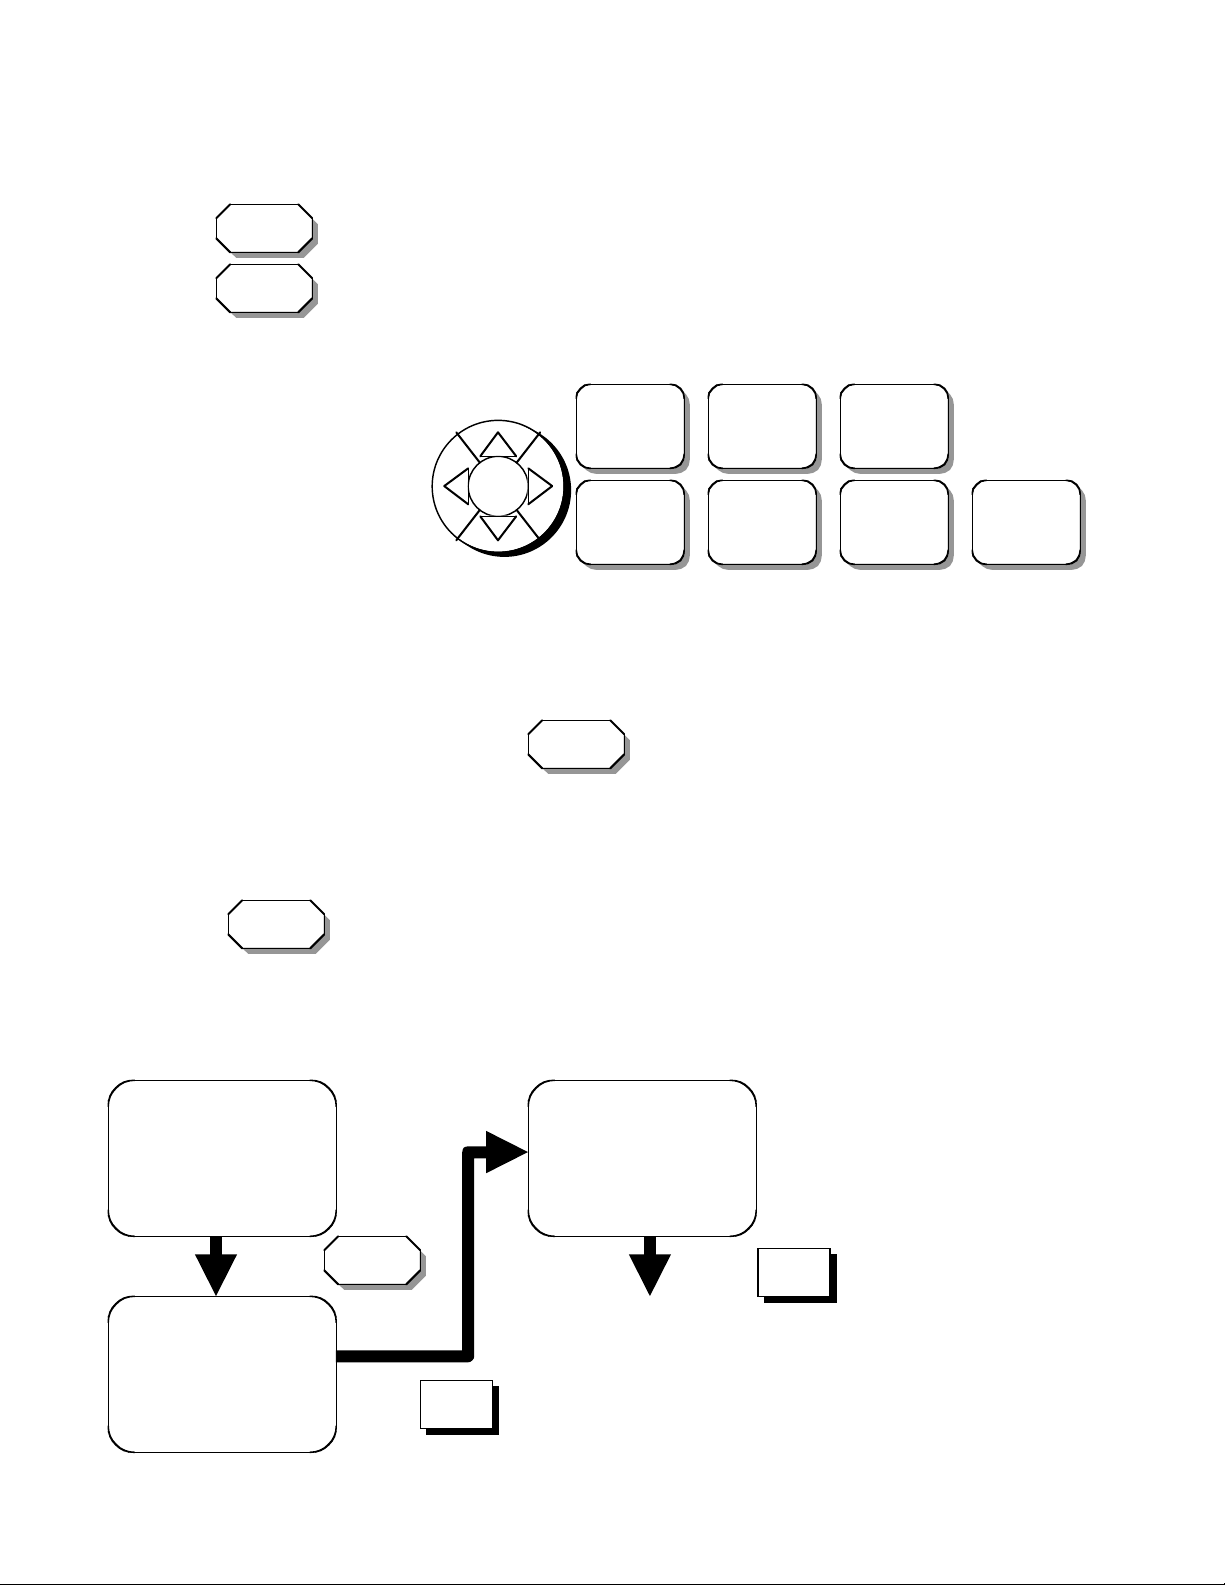
1. Outline of key arrangement
5
1
3
1 Soft keys
2 Menu, Function, and User keys
3 Start/Stop keys
4 Operation key
5 Power switch
See Section 3.1 for
key explanations
2
4
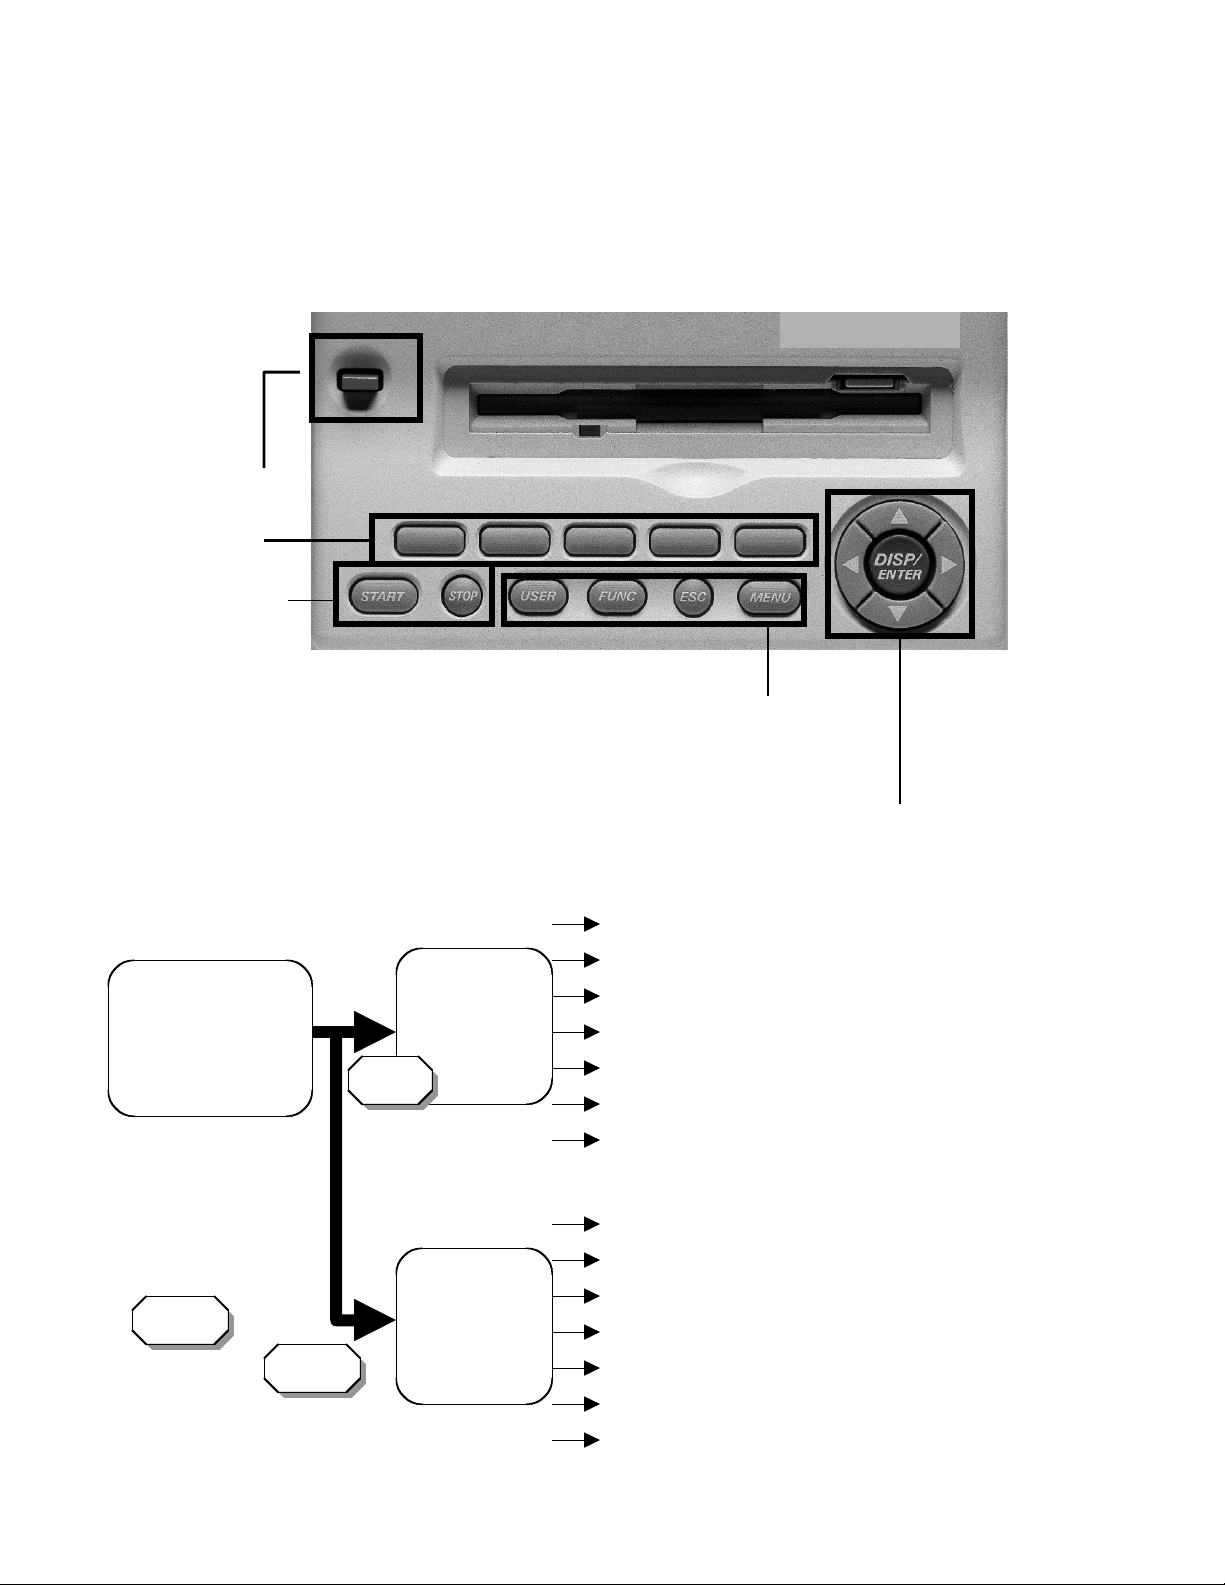
2. Flow chart of setting
Operation screen
(Monitor display)
MENU
Press
and release
MENU
then press
FUNC
for 3 seconds
Section 3.5
Setting mode
Menu
display
Basic Setting
mode
Menu
display
Soft Key
#1 Range(5.1 to 5.7), Alarm(6.2)
#2 Tag(7.1), Filter(5.8), Alarm delay(6.3)
#3 Trend/Save interval(7.3,8.8),
#4 Message(7.5)
#5 Display(7.6 to 7.11)
#6 File (8.9), DST (10.12)
#7,#8 Save/Load(5.1), Clear data(5.2,5.4,5.5)
#1 Alarm(6.4), A/D(5.9), #2 Temperature(10.13)
#3 Memory(8.1-8.4),#4 Memory & Trend(8.10,8.11)
#6 Key lock(10.4), #7 Key login(10.6)
#8 Save(9.1)/Load(9.1), Initialize(9.8)
#9 Options: Remote(10.7), Report(11.13)
#10 Option: Communication (M3643 6.1-6.3)
End Exit from SETUP mode(3.6)
(UM Section)
OMEGA
Page 4
MV100 Quick Reference
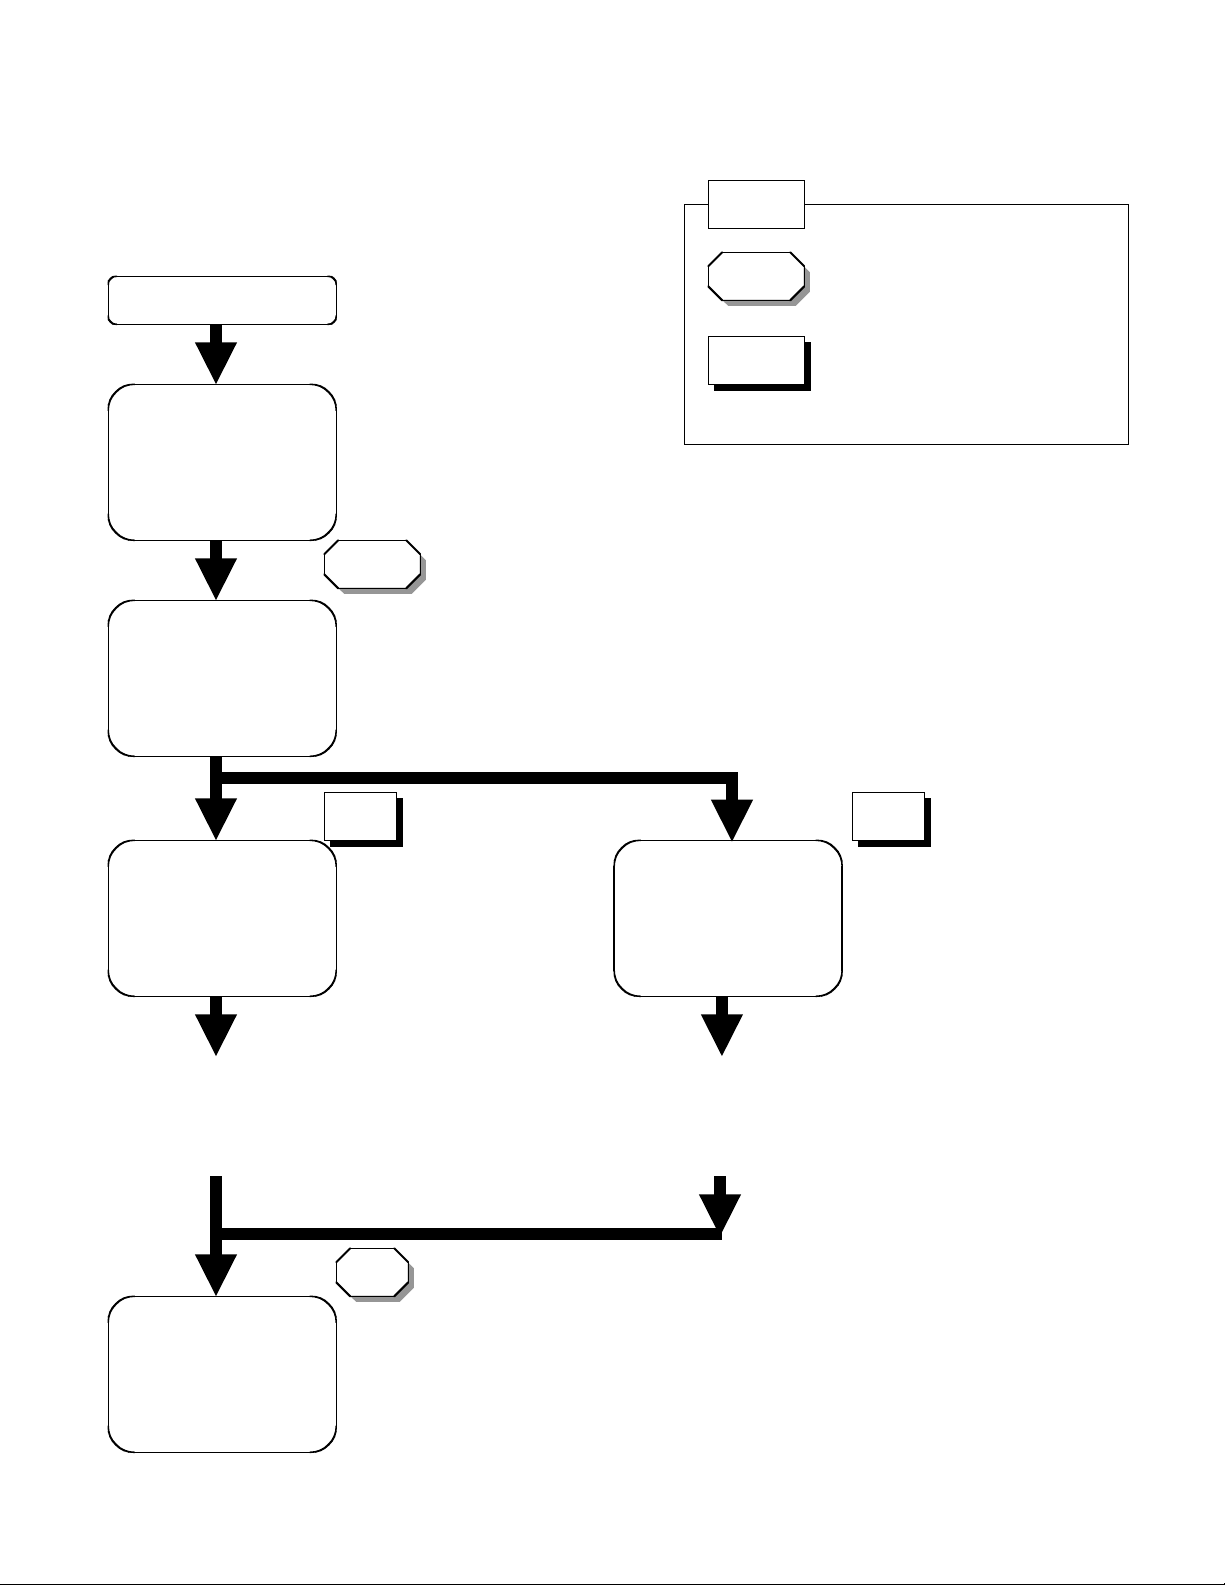
3. Flow chart of setting
- Range,alarm and trend/save interval setting -
Power on
Operation screen
(Monitor display)
Press Menu
Setting mode
Menu
display
Section 3.2
Section 4.1
MENU
Section 3.6
Note
: Hard keys
: Soft keys
Located just below the display
Press
Range,Alarm
setting menu
display
Set range and alarm setting
value by using soft keys,
character/number input
keys and operation key
Press ESC key 2 times to go back to the monitor display
Operation screen
(Monitor display)
#1 #3
Press
Trend/Save interval
Setting menu
display
Section 5.1 to 5.7
Set Time/div and Auto save
interval by using soft keys.
Set messages and other
parameters if required.
Section 7.3, 8.8
ESC
OMEGA
Page 5
MV100 Quick Reference
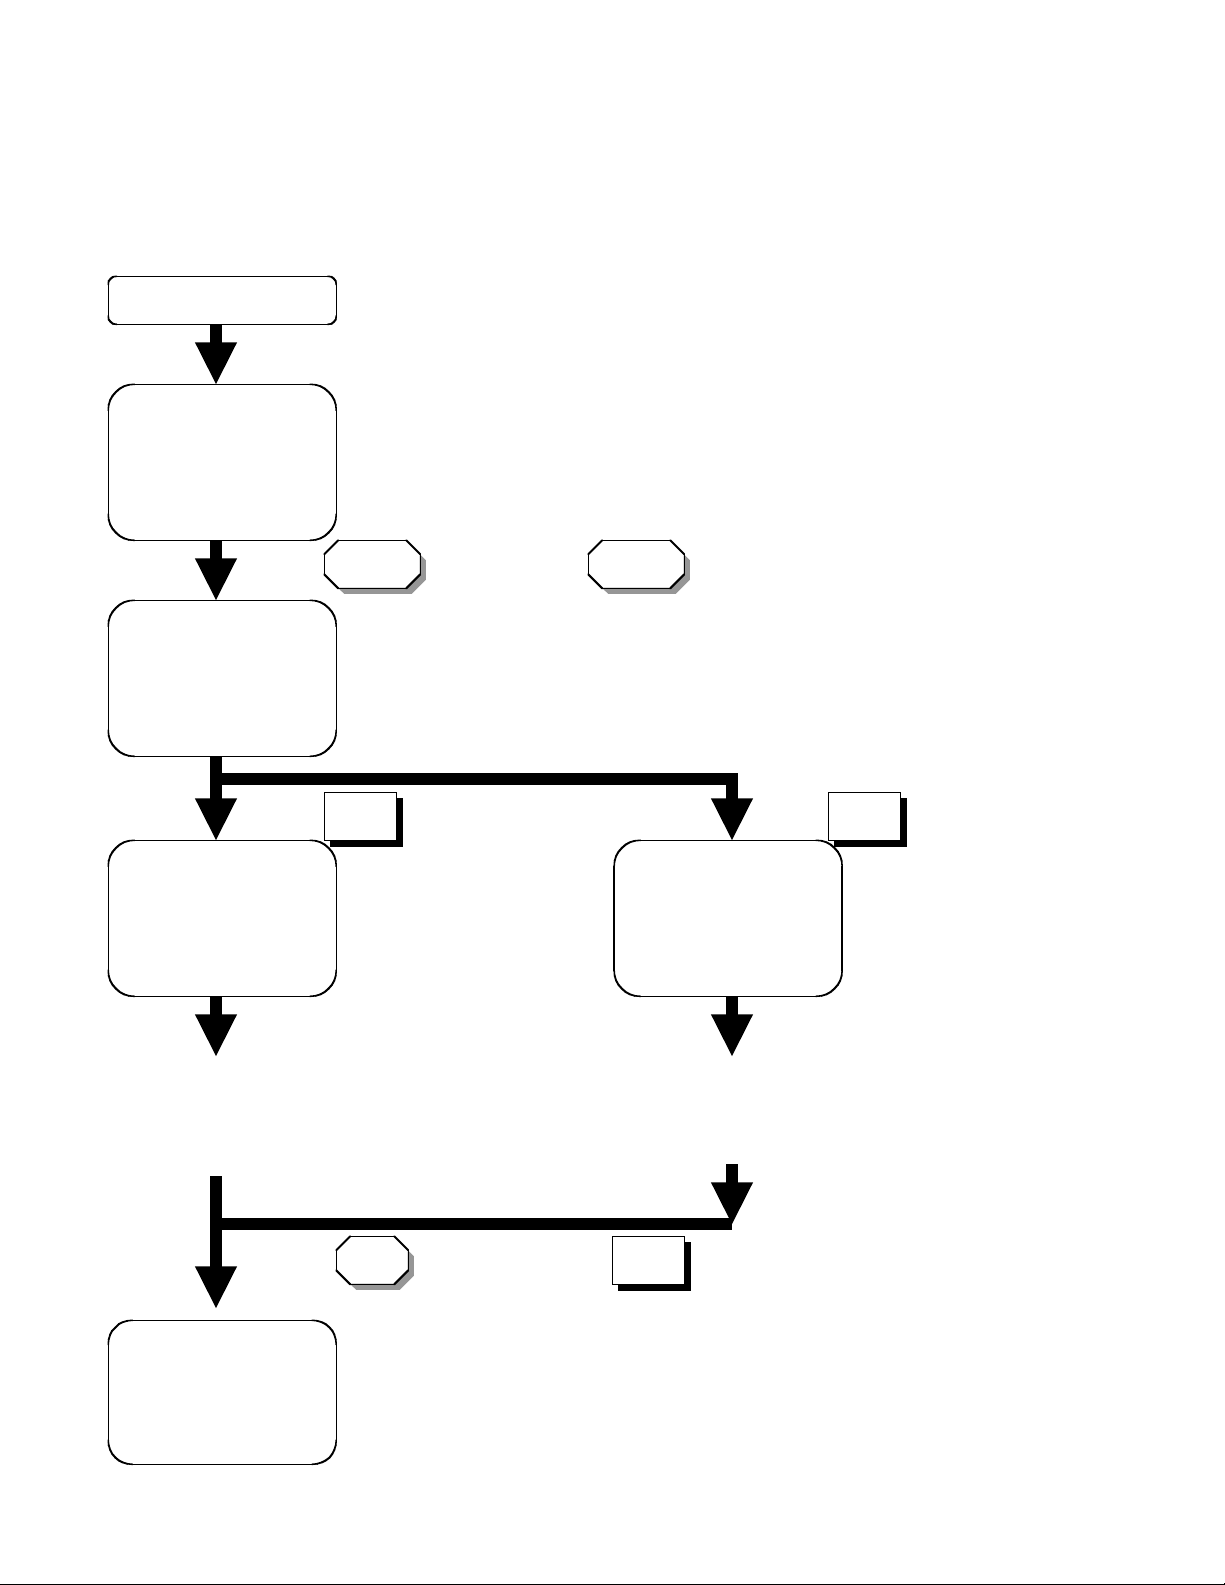
4. Flow chart of basic setting
- Memory and communication related function setting -
Power on
Monitor display
Press , then press key for 3 seconds
Basic Setting mode
menu
Press
Memory related
Basic Setting
menu
Section , 3.2
Section 4.1
MENU FUNC
Section 3.6
#2 #6
Press
Option:
Communication
Basic Setting
Section 8.11
menu
Manual M3643
Set save mode, data type,
sample rate and pre-trigger
if required by using soft
keys and operation key
Press key and select on function menu to go back
to the monitor display
Monitor display
ESC
Set network related parameter such
as IP address and subnet mask by
using soft keys, operation key and
character/number input keys.
End
OMEGA
Page 6
MV100 Quick Reference
5. Start/stop of data acquisition into internal memory
1)Press to start data storage into the internal memory.
2)Press to stop data storage.
Section 8.5, 8.6
START
STOP
6. Switching operation screens
1)Use DISP/ENTER key
Trend Digital Bar
Section 4.1 to 4.7
DISP/
ENTE R
Overview
Infor-
mation
Trend
History
4
Panel
7. Data saving to external medium
7-1. While data acquisition is running
1) When AUTO mode is selected in save mode on memory related SETUP menu*
*:See previous page #2
Periodically or when you press key, data saved into external medium
Section 8.4, 8.7
STOP
2) When MANUAL mode is selected in save mode on memory related SETUP
menu*
Press key
*:See previous page #2
MEDIA
Section 8.4, 8.7
7-2. While data acquisition is stopped
Section 9.2
Operation screen
(Monitor display)
Press Menu
Setting mode
Menu
display
MENU
Press
#7
Setting mode
Menu
display
Press
Every data stored in internal
memory is copied to external
medium.
#3
OMEGA
Page 7

Foreword
Notes
Thank you for purchasing the OMEGA MobileCorder RD-MV100.
This User’s Manual contains useful information about the functions, installation, wiring,
operating procedures, and troubleshooting of the RD-MV100. To ensure correct use,
please read these manuals thoroughly before operation.
Keep this manual in a safe place for quick reference in the event a question arises.
In addition, a quick reference is provided on the previous page. This reference briefly
explains operations that are used frequently. Separate this reference from the manual
for use.
The following three manuals, including this one, are provided as manuals for the RDMV100.
Manual Name Manual No. Description
RD-MV100 User’s Manual M3641 This manual. Explains all functions and
procedures of the RD-MV100 excluding the
communication functions.
RD-MV100 Communication M3643 Explains the communication functions of
Interface User’s Manual the Ethernet/serial interface.
RD-MV100 M3645 Describes the functions and operating
DAQstandard Software procedures of RD-MV Software that
comes with the package.
• The contents of this manual are subject to change without prior notice as a result of
continuing improvements to the instrument’s performance and functions.
• Every effort has been made in the preparation of this manual to ensure the accuracy
of its contents. However, should you have any questions or find any errors, please
contact Omega.
• Copying or reproducing all or any part of the contents of this manual without Omega’s
permission is strictly prohibited.
Trademarks
Revisions
Disk No. RE25
1st Edition : March 2000 (YK)
All Rights Reserved, Copyright © OMEGA
• Windows is registered trademarks of Microsoft Corporation.
• Ethernet is a registered trademark of Xerox Corporation.
• Zip is a trademark or registered trademark of Iomega Corporation.
• Company and product names that are used in this manual are trademarks or
registered trademarks of their respective holders.
First edition : March 2000
i
Page 8
Safety Precautions
This instrument conforms to IEC safety class I (provided with terminal for protective
grounding), Installation Category II, and EN61326-1 (EMC standard), class A (use in a
commercial, industrial, or business environment).
The following general safety precautions must be observed during all phases of
operation. If this recorder is used in a manner not specified in this manual, the
protecition provided by this recorder may be impaired. Omega assumes no liability for
the customer’s failure to comply with these requirements.
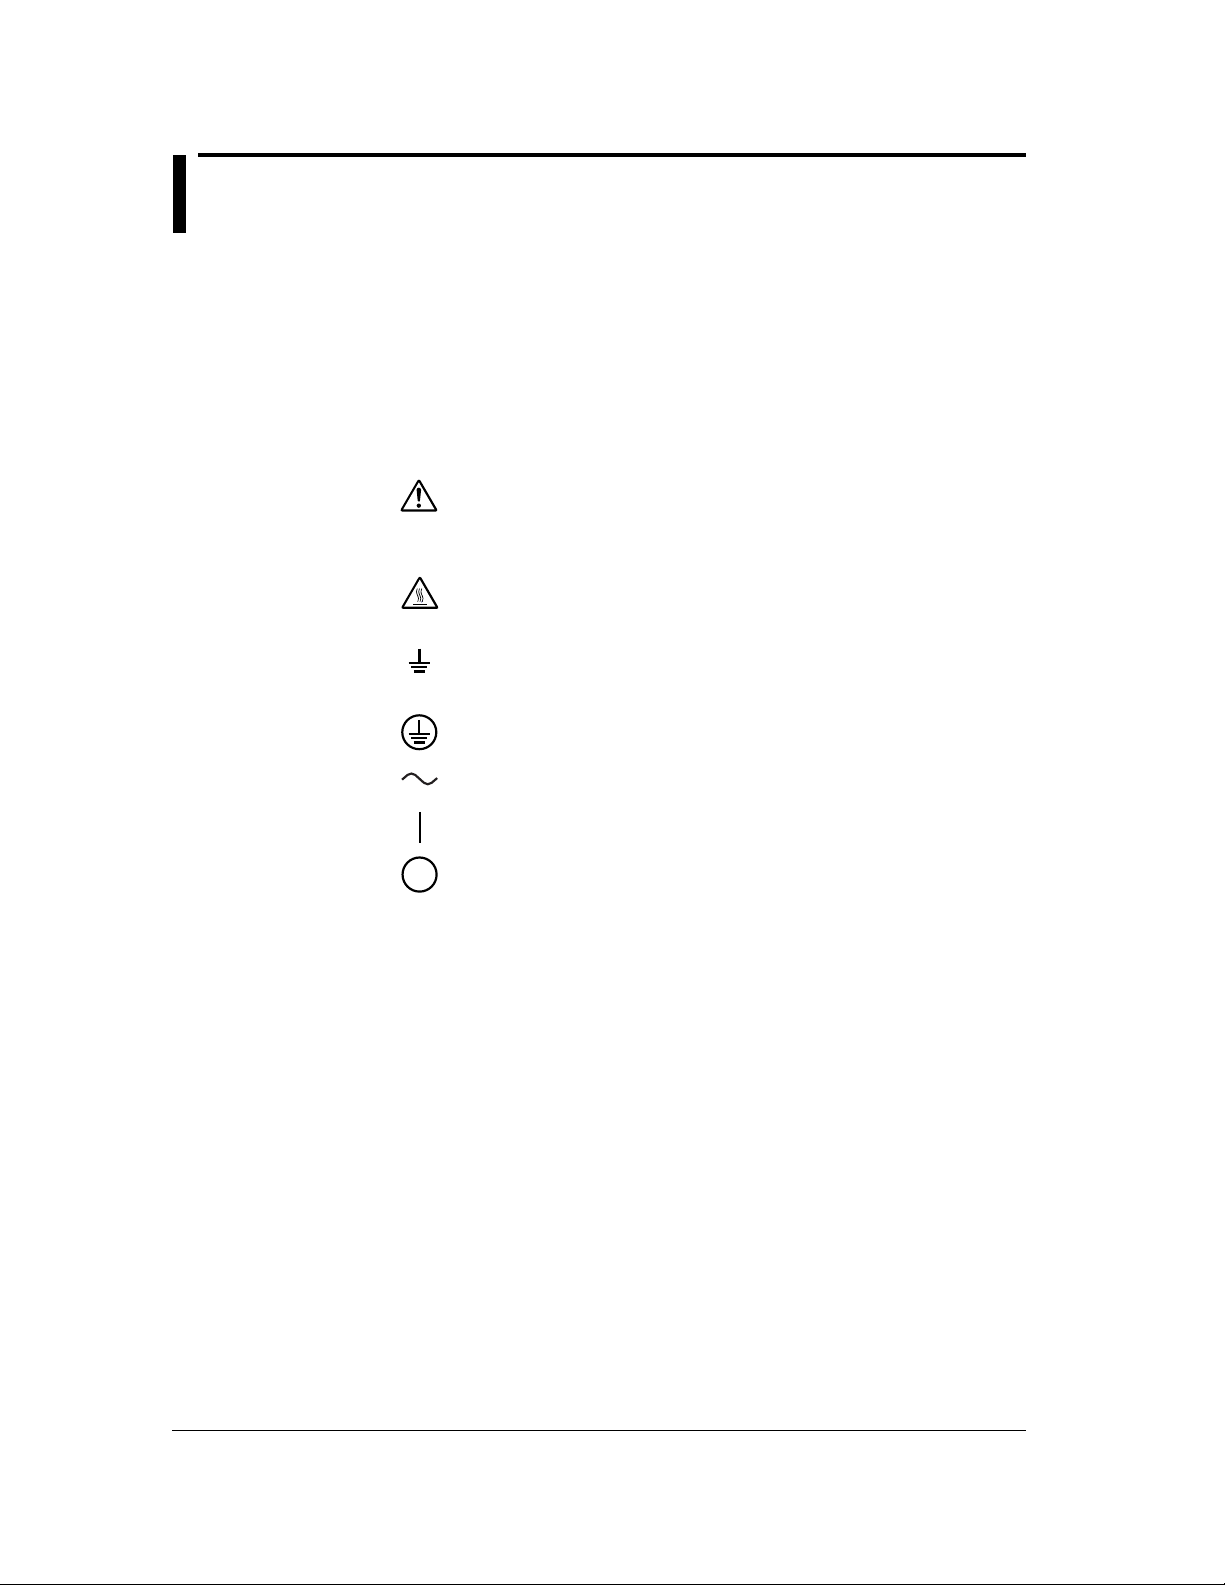
The following symbols are used on this instrument.
“Handle with care.” To avoid injury, death of personnel or damage to
the instrument, the operator must refer to the explanation in the User’s
Manual or Service Manual.
High temperature : To avoid injury caused by hot surface, do not touch
the heat sink.
Functional ground terminal. Do not use this terminal as a protective
ground terminal.
Protective ground terminal.
AC
ON (power)
OFF (power)
ii
Page 9

Safety Precautions
Make sure to comply with the following safety precautions. Failure to comply may
result in injury or death (electric shock hazard).
WARNING
Power Supply
Ensure that the source voltage matches the voltage of the power supply before
turning ON the power.
Power Cord and Plug (Desktop Type)
To prevent an electric shock or fire, be sure to use the power cord supplied by
Omega. The main power plug must be plugged into an outlet with a protective
grounding terminal. Do not invalidate protection by using an extension cord
without protective grounding.
Protective Grounding
Make sure to connect the protective grounding to prevent electric shock before
turning ON the power.
Necessity of Protective Grounding
Never cut off the internal or external protective grounding wire or disconnect the
wiring of the protective grounding terminal. Doing so poses a potential shock
hazard.
Defect of Protective Grounding
Do not operate the instrument when the protective grounding or the fuse might
be defective. Also, make sure to check them before operation.
Fuse (for 12 VDC Power Model)
To prevent fire, only use a fuse that has a rating (voltage, current, and type) that
is specified by the instrument. When replacing a fuse, turn OFF the power
switch and unplug the power cord. Never short the fuse holder.
Do Not Operate in Explosive Atmosphere
Do not operate the instrument in the presence of flammable liquids or vapors.
Operation of any electrical instrument in such an environment constitutes a
safety hazard.
Do Not Remove Covers
Some areas inside the instrument have high voltages. Do not remove the cover
if the power supply is connected. The cover should be removed by Omega’s
qualified personnel only.
External Connection
Connect the protective grounding before connecting to the item under
measurement or control unit.
Damage to the Protective Housing
Using the instrument in a manner not specified in this manual can damage the
instrument’s protective housing.
iii
Page 10
Checking the Contents of the Package
Model Code
Suffix Code
–1
–2
–3
Description
RD-MV100 (2 ch)
RD-MV100 (4 ch)
RD-MV100 (6 ch)
RD-MV100 (12 ch)
Floppy disk
Zip disk
ATA flash memory card (PCMCIA 20MB)
English, deg.F/DST (English standard software
included)
100 to 120 VAC/200 to 240 VAC
12 VDC
*1
3-Pin power inlet with UL, CSA cable
3-Pin power inlet with VDE cable
3-Pin power inlet with SAA cable
3-Pin power inlet with BS cable
Alarm output relay (2 relays)/remote control
*2
Alarm output relay (4 relays)/remote control
*2
Alarm output relay (6 relays)
*2
RS-232 interface
RS-422-A/485 interface
FAIL/memory end output relay
*3
Screw terminal
Computation function (report function included)
Remote control
RD-MV102
RD-MV104
RD-MV106
RD-MV112
External storage
medium
Language
Power supply
Power inlet, power cord
Options
Optional Code
/A1
/A2
/A3
/C2
/C3
/F1
/H3
/M1
/R1
–2
–1
–2
D
F
R
S
*1 With AC adapter
*2 /A1, /A2, and /A3 cannot be specified simultaneously
*3 If /F1 is specified, /A3 cannot be specified.
Unpack the box and check the contents before operating the instrument. If some of the
contents are not correct or missing or if there is physical damage, contact the dealer
from which you purchased them.
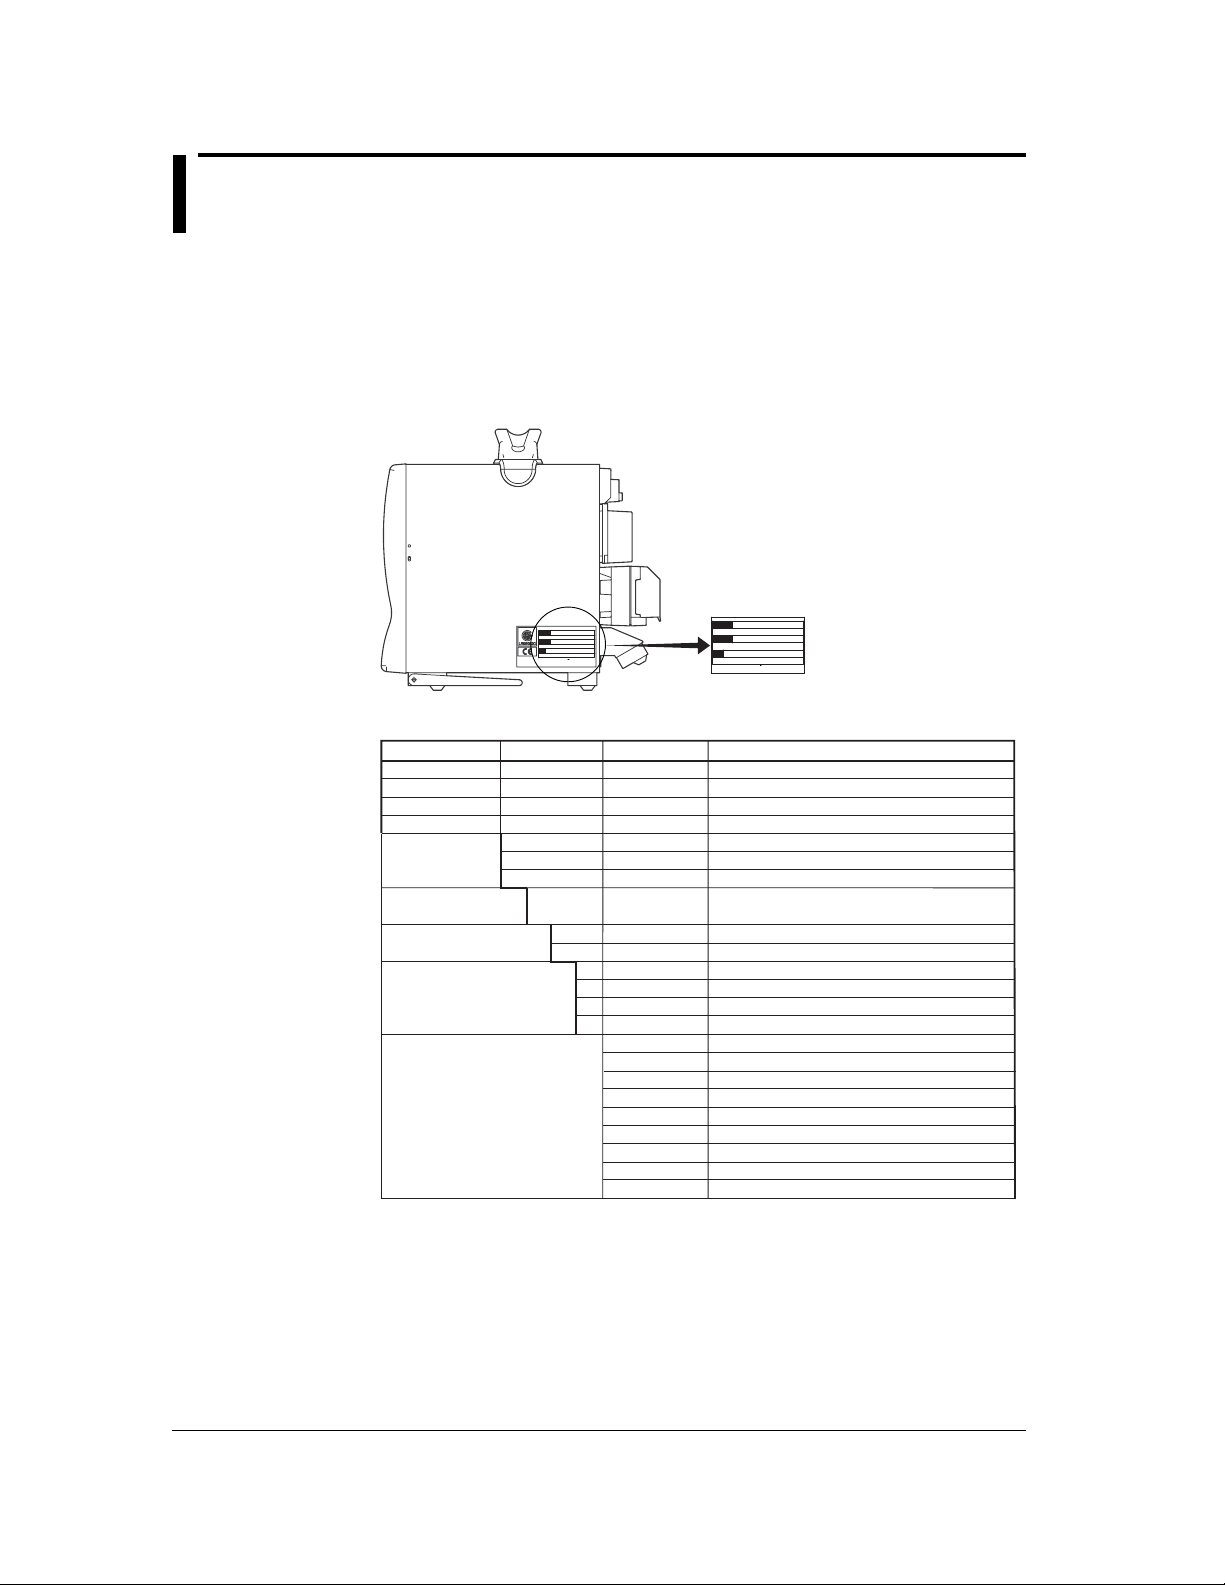
RD-MV100 Main Unit
There is a name plate on the back side of the key panel cover. Open the cover and
check that the model name and suffix code given on the name plate match those on the
order.
iv
MODEL
SUFFIX
NO
Made in Japan
MODEL
SUFFIX
NO
MODEL
NO. (Instrument No.)
When contacting the dealer from which you purchased the instrument, please quote the
instrument No.
Page 11
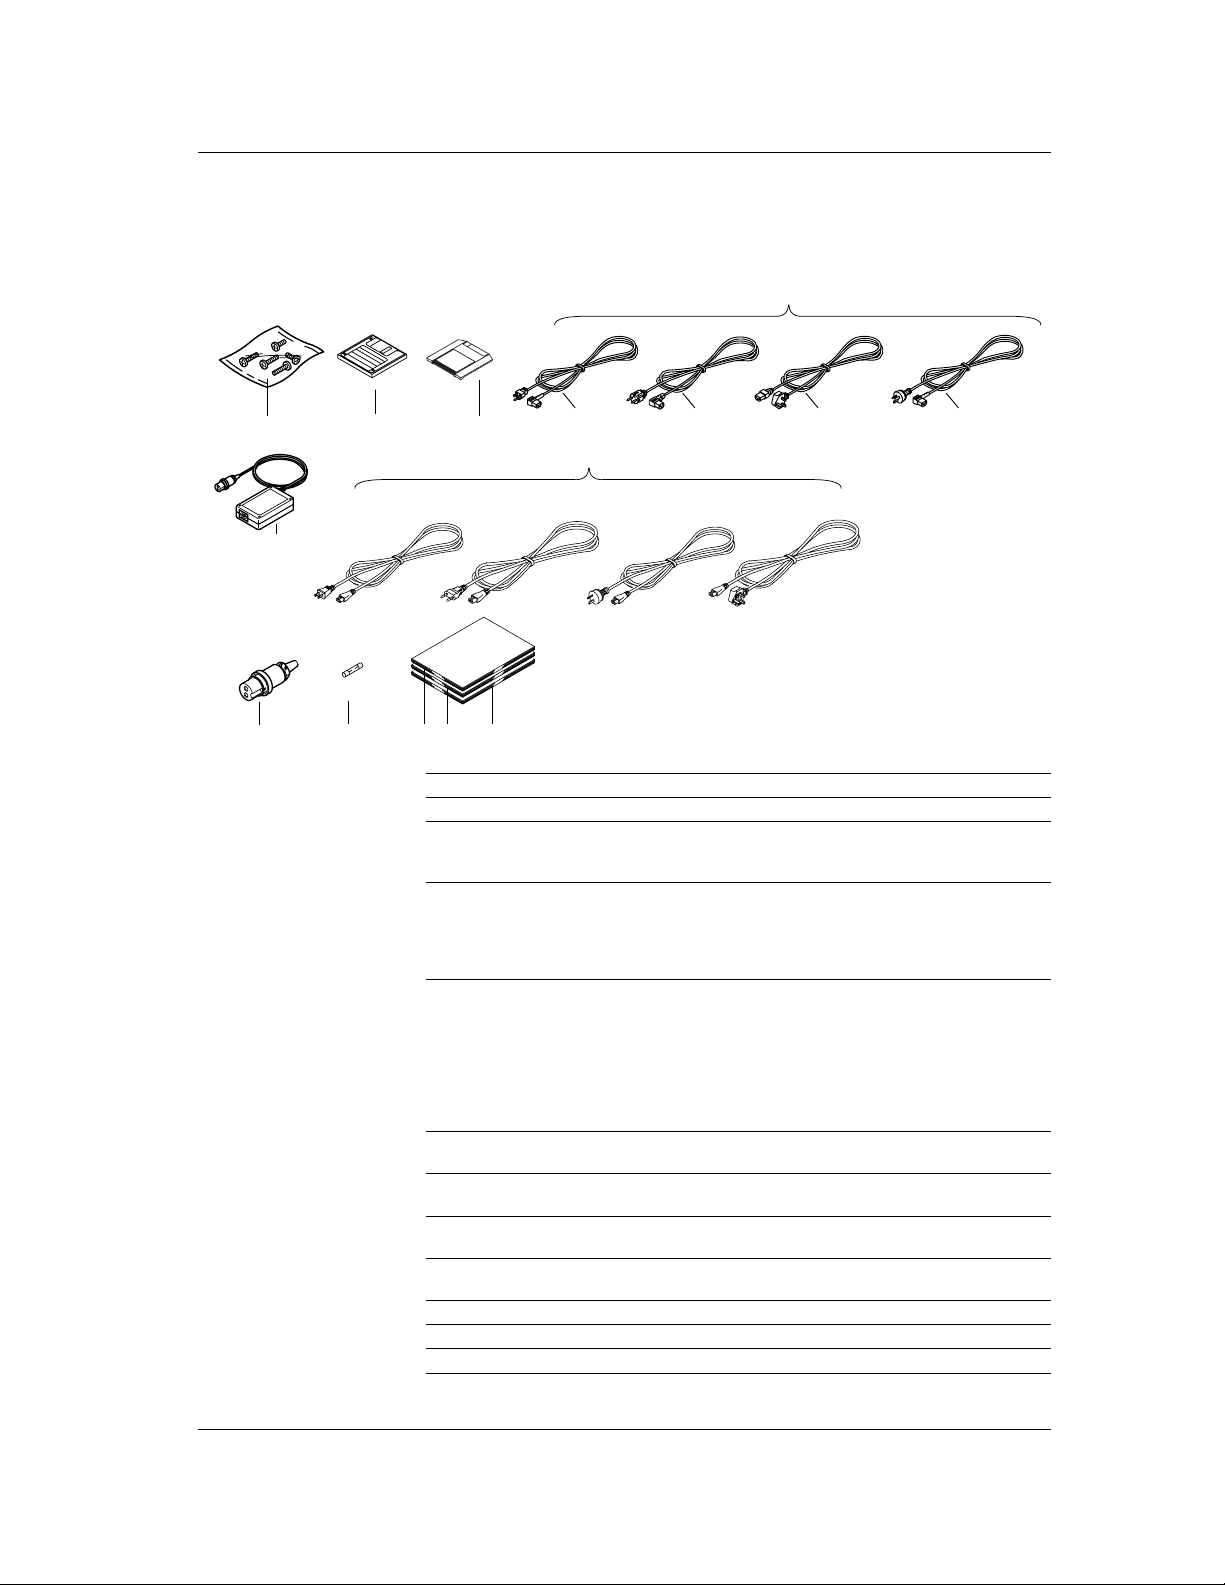
Standard Accessories
The following standard accessories are supplied with the instrument. Make sure that all
items are present and undamaged.
Checking the Contents of the Package
4.One of these power cord types is supplied according
to the instrument’s suffix code
1
2
6.One of these power cord types is supplied according to the suffix code
-D
UL/CSA Standard
3
-F
VDE Standard
D
SAA Standard
F
-R
-S
BS Standard
S
R
5
7
8
9 10 11
Number Part Name Part Number/Model Q’ty Notes
1 Terminal screw 5 M4
2 Application MV10A-02 1 Included only when the language
software code is “-2”
For Windows 95/98/NT
3 External storage A1053MP 1 Zip disk, included only when the code
medium for external storage medium is “-2”
A1134UN 1 ATA flash memory card, included only
when the code for external storage
medium is “-3”
4 Power cord A1006WD 1 Provided only when “-1” is specified
for the power supply code.
A1009WD 1 Provided only when “-1” is specified
for the power supply code.
A1024WD 1 Provided only when “-1” is specified
for the power supply code.
A1023WD 1 Provided only when “-1” is specified
for the power supply code.
5 AC adapter B9230ZW 1 Provided only when power supply
code is -2.
6 Power cord for – 1
AC adapter
7 DC power supply A1105JC 1 Provided only when power supply
ternial connector code is -2.
8 Fuse A1352EF 1 250 V 4 A, time lag (for 12 VDC
power supply model)
9 User’s Manual M3641 1 This manual
10 User’s Manual M3643 1 Communication function
11 User’s Manual M3645 1 Application software
v
Page 12

Checking the Contents of the Package
Optional Accessories (Sold Separately)
The following optional accessories are available for purchase separately. If you make an
order, make sure that all items are present and undamaged.
For information about ordering accessories, contact the dealer from which you
purchased the recorder.
Number Part Name Part Number/Model Q’ty Notes
1 3.5" floppy disk 7059 00 10 2HD
2 Zip disk A1053MP 1 100 MB
3 ATA flash memory card A1134UN 1 20 MB
4 Shunt resistor 4159 20 1 250 Ω ±0.1%
(for the screw terminal) 4159 21 1 100 Ω ±0.1%
5 Shunt resistor 4389 20 1 250 Ω ±0.1%
(for the clamp input terminal) 4389 21 1 100 Ω ±0.1%
6 Fuse A1352EF 4 250 V 4 A, time lag
4159 22 1 10 Ω ±0.1%
4389 22 1 10 Ω ±0.1%
(for 12 VDC power
supply model)
vi
Page 13

How to Use this Manual
Structure of the Manual
This User’s Manual consists of the following 14 chapters, an appendix, and an index.
For information about the communication functions and the standard software, see the
respective manuals (M3643 and M3644).
Chapter Title and Contents
1 Overview of Functions
2 Before Using the Recorder
3 Names of Parts/Run Mode/Common Operations
4 Switching Operation Screens
5 Measurement Channel Settings
6 Acknowledging and Setting Alarms
7 Setting and Operating the Display
8 Data acquisition and Saving to External Storage Medium
9 Managing Files and Initializing Data
10 Other Functions
11 Computation/Report Function (Option)
12 Troubleshooting
13 Maintenance
14 Specifications
Appendix Describes the initial values of the setting mode and basic setting mode, file
Index
Describes the functions of the recorder.
Describes the installation and wiring procedures.
Describes the names of each part of the recorder, how to use the storage
medium drive, run mode, and common key operations.
Describes how to use the operation screen such as the trend display and digital
display. Describes the operations that can be performed using the arrow keys
and the DISP/ENTER key on the front panel.
Describes how to set input specifications such as the range, filter, moving
average, scan interval, integration time of the A/D converter, burnout, and
reference junction compensation.
Describes how to acknowledge alarms and how to set alarms.
Describes how to set the display specification of the operation screen, how to
display messages, and other display-related operations.
Describes how to acquire the measured/computed data and how to save the data
to the external storage medium.
Describes how to save and load the setup data, manage files on the external
storage medium, save the data residing in the internal memory to the external
storage medium using key operations, initialize the internal memory, and other
operations.
Describes how to set and operate key lock, key login/logout, and other functions.
Describes how to use the optional computation (report) function.
Describes the error messages and the troubleshooting measures of the recorder.
Describes fuse replacement and other information.
Describes the specifications of the recorder.
formats of ASCII files.
Note
This manual covers information regarding RD-MV100s that have a language code “-2”
(English).
vii
Page 14
How to Use this Manual
Conventions Used in this Manual
Unit
K ....... Denotes “1024.” Example : 768 KB (File capacity)
k ........ Denotes “1000.”
M ....... Denotes “1024K.” Example : 1.2 MB (Storage capacity of floppy disks)
B ....... “Bytes.” Example : 1.2 MB (Storage capacity of floppy disks)
Symbols
The following symbols are used in this manual.
Affixed to the instrument. Indicates danger to personnel or
instrument and the operator must refer to the User’s Manual.
The symbol is used in the User’s Manual to indicate the
reference.
WARNING
CAUTION
Note
Notation regarding procedures
On pages that describe the operating procedures in Chapter 3 through 11, the following
symbols are used to distinguish the procedures from their explanations.
[ ] ............. Represents contents that are displayed on the screen. Example : [Volt]
⇒ “ ” ........ Indicates a reference item. Example : ⇒ “1.3 Display Function”
#1
Procedure
Explanation
to
Describes precautions that should be observed to prevent injury
or death to the user.
Describes precautions that should be observed to prevent minor
or moderate injury, or damage to the instrument.
Provides important information for the proper operation of the
instrument.
#12
Follow the steps indicated with numbers. The procedures are
given with the premise that the user is carrying out the steps for the
first time
This section describes the setting parameters and the liitations
regarding the procedures. It does not give a detailed explanation of
the function. For detail on the function, see chapter 1.
...... Denotes the soft key that is used to make a
selection on the setting and basic setting menus.
viii
Page 15

Contents
1
Foreword ......................................................................................................................................... i
Safety Precautions .......................................................................................................................... ii
Checking the Contents of the Package ..........................................................................................iv
How to Use this Manual ................................................................................................................ vii
Chapter 1 Overview of Functions
1.1 Overview of the MV100 .................................................................................................... 1-1
1.2 Functions of the Input Section ......................................................................................... 1-2
1.3 Display Function .............................................................................................................. 1-5
1.4 Storage Function ............................................................................................................ 1-15
1.5 Alarm Function ............................................................................................................... 1-17
1.6 Computation Function and Report Function (/M1, Option) ...........................................1-20
1.8 Other Functions ............................................................................................................. 1-24
Chapter 2 Before Using the Recorder
2.1 Precautions on the Use of the Recorder .......................................................................... 2-1
2.2 Installing the Recorder ..................................................................................................... 2-2
2.3 Input Signal Wiring ........................................................................................................... 2-3
2.4 Alarm Output Wiring (/A1 to /A3, Option) ......................................................................... 2-7
2.5 FAIL/Memory End Wiring (/F1, Option) ............................................................................ 2-9
2.6 Remote Control Wiring (/R1, Option) ............................................................................. 2-11
2.7 Power Supply Wiring ...................................................................................................... 2-13
Chapter 3 Names of Parts/Run Mode/Common Operations
3.1 Names of Parts and Functions ......................................................................................... 3-1
3.2 Turning ON/OFF the Power Switch.................................................................................. 3-4
3.3 Inserting/Removing the External Storage Medium .......................................................... 3-5
3.4 Run Mode ........................................................................................................................ 3-7
3.5 Configuring the Functions .............................................................................................. 3-10
3.6 Common Key Operations ............................................................................................... 3-19
3.7 Setting the Date and Time ............................................................................................. 3-23
2
3
4
5
6
7
8
9
10
11
12
Chapter 4 Switching Operation Screens
4.1 Operation Screens ........................................................................................................... 4-1
4.2 Explanation of the Status Display Section ....................................................................... 4-2
4.3 Using the Trend, Digital, and Bar Graph Screens ............................................................ 4-5
4.4 Using the Overview Screen ........................................................................................... 4-11
4.5 Using the Information Screen (Alarm Summary, Message Summary, and
Memory Summary) ........................................................................................................ 4-13
4.6 Using the Historical Trend .............................................................................................. 4-18
Chapter 5 Measurement Channel Settings
5.1 Voltage Input Setting ........................................................................................................ 5-1
5.2 Thermocouple (TC)/Resistance Temperature Detector (RTD) Setting ............................ 5-3
5.3 Digital Input (DI) Setting ................................................................................................... 5-5
5.4 Difference Computation (Delta) Setting ........................................................................... 5-7
5.5 Scaling Setting ................................................................................................................. 5-9
13
14
App
Index
ix
Page 16

Contents
5.6 Square Root Computation Setting ................................................................................ 5-11
5.7 Skip Setting ...................................................................................................................5-13
5.8 Input Filter and Moving Average Setting .......................................................................5-14
5.9 Setting the A/D Integration Time, Scan Interval, Burnout, and Reference Junction
Compensation (Basic Setting Mode) ............................................................................. 5-15
Chapter 6 Acknowledging and Setting Alarms
6.1 Releasing the Alarm Indication and Output Relay (Option) ............................................. 6-1
6.2 Alarm Setting ................................................................................................................... 6-5
6.3 Setting the Alarm Delay Period ........................................................................................ 6-8
6.4 Setting the Auxiliary Alarm Function (Basic Setting Mode) ............................................ 6-10
Chapter 7 Setting and Operating the Display
7.1 Setting Tag Names ........................................................................................................... 7-1
7.2 Selecting Tag Display or Channel Display (Basic Setting Mode) ..................................... 7-2
7.3 Setting the Display Rate (Trend) ...................................................................................... 7-3
7.4 Using Message Strings (Trend) ....................................................................................... 7-4
7.5 Setting the Message String (Trend) ................................................................................. 7-7
7.6 Setting Groups ................................................................................................................. 7-8
7.7 Setting the Trip Line (Trend) .......................................................................................... 7-10
7.8 Setting the Channel Display Colors (Trend, Bar Graph) ................................................ 7-12
7.9 Using Zone Displays (Trend) ......................................................................................... 7-13
7.10 Setting the Scale Division, Bar Graph Base Position (Bar Graph), and Scale Position
(Trend) ........................................................................................................................... 7-15
7.11 Using Partial Expansion Display (Trend) ....................................................................... 7-20
7.12 Setting Whether or Not to Use the Partial Expansion Display (Basic Setting Mode) ..... 7-22
7.13 Setting the Display Direction, Background Color, Waveform Line Width,
Trip Line Width, Grid, and Scroll Time ........................................................................... 7-23
7.14 Setting the Brightness of the Screen and the Backlight Saver Function ........................ 7-25
Chapter 8 Data Acquisition and Saving to External Storage Medium
8.1 Data Types to be Acquired and Saved ............................................................................. 8-1
8.2 Function to Acquire Display Data and Event Data ........................................................... 8-3
8.3 Function to Acquire Other Data........................................................................................ 8-9
8.4 Function that Saves the Data in the Internal Memory to the External Storage Medium 8-10
8.5 Acquiring Display Data ................................................................................................... 8-12
8.6 Acquiring Event Data ..................................................................................................... 8-13
8.7 Saving the Data in the Internal Memory to the External Storage Medium ..................... 8-15
8.8 Setting the Auto Save Interval for the Display Data ....................................................... 8-18
8.9 Setting the File Header, Directory Name, and the Saved Data during Manual Save..... 8-20
8.10 Setting the Channels to Display the Trend and Acquire the Data (Basic Setting Mode) 8-22
8.11 Setting the Method of the Display/Event Data Acquisition (Basic Setting Mode)........... 8-23
8.12 Storing Measured/Computed Data at Arbitrary Times (Manual Sampling) .................... 8-26
Chapter 9 Managing Files and Initializing Data
9.1 Saving/Loading Setup Data ............................................................................................. 9-1
9.2 Saving Data in the Internal Memory to the External Storage Medium
Using Key Operation ........................................................................................................ 9-5
9.3 Viewing Display Data in the External Storage Medium .................................................... 9-6
9.4 Viewing Event Data in the External Storage Medium ...................................................... 9-7
x
Page 17

Contents
9.5 Managing Files/Displaying Free Space on the External Storage Medium ....................... 9-8
9.6 Saving the Screen Image ...............................................................................................9-13
9.7 Clearing Data from the Internal Memory ........................................................................ 9-14
9.8 Initializing Setup Data .................................................................................................... 9-15
Chapter 10 Other Functions
10.1 Using Key Lock .............................................................................................................. 10-1
10.2 Setting the Key Lock Function (Basic Setting Mode) ..................................................... 10-2
10.3 Using the Key Login/Logout Function ............................................................................ 10-4
10.4 Setting the Key Login/Logout Functions (Basic Setting Mode) ...................................... 10-6
10.5 Displaying the Log Screen/System Screen .................................................................... 10-8
10.6 Setting the Memory End Relay Output Time (Option, /F1, Basic Setting Mode) ......... 10-10
10.7 Setting the Remote Control Functions (Option, /R1, Basic Setting Mode) ................. 10-11
10.8 Setting the Displayed Language (Basic Setting Mode) ............................................... 10-14
10.12 Using the Daylight Savings Time Adjustment Function ............................................... 10-20
10.13 Setting the Temperature Unit (Basic Setting Mode) ..................................................... 10-22
Chapter 11 Computation/Report Function (Option)
11.1 Overview of the Computation Function .......................................................................... 11-1
11.2 Explanation of Computing Equations ............................................................................. 11-4
11.3 Using the Computation Function .................................................................................... 11-8
11.4 Setting Computation Channels .................................................................................... 11-10
11.5 Setting the Alarm.......................................................................................................... 11-12
11.6 Setting Constants ......................................................................................................... 11-14
11.7 TLOG Computation ...................................................................................................... 11-15
11.8 Setting the Timer Number and Sum Unit for TLOG Computation ................................ 11-17
11.9 Setting the Timer (Basic Setting Mode) ....................................................................... 11-18
11.10 Using the Rolling Average............................................................................................ 11-20
11.11 Overview of the Report Function ................................................................................. 11-22
11.12 Using the Report Function ........................................................................................... 11-25
11.13 Setting the Report Function ......................................................................................... 11-26
1
2
3
4
5
6
7
8
9
10
11
Chapter 12 Troubleshooting
12.1 A List of Messages ......................................................................................................... 12-1
12.2 Troubleshooting Flow Chart ........................................................................................... 12-8
Chapter 13 Maintenance
13.1 Periodic Maintenance .................................................................................................... 13-1
13.2 Replacing the Fuse ........................................................................................................ 13-2
13.3 Calibration ...................................................................................................................... 13-3
13.4 Recommended Replacement Periods for Worn Parts ................................................... 13-5
Chapter 14 Specifications
14.1 Input Specifications ....................................................................................................... 14-1
14.2 Display Specifications .................................................................................................... 14-3
14.3 Data Storage Specifications .......................................................................................... 14-5
14.4 Alarm Function Specifications ....................................................................................... 14-8
14.5 Specifications of Communication Functions .................................................................14-9
12
13
14
App
Index
xi
Page 18

Contents
Appendix
Index
14.6 Specifications of Optional Functions ........................................................................... 14-10
14.7 General Specifications ................................................................................................. 14-13
14.8 Dimentional Drawings .................................................................................................. 14-18
Appendix 1 Parameters and Initial Settings ............................................................................ App-1
Appendix 2 Data Formats of ASCII Files ................................................................................. App-7
xii
Page 19
Chapter 1 Overview of Functions
RD-MV100
External storage media
Floppy disk
Zip disk
ATA flash memory card
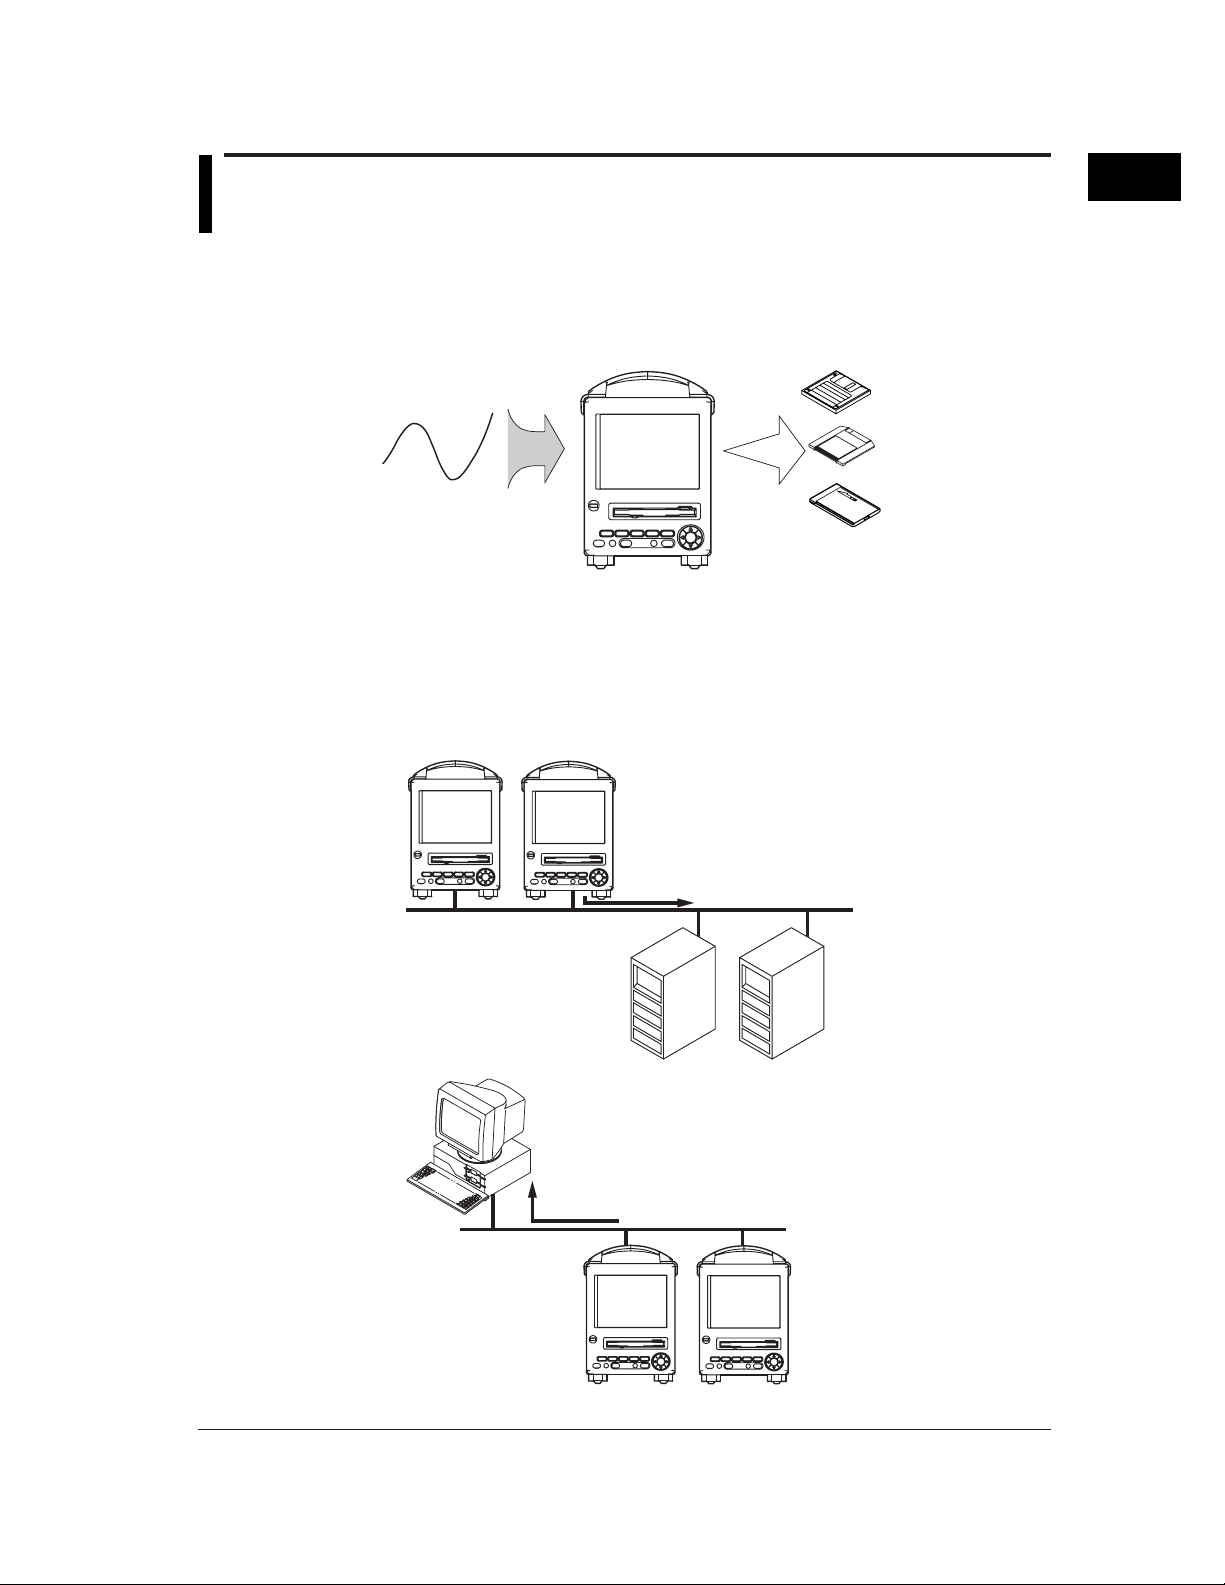
1.1 Overview of the RD-MV100
Unlike conventional recorders that record data on charts, the RD-MV100 displays the
measured data acquired in the internal memory to a LCD in the form of waveforms,
numerical values, and bar graphs. The measured data can also be saved to external
storage media such as floppy disks, Zip disks, and ATA flash memory cards.
The data that have been saved to an external storage medium can be displayed on a PC
using the standard software that comes with the package. The data can also be loaded
into the RD-MV100 to be displayed.
By using the Ethernet interface that comes standard with the RD-MV100, the data can
be transferred to a server on a network (client function). The data stored on the RDMV100’s external storage medium can also be read from a PC on the network (server
function).
1
Overview of Functions
RD-MV100
PC
The communication functions such as the Ethernet interface are not covered in this
manual. See the RD-MV100 Communication Interface User’s Manual (M3643).
RD-MV100
Measured data
Server
Primary Secondary
Data on the external storage medium
RD-MV100
RD-MV100
1-1
Page 20

1.2 Functions of the Input Section
Number of Measurement Channels/Scan Interval
The number of measurement channels and scan intervals for different models are listed
in the table below. For the procedure related to setting the scan interval, see section 5.9.
Model Number of Measurement Channels Scan Interval
RD-MV102 2 channels 125 ms or 250 ms
RD-MV104 4 channels 125 ms or 250 ms
RD-MV106 6 channels 1 s or 2 s
RD-MV112 12 channels 1 s or 2 s
Input Type and Computation
You can select the input type of a measurement channel from DC voltage, thermocouple,
resistance temperature detector (RTD), and ON/OFF input (contact signal or voltage
signal). You can also perform computation on the measured data such as the
“difference,” “square root,” and “scaling.”
The input type and computation are configured as an “input mode” on the RD-MV100.
For the procedure related to setting the different modes, see sections 5.1 to 5.7.
Input Mode Notation*1Description
DC voltage Volt Measures a DC voltage in the range ±20 mV to ±20 V.
Thermocouple TC Measures the temperature corresponding to the appropriate
Resistance RTD Measures the temperature corresponding to the appropriate
temperature range for Pt100, JPt100, Cu10*2, and CU25*2.
detector
ON/OFF input DI Displays the contact input or voltage input signals by
Difference Delta When the input type*3 is set to “DC voltage,” “thermocouple,”
Square root Sqrt When the input type*3 is set to “DC voltage,” the square root
Scaling Scale When the input type*3 is set to “DC voltage,” “thermocouple,”
Skip Skip Channels that are not measured. They are not displayed.
range for R, S, B, K, E, J, T, N, W, L, and U.
correlating them to 0% or 100% of the display range.
Contact input: Closed contact is ON (1). Open contact is
OFF (0).
Voltage input: Less than 2.4 V is OFF (0). Greater than or
equal to 2.4 V is ON (1)
“RTD,” or “ON/OFF input,” the value obtained by subtracting
the measured value of another channel (this channel is
called a “reference channel”) from the input signal of the
channel set to compute the difference is displayed as the
measured value of that channel.
of the input signal of the channel set to compute the square
root is displayed as the measured value of that channel.
The computed result can be scaled to a value in the
appropriate unit and displayed.
“RTD,” or “ON/OFF input,” the input signal can be converted
to a value in the appropriate unit desired and displayed.
1-2
*1 Notation used by the RD-MV100 to represent the input modes. It is used when setting the
measurement channels.
*2 This is optional.
*3 This item defines the type of signals that can be connected to the input terminal when the
input mode is set to “Difference,” “Square root,” or “Scaling.” The description of the input
types, “DC voltage,” “Thermocouple,” “Resistive temperature detector,” and “ON/OFF input,”
are the same as the descriptions given for the input modes, “DC voltage,” “Thermocouple,”
“Resistive temperature detector,” and “ON/OFF input,” respectively.
Page 21
1.2 Functions of the Input Section
If the signal to be measured is a DC current, a shunt resistance is attached to the input
terminal to convert the current signal to a voltage signal. The input mode is set to “DC
voltage” in this case. For the various types of shunt resistors and the procedure related
to setting the current input, see section 5.1.
Input Range and Measurable Range
You can select the “Input range” that is appropriate for the input signal for “DC voltage,”
“Thermocouple,” “RTD,” and “ON/OFF input.” (For example, R, S, B, K, E, J, T, N, W, L,
and U are available input ranges for “Thermocouple.”) For each “Input range,” a
measurable range is defined (for example, the measurable range for /R of
“Thermocouple” is “0.0°C to 1760°C”). For details, see section 14.1.
Burnout
When measuring temperature using a thermocouple and the thermocouple burns out,
you can specify the measurement result to be set to positive over range or negative over
range. Burnout can be set on each measurement channel. The initial setting is set so
that burnout is not indicated. For the setting procedure, see section 5.9.
*1 Positive over range is a condition in which the input signal is over the upper limit of
the measurable range. The measured value is indicated as “+
*2 Negative over range is a condition in which the input signal is below the lower limit of
the measurable range. The measured value is indicated as “–
Reference Junction Compensation (RJC)
When measuring the temperature using a thermocouple, the reference junction
compensation can be used. You can select whether to use the reference junction
compensation provided by the recorder or external reference junction compensation. If
you are using external reference junction compensation, you will also set the reference
voltage. The initial setting is set so that the reference junction compensation provided by
the recorder is used. For the setting procedure, see section 5.9.
1
Overview of Functions
.”
.”
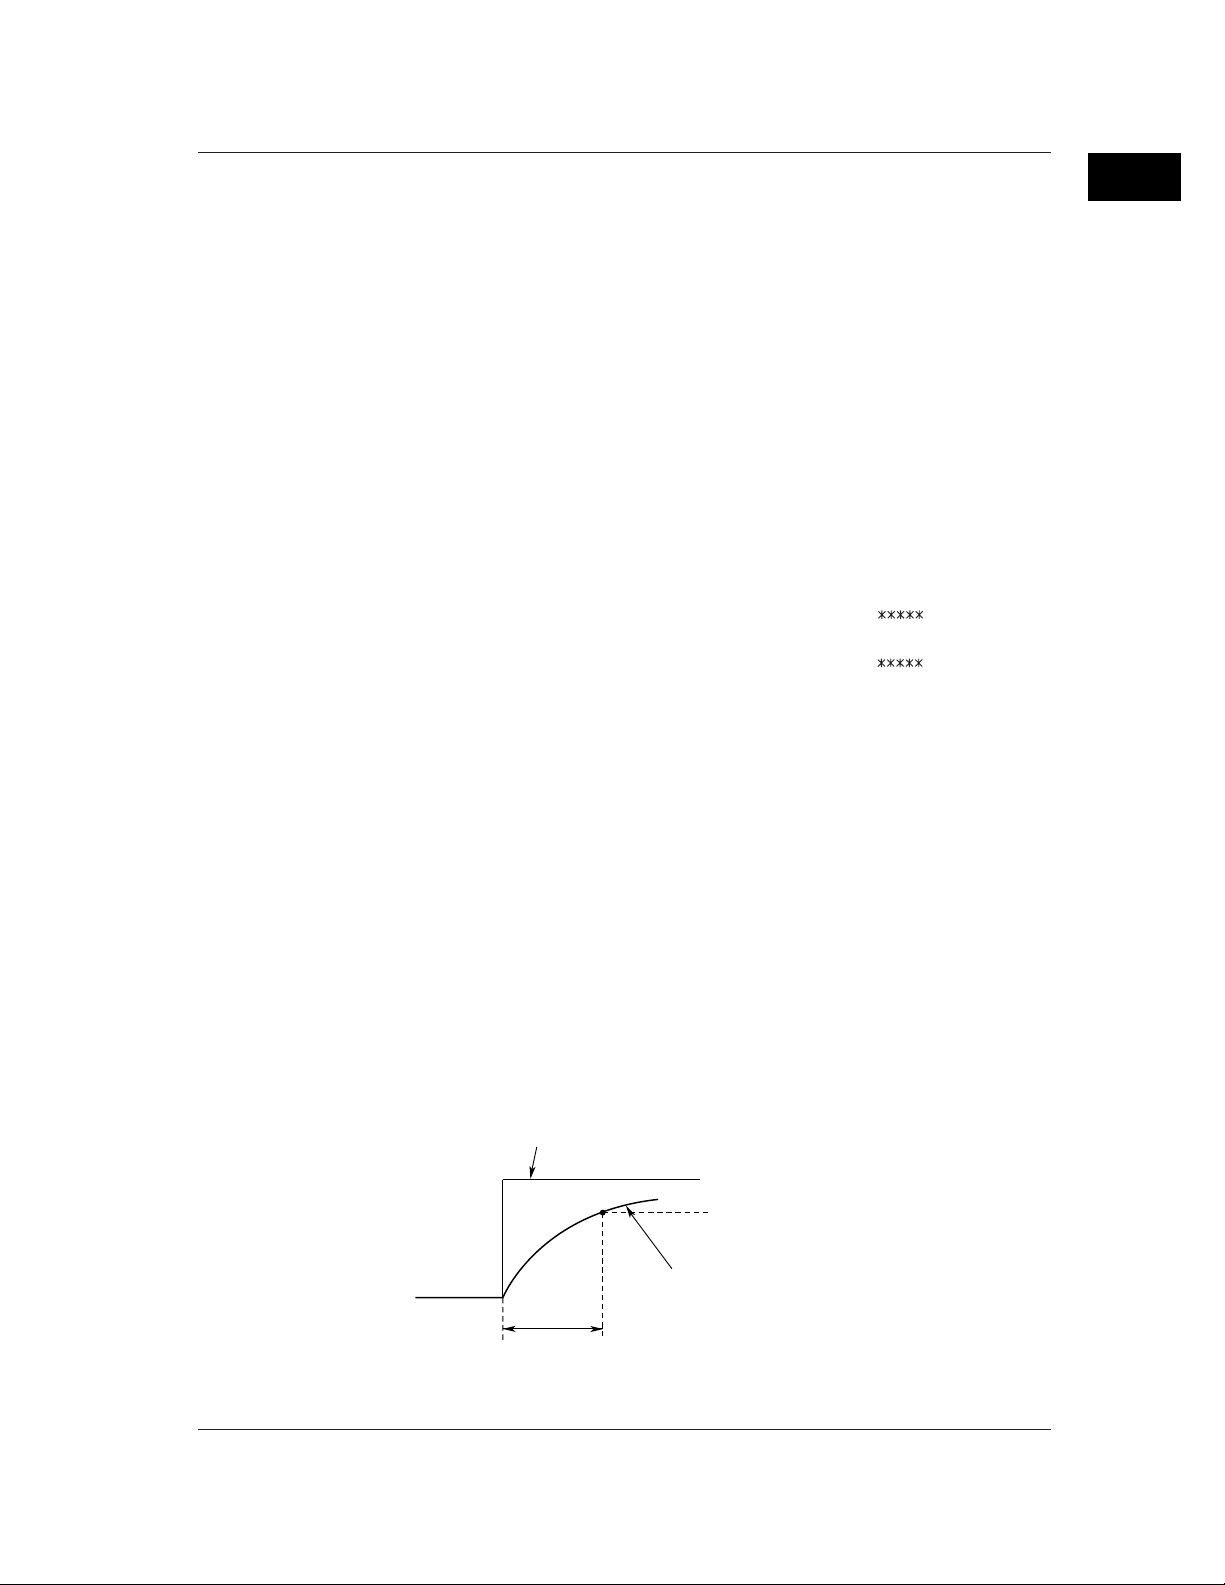
Filter and Moving Average
The filter and moving average are used to suppress the effects of noise that is riding on
the signal. Filtering is provided on the RD-MV102 and RD-MV104. Moving average is
provided on the RD-MV106, and RD-MV112. The filter or moving average can be set on
each channel. For the setting procedure, see section 5.8.
Filter function (RD-MV102 and RD-MV104)
Suppresses the effects of noise above the frequency determined by the specified time
constant. The time constant can be set to 2 s, 5 s, or 10 s. The filter is initially turned
OFF.
Effects of using filter (Output response fot a step input)
Input
63.2% of the output value
Output response curve (when using the filter)
2, 5, 10 s (time constant, the time it takes to reach 63.2% of the output value)
1-3
Page 22
1.2 Functions of the Input Section
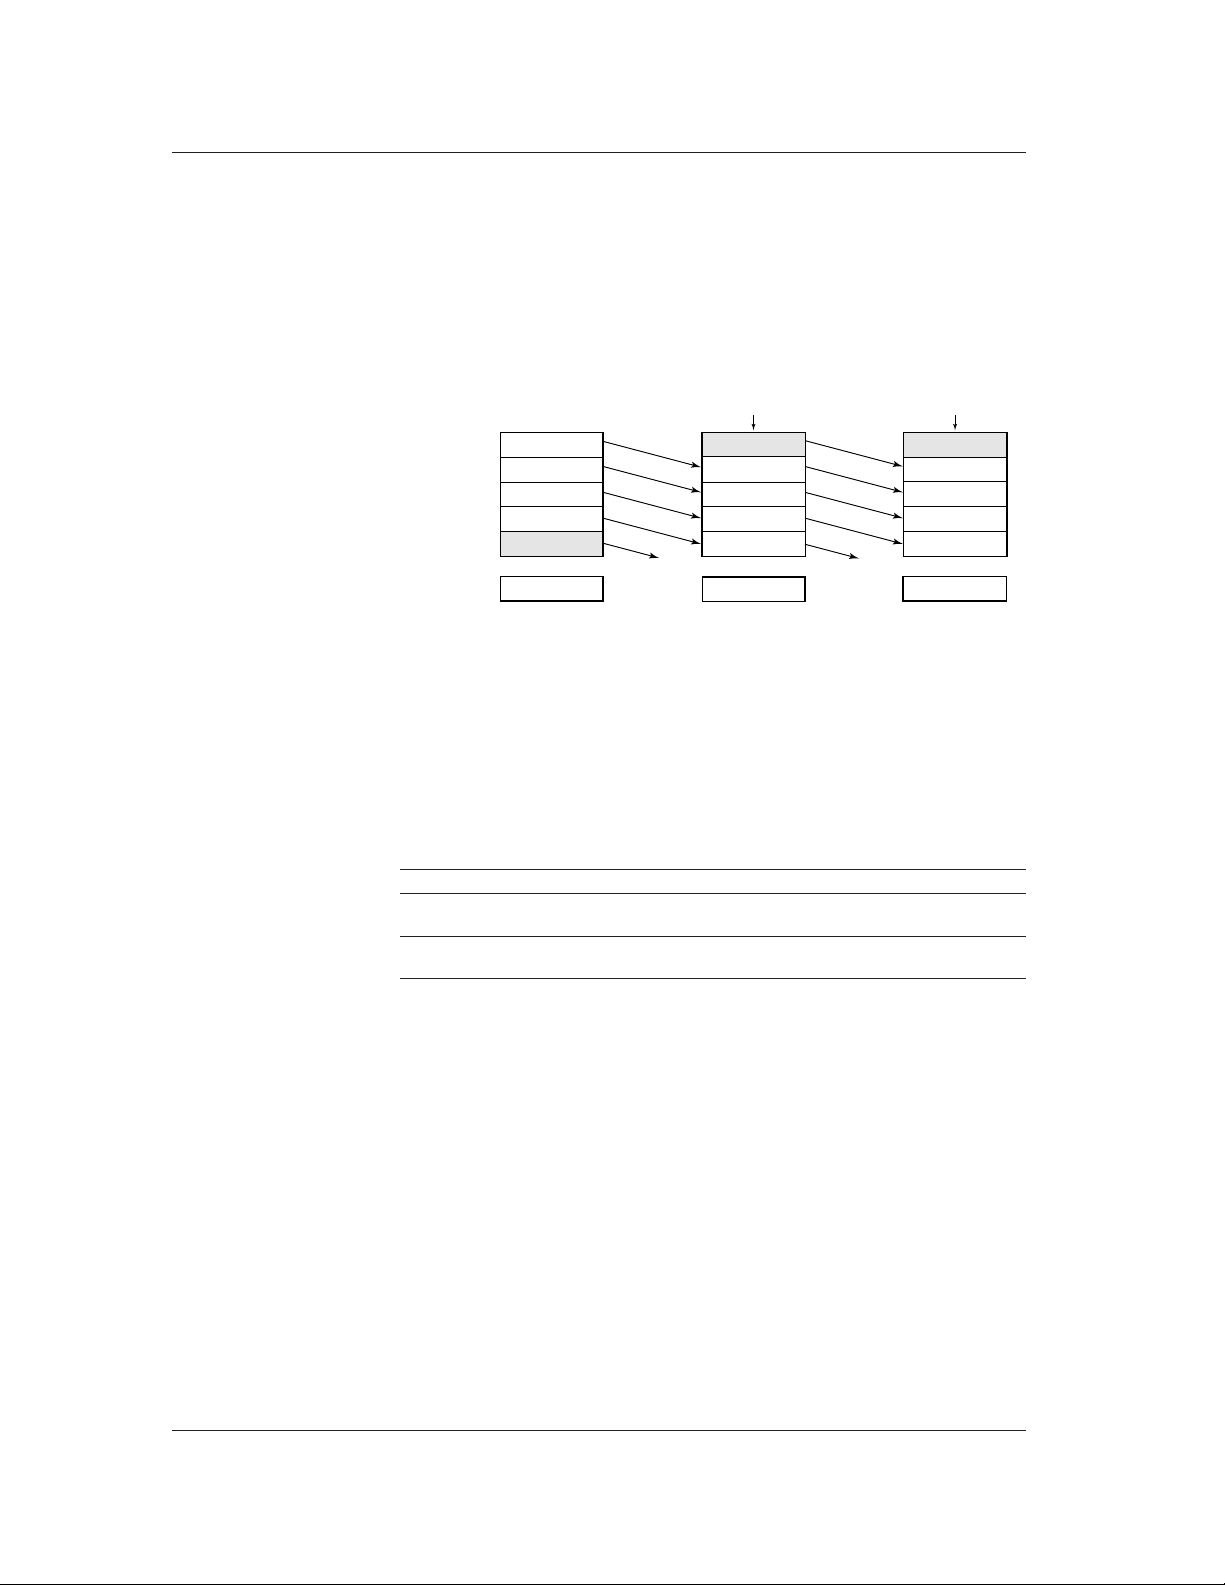
Moving average (RD-MV106, and RD-MV112)
The input signal of the measurement channel is set to the averaged value of the m most
current data points (the number of moving-averaged data points) acquired at the scan
interval. The number of moving-averaged data points can be set in the range 2 to 16.
The moving average is initially turned OFF.
The figure below shows an example indicating the operation of the buffer for the moving
average computation when the number of moving averaged data points is set to “5.”
Buffer data at the
nth sampling
10.0 mV
1
5.0 mV
2
0.0 mV
3
–5.0 mV
4
–10.0 mV
5
Moving average value
0.0 mV
Integration Time of the A/D Converter
The recorder uses an A/D converter to convert the sampled analog signal to a digital
signal. By setting the integration time to match the time period corresponding to one
cycle of the power supply or an integer multiple of one cycle, the power supply frequency
noise can be effectively eliminated. The integration time of the A/D converter is selected
according to the model from the table below. If “Auto” is selected, the recorder will
automatically detect the power supply frequency and select 16.7 ms or 20 ms. Because
100 ms is an integer multiple of 16.7 ms and 20 ms, this setting can be used to eliminate
the power frequency noise for either frequency, 50 Hz or 60 Hz. 100 ms is available on
the RD-MV106, and RD-MV112. For the setting procedure, see section 5.9.
Model Integration Time of the A/D Converter
RD-MV102/RD-MV104 Select 16.7 ms (60 Hz), 20 ms (50 Hz), or auto (automatically switches
RD-MV106/RD-MV112 Select 16.7 ms (60 Hz), 20 ms (50 Hz), 100 ms, or auto (automatically
16.7 ms/20 ms, fixed to 20 ms for 12 VDC power supply model)
switches 16.7 ms/20 ms, fixed to 20 ms for 12 VDC power supply model)
Deleted
Buffer data at the
n+1th sampling
New data
15.0 mV
10.0 mV
5.0 mV
0.0 mV
–5.0 mV
5.0 mV
Buffer data at the
n+2th sampling
New data
10.0 mV
15.0 mV
10.0 mV
5.0 mV
0.0 mV
Deleted
8.0 mV
1-4
Page 23
1.3 Display Function
Common Items Related to the Display
5.5" TFT color LCD and the screen configuration
The recorder has a 5.5" TFT color LCD (320-by-240 dot resolution). The screen consists
of the status display section and the data display section.
Status display section
Displays the displayed screen name, date and time, internal memory/external storage
medium usage condition, alarm condition, key lock, user name (key login function), and
computation condition (option). For details, see section 4.2.
• Data display section
• Displays the operation screen such as the trend display, digital display, and bar
graph display of the measured and computed data as well as alarm, message, and
file information.
• Displays the setup screen for the setting and basic setting modes when the
recorder is being configured. For details related to the setting and basic setting
modes, see section 3.5.
1
Overview of Functions
Status display section
Data display section
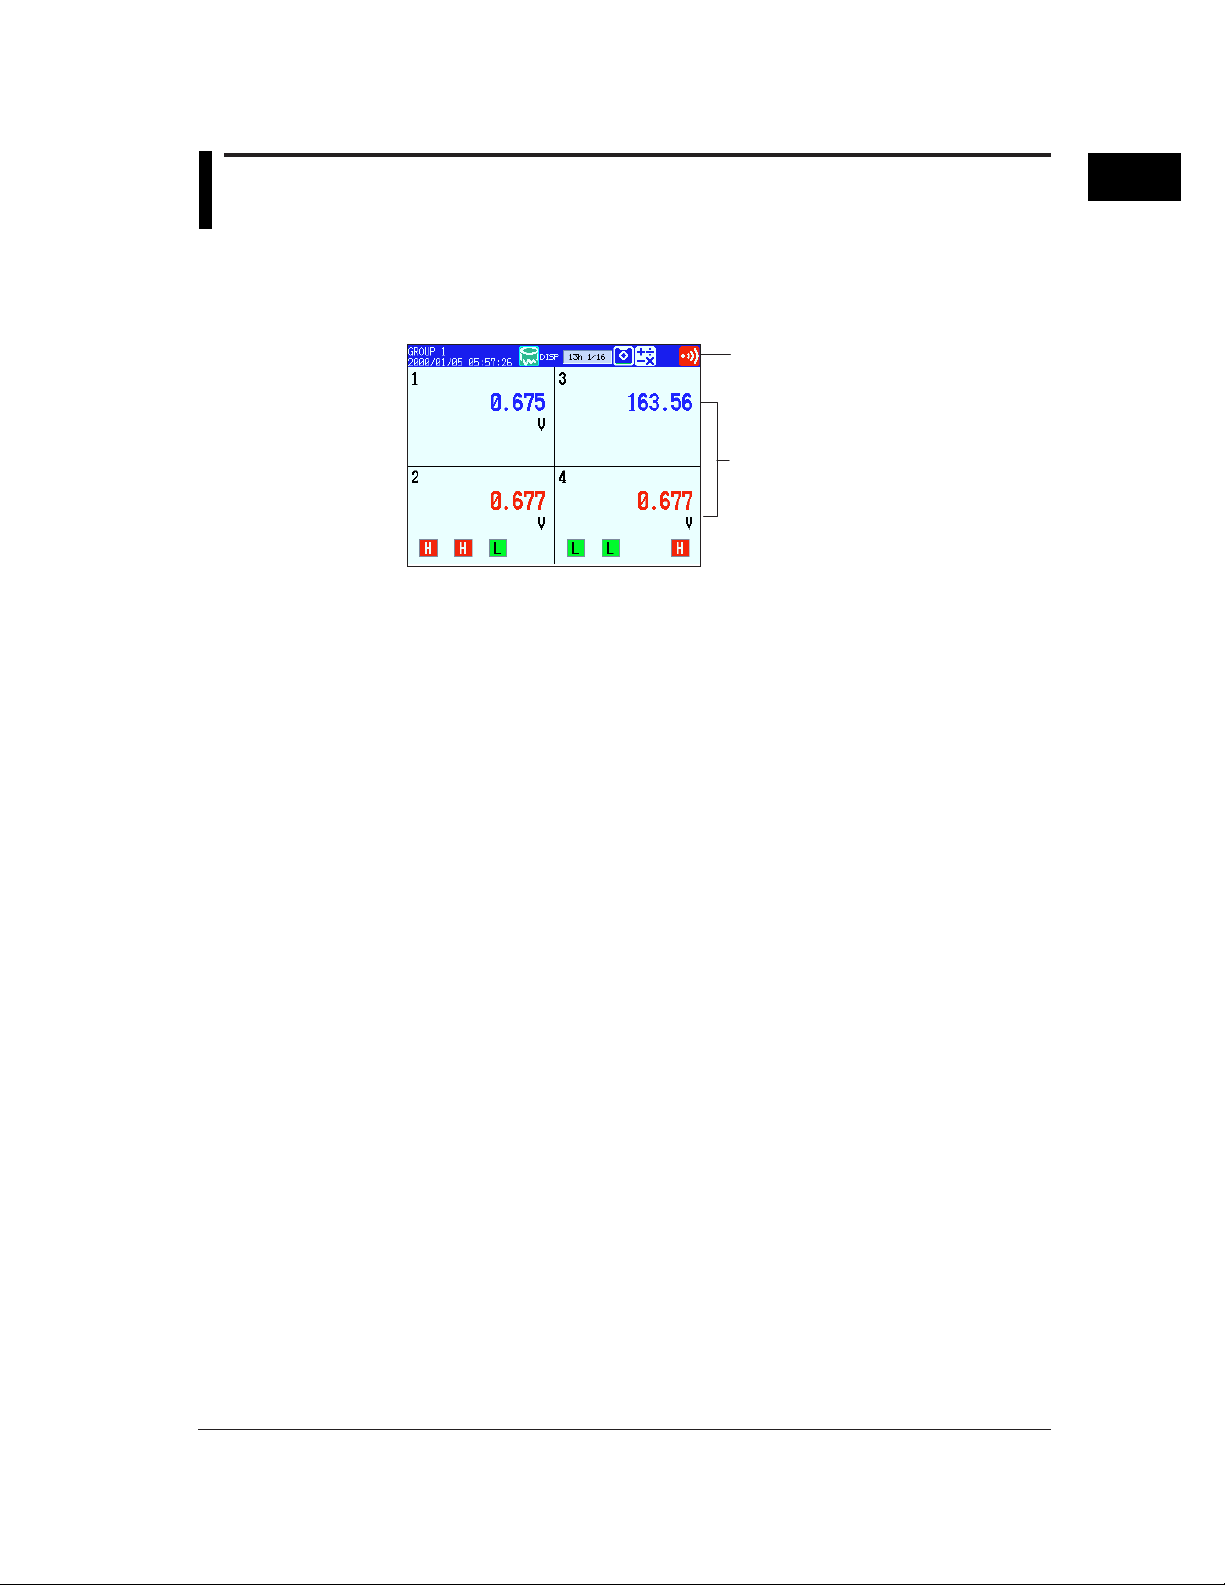
(example of a digital display)
Group display
The data displayed on the trend, digital, and bar graph displays are the data of
measurement or computation channels that are assigned to the group. Up to 6 channels
can be assigned to a single group. For the procedure used to assign channels to
groups, see section 7.6, “Setting Groups.” Up to four groups can be registered. The
groups are common to the trend, digital, and bar graph displays.
On the trend, digital, and bar graph displays, the displayed groups can be automatically
switched at 5 s, 10 s, 20 s, 30 s, or 1 min intervals.
Channel number of tag display
The channels can be displayed as channel number or tags. The setting applies to all
channels. For the procedure related to the selecting the channel display or tag display,
see section 7.2. For the procedure related to setting the tags, see section 7.1.
1-5
Page 24
1.3 Display Function
Trend Screen
Displays the waveform of the measured and computed data. The direction of the
waveform display can be set to horizontal or vertical. For details related to the display
method, see section 4.3.
Trend display
Scale
Display update rate(Time/div)
Message
Trip line
Channel/Tag
Measured/computed value
Unit
Alarm mark
Numerical display section
Waveform of all channels
Data of selected group
Updating the waveform and updating the numerical display
One division on the RD-MV100 consists of 30 dots on the LCD. The displayed waveform
is updated at an interval corresponding to one dot. This interval is determined by the
time period corresponding to one division (referred to as the display update rate). The
relationship between the display update rate and the speed of movement of waveforms
is as follows:
Display Update 1 min 2 min 5 min 10 min 20 min 30 min 1 h 2 h 4 h
Rate (/div)
Speed of movement 594 297 119 59 30 20 10 5 2.5
(approximate value, mm/h)
Note
The speed of movement of the trend display along the time axis is derived from the following
equation given the dot pitch of the LCD (0.33 mm):
The speed of movement of the trend display along the time axis = 30 (dots) × 0.33 (mm) × 60
(min)/display update rate (min)
Measured and computed values are updated every second. However, when the scan
interval on the RD-MV106/RD-MV112 is 2 s, the display update rate is also 2 s.
1-6
Page 25
1.3 Display Function
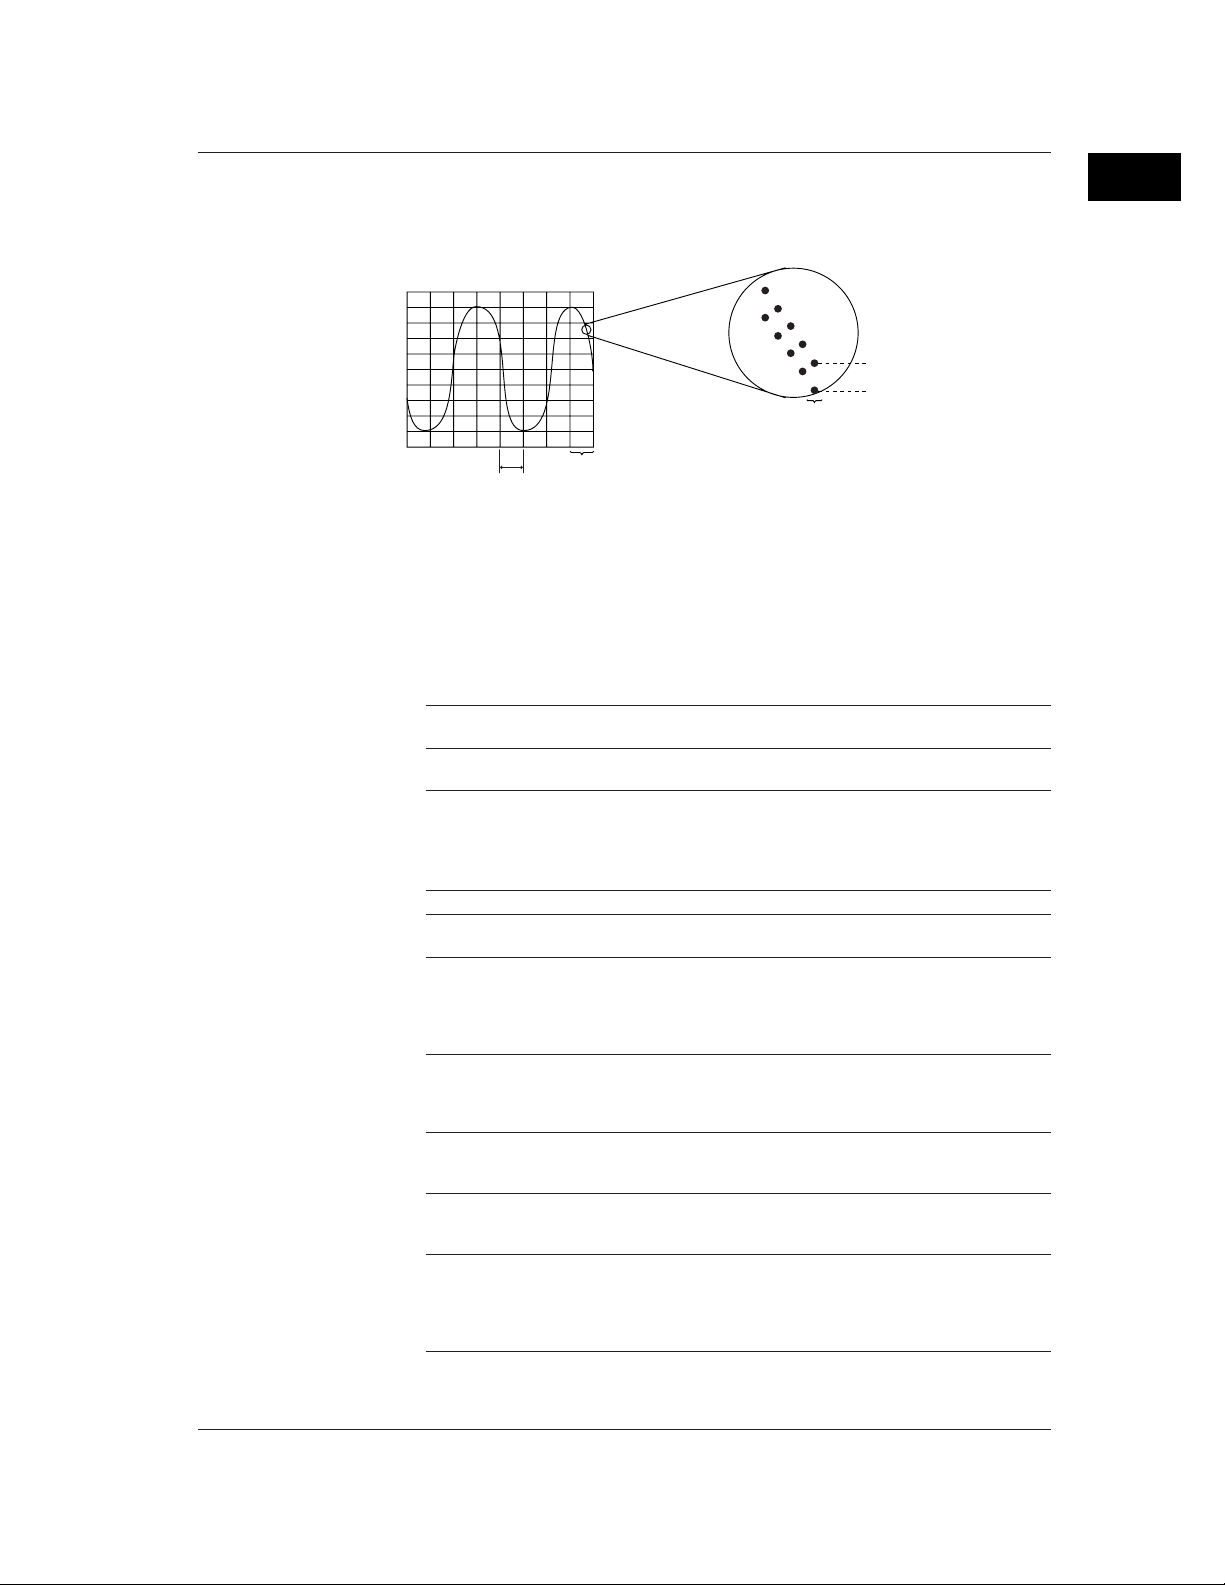
Displayed data
The data displayed on the screen are a maximum and minimum values of the data that
are sampled at the scan interval, within the time period corresponding to one dot.
Displayed data of the waveform (when the display update rate is set to one minute)
Maximum value
Minimum value
2 s (1 dot)
When the display update rate is set to one
1 division (30 dots)
1 min
minute, the time period corresponding to
one dot (the sampling interval of displayed
data) is 2 s.
The time period corresponding to one dot is called “the sampling interval of displayed
data.” The sampling interval of displayed data is determined by the display update
interval.
The relationship between the display update rate and the sampling interval of displayed
data is as follows:
For the procedure related to setting the display update rate, see section 7.3.
Display Update 1 min 2 min 5 min 10 min 20 min 30 min 1 h 2 h 4 h
Rate (/div)
Sampling interval 2 4 10 20 40 60 120 240 480
of displayed data (s)
1
Overview of Functions
Displayed information
The following Information can be displayed.
Information Description
All channel display All the channels that were set to display the trend are
Message display Messages specified by the user can be displayed at
Display direction of waveforms The waveform can be displayed vertically or horizontally.
Displayed color of waveforms The displayed color of waveforms can be specified for each
Thickness of waveform lines You can select from three types: 1, 2, or 3 dots. The
Trip line display Displays a line to indicate a particular value of interest (trip
displayed on one trend screen. ⇒“Sections 4.3 and 8.10”
arbitrary points in time. For example, by displaying a
message when a certain operation is carried out, the point
at which the operation is carried out can be seen visually.
Displayed messages are stored. ⇒“Sections 7.4 and 7.5”
The vertical display is in the same direction as the chart
recorder and is convenient when the RD-MV100 is used
with the chart recorder. ⇒“Section 7.13”
channel. The color also applies to the bar graph display.
⇒“Section 7.8”
specified thickness of waveform lines applies to all
channels. ⇒“Section 7.13”
line) for each group. You can select the thickness of the
displayed line from three types: 1, 2, or 3 dots. Up to four
trip lines can be displayed on a single group. ⇒“Sections
7.7 and 7.13”
1-7
Page 26
1.3 Display Function
Information Description
Scale display A scale appropriate for the measured item can be displayed
Turn ON/OFF the numerical The numerical display section can be turned ON or OFF. If
display section the numerical display section is turned OFF, the display
Zone display The waveform of each channel is displayed in its display
Partial expanded display You can expand the important section of the display area.
for each channel. The number of divisions of the display
scale created by the main scale marks can be set to a value
in the range 4 to 12 div (also applies to the bar graph
display). Medium and small scale marks are displayed in
between the main scale marks.
You can select whether or not to display the scale for each
channel and the display position. ⇒“Section 7.10”
shows only the waveform and the scale. See section 4.3.
range (zone). The waveforms are easier to view, because
they do not overlap. See the explanation of the zone
display below. ⇒“Section 7.9”
See the explanation of the partial expanded display below.
⇒“Sections 7.11 and 7.12”
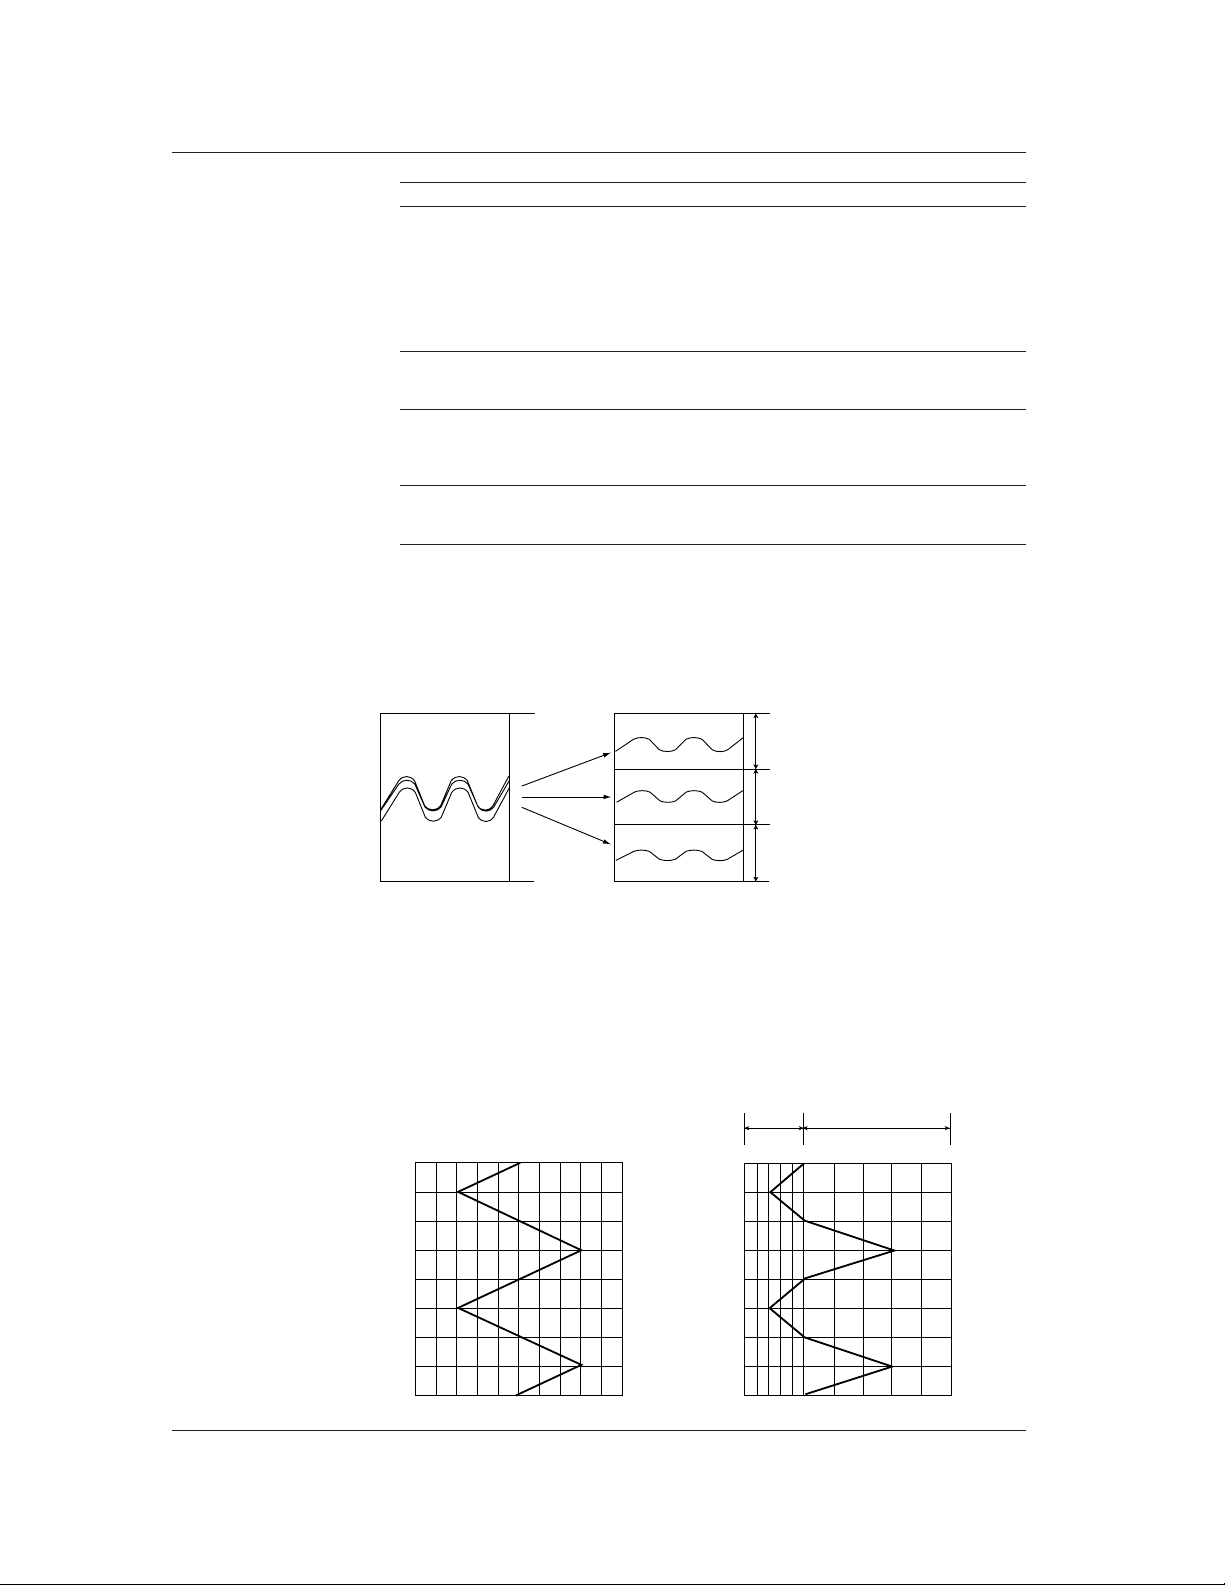
Explanation regarding the zone display
The display range of the measured/computed data is called a zone. Zones can be set
for each channel. The waveforms can be set in different zones, so that they are easier
to view. In the example shown in the figure below, channel 1 is displayed in the zone 0
to 30%, channel 2 in the zone 30 to 60%, and channel 3 in the zone 60 to 100%.
Normal display
100%
CH3
CH2
CH1
0%
Zone display
100%
Zone 3
60%
Zone 2
30%
Zone 1
0%
Explanation regarding the partial expansion display
By compressing a section of the display scale of the measured/computed data, the
remaining section of the display is expanded. You specify a value on the display scale
(boundary value) to be moved to another position on the display scale (boundary value
displacement position). In the example shown in the figure below, 0 V (boundary value)
is moved to the 30% position of the display scale (boundary value displacement
position). The section below the boundary (accounts for 30% of the entire display)
represents –6 V to 0 V and the section above the boundary (accounts for 70% of the
entire display) represents 0 V to 6 V.
% of full display span
0
50
100
Compressed
portion
0
Expanded portion
% of full display span
30
100
1-8
3 div
2 div
1 div
0
1 div
2 div
3 div
–6 V
0
Measured value
6 V
3 div
2 div
1 div
0
1 div
2 div
3 div
–6 V
0
Measured value
6 V
Page 27
1.3 Display Function
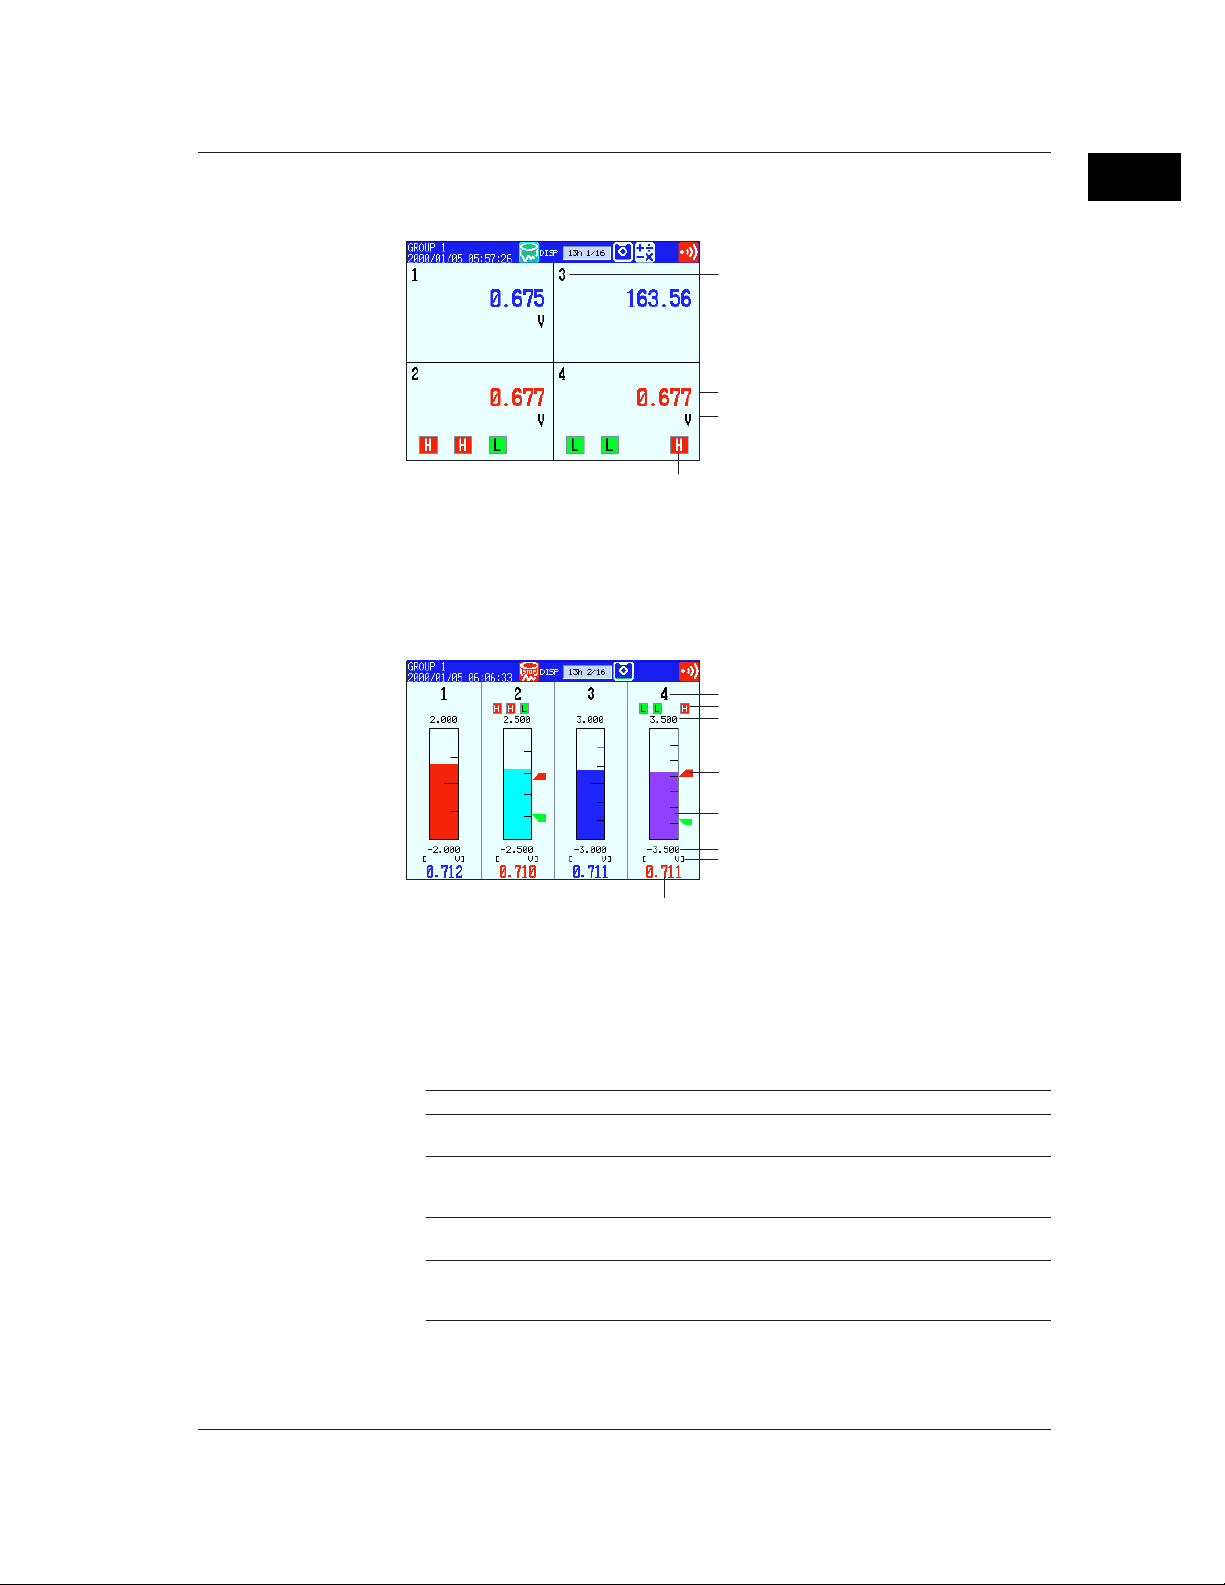
Digital Screen
Bar graph Screen
The measured/computed data are displayed using numerical values in large size. See
section “4.3.”
Channel/Tag
Measured/computed value
Unit
Alarm mark
Display update rate
Measured and computed values are updated every second. However, when the scan
interval on the RD-MV106/RD-MV112 is 2 s, the display update rate is also 2 s.
The measured/computed data are displayed using bar graphs. See section 4.3.
Bar graph display(Vertical)
Tag/Channel
Alarm mark
Upper limit of span
1
Overview of Functions
Alarm point mark
Bar graph
Lower limit of span
Unit
Measured/computed value
Display update rate
Measured and computed values are updated every second. However, when the scan
interval on the RD-MV106/RD-MV112 is 2 s, the display update rate is also 2 s.
Displayed information
The following Information can be displayed.
Information Description
Display direction The bar graphs can be displayed horizontally or vertically.
Base position When the bar graph is displayed horizontally, the starting point
Displayed color The displayed color of the channels are common with the trend
Scale display The number of divisions of the scale can be set to a value in the
⇒ “Section 7.13”
of the bar (base position) can be set to the minimum edge of the
measurement scale or to the center position. ⇒ “Section 7.10”
display. ⇒ “Section 7.8”
range 4 to 12 div. ⇒ “Section 7.10”
(common with the trend display)
1-9
Page 28
1.3 Display Function
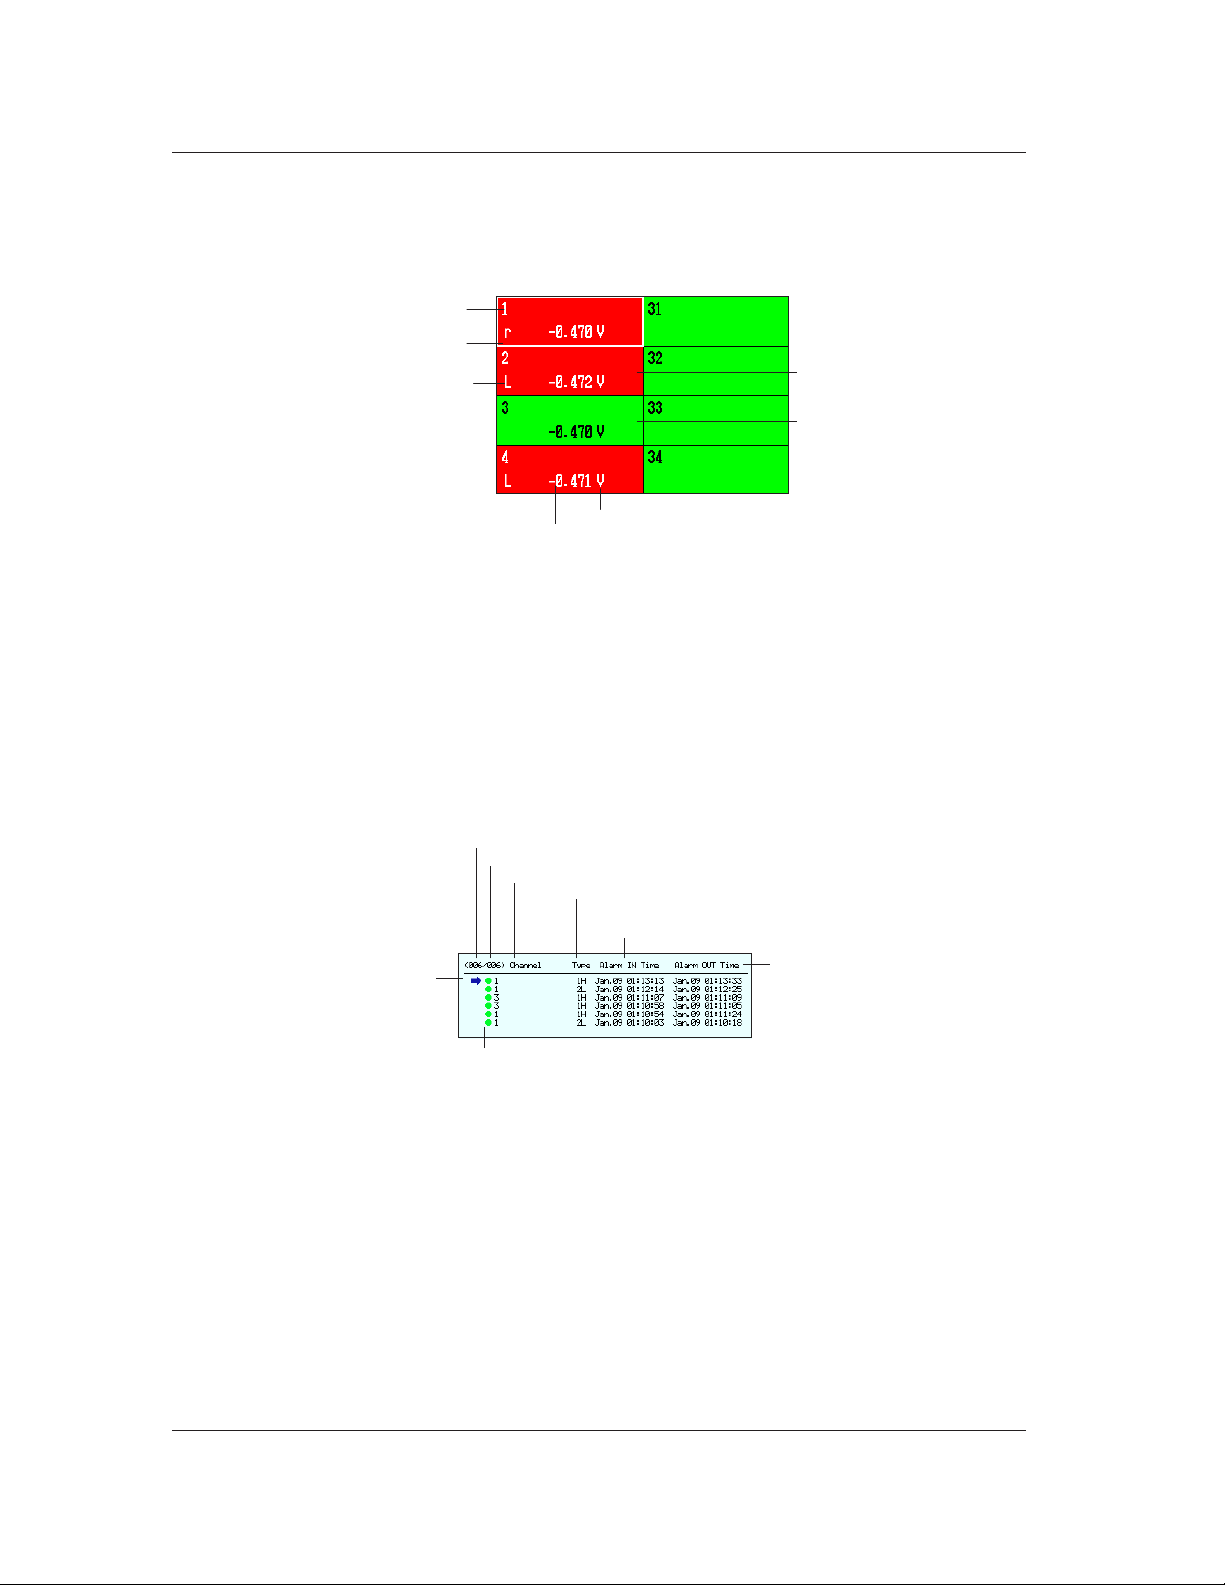
Overview Screen
Alarm Summary
A list of measured/computed values and alarm conditions of all measurement/
computation channels is displayed. You can move the cursor to select a channel and
display the trend or bar graph of the group containing the selected channel. For the
procedure used to display the overview, see section 4.4.
Channel/Tag
Cursor
Alarm type
Unit
Measured/computed value
The area corresponding to a
channel on which an alarm is
occurring is displayed in red.
The area corresponding to a
channel on which an alarm is
not occurring is displayed in
green.
Updating of the numerical display
Measured and computed value are updated every second. However, when the scan
interval on the RD-MV106/RD-MV112 is 2 s, the display update rate is also 2 s.
A list of the most recent alarms can be displayed. By scrolling the screen using a key,
up to 120 incidents can be displayed.
By selecting an alarm from the list using arrow keys, the historical trend of the display
data or event data containing the alarm can be recalled. For a description on the
historical trend display, see “Historical Trend” in this section. For the operating
procedure, see section 4.5.
Number of the alarm information displayed at the last line of the screen
Number of the alarm information in the internal memory
Tag/Channel
Alarm No. /Type
Date & Time
(when the alarm occurred).
1-10
Cursor
Date & Time
(when the alarm released).
Mark (See section 6.1.)
Page 29
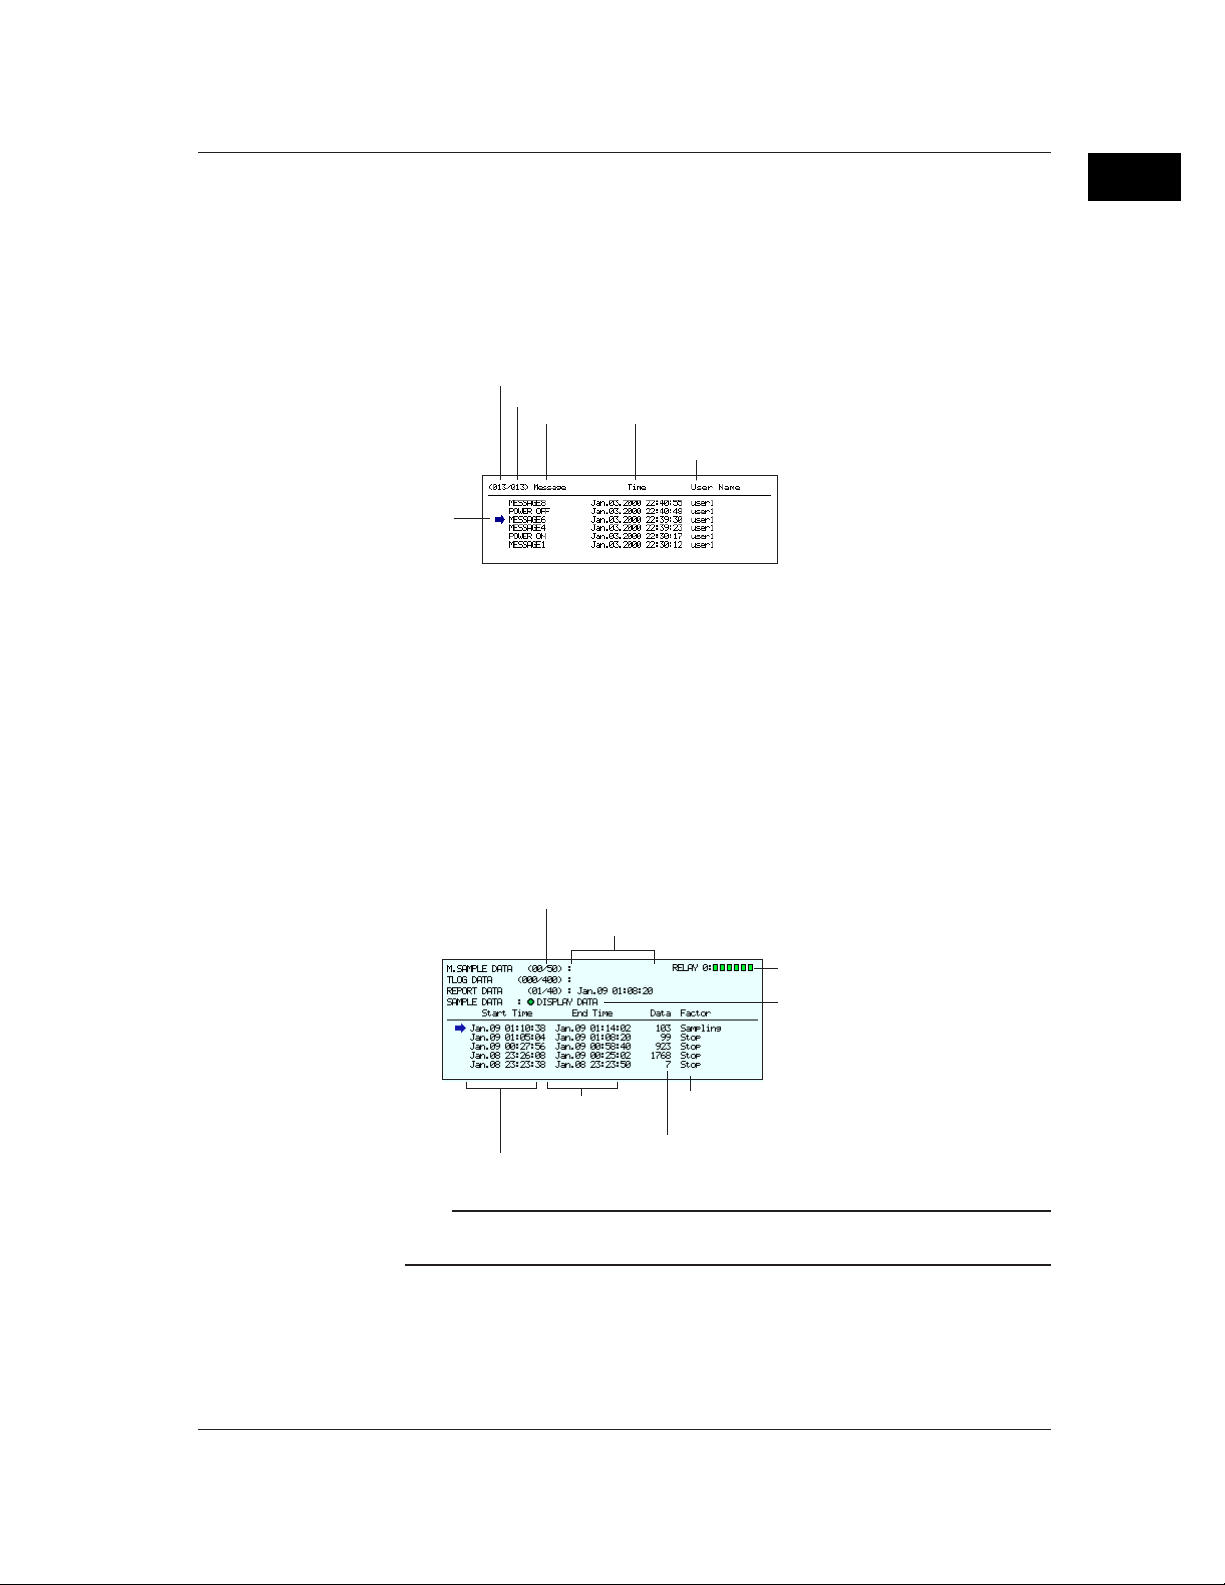
Number of data sets in the internal memory/The maximum number of data
sets the internal memory can hold
Date and time the newest data were acquired
Date and time the data acquisition started
Date and time the data
acquisition ended
Number of data in the file
File status
Status of alarm output relays
Red: Activated
Green: Released
Selection of the file type to be
displayed, display data files or
event data files
1.3 Display Function
Message Summary
Memory Summary
The messages that were entered in the trend display and the times when they were
entered (message information) are displayed in a list. By scrolling the screen using a
key, up to 100 incidents can be displayed.
By selecting a message from the list using arrow keys, the historical trend of the display
data or event data containing the message can be recalled. For a description on the
historical trend display, see “Historical Trend” in this section. For the operating
procedure, see section 4.5.
Number of the message displayed at the last line of the screen
Number of the messages in the internal memory
Message
Cursor
Date and time the message was entered
User name
(when using key login function)
The information pertaining to the display data file and event data file in the internal
memory is displayed. Display data correspond to the data on the trend display. Event
data are data acquired to the internal memory according to the specified sampling
interval and data collection period. The data are separate from the display data.
In addition, the number of manual sampled data, TLOG data (option), and report data
(option) residing in the internal memory are displayed. For models that have the alarm
output relays (option), the ON/OFF state of the relays are also listed.
For details related to the data residing in the internal memory, see section 1.4.
By selecting the display data file or event data file using the arrow keys, the historical
trend display can be recalled. For a description on the historical trend display, see
“Historical Trend” in this section. For the operating procedure, see section 4.5.
1
Overview of Functions
Note
For models with the batch function (/BT1 option), a batch number and lot number can be
displayed in place of the date and time when the data acquisition ended.
1-11
Page 30
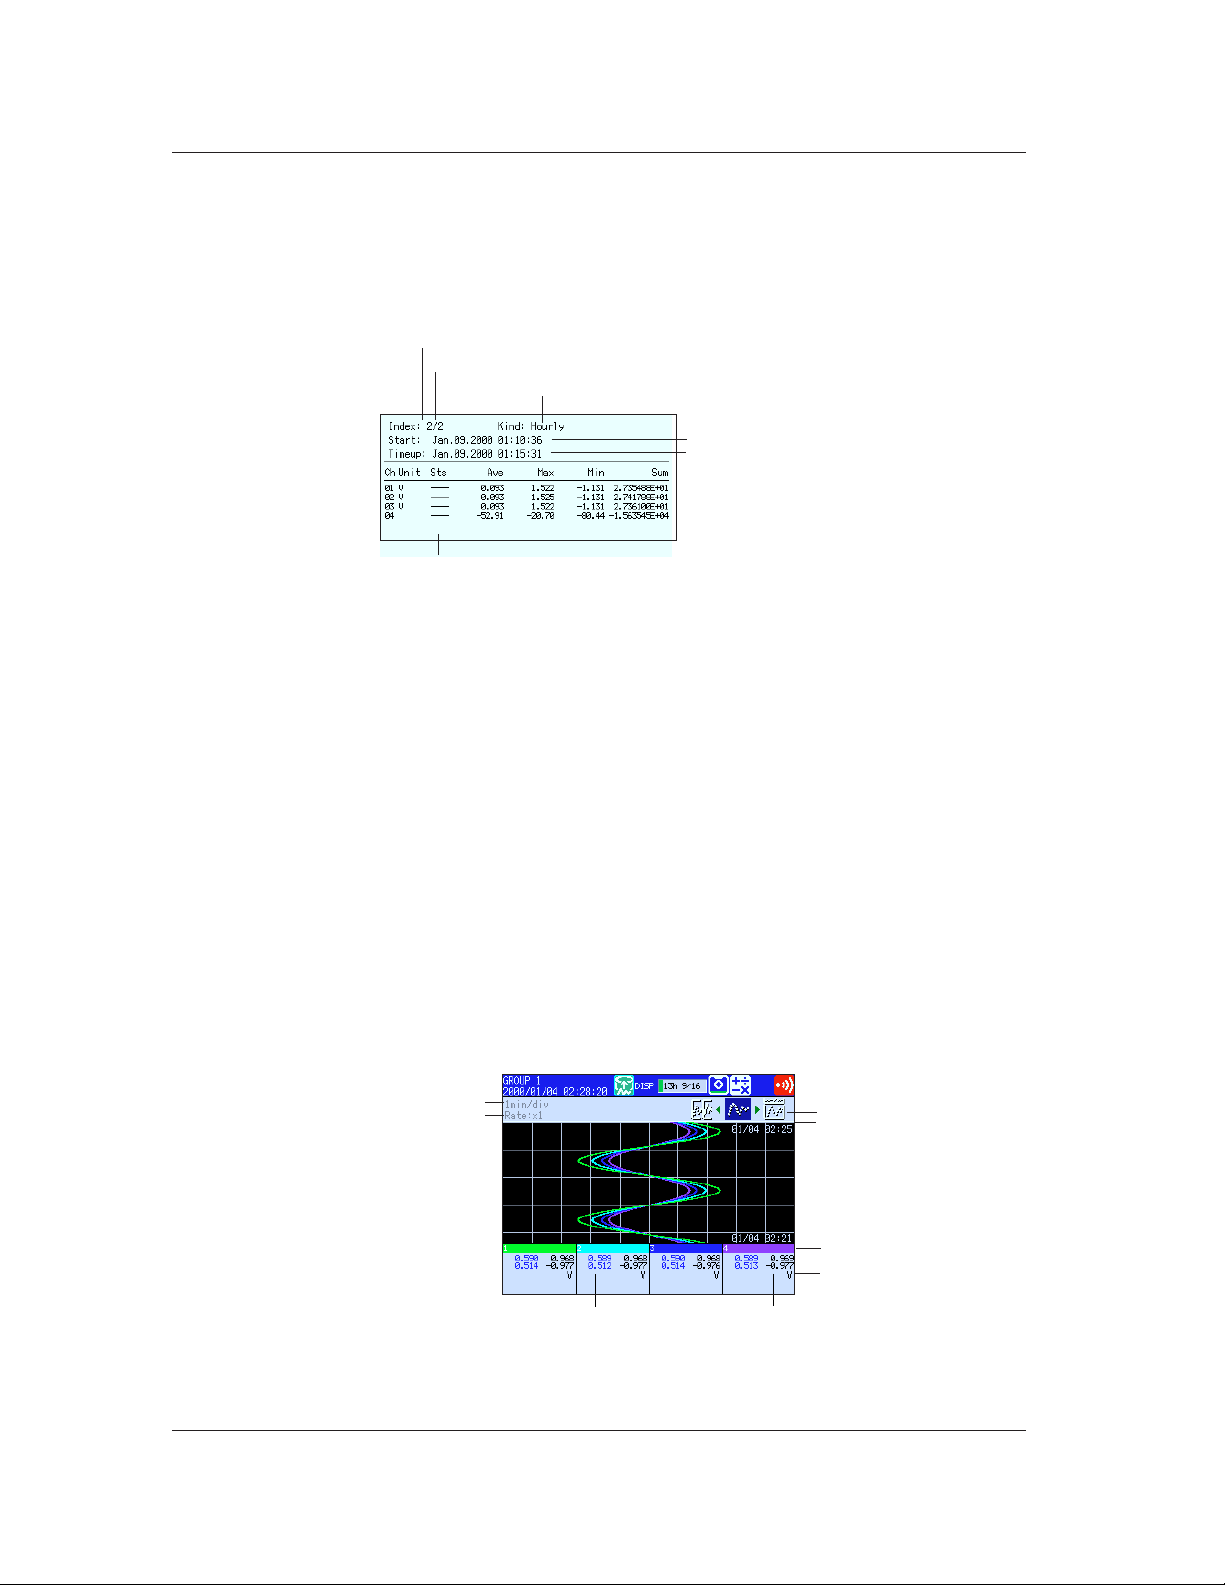
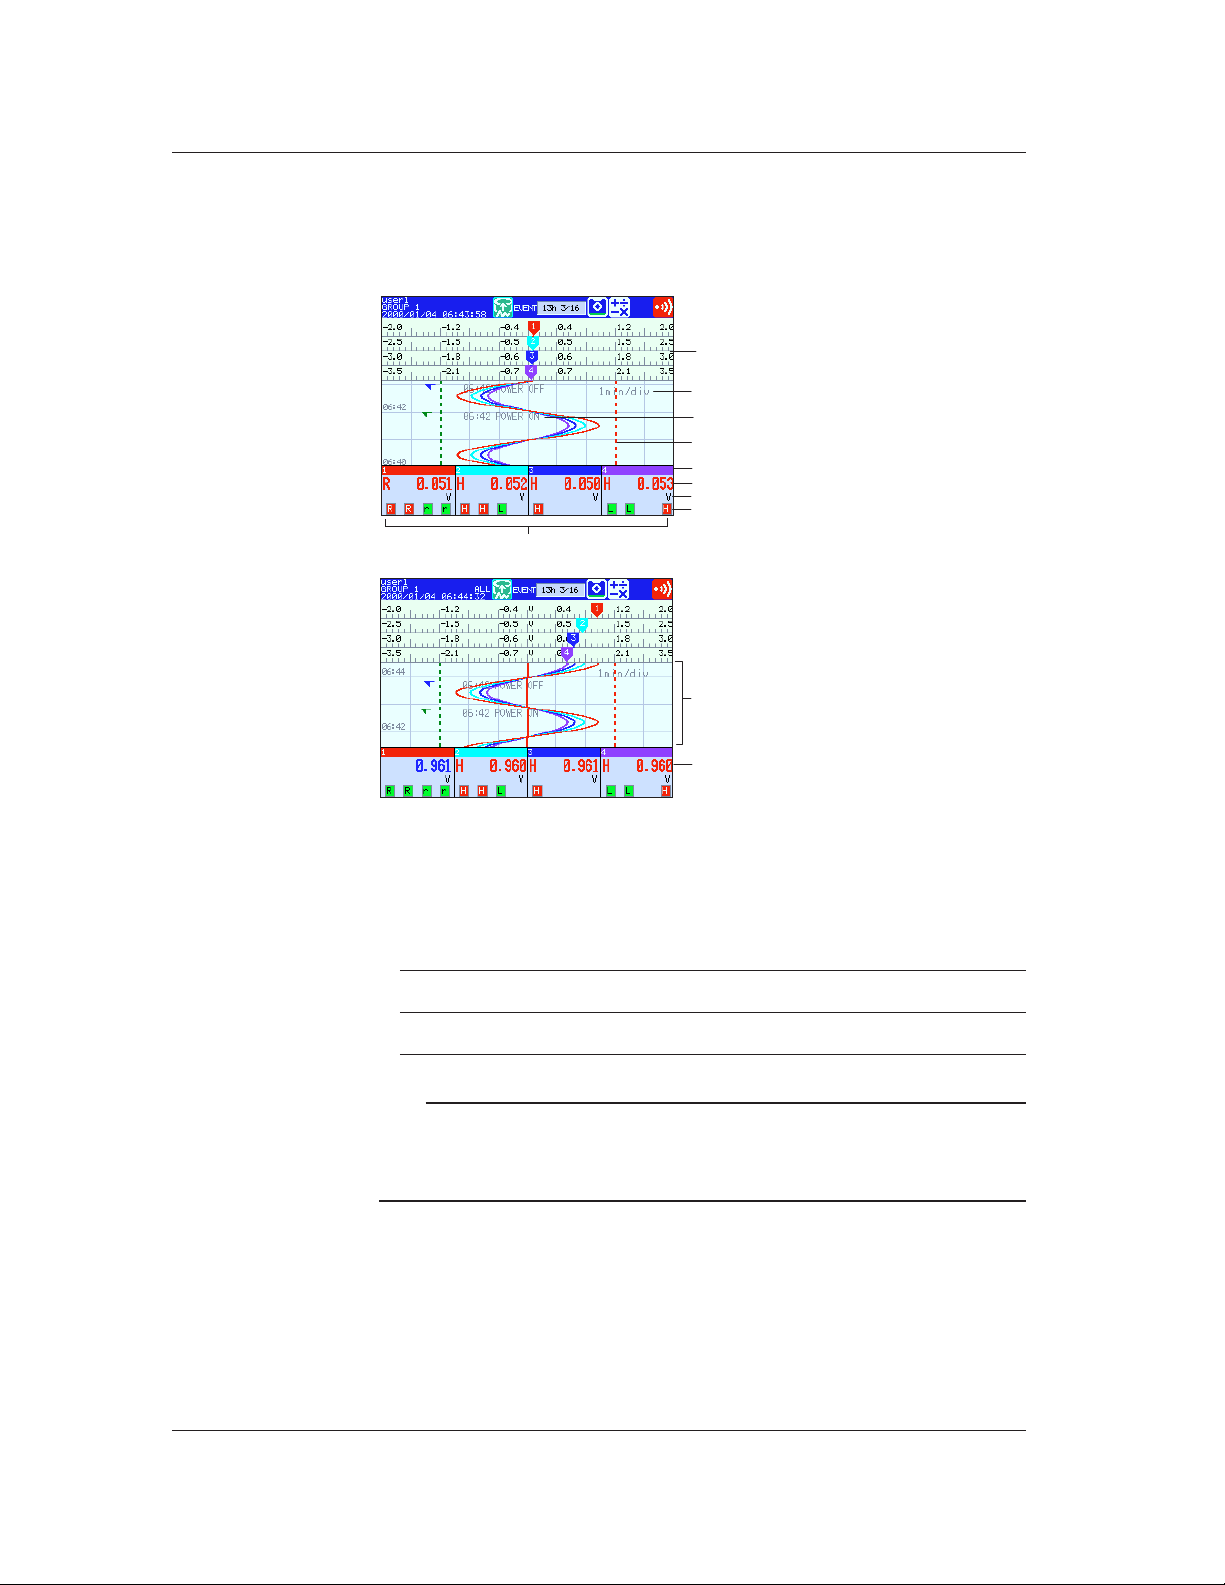
Zoom factor of
the time axis
Time axis
Tag/Channel
Measured/computed value*
(maximum and minimum
value at the display
reference position)
Measured/computed value
(maximum and minimum
value over the entire
display range)
Reference position
Icons for switching screens
Unit
1.3 Display Function
Report Data (/M1 Option)
Historical Trend
Report data residing in the internal memory can be displayed.
The report function is used to write the average, minimum, maximum, and sum at
specified intervals for the specified channels. Reports can be made hourly, daily,
weekly, or monthly. For details related to the report data, see section 1.6. For the
operating procedure, see section 4.5.
The index number of the report data currently displayed
The number of report data sets in the internal memory
Report type
Date and time the report started
Date and time the report was created
Status of data (See section 11.11)
The display data and event data of the measured/computed data stored in the internal
memory or external storage medium are displayed as a historical trend. For details
related to the display data, see “Trend Display” in this section. For details related to the
event data, see section 1.4.
Alarms and scales are not displayed on the historical trend display.
Methods used to display the historical trend
• The following four methods are available in displaying the historical trend of the
display data or event data in the internal memory:
• Display from the alarm summary. For the operating procedure, see section 4.5.
• Display from the message summary. For the operating procedure, see section 4.5.
• Display from the memory summary. For the operating procedure, see section 4.5.
• Recall from the screen menu. For the operating procedure, see section 4.6.
• For methods used to display the historical trend of display data or event data in the
external storage medium, see section 9.3 and 9.4.
Information displayed on the historical trend
The displayed information shown below is common to the historical trend of display data
and event data.
Historical trend display (Display data example)
1-12
* For event data, the measured/computed value at the display reference position.
Page 31

1.3 Display Function
• The waveform can be scrolled along the time axis using the cursor keys.
• The time axis can be expanded or reduced.
• The entire data of the file that is being displayed on the historical trend can be
displayed at the top section of the screen (right section if the trend display is vertical).
You can specify the position to be displayed on the historical trend display using a
cursor. The specified position becomes the display reference position.
Reference position
Cursor
All data display
• The memory information of the file being displayed on the historical trend can be
displayed.
For models with the batch function (/BT1 option), information such as the batch
number and lot number are also displayed.
File name and data type
Serial number of the instrument that sampled
the data
Start/stop time and user name
(user name is displayed only when the key
login function is used)
1
Overview of Functions
Half screen display (only when displaying the historical trend of the display data)
Displays the historical trend of the display data on the left half of the screen and the
current display data on the right half of the screen.
Current trend
Historical trend (display data only)
Current trend information
1-13
Page 32

1.3 Display Function
Setting Screen
The various functions of the RD-MV100 are configured using the setting mode or the
basic setting mode.
Setting mode screen
This screen is used to set the input range, filter/moving average, alarm, group, channel
display color, etc. For details, see section 3.5.
• Setting screen example for the setting mode
Cursor (blue)
Parameter selections (selected using the soft keys)
Basic setting mode screen
This screen is used to configure the basic specifications of the various functions such as
burnout, reference junction compensation, A/D integration time, and the method used to
acquire data to the internal memory. For details, see section 3.5.
• Setting screen example for the basic setting mode
Cursor (blue)
Setting the Display Conditions of the LCD
The following display conditions of the LCD can be configured.
Screen Attribute Settings
Background color You can select white or black for the background color of the of the
operation screen screen.The initial setting is “white.” For the setting procedure, see
LCD brightness The brightness of the LCD can be set between eight levels. The
Backlight saver The lifetime of the LCD backlight can be extended by automatically
Parameter selections (selected using the soft keys)
section 7.13.
initial setting is “4.” For the setting procedure, see section 7.14.
dimming the light when there is no key operation for a certain
amount of time. The screen returns to the original brightness with a
key operation or an alarm occurrence. The initial setting is set so
that the backlight saver is disabled. For the setting procedure, see
section 7.14.
1-14
Page 33

1.4 Storage Function
Acquiring Data to the Internal Memory
Display data and event data
The measured/computed data are first acquired to the RD-MV100’s internal memory as
two types of data, display data and event data. Then, the data are saved to the external
storage medium automatically or when press MEDIA key. You can select whether to
save the measured/computed data as display data, event data, or as both.
The capacity of the internal memory for acquiring display data and event data is 1.2 MB.
When the measured/computed data are saved as both display data and event data, 0.9
MB is used to save display data and 0.3 MB is used to save event data.
Display data only
1.2MB
RD-MV100
Internal memory
Event data only Display data and event data
1.2MB
0.9MB
0.3MB
1
Overview of Functions
Display data
Event data
Display data Event data
Display data are used to display waveforms on the RD-MV100’s screen. Display data
consists of maximum and minimum values of the measured or computed data sampled
at the scan interval within the time period corresponding to one dot on the time axis on
the screen. Display data can be likened to the conventional recording on the chart sheet
and are useful for long-term observations.
Event data are instantaneous values of the measured/computed data at specified
sampling intervals of the event data. By setting the sampling interval equal to the scan
interval, all measured or computed data sampled at the scan interval can be saved. In
addition, the event data generated when an event occurs (an alarm, for example) can
also be saved. This is useful when you wish to observe the measured/computed data in
detail.
The time period corresponding
to one dot on the screen
Display data
Maximum value
Minimum value
Measurement data
Event data
Scan interval
Sampling inteval for event data
1-15
Page 34

1.4 Storage Function
Manual sampled data
Every time a given key operation is carried out, all measured/computed data
(instantaneous values) at that point are acquired to the internal memory. However, this
excludes measurement channels that are skipped and computation channels that are
turned OFF.
TLOG data (only on models with the optional computation function (/M1)
The average, maximum, minimum, sum, or maximum - minimum can be computed for
the specified channels at predetermined intervals and the result can be acquired to the
internal memory. You can specify the interval.
Report data (only on models with the optional computation function (/M1)
The average, maximum, minimum, and sum can be computed for the specified channels
at predetermined intervals and the result can be acquired to the internal memory. You
can select one hour (hourly report), one day (daily report), one day/one week (daily and
weekly reports), or one day/one month (daily and monthly reports) for the interval.
Saving Data to the External Storage Media
External storage media
Various data can be stored to the following storage media:
• 3.5" floppy disk (1.44 MB, 2HD)
• Zip disk (100 MB)
• ATA flash memory card (4 MB to 160 MB): The size varies depending on the memory
card that you are using.
Save method
There are two methods of storing data to the external storage medium. One method
stores the data when press MEDIA key (referred to as manual save). The other method
stores data automatically at certain time intervals to a storage medium (referred to as
auto save).
Other types of data that can be stored
In addition to the types of data described in “Acquiring Data to the Internal Memory,” the
following types of data can be stored on the external storage medium.
• Setting data
The RD-MV100 setting data, such as the setting of the functions of the input section
as described in section 1.2, can also be stored to an external storage medium to the
specified file name. The stored data can also be loaded and used by the RD-MV100.
• Image data of the display screen
The image data of the display screen can be stored to the external storage medium.
The image data can be pasted to documents created on a PC.
Saving Data via Ethernet
The display data, event data, and report data, as described in “Acquiring Data to the
Internal Memory,” can be automatically transferred to an FTP server via Ethernet for
storage. Conversely, the RD-MV100 can operate as an FTP server. The RD-MV100
can be accessed from a PC and the data in the external storage medium can be
retrieved for storage. For these functions, see the “RD-MV100 Communication Interface
User’s Manual” (M3643).
1-16
Page 35

1.5 Alarm Function
This function generates an alarm when the measured/computed data meets a certain
condition. When an alarm occurs, information notifying the alarm occurrence is
displayed on the screen. In addition, a signal can be output from the relay output
terminals on the rear panel of the RD-MV100 (only on models with the optional alarm
output relay function (/A1 through /A3)).
Alarm indication
The alarm conditions are displayed as alarm icons in the status display section and on
the trend, digital, bar graph, and overview displays. The detailed information about the
alarms is displayed in the alarm summary.
Alarms are displayed when the alarm conditions are met. You can select to clear the
alarm when the conditions are no longer met (non-hold alarm) or hold the alarm until it is
cleared (hold alarm).
Alarm indication example (overview display and alarm summary display)
Channel/Tag
Cursor
Alarm type
The area corresponding to a
channel on which an alarm is
occurring is displayed in red.
The area corresponding to a
channel on which an alarm is
not occurring is displayed in
green.
1
Overview of Functions
Unit
Measured/computed value
Number of the alarm information displayed at the last line of the screen
Number of the alarm information in the internal memory
Tag/Channel
Alarm No. /Type
Date & Time
(when the alarm occurred).
Cursor
Mark (See section 6.1.)
Date & Time
(when the alarm released).
Number of alarms
You can set up to four alarms for each channel.
Alarm conditions
The following eight conditions are available:
• Upper limit alarm
An alarm occurs when the measured value exceeds the alarm value.
• Lower limit alarm
An alarm occurs when the measured value falls below the alarm value.
1-17
Page 36

1.5 Alarm Function
Upper limit alarm
Alarm occurrence
Alarm release
Measured/computed data
alarm value
Lower limit alarm
Measured
/computed data Alarm release
alarm value
Alarm occurrence
• Alarm delay upper limit alarm
An alarm occurs when the measured value remains above the alarm value for the
specified time period (delay period).
• Alarm delay lower limit alarm
An alarm occurs when the measured value remains below the alarm value for the
specified time period (delay period).
Alarm delay upper limit alarm example (T is the specified delay period)
Measured/computed data
X1 X2 X3 X4
T1
T
Alarm value
Alarm releaseAlarm occurrence
• Alarm does not occur at T1, because the time period is shorter than the specified
delay period (T).
• The input exceeds the alarm value at X2, but the alarm does not occur. The alarm
occurs at X3 at which the specified delay period elapses (the time when the alarm
occurs is the time at X3).
• The input falls below the alarm value at X4 and the alarm is released.
• Difference upper limit alarm
An alarm occurs when the difference between the measured values of two channels
becomes greater than or equal to the alarm value.
Can be specified only on difference computation channels.
• Difference lower limit alarm
An alarm occurs when the difference between the measured values of two channels
becomes smaller than or equal to the alarm value.
Can be specified only on difference computation channels.
• Upper limit on rate-of-change alarm
The amount of change of the measured values over a certain time interval is checked.
An alarm occurs when the amount of increase becomes greater than or equal to the
specified value.
Can be specified only on measurement channels.
• Lower limit on rate-of-change alarm
The amount of change of the measured values over a certain time interval is checked.
An alarm occurs when the amount of decrease becomes greater than or equal to the
specified value.
Can be specified only on measurement channels.
1-18
Page 37

Measured
value
Measured
value
R alarm
T1
Time
Interval
t
2-t1
Interval
t
2-t1
T2
T2
T1
t1 t2 t1 t2
Variation
|T
2-T1|
Variation
|T
2-T1|
Time
r alarm
Upper limit on rate-of-change alarm Lower limit on rate-of-change alarm
1.5 Alarm Function
The interval is defined by the following equation and is set in terms of the number of
measured data points.
Interval = Scan interval × number of measurements
Alarm hysteresis
This applies to upper and lower limit alarms on measurement channels.
A width (hysteresis) can be specified on the value used to set or release the alarm. This
prevents the alarm from being set or released repetitively when the measured value is
fluctuating around the alarm value. The hysteresis is fixed to 0.5% of the display span
(display scale if the range is set to [Scale]). The initial setting is [ON].
Upper Limit Alarm (H)
1
Overview of Functions
Alarm occurrence
1V
Measured value
Lower Limidt Alarm (L)
Measured value
1V
Alarm occurrence
Alarm output relay
If you are using a model with the optional alarm output relay (/A1 through /A3), a contact
signal can be generated according to the alarm conditions. For the procedure related to
setting the alarm output relay, see section 6.2, “Alarm Setting.”
The following functions can be specified on the alarm output relay. For details, see
section 6.4.
• When multiple alarms are set to one alarm output relay, notify the succeeding alarms
after the first alarm that causes the relay operation (reflash alarm function).
• When multiple alarms are set to one alarm output relay, operate the relay when all
specified alarms are active (AND function)
• Energize or de-energize the alarm output relay when the alarm occurs (energize/deenergize function of the output relay).
• When the alarm changes from the ON state to the OFF state (return to normal
condition), turn OFF the output relay with an alarm ACK operation (output relay hold
function).
Alarm release
Alarm set point
Hysteresis (approx. 0.5%)
Alarm release
Hysteresis (approx. 0.5%)
Alarm set point
1-19
Page 38

1.6 Computation Function and Report Function
(/M1, Option)
Computing equations are assigned to channels that are dedicated to performing
computations. Displaying computation channels and acquiring computed data can be
carried out in the same manner as in the measurement channels. The computation is
performed every scan interval.
Reports can be created, displayed, and stored. Report channels and report types are
set in the basic setting mode.
For detail, see Chapter 11.
Computation Channels
Model Channel
RD-MV102 Channels 31 to 34 (4 channels)
RD-MV104 Channels 31 to 34 (4 channels)
RD-MV106 Channels 31 to 42 (12 channels)
RD-MV112 Channels 31 to 42 (12 channels)
Types of Computations
The following types of computations can be performed.
Type Description
Four arithmetical operations Addition (+), subtraction (–), multiplication (×), and division (/)
SQR Computes the square root.
ABS Determines the absolute value.
LOG Determines the common logarithm.
EXP Determines the exponent.
Relational computation Determines <, ≤, >, ≥, =, ≠ and outputs “0” or “1.”
Logical computation Determines the AND (logical product), OR (logical sum), XOR
Statistical computation (TLOG) Determines the average (AVE), maximum (MAX), minimum
Rolling average Determines the moving average of the computed result at scan
(exclusive logical sum) of two channels, NOT (negation) of an
arbitrary channel and outputs “0” or “1.”
(MIN), and maximum - minimum (P-P) at specified time
intervals for the specified channels. You can specify the
interval.
intervals for the channel for which the equation is specified.
The sampling interval and the number of samples are specified
for each channel. The maximum sampling interval is 1 hour, the
maximum number of samples is 64. The initial setting is set so
that the rolling average is disabled.
1-20
The following elements can be used in the computing equations.
Element Description
Constants (K01 to K12) Set by the computation function.
Communication input data Set by the communication function. ⇒ “RD-MV100
Communication
(C01 to C12) Interface User’s Manual”
Condition of the remote Use ON/OFF (1 or 0) of the remote input signal.
control terminals (D01 to D08)
Page 39

1.8 Computation Function and Report Function (/M1, Option)
Report Function
The report function is one of the functions provided by the optional computation
function (/M1).
This function computes the average, maximum, minimum, and sum for the specified
channels at specified intervals and writes the result to the internal memory.
You can select the report type from hourly reports only, daily reports only, daily and
monthly reports, and weekly and monthly reports. The reports are created every hour on
the hour for hourly reports, at the specified hour on the hour for daily reports (once a
day), at the specified hour on the hour on the specified day for weekly reports (once a
week), and at the specified hour on the hour on the specified date for monthly reports
(once a week).
For example, in the case of daily reports, the average, maximum, minimum, and sum
over a day for the specified channels are computed at the specified time (on the hour),
and the results are acquired to the internal memory. This constitutes one report data set.
The report data residing in the memory can be displayed on the RD-MV100’s LCD (see
section 1.3, “Display Function”).
In addition, the report data residing in the internal memory can be saved to an external
storage medium (section 1.4, “Storage Function”). Because the report data are saved to
the external storage medium in ASCII format, spreadsheet applications can be used to
view the data (see appendix 2, “Data Format of ASCII Files”).
For details related to the report function, see chapter 11.
Item Description
Report type Select from hourly reports only, daily reports only, daily and
monthly reports, and weekly and monthly reports.
Number of channels per report Up to 12 channels
Computed data Average, maximum, minimum, and sum
Number of reports that can be Up to 40
acquired to the internal memory
Data format ASCII format
1
Overview of Functions
For a display example of report data, see section 1.3.
1-21
Page 40

This page intentionally left blank
1-22
Page 41

This page intentionally left blank
1
Overview of Functions
1-23
Page 42

1.8 Other Functions
Key Lock
Key lock is a function that locks key operations, removal of the Zip disk, and the saving
of data to the external storage medium during manual save mode.
A password needs to be entered to release the key lock. For the setting and operating
procedure, see section 10.2, and 10.1, respectively.
Items and behaviors of the key lock (can be set individually)
Item Behavior during Key Lock
START key Disabled
STOP key Disabled
MENU key Disabled
MEDIA key Disabled
DISP/ENTER key Switching operation screens is disabled.
[Alarm ACK] soft key Disabled
Math (Computation)
• [Math START] soft key
• [Math STOP] soft key
• [Math reset] soft key
Write memory
• [Message] soft key
• [Manual sample] soft key*2Disabled
• [Trigger] soft key
• [Save Display] soft key*2Disabled
• [Save Event] soft key
Media (External storage medium)
• During manual save Prevent Zip disk removal.
*1 Set together by [Math] parameter.
*2 Set together by [Write memory] parameter.
*1
Disabled (option)
*1
Disabled (option)
*1
Disabled (option)
*2
Disabled
*2
Disabled
*2
Disabled
Key Login/Logout
This function allows only certain users to access the recorder. The users are
distinguished by their name, user IDs, and passwords. You can select whether or not to
use User IDs. In addition, you can set whether or not to allow operations in the basic
setting mode for each user. Up to 7 users can be registered.
For the setting and operating procedure, see section 10.4, and 10.3, respectively.
1-24
Page 43

1.8 Other Functions
Log Display
System Screen
A list of phenomena that occurred can be displayed in the order of occurrence for the
following items:
• Error messages (50 most recent messages)
• A log of key login and logout (50 most recent logins)
• A log of communication commands (200 most recent commands)
• A log of file transfers using the FTP client function (50 most recent transfers)
For details related to the display format, see section 10.5.
Error log example
Displays the date and time of the error occurrence, error code number, and the
message.
The number of the log displayed at the last line of the screen / total number of logs
Date and time of occurrence
Error code
Error message
The total number of inputs on the RD-MV100, the capacity of the internal memory, the
communication functions, the external storage drive, the options, and the MAC address
(Internet address) can be displayed. For details related to the display format, see
section 10.5.
1
Overview of Functions
Displayed Language
Number of measurement channels*
Number of computation channels
Internal memory capacity
Optional functions
Communication function
External storage medium drive
Optional functions
MAC address
* When the cramped input terminal is equipped (/H2, option), “C” is indicated as
“Analog: 12(C)” in this example.
The displayed language can be set to English, Japanese, German, or French. If German
or French is selected, the following information is displayed in the specified language.
For all other information, the displays will be the same as those for English.
Locations where German or French is used
• Menu used to switch the screen in the operation mode.
• Function menus in the operation mode
• Error Messages
• Operation guide screens (confirmation screen that appears when the STOP key is
pressed or the selection screen that appears when exiting the basic setting mode, for
example.).
For the setting procedure, see section 10.8.
1-25
Page 44

NO CNC
Normal
NO CNC
Failure
NO C NC
Power-off
NO C NC
Normal
NO CNC
Memory end
NO C NC
Power-off
1.8 Other Functions
FAIL/Memory End Function (Option)
Operation at system failure
This function activates the relay output when the CPU fails. The relay is de-energized on
CPU failure. The relay is de-energized if the CPU fails. This relay action cannot be
reversed to “energized on failure” and thus this relay is de-energized also upon power-off
(including a power failure).
• Relay behavior (de-energized on failure)
NO, C, and NC denote normally-opened, common, and normally closed, respectively.
Operation at memory end
This function activates the relay output when the remaining space (time) in the internal
memory or the external storage medium becomes small. The relay is energized if the
memory end is detected. The relay action cannot be reversed to “de-energized on
memory end.” When the relay is energized, save the data in the internal memory to the
external storage medium during manual save, or use another external storage medium
during auto save.
The memory end detection operates as follows.
• When using auto save
When using auto save and the storage medium is inserted, the relay is energized
when the remaining space on the storage medium falls to 10%. At this point, the icon
of the external storage medium on the status display section on the screen turns to
red from green.See section 4.2.
1-26
• When using manual save
• When the type of data to be acquired is display data only or display data and event
data
When the remaining time for storing the display data in the internal memory falls to
the specified time, the relay is energized.
• When the type of data to be acquired is event data only
In the [Free] mode, the relay is energized when the remaining time for storing the
event data in the internal memory falls to the specified time.
In the [Trigger] or [Rotate] mode, the relay is not energized. (There is no alarm
output.)
• Relay behavior (energized on memory end)
NO, C, and NC denote normally-opened, common, and normally closed, respectively.
For the setting procedure, see section 10.6.
Page 45

1.8 Other Functions
Remote Control Function (/R1 Option)
When a contact or open collector signal is applied to the remote control terminal, a
predetermined operation is carried out.
Arbitrary controls can be assigned to the eight remote control terminals. The available
controls are listed below.
For the setting procedure, see section 10.7.
Function Remote Signal Operation
None - No operation.
Start/Stop Edge Start/stop acquiring data to the internal memory.
Trigger Trigger Trigger to start acquiring event data to the internal
Alarm ACK Trigger Release alarm display/relay output (valid only when
Time adj Trigger Adjust the internal clock to the nearest hour.
Computation Edge Start/stop computation (only for models with the
Computation reset Trigger Reset the computed value of the computation
Manual sample Trigger Write the instantaneous values of all channels to the
Load setup data 1 to 3 Trigger Load and activate the setup data file that had been
Messages 1 to 8 Trigger Display messages 1 to 8 on the trend display and
1
Overview of Functions
⇒ “Sections 8.4 and 8.5”
memory (valid only when event data are specified to
be acquired to the internal memory and the trigger
used to start the acquisition is set to key trigger
⇒ “Section 8.11”)
the operation of the alarm display or output relay is
set to “hold”⇒ “Section 6.4”).
computation option (/M1).
channel (reset to 0, only on models with the
computation option (/M1) while the computation is
stopped).
internal memory once.
created and stored in the external storage medium.
write them to the internal memory.
Remote signal (edge and trigger)
The above operations are carried out on the rising or falling edge of the remote signal
(edge) or the ON signal lasting at least 250 ms (trigger).
Rising/Falling Trigger
Rising Falling
250 ms or more
For contact inputs, the remote signal rises when the contact switches from open to close
and falls when the contact switches from close to open. For open collector signals, the
remote signal rises when the collector signal (voltage level of the remote terminal) goes
from high to low and falls when the collector signal goes low to high.
1-27
Page 46

1.8 Other Functions
Daylight Savings Time
Temperature Unit
• When the specified time is reached at which the daylight savings time adjustment is to
be enabled, the recorder automatically sets the clock ahead by one hour.
(Example : If the time is set to 9 O’clock on June 1, the time is set ahead to 10 O’clock
June 1.)
• When the specified time is reached at which the daylight savings time adjustment is to
be disabled, the recorder automatically sets the clock back by one hour.
(Example : If the time is set to 9 O’clock on December 1, the time is set back to 8
O’clock December 1.)
For the setting procedure, see section 10.12.
The temperature unit can be set to Celsius (°C) or Fahrenheit (°F). This applies to all 8.4
and 8.5channels.
For the setting procedure, see section 10.13.
1-28
Page 47

Chapter 2 Before Using the Recorder
2.1 Precautions on the Use of the Recorder
Read the following precautions before using the recorder and the external storage
medium (floppy disk, zip disk, ATA flash memory card).
Handling Precautions
• Use care when cleaning the recorder, especially any plastic parts. When cleaning,
• Keep electrically charged objects away from the instrument as this may cause
• Do not apply volatile chemicals to the LCD monitor or panel keys. Do not allow rubber
• Do not apply shock to the recorder.
• When not in use, make sure to turn OFF the power switch.
• If there are any symptoms of trouble such as strange odors or smoke coming from the
2
Before Using the Recorder
wipe with a dry, soft cloth. Do not use chemicals such as benzene or thinner, since
these may cause discoloring and deformation.
malfunction.
and vinyl products to remain in contact with the recorder for long periods of time. This
may damage the recorder.
recorder, immediately turn OFF the power and unplug the power cord. Then, contact
your nearest Omega.
CAUTION
Don’t put any weight on the recorder while it is in reclined position with its front
feet up, as it may damage the feet .
Handling Precautions of External Storage Media
• Take special care in handling external storage media as they are delicate products.
For general precautions, see the instruction manual that came with the external
storage medium.
• Floppy disks and Zip disks may not operate properly under high or low temperature
environment. If you are using the recorder in a low-temperature environment (less
than 10°C), let the recorder warm-up for at least 30 minutes beforehand.
• If you are using them in a high-temperature environment (greater than 40°C), we
recommend the external storage medium be inserted into the drive when saving the
data and be removed after the data have been saved (manual save, see section 8.4.)
• Remove the external storage medium from the drive when turning ON/OFF the
recorder.
• Do not remove the external storage medium while the access lamp is lit. Doing so
can destroy the data on the medium.
Don’t expose the floppy disk drive or zip drive to vibration or shocks, as it may
damage the drives.
CAUTION
2-1
Page 48

2.2 Installing the Recorder
Installation Location
Install the recorder in a location that meets the following conditions. See also the normal
operating conditions described in section 14.7, “General Specifications.”
For safety reasons, don't mount the recorder with the back panel downwards.
• Well-ventilated location
To prevent overheating, install the recorder in a well-ventilated location. A space of
50 mm or more from the right, left and top surface of the recorder is recommended.
• Minimum mechanical vibrations
Choose an installation location with the minimum mechanical vibration.
• Horizontal
Install the recorder horizontally. (However, the recorder can be reclined up to 30
degrees when the front feet are up.)
Note
• Condensation may occur if the instrument is moved to another place where both the ambient
temperature and humidity are higher, or if the temperature changes rapidly. In addition,
measurement errors will result when using thermocouples. In this case, let the instrument
adjust to the new environment for at least one hour before using the instrument.
• The lifetime of the LCD may be shortened if the recorder is used in a high-temperature
environment over a long period of time. When installing the recorder in a high-temperature
environment (greater than 40°C), we recommend the backlight brightness of the LCD be set
to a low setting. For setting the LCD brightness, see section 7.14.
CAUTION
2-2
Do not install the instrument in the following places :
• In direct sunlight or near heat sources
Install the recorder in a place with small temperature fluctuations near room
temperature (23°C). Placing the instrument in direct sunlight or near heat sources
can cause adverse effects on the internal circuitry.
• Where an excessive amount of soot, steam, moisture, dust, or corrosive gases
are present
Soot, steam, moisture, dust, and corrosive gases will adversely affect the recorder.
Avoid such locations.
• Near strong magnetic field sources
Do not bring magnets or instruments that produce electromagnetic fields close to the
recorder. Operating the recorder in strong magnetic fields can cause errors in the
measurements.
• Bad angle for viewing the screen
Because the recorder uses a 5.5" TFT color LCD, it is difficult to view the display from
an extreme angle. Please install the recorder so that the monitor can be viewed from
the front.
Page 49

2.3 Input Signal Wiring
If a strong tension is applied to the cable wired to the recorder, the terminals of
the recorder and/or the cable can be damaged. In order to prevent tension from
being applied directly on the terminals, fasten all wiring cables to the rear of the
mounting panel.
Precautions to be taken while Wiring
Take the following precautions when wring the input signal cables.
• It is recommended that crimp-on lugs (designed for 4 mm screws) with
insulation sleeves be used on the lead wire ends for the optional screw
terminals (suffix code /H3).
Crimp-on lug
• Take measures to prevent noise from entering the measurement circuit.
• Move the measurement circuit away from the power cable (power circuit) and
ground cable.
• It is desirable that the item being measured does not generate noise. However, if
this is unavoidable, isolate the measurement circuit from the item. Also, ground the
item being measured.
• Shielded wires should be used to minimize noise caused by electrostatic induction.
Connect the shield to the earth ground terminal of the recorder as necessary (make
sure you are not grounding at two points).
• To minimize noise caused by electromagnetic induction, twist the measurement
circuit wires at short, equal intervals.
• Make sure to earth ground the earth ground terminal through minimum resistance
(100 Ω).
• When using internal reference junction compensation on the thermocouple
input, take measures to stabilize the temperature at the input terminal.
• Always use the input terminal cover.
• Do not use thick wires which may cause large heat dissipation (cross sectional
area 0.5 mm
• Make sure that the air temperature remains reasonably stable. Large temperature
fluctuations can occur if a nearby fan turns ON or OFF.
• Connecting the input wires in parallel with other devices can cause signal
degradation, affecting all connected devices.
If you need to make a parallel connection, then
• Turn the burnout function OFF. (See section 5.9)
• Ground the instruments to the same point.
• Do not turn ON or OFF another instrument during operation. This can have
adverse effects on the other instruments.
• RTDs cannot be wired in parallel.
2
or less recommended).
CAUTION
2
Before Using the Recorder
2-3
Page 50

Loosen screw
Loosen screw
2.3 Input Signal Wiring
Wiring Procedure
WARNING
To prevent electric shock, ensure the main power supply is turned OFF.
CAUTION
• Do not apply input signals that exceed the following values. This can damage
the recorder.
• Maximum input voltage
Voltage range of 2 VDC or less or thermocouples : ±10 VDC
Voltage range between 6 and 20 VDC : ±30 VDC
• Maximum common mode noise voltage
250 VACrms (50/60 Hz)
• This recorder is an INSTALLATION CATEGORY II product.
1. Turn OFF the recorder and remove the input terminal cover.
2. Connect the input signal wires to the input terminals.
3. Replace the input terminal cover and fasten it with screws.
Note
The terminal block itself can be removed by loosening the two screws at the top left and
bottom right of the terminal block. This makes wiring work easier. To prevent bad contacts,
make sure to securely tighten the screws after wiring.
2-4
Page 51

RD-MV102/RD-MV112
+/A
/b
CH1
CH2
CH3
CH4
CH5
CH6
-/B
CH 5 CH 3 CH 1
/b
+/A
-/B
CH 6
RD-MV106
CH 4 CH 2
• Input terminal position
Input terminal
• Terminal arrangement
RD-MV102/RD-MV104
Standard input terminals Screw terminals (/H2)
CH 3 CH 1
CH 4 CH 2
/b
+/A
-/B
2.3 Input Signal Wiring
CH4
CH2
CH1
CH3
+/A
-/B
2
Before Using the Recorder
/b
RD-MV106
Standard input terminals Screw terminals
RD-MV112
Standard input terminals Screw terminals
CH 11 CH 9 CH 7
CH 12 CH 10 CH 8
CH 5 CH 3 CH 1
CH 6 CH 4 CH 2
/b
+/A
-/B
RD-MV112
CH12
CH11
CH10
CH9
CH8
CH7
CH6
CH5
Note
RTD input terminals A and B are isolated on each channel. Terminal b is shorted internally
across all channels. However, for options /N1 (Cu10, Cu25 RTD input, 3 terminal isolated
RTD) and /N2 (3 terminal iso lated RTD), input b is isolated for each channel.
CH4
CH3
CH2
CH1
/b
+/A
-/B
2-5
Page 52

2.3 Input Signal Wiring
• Wiring diagram
DC Voltage and DI (Contact) Input
+
DC voltage input
–
Resistance Temperature Detector Input
+
–
b
A
B
A
B
b
Leadwire resistance :
10 Ω max./wire
The resistance of the three wires
should be approximately equal.
Thermocouple Input
Extension leadwire
DC Current Input
+
DC current input
–
Shunt resistor
+
–
+
–
NOTE : For a 4 to 20 mA input, use a
shunt resistor of 250 Ω ±0.1%.
2-6
Page 53

2.4 Alarm Output Wiring (/A1 to /A3, Option)
Loosen screw
Loosen screw
WARNING
• To prevent electric shock, ensure the main power supply is turned OFF.
• If a voltage of more than 30 VAC or 60 VDC is to be applied to the alarm output
terminal, use ring-tongue crimp-on lugs with insulation sleeves on all terminals
to prevent the wires from slipping out when the screws become loose.
Furthermore, use double-insulated wires (dielectric strength of 2300 VAC or
more) for the signal wires on which a voltage of more than 30 VAC or 60 VDC is
to be applied. For all other wires, use basic insulated wires (dielectric strength
of 1350 VAC). To prevent electric shock, attach the terminal cover after wiring
and make sure not to touch the terminals.
Wiring Procedure
1. Turn OFF the recorder and remove the cover for the option terminal.
2. Connect the alarm output wires to the terminal.
The terminal arrangement will be one of the figures shown below depending on
the alarm output relay option (number of outputs) and the /F1 option.
3. Replace the terminal cover and fasten it with screws.
Note
The option terminal block itself can be removed by loosening the two screws at the top left
and bottom right of the terminal block. This makes wiring work easier. To prevent bad
contacts, make sure to securely tighten the screws after wiring.
2
Before Using the Recorder
2-7
Page 54

2.4 Alarm Output Wiring (/A1 to /A3, Option)
Alarm terminal position
Enclosed in parentheses are the relay numbers assigned to each option terminal.
Terminal arrangement (only the position of the alarm output terminals is
indicated.)
When the relay is not energized, NC is closed and NO is open. C is the common
terminal.
/A1, /A1/F1
Option terminal
/A2, /A2/F1
/A3, /A3/R1
Contact Specifications
For details related to the switching of energized/de-energized state of the alarm relays,
see section 6.4.
Item Specification
Output type Relay transfer contact (energize/de-energize switchable)
Output capacity 250 VAC (50/60 Hz), 3 A
250 VDC, 0.1 A (resistive load)
Dielectric strength 1500 VAC (50/60 Hz) for one minute between output terminals and
earth ground terminal
2-8
Page 55

2.5 FAIL/Memory End Wiring (/F1, Option)
WARNING
• To prevent electric shock, ensure the main power supply is turned OFF.
• If a voltage of more than 30 VAC or 60 VDC is to be applied to the FAIL/Memory
End output terminal, use ring-tongue crimp-on lugs with insulation sleeves on all
terminals to prevent the wires from slipping out when the screws become loose.
Furthermore, use double-insulated wires (dielectric strength of 2300 VAC or
more) for the signal wires on which a voltage of more than 30 VAC or 60 VDC is
to be applied. For all other wires, use basic insulated wires (dielectric strength
of 1350 VAC). To prevent electric shock, attach the terminal cover after wiring
and make sure not to touch the terminals.
Wiring Procedure
1. Turn OFF the recorder and remove the cover for the option terminal.
2. Connect the FAIL/Memory End output wires to the terminal.
The terminal arrangement for the FAIL/Memory End output option is as follows.
Terminal position
2
Before Using the Recorder
Option terminal
Terminal arrangement (only the position of the FAIL/Memory end output
terminals is indicated.)
When the relay is not energized, NC is closed and NO is open. C is the common
terminal.
3. Replace the terminal cover and fasten it with screws.
Note
• The option terminal block itself can be removed by loosening the two screws at the top left
and bottom right of the terminal block. This makes wiring work easier. To prevent bad
contacts, make sure to securely tighten the screws after wiring.
• FAIL output is a de-energize relay, and the Memory End output is an energize relay.
2-9
Page 56

2.5 FAIL/Memory End Wiring (/F1, Option)
Contact Specifications
Item Specification
Output type Relay transfer contact
Output capacity 250 VAC (50/60 Hz), 3 A
Dielectric strength 1500 VAC (50/60 Hz) for one minute between output terminals and
For details related to the FAIL/Memory End output, see section 1.8.
250 VDC, 0.1 A (resistive load)
earth ground terminal
2-10
Page 57

2.6 Remote Control Wiring (/R1, Option)
WARNING
To prevent electric shock, ensure the main power supply is turned OFF.
Wiring Procedure
1. Turn OFF the recorder and remove the cover for the option terminal.
2. Connect the remote control signal wires to the terminal.
The terminal arrangement for the remote control option is as follows. C is a
common terminal for terminals 1 through 8.
Terminal position
Option terminal
2
Before Using the Recorder
Terminal arrangement (only the position of the remote control terminals is
indicated.)
“C” denotes the
common terminal.
3. Replace the terminal cover and fasten it with screws.
Note
• The option terminal block itself can be removed by loosening the two screws at the top left
and bottom right of the terminal block. This makes wiring work easier. To prevent bad
contacts, make sure to securely tighten the screws after wiring.
• Use shielded wires for the remote control wires to reduce the effects of noise. Connect the
shield to the earth ground terminal of the recorder.
2-11
Page 58

2.6 Remote Control Wiring (/R1, Option)
Input Specifications
Item Specification
Input signal Voltage-free (dry) contact, open-collector (TTL or transistor)
Input conditions ON voltage : Less than or equal to 0.5 V (30 mA DC)
Input type Photocoupler isolation (one side common)
Dielectric strength 500 VDC for one minute between input terminals and earth ground
For details related to the control and input types, see section 10.7.
Leakage current in the OFF state : No more than 0.25 mA
Signal duration : 250 ms minimum
Internal isolated power source (5 V ±5%)
terminal
2-12
Page 59

2.7 Power Supply Wiring
This section describes how to connect the power supply cable. Make sure to read this
section before wiring the power supplly cables.
100 to 120 VAC/200 to 240 VAC Power Supply Model
Precautions to be taken when wiring the power supply
To prevent electric shock and damage to the recorder, observe the following warnings.
WARNING
• Confirm that the supply voltage meets the rated power supply voltage before
connecting the cable.
• Confirm that the power is turned OFF before connecting the power cord.
• To prevent electric shock and the possibility of fire, use only the power cord that
is supplied by Omega.
• Always use protective earth terminal to prevent electric shock. Connect the
power cord to a three-pole power outlet that has a protective earth terminal.
• Never use an extension cord that does not have protective earth terminal,
otherwise the protection function will be compromised.
Use a power supply that meets the following conditions:
Item Conditions
Rated power supply 100 to 240 VAC
Allowable power supply voltage range 90 to 132 or 180 to 264 VAC
Rated power supply frequency 50/60 Hz
Allowable power supply frequency range 50/60 Hz±2%
Maximum power consumption 38 VA(100 V), 53 VA(240 V)
2
Before Using the Recorder
Note
Do not use a supply voltage in the range 132 to 180 VAC, as this may have adverse effects
on the measurement accuracy.
• Connection procedure
1. Check that the recorder is turned OFF.
2. Connect the power cable (supplied with the recorder) to the power connector on
the rear panel of the recorder.
3. Connect the other end of the power cord to a socket that meets the
requirements.
2-13
Page 60

2.7 Power Supply Wiring
12 VDC Power Supply Model
Using AC adapter
Follow the warnings below to avoid electric shock or damaging the instrument.
• Connect the power wires after checking that the power supply is turned off to
• To prevent electric shock or fire, always use the power cable supplied by
• Before connecting the power cord, check that the voltage on the supply side
• When not using the instrument for a long time, unplug the power cord of the AC
• Only use the AC adapter from Omega (Part No.: B9230ZW).
• Do not put objects on top of the AC adapter or the power cord. Also, do not let
• When unplugging the power cord, do not pull on the power cord. Always hold
WARNING
prevent electric shock.
Omega.
matches with the voltage rating of this recorder.
adapter.
heat generating objects come in contact with them.
the plug. If the power cord becomes damaged, contact your nearest
representative listed on the back cover of this manual.
Connecting Procedure
1. Check that the power switch is turned OFF.
2. Connect the AC adapter to the AC adapter jack on RD-MV100.
Install the clamp filter (standard accessory) near RD-MV100 of power cord.
3. Connect the power cord plug that came with the AC adapter to the power supply
connector of the AC adapter.
4. Connect the plug on the other end of the power cord to a power outlet meeting the
following specifications.
The power outlet should be a three-pole type with a protective grounding terminal.
Rated power supply voltage: 100 to 240 VAC
Operating supply voltage range: 90 to 250 VAC
Rated supply voltage frequency: 50/60 Hz
Maximum power consumption: 90 VA
AC adapter rated output voltage: 12 VDC
AC adapter maximum rated output current: 2.6 A
Functional grounding
When using the AC adapter, noise may be reduced if the functional ground is connected
to the earth GND. Use the functional ground terminal as necessary.
2-14
Page 61

2.7 Power Supply Wiring
Using the accessory DC power terminal connector
Follow the warnings below to avoid electric shock or damaging the instrument.
WARNING
• Connect the power wires after checking that the power supply is turned off to
prevent electric shock.
• To prevent fire, use wires with cross sectional area of 0.3mm2(22AWG) or
more.
Connecting procedure
1. Check thst the power switch is turned off.
2. Connect the accessory DC power terminal connector (part No. A1105JC) to the power
wire and the DC100/DS400/DS600. Use a power wire with a cross sectional area of
2
0.3 mm
Install the clamp filter (standard accessory) near DC100 of power wire.
(22AWG) or more.
21
Soldering
-(0 VDC)
+(10 to 18 VDC)
2
Before Using the Recorder
Rated supply voltage: 12 VDC
Operating supply voltage:10 to 18 VDC
Power consumption: About 30 VA max.
2-15
Page 62

Chapter 3 Names of Parts/Run Mode/Common Operations
3.1 Names of Parts and Functions
Front Panel
3
Names of Parts/Run Mode/Common Operations
1
10
STOP
MEDIA
FUNC ESC
45 6789
DISP/
ENTER
MENUSTART
3
2
1. LCD screen
Displays various operation screens such as the trend display and the setup screen
to configure the recorder.
2. DISP/ENTER key
Displays and confirms the settings for switching screens in the operation mode.
3. Arrow keys
Used to select the screen in the operation mode and to select the parameter.
4. START key
Used to start the data acquisition to the internal memory and display the waveform
on the trend display. Also starts computation and the report function when the
computation function (/M1) is equipped.
5. STOP key
Used to stop the data acquisition to the internal memory. It also stops the updating
of the waveform on the trend display. If the model has the optional computation
function (/M1), the report is stopped. For computation, you can select whether or not
to stop the operation when the STOP key is pressed.
6. ESC key
Used to cancel an operation. Also used to return to the operation mode from the
setting mode (This function is the same as the MENU key).
7. MENU key
Used to enter the setting mode. Also used to return to the operation mode from the
setting mode (This function is the same as the ESC key).
3-1
Page 63

3.1 Names of Parts and Functions
8. MEDIA key
Detects the external storage medium and saves internal memory data to the external
storage medium.
9. FUNC key
Used to execute various functions in the operation mode. Also, used to enter the
basic setting mode from the setting mode.
10. Soft keys
When the FUNC key is pressed, the functions are assigned to the soft keys and
displayed at the bottom of the screen.
During the setting/basic setting modes, the parameters are assigned to the soft keys
and displayed at the bottom of the screen.
with floppy disk drive
with Zip drive
with ATA flash memory
card drive
START STOP USER FUNC ESC MENU
14 12
13
DISP/
ENTER
START STOP USER FUNC ESC MENU
12
DISP/
ENTER
START STOP USER FUNC ESC MENU
13 12
11. Power switch
Used to turn the power ON/OFF.
12. Storage medium drive
Floppy disk drive, Zip drive, or ATA flash memory card drive depending on the
specification.
13. Eject button (access lamp for Zip drive)
Used when ejecting the storage medium. Also is the access lamp for the Zip drive.
The access lamp is lit while the Zip disk is being accessed.
14. Access lamp for the flopppy disk drive
The access lamp is lit while the floppy disk is being accessed.
DISP/
ENTER
13
3-2
Page 64

Rear Panel
3.1 Names of Parts and Functions
3 (RS-232)
1. Power terminals
Connect the power cord.
2. Ethernet port
Connect the Ethernet cable (10Base-T).
3. Serial interface port
RS-232 port or RS-422-A/485 port depending on the specification. Connect the
serial interface cable.
4. Input terminals
Connect the input signal cable of the item being measured.
5. Option terminals
Connect optional input/output signal cables.
1 (AC power supply)2
5
4
3 (RS-422A/RS-485)
1 (12 VDCpower supply)
3
Names of Parts/Run Mode/Common Operations
Desktop Type
Note
See “RD-MV100 Communication interface user’s manual” to use Ethernet port and the serial
interface port.
1. Carrying handle
2. Foot
1
2
3-3
Page 65

3.2 Turning ON/OFF the Power Switch
This section describes the procedures to turn ON/OFF the power switch.
Procedure
1. Check the following points before turning ON the power switch.
• The power cord/wires are connected correctly to the recorder.
• The recorder is connected to the correct power supply. (See section 14.7)
• The proper fuse is set.
CAUTION
If the input wires are connected in parallel with another instrument, avoid turning
ON/OFF the recorder or the other instrument when either one is in operation.
This may affect the reading.
2. Turn the power switch ON.
After performing a self-diagnosis for a few seconds, a screen in the operation
mode appears.
3-4
Note
• If nothing is displayed when the power switch is turned ON, turn OFF the power switch and
check the points listed in step 1. After checking the points, turn ON the power switch again.
If the unit still does not work, it is probably malfunctioning. Contact Omega for repairs.
• If an error message is displayed on the screen, take measures according to the description in
chapter 12, “Troubleshooting.”
• Turn ON the power switch, let the RD-MV100 warm up for at least 30 minutes, and then start
the measurements.
Page 66

3.3 Inserting/Removing the External Storage
Medium
This section describes the procedures to insert and remove the external storage
medium. Three types of media can be used depending on the specification.
• Model RD-MV1
• Model RD-MV1
• Model RD-MV1
For the handling procedure of the storage medium, see section 2.1.
Procedure
Inserting the storage medium
1. Insert the medium into the drive until a click is heard.
2. When the power switch is turned ON, closing the front cover causes the RDMV100 to detect the existence of an external storage medium in the drive. If the
storage medium is detected, an external storage medium icon is displayed in the
status display section of the screen.
Note
The external storage medium can’t be detected when the MEDIA key is locked. First release
the MEDIA key and then press it. (See 10.2 Using key lock.)
-1: Floppy disk
-2: Zip disk
-3: ATA flash memory card
Floppy disk Zip disk ATA flash memory card
3
Names of Parts/Run Mode/Common Operations
Removing the storage medium
Floppy disks and ATA flash memory cards can be removed from the drive regardless of
whether the RD-MV100 is turned ON or OFF. Zip disks cannot be removed when the
RD-MV100 is turned OFF.
1. If the RD-MV100 is turned ON, check that the storage medium is not being
accessed.
Note
• The access lamp is lit while the storage medium is being accessed.
• A message “Data are being saved to the medium.” is displayed while measured/computed
data are being saved to the medium.
3-5
Page 67

Floppy disk Zip disk ATA flash memory card
3.3 Inserting/Removing the External Storage Medium
2. Open the front cover by pressing down on the knob that is located in the center
of the upper section of the cover and pulling forward. Push the eject button to
remove the storage medium.
3. Close the front cover. If the RD-MV100 is turned ON, the external storage
medium icon in the status display section disappears (see the figure of the icon
on the previous page).
Note
If the key lock function for the storage medium is engaged, the Zip disk cannot be ejected
even if the eject button is pressed. Release the key lock before attempting to eject the Zip
disk.
Procedure when the Zip disk cannot be ejected
If the Zip disk cannot be removed by performing the steps given in the “Removing the
storage medium” section, carry out the following steps to remove it.
1. Open the front cover by pressing down on the knob that is located in the center
of the upper section of the cover and pulling forward.
2. Insert a pin of approx. 1 mm in diameter into the eject button hole and press
slowly. This will cause the Zip disk to be ejected.
Eject button of the Zip drive
Zip disk eject hole
Insert
Pin
Explanation
Formatting external storage media
Format the external storage medium before use.
The external storage medium is formatted to the following types using the recorder.
Format type
Floppy disk : 2 HD, 1.44 MB
Zip disk : FDISK 1 partition (hard disk format)
ATA flash memory card : FDISK 1 partition (hard disk format)
External storage media formatted on other devices can be used as long as the format
type is the same as those indicated above.
3-6
Page 68

3.4 Run Mode
Mode types
Power ON
Setting mode Basic setting mode
MENU
Menu screen
Operation screens
Operation mode
Setting screens Setting screens
Menu screen
MENU or ESC
Pressing FUNC
for 3 seconds
Soft key
MENU or
ESC
Soft key ESC
[END] soft key - DISP/ENTER
There are three run modes on the recorder : operation, setting, and basic setting. This
section describes the functions and relationships of the three modes.
Mode Types
Mode Type Description Possible Operations
Operation mode This mode is used for daily operation. Monitoring operation
Setting mode This mode is used to configure the Setting the operation
Basic setting mode This mode is used to configure the Basic settings of the functions
(Setup mode) basic environment of the recorder Operation related to the file on
This mode is entered when the power Data acquisition
is turned ON.
recorder operation such as input Operation related to the file on
range and alarms. the external storage medium
This mode is entered by pressing the
MENU key in the operation mode.
Measured data cannot be displayed in
this mode.
Operations such as measurements,
alarm detection, and data acquisition
are continued.
such
as the input format and the data
storage format.
This mode is entered by pressing the
FUNC key for three seconds at the
setting mode menu. This mode cannot
be entered while data acquisition or
computation is in progress.
Operations such as measurements,
alarm detection, and data acquisition
are stopped.
the external storage medium
3
Names of Parts/Run Mode/Common Operations
3-7
Page 69

3.4 Run Mode
Functions and Operations in the Operation Mode
Operation screen
Displays various operation screens such as trend, digital, bar graph, alarm summary,
message summary, memory summary, historical trend, and report display (option).
Screens are switched by the arrow keys and the DISP/ENTER key. See chapter 4.
Operations using the FUNC key
Pressing the FUNC key displays a menu that is assigned to the soft keys at the bottom
of the screen. The menu varies depending on the setup information and options. Press
the [Next] soft key to display the soft key menu in the next line.
The function is executed by pressing the soft key. Press the FUNC or ESC key to erase
the menu without executing the assigned function.
FUNC key menu
Menu Ref. Section Description
Alarm ACK 6.1, 6.4 Release alarm indication and relay output (when
Message 7.4 Displays messages and stores them to the internal
Manual sample 8.12 Stores instantaneous values of all channels to the
Key lock 10.1 Enables or disables key lock.
Logout 10.3 Logout
Trigger 8.6, 8.11 Starts acquiring event data (when [Key Trigger] is
Math START/STOP 11.3 Starts/stops computation.
Math reset 11.3 Clears computed results.
Math ACK 11.3 Clears the computation dropout display.
Snapshot 9.6 Saves the screen image data to the external
Log 10.5 Displays log screens or the system information
*
FTP test
Save Display/Save Event 8.7 Stores the display data or event data to the
* See RD-MV100 Communication Interface User’s Manual.
alarm display and alarm output relay action is set
to “hold.”)
memory.
internal memory.
(when key kock is in use)
(when being logged in while key login is in use)
set as a trigger to start acquiring event data)
(when the computation function(/M1) is equipped)
(when the computation function(/M1) is equipped
and the computation is suspended)
(when the computation function(/M1) is equipped
and the computation dropout occures)
medium.
screen.
Execute FTP test.
external storage medium.
(only when the display data or event data(free
mode) are being acquired to the internal memory).
3-8
Page 70

Other key operations
• START/STOP
Start/stop acquiring measured/computed data. For the operating procedure, see
sections 8.5 and 8.6.
The waveform on the trend display also starts/stops.
When the computation function (/M1) is equiped, computation and the report function
also start/stop. For the operating procedure, see sections 11.3 and 11.12.
• MEDIA
Detects the external storage medium and saves the data in the internal memory to the
external storage medium in the manual save mode.
Functions of the Setting and Basic Setting Modes
Configure recorder functions using the arrow keys, the DISP/ENTER key, the soft keys,
and the character/number input keys. See “3.5 Configuring the functions” and chapters 5
through 11 for detail. Also see section 9.1 to save the setup data.
3.4 Run Mode
3
Names of Parts/Run Mode/Common Operations
3-9
Page 71

3.5 Configuring the Functions
Setting Mode and Basic Setting Mode
Basic setting mode
The basic setting mode is used to change the basic configuration of various functions.
Basic setting mode cannot be entered while data acquisition or computation is in
progress.
Setting mode
The setting mode is used to change the functions for each channel and the display
specifications. All items except the ones listed below can be changed while data
acquisition or computation is in operation. Items that cannot be changed are grayed and
the cursor cannot be moved on them.
• Items that cannot be changed while data acquisition is in progress
• Input range
• The trend’s display update rate
• Auto save interval
• Computing equation
• Constants for computation
• Items that cannot be changed while computation is in progress
• Range setting
• Computing equation
• Constants for computation
• TLOG timer number and computing unit
3-10
Page 72

Configuration Details
The configuration details of the setting mode and the basic setting mode are shown
below. Enclosed in parentheses are reference sections.
Settings related to the input
Settings related to the alarm
3.5 Configuring the Functions
Item Setting Mode Basic Setting Mode
Scan interval • Scan interval
Input specifications • Input type
(5.1 to 5.7) • Measurement range
Burnout (5.9) • Burn out Off/Up/Down
Reference junction • Switch between
compensation
Noise elimination • Filter time constant/Off (RD-MV102/• Integration time of the A/D
Item Setting Mode Basic Setting Mode
Alarm • Alarm type (6.2) • Display hold/non-hold (6.4)
Alarm output relay • Reflash alarm
operation (option) • AND operation
(6.4) • Relay energize/de-energize
• Upper and lower limit of span
• Reference channel for differential
computation
• Upper and lower limits of scale
• Unit
[External]
• Compensation voltage when set to
[External]
RD-MV104) (5.8) converter (5.9)
•
Number of samples for the moving
average/Off
• Alarm value (6.2) •
• Output relay On/Off (6.2) change alarm (for measurement
• Output relay number (6.2) channels only) (6.4)
• Alarm delay time (6.3) • Hysteresis (for
(RD-MV106/RD-MV112) (5.8)
The time interval for the
channels
• Relay hold/non-hold
[Internal] and
rate-of-
measurement
only) (6.4)
3
Names of Parts/Run Mode/Common Operations
3-11
Page 73

3.5 Configuring the Functions
Settings related to the display
Item Setting Mode Basic Setting Mode
Display group (7.6) • Group name (7.6)
Tag/Channel display • Tag name (7.1) • Switch between tag display
Trend • Display rate (7.3) • Measurement channels to
Bar graph • Channel display color
LCD • Background color (white or black) (7.13)
• Channel assignment (7.6)
• Group display switching interval (7.13)
and channel display (7.2)
• Message (7.5) display the trend
• Trip line position, display color (7.7)
• Trip line width (7.13) channels
• Channel display color (7.8) acquired) (8.10)
(applies also to bar graphs) • Use/not use the partial
• Display direction (vertical/horizontal) (7.13) expansion display (7.12)
• Trend line width (7.13)
• Grid (7.13)
• Number of scale divisions (7.10)
(applies also to bar graphs)
• Scale position (7.10)
• Zone upper and lower limits (7.9)
• Partial expansion display (7.11)
(applies also to trends) (7.8)
• Bar graph direction (vertical/horizontal) (7.13)
• Number of display scale divisions
(applies also to trends) (7.10)
• Bar graph base position (7.10)
• Brightness (7.14)
• Backlight saver specifications (7.14)
(applies also to measurement
that data are
to be
Settings related to data storage
Item Setting Mode Basic Setting Mode
Data acquisition (8.11)
Channel selections for • Measurement channels
data
acquisition (8.10)
Storage media • Name of the directory to which data are • Save method to the to be
Memory end alarm • Minimum remaining amount
(option) of internal memory at which
saved (8.9) storage media, auto save or
• File header string (8.9) manual save (8.11)
• Range of data to be saved
during manual save (8.9)
• Auto save interval (during auto save) (8.8)
• Types of data to be acquired
• Event data
• Sampling interval
• Mode (Free/Trigger/
Rotate)
• Number of blocks
(number of memory
divisions)
• Data length (file size)
• Pre-trigger position
• Type of trigger to use
that data are to be acquired
(applies also to measurement
channels for which to display
the trend)
• Computation channels that
data are to be
acquired
(applies also to
computation channels for
which to display
to generate the alarm (10.6)
the trend)
3-12
Page 74

3.5 Configuring the Functions
Settings related only to the computation channels (configured on a screen
dedicated to computation channels, option)
Item Setting Mode Basic Setting Mode
Computation • Computing equation • Display span
specifications (11.4) • Unit
Constants (11.6) • Constants (K01 to K12)
Alarm • Alarm type (11.5)
• Alarm value (11.5)
• Output relay ON/OFF (11.5)
• Output relay number (11.5)
• Alarm delay time (6.3)
Tag/Channel display • Tag name (7.1)
Trent • Channel display color (7.8) • Computation channels to
• Number of display scale divisions (7.10) display the trend
• Scale position (7.10) (applies also to
• Zone display (7.9) computation channels that
• Partial expansion display (7.11) data are to be acquired)
(8.10)
Bar graph • Channel display color
(Applies also to trends) (7.8)
• Number of scale divisions (7.10)
• Bar graph base position (7.10)
TLOG computation • Timer number to use, sum unit (11.8) • Timer mode (absolute time/
relative time) (11.9)
• Interval time (11.9)
• Reference time for the
absolute timer (11.9)
• Turn ON/OFF reset at each
interval (11.9)
• Turn ON/OFF data saving
to the storage medium (11.9)
Rolling average • On/Off
(11.10) • Sampling interval
• Number of samples
3
Names of Parts/Run Mode/Common Operations
Other settings
Item Setting Mode Basic Setting Mode
Time • Date/time(3.7)
Key lock (10.2) • Use/Not use key lock
• Password
• Keys to lock, enable/disable
the key lock
Key login (10.4) • Use/Not use key login
• Auto logout On/Off
• Use/Not use user ID
• User name
• User ID
• Password
• Allow/Prohibit basic setting
mode
Remote control (Option) (10.7) • Action assignment on
remote terminals
Report (Option) (11.13) • Report types
• Date/Time of creation
• Report channel
assignments
• Sum unit
Display language (10.8) • Select the display language
Daylight savings (10.12) • Date/Time to switch
Temperature (10.13) • Temperature unit
3-13
Page 75

3.5 Configuring the Functions
File Management and Data Clearing
Operations related to the internal memory
Item Setting Mode Basic Setting Mode
Initialization of • Clear measured/computed data • Initialize settings (basic
settingsettings/data clearing in the internal memory (9.7)
Management of files on the external storage media
Item Setting Mode Basic Setting Mode
File management • Save setup data (9.1) • Save setup data (9.1)
• Load setup data (9.1) • Load setup data (9.1)
• Save measured data with key • Delete files (9.5)
operation (9.2) • Format external storage media (9.5)
• Load/display display data (9.3)
• Load/display event data (9.4)
• List filesz (9.5)
• Delete files (9.5)
• Format external storage media (9.5)
The Menu Screen and Items of the Setting Mode
The menu screen and items of the setting mode are as follows. Enclosed in parentheses
are reference sections. [Math set1], [Math set2], [Math set3] are displayed when the
computational function(/M1) is equipped.
mode/setting mode) and clear
measured/computed data in the
internal memory (9.8)
3-14
To [Display] menu on the next page
To [Save/Load, Clear data] menu
on the next page
Page 76

[Display] menu
[Save/Load, Clear data] menu
3.5 Configuring the Functions
3
Names of Parts/Run Mode/Common Operations
Soft key Settings in the Setting Mode
Title Item
#1 Range (5.1 to 5.7) Input type
Measurement range
Upper and lower limits of span
Reference channel for difference computation
Upper and lower limits of scale
Unit
Alarm (6.2) Alarm type
Alarm value
Output relay On/Off
Output relay number
#2 Tag (7.1) Tag name
Filter (5.8) Filter time constant/Off (RD-MV102/RD-MV104)
Moving avarage (5.8) Number of samples for the moving average/Off
(RD-MV106/RD-MV112)
Alarm delay time (6.3)
#3 Trend/Save interval Trend display rate (7.3)
Auto save interval (8.8)
#4 Message (7.5) Message string
#5 Display
#5 - #1 Group set/Trip line Group name (7.6)
Assign channels to groups (7.6)
Trip line position, display color (7.7)
#5 - #2 Color (7.8) Measurement channel display color
3-15
Page 77

3.5 Configuring the Functions
Soft key Settings in the Setting Mode
#5 - #3 Zone (7.9) Zone upper and lower limits
#5 - #4 View (7.13) Trend display direction
#5 - #5 Math (Color) (7.8) Computation channel display color
#5 - #6 Zone (7.9) Zone upper and lower limits for the computation
#6 File (8.9) Header string to be written to file
#7 Save/Load, Clear data
#7 - #1 Save settings Save setup data to the external storage medium (9.1)
#7 - #2 Load settings Load setup data from the external storage
#7 - #3 Save data Store measured data using key operation (9.2)
#7 - #4 Load display data Load/Display the diaplay data on the external
#7 - #5 Load event data Load/Display the event data on the external
#7 - #6 File list List the files on the external storage medium (9.5)
#7 - #7 Delete Delete files on the external storage medium (9.5)
#7 - #8 Format Format the external storage medium (9.5)
#7 - #9 Clear data Clear the measure/computed data in the internal
#8 Time set (3.7) Date/time
#9 Math range (11.4) Computing equations, display span, and unit for
#10 Constant (11.6) Constants (K01 to K12)
Title Item
Graph (7.10) Number of scale divisions for the trend and bar
graph
Bar graph base position
Specify the the scale display positon for trends.
Partial (7.11) Turn On/Off partial expansion display
Position and boundary for the partial expansion
display
Bar graph display direction
Background color (white or black)
Trend line width
Trip line width
Grid for the trend display
Group display switching interva (Scroll time)
LCD (7.14) LCD brightness
Turn On/Off the LCD backlight saver
Transition time for the LCD backlight saver and
conditions that restore the backlight
channels
Graph (7.10) Number of scale divisions for the trend and bar
graph displays for the computation channels
Bar graph base positions for the computation
channels
Specify the the scale display positon for trends for
the computation channels.
Partial (7.11) Turn On/Off partial expansion display for the
computation channels
Position and boundary for the partial expansion
display for the computation channels
Name of directory to which data are to be saved
Range of data to be saved during manual save
Daylight savings time (10.12) Daylight savings time switch time
medium (9.1)
storage medium (9.3)
storage medium (9.4)
memory (9.7)
computation channels
Math alarm (11.5) Alarm type for the computation channel
Alarm value for the computation channel
Output relay On/Off for the computation channel
Output relay number for the computation channel
3-16
Page 78

3.5 Configuring the Functions
Soft key Settings in the Setting Mode
Title Item
#11 Tag (7.1) Tag names of the computation channels
TLOG (11.8) Timer number used in TLOG, sum unit
Rolling average (11.10) Turn ON/OFF the rolling average
Alarm delay time (6.3)
The Menu Screen and Items of the Basic Setting Mode
The menu screen and items of the basic setting mode are as follows. Enclosed in
parentheses are reference sections.
[Save/Load, Initialize] menu
Sampling interval and the number of samples for
the rolling average
3
Names of Parts/Run Mode/Common Operations
To [Save/Load, Initialize] menu below
See RD-MV100 communication
Interface User’s Manual
Soft key Settings in the Basic Setting Mode
Title Item
#1 Alarm (6.4) Reflash alarm
AND operation of alarm output relays
Energize/de-energize alarm output relays
Hold/non-hold alarm output relays
Hold/non-hold alarm displays
Rate-of-change alarm interval
Alarm hysteresis
#2 A/D (5.9) Integration time of the A/D converter
Scan interval
Burn out Off/Up/Down
Reference junction compensation (select internal/
external, compensation voltage when using
external)
Temperature (10.13) Temperature unit
3-17
Page 79

3.5 Configuring the Functions
3-18
Soft key Settings in the Basic Setting Mode
Title Item
#3 Memory (8.11) Save method to the external storage medium
Type of data to be acquired
Event data
• Sampling interval
• Mode (Free/Trigger/Rotate)
• Number of blocks (number of memory divisions)
• Data length (file size)
• Pre-trigger position
• Type of trigger to use
#4 Memory & trend (8.10) Measurement channels to acquire data/display
the trend
Computation channels to acquire data/display the
trend
#5 Aux Switch between tag display and channel display
(7.2)
Minimum remaining amount of internal memory at
which to generate the alarm (10.6)
Set the displayed language (10.8)
Use/Not use partial expansion display (7.12)
Use/Not use batch function (for models with /BT1)
(10.11)
#6 Key lock (10.2) Use/Not use key lock
Password
Keys to lock, enable/disable the key lock
#7 Key login (10.4) Use/Not use key login
Auto logout On/Off
Use/Not use user ID
User name
User ID
Password
Allow/Prohibit basic setting mode
#8 Save/Load, Initialize
#8 - #1 Save settings Save setup data to the external storage medium (9.1)
#8 - #2 Load settings Load setup data from the external storage
medium (9.1)
#8 - #3 Delete Delete files on the external storage medium (9.5)
#8 - #4 Format Format the external storage medium (9.5)
#8 - #5 Initialize Initialize the setup data in the internal memory
and clear measured/computed data (9.8)
#9 Option
#9 - #1 Remote (10.7) Action assignment on remote terminals
#9 - #2 Report (11.13) Report types
Date/Time of creation
Report channel assignments
Sum unit
#9 - #3 Timer (TLOG) (11.9) Timer mode (absolute time/relative time)
Interval
Reference time for the absolute timer
Turn ON/OFF reset at each interval
Turn ON/OFF data saving to the storage medium
#10 Communications
#10 - #1 Ethernet (IP_Address)
#10 - #2 Ethernet (DNS)
#10 - #3 FTP transfer file
#10 - #4 FTP connection
#10 - #5 Control (login, timeout)
#10 - #6 Serial/Memory out
*
*
*
*
*
*
End End (3.6) Terminate operations in the basic setting mode
* See RD-MV100 Communication Interface User’s Manual.
Page 80

3.6 Common Key Operations
This section describes common key operations that are used often.
MEDIA
Key Operations in the Basic Setting Mode
Procedure
Entering the basic setting mode
1. Press the MENU key to enter the setting mode.
2. Hold the FUNC key down for three seconds to enter the basic setting mode.
3. Press the soft key to enter individual setting screens.
Note
• Basic setting mode cannot be entered while data acquisition or computation is in progress.
Stop data acquisition and computation first before entering the basic setting mode.
• Changing and storing the data acquiring method in the basic setting mode ([#3 Memory] and
[#4 Memory and trend]) clears the measured/computed data in the internal memory. Make
sure to save the data to the external storage medium before entering the basic setting mode.
Common key operations in the basic setting mode are described.
Soft keys
Arrow keys
3
Names of Parts/Run Mode/Common Operations
DISP/
ENTER
MENUESCFUNCSTART STOP
DISP/ENTER key
Cursor position
(bule)
Setting selections (selected using the soft keys)
3-19
Page 81

Setting selections (selected using the soft keys)
Cursor position
(bule)
3.6 Common Key Operations
Selecting the parameter
Confirming the settings
Returning to the menu screen of the basic setting mode
Exiting the basic setting mode
Carry out the following steps when the basic setting menu is displayed.
1. Use the arrow keys to move the cursor (blue) to the appropriate parameter. The
available selections are displayed at the bottom of the screen above the soft
keys.
2. Select the parameter with the soft key. The box containing the parameter that
was changed turns yellow. The cursor moves the next parameter.
To cancel the settings, press the ESC key. A window appears for you to confirm
the cancellation. Select [Yes] and press the DISP/ENTER key.
1. Pressing the DISP/ENTER key confirms the new settings. The parameter boxes
return to a white color. The cursor moves to the first parameter on the page.
1. Press the ESC key to return to the menu screen of the basic setting mode.
1. Press the [END] soft key. A confirmation window with a message [Do you want
to store and make the new settings take effect?] appears.
2. Selecting [Yes] with the arrow key and pressing the DISP/ENTER key saves the
new settings and returns to the operation mode.
If you do not wish to save the new settings, select [No] with the arrow key and
press the DISP/ENTER key to return to the operation mode.
Selecting [Cancel] with the arrow key and pressing the DISP/ENTER key
cancels the “operation to exit the basic setting mode” and returns to the basic
setting mode menu. In this case, the setting changes made up to that point are
held.
Key Operations in the Setting Mode
Procedure
Entering the setting mode
1. Press the MENU key to enter the setting mode.
2. Press the soft key to enter individual setting screens.
Common key operations in the setting mode are described.
3-20
Page 82

Entering Numbers
3.6 Common Key Operations
Selecting the parameter
1. Use the arrow keys to move the cursor (blue) to the appropriate parameter. The
available selections are displayed at the bottom of the screen above the soft
keys.
2. Select the parameter with the soft key. The box containing the parameter that
was changed turns yellow. The cursor moves to the next parameter.
To cancel the settings, press the ESC key. A window appears for you to confirm
the cancellation. Select [Yes] and press the DISP/ENTER key.
Confirming the settings
1. Pressing the DISP/ENTER key confirms the new settings. The parameter boxes
return to a white color. The cursor moves to the first parameter on the page.
Returning to the menu screen of the setting mode
1. Press the Menu or ESC key to return to the menu screen of the setting mode.
Exiting the setting mode
1. Press the MENU or the ESC key to save the settimgs and return to the
operation mode.
The operation to enter numbers is used such as when setting the date, time, or the
display span of the input range.
Window for entering numbers
3
Names of Parts/Run Mode/Common Operations
Procedure
Select numbers
When the window used to enter the numbers appears, enter the value according to the
following key operations.
• Left and right arrow keys : Selects the input position
• Up and down arrow keys : Enters the number
3-21
Page 83

3.6 Common Key Operations
Entering Characters
Used to set tag names, set message strings, set or enter passwords.
Procedure
When the window used to enter the string appear, enter the characters according to the
following key operations.
• Left and right arrow keys : Selects the input position
• Up and down arrow key : Enters the character
• [A/a/1] soft key : Select upper-case alphabet (A), lower-case alphabet (a), or
• [DEL] soft key : Deletes the character at the cursor position.
• [BS] soft key : Deletes the character to the left of the cursor position.
• [INS] soft key : Selects insert or overwrite
Window for entering characters
Select character
Insert/overwrite
Selected character type
numbers (1).
The character type is switched in the following order each time the [1/a/A] soft key is
pressed. The selected character type is displayed to the right down of the input
window.
Upper-case alphabet (A) → lower-case alphabet (a) → numbers (1)
Insert and overwrite modes switch each time the [INS] soft key is pressed. The
selected mode is displayed to the right down of the input window.
Copying a Character String
Procedure
To copy a character string to another box, follow the procedures below.
Clearing the character string
3-22
1. Move the cursor to the copy source string and press the [Copy] soft key.
2. Move the cursor to the copy destination box and press the [Paste] soft key. The
character string is copied.
1. To clear the character string, press the [Clear] soft key.
Page 84

3.7 Setting the Date and Time
Set the date and time. The set date and time can be specified whether it belong to the
summer time or the winter time. The summer time and the winter time are defined by the
daylight savings time adjustment function. For detail, see section 10.12, “Using the
Daylight Savings Time Adjustment Function.”
Procedure
MENU
Press
.
3
Names of Parts/Run Mode/Common Operations
Press the soft key
To display the window for the date and time setting, press the soft key
1. YY/MM/DD HH:MM:SS
Enter the date and time.
Pressing the [Input] soft key displays a window used to enter the date and time.
Enter the date and time and press the [DISP/ENTER] key. For the procedures
related to entering numbers, see “Entering Numbers” on page 3-21.
Pressing the DISP/ENTER key closes the window without setting the [DST] box.
To cancel the setting and close the window, press the ESC key.
2. DST (Daylight savings time adjustment function)
[Summer] or [Winter] is displayed in the [DST] box corresponding to the date
and time indicated in the [YY/MM/DD HH:MM:SS] box when the window is
opened.
Operate as follows to set [Summer] or [Winter] for the date and time entered.
Pressing the right arrow key shifts the cursol to the [DST] box. Select [Summer]
or [Winter] by the soft key and press the DISP/ENTER key. The window closes.
To cancel the setting and close the window, press the ESC key before pressing
the DISP/ENTER key.
Next 1/3
.
#8
.
3-23
Page 85

Chapter 4 Switching Operation Screens
4.1 Operation Screens
This chapter describes the screen (operation screen) used to display the measured/
computed data.
Status display section
Data display section
4
Switching Operation Screens
Screen menu
Displayed by pressing the DISP/ENTER key
Sub menu
• The screen consists of the status display section and the data display section.
• The operation screen includes trend, digital, bar graph, alarm summary, message
summary, memory summary, report (option), and historical trend.
• The arrow keys and the DISP/ENTER key are used to switch the screen.
Screen menu : Displayed when the DISP/ENTER key is pressed.
Sub menu : Displayed when the right arrow key is pressed while the screen
menu is displayed.
• The following operations are possible.
• For trend, digital, and bar graph displays, the displayed group can be
automatically switched.
• Recalling the historical trend at the time the alarm selected in the Alarm Summary
occured or the message selected in the Message Summary is written. Also
displaying the historical trend selected in the Memory Summary.
• Switching to the trend or bar graph screen that contains the channel data pointed
on the overview screen.
Arrow keys
DISP/
STOP
MEDIA
FUNC ESC
MENUSTART
ENTER
DISP/ENTER key
4-1
Page 86

4.2 Explanation of the Status Display Section
The following information is displayed in the status display section during the operation
mode and the setting mode. (The information is not displayed in the basic setting mode.
[Setup Mode] is displayed instead).
5-1
1
2
3
A
B
C
6
6-1 ([Free] ode)
6-2 ([Trigger] or [Rotate] mode)
4
859 10
7
D
E
F
1. User name
The user name is displayed when a user is logged in using the key login function.
2. Group name or screen name
The name of the group or screen that is displayed in the data display section. [ALL]
is displayed only during all channel display (see section 4.3).
3. Current date and time
The current date and time are displayed.
4-2
4. ON/OFF state of the measured/computed data acquisition.
A and B are displayed alternately : Data acquisition in progress or waiting for the
event data trigger.
C : Data acquisition is suspended.
Note
For event data that starts acquiring data upon receiving a trigger, the indicator indicates that
the data acquisition is in progress even when it is in the trigger wait state. The trigger wait
state can be identified using the bar graph described in item 6.
Page 87

4.2 Explanation of the Status Display Section
5. The usage condition of the display data storage area in the internal memory
This is displayed when display data acquisition is enabled.
• Bar graph
Displays the used space of the display data storage area.
• Time period
The remaining time for acquiring the display data. When the remaining time is
less than one hour, the time is displayed in units of minutes.
Remaining memory Unit
Greater than or equal to 100 days : %
(Percentage of the remaining area with respect to the display data acquisition
area)
Greater than or equal to 100 hours, less than 100 days : days
(unit less than one day is rounded off)
Greater than or equal to 60 minutes, less than 100 hours : hours
(unit less than one hour is rounded off)
Less than 60 minutes : minutes
(unit less than one minute is rounded off)
• n/16
The maximum number of display data files* that can be written to the internal
memory is 16. “16” represents this value. “n” represents the number of files in the
internal memory.
* One file contains data that are acquired between start and stop operations.
Note
The display data are overwritten for the following cases. Be aware of these cases, because
data that are overwritten are lost.
• When the display data storage area in the internal memory becomes full.
In such case, [Overwrite] is displayed in the status display section.
• When the number of files that remains to be saved to the external medium exceeds 16.
4
Switching Operation Screens
6. The usage condition of the event data storage area in the internal memory
This is displayed when event data acquisition is enabled.
• When the trigger mode is set to [Free]
• Bar graph
Displays the used space of the event data storage area.
• Time period
The remaining time for acquiring the event data. When the remaining time is
less than one hour, the time is displayed in units of minutes.
Remaining memory Unit (refer to item 5)
Greater than or equal to 100 days : %
Greater than or equal to 100 hours, less than 100 days : days
Greater than or equal to 60 minutes, less than 100 hours : hours
Less than 60 minutes : minutes
• n/16
The maximum number of event data files* that can be written to the internal
memory is 16. “16” represents this value. “n” represents the number of files in
the internal memory.
* One file contains data that are acquired between start and stop operations.
Note
The event data are overwritten for the following cases. Be aware of these cases, because
data that are overwritten are lost.
• When the event data storage area in the internal memory becomes full.
In such case, [Overwrite] is displayed in the status display section.
• When the number of files that remains to be saved to the external medium exceeds 16.
4-3
Page 88

4.2 Explanation of the Status Display Section
• When the trigger mode is set to [Trigger] or [Rotate]
• Bar graph
Displays the used space with respect to the specified memory length (data
length, see section 8.11).
When pretrigger is specified and the START key is pressed causing the RDMV100 to enter the trigger wait state, data of size equal to the pretrigger amount
are acquired to the internal memory. The bar is displayed in orange. After
acquiring data of size equal to the pretrigger, the length of the bar stays fixed.
However, the relevant data are updated until the trigger is activated. When the
trigger is activated, the bar turns green. Data are acquired to the internal
memory after the pretrigger data.
During the [Trigger] mode (see section 8.2), [Full] is displayed when data
acquisition to all blocks is complete. When [Full] is displayed, event data are no
longer acquired even if the trigger condition is met. In this case, save the data
in the internal memory to the external storage medium.
• Block display
When the event data storage area is divided into multiple blocks, the usage
condition of the blocks are displayed.
White block : No data
Green block : Block containing data that were acquired to the internal
Gray block : Block containing data that were acquired before the current
memory after starting the current acquisition of event data.
start operation.
7. The external storage medium condition
No display : No storage medium inserted.
D and E displayed in order : Accessing the storage medium.
E : Storage medium is idle (no access)
F : The used space of the storage medium is indicated by the green level indicator in
the icon. The colored section indicating the level turns red when the amount of
free space on the storage medium falls below 10%.
8. Computation icon (option)
Computation icon not displayed : No computation option or computation is suspended
White computation icon : Computation in progress
Yellow computation icon : Computation data dropout occurred
Note
Computation data dropout occurs when the computation is not completed within the scan
interval. The computation icon returns to the green icon by pressing FUNC → [MathACK] soft
key(see section 11.3). If a computation dropout occurs, make the scan interval longer (see
section 5.9) or reduce the number of computation channels that are turned On (see section
11.4).
9. Key lock icon
Key icon : Key lock ON
No display : Key lock OFF
10. Alarm icon
Displayed when any one of the alarms is occurring. For details, see chapter 6.
4-4
Page 89

4.3 Using the Trend, Digital, and Bar Graph
Screens
Operation Flow Diagram
TREND, DIGITAL, BAR GRAPH
DISP
Group 1
(Screen menu)
Changing groups
Group 2
: Screen menu,
(Sub menu)
Group 3 Group 4
: Sub menu,
(Operation screens)
TREND
DISP
DIGITAL
BAR GRAPH
DISP
: DISP/ENTER key,
(Screen menu)
DISP
DISP
Switching screens
TREND DIGITAL
(Sub menu)
BAR GRAPH
: Arrow keys
Group channels
All channels
Scale ON/OFF
Nemerical display ON/OFF
Auto scroll ON/OFF
Changing groups
Auto scroll ON/OFF
4
Switching Operation Screens
Procedure
Displaying the screen
Follow the procedures below when a different operation screen is being displayed.
1. Pressing the DISP/ENTER key displays the screen menu.
2. Select [Trend], [Digital], or [Bar Graph] using the up and down arrow keys.
3. Pressing the right arrow key displays the sub menu.
To close the sub menu, press the left arrow key.
4. Select the group using the up and down arrow keys.
5. Pressing the DISP/ENTER displays the screen.
To close the menu without switching the screen, press the ESC key.
4-5
Page 90

4.3 Using the Trend, Digital, and Bar Graph Screens
Displaying or clearing the scale on the trend screen
This operation is carried out on the Trend screen.
1. Pressing the DISP/ENTER displays the screen menu. ([Trend] is selected.)
2. Pressing the right arrow key displays the sub menu.
To close the sub menu, press the left arrow key.
3. Select [SCALE ON]
* The one that is selectable is displayed in the sub menu.
4. Pressing the DISP/ENTER key displays the scale.
To close the menu without displaying/clearing the scale, press the ESC key.
Displaying all channel trend/Return to group channel trend
This operation is carried out on the Trend screen.
All channel trend displays waveforms of all channels set for Trend screen. See section
8.10 to set channels for Trend screen.
1. Pressing the DISP/ENTER key displays the screen menu. ([Trend] is selected.)
2. Pressing the right arrow key displays the sub menu.
To close the sub menu, press the left arrow key.
3. Select [ALL CHANNEL]
keys.
* The one that is selectable is displayed in the sub menu.
*
or [SCALE OFF].
*
or [GROUP CHANNEL] using the up and down arrow
*
4-6
4. Pressing the DISP/ENTER key displays the screen.
To close the menu without switching the screen, press the ESC key.
Page 91

4.3 Using the Trend, Digital, and Bar Graph Screens
Displaying or clearing the numerical section on the trend screen
This operation is carried out on the Trend screen.
1. Pressing the DISP/ENTER displays the screen menu. ([Trend] is selected.)
2. Pressing the right arrow key displays the sub menu.
To close the sub menu, press the left arrow key.
3. Select [DIGITAL ON]
* The one that is selectable is displayed in the sub menu.
4. Pressing the DISP/ENTER key displays/clears the numerical section.
To close the menu without displaying/clearing the numerical section, press the
ESC key.
Changing the group on the display screen
The following three methods are available. If all channel display is selected, waveforms
for all channels that are registered to display the trend (see section 8.10) are displayed
even when the group is changed.
• Changing the group on the display screen from the screen menu
1. Pressing the DISP/ENTER key displays the screen menu.
2. Pressing the right arrow key displays the sub menu.
To close the sub menu, press the left arrow key.
3. Select the group using the up and down arrow keys.
4. Pressing the DISP/ENTER displays the selected group.
To close the menu without switching the screen, press the ESC key.
*
or [DIGITAL OFF]* using the up and down keys.
4
Switching Operation Screens
• Changing the group on the display screen using the arrow keys
1. The displayed group changes in the order Group 1, Group 2, Group 3, Group 4,
Group 1, and so on by pressing the right arrow key on the trend, digital, and bar
graph screens.
2. By pressing the left arrow key, the displayed group changes in the reverse
order.
• Automatically switch the displayed groups/stop the automatic switching
The displayed group on the trend, digital, and bar graph displays can be
automatically switched at the specified interval. In each display, the displayed group
rotates from group 1 to group 4. You can select 5 s, 10 s, 20 s, 30 s, and 1 min for
the switch interval. For the procedure related to setting the switch interval, see
section 7.13.
1. On the trend, digital, and bar graph displays, press the DISP/ENTER key to
display the screen menu.
2. Press the right arrow key to display the sub menu. To close the sub menu that
you opened, press the left arrow.
4-7
Page 92

4.3 Using the Trend, Digital, and Bar Graph Screens
3. To enable automatic switching, select [AUTO SCROLL ON]* using the up and
down arrow keys. To disable automatic switching, select [AUTO SCROLL
OFF]* using the up and down arrow keys.
* The one that is selectable is displayed in the sub menu.
4. Press the DISP/ENTER key to enable or disable the automatic switching of the
displayed groups.
Switching the trend, digital, and bar graph screens
The following two methods are available:
• Switch between trend, digital, and bar graph from the screen menu
The operating procedure is the same as “Displaying the screen” on page 4-5.
• Switching the trend, digital, and bar graph screens using the arrow keys
1. The displayed screen changes in the order trend, digital, bar graph, trend, and
so on by pressing the down arrow key on the trend, digital, and bar graph
screens.
2. By pressing the up arrow key, the displayed screen changes in the reverse
order.
Starting the waveform display of the trend display/stopping the waveform update
The operation procedure used to start the waveform display of the trend display and the
procedure used to stop the waveform update are the same as the operation used to
start/stop the data acquisition to the internal memory. When the data are being acquired
to the internal memory, the waveform is displayed. When it is stopped, the waveform is
not updated. For the operating procedure, see sections 8.4 and 8.6.
4-8
Page 93

4.3 Using the Trend, Digital, and Bar Graph Screens
Explanation
About group display and all channel display
The group display of trend, digital, and bar graph and the all channel display of the trend
are displayed in the following fashion (see table below). They depend on whether
channels are assigned to the groups and whether the channels are set to display the
trend and set to store the data.
Assigned to Trend Display/Data Numerical Display*1Trend’s Waveform Display Data Acquisition to the
Groups Storage Specification Bar Graph Group All Channels Internal Memory
Yes Yes Display Display Display Yes
Yes No Display Don’t display Don’t display No
No Yes Don’t display Don’t display Display Yes
No No Don’t display Don’t display Don’t display No
*1 Numerical display refers to the numerical display of trend, digital, and bar graph displays.
• The numerical display of trend, digital, and bar graph displays and the bar graph
display are updated at all times when they are displayed. It is not affected by
whether or not the waveform of the trend display is shown.
• The waveform of the trend display is updated at the display update rate. For the
procedure related to setting the display update rate, see section 7.3, “Setting the
Display Update Rate (Trend).”
• For the procedure related to setting the channel to display the trend and to store the
data, see section 8.10.
• For the procedure used to assign channels to groups, see section 7.6.
4
Switching Operation Screens
Alarm indication
Alarms are checked at all times and displayed on the relevant displays regardless of
whether or not the waveform of the trend display is shown.
Alarms are displayed using alarm type symbols. For details related to the alarms, see
section 6.2.
Name Symbol
Upper limit alarm H
Lower limit alarm L
Difference upper limit alarm h
Difference lower limit alarm l
Upper limit on rate-of-change alarm R
Lower limit on rate-of-change alarm r
Delay upper limit alarm T
Delay lower limit alarm t
The display direction of the trend and the bar graph
For the setting procedure of the display direction of the trend and the bar graph, see
section 7.13.
4-9
Page 94

4.3 Using the Trend, Digital, and Bar Graph Screens
Trend (vertical display)
Trend (vertical display, all channel display)
Scale
Display update rate (Time/div)
Message
Trip line
Channel/Tag
Measured/computed value
Unit
Alarm mark
Waveform of all channels
Data of selected group
Digital
Bar graph (vertical display)
Measured/computed value
Alarm mark
Channel/Tag
Measured/computed value
Unit
Tag/Channel
Alarm mark
Upper limit of span
Alarm point mark
Bar graph
Lower limit of span
Unit
4-10
Page 95

4.4 Using the Overview Screen
Operation Flow Diagram
Procedure
(Screen menu) (Overview screen)
DISP
DISP
: Screen menu,
: Sub menu,
Displaying the screen
1. Pressing the DISP/ENTER key displays the screen menu.
2. Select [Trend], [Digital], or [Bar Graph] using the up and down arrow keys.
Select [Overview] using the up and down arrow keys.
3. Pressing the DISP/ENTER displays the screen.
To close the menu without switching the screen, press the ESC key.
Displaying or clearing the cursor
1. Pressing the DISP/ENTER key displays the screen menu.
2. Pressing the right arrow key displays the sub menu.
To close the sub menu, press the left arrow key.
3. Select [CURSOR ON]
* The one that is selectable is displayed in the sub menu.
(Screen menu) (Sub menu)
DISP
Channel
selection
Cursor ON/OFF
DISP
: DISP/ENTER key,
*
or [CURSOR OFF].
DISP
To TREND
To BAR GRAPH
4
Switching Operation Screens
: Arrow keys
*
4. Pressing the DISP/ENTER key displays or clears the cursor.
To close the menu without displaying/clearing the cursor, press the ESC key.
Switching to the trend or bar graph screen of the channel selected with the cursor
1. Move the cursor to select the channel using the arrow key.
2. Pressing the DISP/ENTER key displays the screen menu.
3. Pressing the right arrow key displays the sub menu.
To close the sub menu, press the left arrow key.
4. Select [JUMP TO TREND] or [JUMP TO BAR] using up and down arrow keys.
5. Pressing the DISP/ENTER key displays the screen.
To close the menu without displaying the screen, press the ESC key.
4-11
Page 96

4.4 Using the Overview Screen
Explanation
Overview screen
Channel/Tag
Alarm type
Cursor
Unit
Measured/computed value
4-12
Page 97

4.5 Using the Information Screen (Alarm Summary,
Message Summary, and Memory Summary)
Operation Flow Diagram
(Screen rmenu) (INFORMATION)
DISP
MEMORY SUMMARY
When displaying
Report data
: Screen menu,
: Sub menu,
DISP
: DISP/ENTER key,
Procedure
Displaying the alarm summary, message summary, or memory summary
1. Pressing the DISP/ENTER displays the screen menu.
2. Select [INFORMATION] using the up and down arrow keys.
3. Pressing the right arrow key displays the sub menu.
To close the sub menu, press the left arrow key.
4. Select [ALARM SUMMARY], [MESSAGE SUMMARY], or [MEMORY
SUMMARY] using the up and down arrow keys.
DISP
Information
selection
DISP
(Screen menu)(Sub menu) (Sub menu)
DISP
To HISTORICAL
TREND
4
Switching Operation Screens
DISP
To Report data
: Arrow keys
5. Pressing the DISP/ENTER key displays the screen.
To close the menu without displaying the screen, press the ESC key.
Recalling the historical trend at the time the alarm occurred
This operation is carried out on the Alarm Summary screen.
1. Select the alarm of which to display the trend using the up and down arrow
keys.
Selected alarm
2. Pressing the DISP/ENTER displays the screen menu.
3. Pressing the right arrow key displays the sub menu.
To close the sub menu, press the left arrow key.
4. Select [JUMP TO HISTORY] using the up and down arrow keys.
4-13
Page 98

Selected message
4.5 Using the Information Screen (Alarm Summary, Message Summary, and Memory Summary)
5. Pressing the DISP/ENTER key displays the historical trend.
The displayed data are as follows:
• When configured to acquire only the display data to the internal memory
: Display data.
• When configured to acquire only the event data to the internal memory
: Event data.
• When configured to acquire the display data and the event data to the
internal memory
: Data selected in the memory summary.
To close the menu without switching the screen, press the ESC key.
Recalling the historical trend at the time the message was written
This operation is carried out on the Message Summary screen.
1. Select the message of which to display the trend using the up and down arrow
keys.
2. Pressing the DISP/ENTER displays the screen menu.
3. Pressing the right arrow key displays the sub menu.
To close the sub menu, press the left arrow key.
4. Select [JUMP TO HISTORY] using the up and down arrow keys.
5. Pressing the DISP/ENTER key displays the historical trend.
The displayed data are as follows:
• When configured to acquire only the display data to the internal memory
: Display data.
• When configured to acquire only the event data to the internal memory
: Event data.
• When configured to acquire the display data and the event data to the
internal memory
: Data selected in the memory summary.
To close the menu without switching the screen, press the ESC key.
Selecting the type of file (display data or event data) to display in the memory
summary
This operation is carried out on the Memory Summary screen.
1. Select display data or event data using the left and right arrow keys.
The selected file type is indicated by a green circle to the left of [DISPLAY
DATA] or [EVENT DATA]. Information about the selected file is displayed.
4-14
Page 99

4.5 Using the Information Screen (Alarm Summary, Message Summary, and Memory Summary)
Opening the display data file from memory summary (recalling the historical
trend).
This operation is carried out when displaying the information about the display data in
Memory Summary.
1. Select the file using the up and down arrow keys.
Selected file
2. Pressing the DISP/ENTER displays the screen menu.
3. Pressing the right arrow key displays the sub menu.
To close the sub menu, press the left arrow key.
4. Select [JUMP TO HISTORY] using the up and down arrow keys.
5. Pressing the DISP/ENTER key displays the historical trend.
To close the menu without switching the screen, press the ESC key.
Displaying the report data (option)
This operation is carried out on the Message Summary screen. For detail of the report
data, see section 11.11.
1. Pressing the DISP/ENTER displays the screen menu.
2. Pressing the right arrow key displays the sub menu.
To close the sub menu, press the left arrow key.
3. Select [REPORT DATA] using the up and down arrow keys.
4
Switching Operation Screens
4. Pressing the DISP/ENTER key displays the report data.
To close the menu without displaying the report data, press the ESC key.
Changing the report data to be displayed
“The index number of the report data currently displayed/the number of report data sets
in the internal memory” is displayed in the [Index] column of the report data display. The
most recent report data set is the one with the largest report data index number.
When the report data are being displayed, the arrow keys can be pressed to switch the
report being displayed. The operation when the four arrow keys are pressed are as follows :
Up arrow key : Displays next report data.
Down arrow key : Displays the previous report data.
Right arrow key : Displays the report data that is 10 data sets after the report data being
displayed. However, if there are less than 10 data sets, the most
recent report data (with the maximum report data number) are
displayed.
Left arrow key : Displays the report data that is 10 data sets before the report data
being displayed. However, if there are less than 10 data sets, the
oldest report data (report data number 1) are displayed.
4-15
Page 100

Cursor
Number of the message displayed at the bottom of the screen
Number of the messages in the internal memory
Message
Date and time the message was written
4.5 Using the Information Screen (Alarm Summary, Message Summary, and Memory Summary)
Explanation
Alarm summary
Number of the alarm information displayed at the bottom of the screen
Number of the alarm information in the internal memory
Tag/Channel
Alarm No. (1, 2, 3, 4)/Type (H, L, h, l, R, r, T, t)
Date & Time
(Alarm activated).
Cursor
Mark ⇒ “6.1. Releasing the Alarm Indication and Output Relay (Option)”
Date & Time
(Alarm released).
Message summary
The date and time when the message was entered and the user name (when using key
login function) are displayed.
Memory summary
Number of data sets in the internal memory/The maximum number of data
sets the internal memory can hold
Date and time the last data were acquired
Status of alarm output relays
Red: Activated
Green: Released
Selection of the file type to be
displayed, display data files or
event data files
Date and time the data
acquisition ended
Date and time the data acquisition started
4-16
File status
Number of data in the file
 Loading...