

Page 1
®
,ENGINEERING
INC.
RD-DXA200-02
DAQEXPLORER SOFTWARE
For RD-MV100
and RD-MV200
www.omega.com
e-mail: info@omega.com
User’s Guide
RD-DXA200-02
DAQEXPLORER SOFTWARE
For RD-MV100 and RD-MV200
Shop online at
®
Page 2

Servicing North America:
USA: One Omega Drive, P.O. Box 4047
ISO 9001 Certified Stamford CT 06907-0047
TEL: (203) 359-1660 FAX: (203) 359-7700
e-mail: info@omega.com
Canada: 976 Bergar
Laval (Quebec) H7L 5A1
TEL: (514) 856-6928 FAX: (514) 856-6886
e-mail: info@omega.ca
For immediate technical or application assistance:
USA and Canada: Sales Service: 1-800-826-6342 / 1-800-TC-OMEGA
®
Customer Service: 1-800-622-2378 / 1-800-622-BEST
®
Engineering Service: 1-800-872-9436 / 1-800-USA-WHEN
®
TELEX: 996404 EASYLINK: 62968934 CABLE: OMEGA
Mexico: En Espan˜ ol: (001) 203-359-7803 e-mail: espanol@omega.com
FAX: (001) 203-359-7807 info@omega.com.mx
Servicing Europe:
Benelux: Postbus 8034, 1180 LA Amstelveen, The Netherlands
TEL: +31 (0)20 3472121 FAX: +31 (0)20 6434643
Toll Free in Benelux: 0800 0993344
e-mail: nl@omega.com
Czech Republic: Rudé armády 1868, 733 01 Karviná 8
TEL: +420 (0)69 6311899 FAX: +420 (0)69 6311114
Toll Free: 0800-1-66342 e-mail: czech@omega.com
France: 9, rue Denis Papin, 78190 Trappes
TEL: +33 (0)130 621 400 FAX: +33 (0)130 699 120
Toll Free in France: 0800-4-06342
e-mail: france@omega.com
Germany/Austria: Daimlerstrasse 26, D-75392 Deckenpfronn, Germany
TEL: +49 (0)7056 9398-0 FAX: +49 (0)7056 9398-29
Toll Free in Germany: 0800 639 7678
e-mail: germany@omega.com
United Kingdom: One Omega Drive, River Bend Technology Centre
ISO 9002 Certified Northbank, Irlam, Manchester
M44 5EX United Kingdom
TEL: +44 (0)161 777 6611 FAX: +44 (0)161 777 6622
Toll Free in United Kingdom: 0800-488-488
e-mail: sales@omega.co.uk
OMEGAnet®Online Service Internet e-mail
www.omega.com info@omega.com
It is the policy of OMEGA to comply with all worldwide safety and EMC/EMI regulations that
apply. OMEGA is constantly pursuing certification of its products to the European New Approach
Directives. OMEGA will add the CE mark to every appropriate device upon certification.
The information contained in this document is believed to be correct, but OMEGA Engineering, Inc. accepts
no liability for any errors it contains, and reserves the right to alter specifications without notice.
WARNING: These products are not designed for use in, and should not be used for, patient-connected applications.
Page 3

Foreword
Thank you for purchasing the DAQEXPLORER.
This manual explains the operating procedures of the DAQEXPLORER on Windows 95/98/2000
and Windows NT4.0.
Keep this manual in a safe place for quick reference in the event a question arises.
For information about the handling precautions, functions, and operating procedures of the
RD-MV100/RD-MV200 and the handling and operating procedures of Windows, see the
respective manuals.
Contents of the Package
The package contains the following items:
• DAQEXPLORER (Model: RD-DXA200-02) Installation Disk: 2 floppy disks
• User’s Manual (M-3645, this manual): 1 piece
Notes
• The contents of this manual are subject to change without prior notice as a result of
continuing improvements to the instrument’s performance and functions.
• Every effort has been made in the preparation of this manual to ensure the accuracy of its
contents. However, should you have any questions or find any errors, please contact
Omega.
• Copying or reproducing all or any part of the contents of this manual without Omega’s
permission is strictly prohibited.
• Use of this software on more than one computer at the same time is prohibited. Use by more
than one user is also prohibited.
• Transfer or lending of this software to any third party is prohibited.
• Omega provides no guarantees other than for physical deficiencies found on the original
disk upon opening the product package.
• Omega will not be held responsible by any party for any losses or damage, direct or indirect,
caused by the use or any unpredictable defect of the product.
• Please keep the original disk in a safe place.
• The serial number will not be reissued.
Trademarks
• Windows is a trademark of Microsoft Corporation.
• Lotus1-2-3 is a registered trademark of Lotus Development Corporation.
• Other product names are trademarks or registered trademarks of their respective holders.
Revisions
First Edition: December 1999
Second Edition: July 2000
Disk No. RE22
2nd Edition: July 2000 (YK)
All Rights Reserved, Copyright © 1999 Omega
i
Page 4

How to Use this Manual
Structure of the Manual
This manual consists of the following 6 chapters and an index.
Chapter Title Description
1 Before Use Describes the PC requirements needed to run the
2 Using the DAQ Desktop Describes the DAQ desktop used to start various
3 Using the Data Monitor Describes the operations used when monitoring the
4 Displaying Data with the Data Viewer Describes the operations used when monitoring the
5 Describes the procedures used to configure the
RD-MV100/RD-MV200 RD-MV100/RD-MV200 such as measurement
6 Error Messages and Describes error messages and their countermeasures.
Their Corrective Actions
Index Gives an index.
DAQEXPLORER, the installation procedures, and
other information.
software programs.
It also describes the procedures to setup
communications between the RD-MV100/RD-MV200
and the PC.
data in real-time on the monitor connected to the RDMV100/RD-MV200 via network.
stored data on the hard disk or converting the stored
data to other formats such as ASCII.
conditions.
ii
Page 5

The Scope of This Manual
This manual does not explain the basic operations of Windows 95/98/2000 or Windows NT4.0.
For information related to the basic operation of Windows 95/98/2000 and Windows NT4.0, see
the manual that came with Windows.
Conventions Used in this Manual
Unit
K Denotes 1024. Example 100 KB
Notations of menus, commands, dialog boxes, and buttons
Enclosed with [ ].
Symbols
Note
Gives useful tips on the operation of the software.
iii
Page 6

Contents
Foreword ............................................................................................................................................................. i
How to Use this Manual.............................................................................................................................ii
The Scope of This Manual ....................................................................................................................... iii
Chapter 1 Before Use
1.1 DAQEXPLORER Overview ....................................................................................................... 1-1
1.2 System Requirements ............................................................................................................... 1-3
1.3 Installing the DAQEXPLORER .................................................................................................. 1-4
1.4 Configuring the Network ........................................................................................................... 1-5
Chapter 2 Using the DAQ Desktop
2.1 Starting and Exiting the DAQ Desktop ...................................................................................... 2-1
2.2 Starting and Stopping Data Acquisition on the RD-MV, Send a Trigger ................................... 2-5
2.3 Using the Snap Shot Function ..................................................................................................2-6
2.4 Confirming the RD-MV100/RD-MV200 Data ............................................................................ 2-7
2.5 Automatically Transferring Data in the RD-MV ......................................................................... 2-9
2.6 Viewing the Property and Version Information ........................................................................ 2-12
Chapter 3 Using the Data Monitor
3.1 Starting the Data Monitor .......................................................................................................... 3-1
3.2 Displaying the Trend .................................................................................................................. 3-3
3.3 Displaying the Color Graph ..................................................................................................... 3-14
3.4 Displaying Numeric Values ...................................................................................................... 3-16
3.5 Displaying the Meter ............................................................................................................... 3-17
3.6 Displaying Alarms ................................................................................................................... 3-19
3.7 Circular Display ....................................................................................................................... 3-22
3.8 Connecting Communications between the Data Monitor and the DAQ Desktop .................... 3-24
3.9 Pausing the Monitor and Turning ON/OFF the Link ................................................................ 3-26
3.10 Stopping Communications between the Data Monitor and DAQ Desktop and Exiting the Data
Monitor .................................................................................................................................... 3-27
Chapter 4 Displaying Data with the Data Viewer
4.1 Starting and Exiting the Data Viewer ........................................................................................ 4-1
4.2 Displaying the Waveform ........................................................................................................... 4-4
General Display Settings ............................................................................................................................. 4-5
Setting the Time Axis ................................................................................................................................... 4-6
Setting the Y-axis ......................................................................................................................................... 4-6
Turn ON/OFF the Alarm Display .................................................................................................................. 4-6
Selecting the Characters Used to Identify Channels ................................................................................... 4-7
Showing/Hiding Cursors .............................................................................................................................. 4-7
Displaying Cursor’s Values........................................................................................................................... 4-8
Displaying Statistics ..................................................................................................................................... 4-8
Adding Arbitrary Marks ................................................................................................................................ 4-8
Searching the Alarm Transition Point and Mark Position ............................................................................. 4-9
4.3 Circular Display ....................................................................................................................... 4-11
iv
Page 7

Contents
4.4 Displaying Numeric Values ..................................................................................................... 4-13
General Display Settings of the Numeric Display ...................................................................................... 4-13
Setting the Time Axis ................................................................................................................................. 4-13
Turn ON/OFF the Alarm Display ................................................................................................................ 4-13
Selecting the Characters Used to Identify Channels ................................................................................. 4-14
Showing/Hiding Cursors ............................................................................................................................ 4-14
Adding Arbitrary Marks, Deleting Marks, and Resetting Marks ................................................................ 4-14
4.5 Linking Files and Saving the Link Settings File ....................................................................... 4-15
4.6 Listing Alarms and Marks and Converting the List ................................................................. 4-17
4.7 Displaying the TLOG File ........................................................................................................ 4-19
4.8 Saving the Display Settings ....................................................................................................4-21
4.9 Converting the Data ................................................................................................................ 4-22
4.10 Printing .................................................................................................................................... 4-25
Chapter 5 Configuring the RD-MV100/RD-MV200
5.1 Starting the Configurator ........................................................................................................... 5-1
Starting the Configurator ............................................................................................................................. 5-2
Creating Setup Data by Configuring a New System .................................................................................... 5-3
Loading Preexisting Setup Data .................................................................................................................. 5-3
5.2 Setting the Measurement Channels .......................................................................................... 5-4
Input Type (Mode and Range/Type) ............................................................................................................. 5-5
Difference Computation and Reference ....................................................................................................... 5-5
Display Span ................................................................................................................................................ 5-5
Scale ............................................................................................................................................................ 5-5
Square Root ................................................................................................................................................. 5-5
Alarm ........................................................................................................................................................... 5-6
Input Filter and Moving Average .................................................................................................................. 5-6
Tag ............................................................................................................................................................... 5-6
Display Zone ................................................................................................................................................ 5-6
Graph ........................................................................................................................................................... 5-7
Partial Expanded Display ............................................................................................................................. 5-7
Display Color ................................................................................................................................................ 5-7
Copying and Pasting Setup Data ................................................................................................................. 5-7
Setting One Channel at a Time.................................................................................................................... 5-8
5.3 Setting the Computation Channels ........................................................................................... 5-9
Display Span .............................................................................................................................................. 5-10
Alarm and Tag ............................................................................................................................................ 5-10
TLOG Computation .................................................................................................................................... 5-10
Rolling Average .......................................................................................................................................... 5-10
Display Zone, Graph, Partial Expansion, and Color .................................................................................. 5-10
Constant .................................................................................................................................................... 5-10
Setting One Computation Channel at a Time ............................................................................................ 5-11
Copying and Pasting Setup Data ............................................................................................................... 5-11
5.4 Configuring the Settings .......................................................................................................... 5-12
Screen Display ........................................................................................................................................... 5-12
Message/File ............................................................................................................................................. 5-13
Group/Trip Line .......................................................................................................................................... 5-14
Setting the View Group (RD-MV200 Only) ................................................................................................. 5-15
USER Key (RD-MV200 Only), Daylight Saving, Batch (Option, When the Style Number is Greater than or
Equal to 2) .................................................................................................................................................. 5-15
1
2
3
4
5
6
Index
v
Page 8

Contents
5.5 Configuring the Setup Mode ................................................................................................... 5-16
Alarm/Relay/Remote .................................................................................................................................. 5-16
Scan Interval/Memory ............................................................................................................................... 5-17
Channel (Setting the Burnout and RJC) .................................................................................................... 5-18
Key Lock/Login .......................................................................................................................................... 5-19
Timer (Option) ............................................................................................................................................ 5-20
Report (Creating Hourly/Daily/Weekly/Monthly Reports) .......................................................................... 5-21
Setting the Temperature, Tag, Memory Alarm Time, Displayed Language, and Partial Expanded Display5-22
Network ..................................................................................................................................................... 5-23
5.6 Adjusting the Setup Data (Checking the Data) ....................................................................... 5-25
5.7 Sending the Setup Data to the RD-MV ...................................................................................5-26
5.8 Checking the System Configuration and Initializing Setup Data ............................................ 5-27
5.9 Saving the Setup Data ............................................................................................................ 5-28
5.10 Printing the Setup Data ........................................................................................................... 5-29
5.11 Characters that can be Used .................................................................................................. 5-30
Chapter 6 Error Messages and Their Corrective Actions
6.1 Error Messages and Their Corrective Actions ........................................................................... 6-1
Index
Index .............................................................................................................................................. Index-1
vi
Page 9
Chapter 1 Before Use
1.1 DAQEXPLORER Overview
The DAQEXPLORER consists of the following four software programs:
• DAQ Desktop
• Data Monitor
• Data Viewer
• Configurator
DAQ Desktop
• Data Monitor
• Data Viewer
• Configurator
Setup data
1
Before Use
Ethernet
Display data file
Event data file
TLOG file
Setup data file
DAQ Desktop
The DAQ Desktop can be used to perform the following operations:
• Mount the RD-MV100/RD-MV200 on the network (make it accessible from the
DAQEXPLORER).
• Start the Data Monitor, Data Viewer, and Configurator programs.
• Check the files residing in the internal memory or external storage medium of the RD-
MV100/RD-MV200.
• Snap shot display of the RD-MV100/RD-MV200 display screen.
• Automatic transfer of the RD-MV100/RD-MV200 data.
• Copy RD-MV100/RD-MV200 data to the DAQ Desktop.
• Send triggers to the RD-MV100/RD-MV200.
RD-MV100/RD-MV200
Note
The DAQ Desktop and Data Viewer are automatically registered under [Programs] of the [Start] menu of
Windows 95/98/2000 or Windows NT4.0 when the DAQEXPLORER is installed.
1-1
Page 10

1.1 DAQEXPLORER Overview
Data Monitor
Monitor the RD-MV100/RD-MV200 data using a PC connected to the network by viewing the
trend waveform, for example. The following types of monitor screens are available:
• Alarm Monitor : Lists the alarm conditions of each group or alarms that occurred in the
• Trend Monitor : Displays the waveforms of the measured and computed data. This is
• Color Graph Monitor : Displays the measured and computed data using colors that
• Numerical Monitor : Displays the measured and computed data using numerical (digital)
• Meter Monitor : Displays the measured and computed data using analog meters. You
• Circular Monitor : Displays the measured and computed data in a circular fashion.
Data Viewer
The following three types of data files generated by RD-MV100/RD-MV200 can be displayed as
trends, digital values or in a circular fashion on the screen or printed.
• Display data file (.dds)
• Event data file (.dev)
• TLOG file (.dtg)
You can also use cursors to read the values of the displayed data, perform computation over a
specified region, and convert data to a file in ASCII format or a format that can be opened using
Excel/Lotus.
If you wish to open multiple Data Viewers, select [Program] - [DAQEXPLORER] - [Viewer] from
the Start menu.
past. It can be used to monitor alarms.
useful when you wish to observe the data trend.
correspond to specific values. This is useful when you wish to observe
the overall tendency of the measured and computed data.
values. This is useful when you wish to read the exact values.
can select bar graph, meter, or thermometer. This provides a useful
way to display the current conditions graphically.
1-2
Configurator
The Configurator is used to configure RD-MV100/RD-MV200 setup data such as the
configuration of the measurement channels and computation channels, the screen display
format, etc. Configuration data can also be stored to or retrieved from the hard disk on the
connected PC. There are three methods for setting the RD-MV100/RD-MV200:
• Retrieving the current setup data from the connected RD-MV and subsequently modifying
the settings.
• Loading saved setup data from the PC and changing the settings.
• Configuring a new system and settings.
Page 11

1.2 System Requirements
Hardware
PC
PC capable of running Windows 95/98/2000 or Windows NT 4.0 with at least a Pentium 166
MHz MMX processor (Pentium II 266 MHz or better recommended).
RAM
64 MB or more (The recommended amount of RAM depends on various parameters such as
the performance of the graphics card. In general, 128 MB of RAM will provide smooth
operation.) However, the necessary amount of RAM may increase, if you are running other
programs simultaneously.
Hard Disk
Free space of at least 100 MB.
Floppy Disk Drive
1.44 MB floppy disk drive (one drive)
Mouse
Mouse supported by Windows 95/98/2000 or Windows NT4.0.
Monitor
A monitor supported by Windows 95/98/2000 or Windows NT4.0. At least 800 x 600 resolution
with at least 32 K of colors. 1024 x 768 resolution with 65536 colors recommended.
1
Before Use
Communication Card
An Ethernet card supported by Windows. The TCP/IP protocol must also be installed.
Printer
Printer supported by Windows. You will also need an appropriate printer driver.
Operating System
Windows 95/98/2000 or Windows NT4.0.
Note
• When using Windows 95, make sure that the version of Internet Explorer is 3.02 or later.
• When using Window NT4.0, install [Service Pack5] or a later version of the service pack.
• When numerous RD-MV100/RD-MV200s are mounted onto the DAQ Desktop on Windows 95/98 and
• If daylight savings exists in the specified time zone, check “Automatically adjust clock for daylight
• Do not specify time zone settings in the Windows autoexec.bat file. If you see a line such as
• This program cannot handle data after year 2038.
many windows are opened, a message “A required resource was unavailable.” may appear and the
operation may become unstable.
savings changes.”
“TZ=GTM0” in the autoexec.bat file, deactivate it by attaching a REM command in front.
1-3
Page 12

1.3 Installing the DAQEXPLORER
A serial number is required in setting up the program. Check the serial number that is indicated
on the label of the first setup disk, DISK#1, beforehand.
1. Start Windows.
2. Insert the first floppy disk into the floppy disk drive.
3. Double-click [3
4. Double-click “setup.exe” to start the installation. Then, follow the instructions on the screen.
Note
• Terminate memory resident programs such as virus protection programs before installation.
• The DAQ Desktop and Data Viewer programs are registered in the Start menu immediately after
installation.
• When reinstalling the software, do an uninstall first.
• To uninstall the program, follow the procedures below:
1. Double-click “Add/Remove Programs” in the Windows Control Panel and uninstall the program.
2. As necessary, back up the following files to a different directory:
All files in the [Config] and [Desktops] directories that are located in the directory where this program
was installed.
3. Using Explorer, delete the Files and subdirectories that were created after the installation of the
program. Also, delete the directory to which the program was installed.
1/2 Floppy] in [My Computer] to open the floppy disk window.
1-4
Page 13
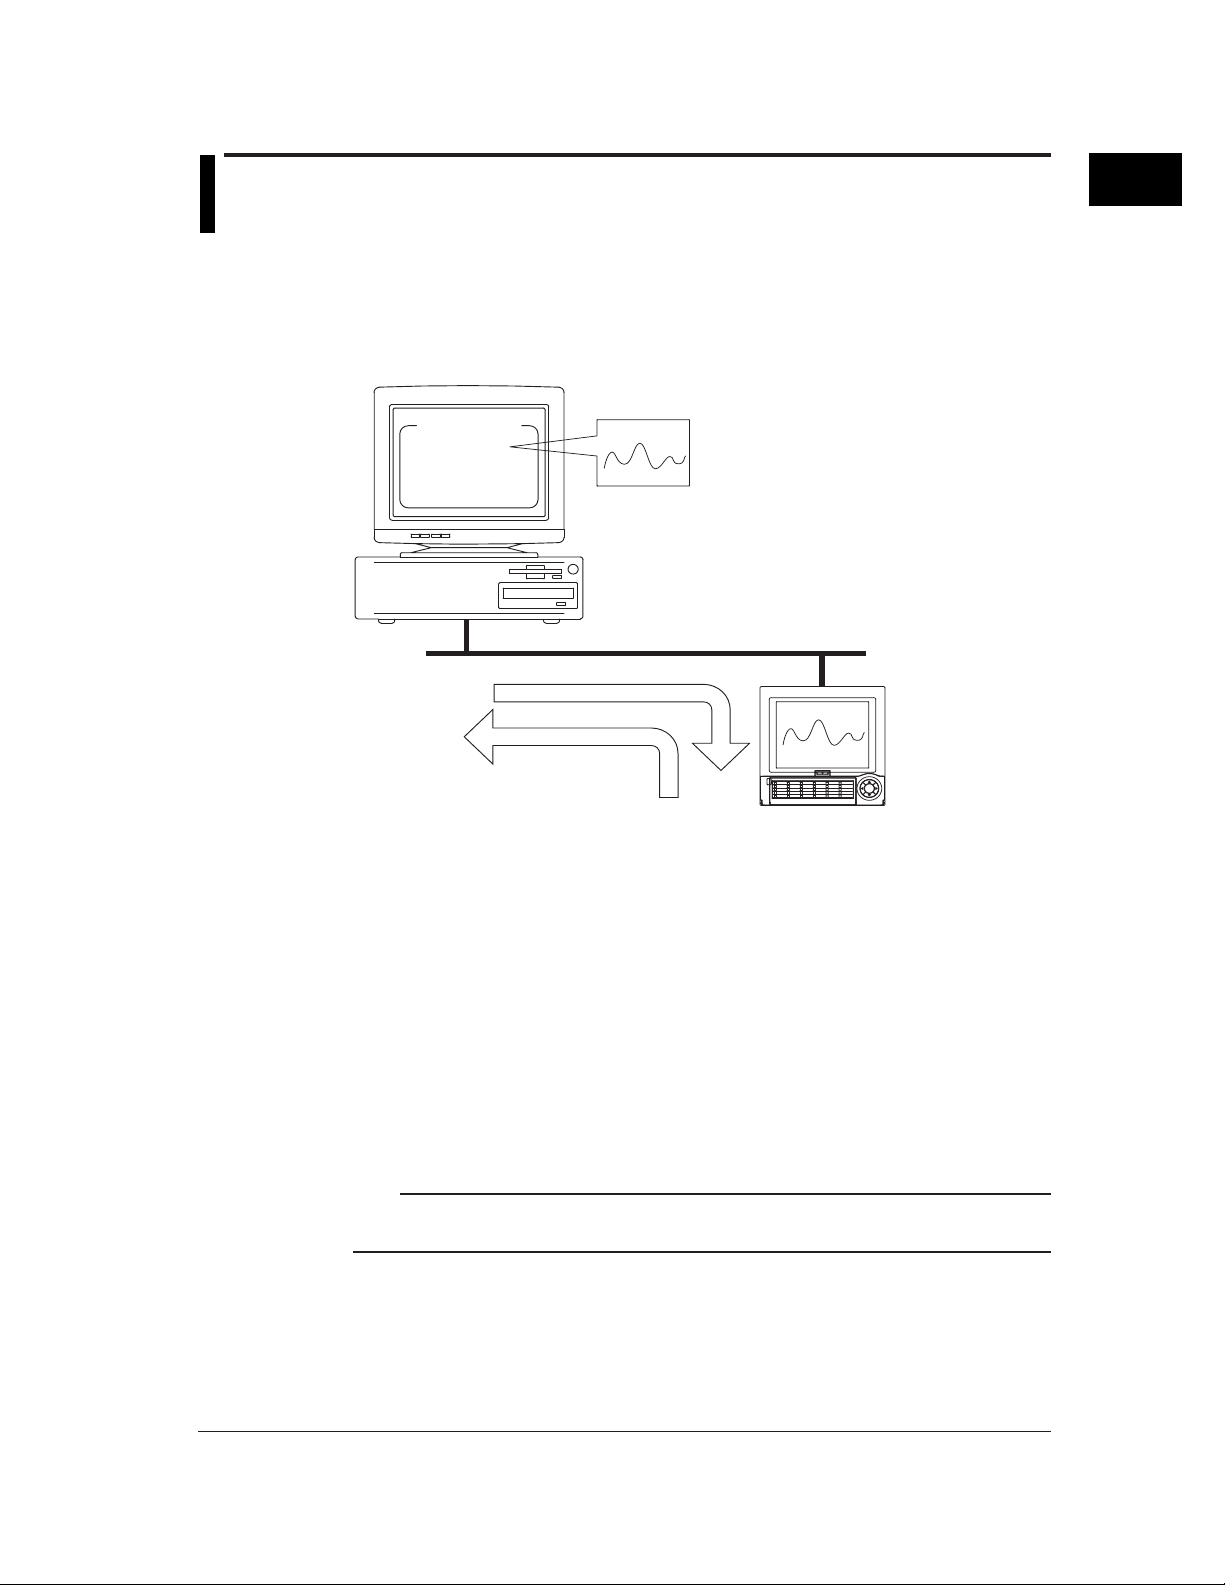
1.4 Configuring the Network
The network must be configured so that the RD-MV and the PC can communicate properly
using DAQEXPLORER.
Set the network configuration on the RD-MV side.
For the configuration procedure, see the respective communication interface user’s manual.
1. Press the MENU key to display the setting mode menu.
2. Press the FUNC key for approximately three seconds to display the basic setting mode
menu.
For the RD-MV100
3. Press the [#10 (Communications)] soft key, then the [#1 (Ethernet, IP address)] soft key.
Then, press the [#2 (Ethernet, DNS)] soft key.
For the RD-MV200
3. Press the [#6 (Communications)] soft key, then the [#1 (Ethernet)] soft key to display the
following communication function menu:
4. Enter these three parameters.
1
Before Use
5. Enter a name.
* Host name The name that is specified here is used as an identification name for the RD-MV100/RD-
MV200 that can be mounted from within the network folder. If a name is not specified, the
IP address will be used as the identification name.
Note
• In using this software, the DNS, domain name, and suffix search order do not need to be configured.
• You can check and save the configuration using the TCP/IP menu of the Configurator.
• If you change the IP address, make sure to reboot the RD-MV.
1-5
Page 14
Chapter 2 Using the DAQ Desktop
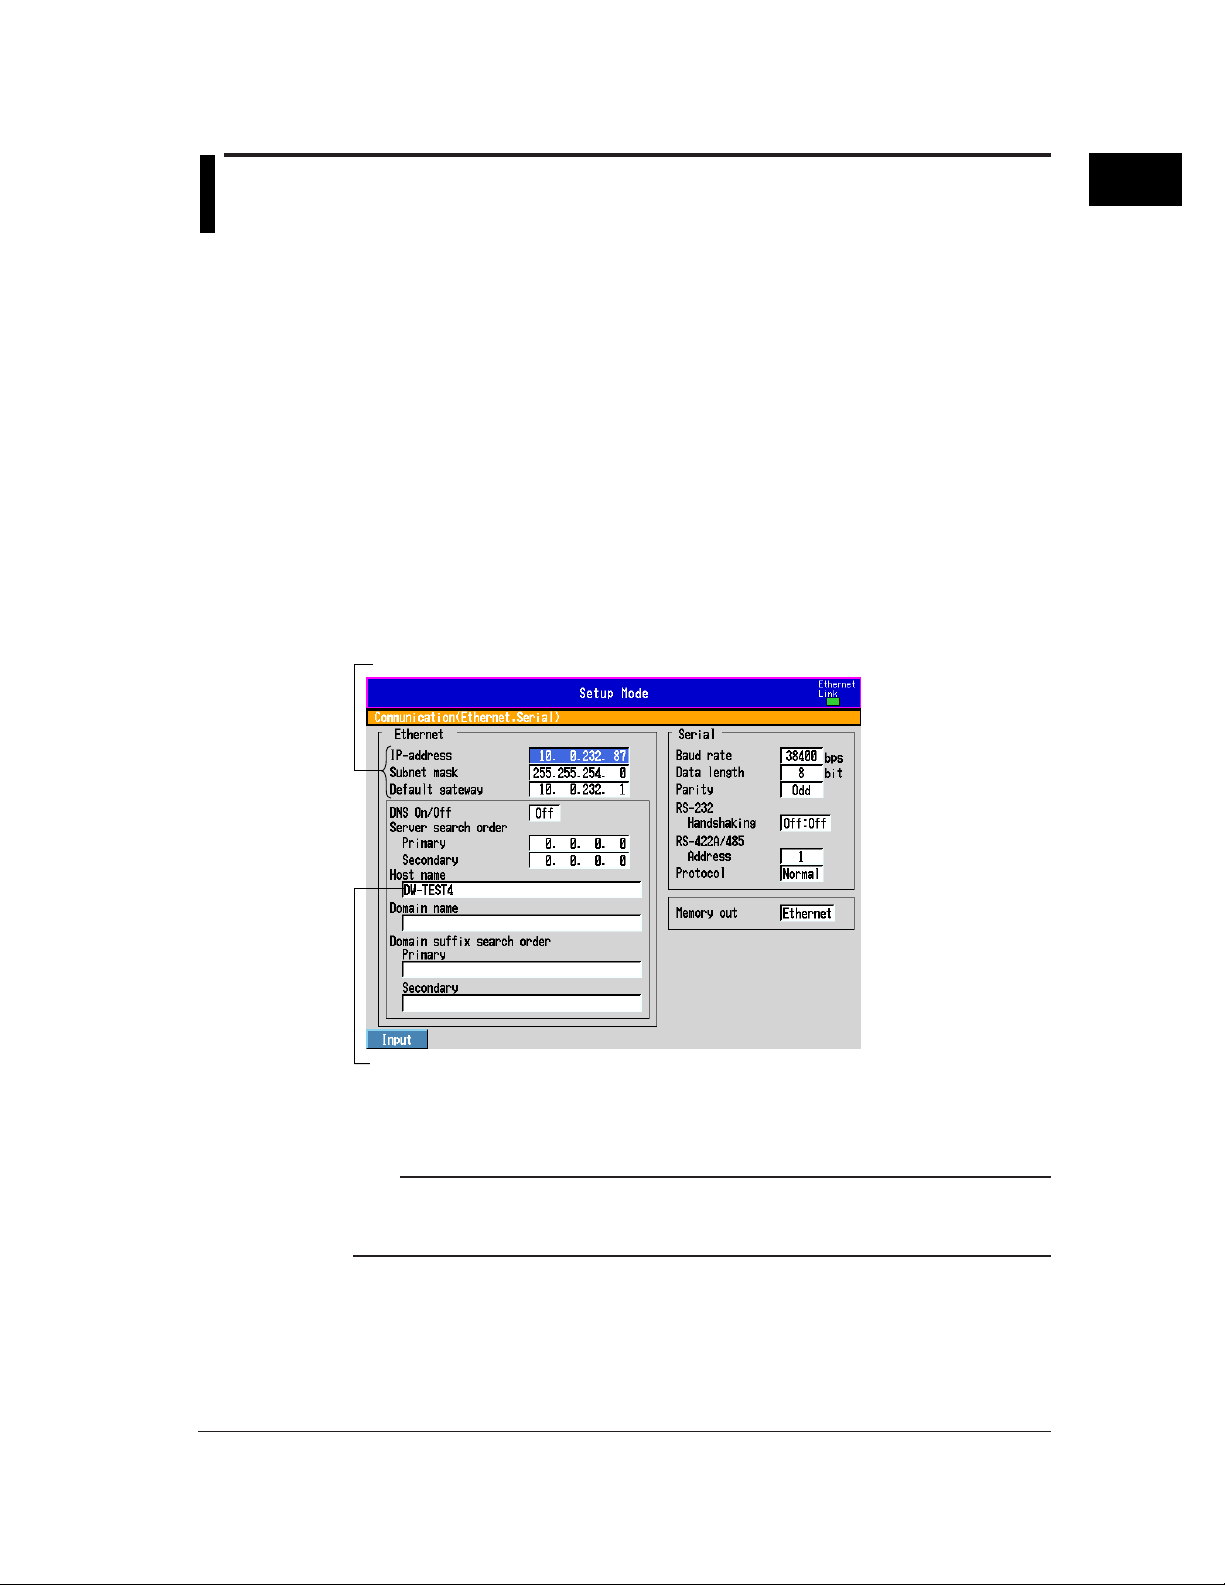
2.1 Starting and Exiting the DAQ Desktop
Starting the DAQ Desktop
4. The DAQ Desktop opens.
1. From the Start menu, select
[Programs] - [DAQEXPLORER] [Desktop].
2. The password confirmation dialog box opens.
3. Enter the user name and
password.
2
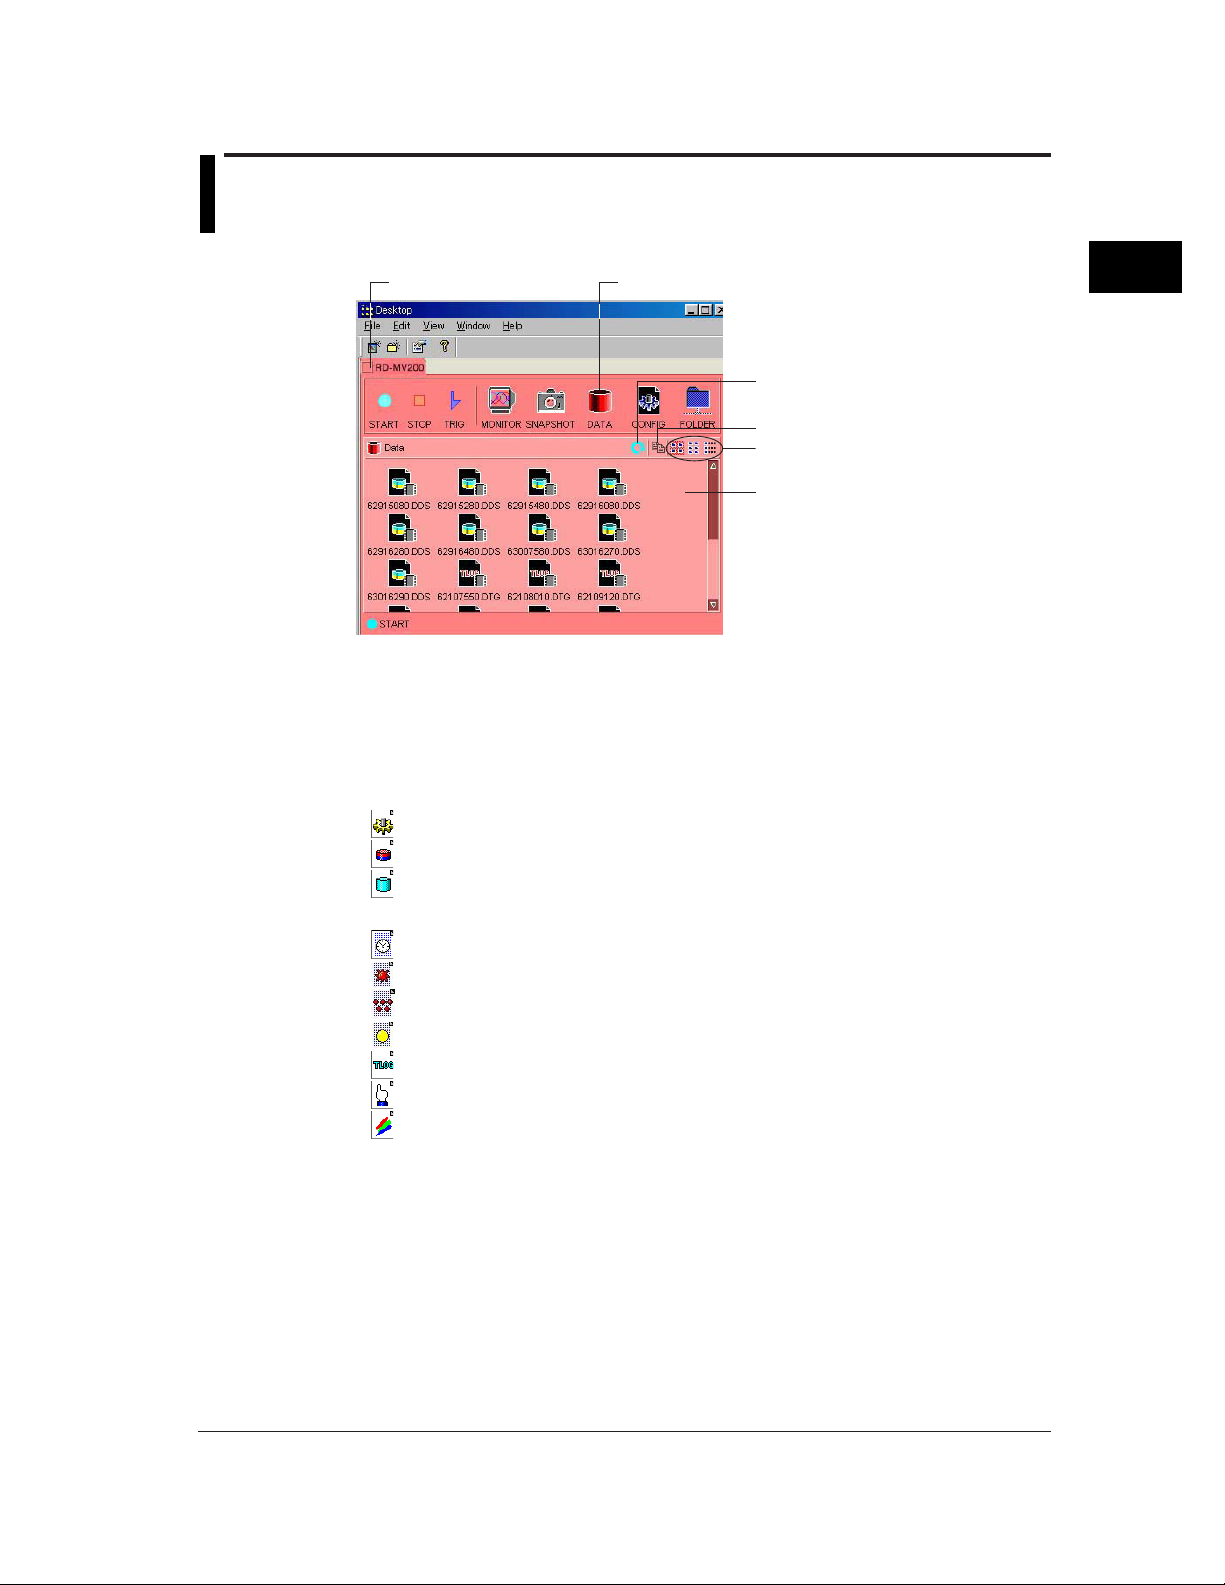
Using the DAQ Desktop
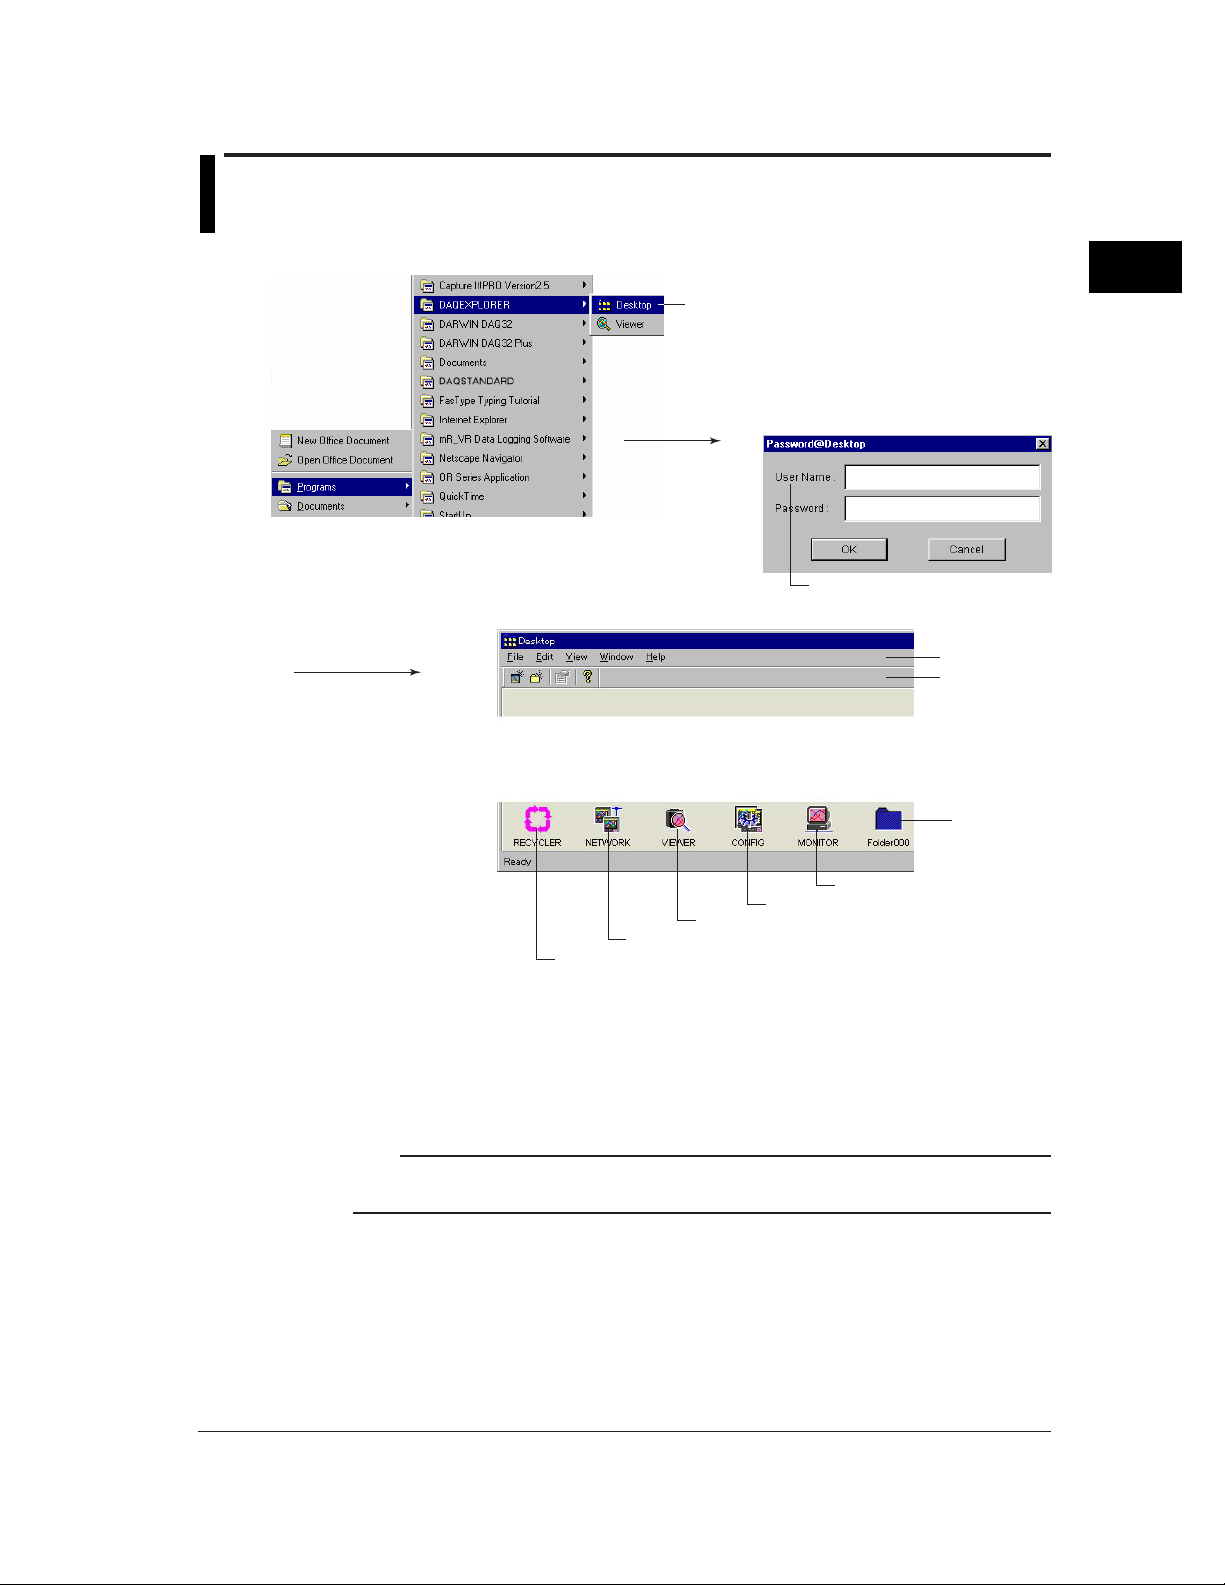
Menu bar
Toolbar
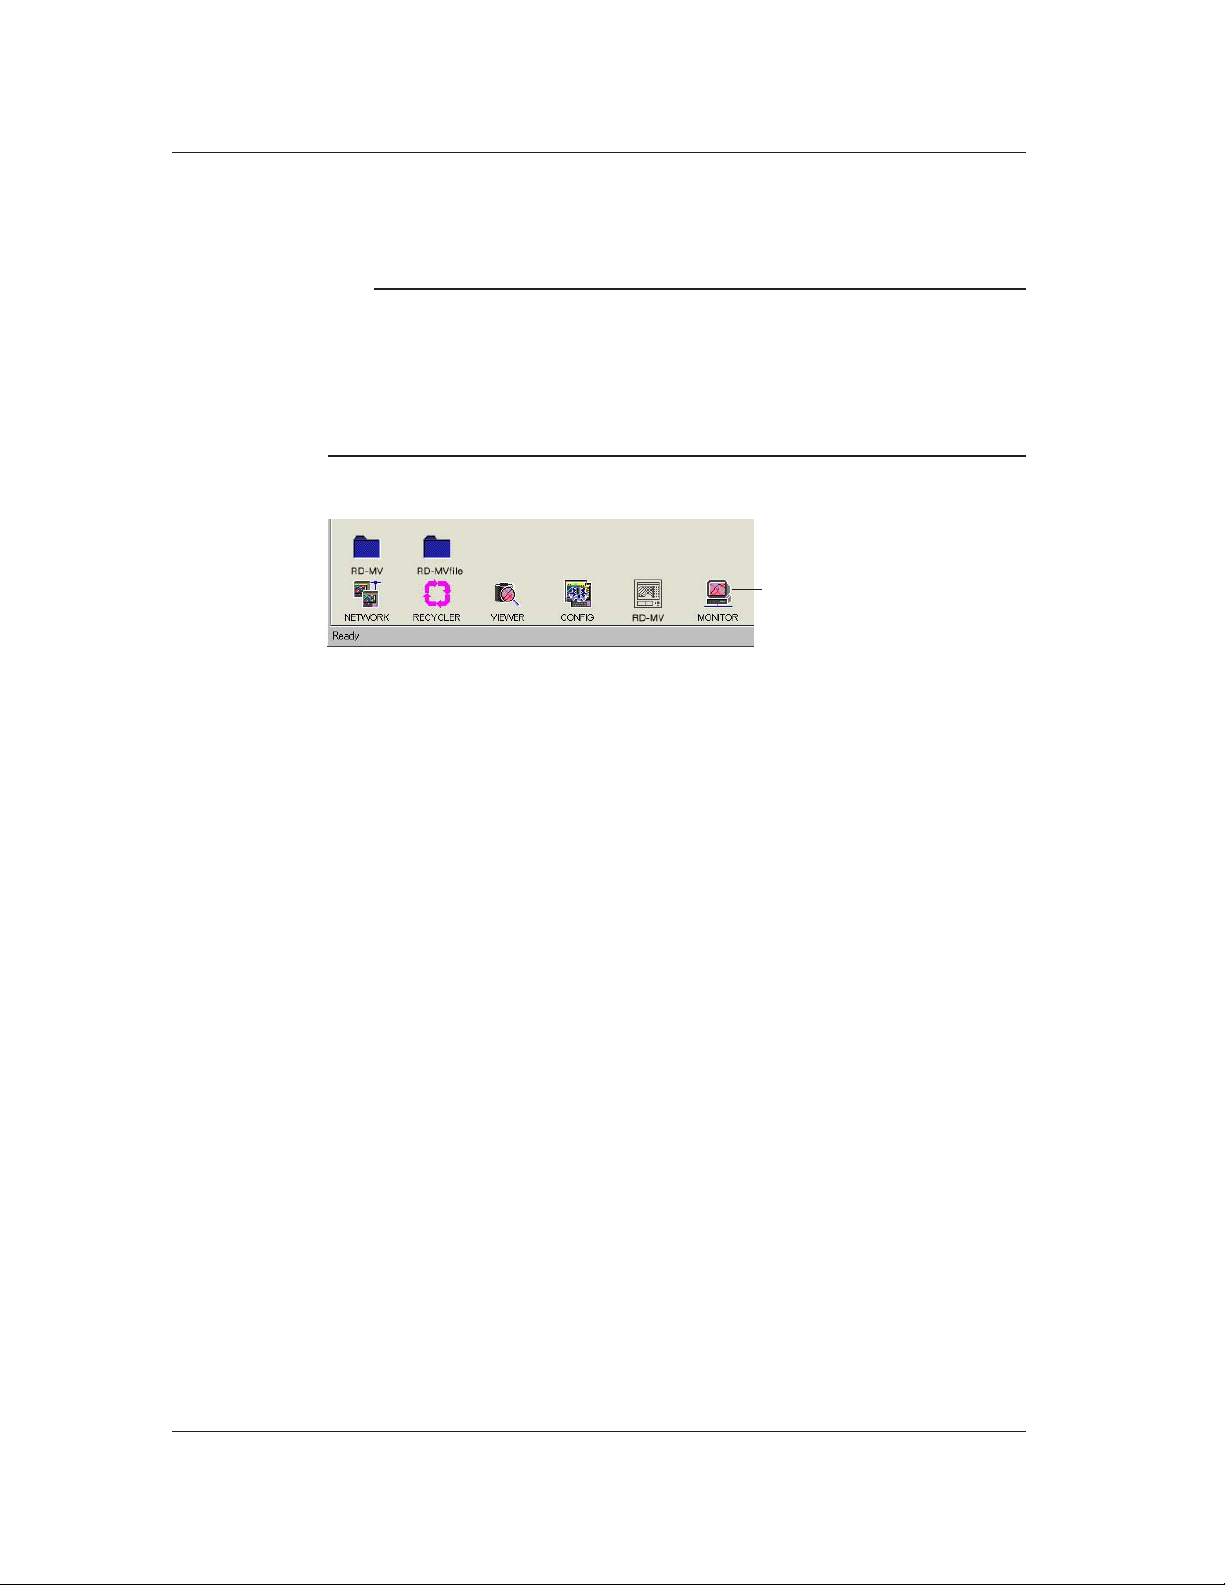
Folder icon
CONFIG icon
MONITOR icon
VIEWER icon
Network icon
Recycle icon
Password confirmation
If the Ethernet login on the RD-MV100/RD-MV200 is set to [On] at the [admin] level, enter the
user name and password of the administrator that was registered on the RD-MV.
If the Ethernet login is set to [Not] (not used), you do not have to enter the user name or
password. Clicking the [OK] or the [Cancel] button starts the DAQ Desktop.
Note
If there are multiple RD-MV100/RD-MV200s that have the Ethernet login configured, only the RD-
MV100/RD-MV200 with the matching user name and password specified in step 3 will be mountable.
2-1
Page 15

2.1 Starting and Exiting the DAQ Desktop
DAQ Desktop Functions
The DAQ Desktop has the following functions:
Menu bar
• File
• New Mount: Mounts the RD-MV100/RD-MV200 with the specified host name or IP
address onto the DAQ Desktop.
• New Folder: Creates a new folder. You can also make the folder the data transfer
destination.
• Property: Displays the properties of the RD-MV100/RD-MV200.
• Set Time: Sets the date and time of all mounted , RD-MV100s, and RD-MV200s at
once.
• Port No.: You can check or change the port number.
• Exit : Exits the DAQ Desktop and returns to the Windows screen.
• Edit: Copies and Pastes selected files.
• View: Refreshes information, selects the display format of the list, and shows or
hides the toolbar and status bar.
• Window: Closes all windows.
• Help : Displays the version information of the DAQ Desktop.
Toolbar
(New Mount): This icon is equivalent to selecting [File] - [New Mount] from the
•
(New Folder): This icon is equivalent to selecting [File] - [New Folder] from the
•
(Property): This icon is equivalent to selecting [File] - [Property] from the menu bar.
•
(Version Information): This icon is equivalent to selecting [Help] - [About] from the menu bar.
•
menu bar.
menu bar.
2-2
Network icon
• Lists the RD-MV100/RD-MV200s that are on the same segment of the network.
• Mounts the RD-MV100/RD-MV200 that is on the network onto the DAQ Desktop.
Recycle icon
Deletes files and folders and dismounts the RD-MV100/RD-MV200.
VIEWER icon Starts the Data Viewer program.
MONITOR icon Starts the Data Monitor program.
CONFIG icon Starts the Configurator program.
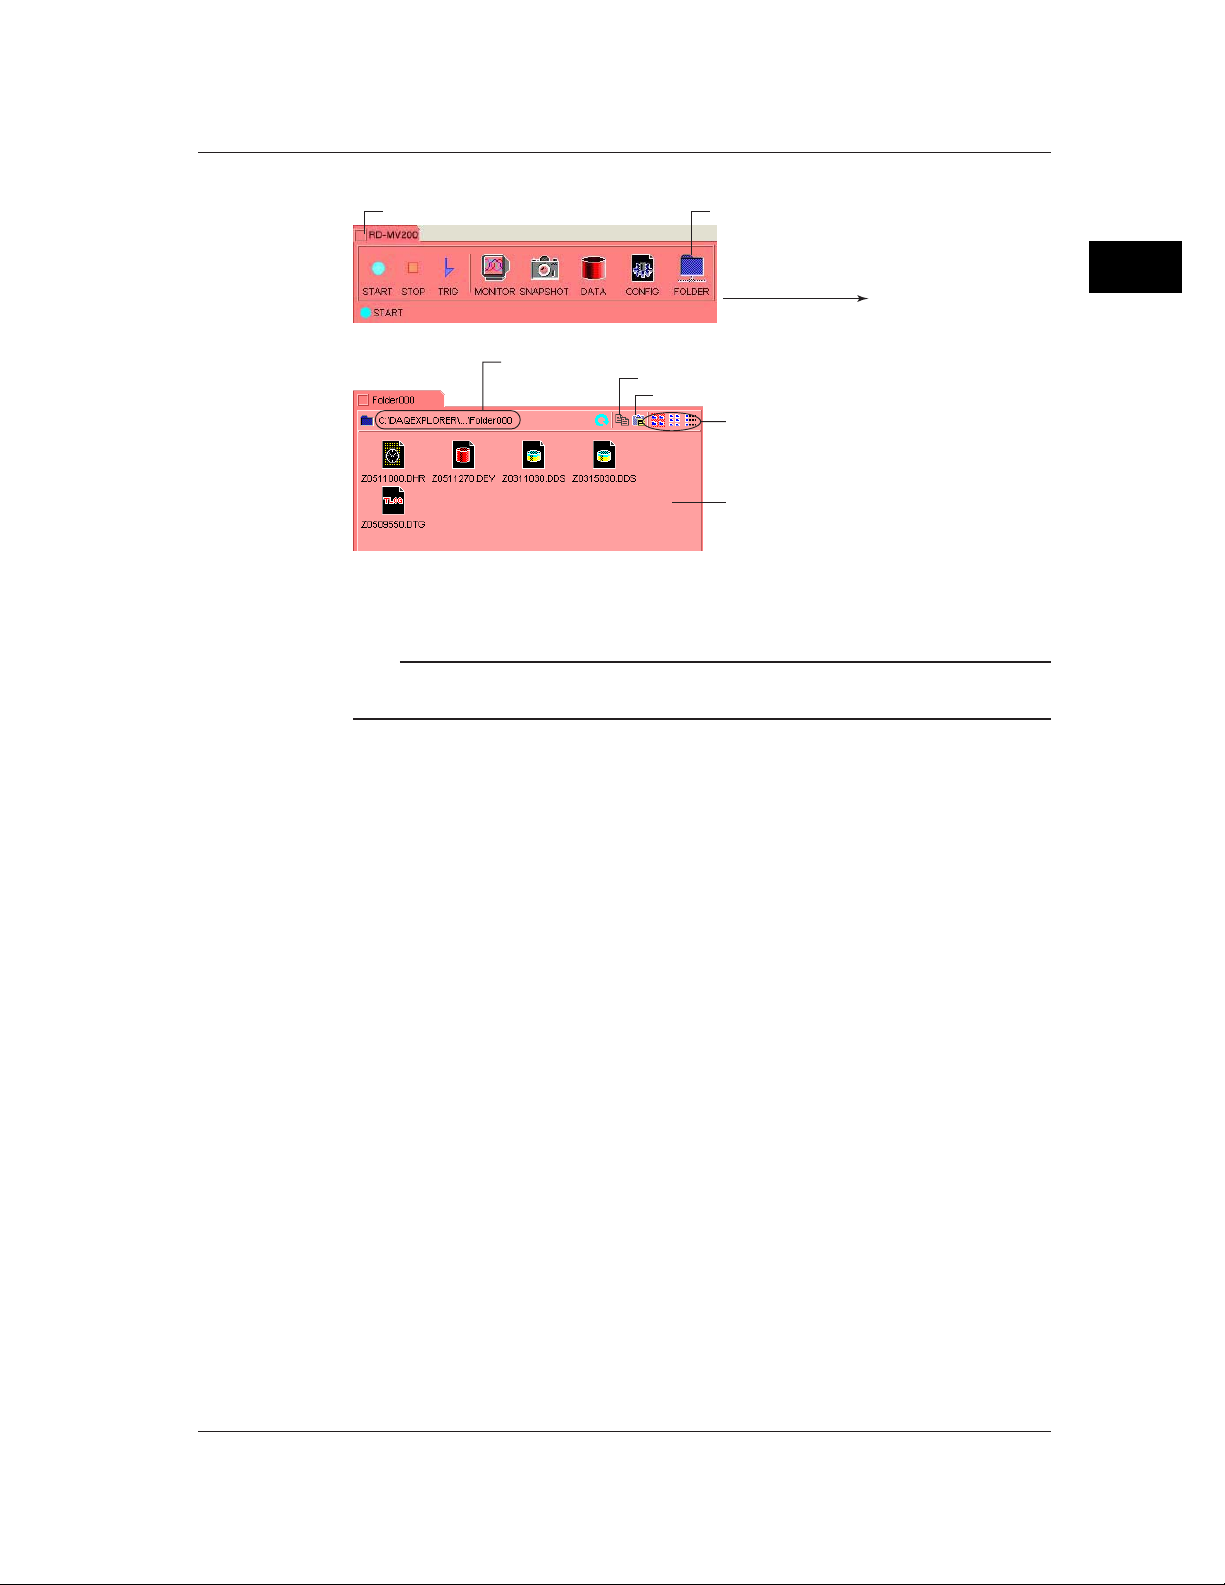
RD-MV icon
The following operations can be performed:
• Start/Stop the data acquisition to the internal memory of the RD-MV100/RD-MV200.
• Start the Data Monitor, Data Viewer,Configurator programs.
• Snap shot.
• View the files residing in the internal memory or the external storage medium of the RD-
MV100/RD-MV200.
• View and change the RD-MV100/RD-MV200 configuration.
• Create automatic transfer destination for the RD-MV100/RD-MV200 data and list the transfer
data.
Folder icon
This is the automatic transfer destination for the RD-MV100/RD-MV200 data. For the
procedures to create folder icons, see section 2.5.
Note
• Files and folders that are dragged and dropped onto the recycler icon are temporarily placed in the
following folder:DAQEXPLORER\desktops\DAQStation\recycler.
• When the DAQEXPLORER is restarted, all the data in the recycler folder are deleted.
Page 16
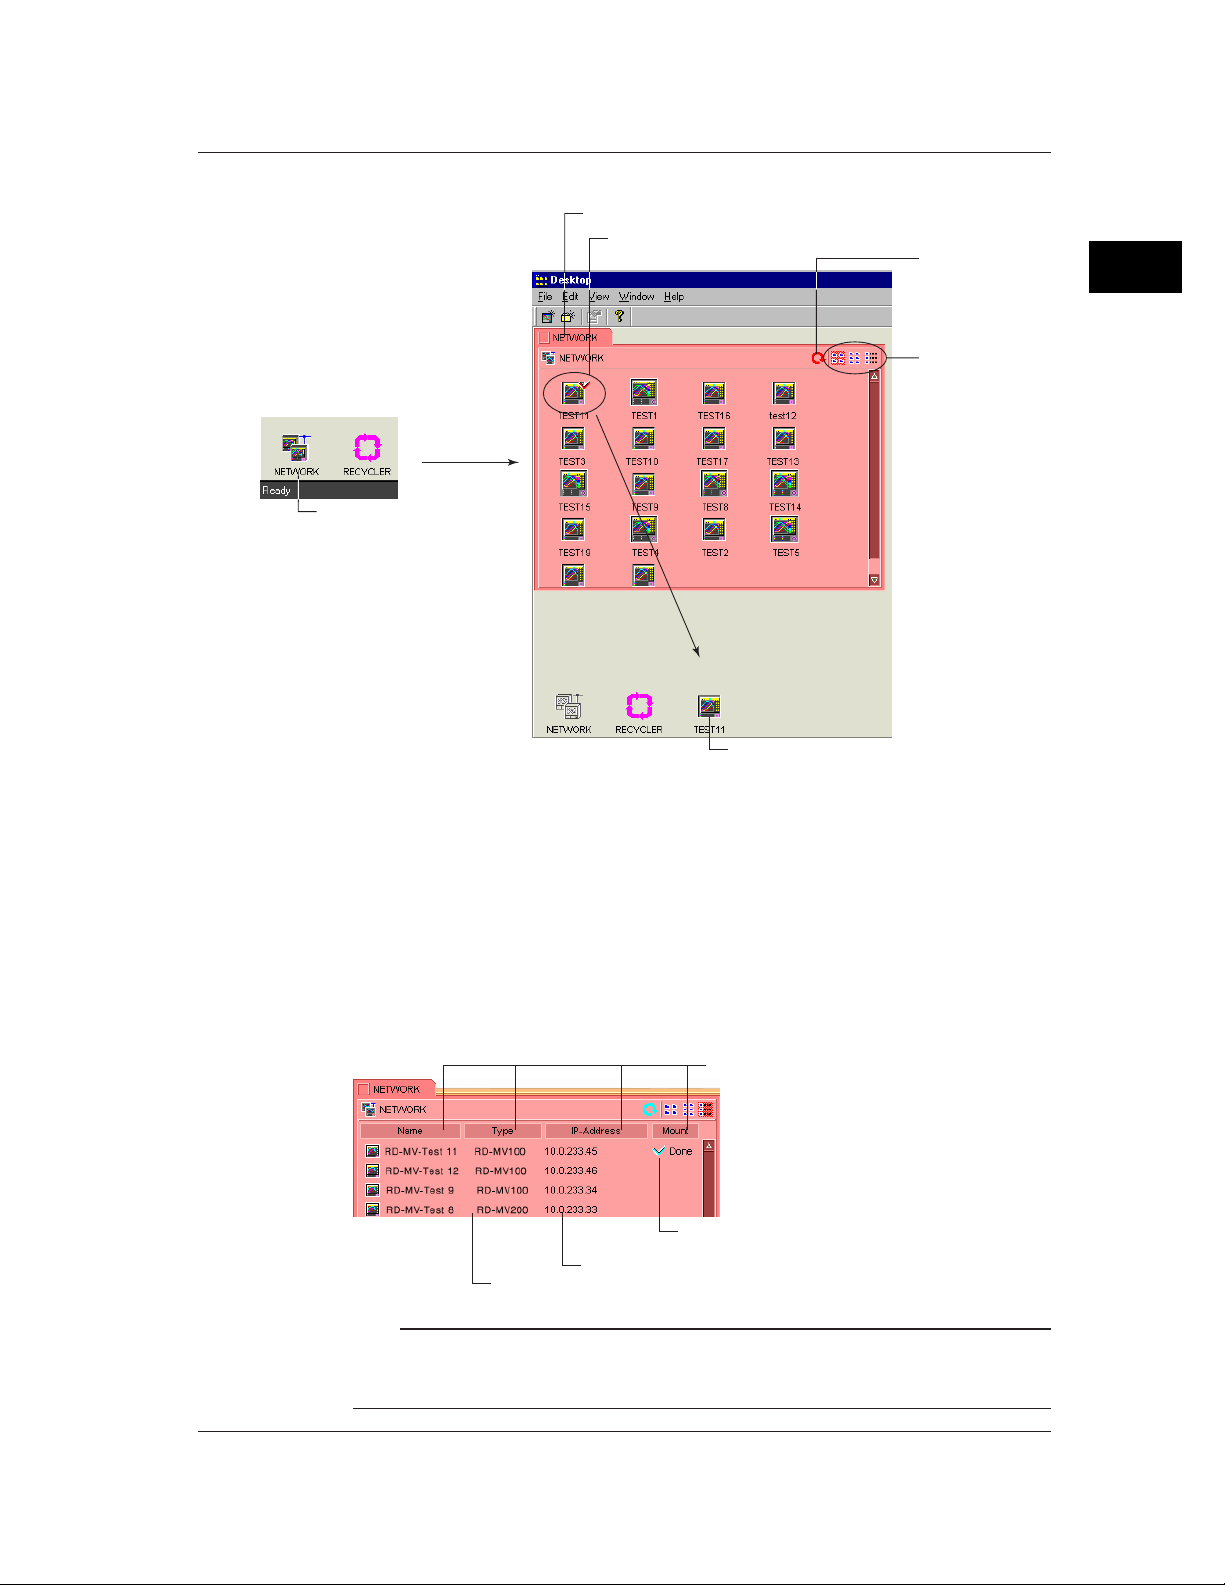
Mounting the RD-MV100/RD-MV200
2. The network
folder opens.
1. Double-click here.
2.1 Starting and Exiting the DAQ Desktop
Network folder
Check mark appears when the RD-MV is mounted
onto the DAQ Desktop.
3. Drag and drop onto the desktop.
Reload
Select the display
format of the list
2
Using the DAQ Desktop
RD-MV that has been mounted
Network folder
The network folder will list the mountable RD-MV100/RD-MV200s that are within the same
segment.
The RD-MV100/RD-MV200 icons that have already been mounted onto the DAQ Desktop will
display red check marks.
In addition, the list of RD-MV100/RD-MV200 icons will show the host names that were
specified in section 1.4.
Methods used to display the list
You can select Icons, List, or Details.
• Display example when details is selected
Sort using the item that was clicked
Check marks are attached to RD-MV100/
Displays the model
Displays the IP address
MV200s that are mounted on the DAQ Desktop
Note
Depending on the network conditions, the RD-MV100/RD-MV200, even when it is in the same segment,
may not be listed. In this case, mount the RD-MV100/RD-MV200 by specifying the IP address or host
name. For details related to mounting, see the next page.
2-3
Page 17
2.1 Starting and Exiting the DAQ Desktop
Mounting by Specifying the IP Address or Host Name
2.The [New Mount]
dialog box opens.
1. Click here.
Or, select [File] - [New Mount].
New Mount
Mount the RD-MV100/RD-MV200 by specifying the IP address or host name.
This method is used to mount a RD-MV100/RD-MV200 residing in another network.
Clicking the [OK] button displays the icon of the RD-MV100/RD-MV200 that has been mounted
on the DAQ Desktop.
Note
• The maximum number of RD-MV100/RD-MV200s that can be mounted is 16.
• The icon of the RD-MV100/RD-MV200 that could not be connected is indicated with a red “×” mark.
• Connecting is not possible in the following cases:
• The RD-MV is not turned ON.
• The RD-MV with the specified IP address or host name does not exist.
• The user name and password (see page 2-1) do not match.
• Another user is using the particular RD-MV.
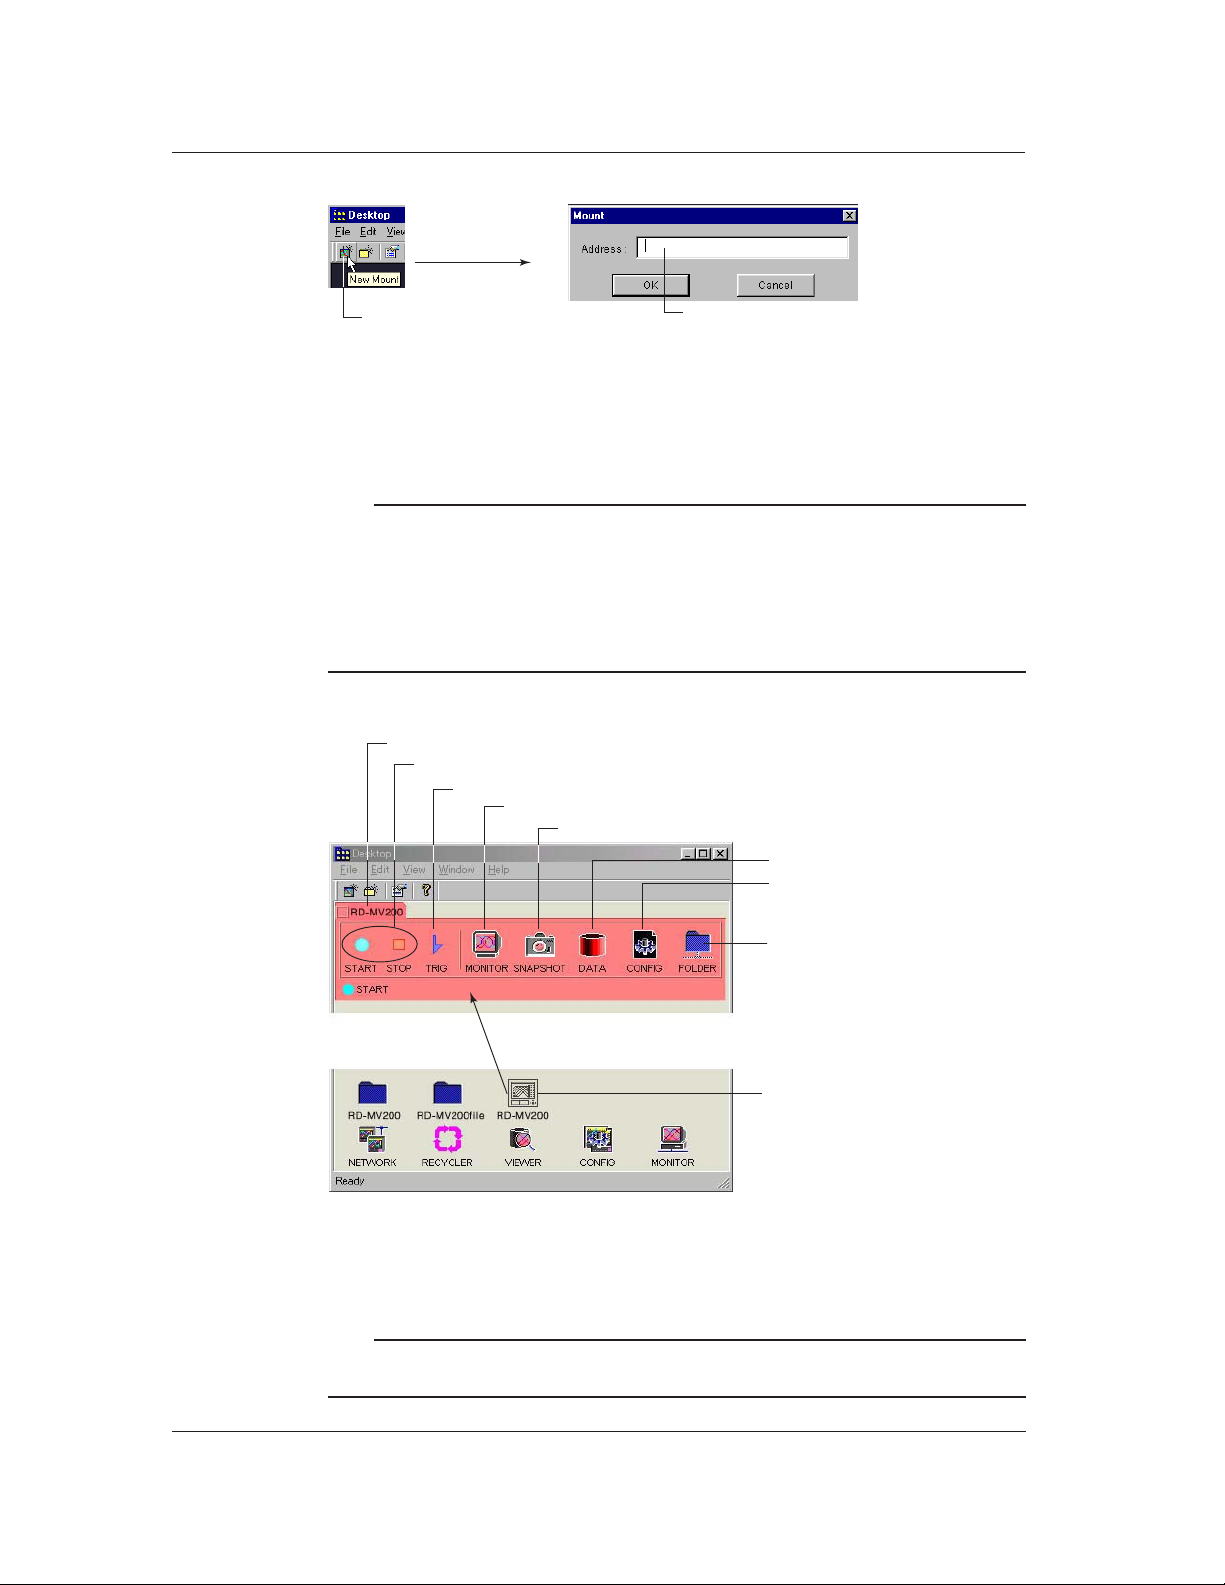
Opening the RD-MV Folder
RD-MV folder
Start/Stop the data acquisition (section 2.2)
3. Enter the host name or IP address.
Send a trigger (section 2.2)
Data monitor (section 3)
Snap shot (section 2.3)
Confirm data (section 2.4)
Check and reconfigure
RD-MV100/RD-MV200 setup data
(section 5)
Create and View the automatic
destination folder (section 2.5)
Exiting the DAQ Desktop
If you attempt to exit the program while the Data Monitor, Data Viewer, or Configurator is
running and the desktop is busy carrying out some operation, a message “Now working! Do you
exit all compulsory?” is displayed.
Note
You cannot exit from the DAQ Desktop, if you are editing a file that is outside the management of the
DAQ Desktop on the Data Viewer that was started from the Start menu or on the Configurator program.
2-4
2. The RD-MV folder opens.
1. Double-click here.
Page 18
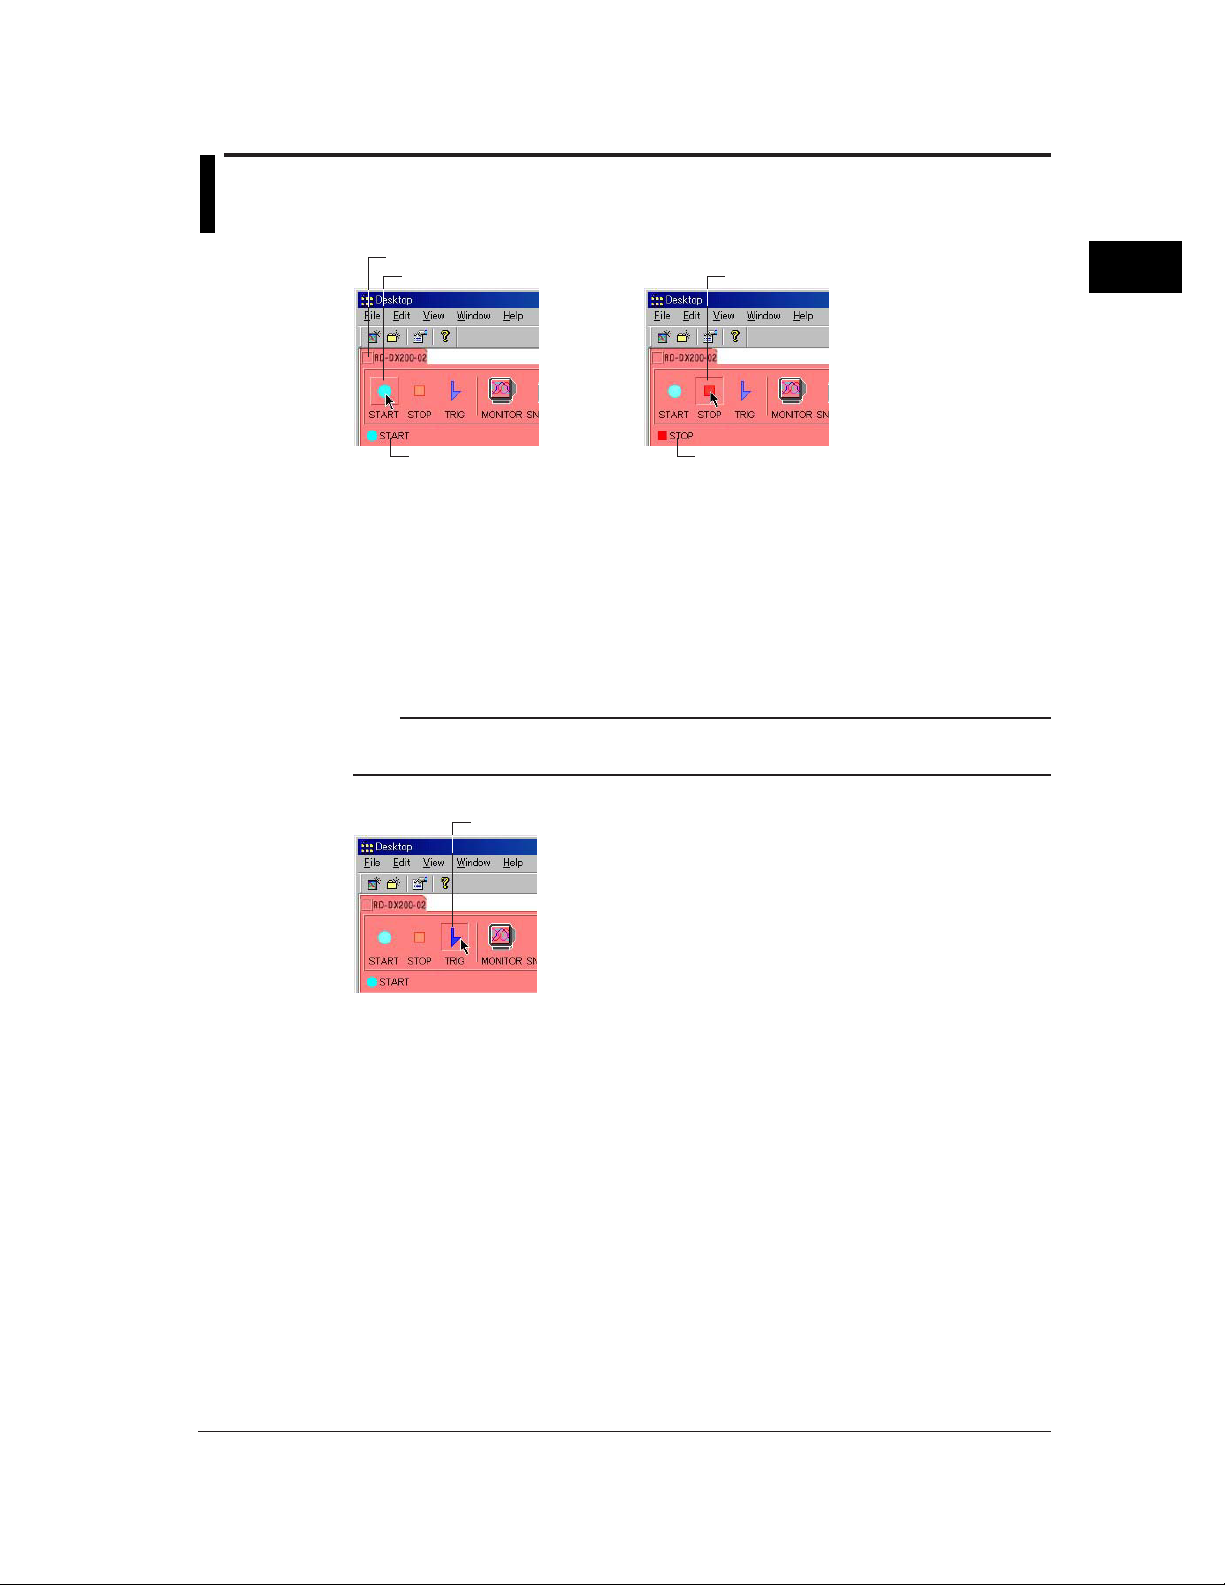
2.2 Starting and Stopping Data Acquisition on the
RD-MV, Send a Trigger
RD-MV folder
Click here (start)
Indicates that the data
acquisition is started
Starting
Clicking the start button starts the data acquisition to the internal memory of the RD-MV100/
RD-MV200.
Stopping
When you click the stop button, a message, “Do you stop recording?” appears. Clicking the
[OK] button stops the data acquisition to the internal memory of the RD-MV100/RD-MV200.
Click here (stop)
Indicates that the data
acquisition is stopped
Note
In some cases, the start/stop indicator may not be correct such as when the data acquisition is started or
stopped on the RD-MV.
Click here (send a trigger)
2
Using the DAQ Desktop
Trigger
Sends the trigger signal used to store the event data to the internal memory. The trigger is valid
when the mode used to store the event data to the internal memory of the RD-MV is [Trigger]
or [Rotate], trigger type is set to key trigger ([Manual Trigger] is set to [ON], see page 5-17) and
the RD-MV is in the trigger-wait condition after you press the Start button. The trigger button
is invalid during all other operations.
2-5
Page 19
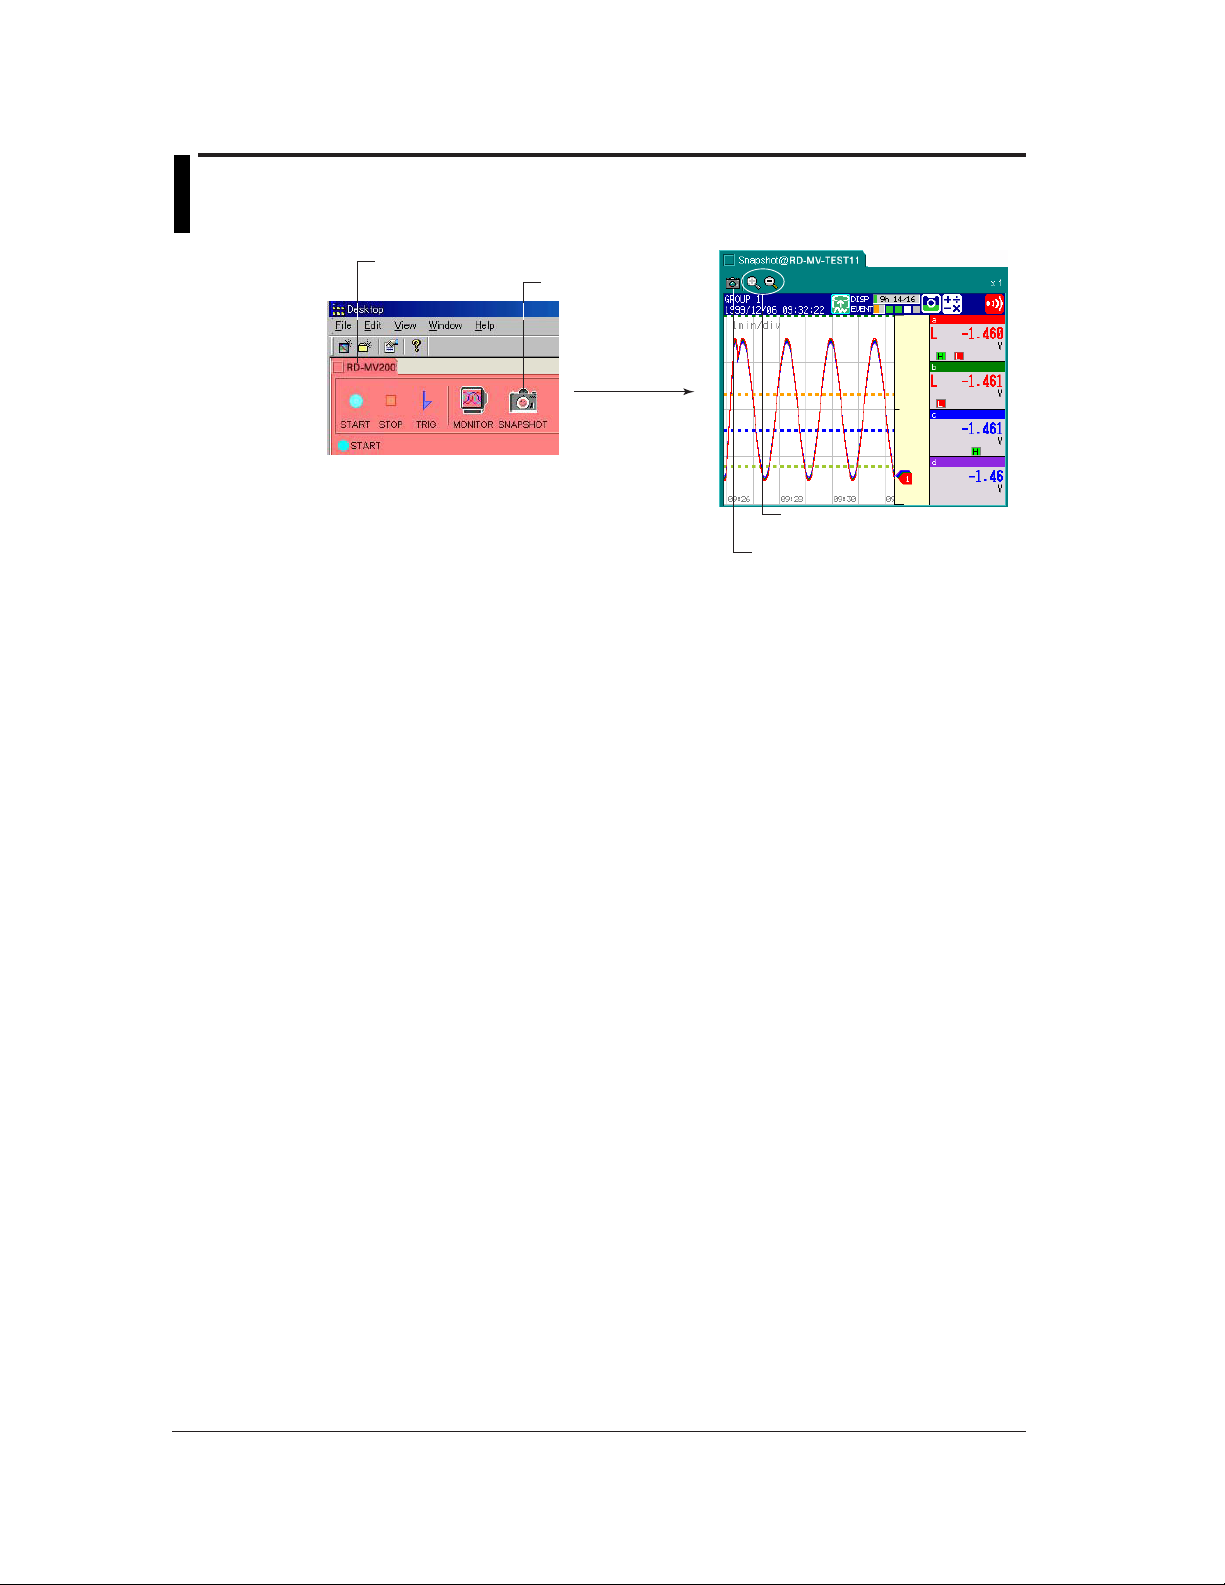
2.3 Using the Snap Shot Function
RD-MV folder
1. Double-click here.
2. The snap shot
screen opens.
Saving the snap shot screen
Drag and drop the snap shot screen that you wish to save onto the DAQ Desktop or onto a
folder on the DAQ Desktop.
The screen data that are dragged and dropped onto the DAQ Desktop are saved to the
DAQEXPLORER\desktop\DAQStation folder in the drive where the DAQEXPLORER was
installed.
The extension of the saved data file is [png].
The data that are saved cannot be opened using the DAQEXPLORER. You will need a
separate software program that can open the screen data.
Expand or reduce the size of the
snap shot screen
Take a new snap shot.
2-6
Page 20
2.4 Confirming the RD-MV100/RD-MV200 Data
Confirming the Data
RD-MV folder 1. Double-click here.
Displaying the data list
Displays a list of the files in the active folder of the internal memory or the external storage
medium of the RD-MV100/RD-MV200.
Data that can be displayed
The following data files can be listed:
•
Setup data file (*.PNL)
•
Display data file (*.DDS)
Event data file (.DEV)
•
• Report file
Hourly report file (*.DHR)
Daily report file (*.DDR)
Weekly report file (*.DWR)
Monthly report file (*.DMR)
TLOG file (*.DTG)
•
•
Manual sample file (*.DMN)
Display image data file (*.png)
•
2
Using the DAQ Desktop
Reload the data
Copy the selected files to the copy buffer
Select the display format of the list
2. Open the list
Of the files listed above, display files, event files, and TLOG files can be opened using the Data
Viewer (See section 3).
2-7
Page 21
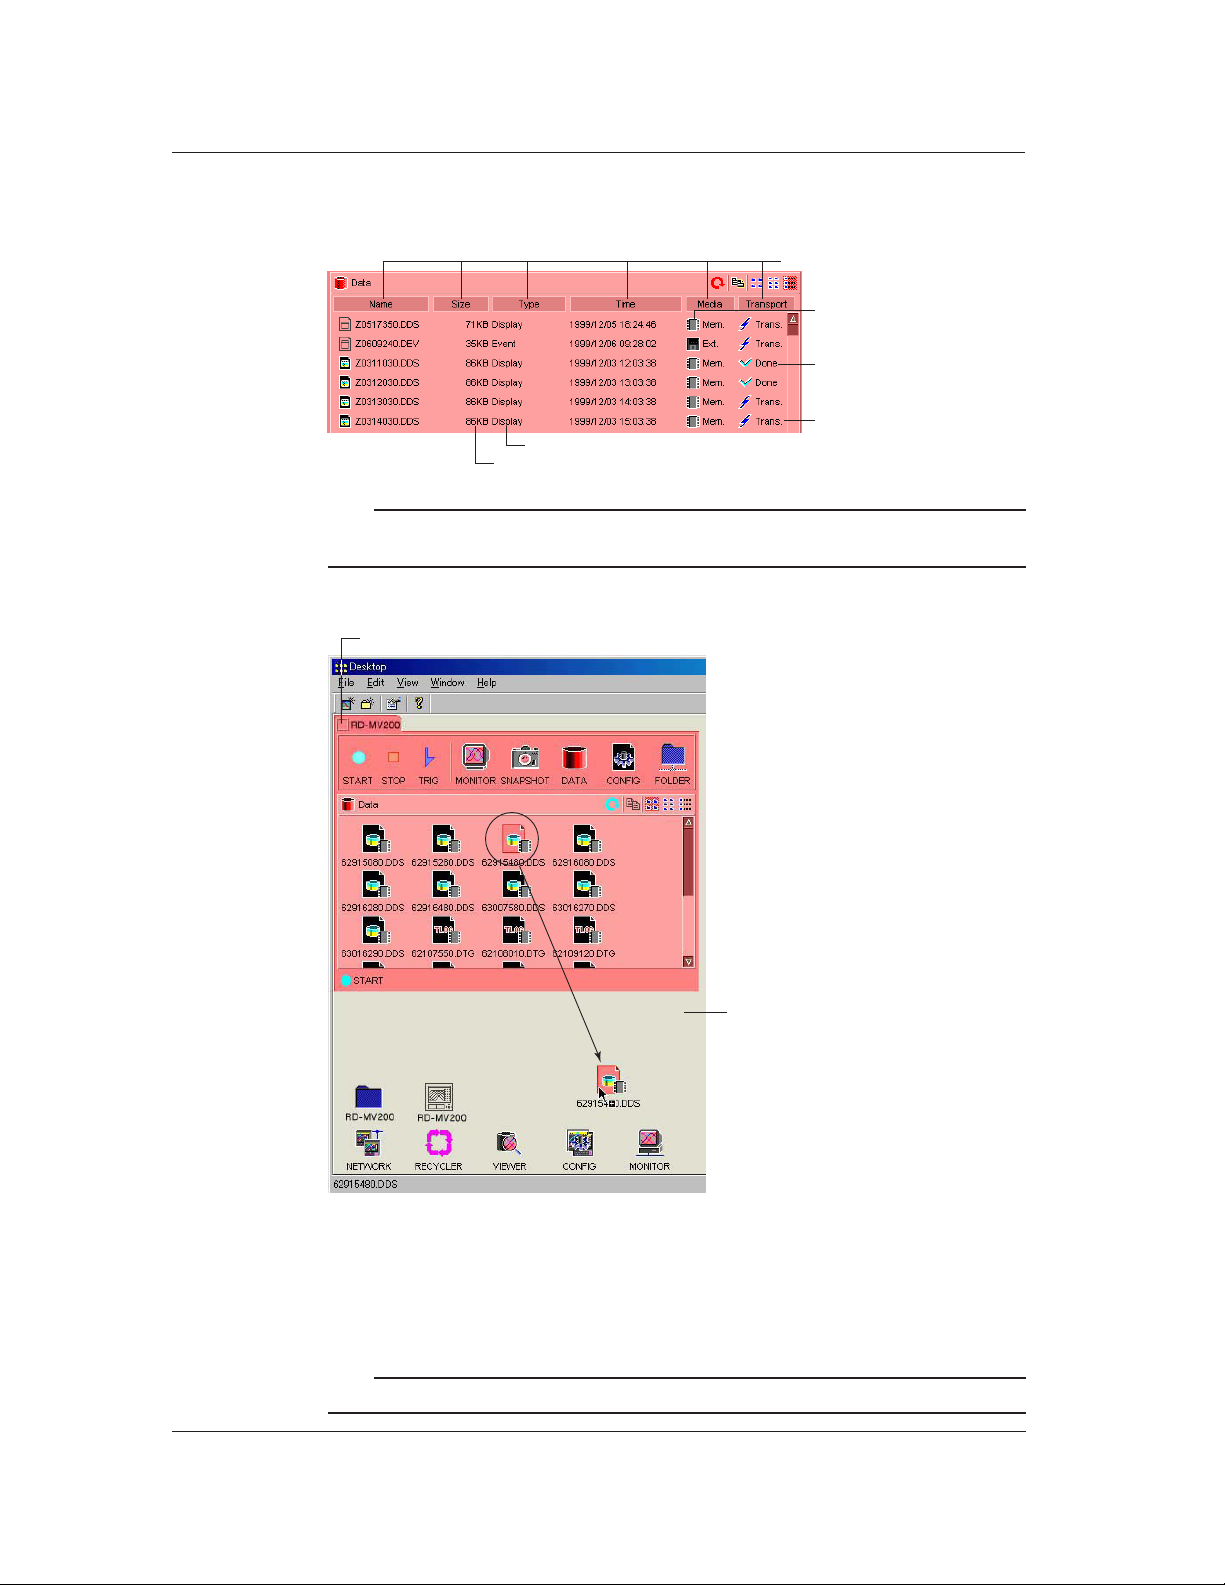
2.4 Confirming the DX100/DX200/MV100/MV200 Data
Methods used to display the list
You can select Icons, List, or Details.
• Display example when details is selected
Displays the data type
Displays the data size
Note
When viewing the contents of the external storage medium, only the data files in the directory that was
specified as the data save destination on the RD-MV are listed.
Copying Files to the DAQ Desktop
RD-MV folder
Sort using the item that was clicked
Displays whether the data are
of the internal memory or the
external storage medium
Check mark is attached to a file
that has been automatically
transferred
Attached to a file that is being
automatically transferred
2-8
DAQ Desktop
Drag and drop
You can copy the file that is located in the RD-MV to the DAQ Desktop by dragging and
dropping the file onto the DAQ Desktop.
Copying and pasting files
To copy the files, select the files and select [Edit] - [Copy].
The files that are copied can be pasted to the active window by selecting [Edit] - [Paste].
Note
When the data are reloaded, the files residing the copy buffer are cleared.
Page 22
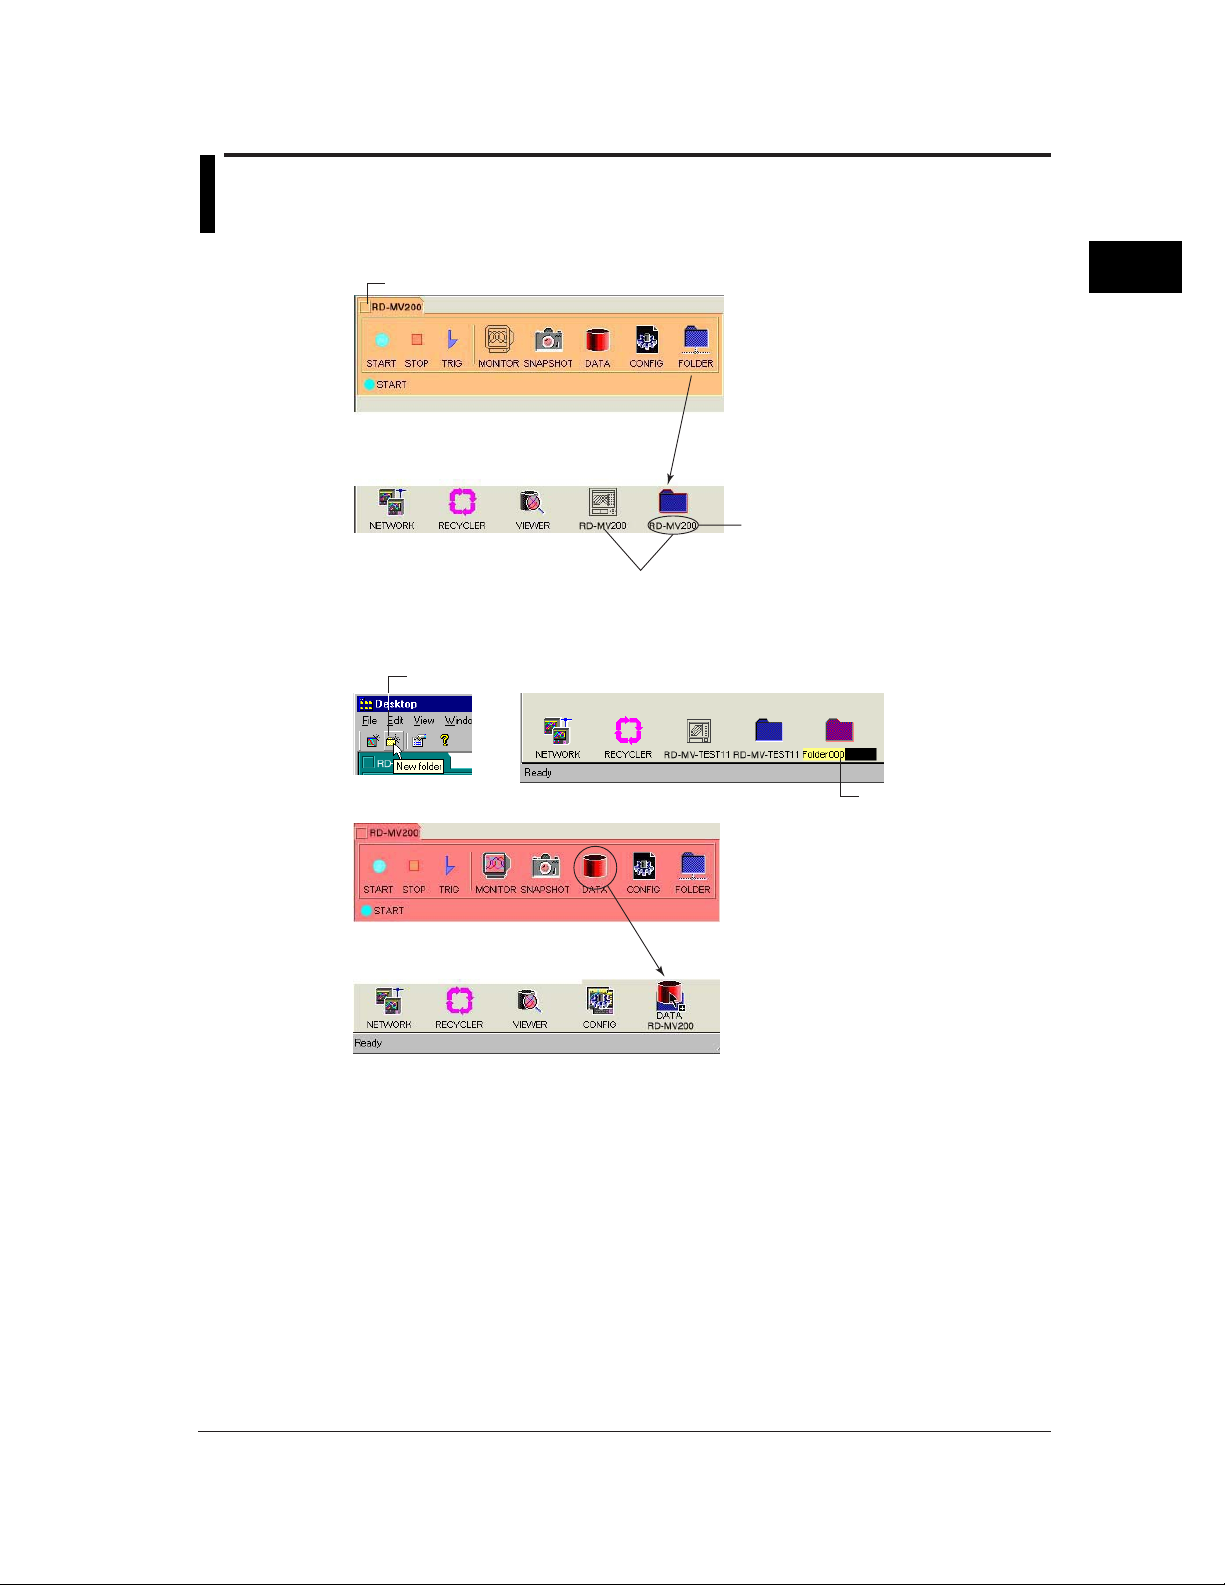
2.5 Automatically Transferring Data in the RD-MV
Setting the Automatic Transfer Destination
RD-MV folder
Renaming the automatic transfer destination folder
1. Click here ([File] - [New Folder]).
Same name
2
Using the DAQ Desktop
1. Drag and drop onto the DAQ desktop.
2. The folder name is set to the same name
as the icon of the RD-MV100/ RD-MV200
hat was mounted. This folder is the
automatic transfer destination.
2. A new folder is created.
3. Enter the folder name.
4. Drag and Drop onto the newly created folder icon.
(The automatic transfer destination is set to the
newly created folder.)
The data residing in the internal memory or external storage medium of the RD-MV can be
automatically transferred to the specified folder on the PC.
2-9
Page 23
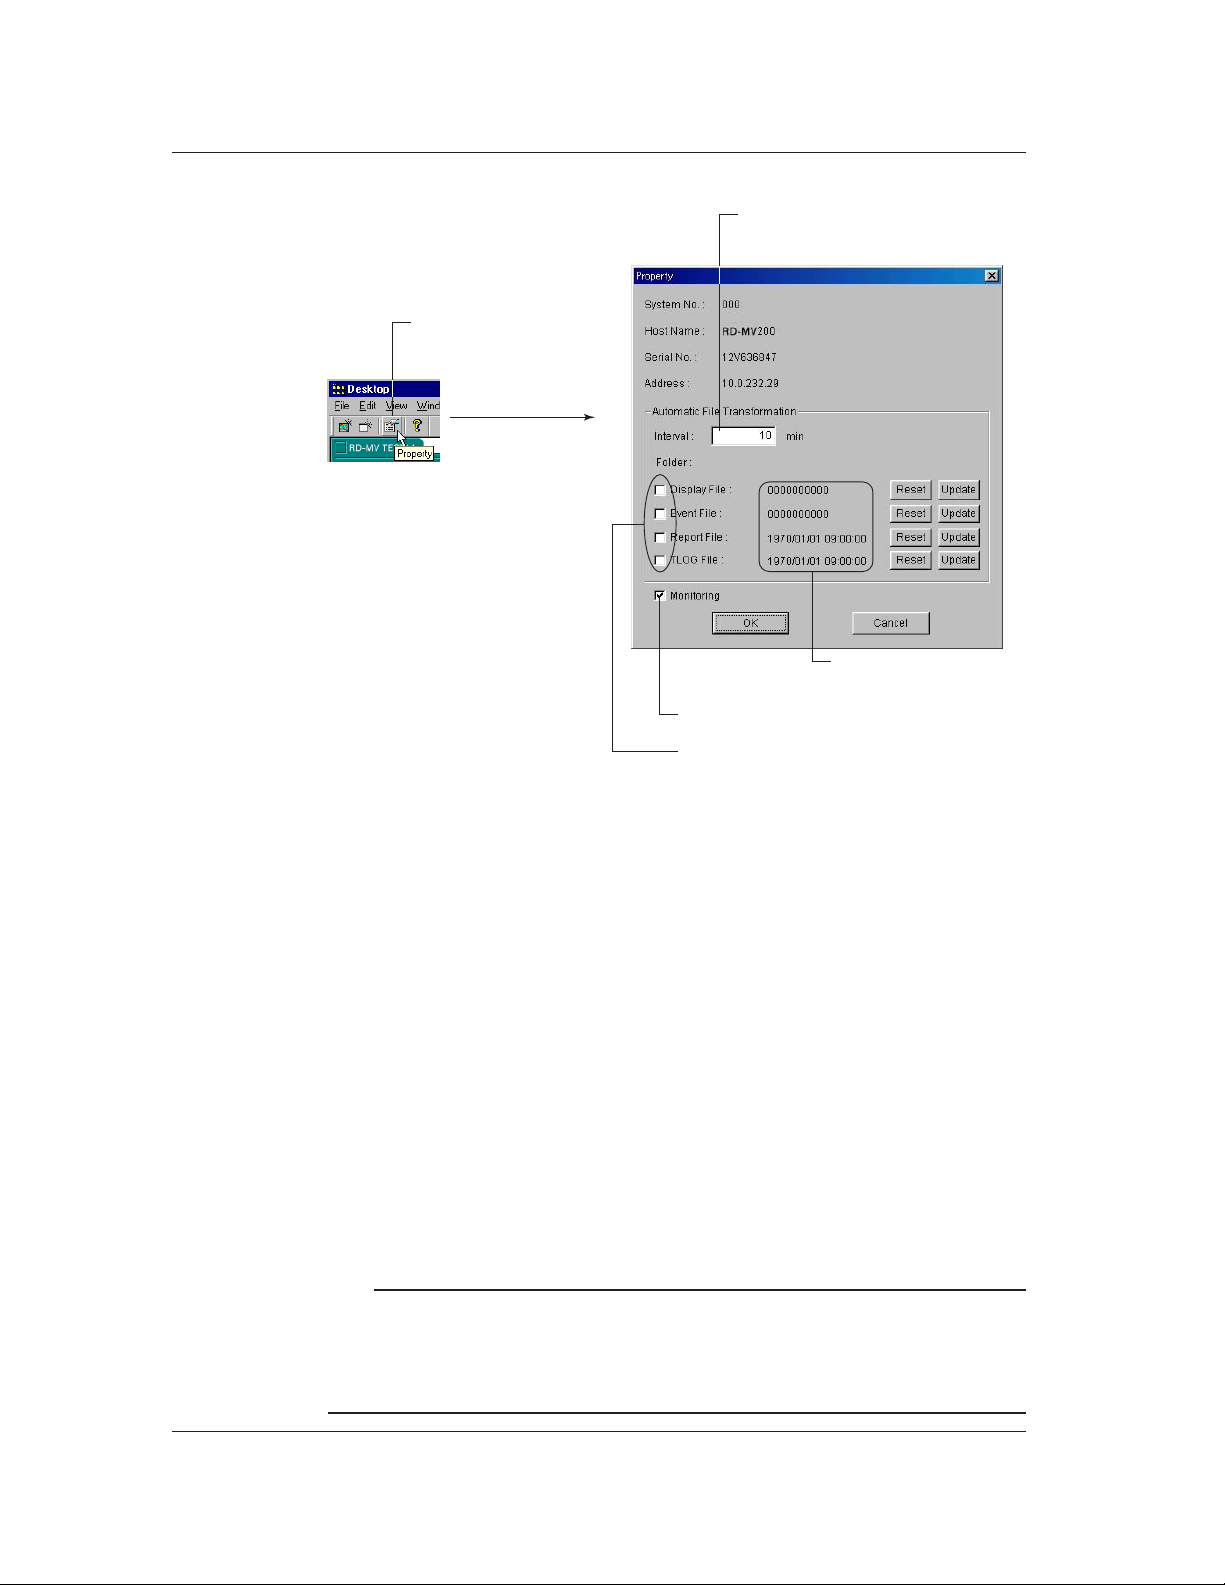
2.5 Automatically Transferring Data in the DX/MV
Selecting the Files to be Automatically Transferred
1. Click here
([File] - [Property]).
2. The [Property] dialog
box opens.
Select the interval at which the data are
to be transferred in units of minutes
(10 to 120 minutes)
The number or date of the
data file that was previously
transferred
Start/Not start the Data Monitor program
from the RD-MV folder
Automatically transfer the files that are checked
Files that can be automatically transferred
The following files residing in the internal memory or the external storage medium of the RD-
MV100/RD-MV200 can be automatically transferred:
• Display data file
• Event data file
• Report file
• TLOG file
Resetting
All existing files of the selected types are automatically transferred at the time of the data
transfer immediately after the [Reset] button is clicked.
Updating
All files of the selected types that are created after the [Update] button is clicked are
automatically transferred during the next data transfer.
Monitoring
Select whether or not to start the Data Monitor program from the RD-MV folder. If you
deselect the check box, you will not be able to select the MONITOR icon of the RD-MV folder.
Note
• If the DAQEXPLORER is terminated with some files still selected to be transferred (denoted on each
file by a check mark), the selected files will be transferred when the first data transfer is performed
once the DAQEXPLORER has been restarted.
• The property icon ([File] - [Property]) cannot be selected unless the RD-MV folder is active (the RD-MV
folder is selected).
2-10
Page 24
Confirming the Transferred Files
RD-MV folder
2.5 Automatically Transferring Data in the DX/MV
1. Double-click here.
2. The automatic transfer
destination folder opens.
The location of the automatic transfer destination folder
Copy the selected files to the copy buffer
Paste the file in the copy buffer
Select the method used to display the list
(see section 2.4)
3. Displays a list of transferred files.
You can also open the above folder by double-clicking the automatic transfer destination folder
located on the DAQ Desktop.
Note
When the list of data residing in the internal memory or external storage medium of the RD-MV100/RD-
MV200 is displayed, data that have been transferred are indicated with red check marks.
2
Using the DAQ Desktop
2-11
Page 25
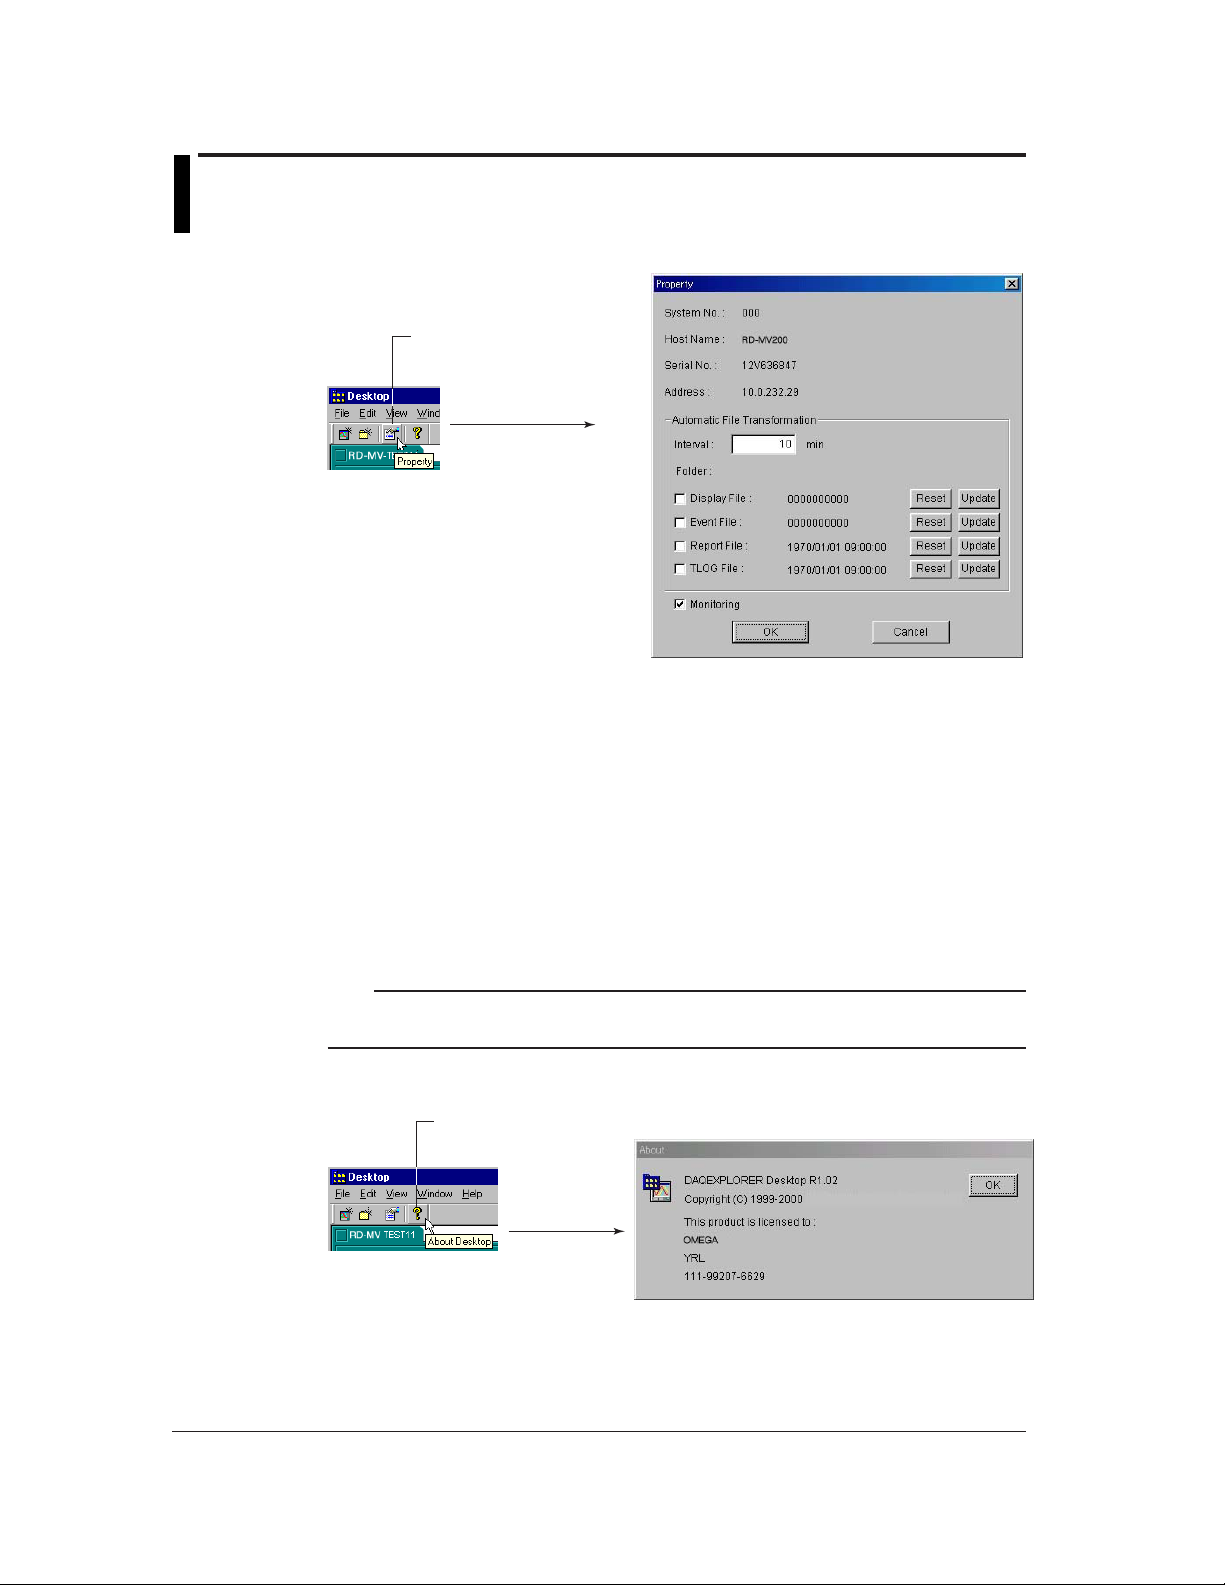
2.6 Viewing the Property and Version Information
Property
1. Click here ([File] - [Property]).
2. The [Property] dialog
box opens.
The properties of the active RD-MV100/RD-MV200 are displayed. The following items are
displayed:
System No.: Number used on the Data Monitor
Host Name: RD-MV100/RD-MV200 host name
Serial No.: RD-MV100/RD-MV200 serial number
Address: RD-MV100/RD-MV200 IP address or host name
Interval: Automatic transfer interval of data (10 to 120 minute range)
Folder: Automatic transfer destination for the data
Reset: Transfer all existing data files
Update: Transfer only newly created data files.
Monitoring: Use/Not use the Data Monitor program.
Version Information
2-12
Note
The property icon ([File] - [Property]) cannot be selected unless the RD-MV folder is active (the RD-MV
folder is selected).
1. Click here ([Help] - [About])
2. The [About]
dialog box
opens.
The version information of the DAQ Desktop is displayed.
Page 26
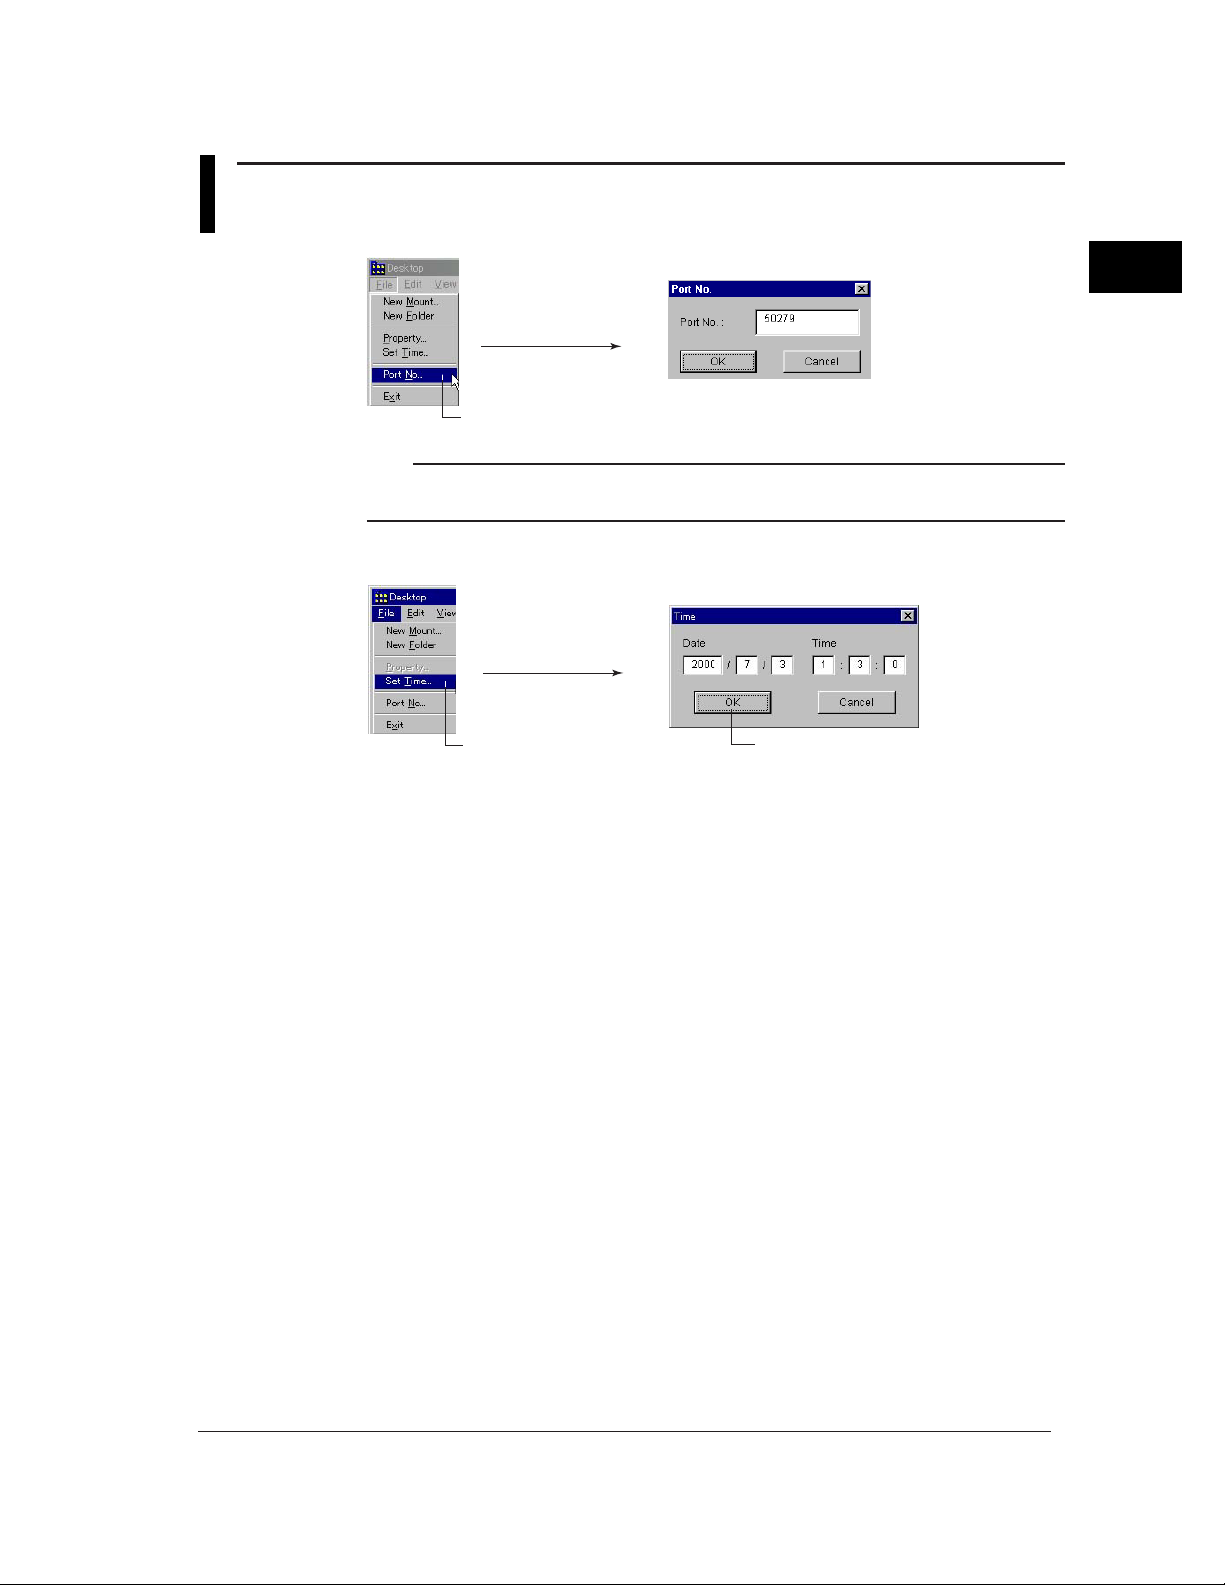
2.7 Confirming the Port Number Setting the Time on
the RD-MV
2. The [Port No.] dialog
box opens.
1. Select [File] - [Port No.].
Note
The above dialog box can be used to change the port number. However, please consult your network
administrator when changing the port number.
Setting the Time on the RD-MV
2. The [Time] dialog box
opens.
1. Select [File] - [Set Time]. 3. Enter the date and time and click here.
2
Using the DAQ Desktop
Sets the date and time of all mounted RD-MV100s, and RD-MV200s at once.
2-13
Page 27
Chapter 3 Using the Data Monitor
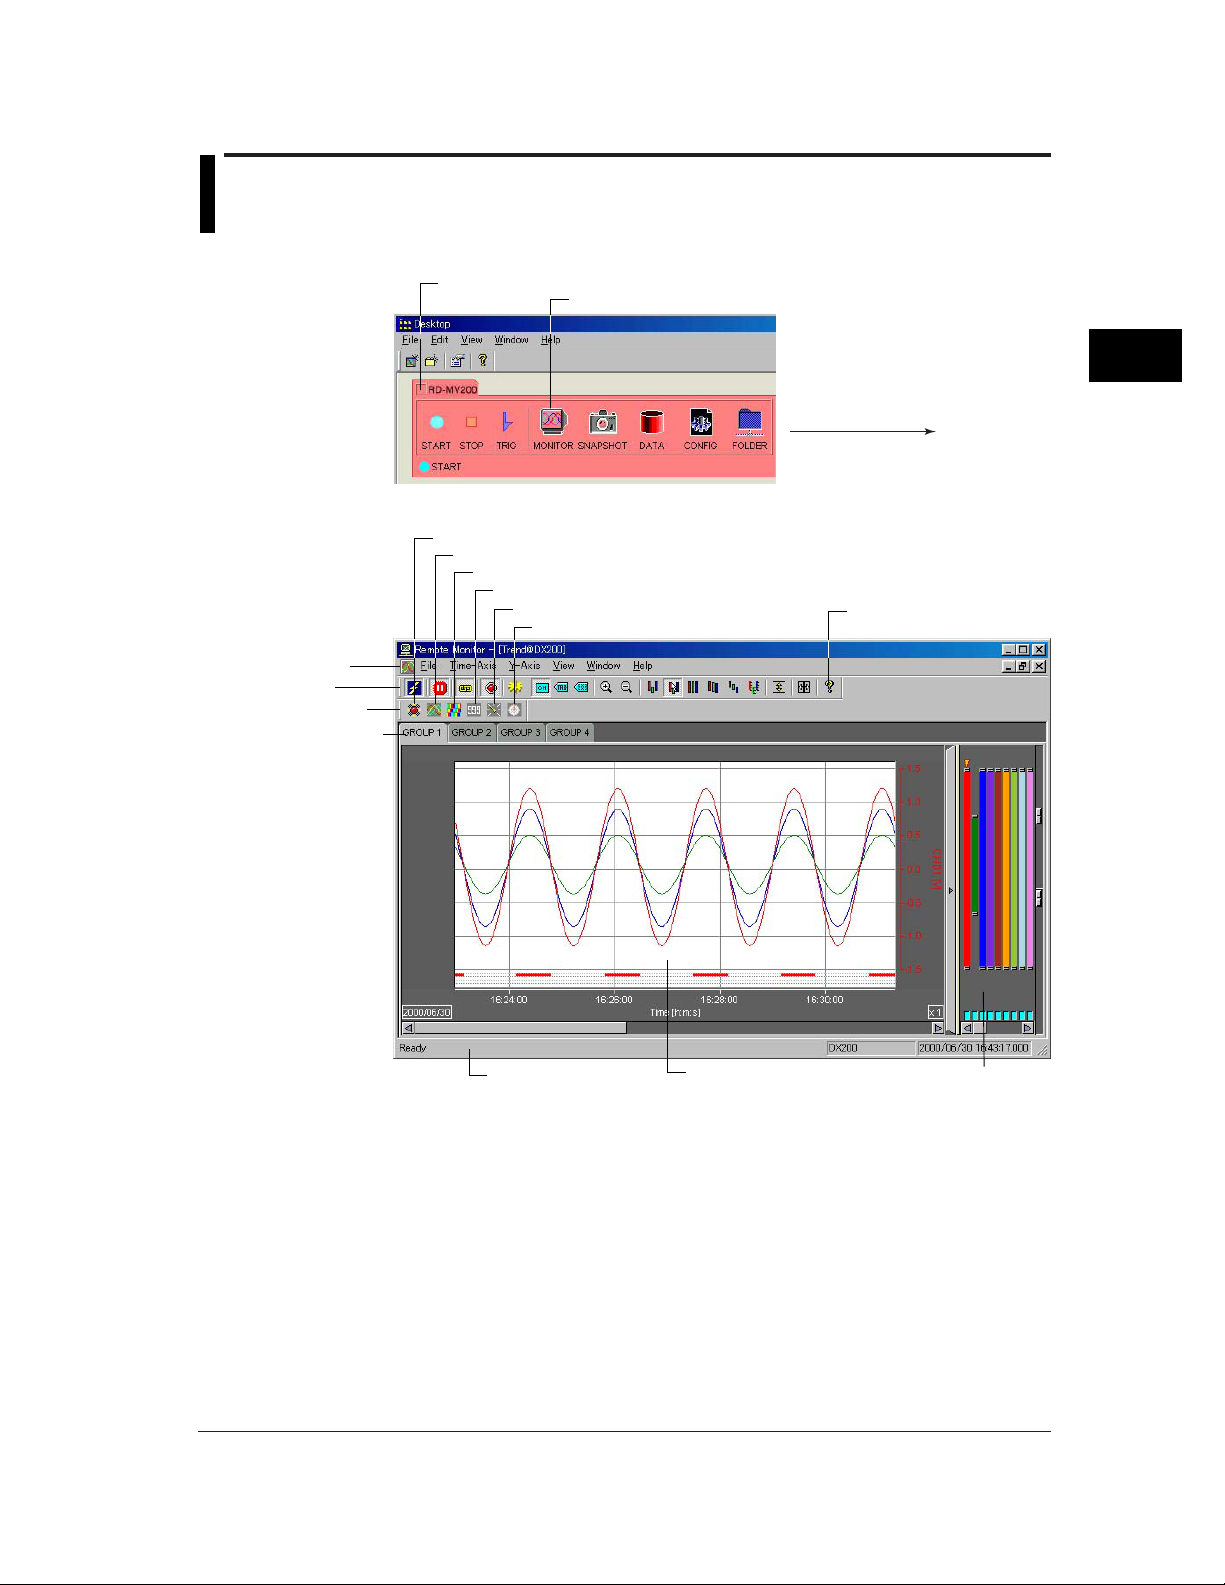
3.1 Starting the Data Monitor
Starting the Data Monitor (From the RD-MV Folder)
RD-MV folder
1. Double-click here.
Alarm monitor (section 3.6)
Trend monitor (section 3.2)
Color graphic monitor (section 3.3)
Numeric monitor (section 3.4)
Meter monitor (section 3.5)
Circular monitor (section 3.7)
Menu bar
Toolbar
Monitor bar
Trend monitor
3
Using the Data Monitor
2. The trend monitor opens.
Display version information
of the Data Monitor
Status bar
Waveform display area
Zone display area
The Data Monitor can be used to monitor the measured/computed data and the alarms of the
RD-MV100/RD-MV200. The following six monitoring methods are available:
• Alarm monitor
• Trend monitor
• Color graph monitor
• Numeric monitor
• Meter monitor
• Circular monitor
3-1
Page 28
3.1 Starting the Data Monitor
Toolbar, monitor bar, and status bar
Clicking [View] - [Tool Bar], [Monitor Bar], or [Status Bar] from the menu bar displays the
corresponding bar in the window. The bar will disappear if the check is removed.
Note
• You cannot launch the Data Monitor using the MONITOR icon, if the Data Monitor is already running.
• You can monitor the data on the Data Monitor, even if the data acquisition to the internal memory of
the RD-MV is stopped.
• The trend screen is initially displayed when the Data Monitor is started.
• The RD-MV folder is displayed by double-clicking the RD-MV icon on the DAQ Desktop.
• If the connection conditions are saved by selecting [File] - [Save], they will be restored the next time the
Data Monitor is opened.
Starting the Data Monitor (From the Desktop)
For the operations that follow, see section 3.8, “Connecting Communications between the Data
Monitor and the DAQ Desktop.”
1. Double-click here.
3-2
Page 29
3.2 Displaying the Trend
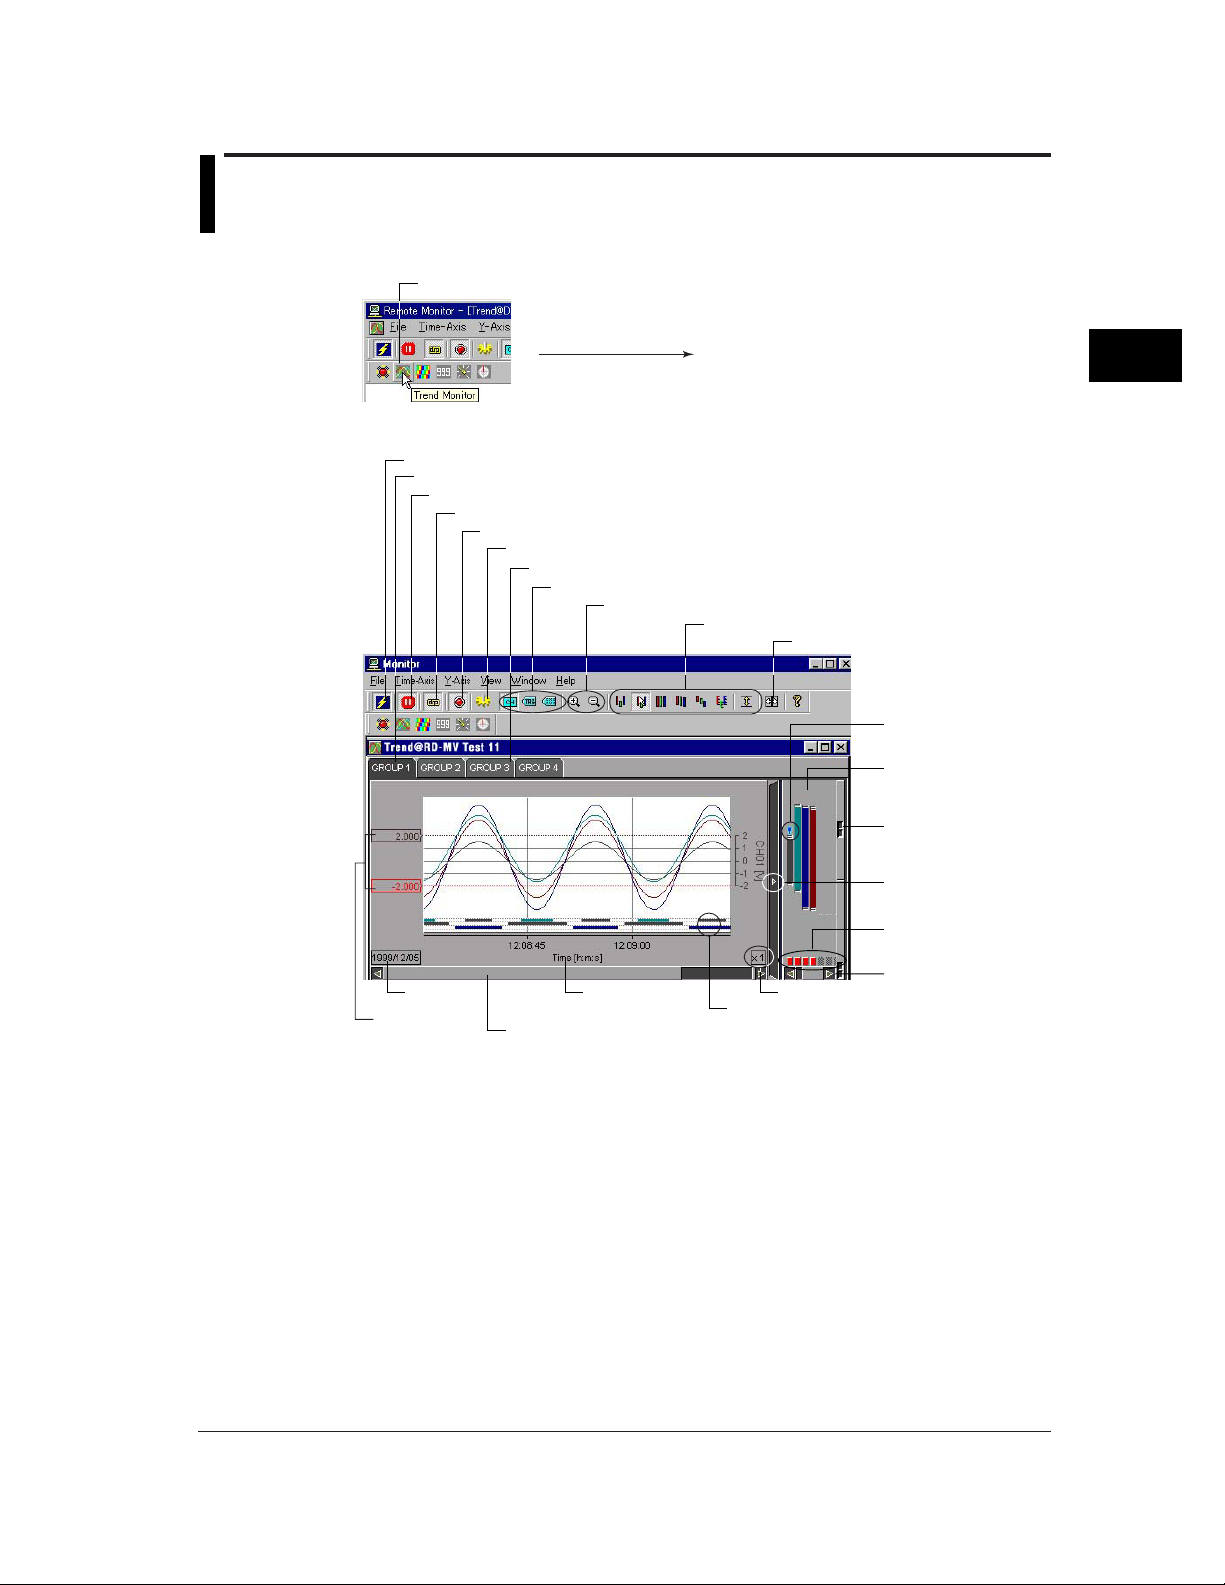
Displaying the Trend
1. Click here ([Window] - [Trend Monitor]).
2. The trend monitor opens.
Connect/Disconnect the monitor (section 3.8, 3.10)
Select the displayed group
Pause the monitor (section 3.9)
Turn ON/OFF the link (section 3.9)
Turn ON/OFF the alarm display
Set general display settings
The red bar blinks when an alarm occurs
Characters used to identify channels
3
Using the Data Monitor
Zoom in or zoom out of the time axis
Set the Y-axis
Display the cursor’s value
Mark the active
waveform
Zone display area
Grid brightness
adjustment knob
Show/Hide zone
display area
Turn ON/OFF waveform
display
Date
Trip line
Absolute or
relative time
Move the waveform
display position (scroll bar)
Zoom factor
Alarm display
Brightness adjustment
knob of the waveform
display area
Select the displayed group
Select the group for which the trend is to be displayed from the groups specified in [General
Display Settings]. The registration of channels to groups is done at [General Display Settings] -
[Channel No.].
3-3
Page 30
3.2 Displaying the Trend
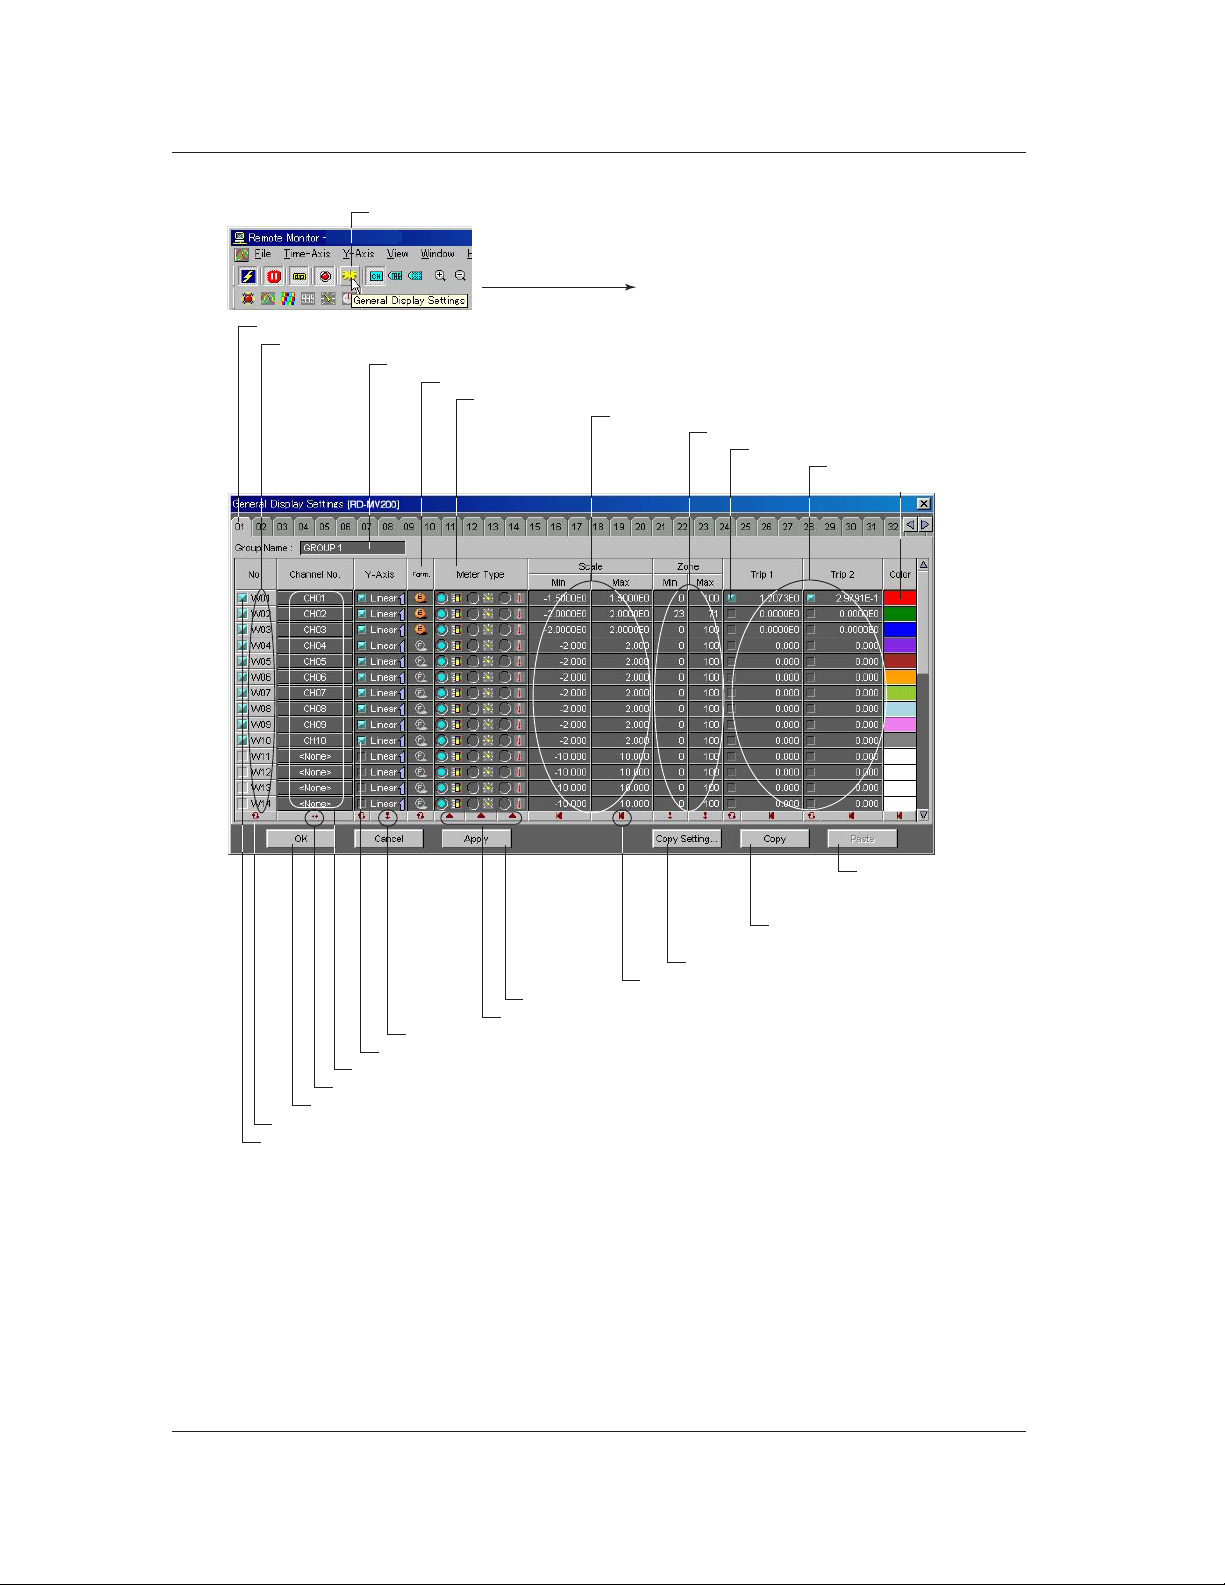
General Display Settings
3. Click the tab of the group to be configured.
The waveform corresponding to the waveform No. that is clicked becomes active.
1. Click here ([Window] - [General Display Settings]).
2. The [General Display Settings]
dialog box opens.
Enter the group name
Select normal display or exponential display
See section 3.5, “Displaying the Meter.”
Enter the display range
Enter the display position
Show/Hide the trip line
Enter the trip line
Display color
3-4
Paste the copied setup
data to the active
waveform number
Copy the setup data of the
active waveform number
Select the items to be copied
Initialize
Activate the settings
Set the selected range at once
Copy the settings of the first channel in the selected range to all other channels
Show/Hide the Y-axis
Register the channel
Assign numbers to the channels in the selected range in ascending order
Activate the settings and close the dialog box
Turn ON/OFF at once
Turn ON/OFF waveform display (Blue is ON)
Group
A maximum of 50 groups can be set. A maximum of 32 channels can be registered in one
group.
Turn ON/OFF the display
Check the box of the waveform number to be displayed. This is synchronized to the ON/OFF
button of the waveform display of the zone display area.
Page 31

3.2 Displaying the Trend
Registering the channel
1. Click one.
2. The [Channel No.] dialog box opens.
3. Click one.
Types of Y-axis and turning ON/OFF the Y-axis
Select linear or logarithmic by clicking the Y-axis display area. If [Multi-Axis Zone] (page 3-7,
Setting the Y-axis) is selected, you can select whether or not to display the Y-axis. The Y-axis
of the waveform for which the check box is shown in [blue] will be displayed.
3
Using the Data Monitor
Scale (display range)
The range of minimum and maximum values is from -999999999 to 999999999, excluding the
decimal point.
Click the scale value display area to enter values.
Zone (display position)
The range is as follows:
• Minimum value: 0 to 99%
• Maximum value: 1 to 100%
Specify the waveform display position by taking the bottom edge of the waveform display area
of the trend display screen to be 0% and the top edge to be 100%. Click the zone display area
to enter values.
Trip line
Two trip lines (trip 1 is red, trip 2 is blue) can be set for each waveform. Only the trip lines of the
active waveform are displayed on the trend screen. However, on the auto zone display screen
(“Setting the Y-axis” on page 3-7), the trip lines of all displayed waveforms that are checked are
displayed.
When the monitor is paused (section 3.9), you can change the position of the trip line by
dragging it.
3-5
Page 32

3.2 Displaying the Trend
Display color
You can select the color of each waveform. To create custom colors, click the [Define Custom
Colors] button in the [Color] dialog box.
Copy/Paste
The parameters that are checked in the [Copy Setting] dialog box, that opens when the [Copy
Setting] button is clicked, are copied.
When the [Copy] button is clicked, the settings of the waveform corresponding to the waveform
No. that was activated (displayed in red) are copied. When the [Paste] button is clicked, the
settings are copied to the waveform corresponding to the waveform No. that was activated.
Selecting the Characters Used to Identify Channels
Click one ([View] - [Channel No.]/[Tag No.]/[Tag Comment])
Select the character string used to identify the channel from channel No., tag No., and tag
comment. The selected character string will be used as a label to indicate the waveform name.
The string can be registered on the RD-MV100/RD-MV200 directly or by using the
Configurator.
If [Tag No.] is selected the first eight characters of the registered character string are used. If
[Tag Comment] is selected all the characters are used.
Note
When the identification string is switched, the channel character string displayed on each monitor, [Cursor
Value] window, and [General Display Setting] window will change accordingly.
Setting the Time Axis
Selecting absolute or relative time display
Absolute Time: Displays the time.
Relative Time: Displays the relative time from the first data point.
Note
The time information display of the cursor’s value display is set to the specified setting (absolute or
relative).
1. Select [Time Axis] - [Absolute Time] or
[Relative Time] from the menu bar.
2. The specified time axis is displayed.
3-6
Page 33

Zooming in or zooming out of the time axis
• Zoom In Example • Zoom Out Example
Setting the Y-axis
Selecting the waveform display zone
3.2 Displaying the Trend
Click either one
([Time Axis] - [Zoom In]/[Zoom Out])
Expanded by 2 Reduced to 1/2
User zone
Edit zone
Full zone
Slide zone
Auto zone
Multi-axis zone
Click one
([Y-Axis] - [User zone]/[Edit zone]/[Full zone]/
[Slide zone]/[Auto zone]/[Multi-axis zone])
Waveform display limit
([Y-Axis] - [Clip])
3
Using the Data Monitor
Select from the following list of choices:
For the display examples of each zone, see the next page.
• User zone: Each waveform is displayed in the range specified in [Zone] under the
[General Display Setting] (the zone cannot be changed on the trend display
screen).
• Edit zone: Each waveform is displayed in the range specified in [Zone] under the
[General Display Setting] (the zone can be changed on the trend display
screen).
• Full zone: Display all waveforms using full zones.
• Slide zone: Display the waveforms in a cascade fashion from the top to the bottom of the
waveform display area.
• Auto zone: Display the waveforms by equally dividing the waveform display area by the
number of displayed waveforms.
• Multi-axis zone: Display the Y-axis of multiple waveforms.
Note
If the waveform display zone is set to some setting other than multi-axis zone and auto zone, only the Y-
axis of the active waveform is displayed.
3-7
Page 34

3.2 Displaying the Trend
Examples of the Various Zone Settings
• Full zone • Slide zone
• Auto zone
Slide zone
Full zone
Auto zone
3-8
• Multi-axis zone
Y-axis display area
Page 35

Editing zones
3.2 Displaying the Trend
Drag the top adjustment knob
Drag the zone display bar
Drag the bottom adjustment knob
You can change the waveform display zone on the trend display screen by clicking the edit zone
icon or by selecting [Y-Axis] - [Edit Zone].
The size of the zone can be changed by dragging the top and bottom adjustment knobs. The
entire zone can be moved by dragging the zone display bar.
The zones that are set in [Edit Zone] are reflected in the [Zone] setting of the [General Display
Settings].
Displaying multiple Y-axis
When multi-axis zone is selected, the Y-axis scales corresponding to the [Y-Axis] boxes in the
[General Display Settings] that are checked will be displayed.
The Y-axis can only be added or deleted by dragging or dropping when the monitor is paused.
• Adding a Y-axis • Deleting a Y-axis
3
Using the Data Monitor
Drag and drop
Drag and drop
3-9
Page 36

3.2 Displaying the Trend
Waveform display limit (clip)
When the waveform display limit is enabled by clicking the clip icon or by selecting [Y-Axis] -
[Clip], the Y-axis display range of the waveform are limited to the minimum and maximum
values that were specified under [General Display Settings] - [Scale]. Measured values that are
less than the minimum value are set to the minimum value and values that are greater than the
maximum value are set to the maximum value.
• Example in which Display Limit is Enabled
• Example in which Display Limit is Disabled
Turning ON/OFF the Alarm Display
1. Click here ([View] - [Alarm]).
3-10
2. The alarm is displayed.
Alarm display
No alarm
Alarm 1
Alarm 2
Alarm 3
Alarm 4
Alarm occurrence
The alarm of the active waveform is displayed in front.
Page 37

Showing/Hiding Cursors
Showing the cursor
1. Click here ([File] - [Pause]).
3.2 Displaying the Trend
2. The monitor pauses.
3. Point the cursor on
4. Drag the cursor (Cursor B).
the screen (Cursor A).
When the mouse is pointed on the screen, Cursor A and Cursor B are overlapped.
Cursors can be displayed only when the monitor is paused. Pause the monitor before pointing
the cursor on the trend screen.
Hiding the cursor
3
Using the Data Monitor
Select [View] - [Hide Cursor]
Selecting the Line Type of the Waveform (Normal/Medium/Thick)
Select [View] - [Normal], [Medium], or [Thick]
You can select the thickness of the line of the displayed waveform from Normal, Medium, and
Thick.
3-11
Page 38

3.2 Displaying the Trend
Displaying Cursor’s Values
A list of Cursor A and B values and their differences on the trend screen is displayed. You can
change the values of Cursor A and B by clicking the cursor movement buttons.
When the alarm display is turned ON, the alarm conditions are displayed. When an alarm is in
effect, the indicator is red. When it is not, the indicator is green. If the alarm is not set, the
indicator is black.
1. Click here ([View] - [Display Cursor’s Values]).
2. The [Cursor’s Value] dialog box opens.
The values of Cursor A and B on the trend screen
Cursor movement button
Alarm display (Displays the conditions of alarm 1, 2, 3, and 4 from the left)
Displaying numeric values of abnormal data
The abnormal data are displayed as follows:
+OVER: Measured/computed data are over the positive limit
-OVER: Measured/computed data are under the negative limit
LACK: Computation error or data dropout
Note
When a cursor is not displayed on the trend screen, the cursor’s value display area becomes blank.
Setting the Window
Cascade/Tile/Arrange Icons
Select [Window] - [Cascade], [Tile],
or [Arrange Icons]
3-12
Page 39

• Example of a Cascading Display
• Example of a Tiled Display
3.2 Displaying the Trend
3
Using the Data Monitor
• Example of Arranged icons
Displaying a new trend monitor, color graph monitor, numeric monitor, meter monitor or
circular monitor
Alarm
Trend
Color graph
Numeric
Meter
Circular
Click one
A new monitor opens every time the icon is clicked. This is useful when you wish to view
multiple groups simultaneously.
3-13
Page 40
3.3 Displaying the Color Graph
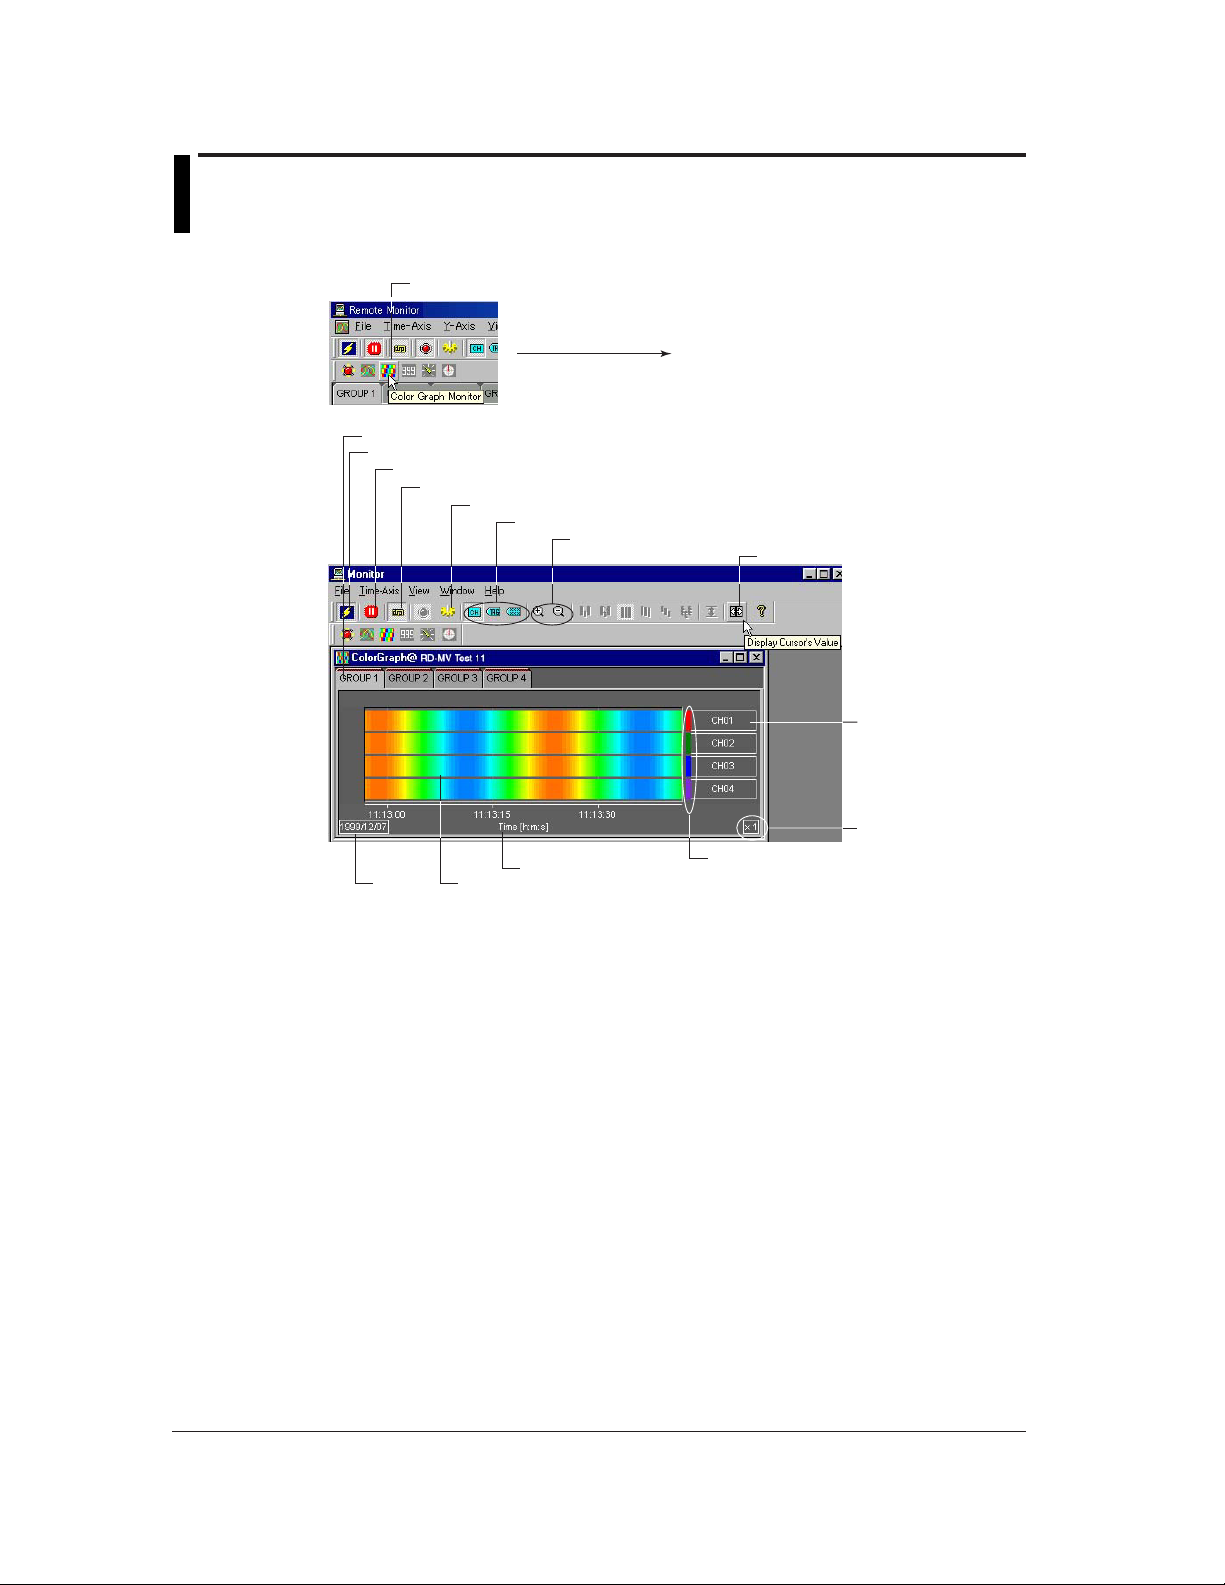
Displaying the Color Graph
Click here ([Window] - [Color Graph Monitor]).
2. The color graph monitor opens.
Select the displayed group
Connect/Disconnect the monitor (section 3.8, 3.10)
Pause the monitor (section 3.9)
Turn ON/OFF the link (section 3.9)
General display settings
Characters used to identify channels (section 3.2)
Zoom in or zoom out of the time axis
Display the cursor’s value
Display the channel
No., tag No., or tag
comment
Date Display measured data using different colors
General Display Settings
The parameters in the [General Display Settings] dialog box related to the color graph display
are as follows:
• Turn ON/OFF waveform display: The color graph of the waveform that has channels
• Registering the channel: The measured or computed data of the registered channel
• Setting the displayed range: By assigning 50 different colors from the minimum to the
• Display color
For details related to the setting procedures, see “General Display Settings” in section 3.2,
“Displaying the Trend.”
Magnification
Absolute or relative time
Display color
registered and is turned ON is displayed.
can be displayed.
maximum values of the scale, the measured values are
displayed using those colors. The measured data are
colored in the following order: blue (minimum value), light
blue, green, yellow, and red (maximum value).
3-14
Page 41

Setting the Time Axis and Cursor Display
Selecting absolute or relative time display, zooming in or out of the time axis, displaying
cursor’s values
For details, see “Setting the time axis” and “Displaying Cursor’s Values” in section 3.2,
“Displaying the Trend.”
Showing the cursor
1. Click here ([File] - [Pause]).
2. The monitor pauses.
3.3 Displaying the Color Graph
3
Using the Data Monitor
Cursors can be displayed only when the monitor is paused. Pause the monitor before pointing
the cursor on the screen.
Hiding the cursor
For details, see “Hiding the Cursor” in section 3.2, “Displaying the Trend.”
Setting the Window
For details, see “Setting the Window” in section 3.2, “Displaying the Trend.”
4. Drag the cursor (Cursor B).
Point the cursor on the screen (Cursor A)
3-15
Page 42

3.4 Displaying Numeric Values
Displaying Numeric Values
1. Click here ([Window] - [Numeric Monitor]).
2. The numeric monitor opens.
Select the displayed group
Connect/Disconnect the monitor (section 3.8, 3.10)
Pause the monitor (section 3.9)
Turn ON/OFF the link (section 3.9)
Turn ON/OFF the alarm display
General display settings
Chatacters used to idenfity channels (section 3.2)
Display the channel No.,
tag No., or tag comment
Display the bar representing
the current measured value
General Display Settings
The parameters in the [General Display Settings] dialog box related to the numeric display are
as follows:
• Turn ON/OFF waveform display
• Registering the channel
• Setting the displayed range: The bar representing the current measured value is displayed
For details related to the setting procedures, see “General Display Settings” in section 3.2,
“Displaying the Trend.”
Turn ON/OFF the Alarm Display
The alarm conditions of alarms 1 to 4 are displayed on the screen by clicking the alarm display
icon or selecting [View] - [Alarm] and turning ON the alarm display. When an alarm is in effect,
the indicator is red. When it is not, the indicator is green. If the alarm is not set, the indicator is
black.
Setting the Window
For details, see “Setting the Window” in section 3.2, “Displaying the Trend.”
Note
For the numeric display of abnormal data, see page 3-12.
Alarm display (Displays the
conditions of alarm 1, 2, 3,
and 4 from the left)
Display the current measured
value numerically
by normalizing it to the minimum and maximum values of the
scale.
3-16
Page 43

3.5 Displaying the Meter
Displaying the Meter
1. Click here ([Window] - [Meter Monitor]).
2. The meter monitor opens.
Connect/Disconnect the monitor (section 3.8, 3.10)
Select the displayed group
Pause the monitor (section 3.9)
Turn ON/OFF the link (section 3.9)
Turn ON/OFF the alarm display
General display settings
Chatacters used to idenfity channels (section 3.2)
meter
Display the current
measured value numerically
Display the meter representing
the current measured value
ThermometerAnalog
Alarm display (Displays the conditions
of alarm 1, 2, 3, and 4 from the left)
3
Using the Data Monitor
Display the channel No.,
tag No., or tag comment
Bar meter
Note
For the numeric display of abnormal data, see page 3-12.
3-17
Page 44

3.5 Displaying the Meter
General Display Settings
The parameters in the [General Display Settings] dialog box related to the meter display are as
follows:
• Turn ON/OFF waveform display
• Registering the channel
• Meter type: Select the meter from bar meter, analog meter, and
• Setting the displayed range: The minimum and maximum values of the scale become the
For details related to the setting procedures, see “General Display Settings” in section 3.2,
“Displaying the Trend.”
Selecting the meter type
thermometer.
lower and upper limits of the meter scale.
Bar meter
Analog meter
Thermometer
Turn ON/OFF the Alarm Display
For details, see section 3.4, “Displaying Numeric Values.”
Setting the Window
For details, see “Setting the Window” in section 3.2, “Displaying the Trend.”
Click one
3-18
Page 45

3.6 Displaying Alarms
Displaying Alarms
1. Click here ([Window] - [Alarm Monitor]).
2. The alarm monitor opens.
Connect/Disconnect the monitor (section 3.8, 3.10)
Pause the monitor (section 3.9)
Turn ON/OFF the link (section 3.9)
General display settings (section 3.2)
Chatacters used to idenfity channels (section 3.2)
3
Using the Data Monitor
Display the cursor’s value
Overview display
General Display Settings
The parameters in the [General Display Settings] dialog box related to the alarm display are as
follows:
• Turn ON/OFF waveform display
• Registering the channel
• Group Name
For details related to the setting procedures, see “General Display Settings” in section 3.2,
“Displaying the Trend.”
Select the information
to be displayed
Click here to stop the alarm sound
and terminate the alarm confirmation
3-19
Page 46

3.6 Displaying Alarms
Turn ON/OFF the Alarm Sound
An alarm sound can be generated when an alarm occurs. To stop the alarm sound, confirm all
alarms by clicking all groups in which alarms are occurring or select [View] - [Alarm Hold Reset].
Note
• Only one alarm monitor can be displayed for one connection. If you displayed multiple alarm monitors,
select [File] - [Connect] to reconnect to the host. For details related to the connection, see section 3.7.
• To use the alarm sound, a sound source (sound card) must be installed on the PC.
Selecting the Information to be Displayed
Click for the overview display
Click for the alarm log display
Alarm log display
3-20
Trend screen
Cursor displayed at the alarm occurring location
Overview and log
The following two types of alarm displays are available:
• Overview
The following four types of lamps are used to display the alarm conditions within the group:
• Green lamp: No alarms are occurring.
• Red lamp: An alarm is occurring.
• Green lamp and blinking ring: No alarms are occurring, but there are alarms that have
occurred in the past that have not been confirmed.
• Red lamp and blinking ring: An alarm is occurring. In addition, there are alarms that
have occurred in the past that have not been confirmed.
Note
By displaying the overview and clicking the group in which the alarm is occurring, the alarm can be
confirmed. You can also confirm alarms by selecting [View] - [Alarm Hold Reset]. The blinking ring
disappears when a confirmation is made.
Page 47

• Alarm log
Displays a list of the type, the time of occurrence and release, and the channel of the alarms
that occurred in the past. A maximum of 100 alarm logs can be displayed.
The symbols used in the alarm log are as follows:
: Upper limit alarm
: Lower limit alarm
: Delay upper limit alarm
: Delay lower limit alarm
: Difference upper limit alarm (red)
: Difference lower limit alarm (blue)
: Upper limit on rate-of-change alarm
: Lower limit on rate-of-change alarm
The following operations are possible on the alarm log display when the monitor is paused.
• If an item is clicked, the cursor on the trend screen or the color graph screen will move to
the corresponding time.
• Scroll the displayed items
Displaying Cursor’s Values and Setting the Window
For details, see “Displaying Cursor’s Values” and “Setting the Window” in section 3.2,
“Displaying the Trend.”
3.6 Displaying Alarms
3
Using the Data Monitor
3-21
Page 48

3.7 Circular Display
Circular Display
1. Click here ([Window] - [Circular Monitor]).
Connect/Disconnect the monitor (section 3.8, 3.10)
Select the displayed group
Pause the monitor (section 3.9)
Turn ON/OFF the link (section 3.9)
Turn ON/OFF the alarm display
Set general display settings
The red bar blinks when an alarm occurs
Characters used to identify channels
2. The circular monitor opens.
Zoom in or zoom out of the time axis
Set the Y-axis
Display the cursor’s value
Waveform label
(Select channel No.
or tag)
Mark the active
waveform
Zone display area
Date
Cursor
General Display Settings
The parameters in the [General Display Settings] dialog box that are different between the
circular display and the trend display (section 3.2) are as follows:
Trip line
The trip lines on the circular screen cannot be dragged and dropped.
You can change the position of the trip lines by changing the values in the [General Display
Settings] dialog box.
Absolute or
relative time
Move the waveform
display position (scroll bar)
Grid brightness
adjustment knob
Turn ON/OFF circular
display
Brightness adjustment
knob of the waveform
display area
Show/Hide zone
display area
Displayed time per cycle
Alarm display
3-22
Page 49

Setting the Time Axis
Selecting absolute or relative time display
3.7 Circular Display
1. Click here ([Time-Axis]).
Note
The number of displayed data points for a single waveform is 1800. The time over which the measured
data can be monitored on the circular screen depends on the scan interval and the step value (page 3-
24).
Setting the Y-axis
Waveform display limit
The circular screen always displays the waveform that is limited to the values between the
maximum and minimum values of the Y-axis display range. The range is set using [Scale] in
the [General Display Settings] dialog box.
Alarm Display
You can select whether to display the alarm on the inside or the outside of the waveform display
section of the circular screen.
2. Select the displayed time per cycle.
Select [View] - [Alarm Inside] or [Alarm Outside]
3
Using the Data Monitor
Alarm Inside
Alarm Outside
3-23
Page 50

3.8 Connecting Communications between the Data
Monitor and the DAQ Desktop
Connecting Communications
1. Select [File] - [New] from the menu bar. A trend monitor screen without data is displayed.
2. Select [File] - [Connect] or [Configuration] from the menu bar. The [Connect] dialog box
opens.
3. Enter search conditions.
4. Click either one.
Connection Conditions
Specify the following four items of the DAQ Desktop you wish to connect: Up to 16 DAQ
Desktops can be connected. The maximum number of connections is 16.
• Host Name: The host name or IP address of the PC that is running the DAQ Desktop that is
to be connected.
• Port No.: The port number to be used. The default value is 50279 (The number can be
confirmed using Port No. as described in section 2.7).
• System No.: The number assigned by the DAQ Desktop to the mounted RD-MV100/RD-
MV200. (The number can be confirmed using Property - System No. as
described in section 2.6.)
• Step: Set the step value used to acquire data points from the host. For example, a
value of 1 will result in every data point being acquired, a value of 2 will acquire
every other data point, a value of 3 acquires every third data point, and so on.
The default value is 1.
If the connection conditions are already specified, selecting [File] - [Connect] will connect the
communications between the Data Monitor and the DAQ Desktop.
3-24
Connecting
Clicking the [Connect] button connects the communications between the Data Monitor and the
DAQ Desktop. Clicking the [OK] button activates the specified information and closes the dialog
box (not connected, yet). Clicking the [Cancel] button discards the specified information and
closes the dialog box.
Note
• If the Data Viewer is launched by double-clicking the MONITOR icon of the RD-MV folder, the
communications between the Data Monitor and the DAQ Desktop are automatically connected.
• The port number must match the port number that was specified in the DAQ Desktop.
• Depending on the line condition, the connection may be stopped. In that case, reconnect to the host.
• If you clicked the [OK] button, you can click the [Connect/Disconnect] icon on the toolbar or select [File]
- [Connect] to connect to the DAQ Desktop.
Page 51

3.8 Connecting Communications between the Data Monitor and the DAQ Desktop
Saving the Connection Conditions
Select [File] - [Save As] or [Save]. The [Save As] dialog box opens. Specify the file name and
the destination directory and click the [Save] button.
Note
• If the data monitor is started (connected) by double-clicking the MONITOR icon in the RD-MV folder
and you select [File] - [Save], the [Save As] dialog box does not appear and the file is saved to the
following location:
DAQEXPLORER-desktops-DAQStation folder - RD-MV icon name
The file extension is [rmt].
In addition, at the time of reconnection, the conditions saved using [File] - [Save] (such as the type of
displayed monitor and cascaded windows) are used to start the data monitor.
3
Using the Data Monitor
Connecting Using the Preexisting Connection Conditions
The following methods can be used to connect to the DAQ Desktop:
• Communication that is deactivated is resumed by clicking the connect icon on the toolbar or
selecting [File] - [Connect].
• Select [File] - [Open] and specify the file in the [Open] dialog box to connect.
3-25
Page 52

3.9 Pausing the Monitor and Turning ON/OFF the
Link
Pausing the Monitor
Click here ([File] - [Pause]).
The display data are continuously acquired even when the monitor is paused. Thus, when the
monitor is restarted, the measured values acquired while the monitor was paused are also
displayed.
The monitors that pause are those on the same connection as the active window.
Turn ON/OFF the Link
Click here ([File] - [Link]).
You can specify whether or not to link the group display operation of the data monitor (trend
monitor, color graphics monitor, numeric monitor, meter monitor, and circular monitor) of the
same connection.
When the link is turned ON and the displayed group is changed in one Data Monitor, the
displayed groups in all monitors that have the link turned ON also change.
Note
• As default, all monitor links are turned ON.
• There is no link setting for the alarm monitor, because it displays all groups.
3-26
Page 53

3.10 Stopping Communications between the Data
Monitor and DAQ Desktop and Exiting the Data
Monitor
Disconnecting from the DAQ Desktop
Click here ([File] - [Disconnect]).
When you attempt to disconnect, a message, “Communication in progress. Cancel
communications?” is displayed. Clicking the [OK] button stops communication with the active
data monitor.
The communication is resumed by clicking the connect icon on the toolbar or selecting [File] -
[Connect].
Exiting the Data Monitor
After stopping communications, select [File] - [Exit] or click the [×] button to exit the Data
Monitor.
If you attempt to exit while the communication is active, a message, “Communication in
progress. Cancel all communications?” is displayed. Clicking the [OK] button stops
communication with the active data monitor. Then, carry out the exit operation again.
Note
[File] - [Connect] of the menu bar switches to [File] - [Disconnect] when the connection is activated.
3
Using the Data Monitor
3-27
Page 54

Chapter 4 Displaying Data with the Data Viewer
4.1 Starting and Exiting the Data Viewer
Starting the Data Viewer
RD-MV folder
1. Double-click the file icon.
2. The data viewer opens.
4
Displaying Data with the Data Viewer
Open a file
Save display conditions
(section 4.8)
Section 4.9
Information about the loaded file
Display waveforms (section 4.2)
Display values (section 4.4)
Display circular(section 4.3)
Display alarm/mark(section 4.6)
Display numveric cursor values (section 4.2)
Display computed result (section 4.2)
Display version information
of the Data Viewer
Menu bar
Toolbar
Search bar
Trigger mark
Status bar
You can also start the program by selecting [Start] - [Programs] - [DAQEXPLORER] - [Viewer].
In addition, you can start the program from the desktop.
You can start multiple Data Viewers by starting the program from the Start menu.
4-1
Page 55

4.1 Starting and Exiting the Data Viewer
Files that launch the Data Viewer
The Data Viewer starts by opening the following three types of files:
: Display data file (*.dds)
•
•
: Event data file (*.dev)
•
: TLOG file (*.dtg)
•
: Link setting file (*.ldx)
Toolbar, search bar, and status bar
Clicking [View] - [Toolbar], [Search Bar], or [Status Bar] from the menu bar displays the
corresponding bar in the window. The bar will disappear if the check is removed.
Opening the File by Specifying its Location
1. Click here ([File] - [Open]).
2. The [Open] dialog box opens.
3. Select the desired file
and click the [Open]
button.
Supplementary Info. tab
Batch Info. tab
Information about the selected file
You can open a file by specifying the location. You cannot specify the internal memory or the
external storage medium of the RD-MV100/RD-MV200.
4-2
Page 56

4.1 Starting and Exiting the Data Viewer
Checking the information about the loaded file
You can check the information about the active data file by selecting [Information] - [About
Document].
• For waveform data files and event data files
• For TLOG files
4
Displaying Data with the Data Viewer
The items that are checked are output in the header when printed.
Note
• Multiple files can be opened simultaneously.
• The number of files that can be opened simultaneously depends on the memory size of the PC and the
free disk space.
Exiting the Data Viewer
Select [File] - [Exit] or click the [×] button. If you changed the settings in any of the windows, a
message “Save changes to ****.***?” is displayed. Click the [Yes] button, if you wish to save the
settings and exit the Data Viewer. Click the [No] button, if you do not wish to save the settings
and exit the Data Viewer.
4-3
Page 57

4.2 Displaying the Waveform
Displaying the Waveform
1. Click here ([Window] - [Graph]).
Group selection tab (click the tab of the group you wish to display)
Mark on the active waveform
Zone display area
Show/Hide the zone
display area
Waveform label
(Select channel No.
or tag)
Indicates the section of the waveform
that is being displayed in a white frame
2. The waveform display screen opens.
Display the alarm/mark list
Display the cursor value
Link the previous file
Link the next file
Color overview
Color display adjuster
(turn ON/OFF the
color overview display)
Waveform
Date
Drag this bar to change the
size of the zone display area
Turn ON/OFF waveform display
display area
Trip line of the active
waveform
Alarm display area
Magnification
Move the waveform display position
(Scroll bar)
Absolute or relative time
4-4
Page 58

Color overview display
The measured values of the entire data are displayed using various colors. By assigning 50
different colors from the minimum to the maximum values of the scale, the measured values are
assigned to those colors.
If the data are display data, the maximum value is displayed at the top of the space allocated to
a single waveform, and the minimmum value is displayed at the bottom.
If you click or drag the cursor on the color overview display area, the section of the waveform is
displayed in the waveform display area.
Note
The color overview is turned OFF as default.
General Display Settings
4.2 Displaying the Waveform
Displays marks and cursors
Displays the waveforms that
have the display turned ON
4
Displaying Data with the Data Viewer
1. Click here ([View] - [General Display Settings]).
2. The [General Display Settings]
dialog box opens.
Set the maximum and minimum values of the measured
data the maximum and minimum values of the scale.
For details related to the setting procedures, see “General Display Settings” in section 3.2,
“Displaying the Trend.”
4-5
Page 59

4.2 Displaying the Waveform
Setting the Time Axis
Selecting absolute or relative time display
Zoom in or zoom out on the time axis
By selecting [Time Axis] - [All], the time axis is adjusted so that all the data can be displayed. If
you wish to zoom in or out by specifying the zoom rate, take the following steps (resolution is 1/
1000 to 20):
Select [Time Axis] - [Absolute Time] or [Relative Time].
Click either one
1. Select [Time Axis] - [Set Scale].
2. The [Time Axis Scale]
dialog box opens.
Setting the Y-axis
Selecting the waveform display zone
For zone setting examples and the edit zone operation, see section 3.2, “Displaying the Trend.”
Waveform Display Limit
See “Waveform display limit (clip)” in section 3.2.
Turn ON/OFF the Alarm Display
2. The alarm conditions of alarm 1 to 4 are displayed in the alarm display area.
For details related to the alarm display, see “Turning ON/OFF the Alarm Display” in section
3.2, “Displaying the Trend.”
3. After entering the zoom rate,
click the [OK] button.
Click one
1. Click here.
4-6
Page 60

Selecting the Characters Used to Identify Channels
You can select the channel No. or tag as the character string used to identify the channels by
selecting [View] - [Channel No.] or [Tag]. The selected character string will be used as a label
to indicate the waveform name.
The character string is registered on the RD-MV100/RD-MV200 or by using the Configurator.
Note
• When the identification string is switched, the channel character string displayed on the Y-axis of the
waveform display window, circular display window, numeric window, list display window, [Cursor Value]
window, [Computed Result] window, [General Display Setting] window, and data conversion dialog box
will change accordingly.
• Both the channel No. and tag are used in the output result of the data conversion.
Showing/Hiding Cursors
Showing the cursor
1. Point the cursor on the screen (Cursor A)
4.2 Displaying the Waveform
4
Displaying Data with the Data Viewer
2. Drag the cursor
(Cursor B).
By selecting [Edit] - [Select All], Cursor A and Cursor B moves to the beginning and the end of
the data, respectively.
Hiding the cursor
Select [View] - [Hide Cursor].
Copying the data to the clipboard
Click here ([Edit] - [Copy]).
On the numerical window and list display window (section 4.6), you can copy the data between
Cursor A and Cursor B to the Windows clipboard. On the waveform display window and circular
display window, the displayed image can be copied to the clipboard.
Note
• The maximum number of data points that can be copied to the clipboard is 1000.
• The channels that are copied to the clipboard are those that are registered in the selected group with
the waveform display turned ON.
• When the display mode of the time axis is set to absolute time, the absolute time is output. If it is set to
relative time, the relative time from the first data point is output.
• Contents that have been copied to the clipboard can be pasted to other applications for use.
4-7
Page 61
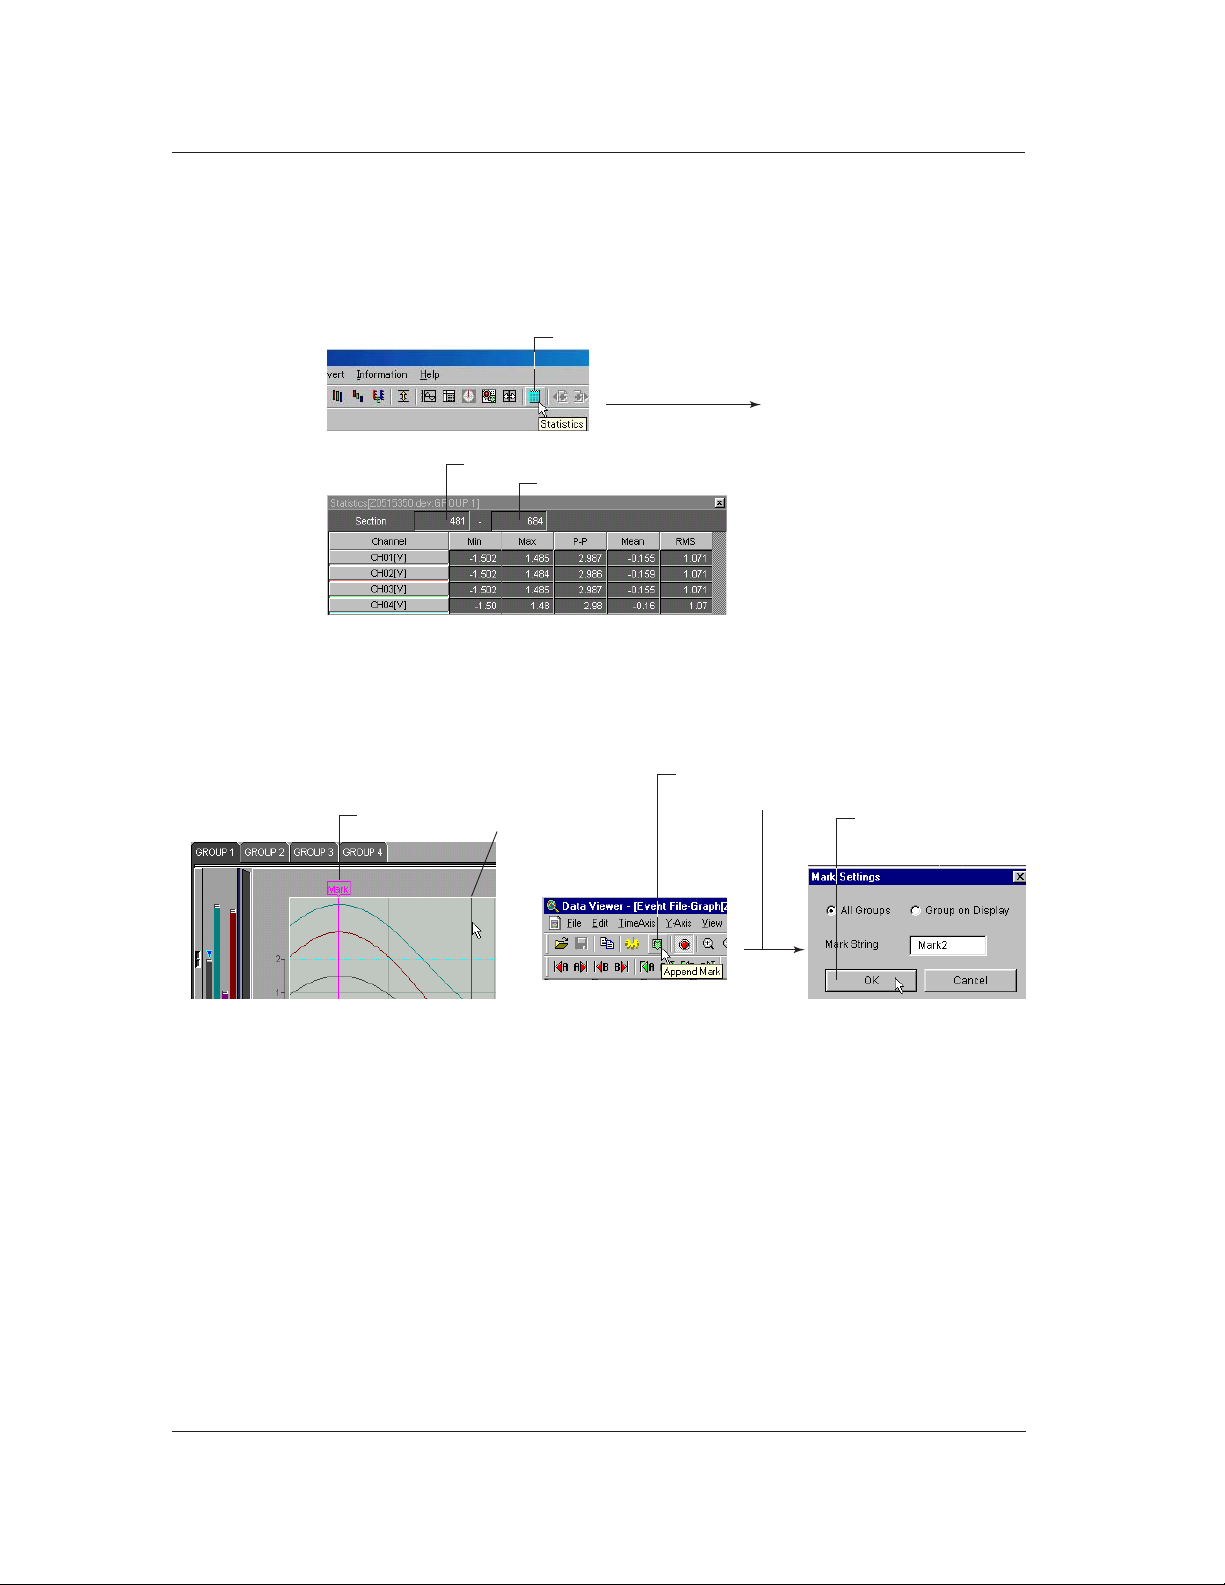
4.2 Displaying the Waveform
Displaying Cursor’s Values
Clicking the control icon or selecting [Window] - [Control] displays the [Control] dialog box.
For details related to [Control] dialog box, see “Displaying cursor’s values” in section 3.2,
“Displaying the Trend.”
Displaying Statistics
1. Click here.
2. The statistics display screen opens.
The minimum value, maximum value, P-P, mean, and rms value for each waveform in the range
specified by Cursors A and B are computed and displayed. If the cursor is not displayed, the
computation is performed over the entire data.
Adding Arbitrary Marks
Arbitrary mark
When Cursor A and Cursor B are at the same position, arbitrary marks can be placed. You can
select whether to put the arbitrary marks on all groups or only on the displayed group. In
addition, double-clicking a mark, that has been created using the Data Viewer, opens the [Mark]
dialog box in which you can change the displayed group and the mark name.
The first data number of the computed region (Cursor A)
The last data number of the computed region (Cursor B)
2. Click here ([View] - [Append Mark]).
3. The [Mark Settings] dialog box opens.
1. Point the cursor.
4. After entering the
string, click the [OK]
button.
4-8
Page 62

Searching the Alarm Transition Point and Mark Position
Search the alarm transition point
Click one
Searching the alarm transition point
Moves Cursor A or Cursor B to the alarm transition point (the point at which the alarm occurred
and the point at which the alarm was released) of the active channel.
Searching is possible to the left and right of the cursor.
Searching the mark position
Moves Cursor A or Cursor B to the mark position (arbitrary mark or trigger mark) of the active
channel.
Searching is possible to the left and right of the cursor.
Note
• The searching function cannot be used, if the cursor is not displayed.
• The search function cannot be used, if there are no arbitrary marks or when the alarm display is OFF.
4.2 Displaying the Waveform
Search the mark position
Click one
4
Displaying Data with the Data Viewer
Deleting Marks
The arbitrary marks (green/yellow) and trigger marks (yellow) between Cursor A and Cursor B
are deleted.
Note
Resetting Marks
All arbitrary marks created on the Data Viewer are erased by selecting [Edit] - [Reset Mark].
The marks (messages) and the trigger point that were created on the RD-MV100/RD-MV200
but deleted on the Data Viewer are displayed again.
1. Place Cursor A and Cursor B so that
the mark is between the two.
2. Select [Edit] - [Delete Mark].
• The arbitrary marks placed on the Data Viewer are green. The arbitrary marks (messages) and trigger
points placed on the RD-MV100/RD-MV200 are yellow.
• Up to 16 characters can be used for a mark name.
4-9
Page 63

4.2 Displaying the Waveform
Setting the Window
Select how to sort the windows
Select the windows to be displayed
4-10
Page 64

4.3 Circular Display
Circular Display
Group selection tab (click the tab of the group you wish to display)
Mark on the active waveform
Zone display area
Show/Hide the zone display area
1. Click here ([Window] - [Circular]).
2. The circular display screen opens.
Display the cursor value
Waveform label
(Select channel No.
or tag)
Select the active
waveform
Alarm display area
4
Displaying Data with the Data Viewer
Drag this bar to change the
Date
size of the zone display area
Turn ON/OFF waveform display
General Display Settings
For details related to the setting procedures, see “General Display Settings” in section 3.7,
“Circular Display.”
Trip line of the active
waveform
Displayed time per cycle
Circular display area
Absolute or relative time
Move the waveform display position
(Scroll bar)
4-11
Page 65

4.3 Circular Display
Setting the Time Axis
Selecting absolute or relative time display and zooming in or zooming out on the time axis
See section 4.2, “Displaying the Waveform.”
Selecting the displayed time
Setting the Y-axis
Waveform display limit
See section 3.7, “Circular Display.”
Turning ON/OFF the Alarm Display
For details on the alarm display, see Alarm Display in section 3.7, “Circular Display.”
Select the displayed time per cycle
Select the [Zoom In] or [Zoom Out]
4-12
Page 66

4.4 Displaying Numeric Values
Displaying Numeric Values
1. Click here ([Window] - [Sheet]).
2. The numeric display screen opens.
Open a file (section 4.1)
Group selection tab (click the tab of the group you wish to display)
Save display conditions (section 4.8)
Copy to clipboard (section 4.2)
General display settings
Section 4.2
Turn ON/OFF the alarm display
Absolute or relative time
Waveform label (select channel No. or tag)
4
Displaying Data with the Data Viewer
Mark on the active waveform
Click here to make the waveform active
Scroll the screen
(left and right)
Mark (arbitrary mark or trigger mark)
Alarm display (Displays the conditions of
alarm 1, 2, 3, and 4 from the left)
General Display Settings of the Numeric Display
Clicking the General Display Settings icon or selecting [View] -[General Display Settings] opens
the [General Display Settings] dialog box. Of the parameters in the [General Display Settings]
dialog box, those that relate to the numeric display are as follows:
• Turn ON/OFF numeric value display
• Registering the channel
For details related to the setting procedures, see “General Display Settings” in section 3.2,
“Displaying the Trend.”
Setting the Time Axis
Select [View] - [Absolute Time] or [Relative Time]. Then, select the time display format using
[Format].
Turn ON/OFF the Alarm Display
The alarm conditions of alarms 1 to 4 are displayed on the screen by clicking the alarm display
icon or selecting [View] - [Alarm] and turning ON the alarm display. When an alarm is in effect,
the indicator is red. When it is not, the indicator is green.
Scroll the screen
(up and down)
4-13
Page 67

4.4 Displaying Numeric Values
Selecting the Characters Used to Identify Channels
For details, see “Selecting the Characters Used to Identify Channels” in section 4.2, “Displaying
the Waveform.”
Showing/Hiding Cursors
Showing the cursor
1. Point the cursor (Cursor A)
2. Drag the cursor (Cursor B).
By selecting [Edit] - [Select All], Cursor A and Cursor B moves to the beginning and the end of
the data, respectively.
Showing the cursor value, displaying statistics and hiding the cursor
For details, see “Displaying Cursor’s values,” “Hiding the Cursor,” “Displaying Statistics” in
section 4.2, “Displaying the Waveform.”
Adding Arbitrary Marks, Deleting Marks, and Resetting Marks
For details, see “Adding Arbitrary Marks,” “Deleting Marks,” and “Resetting Marks” in section
4.2, “Displaying the Waveform.”
4-14
Page 68

4.5 Linking Files and Saving the Link Settings File
Linking Files
You can link and display RD-MV100/RD-MV200 files that have been divided by the auto save
function, power failures, or other means (factors).
The files that can be linked are those that exist in the same directory. There are two methods to
link files, from the toolbar and from the menu bar.
1. Click here ([File] - [Open]).
2. The [Open]
dialog box opens.
3. Select the initial file.
4. Click here to open the
file.
4
Displaying Data with the Data Viewer
From the toolbar
5. Click either button
Link next file
Link previous file
4-15
Page 69

4.5 Linking Files and Saving the Link Settings File
From the menu bar
8. Select [Prev](previous file) or [Next](next file).
7. Click here(display files for linking).
10. Displays the linked files in a different color.
5. Click here([Window]-[Link]).
6. The [Link] dialog box opens.
9. Displays the linked files.
Saving the Link Settings File
Select [File] - [Save Display Setting As] to save the link settings file to the same directory as the
linked files.
The file name takes the form of the original file name with the file extension .ldx.
You can save the file by specifying the file name and the destination directory by selecting [File]
- [Save Display Setting].
The file extension .ldx is appended to the original file name
4-16
Page 70

4.6 Listing Alarms and Marks and Converting the
List
A list of alarms and marks is displayed with the display file or event file opened.
1. Click here([Window]-[Alarm/Mark]).
2. The [Display File List]
dialog box opens.
3. Click here([Alarm List]).
Label
3. Click here([Mark List])
Click a label to sort using the label. The first click will sort the list in the ascending order; the
second click will sort the list in the descending order.
Pointer
Cursor
Mark created on the viewer
Mark created on the RD-MV
Trigger mark
4
Displaying Data with the Data Viewer
Note
If you drag on the “Alarm List” display screen, a pointer is displayed. The cursor on the waveform display,
circular display, numerical display, and cursor value display are not synchronized to this pointer.
4-17
Page 71

4.6 Listing Alarms and Marks and Converting the List
Converting and outputting the alarm or mark list
The Alarm or Mark List can be converted to ASCII, Lotus, and Excel formats.
1. Click here([Convert]-[Alarm to] or [Mark to])
2. The [Alarm List] or [Mark List] dialog box opens.
3. Click here.
4. The [Save As] dialog box opens.
6. Click here.
Enter the file name.
5. Set the items and
click here.
Select one.
4-18
Page 72

4.7 Displaying the TLOG File
Displaying the TLOG File
RD-MV folder
Open a file (section 4.1)
Timer No. selection tab
Save display conditions (section 4.8)
Section 4.1
Section 4.9
File information (section 4.1)
4
Displaying Data with the Data Viewer
1. Double-click the TLOG file icon.
2. The file opens.
Waveform label (select channel No. or tag)
Data No.
Time display
Date display
Scroll the screen (left and right)
Turn ON/OFF flags ([View] - [Flags])
4-19
Page 73

4.7 Displaying the TLOG File
Turning ON/OFF Flags
When [View] - [Flags] is checked, the following status information is displayed:
: Stopped TLOG computation.
: The RD-MV time and date was changed during TLOG computation.
: Power failure occurred during TLOG computation.
Date/Time display
Select [View] - [Date Format] or [Time Format] to select the display format. If [None] is selected,
the date or time will not be displayed.
Data No.
When [View] - [Data No.] is checked, the data number is displayed.
Selecting the Characters Used to Identify Channels
For details, see “Selecting the Characters Used to Identify Channels” in section 4.2, “Displaying
the Waveform.”
4-20
Page 74

4.8 Saving the Display Settings
Click here ([File] - [Save Display Setting]).
The display settings can be saved to a file. The following display settings can be saved:
For display file, event file, and link file displays
• Print comment • The background and grid color of the
• Cursor A and Cursor B positions • Y-axis zone setting
• ON/OFF condition of the clipping of the • The active waveform
displayed waveform
• Settings specified in the General Display Settings • The height of the data overview of each
• Mark information • The width of the zone display area of
• Zoom rate of the time axis • Show/Hide condition of the zone display
• Display mode of the time axis (absolute/relative) • Selected group
• Waveform display area • ON/OFF condition of the alarm display
• The channel identification string mode (channel/tag)
• ON/OFF condition of file information items (see section 4.1)
waveform display area
group
each group
area
4
Displaying Data with the Data Viewer
For TLOG file display
• ON/OFF condition of TLOG file information items (see section 4.1) and print comment
• The string to be used (channel/tag)
• Timer No.
• Display format of date and time
The information is saved to the same directory as the data files. The name of the saved file is
the name of the data file being displayed, with an added [vdx] extension (Y1116040.DDS.vdx,
for example).
This display setting file can be overwritten unlimited number of times.
When the data with the same file name is reopened, the display settings that were saved are
used. If you do not wish to open the data using the saved settings, delete the display setting file
([vdx] extension) before opening the data file.
Note
When the data residing in the internal memory or the external storage medium of the RD-MV100/RD-
MV200 are being displayed, the display settings cannot be saved.
4-21
Page 75

4.9 Converting the Data
When waveform display or numeric display is open
3. Enter the conversion range.
Save destination and file name
4. Select either one.
The measured data can be converted to ASCII, Lotus, and Excel formats.
1. Select one.
2. The [Conversion Details] dialog box opens.
5. Change the save destination.
When displaying the TLOG File
3. Check the timer No. to be converted.
4. Change the save destination.
4-22
Page 76

4.9 Converting the Data
Start point and end point
Cursor A and Cursor B are used to set the start point and end point of the range, respectively. If
Cursor A and Cursor B are not specified or the cursors were erased, the data numbers of the
start and end points are automatically set to [0] and [total number of data points - 1],
respectively.
To convert all the data in the specified range, set the step number to 1.
Step
To convert all the data in the specified range, set the step number to 1.
Group/Channel
If you select [Group], enter the range of groups to be converted.
If you select [Channel], enter the range of channels to be converted.
Changing the save destination
Select the destination folder and
file and click the [OK] button
To change the destination folder or the name of the file containing the converted data, click the
[File] button. The [Change the file name] dialog box opens.
Note
• The default group is set to the number of the group that is currently being displayed. The default
channel is set to all channels.
• The name of the destination file is automatically set to the displayed file name followed by the
extension that identifies the data format. For ASCII, Lotus, and Excel conversions, the file extensions
[txt], [wrk] (can be loaded using version 2.0 or later, and [xls] (can be loaded by version 4.0 or later) are
attached, respectively.
• There is a limit in the number of data points that Lotus1-2-3 and Excel can handle. For these
programs, specify the number of data points to be converted before performing the conversion. Note
that even if the number of data points to be converted is within the limits, it still may not be possible to
load the data if there is not enough free memory available on the PC.
• Do not specify a floppy disk or an external storage medium as the save destination as it will take a long
time for the save operation.
• Do not specify the root directory as the save destination.
• Prepare enough free space on the destination disk.
4
Displaying Data with the Data Viewer
4-23
Page 77
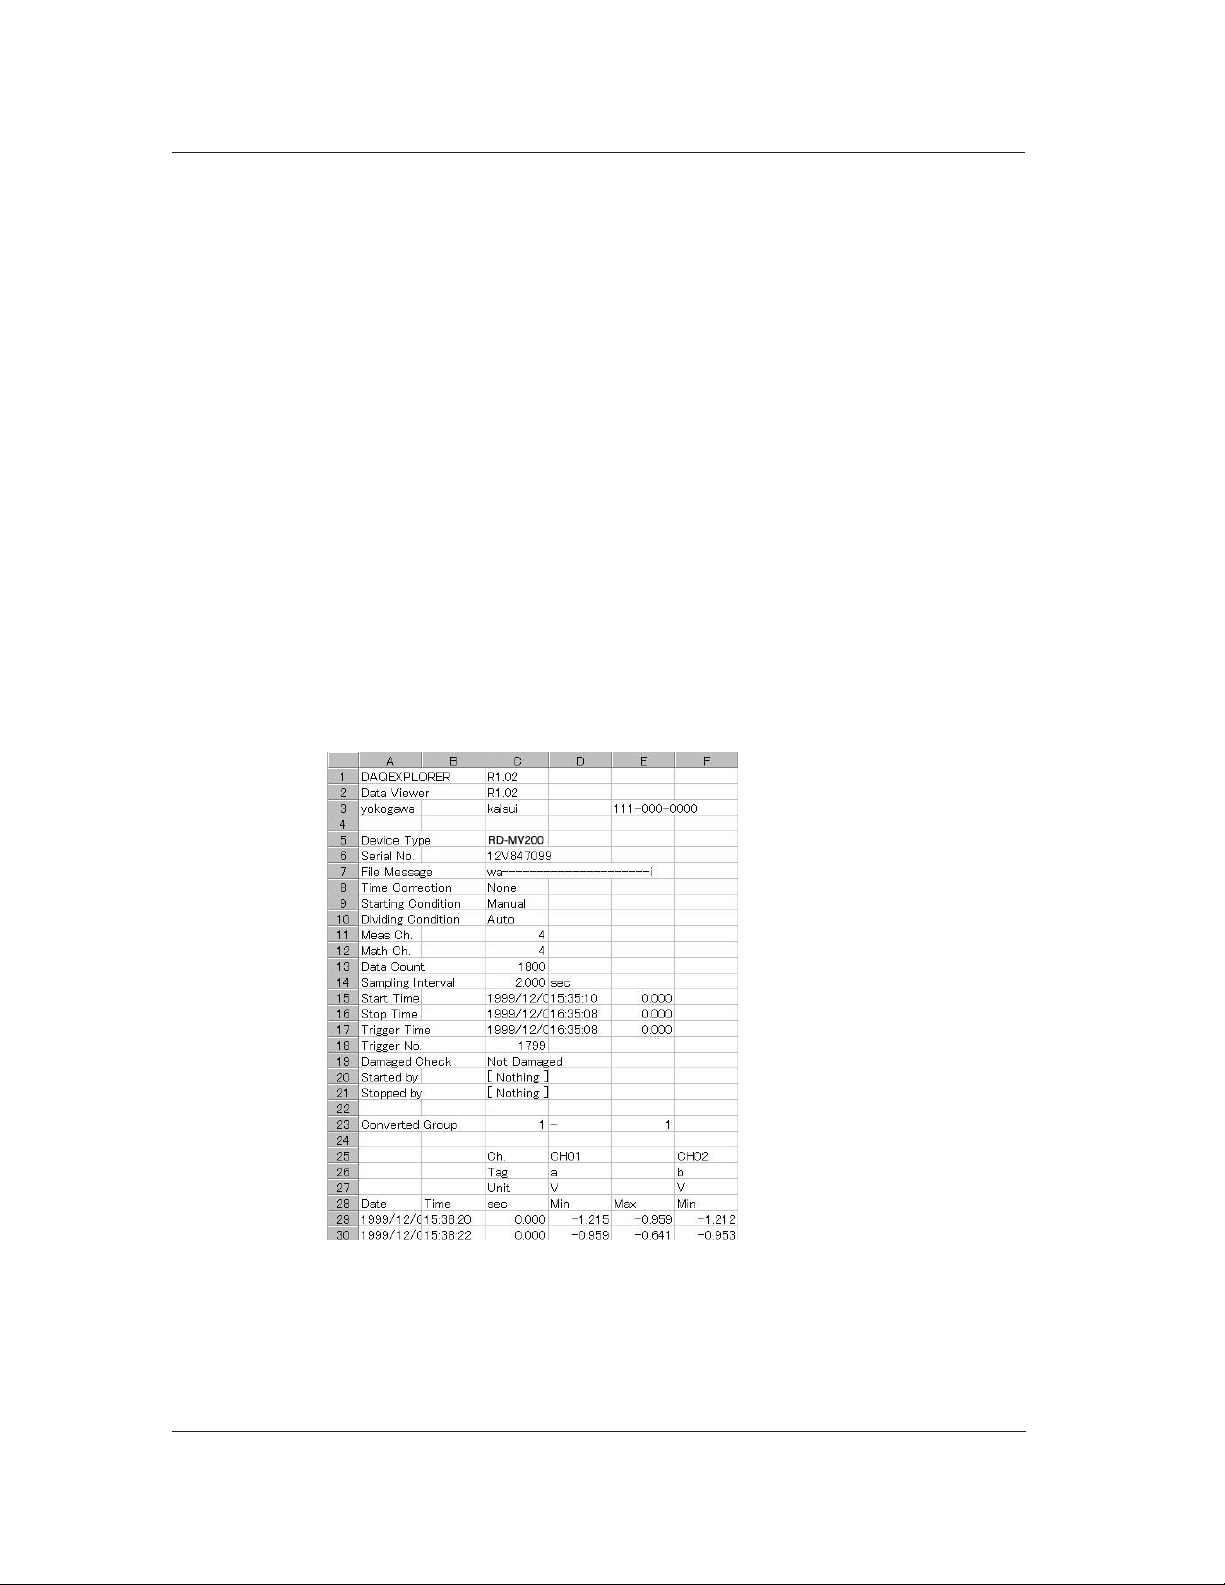
4.9 Converting the Data
Conversion Example
ASCII conversion file
"DAQEXPLORER","R1.02"
"Data Viewer","R1.02"
"","kawamura","111-00000-0000"
"Device Type","RD-MV200"
"Serial No.","12V636847 "
"File Message",""
"Time Correction","None"
"Starting Condition","Auto"
"Dividing Condition","Manual"
"Meas Ch.", 30
"Math Ch.", 1
"Data Count", 180
"Sampling Interval", 2.000,"sec"
"Start Time","1999/11/17","20:34:28", 0.000
"Stop Time","1999/11/17","20:40:26", 0.000
"Trigger Time","1999/11/17","20:40:26", 0.000
"Trigger No.", 179
"Damaged Check","Not Damaged"
"Started by","[ Key In ]"
"Stopped by","[ Comm In ]"
"Converted Group", 1,"-", 1
"Ch.","CH01","CH02","CH03","CH04","CH05","CH06","CH07","CH08","CH09","CH10"
"Tag","","","","","","","","","",""
"Unit","V","","","","V","V","V","V","V","V"
"Date","Time","sec","Min","Max","Min","Max","Min","Max","Min","Max","Min","Max","Min","Max",
"Min","Max","Min","Max","Min","Max","Min","Max"
"1999/11/17","20:34:28", 0.000, -0.506, -0.409, 66.39, 72.87, 122.38, 126.31,
122.46, 126.39, -0.498, -0.401, -0.496, -0.399, -0.495, -0.397, -0.493, -0.394, -
0.491, -0.392, -0.489, -0.390
Excel conversion file
4-24
Page 78
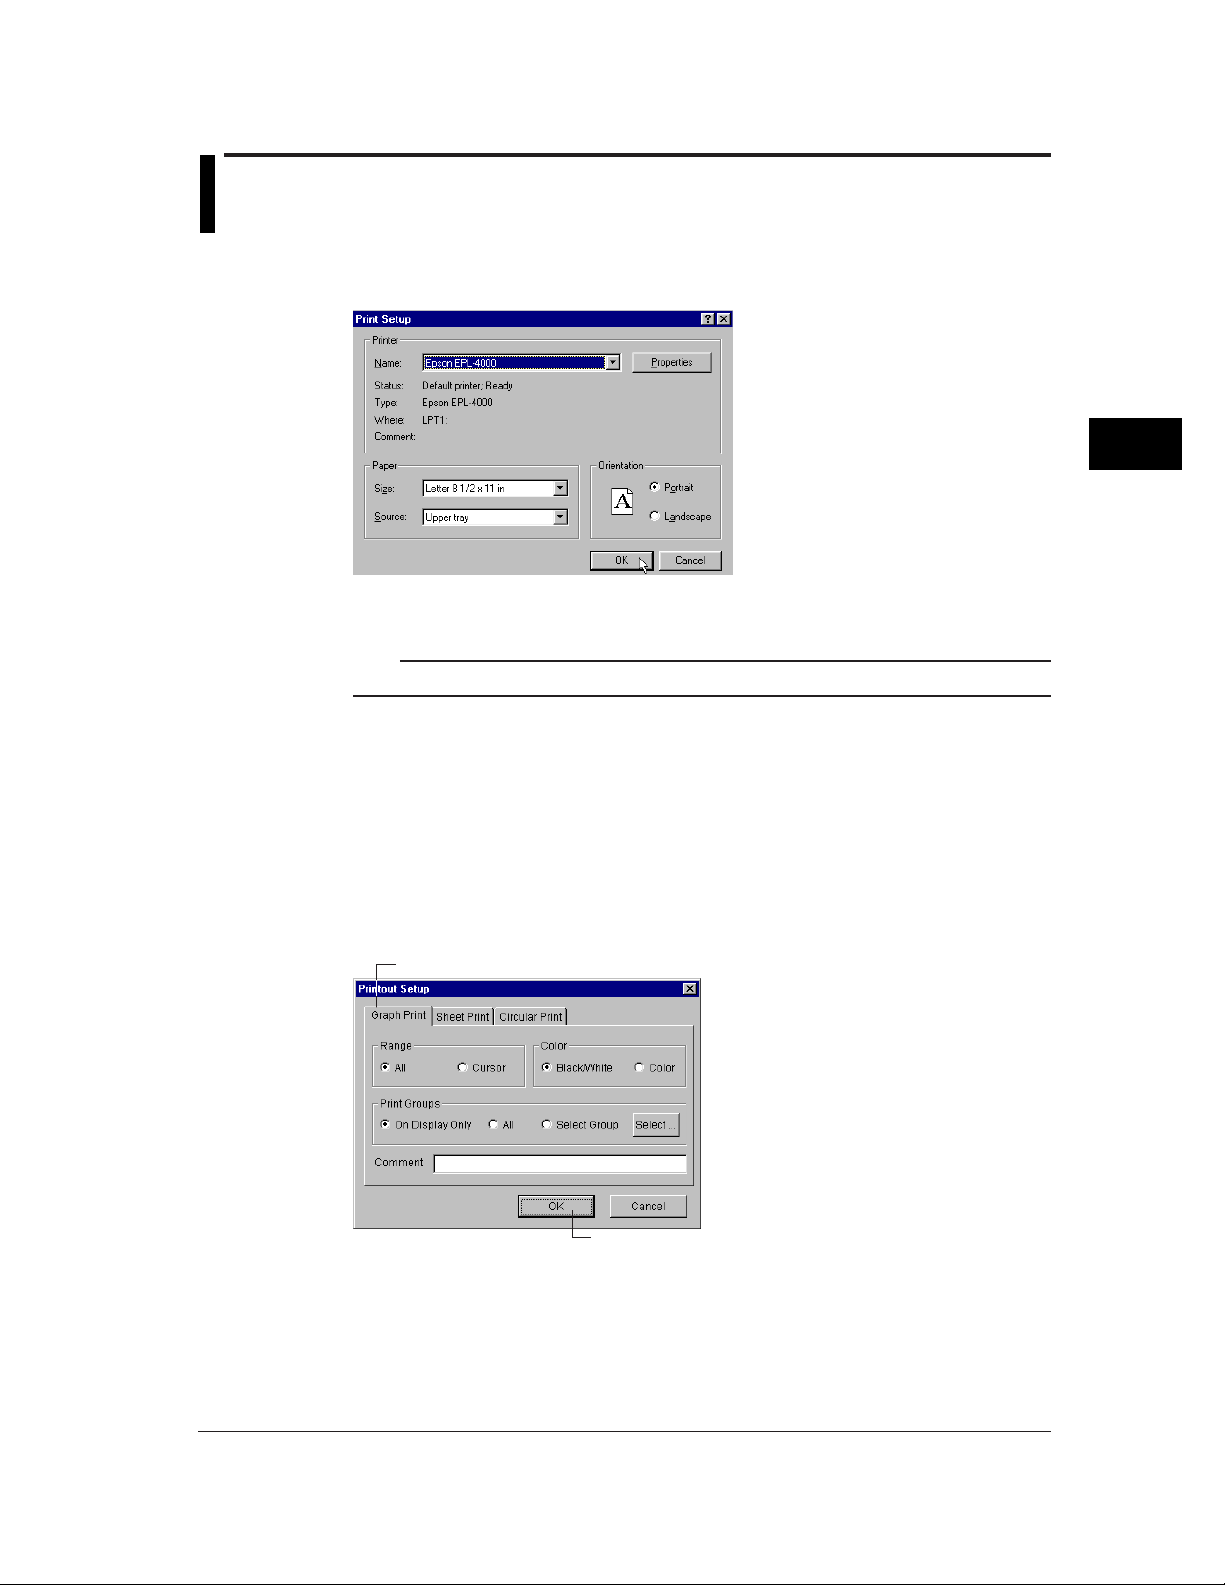
4.10Printing
Setting the Printer
1. Select [File] - [Print Setup].
2. Set the printer, paper and orientation.
Note
Set the printer according to the configuration of the system that you are using.
Specifying the Contents to be Printed (for Display Data File and Event Data File)
Specify the contents to be printed before executing the print. This is not necessary when
printing the TLOG file.
Select [File] - [Print Settings]. The [Printout Setup] dialog box opens. When the waveform is
displayed, printing is carried out according to the settings under the Graph Print tab of the
[Printout Setup] dialog box. If numeric values are displayed, printing is carried out according to
the settings under the Sheet Print tab.
4
Displaying Data with the Data Viewer
Setting graph print
Click this tab to set the graph print
Set the range, color, print group, and comment,
then click the [OK] button
4-25
Page 79

4.10 Printing
If you selected [Select Group], click the [Select] button. The [Select Groups] dialog box opens.
Select the groups to be printed. Click the [OK] button to close the dialog box.
Note
• The [Comment] can be entered or changed using [About Document] (see “Viewing the information of
the loaded file” page 4-3). When the print comment is entered or changed, it is reflected in the
comment of [About Document] dialog box.
• Up to 127 characters can be entered in the [Comment] entry box. However, the number of characters
that is actually printed is limited.
• When the cursor is not displayed,select the [All] button under [Range] in the [Printout Setup] dialogu
box.
Setting sheet print
Click this tab to set the sheet print
4-26
Select the range to be printed, and click the [OK] button
Setting circular print
Click this tab to set the circular print
Select the range to be printed, and click the [OK] button
For the operations that follows, see “Setting graph print.”
Page 80

Header
Print Preview
4.10 Printing
A header can be printed when printing the waveform or a TLOG file.
Of the items that are displayed in the file information dialog box ([Information] - [About
Document]), those that are checked are printed in the header section. For details related to the
file information, see section 4.1.
You can preview the print layout before actually printing the data.
Selecting [File] - [Print Preview] displays the print preview screen.
Printing
Note
• The preview screen will display the print image of the specified range.
• The file information is also displayed when previewing the graph. If the color overview, alarm, [Cursor
value] window, and [Statistics] window are displayed, these are also displayed on the preview screen
along with the graph
• For the print preview operation, see the instruction manual that came with your operating system.
1. Click here ([File] - [Print]).
2. The [Print] dialog box opens.
4
Displaying Data with the Data Viewer
Select the printer, print range, the number of copies,
and click the [OK] button
4-27
Page 81

Chapter 5 Configuring the DX100/DX200/MV100/MV200
5.1 Starting the Configurator
The following two types of files can be opened using the Configurator:
CONFIG file
This is the file located in the RD-MV folder. It allows a direct view of the setup data of the RD-
MV100/RD-MV200. Only one CONFIG file exists in one RD-MV folder.
You can change the setting on the Configurator, but the file cannot be saved.
Setup data file (*.PNL)
This is the file that is saved to the PC such as to the DAQ Desktop. You can change the
settings on the Configurator and save the file and create new setup data.
The Configurator can transmit and receive the setup data, change the setup data, and create
new setup data. It can configure the following style numbers of RD-MV.
RD-MV
RD-MV100
RD-MV200
Copying the Setup Data to the DAQ Desktop
You can copy the CONFIG file to the DAQ Desktop by dragging and dropping the CONFIG icon
of the RD-MV folder onto the DAQ Desktop.
The extension of the file that is copied becomes [PNL].
Style1 Style2 Style3
5
Configuring the DX100/DX200/MV100/MV200
5-1
Page 82

5.1 Starting the Configurator
Starting the Configurator
RD-MV folder
Print (section 5.10)
Data check (section 5.6)
1. Double-click here.
2. The RD-MV Configurator opens.
Display the version information of the Configurator
Menu bar
Toolbar
Scroll the screen (left and right)
Scroll the
screen
(up and down)
5-2
Page 83

Creating Setup Data by Configuring a New System
Batch function option is selectable when the style number
is greater than or equal to 2
5.1 Starting the Configurator
1. Douoble-click the CONFIG icon
on the desktop.
2. The [System Configuration] dialog box
opens.
3. Click the appropriate items
and click the [OK] button to open
the Configurator screen.
5
Configuring the DX100/DX200/MV100/MV200
Loading Preexisting Setup Data
You can specify the location where the setup data file is located and open the Configurator.
Select [File]-[New] to create
new setup data from the second time.
Create the setup data according to step 2 and 3.
1. Select [File]-[Open].
2. The [Open] dialog box opens.
Select a file with .pnl estension
and click here.
5-3
Page 84

5.2 Setting the Measurement Channels
Select this tab
Double-click to set the channel
Select the input mode Select the range/type
Difference computation
Scale
Square root
Select the reference for the difference
computation
Set the span
Enter the scale
Enter the display zone
Enter the scale unit
Enter the alarm value
Select the alarm type
Select the graph setting
Select the relay number
Enter the delay period
Enter the tag name
Select sampling count
Select the channel
display color
5-4
Initialize
Set the value to the
maximum value possible
Set the value to the
minimum value possible
Turn ON/OFF the partial expanded display
Page 85

Input Type (Mode and Range/Type)
Select from the list of choices from the pull-down menu.
Mode Relevant Settings
VOLT (voltage) Range, span L, and span U
TC (thermocouple) Type, span L, and span U
RTD (resistance temperature detector) Type, span L, and span U
DI (voltage level/contact input) Range, span L, and span U
SKIP (Measurement/Display OFF) None
Note
• When a value outside the range is entered or when the span L and span U values are set to the same
value, they are corrected when the data are checked.
• If SKIP is selected, settings such as Delta/Scale/Sqrt and Range/Type are discarded.
5.2 Setting the Measurement Channels
Difference Computation and Reference
Displays the difference between the input and the reference channel.
If difference computation is performed between channels that have different range and type
settings, the decimal position of the computed result is set to that of the channel computing the
difference. If the number of digits to the right of the decimal of the reference channel is greater
than that of the channel computing the difference, the reference value below the least significant
digit of the channel computing difference is rounded beforehand.
Display Span
Sets the upper and lower limits (full scale) of the display.
When the span L and span U values are set to the same value or when a value outside the
range is entered, they are corrected when the data are checked.
Scale
Scale L, scale U, and decimal point
Scale’s value is displayed by taking the range between scale L and scale U to be full scale.
Enter the upper and lower limit values to which you wish to convert the raw values. Include the
decimal point.
When the scale L and scale U values are set to the same value or when a value outside the
range is entered, they are corrected when the data are checked.
Unit
Enter the unit using up to six characters.
5
Configuring the DX100/DX200/MV100/MV200
Square Root
Computes and displays the square root of the input. This setting can be used only when the
input mode is set to VOLT (voltage). As necessary, set the span, scale, and unit.
5-5
Page 86

5.2 Setting the Measurement Channels
Alarm
Four alarms (Alarm 1 to 4) can be specified on each channel.
Type
Select H, L, h, l, R, T or t. T or t is selectable when the style number is greater than or equal to
2. The selectable alarms vary depending on the input mode and computation type. For details,
see section 6.2 in the User's Manual M-3641 or M-3642.
Alarm value
Alarm is generated using the specified value as the boundary. The selectable range of alarm
values vary depending on the input mode and range.
Alarm delay
Alarm is generated when the measured value stays above or below the specified alarm value
for the specified time (delay period).
Relay
To output relays, select the output relay number. Otherwise, select [NONE].
Input Filter and Moving Average
Moving average can be specified on models RD-MV106, RD-MV112, RD-MV210, RD-MV220,
and RD-MV230.
Input filter can be specified on models RD-MV102, RD-MV104, RD-MV204, and RD-MV208.
Tag
Display Zone
Input filter
To use the input filter, select the time constant (2 s, 5 s, or 10 s).
Moving average
To use the moving average, select the sampling count (2 to 16).
Up to 16 characters can be entered for the tag.
You can use the tag name instead of the channel name to be displayed on the screen.
The [Setup] screen is used to select whether to display the channel name or the tag name on
the screen.
If tag is selected in the [Setup] screen, you will be able to select tag No., tag comment, or tag in
the Data Monitor or Data Viewer.
You can select the range of the screen in which the waveform of each channel is to be
displayed.
Specify positions (%) on the display scale for the upper and lower limits.
The conditions for setting the zones are as follows:
• Range: 0% to 100%
The lower limit must be less than the upper limit
• The difference between the lower and upper limits is at least 5%.
5-6
Page 87

Graph OR M-
5.2 Setting the Measurement Channels
Divisions
Select the number of bar graph divisions.
Bar graph
Select the reference position of the bar graph. Selecting [Center] when the bar graph is vertical
produces no effect.
It is set back to [Normal] when the data are checked.
Scale
When using scale display on the trend screen, select the position to display the scale.
For details related to divisions, bar graph, and scale, see section 7.10 in the RD-MV100/RD-
MV200 User’s Manual.
Partial Expanded Display
Position (%)
Set the boundary for the partial expanded display. The range is from 1 to 99%.
Boundary
The conditions used to set the boundary vary depending on the measurement and computation
channels as follows:
• Measurement channel
When SCALE and SQRT are not used: Span L < boundary < span U
When SCALE and SQRT are used: Scale L < boundary < scale U
• Computation channel
Span L < boundary < span U
Note
The partial expansion settings take effect when the partial expansion function is set to [Use] in the [Aux]
section of the [Setup] tab.
Display Color
You can select the display color of each channel from 16 colors.
Copying and Pasting Setup Data
The items checked in [Copy Details] can be copied and pasted. Click the channel number to
select the copy source or paste destination.
To select multiple channels to be copied, drag the channel number to specify the range to be
copied. To select multiple copy destinations, select the range in a similar fashion.
5
Configuring the DX100/DX200/MV100/MV200
5-7
Page 88

5.2 Setting the Measurement Channels
Setting One Channel at a Time
1. Double-click the
channel you wish to set.
2. The channel setting
3. Select the tab of the item
to be configured.
dialog box opens.
4. After setting the
items, click here.
Apply the settings.
Update according to the changes
in the [Meas] sheet.
The items in the measurement channel tab can be configured for each channel. The items that
are configured are the same as those configured on the spreadsheet. For details, see the page
corresponding to the item.
5-8
Page 89

5.3 Setting the Computation Channels
Double-click when setting each channel
Select this tab
Enter the expression
Turn ON/OFF computation Select the number of digits to the right the decimal
Set the alarm (section 5.2)
Set the display span (6 characters or less)
Enter the unit
Enter the tag (section 5.2)Enter the alarm period
Enter the constant
to be used in the
expression
5
Configuring the DX100/DX200/MV100/MV200
Display zone (section 5.2)
Set the graph (section 5.2)
Turning ON/OFF Computation
Select whether or not to perform computation for each channel.
Expression
Enter the expression using up to 40 characters. For details related to the expression, see the
RD-MV100/RD-MV200 User’s Manual.
Partial expansion (section 5.2)
Display color (section 5.2)
5-9
Page 90

5.3 Setting the Computation Channels
Display Span
Sets the upper and lower limits of the display.
The range is from -9999999 to 99999999. Set the number of digits to the right the decimal to
four digits or less.
Alarm and Tag
The settings are the same as the measurement channels. For details, see section 5.2, “Setting
the Measurement Channel.”
TLOG Computation
Timer
Select one of the timers (1 to 3) set in the setup mode.
The computation interval of TLOG computation is set to the time assigned to the selected timer.
Sum scale
Set the sum scale.
Rolling Average
Interval
Select the sampling interval when rolling average is activated.
Times (Number of samples)
Select the number of samples (number of data points used to compute the rolling average).
Display Zone, Graph, Partial Expansion, and Color
The settings are the same as the measurement channels. For details, see section 5.2, “Setting
the Measurement Channel.”
Constant
You can set constants to be used in the expression. Up to 12 and 30 constants can be
specified on the RD-MV100 and RD-MV200, respectively.
5-10
Page 91

Setting One Computation Channel at a Time
1. Double-click the channel
you wish to set.
2. The channel setting
dialog box opens.
<Select Operator dialog box>
Select the operator type and click the operator button
5.3 Setting the Computation Channels
3. Select the tab of the item to be configured.
Click here to enter
the operator
5
Configuring the DX100/DX200/MV100/MV200
4. After setting the items,
click here.
Set the maximum value.
Set the minimum value.
Copy the first setting.
Operator button
The items in the math channel tab can be configured for each channel. The items that are
configured are the same as those configured on the spreadsheet. For details, see the page
corresponding to the item.
Copying and Pasting Setup Data
See section 5.2, “Setting the Measurement Channel.”
5-11
Page 92

5.4 Configuring the Settings
Screen Display
Select this tab
Recover by a key operation
Select the time per 1 division
Recover by a key operation or alarm occurrence
Select the display format of
the trend and bar graph
The screen saver function
is activated, when there is
no key operation or alarm
occurrence for the
specified time period.
If you selected RD-MV100 in the “System Configuration” dialog box, “User key” on the
“Setting” page will not be displayed.
Display update interval
You can select the display update interval from 1 min/div, 2 min/div, 5 min/div, 10 min/div, 20
min/div, 30 min/div, 1 h/div, 2 h/div, and 4 h/div. In addition to these selections, 15 sec/div and
30 sec/div can also be selected on the RD-MV102, RD-MV104, RD-MV204, and RD-MV208
when the style number is greater than or equal to 3.
Auto save interval
The auto save interval can be specified when the [Save] is set to [Auto] (see page 5-17) and the
data type is set to [DISPLAY] or [EVENT&DISP] in the memory sample section of the setup tab.
Auto scroll time
This is the time period used to automatically switch the displayed group. It can be specified
when the style number of the RD-MV is greater than or equal to 2.
5-12
Page 93

Message/File
5.4 Configuring the Settings
Click here (also selectable from
[Setting] - [SET [Regular] Setting])
Enter the message
Copy the entered message
Paste to another message
number
Enter the comment
Enter the save destination
folder
Message
Up to 16 characters can be entered for the message.
File header
Adds a comment to the header section of the measurement/computation data file.
Director name
Set the name of the folder in which the measurement/computation data files is to be saved.
5
Configuring the DX100/DX200/MV100/MV200
Note
• Up to eight characters can be entered for the file header and director name. AUX, CON, PRN, NUL,
and CLOCK cannot be used.
• If the directory name is not specified, DATA0 (default) is automatically set.
Manual save
Select whether to save all the data or data that have not been saved during manual save.
5-13
Page 94

5.4 Configuring the Settings
Group/Trip Line
Click here (also selectable from
[Setting] - [SET [Regular] Setting])
Turn ON/OFF the trip line display
Select the tab of the group
to be configured.
Enter the group name
Check the channels that you wish to register in the selected group (blue: ON)
Set the trip line by dragging
Set the trip line by
entering a value
Select the color of
the trip line
Group name
Up to 16 characters can be entered for the group name.
Number of channels
The maximum number of channels that can be assigned to a group is 10 and 6 for RD-MV200
and RD-MV100, respectively. The assigned channels are listed under [Channel Configuration].
If no channels are specified, CH01 is automatically assigned.
Trip line
Up to four trip lines can be set to one group.
With regard to the trip lines set here, the first and second settings (No.1 and No. 2) refer to the
trip lines in the Data Monitor and Data Viewer. If you change them here, they will also change
in the Data Monitor and Data Viewer.
5-14
Page 95

Setting the View Group (RD-MV200 Only)
Click here (also selectable from [Setting] - [SET [Regular] Setting])
Enter the view group name
View group
Up to four view groups can be registered.
5.4 Configuring the Settings
Select the type of screen to be displayed
or drag & drop
5
Configuring the DX100/DX200/MV100/MV200
Type of screens
available
Select the group to be displayed
Group Name
Up to 16 characters can be entered for the group name. The specified group name appears as
a sub menu of the [4 Panel] display of the RD-MV200.
Screen type
The view group is made up of four screens. Select the type of screen to display in each screen.
USER Key (RD-MV200 Only), Daylight Saving, Batch (Option, When the Style Number
is Greater than or Equal to 2)
Click either one (also selectable from [Setting] - [SET [Regular] Setting])
Select the function to be assigned to the USER key
Select either one
Enter usint up to
16 characters.
Enter the value
in the range
from 0 to 9999
5-15
Page 96

5.5 Configuring the Setup Mode
Alarm/Relay/Remote
2. Click here (also selectable from [Setting] - [SETUP [Basic] Setting]-[Setting])
1. Select this tab
Alarm
Select the alarm format. The selected items become blue.
Select from 1 to
15 times
Copy/Paste the
selected range
Select the controlled item
Relay AND
Set the range of relays (from the first alarm relay) to take the AND logic. All other relays will be
set to OR logic. If [NONE] is selected, all relays will operate using the OR logic.
Remote (Option)
You can assign items to be controlled by the eight remote control terminals. This is possible, if
the remote function is available.
For details related to the copy/paste function, see page 5-7.
5-16
Page 97

Scan Interval/Memory
Click here (also selectable from [Setting] - [SETUP [Basic] Setting]-[Setting])
Scan interval
The selectable scan intervals vary depending on the model as follows:
RD-MV102, RD-MV104, RD-MV204, and RD-MV208: 125 ms and 250 ms
RD-MV106, RD-MV112, RD-MV220, and RD-MV230: 1 s and 2 s
5.5 Configuring the Setup Mode
Check the channels you
wish to sample
5
Configuring the DX100/DX200/MV100/MV200
Set these parameters when the data type is set to [EVENT & DISP] or [EVENT]
A/D Integrate
100 ms can be selected only when the scan interval is set to 2 s.
Memory Sample (save method of measured/computed data)
• Number of blocks
When the data type is [EVENT], select 1, 2, 4, 8, or 16.
When the data type is [EVENT&DISP], select 1, 2, or 4.
• Pre-Trigger Length
If 0% is selected, the event file will entirely consist of data after the trigger. If 100% is
selected, the event file will entirely consist of data before the trigger.
• Memory Sample
Select the channels that are to be saved to the memory.
Note
If [Save] is set to [Manual], the data directory is created at a location that cannot be managed by the DAQ
Desktop. Therefore, the DAQ Desktop cannot be used to handle data files in that directory.
5-17
Page 98

5.5 Configuring the Setup Mode
Channel (Setting the Burnout and RJC)
Click here (also selectable from [Setting] - [SETUP [Basic] Setting] - [Setting])
Burnout
For thermocouple (TC) inputs, select how the measurement results are to be handled when the
thermocouple burns out.
Set to the positive side (100%)
Set to the negative side (0%)
Set the reference junction compensation
to internal or external
RJC Volt (uV)
When the reference junction compensation is set to [External], set the compensation value in
the range from -20,000 to 20,000.
Copying and pasting setup data
The items checked in [Copy Details] can be copied and pasted. Click the channel number to
select the copy source or paste destination.
To select multiple channels to be copied, drag the channel number to specify the range to be
copied. To select multiple copy destinations, select the range in a similar fashion.
5-18
Page 99

Key Lock/Login
Click here (also selectable from [Setting] - [SETUP [Basic] Setting]-[Setting])
RD-MV200 cnfiguration screen
Turn ON when using user settings
Check when using login, auto logout, and user ID.
Setting the key lock
• Key Lock
When using the key lock function, select whether or not to activate the key lock function (lock
or free).
5.5 Configuring the Setup Mode
RD-MV100 configuration screen
5
Configuring the DX100/DX200/MV100/MV200
• Password
Enter the password used to release the key lock using up to six characters. [???] is
displayed after the password is entered.
Setting the login
• User name
Up to 16 characters can be entered for the user name.
• User ID
Up to 4 characters can be entered for the User ID. [???] is displayed after the password is
entered.
• Password
Up to 6 characters can be entered for the password. [???] is displayed after the password is
entered.
• Setup
Select whether or not to allow setting changes in the setup mode.
Note
• If there is a duplicate [User Name] that is turned ON, the user with the larger user number is turned
OFF.
• If [Setup] of all users that are turned ON is set to [Disable], the [Setup] of the user with the smallest
number is set to [Enable].
5-19
Page 100

5.5 Configuring the Setup Mode
Timer (Option)
Click here (also selectable from [Setting] - [SETUP [Basic] Setting]-[Setting])
Select one
Timeout every time the specified time elapses
Select the timeout time
Time out with the specified
time as the reference
Reset computation when a timeout occurs
Save the data to the TLOG file when a timeout occurs.
You can set three types of timers to be used in the statistical computation. You can have the
data saved to a TLOG file or reset the computation when the specified timeout time elapses.
5-20
 Loading...