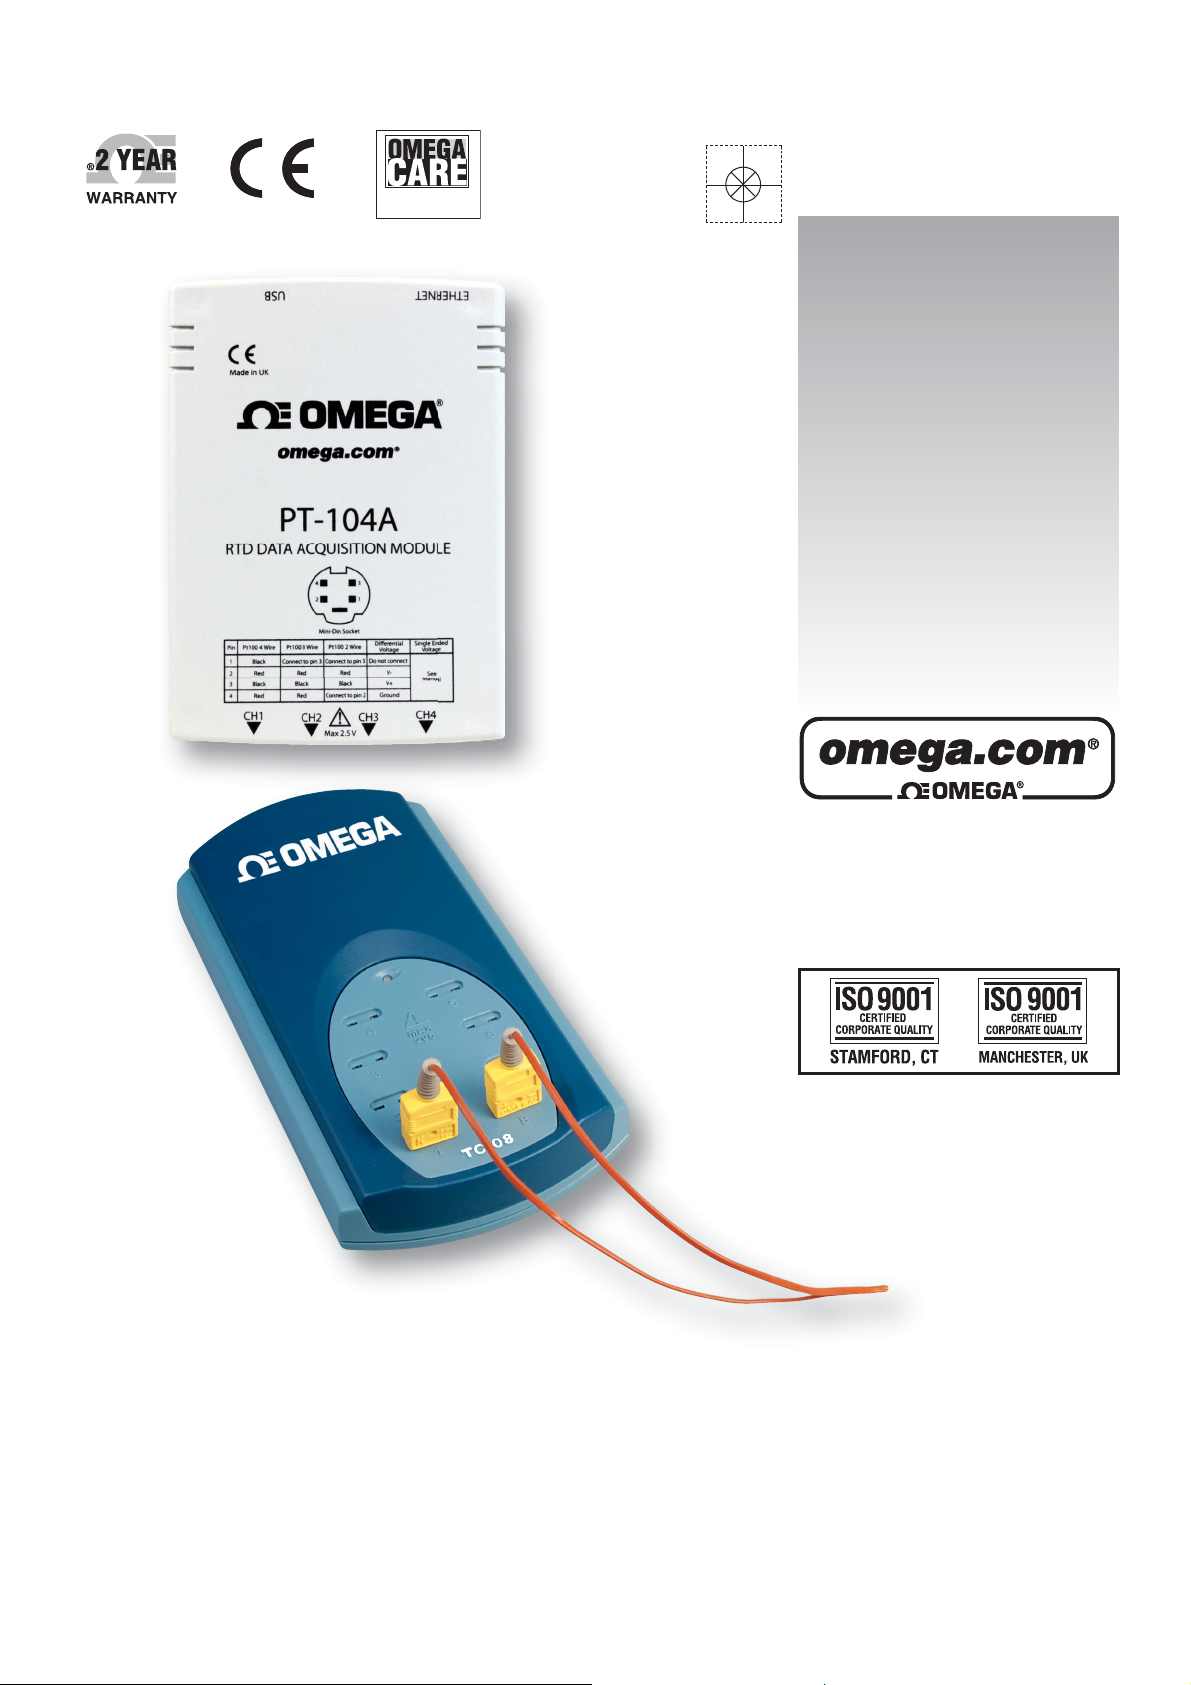
Omega Products PC-104A Installation Manual
Extended Warranty
Program
SM
User’s Guide
PT-104A
Shop online at
®
e-mail: info@omega.com
For latest product manuals:
TC-08
omegamanual.info
omega.com
LOGGING SOFTWARE FOR
TC-08 AND PT-104A DATA
ACQUISITION MODULES

OMEGAnet®Online Service Internet e-mail
omega.com info@omega.com
Servicing North America:
U.S.A.: Omega Engineering, Inc., One Omega Drive, P.O. Box 4047
ISO 9001 Certified Stamford, CT 06907-0047 USA
Toll Free: 1-800-826-6342 TEL: (203) 359-1660
FAX: (203) 359-7700 e-mail: info@omega.com
Canada: 976 Bergar
Laval (Quebec), Canada H7L 5A1
Toll-Free: 1-800-826-6342 TEL: (514) 856-6928
FAX: (514) 856-6886 e-mail: info@omega.ca
For immediate technical or application assistance:
U.S.A. and Canada: Sales Service: 1-800-826-6342/1-800-TC-OMEGA
Customer Service: 1-800-622-2378/1-800-622-BEST
Engineering Service: 1-800-872-9436/1-800-USA-WHEN
Mexico: En Español: 001 (203) 359-7803 FAX: (001) 203-359-7807
info@omega.com.mx e-mail: espanol@omega.com
®
®
®
Servicing Europe:
Benelux: Managed by the United Kingdom Office
Toll-Free: 0800 099 3344 TEL: +31 20 347 21 21
FAX: +31 20 643 46 43 e-mail: sales@omega.nl
Czech Republic: Frystatska 184
733 01 Karviná, Czech Republic
Toll-Free: 0800-1-66342 TEL: +420-59-6311899
FAX: +420-59-6311114 e-mail: info@omegashop.cz
France: Managed by the United Kingdom Office
Toll-Free: 0800 466 342 TEL: +33 (0) 161 37 29 00
FAX: +33 (0) 130 57 54 27 e-mail: sales@omega.fr
Germany/Austria: Daimlerstrasse 26
D-75392 Deckenpfronn, Germany
Toll-Free: 0 800 6397678 TEL: +49 (0) 7059 9398-0
FAX: +49 (0) 7056 9398-29 e-mail: info@omega.de
United Kingdom: OMEGA Engineering Ltd.
ISO 9001 Certified One Omega Drive, River Bend Technology Centre, Northbank
Irlam, Manchester M44 5BD England
Toll-Free: 0800-488-488 TEL: +44 (0)161 777-6611
FAX: +44 (0)161 777-6622 e-mail: sales@omega.co.uk
It is the policy of OMEGA Engineering, Inc. to comply with all worldwide safety and EMC/EMI
regulations that apply. OMEGA is constantly pursuing certification of its products to the European New
Approach Directives. OMEGA will add the CE mark to every appropriate device upon certification.
The information contained in this document is believed to be correct, but OMEGA accepts no liability for any
errors it contains, and reserves the right to alter specifications without notice.
WARNING: These products are not designed for use in, and should not be used for, human applications.

Contents
ILogging Software User's Guide
.....................................................................................................................................11 Introduction
1 Overview
2 Recording
3 Safety warning
...........................................................................................................................................1
...........................................................................................................................................2
...........................................................................................................................................3
.....................................................................................................................................42 Software components
1 Introduction
2 Recorder
3 Logging Player
4 Graph
5 XY Graph
6 Spreadsheet
7 Notes
...........................................................................................................................................4
...........................................................................................................................................5
...........................................................................................................................................6
...........................................................................................................................................7
...........................................................................................................................................9
...........................................................................................................................................11
...........................................................................................................................................13
.....................................................................................................................................143 How to...
1 Add new measurements
2 Select which measurements to display
3 Start a new run
4 Repeat an existing run
5 Start recording whenever Windows starts
6 Display data
7 Print data
8 Export data to a spreadsheet
9 Export a graph to a word processor
10 Enable date and time scaling on a graph
11 Transfer data over an IP network
12 Run multiple recorders
...........................................................................................................................................14
...........................................................................................................................................14
...........................................................................................................................................14
...........................................................................................................................................15
...........................................................................................................................................15
...........................................................................................................................................16
...........................................................................................................................................16
...........................................................................................................................................16
...........................................................................................................................................17
...........................................................................................................................................17
...........................................................................................................................................18
...........................................................................................................................................19
.....................................................................................................................................204 Menu bar
1 File
2 Settings
3 View
4 Help
5 Keyboard shortcuts
...........................................................................................................................................20
...........................................................................................................................................21
...........................................................................................................................................22
...........................................................................................................................................22
...........................................................................................................................................23
.....................................................................................................................................245 Dialogs
1 General dialogs
1 Recording
2 Sampling Rate
3 Print
4 Confirm File delete
5 Converter-related
6 IP socket-related
7 Parameter-related
8 Window-related
Copyright © 1994-2010 Omega Engineering, Inc. All rights reserved. M4941/0710
...........................................................................................................................................24
...........................................................................................................................................24
...........................................................................................................................................25
...........................................................................................................................................25
...........................................................................................................................................26
...........................................................................................................................................26
...........................................................................................................................................29
...........................................................................................................................................32
...........................................................................................................................................38

ContentsII
9 Preferences
10 Hardware configuration
...........................................................................................................................................41
...........................................................................................................................................43
.....................................................................................................................................476 Equipment overview
1 PT-104A
2 USB TC-08
3 IP sockets
...........................................................................................................................................47
...........................................................................................................................................47
...........................................................................................................................................47
.....................................................................................................................................487 Technical information
1 .ini preferences file
2 .plw data file
3 .pls settings file
4 Scaling file
5 Command line options
6 Multiple program instances
7 DDE
8 Equation notation
9 Glossary
..............................................................................................................................................55
Index
...........................................................................................................................................48
...........................................................................................................................................49
...........................................................................................................................................49
...........................................................................................................................................51
...........................................................................................................................................52
...........................................................................................................................................52
...........................................................................................................................................52
...........................................................................................................................................53
...........................................................................................................................................53
Copyright © 1994-2010 Omega Engineering, Inc. All rights reserved.M4941/0710
Logging Software User's Guide 1
Welcome to the User's Guide for the Logging Software, a
data acquisition tool that collects, records, displays and
analyses measurement data. The software has the
following capabilities:
Collects blocks of data at high speed from a single
logger
Collects data at low speed over long periods from
multiple loggers
Allows you to adjust Alarm settings for
measurements you want to take
Enables you to apply Parameter scaling , using
equations or tables
Allows you to Edit calculated parameters
Can analyse other files during data collection
Displays data during slow collection and after collection
Graphical display in the XY Graph and Graph
windows, and spreadsheet display in the Spreadsheet
windows
Transfers data to other applications via clipboard, file
or DDE
Transfers data between computers using IP sockets
1 Introduction
1.1
Overview
34
33
36
9 7
11
52
47
Copyright © 1994-2010 Omega Engineering, Inc. All rights reserved. M4941/0710
Introduction2
1.2
Recording
The recording mode and repeat functions are selected using the Recording dialog.
Ensure that real time continuous mode is selected. This offers continuous recording
over long periods. The data can be displayed in graphical or spreadsheet format
during data collection. The fastest sampling rate in realtime mode depends on the
speed of the computer and the operating system (it is of the order of a few
milliseconds).
There are several options to specify what should happen at the end of a run when the
specified maximum number of samples have been collected. The options are as
follows:
Stop
Repeat immediately
Scroll
Repeat after delay
24
Copyright © 1994-2010 Omega Engineering, Inc. All rights reserved.M4941/0710

Logging Software User's Guide 3
1.3
Safety warning
DO NOT connect the ground input of the converter to anything which may be at some
voltage other than ground, as you may risk damage to the converter and your
computer. Furthermore, if you connect the converter ground to something which is
live, your computer chassis may become live.
If in doubt, check by connecting a channel input to the doubtful ground point, and
check that there is no significant AC or DC voltage.
We strongly recommend that you read the general safety information in your
installation guide and also the product-specific safety warning in the product manual
before using your product for the first time.
Copyright © 1994-2010 Omega Engineering, Inc. All rights reserved. M4941/0710
2 Software components
Software components4
2.1
Introduction
The Logging Software is made up of a number of separate components, but you need
only activate the components that you wish to use. As a result, the screen is not
cluttered with data that you are not using and the computer can easily be used for
other applications whilst you are recording.
The application components that are available are as follows:
Logging Recorder . Enables you to start and stop recording and to specify
recording files, the measurements currently being taken and the alarm state.
Logging Player . Enables you to scroll quickly and easily through stored files to
compare results on successive runs.
Graph . Shows the readings for single or multiple measurements over a period of
time.
XY Graph . Shows the readings of one measurement against another, on the same
graph.
Spreadsheet . Shows detailed or summary information in a format which can be
copied to a clipboard.
Notes . Enables you to enter information for a particular run.
7
9
13
5
6
11
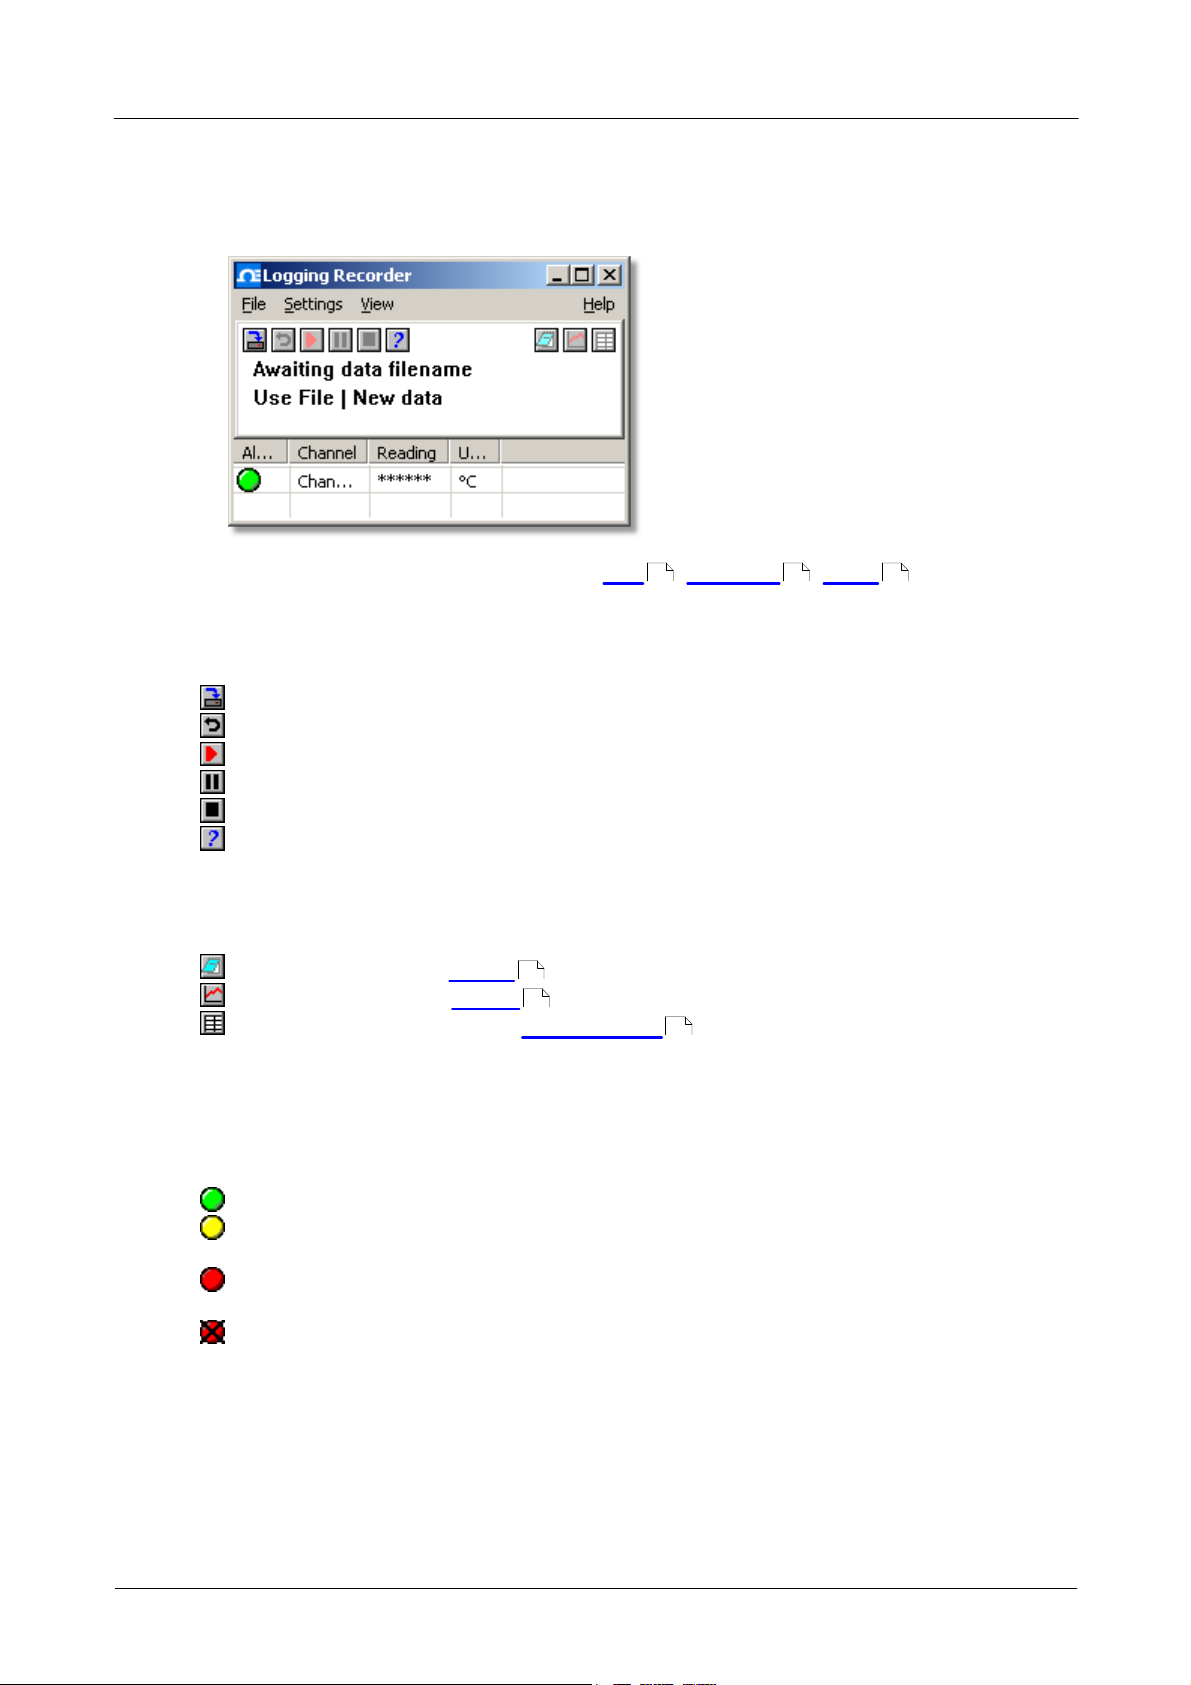
When you start the Logging Software in recorder mode, the computer displays the
Logging Recorder . The Logging Player and display windows can be selected from the
Window menu.
When you start the Logging Software in player mode, the computer displays the
Logging Player . The Logging Recorder and display windows can be selected from the
Window menu.
Copyright © 1994-2010 Omega Engineering, Inc. All rights reserved.M4941/0710
Logging Software User's Guide 5
2.2
Recorder
When you start the Logging Software using the Recorder icon, the computer displays
the monitor window:
At the top is a menu bar containing the File , Settings , View and Help
menus. Below the menu bar are two sets of controls, the Recorder controls and the
Window controls.
Recorder controls
New file. Specify a new file to record to.
Re-record. Rewind the current file so that it can be re-recorded.
Start recording.
Pause/resume.
Stop recording.
Help. Access the help information for the recorder window (this page).
20 21 22
Window controls
The second group of buttons, on the right, is used to open other windows:
View Notes. Open a Notes window.
View Graph. Open a Graph window.
View spreadsheet. Open a Spreadsheet window.
13
7
11
Range indicators
The lower pane of the window contains a line of information for each selected
measurement. At the beginning of each line is an indicator lamp that signals the
current status of the readings taken by the PT-104 software:
The measurement value is within range
The measurement value is currently out of range, but has not been out of range
long enough to trigger an alarm
The measurement value is in an alarm state. To cancel the alarm, use the mouse
to click on the lamp
The measurement value is in an alarm state, but the alarm has been cancelled
Next to each lamp is the name of the measurement and its current value. If you click
on a measurement name, the computer will display the details of the measurement.
Copyright © 1994-2010 Omega Engineering, Inc. All rights reserved. M4941/0710
Software components6
2.3
Logging Player
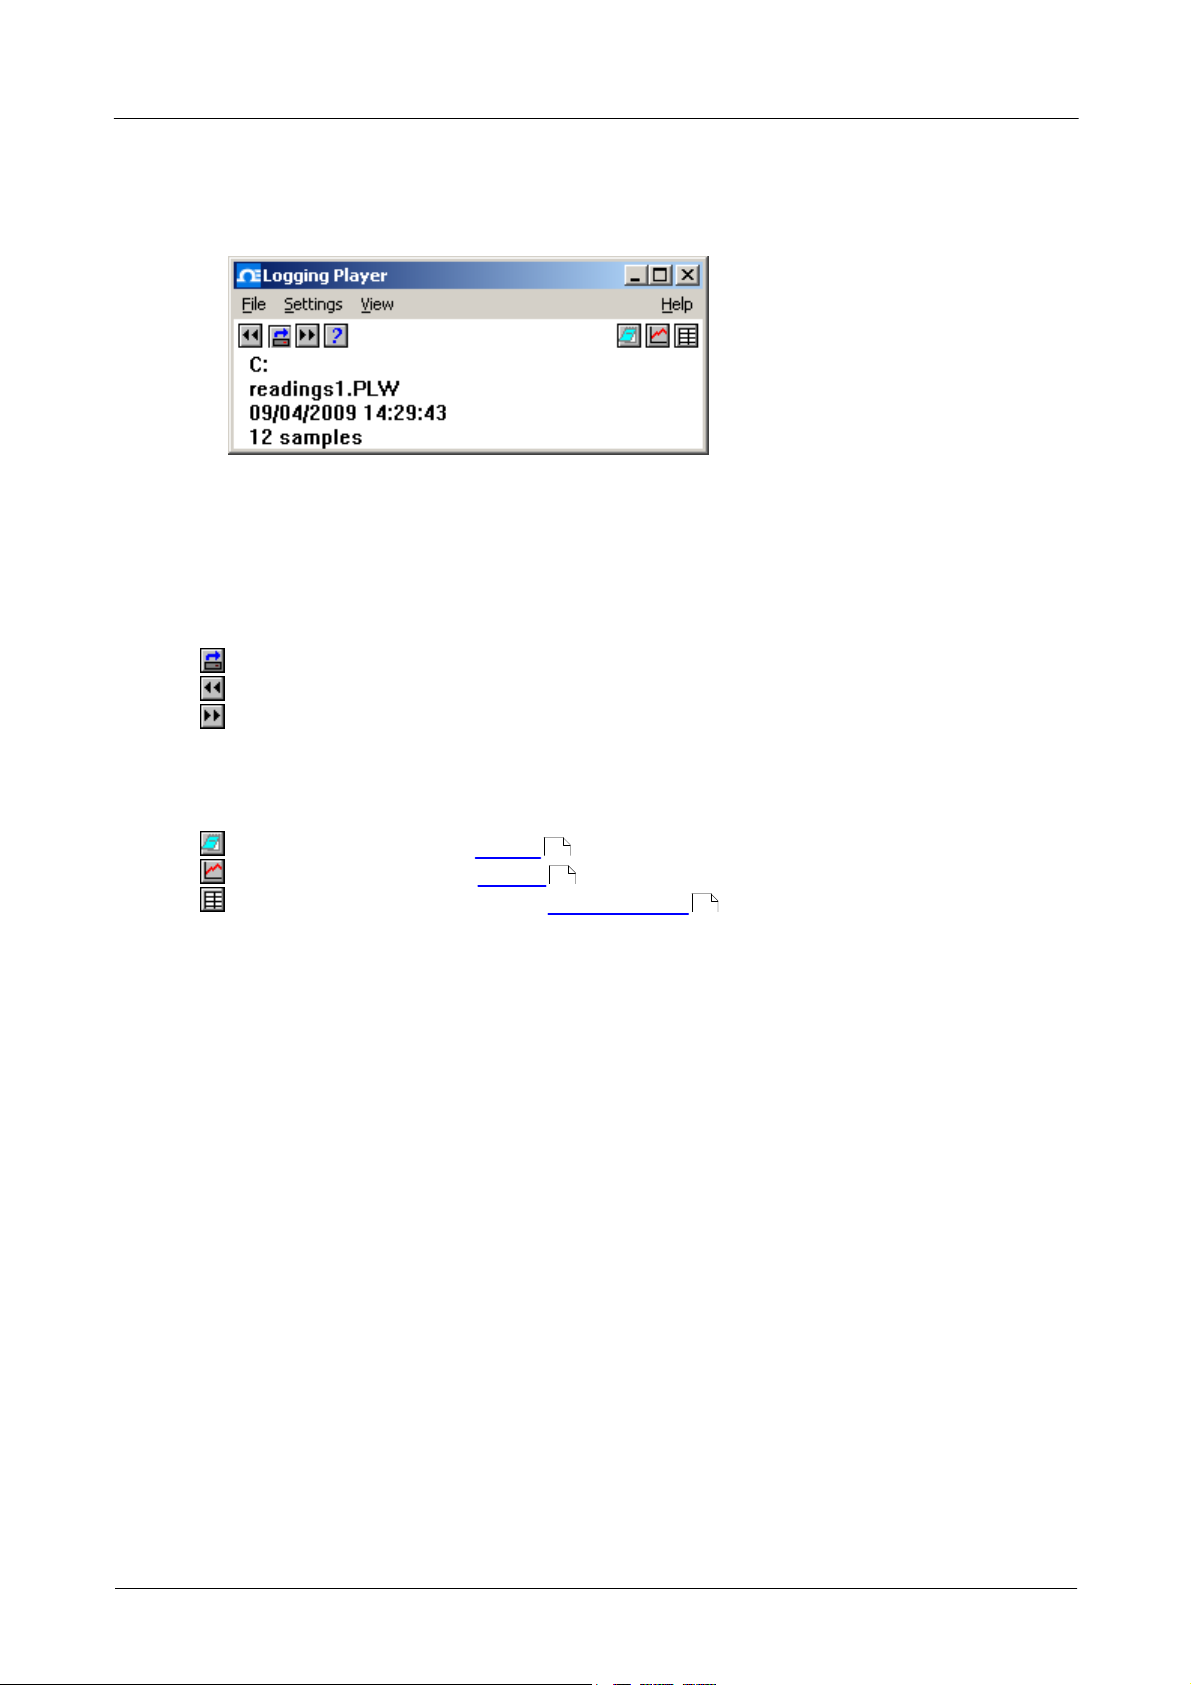
When you start the Logging Player, or you select Player from the View menu of
the Logging Recorder, the computer opens a new window:
This shows you the name of the current Logging Player file and the number of
samples taken so far.
Logging Player controls
The buttons on the left are used to specify a filename and to go forwards or backwards
in a file sequence. The controls are as follows:
Open file. Load a new file into the player.
Back a file. Go to the previous file in a sequence.
Forwards a file. Go to the next file in a sequence.
Window controls
The buttons on the right are used to open other windows:
View Notes. Open a Notes window.
View Graph. Open a Graph window.
View spreadsheet. Open a Spreadsheet window.
13
7
11
Copyright © 1994-2010 Omega Engineering, Inc. All rights reserved.M4941/0710
Logging Software User's Guide 7
2.4
Graph
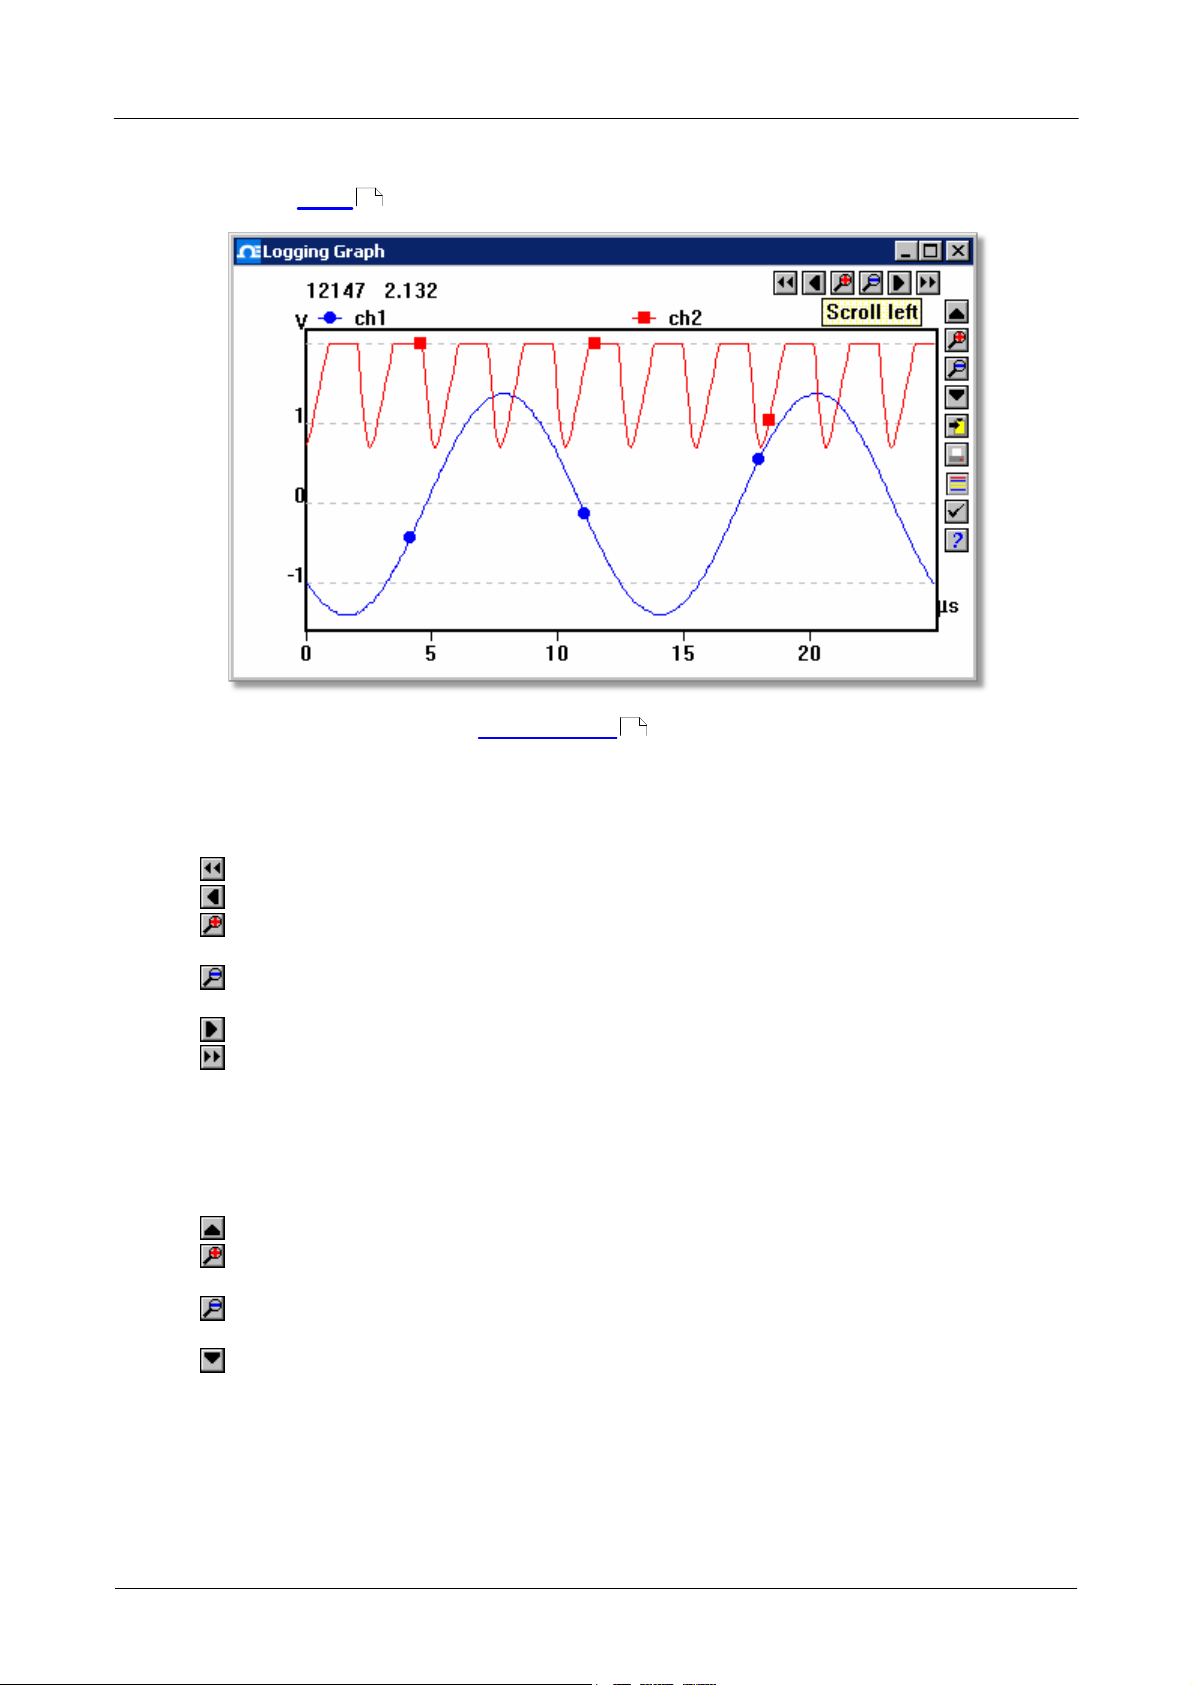
From the View menu of the Logging Recorder or Logging Player, select Graph.
Note that there are several graph options that affect the way that the graph is
displayed and the format of the axis scales.
22
38
The group of horizontal buttons in the top right corner of the screen selects what time
interval is displayed:
Scroll left. Move a whole display left.
Scroll quarter left. Move a quarter display left.
Expand horizontal axis. Magnify the middle half of the display to fill the whole
width.
Shrink horizontal axis. Shrink the current display to half size, so that more is
displayed before and after.
Scroll quarter right. Move a quarter display right.
Scroll right. Move a whole display right.
The upper group of vertical buttons controls the vertical range displayed. If there is
more than one graph frame, the buttons control the frame with the thicker border. To
switch to a different frame, point inside the new frame with the cursor and click the
left mouse button.
Scroll up. Move a whole display up.
Expand vertical axis. Magnify the middle half of the display to fill the whole
height.
Shrink vertical axis. Shrink the current display height to half size, so that more
is displayed above and below.
Scroll down. Move a whole display down.
Note that if you use these controls to change the time or vertical range, auto-scaling
for that axis is turned off automatically. Use the options to turn auto-scaling back on
again (see button below).
Copyright © 1994-2010 Omega Engineering, Inc. All rights reserved. M4941/0710
Software components8
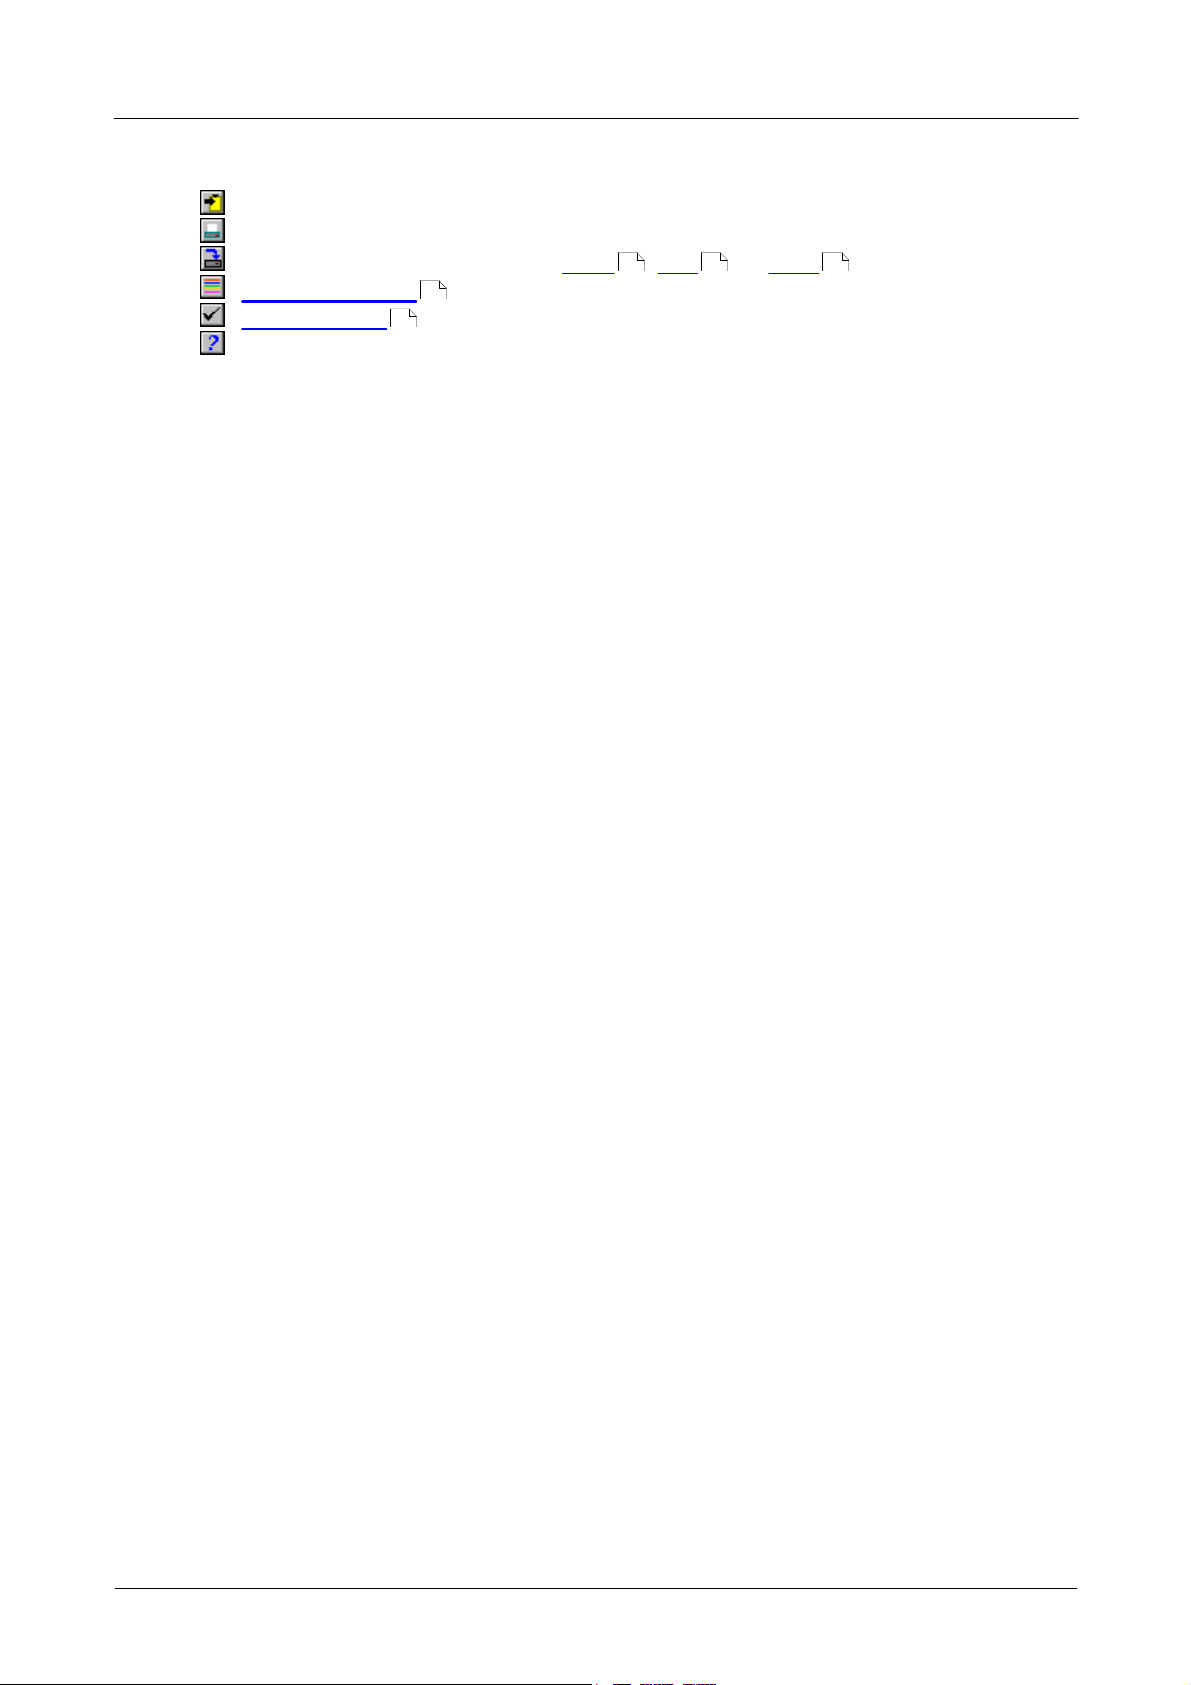
The remaining vertical controls are:
Copy to clipboard. Copy the graph to the clipboard.
Print view. Print the graph.
New file. Write graph to file in .bmp , .jpg , or .wmf format.
Select channels . Select the measurements to display on the graph.
View options . Specify the options for the graph.
34
38
53 53 54
Help. Access the help info for the graph window (this page).
If you move the mouse cursor onto the graph part of the screen, the computer will
display the measurement value and time at the current cursor position. If you click the
left mouse button, the graph will zoom in, centred on the mouse cursor. If you click
the right mouse button, the graph will zoom out, centred on the mouse cursor.
Copyright © 1994-2010 Omega Engineering, Inc. All rights reserved.M4941/0710
Logging Software User's Guide 9
2.5
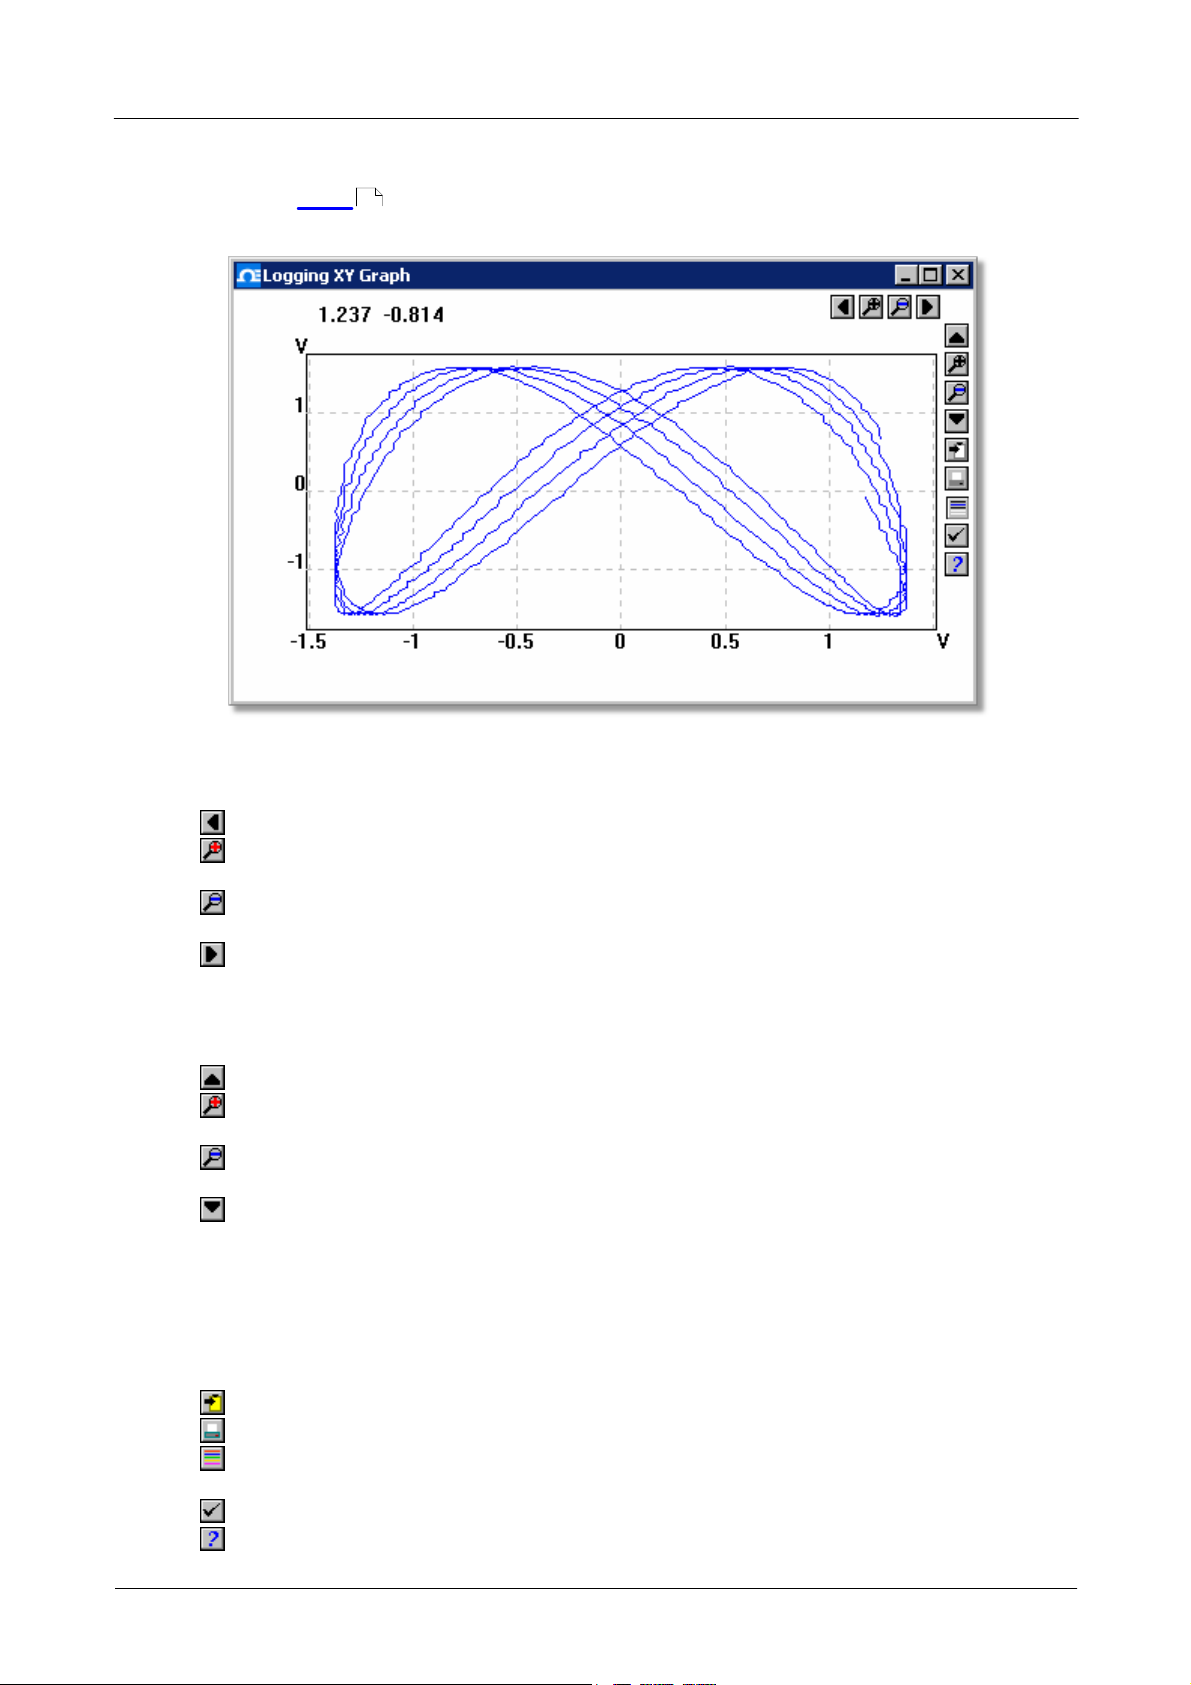
XY Graph
From the View menu of the Logging Recorder or Logging Player, select XY
Graph.
22
There are several buttons in the top right corner of the screen. The top row of buttons
controls the horizontal range displayed:
Scroll quarter left. Move a quarter display left.
Expand horizontal axis. Magnify the middle half of the display to fill the whole
width.
Shrink horizontal axis. Shrink the current display to half size, so that more is
displayed.
Scroll quarter right. Move a quarter display right
The upper group of buttons in the column on the right controls the vertical range
displayed:
Scroll up. Move a whole display up.
Expand vertical axis. Magnify the middle half of the display to fill the whole
height.
Shrink vertical axis. Shrink the current display height to half size, so that more
is displayed above and below.
Scroll down. Move a whole display down.
Note that if you use these controls to change the horizontal or vertical range, autoscaling for that axis is turned off automatically. Use the options to turn auto-scaling
back on again (see buttons below).
The remaining vertical controls are:
Copy to clipboard. Copy the graph to the clipboard.
Print view. Print the graph.
Select channels. Select the measurements to display on the XY graph (only
two).
View options. Specify the options for the graph.
Help. Access the help info for the graph window (this page).
Copyright © 1994-2010 Omega Engineering, Inc. All rights reserved. M4941/0710

Software components10
If you move the mouse cursor onto the graph part of the screen, the computer will
display the measurement values at the current cursor position.
Copyright © 1994-2010 Omega Engineering, Inc. All rights reserved.M4941/0710
Logging Software User's Guide 11
2.6
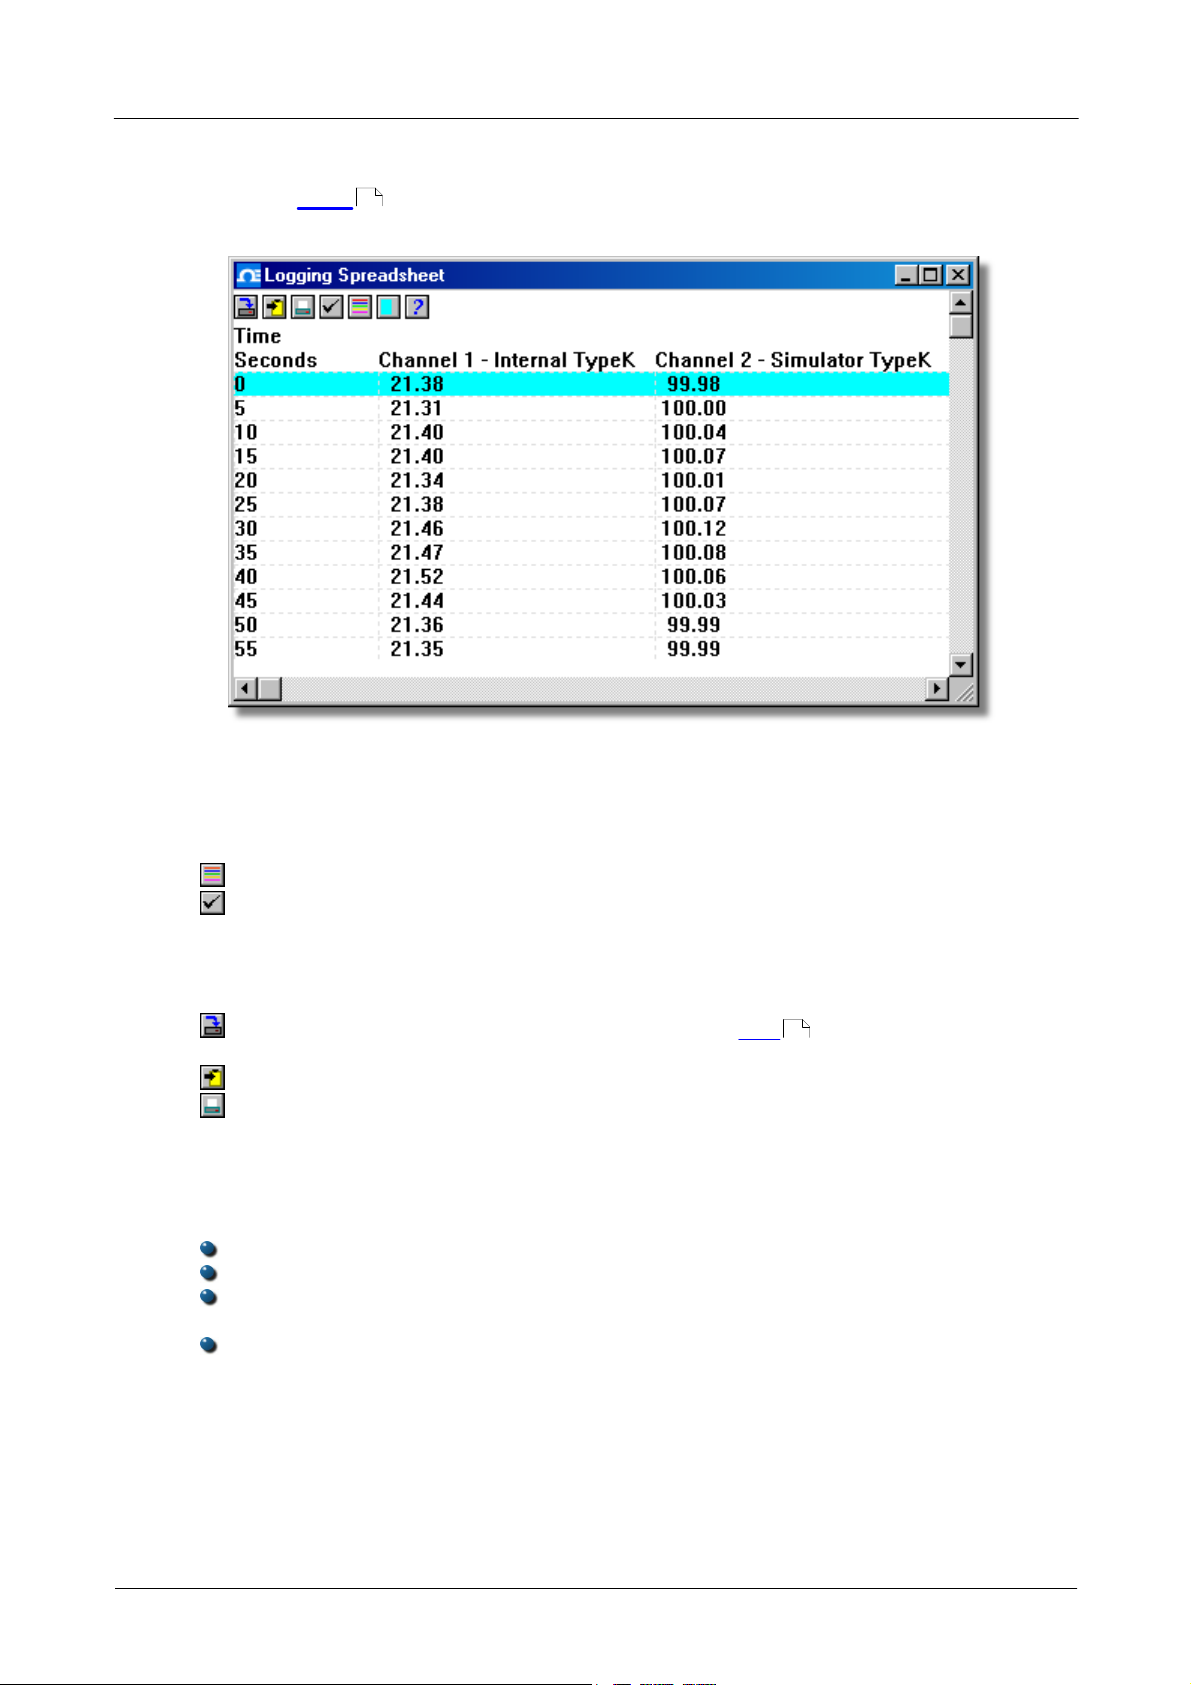
Spreadsheet
From the View menu of the Logging Recorder or Logging Player, select
Spreadsheet.
22
There is one line for each reading. The first column shows the time in seconds, while
the remaining columns show the selected measurements.
The following options buttons are available:
Select channels. Select the measurements to display.
View options. Spreadsheet options specify whether to display individual
readings, or first reading, average, minimum and maximum for a period.
If you select a range of readings, you can use the following buttons:
Write to disk. Write the readings to a print file (.prn ) or a text file (.txt) -
Both are tab-separated value files.
Copy to clipboard. Write the readings to the clipboard.
Print view. Print the graph.
You can select a range in one of three ways:
If all of the readings that you want to select are on the screen:
Point the mouse at the first reading
Press and hold down the left mouse button
Drag the mouse to the last reading (the selected readings will be highlighted as you
go) and
Release the left mouse button.
53
Copyright © 1994-2010 Omega Engineering, Inc. All rights reserved. M4941/0710
If the readings are a long way apart:
Point the mouse at first reading
Click the left mouse button (this will highlight the first reading)
Scroll down to the last reading
Point at the last reading and
Press the shift key and click the left mouse button.
If you wish to select all of the readings for one day:
Point the mouse at any reading during the required day
Click the left mouse button (this will highlight the reading) and
Click on the 'select day' icon:
Software components12
Copyright © 1994-2010 Omega Engineering, Inc. All rights reserved.M4941/0710
Logging Software User's Guide 13
2.7
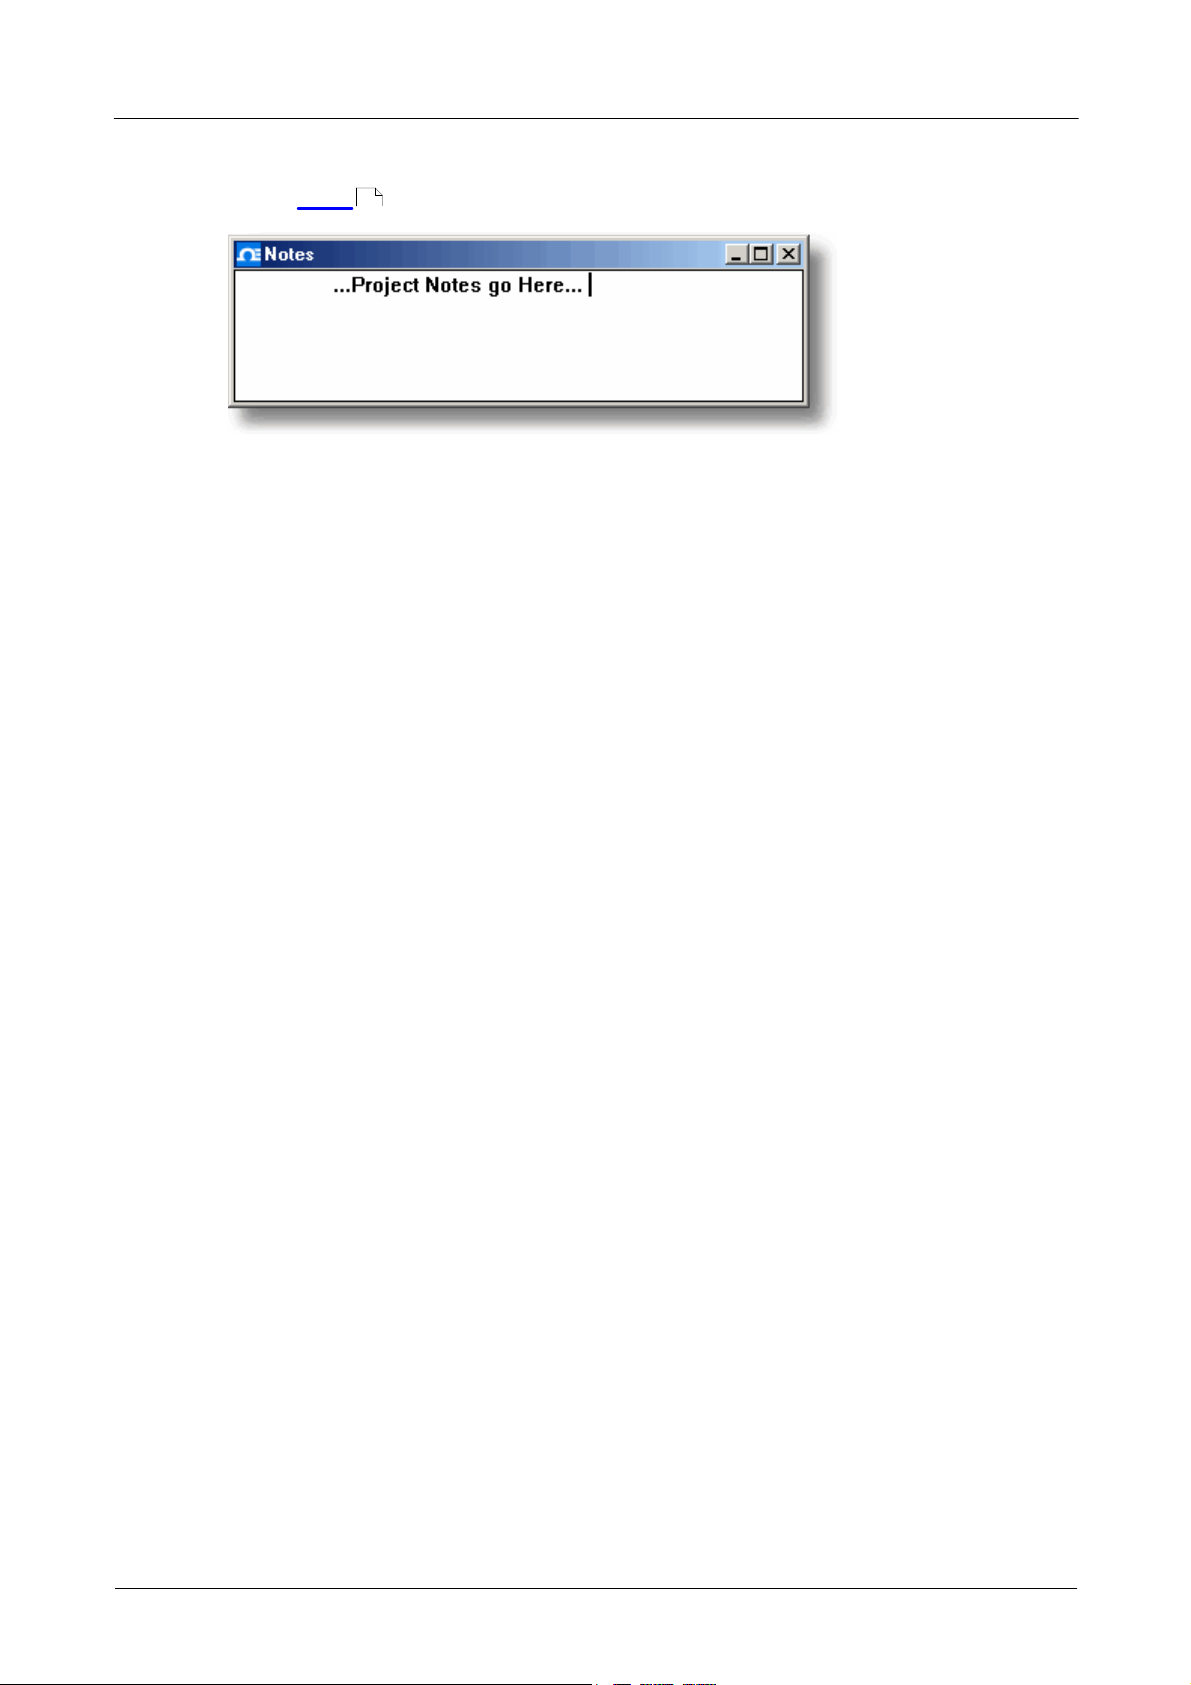
Notes
From the View menu of the Logging Recorder or Logging Player, select Notes.
This window enables you to enter information for a particular run. This is useful if you
carry out a number of similar runs. The report title can be the same for every run, but
the notes contain information specific to each run.
If you have a Notes window open when you use the player to browse through several
runs, the notes for each run will be displayed. The notes also appear on printed
reports.
22
Copyright © 1994-2010 Omega Engineering, Inc. All rights reserved. M4941/0710
3 How to...
How to...14
3.1
3.2
3.3
Add new measurements
1. Select the converter in the normal way
2. At the measurement list dialog, select Add (for the PT-104, for example, this would
be the Pt104 Channels dialog)
3. Enter the details for the measurement
4. Click the Scaling button
5. Enter the scaling details (see Parameter scaling dialog for details).
43
33
Select which measurements to display
When you first open a graph or spreadsheet window, the computer displays only the
first measurement. To select a different measurement or to add further
measurements:
1. Click on the Select channels button: . The computer will display the Select
parameters dialog, with a list of all of the measurements and which ones are
in use
2. Click on each measurement that you wish to be active
3. Click OK
34
Start a new run
To start a new run from scratch, select New settings from the File menu. The
Logging Software will take you through the steps necessary to define what you want
to collect:
Recording method (real time continuous only)
Sampling Rate , including sampling interval and maximum number of samples
Converter details
Measurement setup: for example, if you are using the PT-104, you will see the PT-
104 Channel List dialog
Once you have entered these details, check that the monitor window in the Logging
Recorder is displaying the measurements that you wish to record, and that the
correct values are showing.
1. If you are in the Logging Player, go to the View menu and select Recorder,
otherwise go straight to step 2
2. The Logging Recorder window has buttons like a tape recorder, to start, stop,
rewind etc.
3. Click on the New file button:
4. Type the name of the file to which you wish to record
5. Click OK (the filename will appear in the recorder window)
6. Click the Start recording button:
The sample number will increase on every sample interval.
24 2
25
26
43
5
5
Copyright © 1994-2010 Omega Engineering, Inc. All rights reserved.M4941/0710
Logging Software User's Guide 15
3.4
3.5
Repeat an existing run
If you have just recorded a run, and you wish to retain the data, yet start a new run:
1. Click on the New file button: . Note: Do not attempt to save your data directly
to a floppy disk. The computer will display the next sequence-numbered file name.
2. If you do not wish to use the default filename, type in a different name.
3. Click OK
4. Click the Start recording button:
If you have just recorded a run, and you wish to discard the data and start a new run:
1. Click the Re-record button:
2. Click the Start recording button:
If you wish to repeat a run:
1. From the File menu, select Open.
2. Select the file that you wish to repeat.
3. From the View menu, select Recorder. This displays the recorder window.
4. Proceed according to the retain or discard options described above.
Start recording whenever Windows starts
First, save the settings for the type of run that you wish to start:
1. Define the type of run that you wish to carry out
2. Select Save as... from the File menu
3. Type in a filename for these settings
4. Change the file type to .pls
5. Click OK
Note: Do not attempt to save your data directly to a floppy disk.
Now run the program:
1. Click the Windows Start button
2. Select Settings or Control Panel
3. Select Taskbar and Start Menu
4. Click Start Menu
5. Click Add
6. Type c:\omega\plw32.exe -r settings.pls (or whatever your settings file is
called) and click OK
7. Select the startup folder (programs in the startup folder are run automatically when
Windows starts) and click OK
8. Click the Finish button
53
Copyright © 1994-2010 Omega Engineering, Inc. All rights reserved. M4941/0710
 Loading...