

Page 1

Table of Contents
INTRODUCTION..............................................................................................................v
Ÿ How to Use This Manual.....................................................................................................................v
Ÿ Terms Used in this Manual..................................................................................................................v
Ÿ Fonts Used in this Manual...................................................................................................................v
PC Hardware Requirements .........................................................................................vi
Software Installation....................................................................................................vii
Ÿ Installing DataWorker LE on a PC with Windows 95, 98 or NT........................................................vii
Ÿ Starting the Software.........................................................................................................................vii
1.0 A Look at DataWorker LE.........................................................................................1
1.1 DataWorker LE Workbook Features................................................................................................1
1.2 Standard Worksheet functions.........................................................................................................3
1.2.1 Worksheet tabs .....................................................................................................................3
1.2.2 Selecting Worksheets............................................................................................................3
1.2.3 Split-bar.................................................................................................................................3
1.2.4 Worksheet Tab Scroll Arrows ...............................................................................................3
1.2.5 Scrollbars...............................................................................................................................4
♦♦i♦♦
Page 2

2.0 Worksheet Descriptions...........................................................................................5
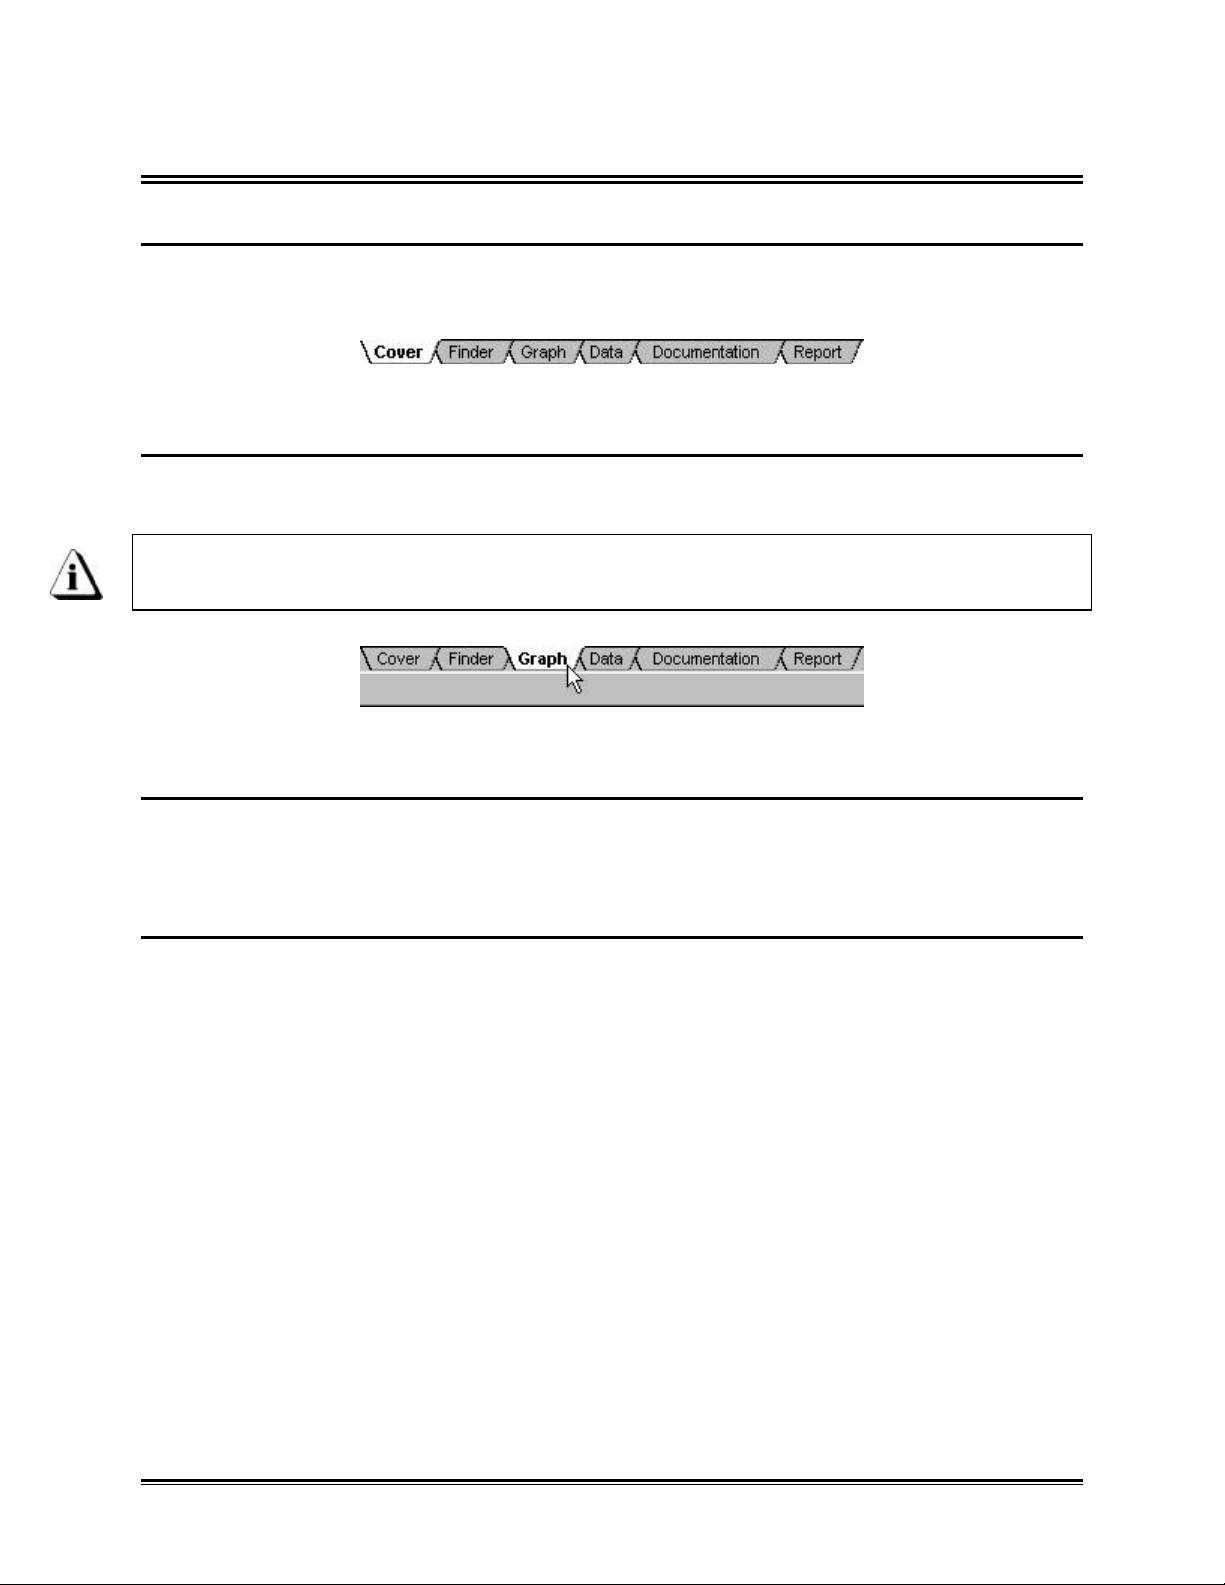
2.1 Cover Worksheet .............................................................................................................................5
2.1.1 Cover Worksheet Menus and Toolbar..................................................................................6
2.1.2 Report Image.........................................................................................................................7
2.1.3 Company/Report Name ........................................................................................................8
2.2 Finder Worksheet.............................................................................................................................9
2.2.1 Finder Menus and Toolbar Buttons.....................................................................................10
2.2.2 Parameter Group Row........................................................................................................10
2.2.3 Parameter Labels................................................................................................................11
2.2.4 Parameter Units...................................................................................................................11
2.2.5 Data Run Rows ...................................................................................................................12
2.2.6 Filters...................................................................................................................................13
2.3 Graph Worksheet...........................................................................................................................15
2.3.1 Graph Worksheet Menus and Toolbar Buttons...................................................................16
2.3.2 Mini Finder...........................................................................................................................16
2.3.3 Magnify Map........................................................................................................................17
2.3.4 Data Table...........................................................................................................................17
2.3.5 Sensor Location Descriptions..............................................................................................18
2.3.6 Channel Check Boxes.........................................................................................................18
2.3.7 Status Bar............................................................................................................................18
2.3.8 Data Tabs............................................................................................................................19
2.3.8.1 Values....................................................................................................................19
2.3.8.2 Statistics ................................................................................................................20
2.3.8.3 Basic Parameters..................................................................................................20
2.3.8.4 Misc. Parameters...................................................................................................20
2.3.8.5 X Scale...................................................................................................................21
2.3.8.6 Y Scale...................................................................................................................21
2.3.9 The Data Graph...................................................................................................................22
2.3.9.1 X and Y-Axes and Labels......................................................................................22
2.3.9.2 Data Plots..............................................................................................................23
2.3.9.3 X-Ref(erence) Line................................................................................................24
2.3.9.4 X-Cursors...............................................................................................................25
2.3.9.5 X-axis Units............................................................................................................26
2.4 Data Worksheet..............................................................................................................................27
2.4.1 Data Worksheet Menus and Toolbar Buttons.....................................................................28
2.4.2 Individual Parameters..........................................................................................................29
2.4.3 Individual Data Points..........................................................................................................30
2.5 Documentation Worksheet.............................................................................................................31
2.5.1 Documentation Worksheet Menus and Toolbar Buttons ....................................................32
2.5.2 Note Cells............................................................................................................................32
2.6 Report Worksheet..........................................................................................................................33
2.6.1 Report Worksheet Menus and Toolbar...............................................................................34
2.6.2 Report Configuration...........................................................................................................34
3.0 Menu and Tool Commands....................................................................................35
3.1 File Menu........................................................................................................................................35
3.1.1 New......................................................................................................................................35
3.1.2 Open....................................................................................................................................36
3.1.3 Close....................................................................................................................................36
3.1.4 Import File(s).......................................................................................................................37
3.1.5 Save.....................................................................................................................................38
♦♦ii♦♦
Page 3

3.1.6 Save As ...............................................................................................................................38
3.1.7 Backup Database................................................................................................................39
3.1.8 Port Configuration................................................................................................................40
3.1.9 Page Setup..........................................................................................................................41
3.1.10 Page Header / Footer........................................................................................................42
3.1.11 Print Preview.....................................................................................................................43
3.1.12 Print ...................................................................................................................................44
3.1.13 Print Report .......................................................................................................................45
3.1.14 Recent Files 1, 2, 3, etc….................................................................................................45
3.1.15 Exit.....................................................................................................................................45
3.2 Edit Menu .......................................................................................................................................46
3.2.1 Undo....................................................................................................................................46
3.2.2 Redo....................................................................................................................................46
3.2.3 Remove Row.......................................................................................................................46
3.2.4 Hide Row.............................................................................................................................46
3.3 View Menu......................................................................................................................................47
3.4.1 Toolbar.................................................................................................................................47
3.4.2 Status Bar............................................................................................................................47
3.3.3 Zoom In................................................................................................................................47
3.3.4 Zoom Out.............................................................................................................................47
3.3.5 100%....................................................................................................................................48
3.4 Format Menu..................................................................................................................................49
3.4.1 Bold......................................................................................................................................49
3.4.2 Italic .....................................................................................................................................49
3.4.3 Underline .............................................................................................................................49
3.4.4 Alignment (Left, Center, Right)............................................................................................49
3.5 Instrument Menu ............................................................................................................................50
3.5.1 OM-550................................................................................................................................50
3.5.2 Read OM-5000....................................................................................................................51
♦♦iii♦♦
Page 4

3.6 Tools Menu.....................................................................................................................................52
3.6.1 Magnify Tool........................................................................................................................52
3.6.2 Notes Tool ...........................................................................................................................54
3.6.3 Line Color ............................................................................................................................55
3.6.4 Fill Color ..............................................................................................................................55
3.6.5 Move to Front ......................................................................................................................56
3.6.6 Move to Back.......................................................................................................................56
3.6.7 Move Forward .....................................................................................................................56
3.6.8 Move Back...........................................................................................................................56
3.6.9 Line......................................................................................................................................57
3.6.10 Rectangle...........................................................................................................................57
3.6.11 Round Rectangle...............................................................................................................57
3.6.12 Ellipse................................................................................................................................58
3.6.13 Polygon..............................................................................................................................58
3.6.14 Y-Reference.......................................................................................................................58
3.7 Window Menu ................................................................................................................................59
3.7.1 Cascade...............................................................................................................................59
3.7.2 Tile.......................................................................................................................................59
3.7.3 Open File.............................................................................................................................59
3.8 About Menu....................................................................................................................................60
3.8.1 Index....................................................................................................................................60
3.8.2 Using Help...........................................................................................................................60
3.8.3 DataWorker.........................................................................................................................61
3.8.4 Context Help........................................................................................................................61
3.8.5 Copy Button.........................................................................................................................61
APPENDIX A: Toolbar Buttons & Pull-Down Menus..................................................62
♦♦iv♦♦
Page 5
INTRODUCTION
ŸŸ How to Use This Manual
This Software User’s Guide explains how to use OM-550/5000 Windows Software.
This manual is written for users of varied experience. If a section covers information
you already know, feel free to skip to the next section.
• You do not need to be a computer expert to use this manual or the Software.
• The manual assumes you are familiar with Microsoft Windows 95, 98 or NT.
ŸŸ Terms Used in this Manual
The following statements describe special terms that will be in this manual.
• The Software will be referred to as DataWorker LE.
• Both of the OM-550 and OM-5000 series Dataloggers will be referred as a Logger.
• Workbook, contains all of the worksheets and the uploaded data set saved with file
extension (.DDW).
• Worksheet, the individual pages or sheets in the workbook file.
• Data Set, multiple data runs uploaded into the workbook file.
• Data Run / Experiment, the data uploaded from the Logger.
• Thermocouple, may be referred to as T/C
• Informs the user that the note includes important information.
• Informs the user that the note includes a handy software tip.
ŸŸ Fonts Used in this Manual
This manual uses a special font to indicate terms or words that can be found directly on
the PC display.
For Example: Select the Open command from the File menu to open a new workbook
file. This font indicates the words Open and File are actually found in the PC display.
♦♦v♦♦
Page 6
PC Hardware Requirements
Before the software can be used, a 486 or better computer that can run Windows 95,
98 or NT will be required to run the software.
If your current PC does not meet these requirements contact Customer support
for an alternitive software program.
Specific recommendations are as follows:
CPU, RAM, Hardware: Pentium processor
16 megabytes of RAM (minimum).
25 megabytes of free disk space (minimum).
Operating System: Windows 95, 98, or Windows NT.
Disk Drive: 3.5” high-density floppy disk drive or CD ROM drive.
Mouse: Windows compatible mouse, plugged into either a dedicated
mouse or serial port.
Serial Port: At least one port in addition to the one used for the mouse.
Video: Color VGA or better graphics adapter and appropriate video
monitor. (SVGA is highly recommended)
Printer: Color printer is recommended.
It is recommended that the software not be run on a computer that is using a
software program that doubles the computer’s RAM.
♦♦vi♦♦
Page 7
Software Installation
Before the Software is installed, read the README file (any standard text viewer can
be used). The README contains the latest information on DataWorker LE software
and installation instructions.
ŸŸ Installing DataWorker LE on a PC with Windows 95, 98 or NT
All running applications must be closed before installing the software.
1. Insert disk 1 or the CD in the respective drive.
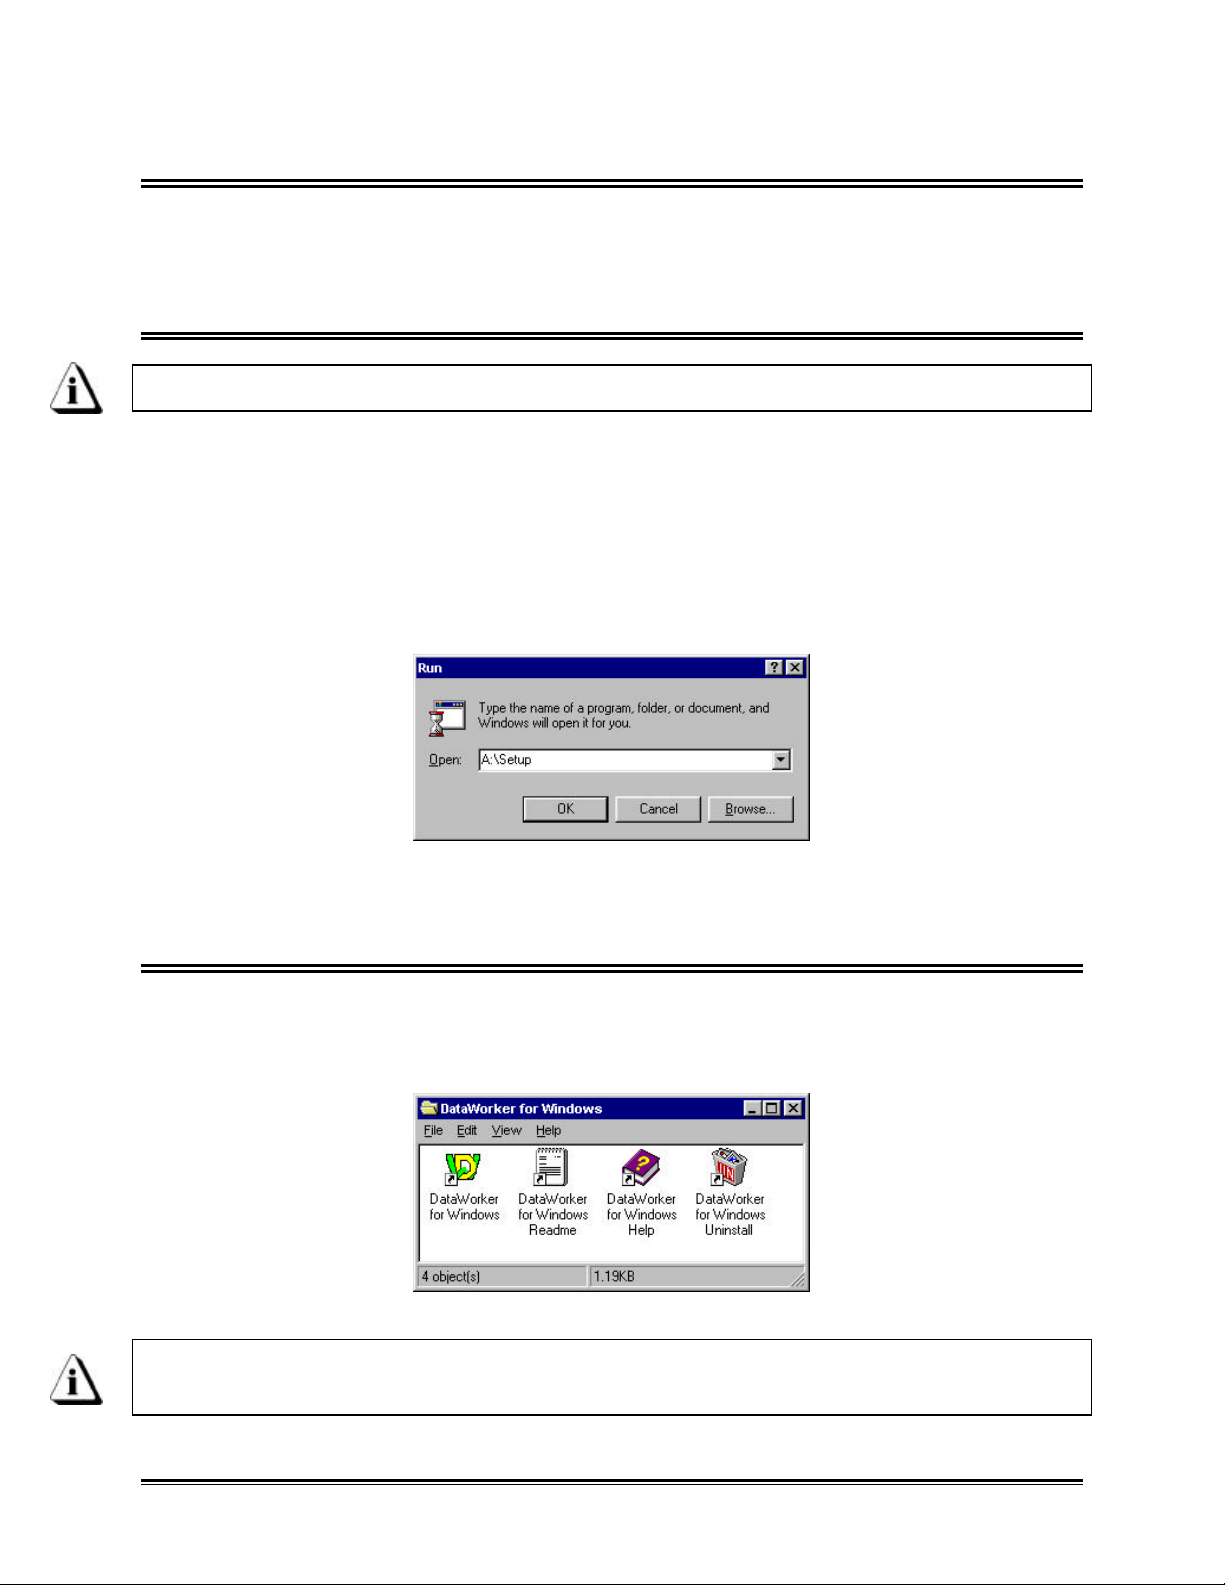
2. Select Run from the Start up menu.
3. Type the drive name, colon, backslash and Setup in the Open text box and click
the OK command button.
For example, if disk 1 is inserted into the “A” drive type A:\Setup.
Run Dialog Box
4. Closely follow the setup instructions provided with the software
ŸŸ Starting the Software
After the software is installed, start the software program by either double-clicking the
DataWorker icon from the program group or select it from the DataWorker for Windows
program sub-menu.
Program Group
Once the software installation is complete, it is important to start the software
and configure the communication port (refer to section 3.1.8 Port Configuration)
♦♦vii♦♦
Page 8
1.0 A Look at DataWorker LE
SPLIT BAR
TOOLBAR
SCROLL ARROWS
This section presents an overview of a DataWorker LE workbook management window.
When DataWorker LE is started, it will automatically load the previously saved
workbook file. In the case when DataWorker LE is first installed and started it will load
the sample workbook file supplied with the software (i.e. DWsample.ddw).
1.1 DataWorker LE Workbook Features
The workbook has several features as described in the following section:
MENUS
TITLE BAR
VERTICAL SCROLL BAR
HORIZONTAL SCROLL BAR
WORKSHEET TAB
STATUS BAR
WORKSHEET TABS
Figure 1-1: Workbook Features
♦♦1♦♦
Page 9

• Title Bar: This bar contains the program name, version and the active workbook
file name.
• Menus: These menus contain the commands and tools for each worksheet. Each
worksheet may contain different commands to supply specific function for each
worksheet. Individual worksheet menus are described in detail in their specified
sections of this manual.
• Toolbar: The Toolbar has buttons to serve as shortcuts to the menu commands.
Individual worksheet toolbar buttons are described in detail in their specified
sections of this manual. Each worksheet may have different items on the toolbar
because of the different commands offered by each worksheet.
• Worksheet Tabs: These tabs are used to gain access to each worksheet.
• Worksheet Scroll Arrows: These arrows are used to view other worksheet tabs
when they are covered by the Horizontal scroll bar.
• Split-bar: This bar slides the Horizontal Scroll bar to the left or right so all or part
of the worksheet tabs can be viewed.
• Status Bar: This bar on the bottom of the worksheet display shows the available Help
information, current date and time.
• Horizontal Scroll Bar: This bar scrolls the worksheet display horizontally left
and right.
• Vertical Scroll Bar: This bar scrolls the worksheet display vertically up and
down.
♦♦2♦♦
Page 10
1.2 Standard Worksheet functions
1.2.1 Worksheet tabs
There are six standard worksheets each having a tab for easy access. These tabs are
located on the bottom left of the display.
Figure 1-2: Worksheet Tabs
1.2.2 Selecting Worksheets
To view a worksheet, use the mouse pointer to click on a worksheet tab. The worksheet
tab will then become highlighted, and the worksheet will now be visible.
The keyboard does not allow access to the worksheets. The only way to select
the worksheet is by using the mouse pointer.
Figure 1-3: Selecting a Worksheet
1.2.3 Split-bar
The Split-bar on the tab bar lets the user slide the Horizontal scroll bar to the left or
right, so all of the worksheet tabs can be viewed. This feature is located where the on
the left edge of the Horizontal scroll bar.
1.2.4 Worksheet Tab Scroll Arrows
Worksheet tabs may be hidden behind the horizontal scroll bar. To view them the user
can either use the Tab Scroll Arrows located on the left of the worksheet tabs or use
the Split-bar.
♦♦3♦♦
Page 11
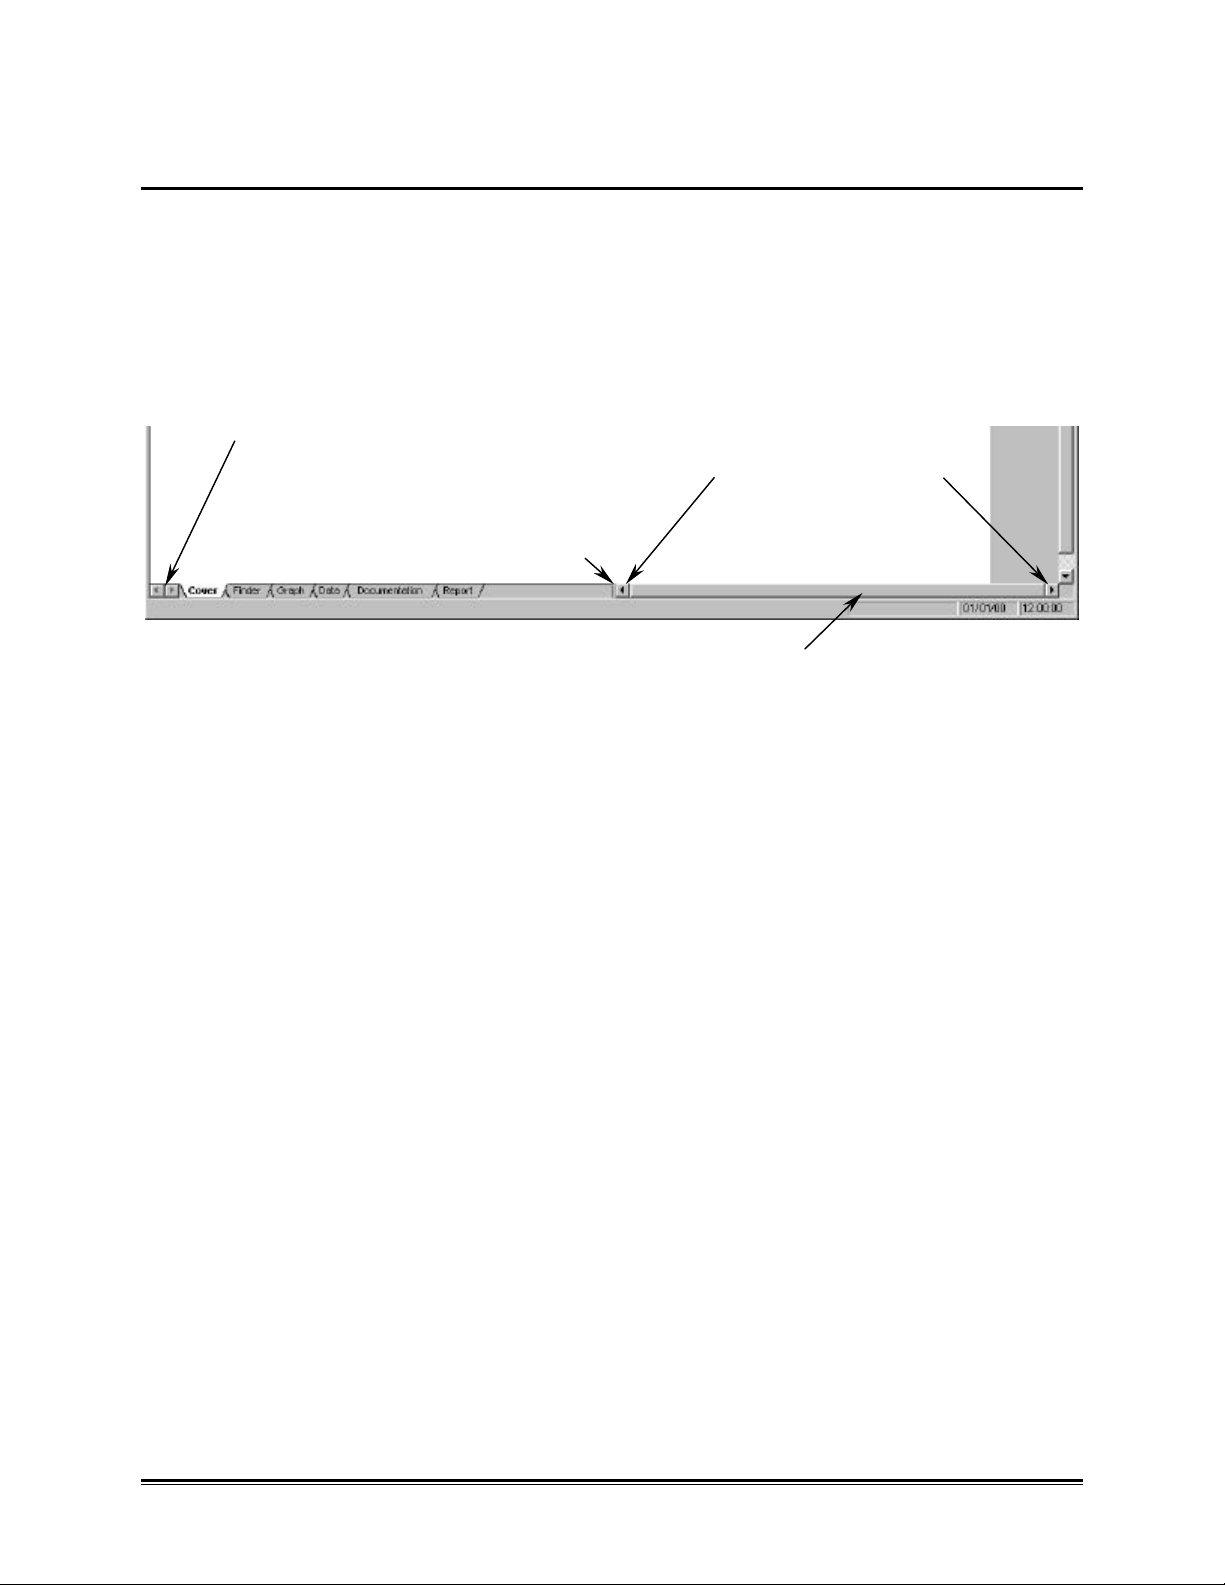
1.2.5 Scrollbars
SLIDE TO VIEW WORKSHEET TABS
The worksheets have both Horizontal and Vertical screen scroll bars so the non-visible
areas of the worksheet can be scrolled into view. The Horizontal scroll bar is located in
the lower right corner and can be scrolled left or right by pressing the left or right
arrows located on each end of the scroll bar. The user may also scroll the display by
sliding the center scroll bar left or right. The Vertical scroll bar located on the right side
of the screen has the same features as the Horizontal scrollbar except it scrolls the
worksheet display up and down.
CLICK HERE TO SCROLL WORKSHEET TABS
CLICK AND DRAG TO SLIDE THE VIEW HORIZONTALLY
Figure 1-4: Worksheet Options
CLICK TO SINGLE
STEP WORKSHEET
VIEW LEFT OR RIGHT
♦♦4♦♦
Page 12
2.0 Worksheet Descriptions
MENUS & TOOLBAR
COMPANY NAME TEXT BOX
The following sections offer brief explanations for the worksheet functions and how they
benefit the user. Refer to section 3.0 Menu and Tool Commands for information on how
to use all of the menu commands.
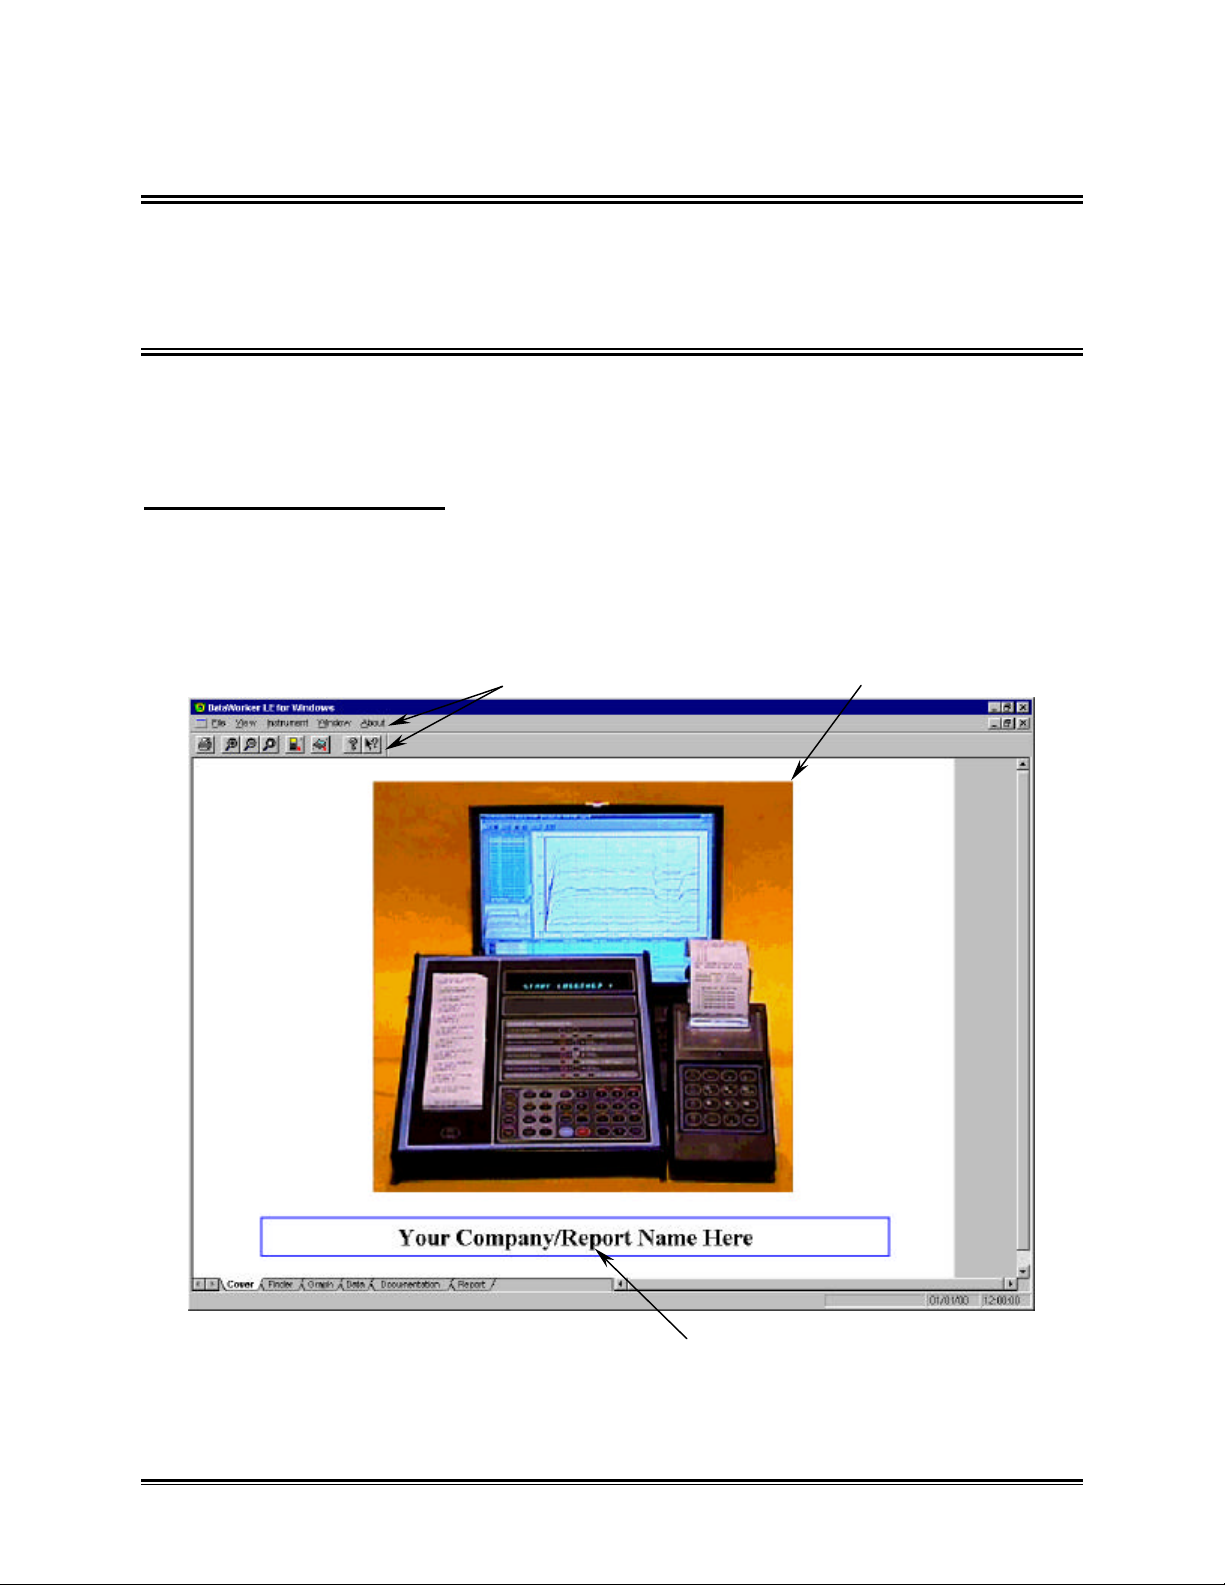
2.1 Cover Worksheet
The Cover worksheet is the introductory worksheet. This worksheet contains an
introductory picture of an OM-550, OM-5100, and a text box for entering a company or
workbook name.
Cover worksheet features:
• Menus and Toolbar
• Report Image
• Company Name Text Box
REPORT IMAGE
Figure 2-1: Welcome Worksheet
♦♦5♦♦
Page 13
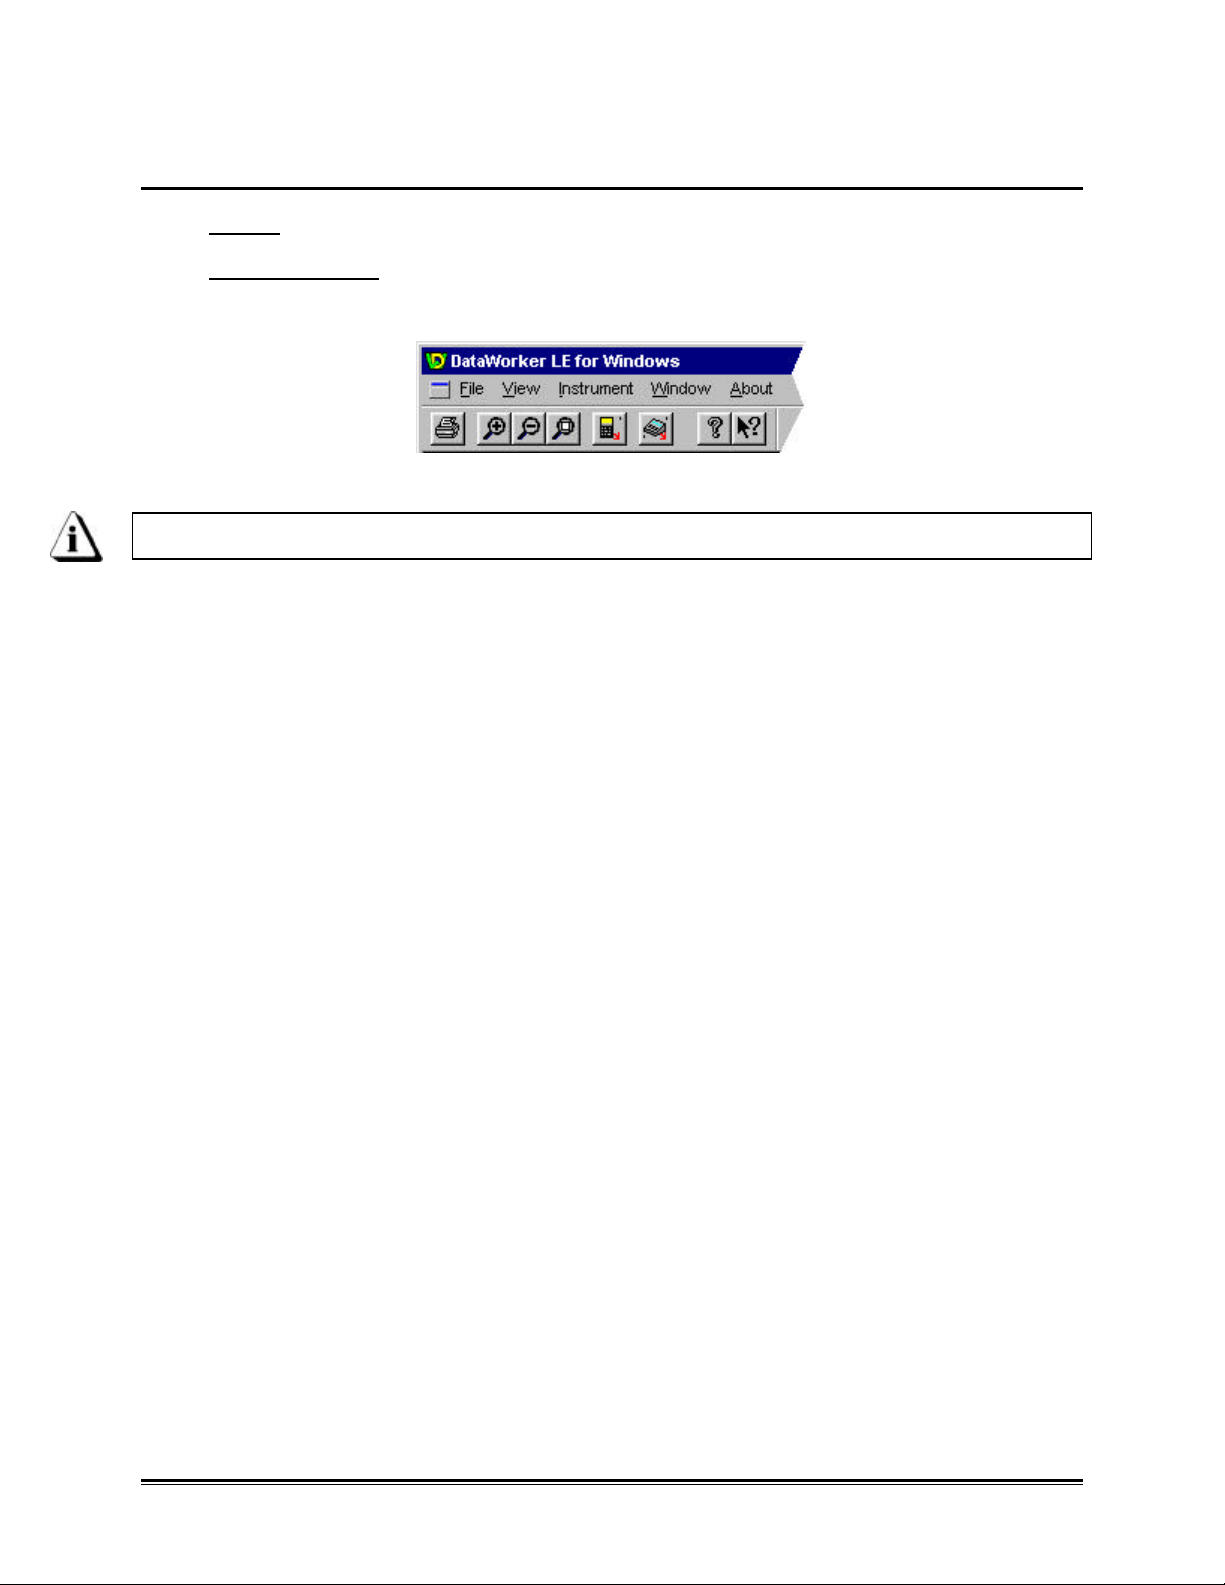
2.1.1 Cover Worksheet Menus and Toolbar
• Menus: File, View, Instrument, Window, and About.
• Toolbar Buttons: Print, Zoom In, Zoom Out, 100%, Read OM-550, Read OM-
5000, About, and Context Help.
Figure 2-2: Cover Worksheet Menus and Toolbar Buttons
The dimmed menu commands are used in other worksheets.
♦♦6♦♦
Page 14
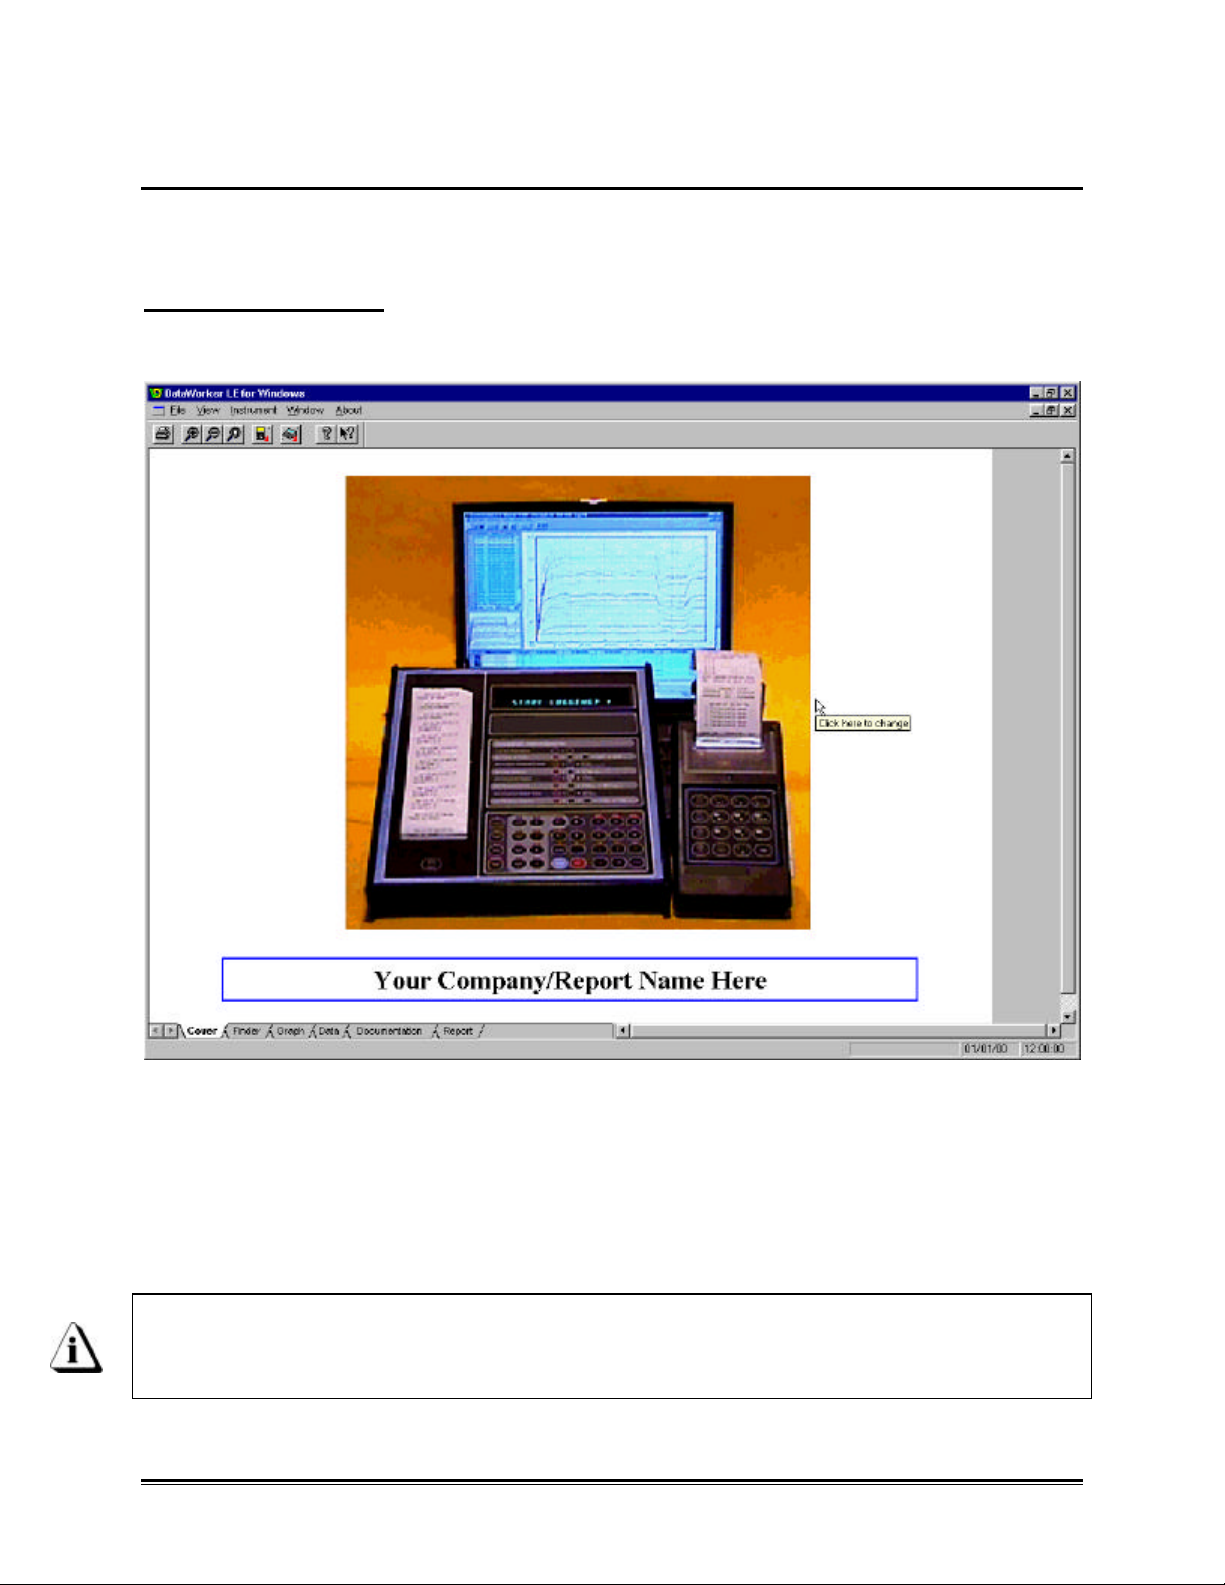
2.1.2 Report Image
The image located on the Cover worksheet can be changed to insert a custom
company logo or image that relates to the report.
To change an image:
1. Using the mouse pointer, click the image in the blue box and a list box will appear.
Figure 2-3: Changing an Image
2. Navigate to the folder where the desired image file is and highlight by clicking it
once. The image files supported by the software are Dib-(.dib), Gif (.gif), Pcx
(.pcx), Tiff (.tiff), Targa (.tga), Bitmap (.bmp) and Jpeg (.jpg).
3. Click the OK command button to insert, or Cancel to return to the Cover
worksheet without making any changes.
Once an image (picture or logo) is selected, a copy of that image is added to the
“Images” file folder located in the workbook directory. This allows the user to
easily locate any image or logo.
♦♦7♦♦
Page 15
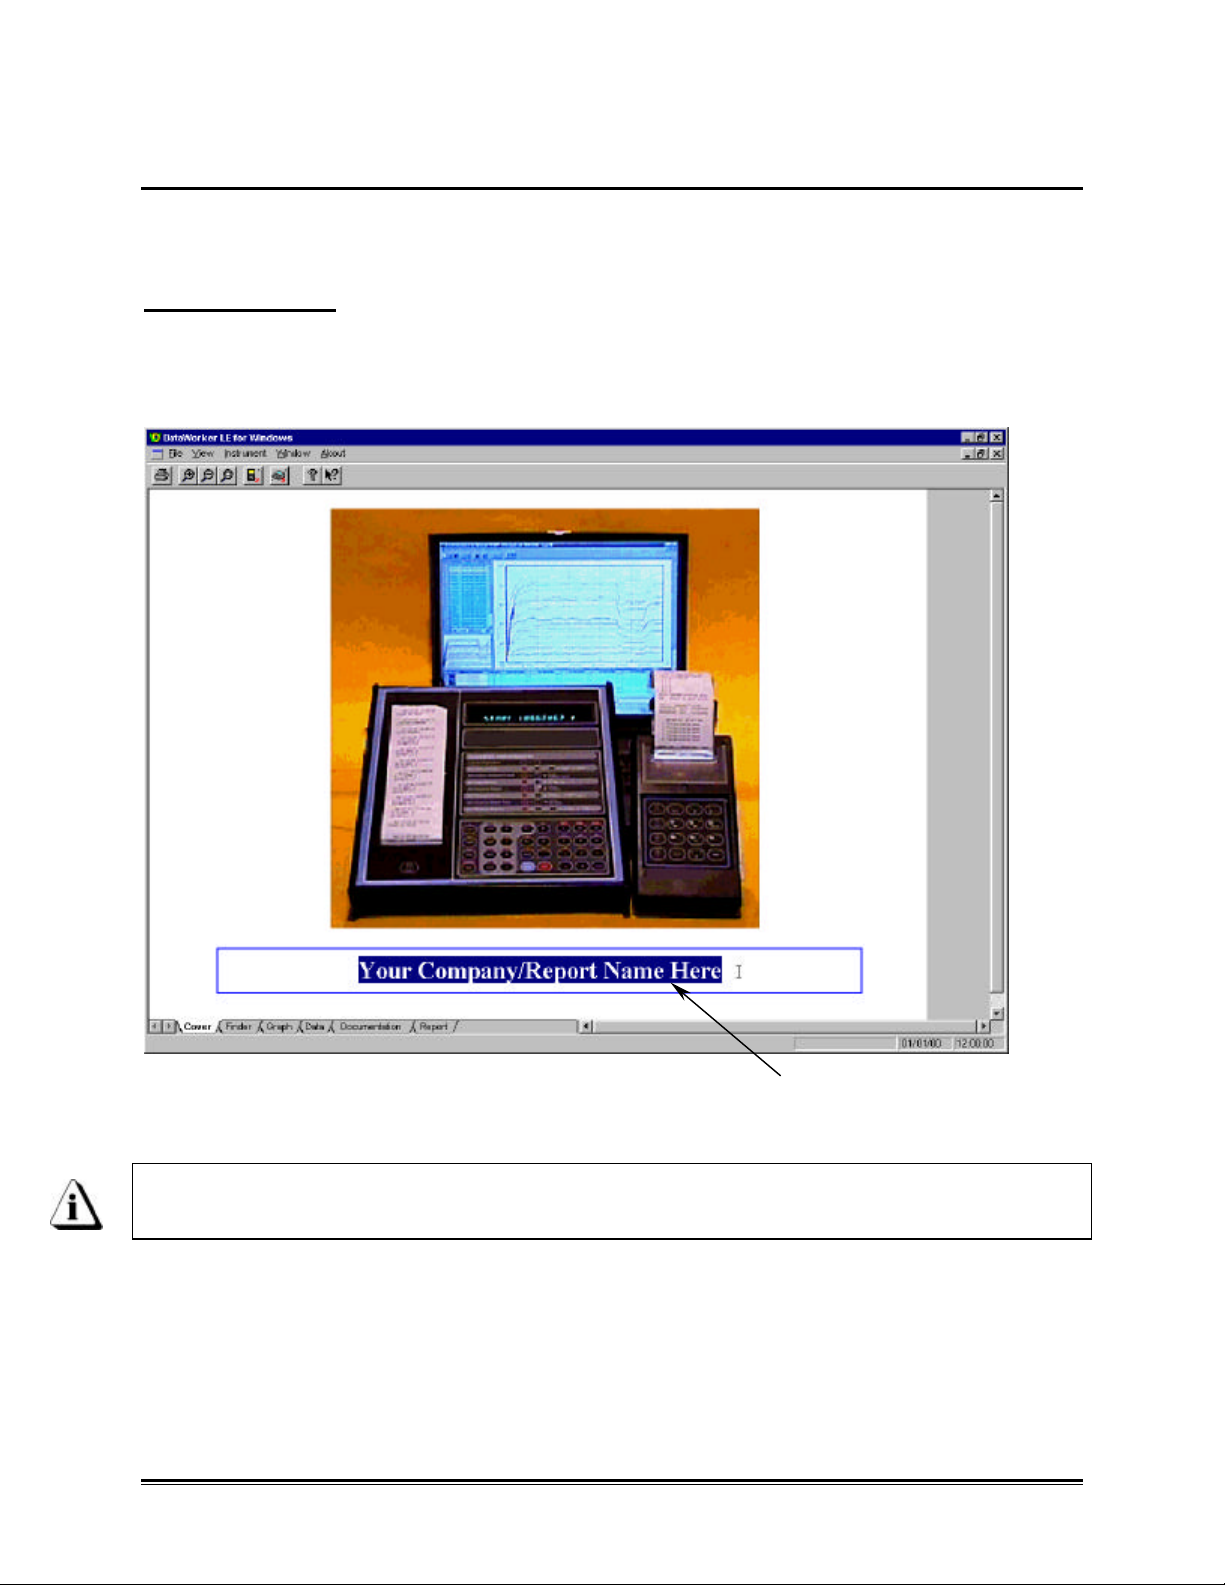
2.1.3 Company/Report Name
The text box located on the bottom half of the Cover worksheet allows the user enter a
company or report name.
To enter a name:
1. Using the mouse pointer, highlight the text in the text box.
2. Type a desired name and then hit the [enter] key to accept or [esc] to cancel.
HIGHLIGHTED TEXT
Figure 2-4: Entering a Company Name
The text in the Company name text box is automatically entered in the Company
parameter on the Finder worksheet everytime data is uploaded into the program.
♦♦8♦♦
Page 16
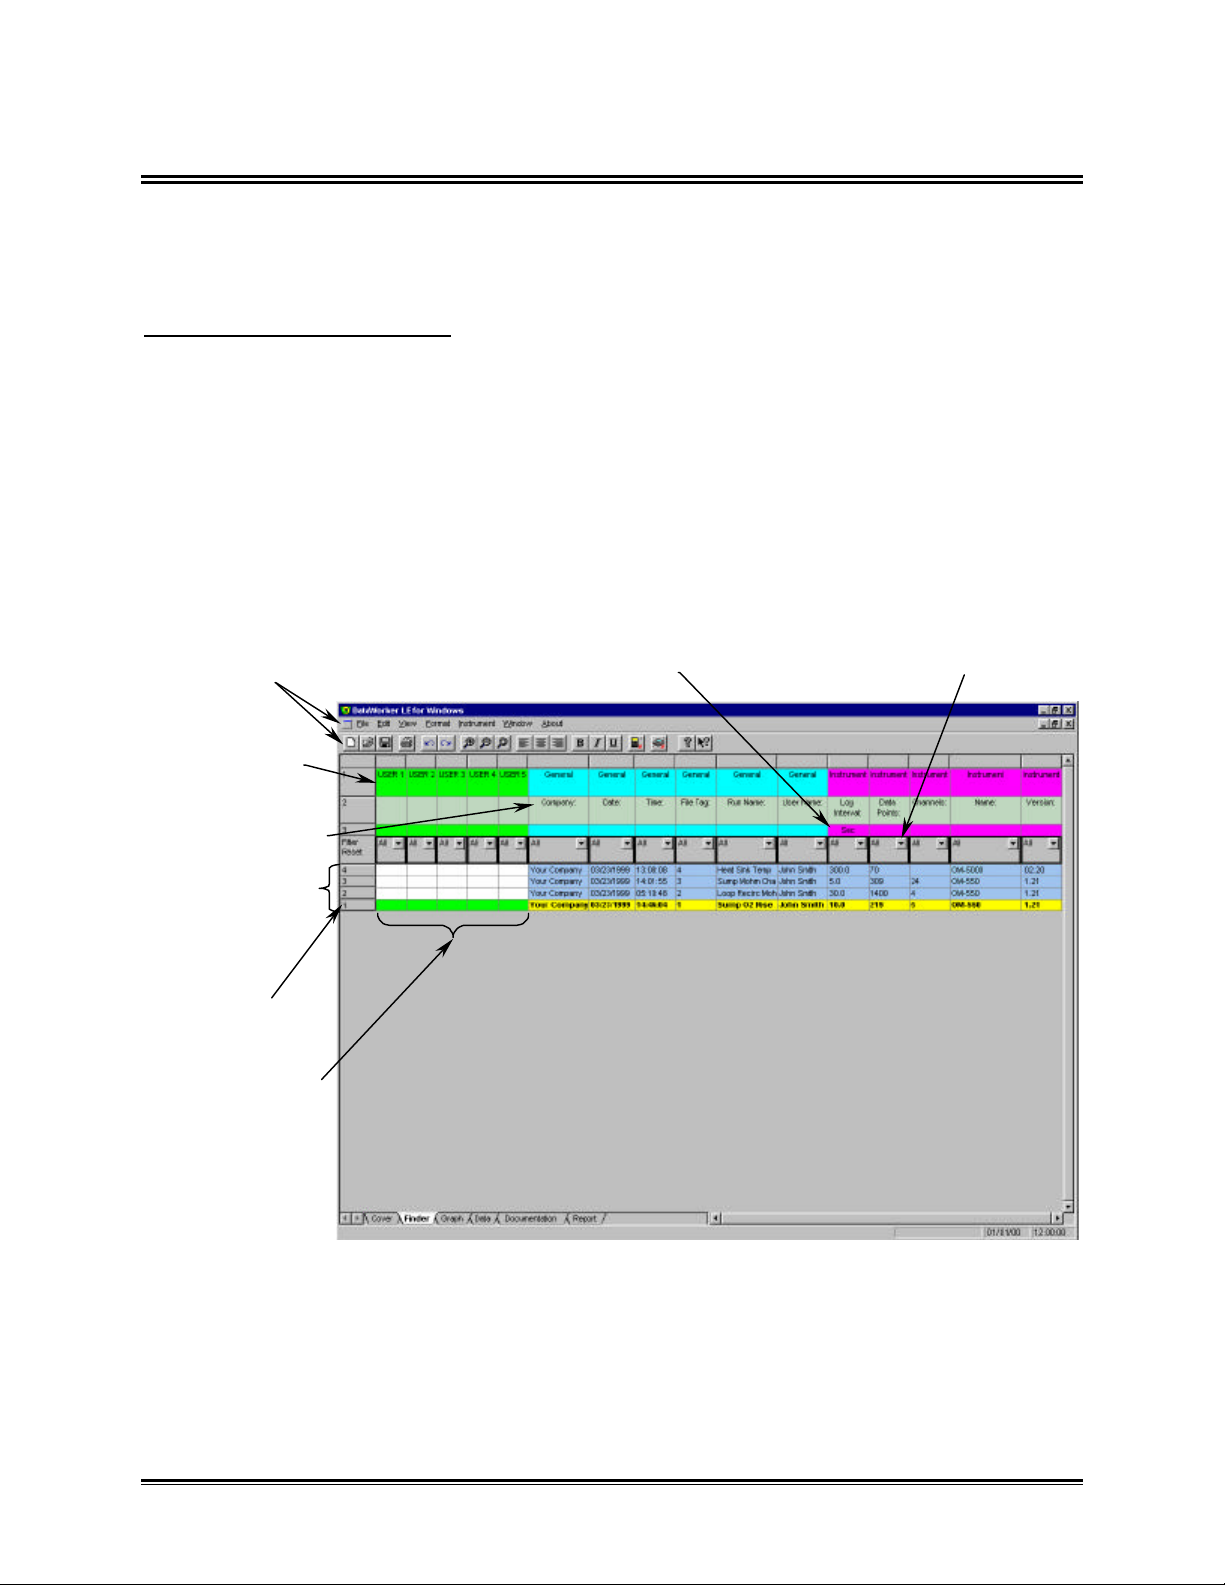
2.2 Finder Worksheet
MENUS &
PARAMETER UNITS
FILTERS
DATA RUN
COLUMNS
The Finder worksheet contains the data collected by the Logger and is in a standard
spreadsheet format. Each row represents one data run which gives the user easy
access and indexing to each data run.
Finder worksheet features:
• Menus and Toolbar
• Parameter Groups (color coded)
• Parameter Labels
• Data Run Rows
• User Definable Columns
• Parameter Units
• Filters
TOOLBAR
PARAMETER
GROUPS
PARAMETER
LABELS
DATA RUN ROWS
SELECTED
USER
DEFINABLE
Figure 2-5: Finder Worksheet
♦♦9♦♦
Page 17
2.2.1 Finder Menus and Toolbar Buttons
• Menus: File, Edit, View, Format, Instrument, Window and About.
• Toolbar buttons: New, Open, Save, Print, Undo, Redo, Zoom In, Zoom Out, 100%,
Align left, Center, Align right, Bold, Italic, Underline, OM-550, Read OM-5000, About
and Context Help.
Figure 2-6: Finder Worksheet Menus and Toolbar Buttons
The dimmed menu commands are used in other worksheets.
2.2.2 Parameter Group Row
The Parameter Groups are the headers for a specific group of data parameters
collected by the Logger. The Parameter Groups are color coded with the associated
Parameter Labels so they will be easily identified together.
PARAMETER GROUP
Figure 2-7: Parameter Group
The Parameter Groups are defined as the following:
User Defined Parameter Group: These parameters have white cells indicating
they can be used to enter text to help tag the row
with unique information about that data run.
General Parameter Group: This group contains file information associated
with the data run such as date and time (of data
run) and the data file tag.
Instrument Parameter Group: This group contains the programmed information of
the Instrument that was used to collect data.
♦♦10♦♦
Page 18
2.2.3 Parameter Labels
The Parameter Labels are where all of the specific parameters in each group are
named.
PARAMETER
LABEL
Figure 2-8: Parameter Label
Parameter Label column width can be adjusted to be larger or smaller by placing
the mouse pointer over a line dividing the parameter columns and sliding it to the
desired width.
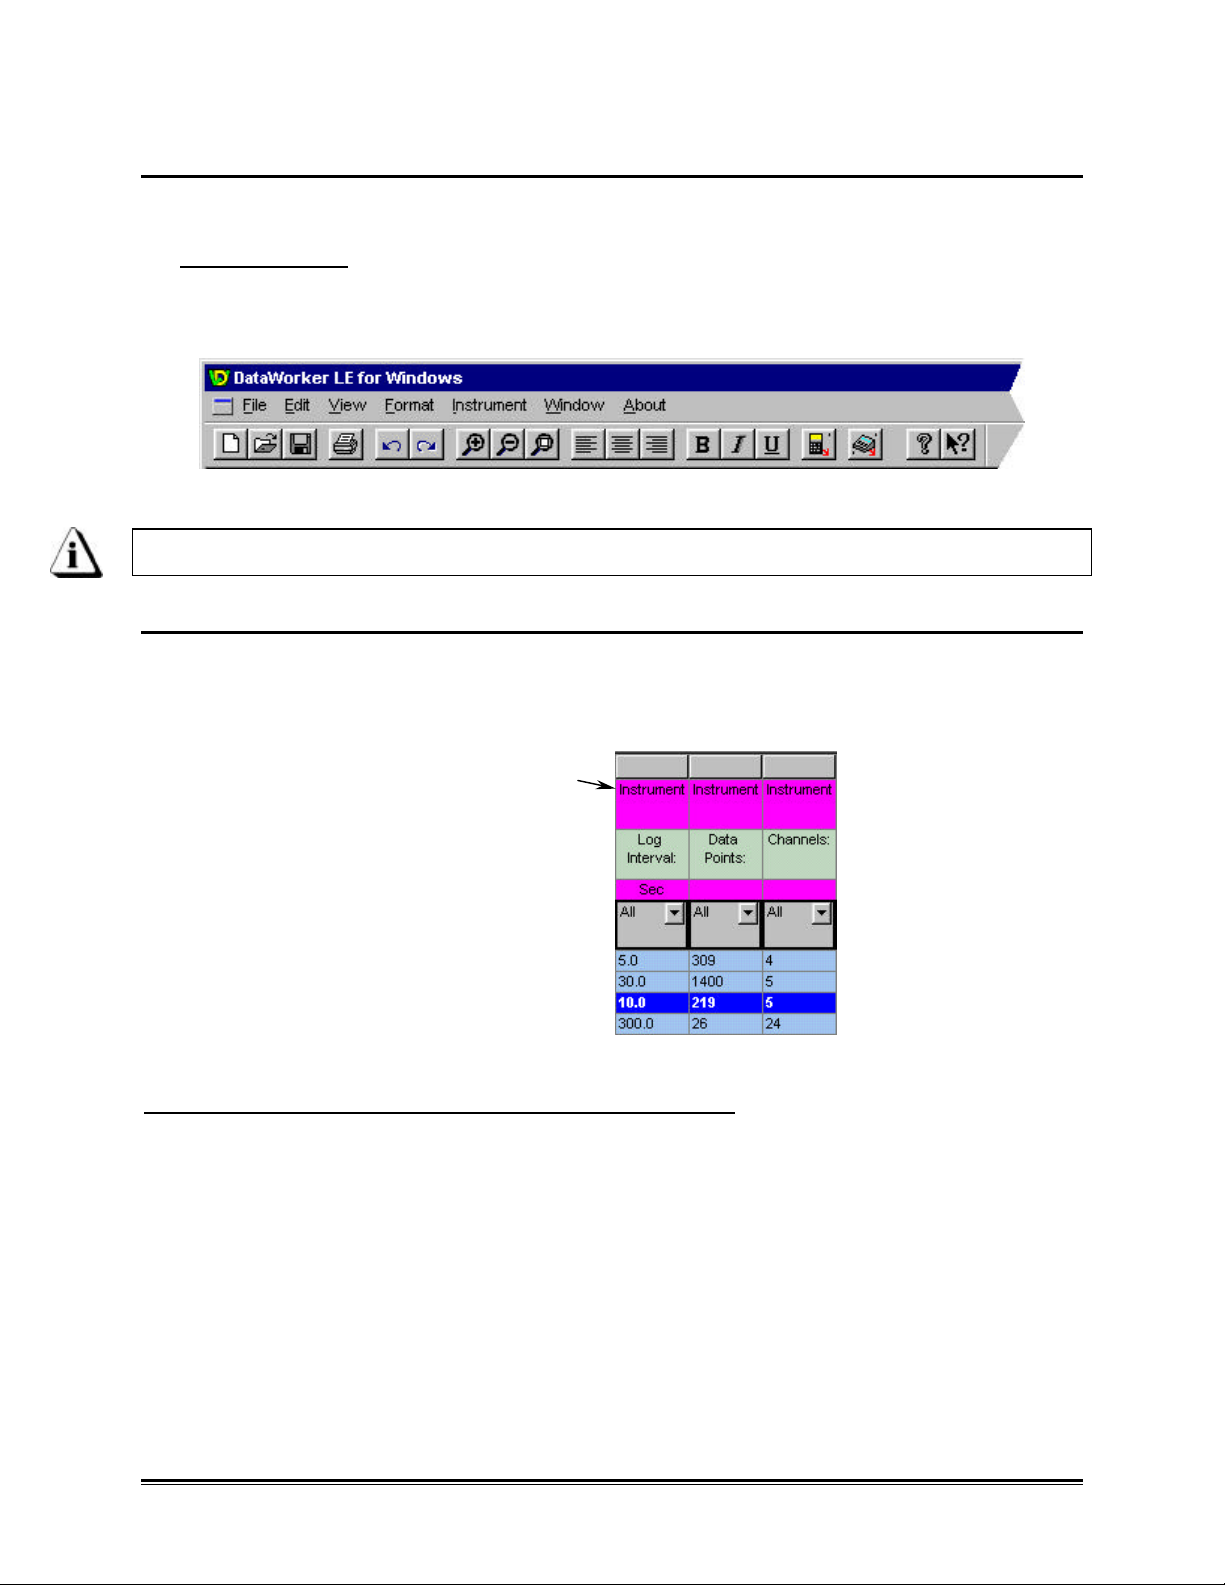
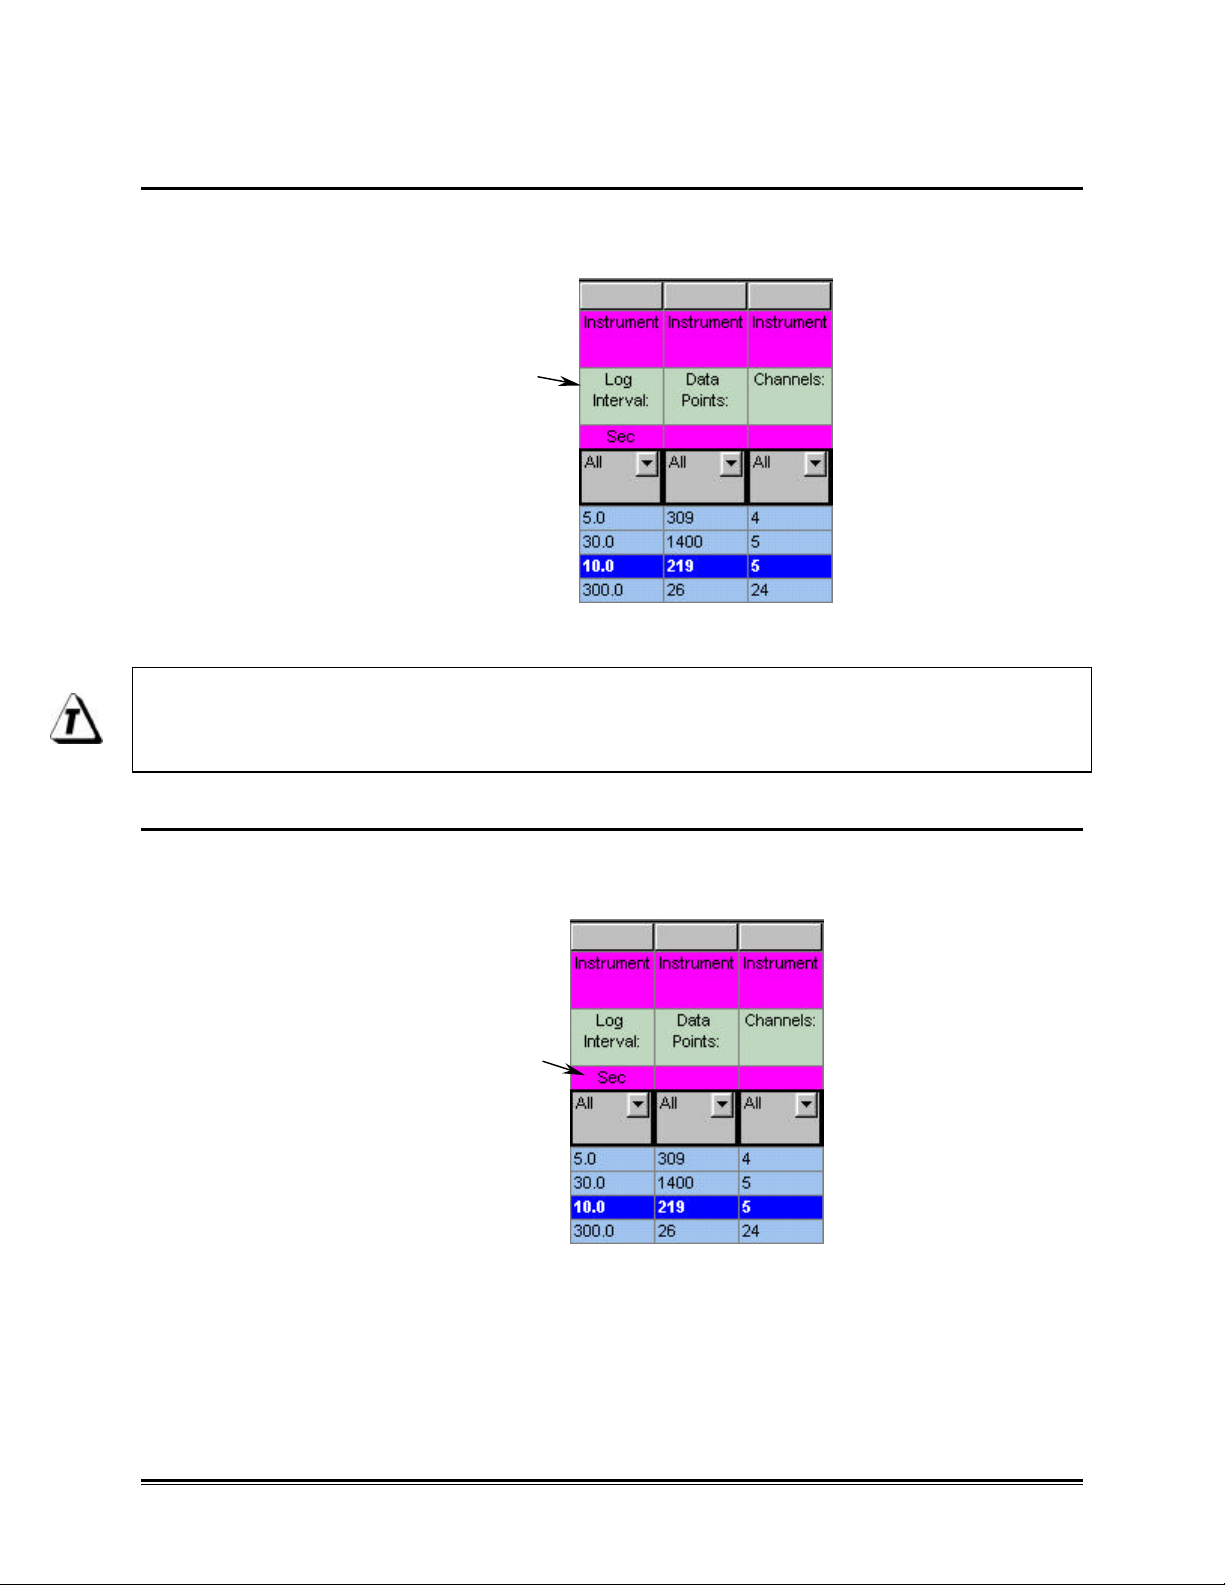
2.2.4 Parameter Units
The Parameter Units are the units of measurement for that parameter. For example, in
the Instrument Parameter group the Parameter Log Interval is in Seconds.
PARAMETER
UNITS
Figure 2-9: Parameter Units
♦♦11♦♦
Page 19
2.2.5 Data Run Rows
All of the data runs uploaded into the workbook file are listed on the Finder worksheet
as individual rows. The first data run uploaded into the workbook file is in the bottom
row and the most recent data run uploaded is in the top row.
When any data run row is selected, all of the cells in the entire row are highlighted in
purple and blue. The purple cells indicate that the cells can be modified and the blue
cells indicate the data cannot be modified.
When any individual data cell in a data run row is selected, all of the cells in the entire
row are highlighted in green and yellow. The green cells indicate that the cells can be
modified and the yellow cells indicate the data cannot be modified.
The data run rows can also be moved into any order desired. This is useful when the
user wants to place similar data runs together.
To change the order of the data run:
1. Select the number cell of a data run row with the mouse pointer. The row will
then become highlighted in purple and blue.
2. Drag the row and drop it to a desired location.
Figure 2-10: Drag and Drop Data Rows
Entire selected rows and columns can be copied and pasted into other
spreadsheet applications by pressing keys (CTRL + C) to “copy” and then
“pasted” by pressing keys (Ctrl + V).
♦♦12♦♦
Page 20
2.2.6 Filters
There are Filters for each parameter label that filter specific data out of data runs so
the user can easily compare similar data.
Filtering more than one column at a time acts as a Logical AND Function. All
conditions of all set filters must be met for data row(s) to remain.
To use the Filter function:
1. Click the Filter button to reveal the unique data as populated in that column
under that particular parameter label.
2. Select a desired data value to filter, or the two standard filters All and Special.
FILTER
ARROW
BUTTON
Figure 2-11: Filter Function
To use the All option:
1. Select All to reset the filter for that column and view all of the data run rows that
meet the other column filters.
To use the Special option:
1. Select Special to select data run rows within a range of values. There are
multiple options to select information to filter by clicking the appropriate
relational operators option button (See Figure 2-12). The user can either select
data from a populated list or type it in the text box on the top of the column.
= equal to >= greater than or equal to
> greater than <= less than or equal to
< less than <> Not equal to
Figure 2-12: Relational Operators
♦♦13♦♦
Page 21
2. Select a data filter by:
• Clicking the greater than relational operator option button beside the left data
column.
• Click a Parameter value from the list or type it in the text box.
• Click the AND logical operator option button.
• Click the less than relational operator option button beside the right data
column.
• Click a Parameter value from the list or type it in the text box.
The Clear command button can be selected at any time to clear the selections and
the new values can be selected.
3. Click the OK command button to accept the selected data filters or Cancel to
return to the worksheet without executing the filter request.
Figure 2-13: Special Filter Feature Dialog Box
In this example the data filtered would be all times between, but not including 13:08:08
and 14:46:04.
To reset all of the data set rows to restore the entire data set, click the Red Filter
Reset button on the Finder worksheet.
♦♦14♦♦
Page 22
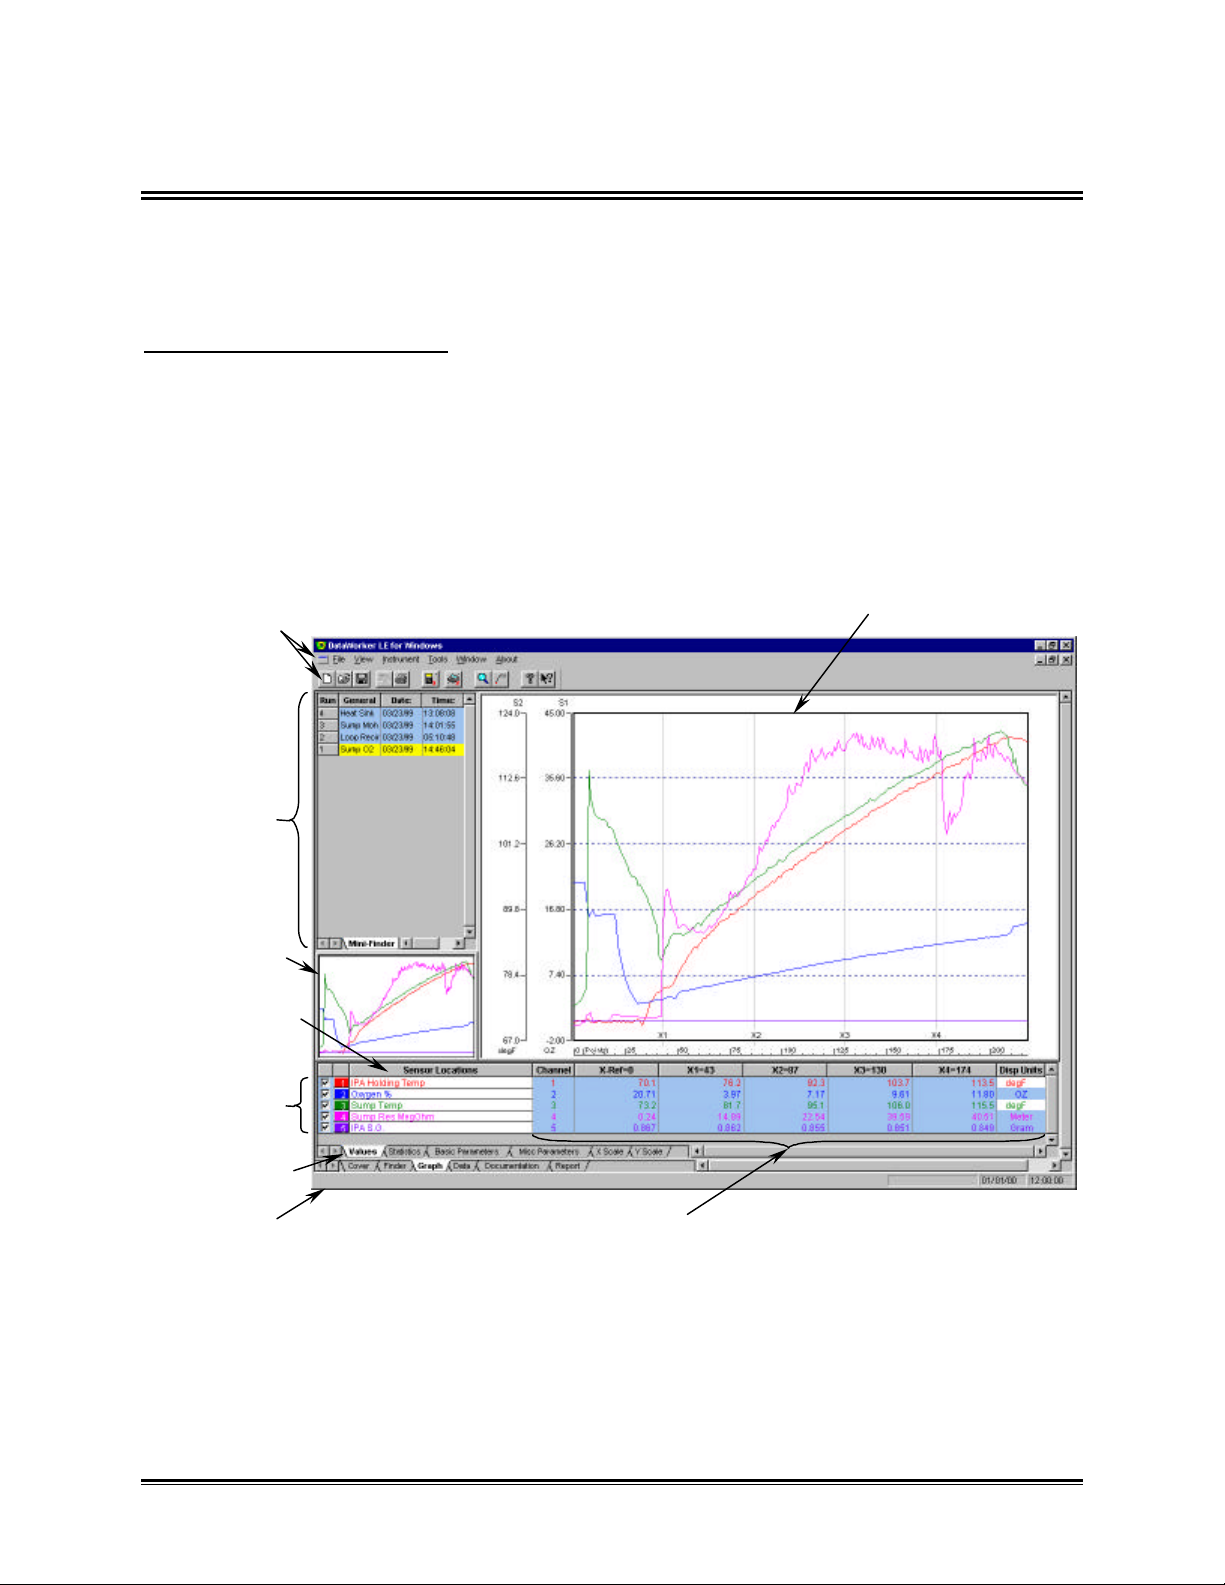
2.3 Graph Worksheet
DATA GRAPH
MAGNIFY MAP
The Graph worksheet is where a selected Logger data run is represented graphically.
The software allows the user to analyze the data and to compute statistics based on
the data.
Graph worksheet features:
• Menus and Toolbar Ÿ Status Bar
• Mini Finder Ÿ Statistics Tabs
• Magnify Map Ÿ Data Table
• Channel Check Boxes Ÿ Data Graph
• Sensor Locations
MENUS &
TOOLBAR
MINI FINDER
SENSOR
LOCATIONS
CHANNEL
CHECK
BOXES
STATISTICS
TABS
STATUS BAR
DATA TABLE
Figure 2-14: Profile Worksheet
♦♦15♦♦
Page 23

2.3.1 Graph Worksheet Menus and Toolbar Buttons
• Menus: File, View, Instrument, Tools, Window, and About.
• Toolbar buttons: New, Open, Save, Copy, Print, Read OM-550, Read OM-5000,
Magnify, Notes, About, and Context Help.
Figure 2-15: Graph Worksheet Menus and Toolbar Buttons
The dimmed menu commands are used in other worksheets.
2.3.2 Mini Finder
The Mini Finder is a small version of the Finder worksheet that allows the user to select
other data runs to view without having to select them from the Finder worksheet.
Figure 2-16
The Mini Finder includes three parameter columns to identify the data runs. The
columns contain the data run Name, Date, and Time.
To select a data run, click the number of the data run in the left column. This will
highlight the entire row and load the graph data for viewing.
♦♦16♦♦
Page 24

2.3.3 Magnify Map
DATA TABLE
VERTICAL SCROLL BAR
When using the Magnify Tool this area of the Graphic worksheet shows a small map of
the entire graph and indicates the area currently magnified.
MAGNIFIED
AREA
Figure 2-17: Magnify Map
2.3.4 Data Table
The Data Table includes all of the data collected by the Logger and separated into
statistical format. The data is placed in rows and columns with descriptions to identify
each one. The amount of columns the Data Table contains varies depending which
statistic is active.
When there are more than six channels are used to collect data the vertical scroll bar
located on the right of the Data Table can be used to scroll up or down to view the
other channel data.
Another way to view more channels is to place the mouse arrow over the top edge of
the Data Table and slide it up until all of the desired channels are in view.
Figure 2-18: Data Table
The white cells in the Data Table are user configurable to allow the user to change a
Sensor Location description at any time by clicking the desired cell and then typing in a
new description for that particular channel. Some of the user configurable cells have
drop down lists to allow the user to manually select a desired unit for a desired sensor
channel.
♦♦17♦♦
Page 25

2.3.5 Sensor Location Descriptions
DATE & TIME
The Data Table includes Sensor Location descriptions (labels) that have individual
colors that indicate which Data Plot it represents. There is also a channel quantity
number above the channel numbers that indicates how many channels are used in the
data run.
SENSOR LOCATIONS
DESCRIPTIONS
CHANNEL
QUANTITY
Figure 2-19: Sensor Locations Descriptions
2.3.6 Channel Check Boxes
The Channel Check Boxes control whether the associated Data Plot is displayed on the
Data Graph and whether the statistical results for that channel are included in the data
table. To view or remove a Data Plot, click the channel check box beside a channel to
turn it “ON” or “OFF”
CHANNEL
CHECK
BOXES
Figure 2-20: Channel Check Boxes
2.3.7 Status Bar
The Status Bar shows the available Help information, current PC date and time.
HELP INFORMATION
Figure 2-21: Status Bar Features
• Help Information
When the mouse pointer is placed over a Toolbar button this area of the Status bar will
display the action that button performs.
• Date and Time
This area of the Status bar displays the current time and date of the PC.
♦♦18♦♦
Page 26

2.3.8 Data Tabs
The Data Tabs allow the user to view the different statistical channel sensor
information in the Data Table.
The Data Tabs are:
• Values
• Statistics
• Basic Parameters
• Misc. Parameters
• X Scale
• Y Scale
Only one Data tab can be active at a time and each is described in the following
sections.
When either the Values or Statistics data tab is active and the Magnify tool is
used to zoom in on a portion of the Data Graph, the Data Table displays the
statistics for those values that are displayed in the zoomed area.
2.3.8.1 Values
When Values is the active data tab, the Data Table lists the data at the point where an
X-Cursor intersects a Data Plot. The X-Cursor value can be changed at any time by
moving the X-Cursor (refer to the descriptions in section 2.3.9.4 X-Cursors). When an
X-Cursor is moved, the values in the Data Table are automatically updated.
Values in the Data Table reflect the selected unit type of the X and Y-axis units.
♦♦19♦♦
Page 27

2.3.8.2 Statistics
When Statistics is the active data tab, the first four columns of the Data Table displays
the Minimum and Maximum data or value point found for each Data Plot and the value
of X in (time, distance, or point number) at which it occurs.
The last two columns of the Data Table display the Average (Mean) and Standard
Deviation of the data values recorded for each channel.
If a portion of the Data Graph is magnified using the Magnify tool, the Data Table
displays the Mean and Standard Deviation of the values displayed on the graph.
2.3.8.3 Basic Parameters
When Basic Parameters is the active data tab, it displays all of the Basic parameters and
programmed data of the Logger.
2.3.8.4 Misc. Parameters
When Misc. Parameters is the active data tab, it displays special parameters and
programmed data that are unique to the OM-550 and OM-5000.
♦♦20♦♦
Page 28

2.3.8.5 X Scale
When X Scale is the active data tab, it displays the current information for the X Scale.
The X Scale tab also includes a column of check boxes to turn a Channel Lag “ON”.
Once the Channel Lag is enabled the user can enter the Lag Points difference between
one to another channel.
DataWorker LE can use channel lag information to align the Data Plots so the user can
compare the results more easily during analysis.
The user can also select the type of scale for the X-Units using the X-Units column.
The different X-Units are Point, Time Relative (Time measure from process origin), and
Time Absolute (Time of day). Refer to section 2.3.9.5 X-axis Units for more information.
2.3.8.6 Y Scale
When Y Scale is the active data tab, it displays the current Y Scale information.
DataWorker LE has a powerful Autoscaling feature that automatically scales the Data
Graph so the data will always be visible and easy to work with. DataWorker LE will
automatically select a range of values for both the X and Y-axes to ensure that all the
data fits on the screen.
The Y Scale Tab also includes option buttons so the user can select three different Yscales or have DataWorker LE software automatically determine a scale for individual
channels.
To change the range of Y-values for each channel enter the minimum and maximum
scale values in the Scale-min and Scale-max cells for each one.
♦♦21♦♦
Page 29

2.3.9 The Data Graph
The Data Graph is a powerful yet simple display that shows a graph of data collected
from one data run. The user can customize the Data Graph using the following
features:
• X and Y-Axes and Labels
• Data Plots
• X-Ref(erence)
• X-Cursors
• X-axis Units
The features of the Data Graph are described in the sections that follow. Some of these
features described are also controlled using the appropriate menu options. Refer to
section 3.0 Menu and Tool Commands for more information.
2.3.9.1 X and Y-Axes and Labels
The Y-axis (vertical) contains the scale of the measured or dependent variable (i.e.
temperature, voltage, etc…). Lower values are at the bottom and higher values at the
top.
When data is being analyzed, the Y-axis includes scale units labeled on the left side of
the graph. These scales divide the vertical axis into equal parts and are automatically
scaled to fit the current Y-axis size. The Logger collects temperature data in either
Celsius or Fahrenheit but can be changed with the software program (refer to section
2.3.8.6 Y Scale for more details). Voltage data can also be scaled a necessary.
The X-axis (horizontal) contains values of the independent variable—data points
collected. The X-axis can be converted from data points or time (refer to section 2.3.8.5
X Scale for more details).
♦♦22♦♦
Page 30

2.3.9.2 Data Plots
DATA PLOTS
The Data Plots in the Data Graph represent the data for each of the channels on the
Logger. Each channel is represented by a different color and corresponds to the color
of its description in the Data Table shown in Figure 2-22.
Figure 2-22: Data Plots
A Data Plot in the Data Graph can be suppressed or restored at any time by clicking
the check box with the corresponding channel description in the Data Table. This
allows the user to view any combination of the Data Plots or individually.
When two or more Data Plot points overlap, they will overwrite each other in the
same order they appear in the Sensor Locations descriptions. For example, if a
channel 1 Data Plot point and a channel 3 point have the same values, only the
channel 3 Data Plot point appears.
♦♦23♦♦
Page 31

2.3.9.3 X-Ref(erence) Line
The X-Ref is a dashed vertical line at the left edge of the Data Graph, as shown in
Figure 2-23. The X-Ref line can be moved to the left or right to align the process with
the data.
X-REF
LINE
Figure 2-23: Process Origin
The X Ref column in the Data Table indicates the true position of the X-Ref line while it
is being moved. After the mouse button is released, the zero point of the X Scale
moves to the X Ref line.
When the Statistics Data tab is active and the user moves the X Ref line, the min.
and max X data will automatically update to reflect the new position.
To move the X-Ref line:
1. Select the X-Ref line by positioning the mouse pointer anywhere on the dashed
line.
2. Press and hold the left mouse button.
3. Move the line by dragging it left or right.
4. Release the mouse button when the X-Ref line is at the desired location.
♦♦24♦♦
Page 32

2.3.9.4 X-Cursors
X-CURSORS
The Data Graph has four X-cursors that indicate the Y-values at the intersection of a
Data Plot with each X-Cursor. These values are displayed in the Data Table in four
data columns labeled X1, X2, X3, and X4, representing X-Cursor 1 through X-Cursor 4.
Figure 2-24: X-Cursors
When an X-Cursor is moved to a new position, it automatically moves to the closest
real X-value. Notice on highly magnified graphs that the cursor jumps from point to
point. In an extreme case, if the graph is so highly magnified that there are no real Xvalues to move to, the X-Cursors cannot be moved at all.
To move an X-Cursor:
1. Position the mouse pointer over an X-Cursor vertical line then press and hold
the left mouse button and drag it left or right releasing the mouse button when
the X-Cursor is at the desired location.
The position of an X-Cursor controls the values displayed in the Data Table.
When an X-Cursor is moved, values in the Data Table are automatically updated.
♦♦25♦♦
Page 33

2.3.9.5 X-axis Units
SCALE
The user can select three different types of X scales for the X-axis. The scales are
Point, Time Relative (time measure from process origin), and Time Absolute (time of
day). To select a scale go to the X Scale Statistics tab and click an X-Units cell. Select
the drop down list arrow and the X-scale list will appear. Select a desired scale and the
X Scale will then automatically change to the new scale.
Figure 2-25: Scale Types
LOGGED
POINT
TIME
RELATIVE
TIME
ABSOLUTE
♦♦26♦♦
Page 34

2.4 Data Worksheet
MENUS AND TOOLBAR
The Data worksheet contains the numerical format of the data collected by the Logger.
Each channel has an individual column starting from the left edge of the worksheet.
The column header rows include the Instrument and Basic Parameters and the
remaining rows are the individual data points for each channel.
Data worksheet features:
• Menus and Toolbar
• Parameter Section
• Data Points
PARAMETERS
DATA POINTS
Figure 2-26: Data Worksheet
♦♦27♦♦
Page 35

2.4.1 Data Worksheet Menus and Toolbar Buttons
• Menus: File, Edit, View, Format, Instrument, Window, and About.
• Toolbar buttons: New, Open, Save, Print, Undo, Redo, Zoom In, Zoom Out,
100%, Left Align, Center, Right Align, Bold, Italic, Underline, Read OM-550
Read OM-5000, About, and Context Help.
Figure 2-27: Data Worksheet Menus and Toolbar Buttons
The dimmed menu commands are used in other worksheets.
♦♦28♦♦
Page 36

2.4.2 Individual Parameters
PARAMETERS
PARAMETERS
MISC PARAMETERS
DROP DOWN LIST
The Individual Parameters include the individual Instrument, Basic, and Misc.
Parameters for each channel.
When the user scrolls the display down to view data points the Instrument parameters
always remain at the top of the columns as reference headers.
The Basic parameters are the same parameters as viewed on the Basic Parameter
Statistics Tab and these are the constant parameters that the OM-550 and OM-5000
have in common.
The last row in the parameter section includes a drop down list of parameters that are
unique to the OM-550 and OM-5000. To view click the drop down list arrow in the
appropriate cell and the drop down list will appear.
INSTRUMENT
BASIC
Figure 2-28: Parameter Section
♦♦29♦♦
Page 37

2.4.3 Individual Data Points
The individual data points collected during the data run are listed in individual cells for
analysis.
This type of spreadsheet format makes it easy to copy and paste the data into
other spreadsheet programs.
“HEADER” ROWS
X-1 CURSOR
Figure 2-29: X-Cursor Row
The X-Ref line and X-cursors also appear in the Data worksheet rows. The X-Ref is
green highlighted row of cells and the X-cursors are yellow highlighted cells and
labeled accordingly. These rows move when the user moves them on the Graph
worksheet. Refer to section 2.3.9.4 X-Cursors for more information.
Another feature of the Data worksheet is when the user magnifies an area on the Data
Graph the magnified data points are highlighted on the Data worksheet with shaded
light green cells.
♦♦30♦♦
Page 38

2.5 Documentation Worksheet
The Documentation worksheet is where notes or messages can be saved. For example
an engineer can keep a production journal by typing a message in a cell explaining
specific instructions on how the experiment was setup on a particular day.
This worksheet is also helpful when conclusions have been drawn from the data and its
analysis may be documented here for later inclusion in a final report.
Documentation worksheet features:
• Menus and Toolbar
• Note Cells
MENUS &
TOOLBAR
NOTE
CELLS
Figure 2-30: Documentation Worksheet
♦♦31♦♦
Page 39

2.5.1 Documentation Worksheet Menus and Toolbar Buttons
• Menus: File, Edit, View, Format, Instrument, Window, and About.
• Toolbar buttons: New, Open, Save, Print, Undo, Redo, Zoom In, Zoom Out,
100%, Left Align, Center, Right Align, Bold, Italic, Underline, Read OM-550,
Read OM-5000, About, and Context Help.
Figure 2-31: Data Worksheet Menus and Toolbar Buttons
The dimmed menu commands are used in other worksheets.
2.5.2 Note Cells
The Note Cells are similar to a standard spreadsheet program and can be resized by
sliding the cell borders to show an entire note or message. The text in these cells can
also be formatted using the commands on the Format menu.
Figure 2-32: Example Note
♦♦32♦♦
Page 40

2.6 Report Worksheet
The Report worksheet allows the user to select various combinations of worksheets to
be printed using the Print Report command. This is a useful tool to print multiple
worksheets of the Workbook file in a report format.
Report worksheet features:
• Menus and Toolbar
• Report Configuration
MENUS AND
TOOLBAR
REPORT CONFIGURATION
Figure 2-33: Report Worksheet
♦♦33♦♦
Page 41

2.6.1 Report Worksheet Menus and Toolbar
• Menus: File, View, Instrument, Window, and About.
• Toolbar Buttons: Print, Zoom In, Zoom Out, 100%, Read OM-550, Read OM-
5000, About, and Context Help.
Figure 2-34: Report Worksheet Menus and Toolbar Buttons
The dimmed menu commands are used in other worksheets.
2.6.2 Report Configuration
This area of the worksheet is where the individual worksheets and Statistics tabs are
selected for report printing.
To setup and print a report:
1. Click the check box(es) to enable the desired worksheet(s) and Statistics tab(s)
to be printed.
2. Click the Print Report command button to accept the selection(s) and initiate
printing.
The Print Report command can also be selected from the File menu on all of the
worksheets.
♦♦34♦♦
Page 42

3.0 Menu and Tool Commands
This section explains how to use all of the Menu and Toolbar button commands. Each
of the following sections will list all of the commands specific to each of the menus.
The dimmed menu commands are used in other worksheets.
3.1 File Menu
Commands in the File menu are designed to help send instructions to the printer and
configure workbooks.
3.1.1 New
Select the New command from the File menu to start a new workbook. A message box
will appear allowing the user to select a file folder to save the new workbook. The New
command will automatically open a new workbook with default values and settings. The
program is now prepared to read data from the Logger.
Figure 3-1: New List Box
The New command can be accessed on the Toolbars of the Finder, Graph, Data, and
Documentation worksheets. This command can also be used by pressing Ctrl + N.
• New Button:
♦♦35♦♦
Page 43

3.1.2 Open
The Open command allows the user to open an existing workbook file.
Figure 3-2: Open List Box
To open a workbook file:
1. Select the Open command from the File menu. A list box of workbook files with
an extension of (.DDW) will appear.
2. Highlight the desired workbook file to open by clicking it once.
3. Click the OK command button to open, or Cancel to return to the current
worksheet.
More than one workbook file can be open at a time and can be viewed by using
the commands on the Window File menu (refer to section 3.7 Window Menu).
The Open command can be accessed on the Finder, Graph, Data, and Documentation
worksheet Toolbars. This command can also be used by pressing Ctrl + O.
• Open Button:
3.1.3 Close
Select the Close command from the File menu will close the current workbook. If there is
second workbook open, closing a workbook will return to the previous workbook.
♦♦36♦♦
Page 44

3.1.4 Import File(s)
The Import File(s) command imports existing OM-550/5000 (.BIN) files into the Finder
worksheet. Once the data is imported it can then be saved in the new format as
described under the Save and Save As menu commands.
To import OM-550/5000 (.bin) data to DataWorker LE:
1. Select the Import File(s) command from the File menu and the Import File(s) list
box will appear.
Figure 3-3: Import List Box
2. Select the file folder of the file(s) to import.
3. Select the file(s) to import by clicking it.
4. Click the Open command button.
The path and file name of the file to be imported can also be typed in the File
name text box.
♦♦37♦♦
Page 45

3.1.5 Save
Select the Save command from the File menu to save the current workbook file after
changes have been made. When the user saves the file, all of the current data sets
and options in the workbook are saved.
The Save command can be accessed on the Finder, Graph, Data, and Documentation
worksheet Toolbars. This command can also be used by pressing Ctrl + S.
• Save Button:
3.1.6 Save As
Select the Save As command from the File menu to save the current workbook with a
new file name. When the user saves the file, the current appearance of the workbook
and the options that have been set are saved.
Figure 3-4: Save As List Box
♦♦38♦♦
Page 46

3.1.7 Backup Database
Select the Backup Database command from the File menu to save the current workbook
as a backup file with a file extension of (.BAK).
This command is used to protect all of the collected data in case the file may
accidentally get deleted or corrupted. When the user saves the file, the current
appearance of the workbook and the options that have been set with menu commands
are saved.
Figure 3-5: Backup Database List Box
To restore a Backup file:
1. Use Windows Explorer to locate the desired backup file.
2. Rename the file to a new name with a file extension (.DDW).
3. Start the DataWorker LE software and use the Open command from the File
menu and select the renamed (.DDW) file.
♦♦39♦♦
Page 47

3.1.8 Port Configuration
The Port Configuration command is used to set a communication (COM) port so the PC
and the Logger can communicate. This command is very important when the software
is first installed or PC hardware configurations have changed.
Figure 3-6: Port Configuration Dialog Box
To configure a Com port:
1. Select the Port Configuration command from the File menu and the Configuration
dialog box will appear.
2. Click the option button next to a COM port depending on which serial port the
PC is set up for RS-232 communications.
3. Click the SET command button to use the selection as the default whenever the
program is started.
4. Click the OK command button to use the selection for the current workbook file
or Cancel to exit without changing.
♦♦40♦♦
Page 48

3.1.9 Page Setup
The Page Setup command sets up page parameters individually for each worksheet.
Figure 3-7: Page Setup Dialog Box
To set the page parameters:
1. Select the Page Setup command from the File menu.
2. Select desired parameters to apply to the worksheet.
2. Click the OK command button to use the current page setup selections.
3. Click the Cancel command button to leave the page setup command without
changing anything.
Selections made using the Page Setup command will not be visible on the
worksheet it is only used for print formatting. To view the selections, use the Print
Preview command (refer to section 3.1.11 Print Preview).
♦♦41♦♦
Page 49

3.1.10 Page Header / Footer
The Page Header / Footer command places text on the top and bottom of the printed
worksheet.
Some of the worksheets contain default information in the Header and Footer
fields, to view use the Print Preview command. Refer to section 3.1.11 Print
Preview.
Figure 3-8: Header / Footer Dialog Box
To add Header and/or Footer information:
1. Select the Page Header/Footer command from the File menu.
2. Click the Header or Footer tab.
3. Determine where to place the note: left, center or right side of the worksheet.
Click a text field and type the desired text.
4. There are options to change the type of font, distance the note is from the frame
edges and type of page numbering (See Figure 3-8).
5. Click the OK command button to accept the Header/Footer or click Cancel to
return to the worksheet without making any changes.
The Header/Footer information will not be visible on the worksheet. It is only
used for printing. To view the Header/Footer information, use the Print Preview
command. Refer to section 3.1.11 Print Preview.
♦♦42♦♦
Page 50

3.1.11 Print Preview
The Print Preview command shows a preview of the page(s) to be printed. This
command is useful when confirming print options the user has set up for printing.
To view a print preview:
1. Select the Print Preview command from the File menu and the Print Preview
window will appear.
Figure 3-9: Print Preview Window
• Click the Print command button to proceed with printing.
• Click the Two-Page command button if there is more than one page in the report to
view them side by side.
• Click the Next Page or Prev Page command button to view other pages of a multiple
page report.
• Click the Zoom In command button to observe small details, and Zoom Out to
restore.
• Click the Close command button to close the Print Preview window.
♦♦43♦♦
Page 51

3.1.12 Print
The Print command prints worksheet information from the workbook. The options that
appear on the Print dialog box will depend on the type of printer and the printer driver
installed.
To print a worksheet:
1. Select the Print command from the File menu and a standard Windows or driver-
dependent print dialog box will appear.
2. Select the desired print options.
Figure 3-10: Print Dialog Box
3. Click the OK command button to print the worksheet.
4. Click the Cancel command button to close the print window without printing.
The Print command can be accessed on all worksheet Toolbars. This command can
also be used by pressing Ctrl + P
• Print Button:
♦♦44♦♦
Page 52

3.1.13 Print Report
Select the Print Report command from the File menu to print the selected worksheets
from the Report worksheet as discussed in section 2.6.2 Report Configuration.
The options that appear on the Print Report dialog box will depend on the type of
printer and the printer driver installed.
To print a worksheet:
1. Select the Print Report command from the File menu and a standard Windows or
driver-dependent print dialog box will appear.
2. Select the desired print options.
Figure 3-11: Print Report Dialog Box
3. Click the OK command button to print the report.
4. Click the Cancel command button to close the print window without printing.
3.1.14 Recent Files 1, 2, 3, etc…
The most recently loaded workbook file names are displayed at the bottom of the File
menu. To open one of these files, click the name of the desired workbook file or press
the appropriate number beside it.
3.1.15 Exit
Select the Exit command to quit the DataWorker LE program. A message box will
prompt the user to save changes. If the user decides to save the changes, all data and
configuration changes will be saved with the workbook file.
♦♦45♦♦
Page 53

3.2 Edit Menu
The Edit menu allows the user to undo, redo changes and remove or hide data runs.
3.2.1 Undo
Select the Undo command to undo any previous action. For example if the filter
command is used and then the user decides that command was not necessary, the
Undo command will restore it back to its original format. Multiple undo actions can be
performed with the undo command.
The Undo command can be accessed on the Toolbars of the Finder, Data, and
Documentation worksheets.
• Undo Button:
3.2.2 Redo
Select the Redo command to restore the mistake made by using the Undo command.
Like Undo, the user can use Redo to restore all of the Undo actions.
The Redo command can be accessed on the Toolbars of the Finder, Data, and
Documentation worksheets.
• Redo Button:
3.2.3 Remove Row
Select the Remove Row command to remove a data run row that is not needed. This
command is helpful when data has been collected and the user feels it is not beneficial
to the workbook data set.
This command is permanent and the data row can not be retrieved once
performed. The software program will warn the user with a message box.
3.2.4 Hide Row
Select the Hide Row command to exclude a row without eliminating it completely from
the workbook file when analyzing the uploaded data run. This command is similar to the
filter function (refer to section 2.2.6 Filters), and is helpful when data has been
collected and it may not be beneficial to the data set. To restore hidden data set row(s)
click the Red Filter Reset button located on the top left of the parameter columns.
♦♦46♦♦
Page 54

3.3 View Menu
The View menu commands assist the user to manipulate areas on all of the worksheet
displays.
3.4.1 Toolbar
Select the Toolbar command from the View menu to activate or deactivate the toolbar.
Deactivating the Toolbar will allow the user to view more of the worksheet area. When
there is a checkmark beside the Toolbar command it is activated and when the
checkmark is not there it is deactivated.
3.4.2 Status Bar
Select the Status bar command from the View menu to activate or deactivate the Status
bar on the bottom of the worksheets. Deactivating the Status bar will allow the user to
view more of the worksheet area. When there is a checkmark beside the Status bar
command it is activated and when the checkmark is not there it is deactivated.
3.3.3 Zoom In
Select the Zoom In command from the View menu to make the current worksheet view
larger. The Zoom In command has the capability to zoom in multiple times. When the
maximum zoom level has been reached the Zoom In command will be dimmed.
The Zoom In command can be accessed on the Toolbars of the Cover, Finder, Data,
Documentation, and Report worksheets. This button will speed up the Zoom In process
if multiple zooms are desired.
• Zoom In Button:
3.3.4 Zoom Out
Select the Zoom Out command from the View menu to make the current worksheet view
smaller. The Zoom Out command has the capability to zoom out multiple times. When
the minimum zoom has been reached the Zoom Out command will be dimmed.
The Zoom Out command can be accessed on the Cover, Finder, Data, Documentation,
and Report worksheets. This button will speed up the Zoom Out process if multiple
zooms are desired.
• Zoom Out Button:
♦♦47♦♦
Page 55

3.3.5 100%
Select the 100% command from the View menu to return the worksheet to its default
display size.
The 100% command can be accessed on the Toolbar of the Cover, Finder, Data,
Documentation, and Report worksheets.
• 100% Button:
♦♦48♦♦
Page 56

3.4 Format Menu
The Format menu includes commands that change the layout or pattern of the text in
user configurable cells.
3.4.1 Bold
Select the Bold command from the Format menu to turn the data in user configurable
cells bold. Select the Bold command again to return to standard format.
The Bold command can be accessed on the Toolbar of the Finder, Data, and
Documentation worksheets.
• Bold Button:
3.4.2 Italic
Select the Italic command from the Format menu to turn the data in user configurable
cells italic. Select the Italic command again to return to standard format.
The Italic command can be accessed on the Toolbar of the Finder, Data, and
Documentation worksheets.
• Italic Button:
3.4.3 Underline
Select the Underline command from the Format menu to underline the data in user
configurable cells. Select the underline command again to return to standard format.
The Underline command can be accessed on the Toolbar of the Finder, Data, and
Documentation worksheets.
• Underline Button:
3.4.4 Alignment (Left, Center, Right)
Select the Align Left, Center or Align Right command from the Format menu to align the
data in user configurable cells on the Finder, Data, and Documentation worksheets.
The alignment commands can be accessed on the Toolbar of the Finder, Data, and
Documentation worksheet.
• Alignment Buttons: (Align Left, Center, and Align Right)
♦♦49♦♦
Page 57

3.5 Instrument Menu
The Instrument menu commands transfers and uploads data from the OM-550 and OM5000 into the DataWorker LS software.
The Logger must be connected to a PC and the proper communication port must
be configured to properly use the commands on this menu (refer to section 3.1.8
Port Configuration).
3.5.1 OM-550
The Read OM-550 command starts the data transfer process after completing the data
collection process with the OM-550.
To read OM-550 data:
1. Connect the OM-550 to the PC (refer to the appropriate section in the Hardware
manual).
2. Select the Read OM-550 command from the Instrument menu and a status bar
dialog box will appear indicating that data retrieval from the OM-550 has begun.
Figure 3-12: Read OM-550 Dialog Box
Once data transfer is complete, the dialog box will disappear and will return to the
current worksheet.
If the OM-550 has not collected enough data to create a complete graph a
message box will appear (See Figure 3-13).
Figure 3-13: Communication Error Dialog box
The Read OM-550 command can be accessed on all worksheet Toolbars.
• Read OM-550 Button:
♦♦50♦♦
Page 58

3.5.2 Read OM-5000
The Read OM-5000 command starts the data transfer process after completing the
data collection process with the OM-5000.
To read OM-5000 data:
1. Connect the OM-5000 to the PC (refer to the appropriate section in the
Hardware manual).
2. Select the Read OM-5000 command from the Instrument menu and a status bar
dialog box will appear indicating that data retrieval from the OM-5000 has
begun.
Figure 3-14: Read OM-5000 Dialog Box
Once data transfer is complete, the dialog box will disappear and will return to the
current worksheet.
If the OM-5000 has not collected enough data to create a complete graph a
message box will appear (See Figure 3-15).
Figure 3-15: Communication Error Dialog box
The Read OM-5000 command can be accessed on all worksheet Toolbars.
• Read OM-5000 Button:
♦♦51♦♦
Page 59

3.6 Tools Menu
Options in this menu make it easy to analyze results and change the appearance of the
Data Graph.
To remove any drawing object added to the Data Graph, select it with the mouse
pointer or with the selection window and then press the [Delete] key.
3.6.1 Magnify Tool
The Magnify tool enlarges any selected area of the Data Graph for easy visual
examination.
To magnify a portion of the Data Graph:
1. Click the Magnify tool from the Tools menu.
2. Position the cursor on a desired section the Data Graph to select one corner of
the area to enlarge.
3. Press the left mouse button and drag the cursor diagonally to the opposite
corner of the box. An outline of the box appears as you drag.
4. Release the left mouse button when the outline of the area to be magnified is
visible. The area inside the box is then magnified to fill the entire Data Graph.
♦♦52♦♦
Page 60

To show even more detail in the Data Graph, Magnify can be performed multiple times.
If the Magnify tool reaches the maximum zoom capability the software will display a
message box informing that the user has “Zoomed to Tight”.
When using the Magnify tool, the Magnify Map uses a red box to indicate the area
currently magnified. If the data graph was previously magnified, the current level of
magnification is displayed as the smallest red box on the Magnify Map (Previous
magnified areas are noted with gray boxes).
MAGNIFY
MAP
MAGNIFIED
AREA
Figure 3-16: Magnify Map
When the Magnify tool has been used multiple times, click the Magnify map once to go
back to a previously selected level of magnification.
When a portion of the Data Graph is magnified and then display statistics
functions, the parts of the graph that disappear off the top or bottom of the graph
continue to be used in the analysis. In other words, events can be described
between any two times, distances, or point numbers, by limiting the range of Xvalues used in statistics functions. All the Y-values between the specified Xvalues are used in the computations, even if they do not appear in the magnified
graph.
The Magnify command can be accessed on the Graph worksheet Toolbar.
• Magnify Button:
♦♦53♦♦
Page 61

3.6.2 Notes Tool
The Notes tool adds a leader with text to any portion on the Data Graph to label special
areas of interest.
To add notes to the Data Graph:
1. Select the Notes tool from the Tools menu.
2. Position the cursor at the desired location to start the note leader, click and drag
the note leader to the desired location where the note text box is to be placed
and release the mouse button.
3. A standard Windows color pallet will then appear allowing the user to select a
Fill color for the note text box.
4. Click the Note text box once and type the desired note text.
The Notes tool can be accessed on the Graph worksheet Toolbar.
• Notes Button:
♦♦54♦♦
Page 62

3.6.3 Line Color
When a tool or drawing object has been added to the Data Graph the color of the
exterior line can be changed at any time.
To change line color:
1. Select the drawing object with the mouse pointer or with the selection window.
2. Select the Line Color command from the Tools menu and then a standard
Windows color pallet will appear.
3. Select a line color and click the OK command button.
A line color can also be changed by double-clicking a line. A standard windows
color pallet will appear allowing the user to select the desired color.
3.6.4 Fill Color
When a Note or drawing object with Fill color has been added to the Data Graph, its
color can be changed at any time.
To change Fill color:
1. Select the drawing object with the mouse pointer or with the selection window.
2. Select the Fill Color command from the Tools menu and then a standard
Windows color pallet will appear.
3. Select a Fill color and click the OK command button.
A Fill color can also be changed by double-clicking the Fill color of a drawing
object. A standard windows color pallet will appear allowing the user to select
the desired color.
♦♦55♦♦
Page 63

3.6.5 Move to Front
When multiple drawing objects are overlapped on the Data Graph the Move to Front
command will move an object that is behind one or more objects to the front.
To move a drawing object to the front:
1. Select the rear drawing object with the mouse pointer or with the selection
window.
2. Select the Move to Front command from the Tools menu and then the drawing
object will move in front of the overlapped drawing object(s).
3.6.6 Move to Back
When multiple drawing objects are overlapped on the Data Graph the Move to Back
command will move an object that is in front of one or more objects to the back.
To move a drawing object to the back:
1. Select the front drawing object with the mouse pointer or with the selection
window.
2. Select the Move to Back command from the Tools menu and then the drawing
object will move behind the overlapped drawing object(s).
3.6.7 Move Forward
When multiple drawing objects are overlapped on the Data Graph the Move Forward
command will move an object that is behind multiple objects one object forward.
To move a drawing object forward:
1. Select a drawing object that is behind one or more drawing object with the
mouse pointer or with the selection window.
2. Select the Move Forward command from the Tools menu and then the drawing
object will move one object forward.
3.6.8 Move Back
When multiple drawing objects are overlapped on the Data Graph the Move Back
command will move an object that is in front of multiple objects one object back.
To move a drawing object to the back:
1. Select the front drawing object with the mouse pointer or with the selection
window.
2. Select the Move Back command from the Tools menu and then the drawing object
will move one object back.
♦♦56♦♦
Page 64

3.6.9 Line
The Line command adds a line anywhere on the Data Graph.
To add a line to the Data Graph:
1. Select Line from the Tools menu.
2. Position the cursor at the desired location to start the line, Press and hold the
left mouse button and drag the line to the desired location where the end of the
line is to be placed and release the mouse button.
3.6.10 Rectangle
The Rectangle command adds a rectangle anywhere on the Data Graph.
To add a rectangle to the Data Graph:
1. Select Rectangle from the Tools menu.
2. Position the cursor on the Data Graph for the desired location to place the
rectangle.
3. Press and hold the left mouse button and drag the cursor diagonally to the
opposite corner of the rectangle. An outline of the rectangle appears as you
drag.
4. Release the left mouse button when the desired rectangle size is achieved.
3.6.11 Round Rectangle
The Round Rectangle command adds a rectangle with rounded corners anywhere on
the Data Graph.
To add a round rectangle to the Data Graph:
1. Select Round Rectangle from the Tools menu.
2. Position the cursor on the Data Graph for the desired area to place the round
rectangle.
3. Press and hold the left mouse button and drag the cursor diagonally to the
opposite corner of the rectangle. An outline of the rectangle appears as you
drag.
4. Release the left mouse button when the desired rectangle size is achieved.
♦♦57♦♦
Page 65

3.6.12 Ellipse
The Ellipse command adds an ellipse anywhere on the Data Graph.
To add an ellipse to the Data Graph:
1. Select Ellipse from the Tools menu.
2. Position the cursor on the Data Graph for the desired area to place the ellipse.
3. Press and hold the left mouse button and drag the cursor diagonally to the
opposite corner of the ellipse. An outline of the ellipse appears as you drag.
4. Release the left mouse button when the desired ellipse size is achieved.
3.6.13 Polygon
The Polygon command adds a polygon anywhere on the Data Graph.
To add a polygon to the Data Graph:
1. Select Polygon from the Tools menu.
2. Position the cursor on the Data Graph for the desired area to place the first
corner of the polygon.
3. Drag the cursor to another point on the Data Graph and click once to place
another corner of the polygon. Repeat until all sides of the polygon have been
positioned on the Data Graph and double click the last point to stop adding more
polygon edges.
3.6.14 Y-Reference
The Y-Reference command adds an Y-Reference line with Y location text to the Data
Graph to locate the Y location of special areas of interest.
When an Y Reference is added to the Data Graph it can be moved vertically up and
down. The Y location text is then automatically updated to the new location.
To add an Y Reference to the Data Graph:
1. Select the Y Reference from the Tools menu.
2. Position the cursor on the Data Graph at desired location and click to place the
Y Reference.
3. A standard Windows color pallet will then appear allowing the user to select a
line color for the Y Reference line.
♦♦58♦♦
Page 66

3.7 Window Menu
The Window menu arranges opened workbook files for viewing and quick access.
3.7.1 Cascade
Select the Cascade command from the Window menu to cascade opened workbook files
from the upper left corner overlapping the workbooks downward so each workbook title
bar is visible.
Figure 3-17: Cascaded Workbooks
3.7.2 Tile
Select the Tile command from the Windows menu to arrange the open workbook files in
a rectangular fashion dividing the workbook files into smaller sizes arranged so they fit
next to each other on the display.
3.7.3 Open File
The lower section of the Window menu shows the open workbook files. This allows
quick access to all of the open workbook files. Selecting a workbook file name will to
bring it to the front of the open workbooks and make it active.
♦♦59♦♦
Page 67

3.8 About Menu
The Help menu is a complete online reference tool that can be used at any time. Help
is especially useful when information is needed quickly.
• Index
• Using Help
• About DataWorker
3.8.1 Index
DataWorker LE for Windows does not include a help index. Please refer to the
appropriate sections of this manual for more information.
3.8.2 Using Help
Select the Using Help command from the Help menu to display the Microsoft How to
Use Help Window. This is the best way to learn about using the DataWorker LE
Software Help system.
Figure 3-18: Using Help Window
♦♦60♦♦
Page 68

3.8.3 DataWorker
Select DataWorker from the Help menu to display the software version, release date
and company information.
Figure 3-19: DataWorker Dialog Box
The About command can be accessed on all of the worksheet Toolbars.
• About Button:
3.8.4 Context Help
Use the Context Help command button to obtain Help on a specific portion of the
software. Click the Context Help button on the Toolbar, the mouse pointer will change to
an arrow and question mark. Click somewhere in the screen on any worksheet, such as
another Toolbar button. The Help information will be shown for the item clicked.
• Context Help Button:
3.8.5 Copy Button
There is a Copy Button that can be accessed on the Graph worksheet Toolbar. This
button copies the Graph worksheet to the clipboard so it can be pasted into other
applications.
• Copy Button:
♦♦61♦♦
Page 69

APPENDIX A: Toolbar Buttons & Pull-Down Menus
DataWorker LE Tool buttons:
About Open
Align center Print
Align left Read OM-550
Align right Read OM-5000
Bold Redo
Context Help Save
Copy Underline
Italic Undo
Magnify Zoom 100%
New Zoom In
Notes Zoom Out
♦♦62♦♦
Page 70

•• Cover Worksheet Pull-Down menus:
•• Finder Worksheet Pull-Down menus:
♦63♦♦
Page 71

•• Graph Worksheet Pull-Down Menus:
♦64♦♦
Page 72

•• Data Worksheet Pull-Down menus:
♦65♦♦
Page 73

•• Documentation Worksheet Pull-Down menus:
•• Report Worksheet Pull-Down menus:
♦66♦♦
 Loading...