

Page 1

Page 2

Trademark Notice
Registered trademarks belong to their respective owners.
COPYRIGHT – 2001 OMEGA Engineering
All Rights Reserved
2
Page 3

CONTENTS
INTRODUCTION _____________________________ 7
1.1 STANDARD FEATURES _______________________8
1.2 STANDARD KIT ITEMS ________________________9
1.3 SUMMARY OF PARTS________________________10
1.4 PRECAUTIONS______________________________11
1.5 USING THIS MANUAL ________________________13
1.5.1 Warnings ____________________________________ 13
1.5.2 Names ______________________________________ 13
1.5.3 Instruction Sequences __________________________ 14
1.5.4 Instruction Types ______________________________ 14
BASIC OPERATION _________________________ 15
2.1 GENERAL__________________________________16
2.1.1 Powering Up__________________________________ 16
2.1.2 Accessing Main Menu __________________________ 16
2.1.3 Selecting a Main Menu Item______________________ 17
2.1.4 Selecting an Option ____________________________ 17
2.1.5 Editing Names ________________________________ 19
2.1.6 Editing Numerical Values ________________________ 22
2.2 SETTING UP INPUTS_________________________23
2.2.1 Channel Selection & Setup ______________________ 24
2.2.2 Channel Types ________________________________ 25
2.2.3 Matching Inputs to Sensors ______________________ 26
2.2.4 Modifying the Input boxes _______________________ 27
2.2.5 Modifying the Output boxes ______________________ 29
2.2.6 Modifying the Units_____________________________ 29
2.3 SETTING UP CHANNELS _____________________30
2.3.1 Setting Up Your Recording (The Trigger Menu) ______ 30
2.3.2 Setting Display Options _________________________ 36
2.3.3 Graph Controls ________________________________ 37
2.4 RECORDING DATA __________________________39
2.4.1 Setting Up the Filename_________________________ 39
2.4.2 Choosing a Folder _____________________________ 39
2.4.3 Starting a Recording____________________________ 40
3
Page 4

2.4.4 Auto-Repeating Recordings ______________________ 40
2.4.5 Chained Recordings____________________________ 41
2.5 PLAYING BACK _____________________________42
2.6 FILE UTILITIES______________________________43
2.7 OUTPUTTING SAMPLES FROM RS232 __________44
UTILITIES__________________________________ 45
3.1 RESETTING THE INSTRUMENT ________________46
3.2 ADJUSTING LCD ____________________________47
3.2.1 Adjusting Contrast _____________________________ 47
3.2.2 Turning Backlight On ___________________________ 47
3.3 SETTING CLOCK ____________________________48
3.3.1 Checking Date and Time ________________________ 48
3.3.2 Setting Date and Time __________________________ 48
3.4 MANAGING BATTERY________________________49
3.4.1 Instrument Battery _____________________________ 49
3.4.2 Checking Battery Capacity_______________________ 50
3.4.3 Charging Powered-up instrument__________________ 50
3.4.4 Charging Powered-down instrument _______________ 50
3.4.5 Reconditioning Batt ery Pack _____________________ 51
3.4.6 Power Saver__________________________________ 51
3.4.7 Replacing Battery Pack _________________________ 52
3.5 ERASING MEMORY__________________________53
3.6 TROUBLESHOOTING ________________________54
3.6.1 Power Problems_______________________________ 54
3.6.2 Data Problems ________________________________ 54
3.6.3 Data-Transfer Problems_________________________ 55
3.6.4 Other Problems _______________________________ 55
ANALYSIS SOFTWARE______________________ 57
4.1 INSTALLING OM-3000
4.1.1 License Agreement ____________________________ 58
4.1.2 PC System Requirements _______________________ 58
4.1.3 Installing OM-3000
4.2 STARTING UP
4.2.1 Starting up ___________________________________ 60
4.2.2 Configuring PC COM port _______________________ 60
4
MAS
___________________________60
MAS
____________________58
MAS
on PC ___________________ 59
Page 5

4.3 TRANSFERRING DATA TO THE PC_____________61
4.4 MANAGING DATA ___________________________62
4.4.1 Opening a File ________________________________ 62
4.4.2 Merging Two Files _____________________________ 62
4.4.3 Using the Navigator ____________________________ 62
4.4.4 Deleting Data from a Folder ______________________ 62
4.4.5 Editing Recording Details________________________ 63
4.4.6 Viewing and Printing Data Values _________________ 63
4.4.7 Exporting data ________________________________ 64
4.5 CALCULATING DATA ________________________65
4.6 PLOTTING DATA ____________________________66
4.6.1 Plotting Single and Individual Charts _______________ 66
4.6.2 Zooming & Panning ____________________________ 67
4.6.3 Printing Charts ________________________________ 67
4.6.4 Reading and Comparing Values __________________ 68
4.6.5 Plotting Waterfall Charts_________________________ 70
4.7 UPGRADING FIRMWARE _____________________71
Appendix SPECIFICATIONS __________________ 73
Appendix Application Notes__________________ 75
6.1 Application Note 1___________________________75
6.2 Application Note 2___________________________80
Appendix Optimizing Temperature Accuracy____ 83
Appendix OM-3000
8.1 FUNCTIONS ________________________________86
8.1.1 Mathematical Functions _________________________ 86
8.1.2 Iterative Functions _____________________________ 88
8.1.3 Logical Functions ______________________________ 88
8.1.4 Conditional Functions___________________________ 89
8.1.5 Date and Time Functions ________________________ 89
8.2 OPERATORS _______________________________90
8.2.1 Logical Operators______________________________ 90
8.2.2 Arithmetic Operators ___________________________ 90
MATH ________________ 85
MAS
MAS
MASMAS
5
Page 6

6
Page 7

INTRODUCTION
MAS
Windows
OM3000
OM3000-T6V4
o
C (-418 to +2498oF)
based software sup plied
.
.
temperature
±
5VDC or
Congratulations on purchasing the
T6V4
The
measurement ranging from –250 to +1370
depending on the thermocouple type, and up to four channels of
voltage
±
30VDC. Collected data can be transf erred to a PC where it can be
analyzed in detail using the
in the kit.
This manual has been f ormatted to a llow you to quic kly learn ho w to
use your
read it before operating your
module allows up to six channels of
measurement with user-selectable settings of
OM3000
. Please keep this manual for futur e reference and
7
Page 8

1.1 STANDARD FEATURES
• 24-bit A/D converter providing high-precision measurements
• 512kB non-volatile memory capable of storing up to 400,000
sample points
• Time and date stamped recordings
• Temperature compensated graphical L CD (liquid-cr ystal displa y)
with 240x128 pixels
• Electro-luminescent LCD backlight
• Built-in battery charger and conditioner
• 1500mAh Ni-Cad (Nickel-Cadmium) battery pack
• Upgradeable firmware
• RS232 interface to communicate with a PC (personal computer)
• Windows
8
based Measurment Analysis Software (
MAS
)
Page 9

1.2 STANDARD KIT ITEMS
9
Page 10
1.3 SUMMARY OF PARTS
10
Page 11
1.4 PRECAUTIONS
WARNING
operating your instrument. Not heeding the warnings or
recommendations c ould res ult i n data loss, data inaccuracy, dam age
to the instrument, or injury to yourself.
WARNING
transfer cable and bootstrap
cannot be entangled with any
moving or rotating machinery.
: Please read and understand this section fully before
WARNING
connect any sensor to a high voltage i.e. a vo ltage
that exceeds 50VDC or 32VAC or the “safety extra
low voltage” (SELV) defined by your local power
authority.
: Ensure the data-
: To avoid electrical shock, do not
WARNING
an explosive environment.
: Do not operate the instrument in
WARNING
the instrument for more than 2 hour s as data and
settings may be lost.
: Do not detach the battery pack from
WARNING
a PC before reprogram ming the instrum ent with new
firmware – reprogramming the instrument erases all
data stored in the instrument (see section 4.6).
: Transfer data stored in t he instrument to
<
2 hours
11
Page 12
WARNING
: Charge the battery pack up to at leas t 30%
capacity before taking a recording. If using the
instrument for 4 hours or more, first ensure that the
battery pack is fully charged.
30%
>
WARNING
: Constantly charging the battery when it is not fully
drained will create a "Memory" effect and eventually shorten the
amount of charge that the battery can hold. Please read
Managing Battery
to learn how to prevent this.
WARNING
: Do not expose the instrument to large
3.4
impacts or pressure.
WARNING
solvent to clean the instrument.
: Do not use alcohol or any organic
WARNING
: Do not expose the instrument to wet
Kero
conditions or store it in a dam p place where the relati ve
humidity exceeds 80% RH.
WARNING
: Do not place the instrument in a hot
place where the tem perature exceeds 140°F (60°C).
Otherwise, the battery pack will degrade.
WARNING
: Ensure that the battery pack is securely
fastened – but not over-tightened – to the instrument
before operating the instrument.
WARNING
: If the instrument malf unctions, return it
to an authorized dealer. Do not try to repair it
yourself, as this will invalidate the warranty.
WARNING
: Use only an approved power transformer
and ensure its voltage and frequency rating matches
that of your mains AC power.
12
DEALER
AUTHORIZED
Page 13
1.5 USING THIS MANUAL
1.5.1 Warnings
In this manual, the word
actions may lead to dam aging consequences. Please he ed all such
warnings.
WARNING
is displayed where certain
1.5.2 Names
In this manual, window and screen names are italicized. These
names refer to the names appearing at the top of windows/screens.
MAS
Window
The PC key names ar e shown as norm al tex t, e.g. Shif t ref ers to the
Shift key on the PC keyboard.
Keys on the instrument are shown as they appear on the instrum ent
keypad, e.g.
Some instrument keys have more than one function, e.g. the
key which is used as either t he ON k e y or the OFF key depending on
the state the instrument is operating in.
refers to the Shift key on the instrument.
13
Page 14

1.5.3 Instruction Sequences
The ! symbol is used to indicate the sequence of menu selections.
Instruction Meaning
Click File ! Save. Select the File menu and t hen
select Save.
1.5.4 Instruction Types
The word “press” refers to key presses or menu selections on the
instrument.
The word “click” refers to menu selections on the PC, and “push”
refers to key presses on the PC keyboard.
Instruction Meaning
Click File ! Export.
Push the Esc key.
Some operating instructions are illustrated with examples. Such
instructions are marked with the word
14
Select File and then Export in
MAS
software.
Push the Esc key on the PC
keyboard.
EXAMPLE
.
Page 15

BASIC
OPERATION
This section outl ines the procedure for perform ing basic operations
on your instrument. You will learn to:
• use the instrument menu system;
• record data; and
• playback recorded data.
WARNING
: Read section 1.4 before operating your instrument.
15
Page 16
2.1 GENERAL
2.1.1 Powering Up
• Press
• Press
that is being measured (using previous settings).
• To power down, press
the instrument does not respond to any key press, reset it (see
section 3.1).
. The Initialization screen is displayed.
. Measurement begins and the screen displays data
*
and follow on-screen instructions. If
2.1.2 Accessing Main Menu
To perform instrument operations, you need to access the main
menu. To access the main menu:
• Press
You can alternativel y press
top of the screen and consis ts of four items: File, Display, Trig(ger),
and Sys(tem). To cancel the main menu, press
.
. The main menu is dis played at the
again.
Every time the instrument is powered up, the power saver (a power-saving feature)
*
is automatically turned on. See section 3.4.6 for more details.
16
Page 17
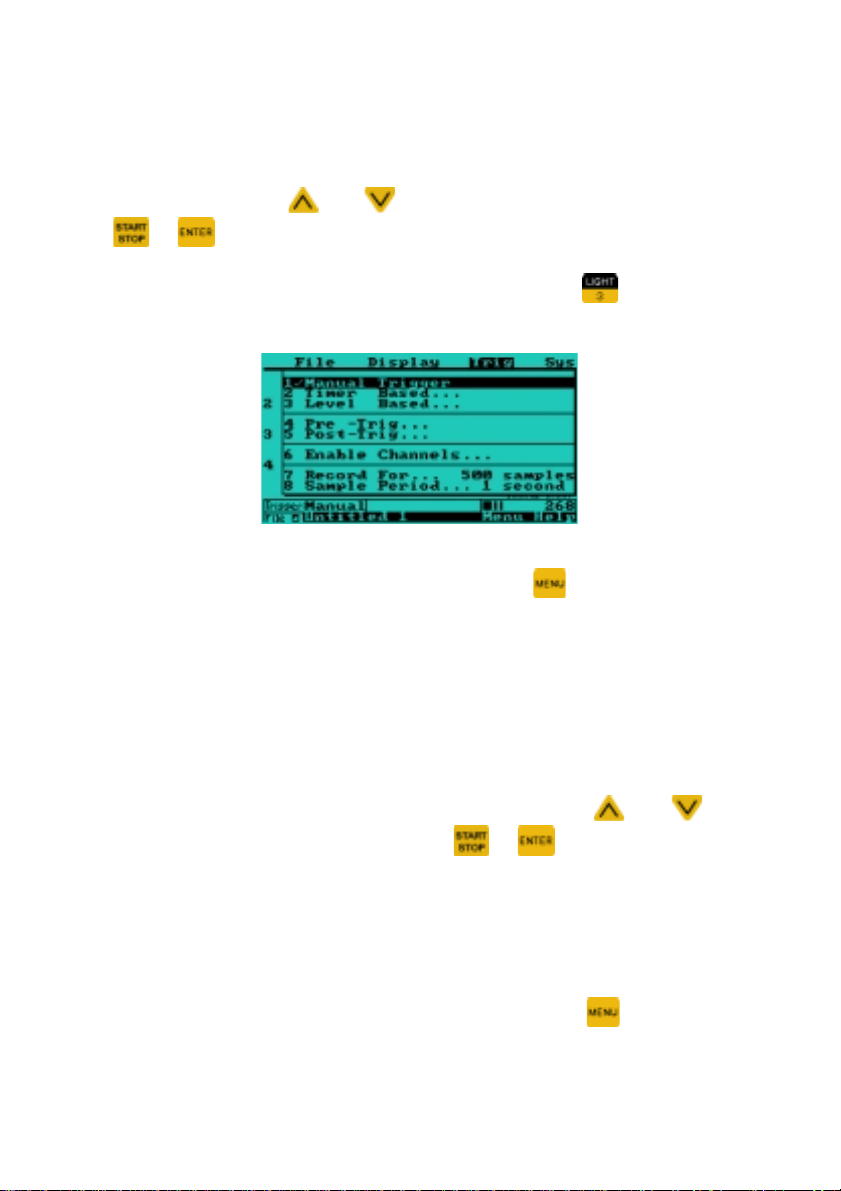
2.1.3 Selecting a Main Menu Item
• Press the number preceding the menu item.
Alternativel y, press
or .
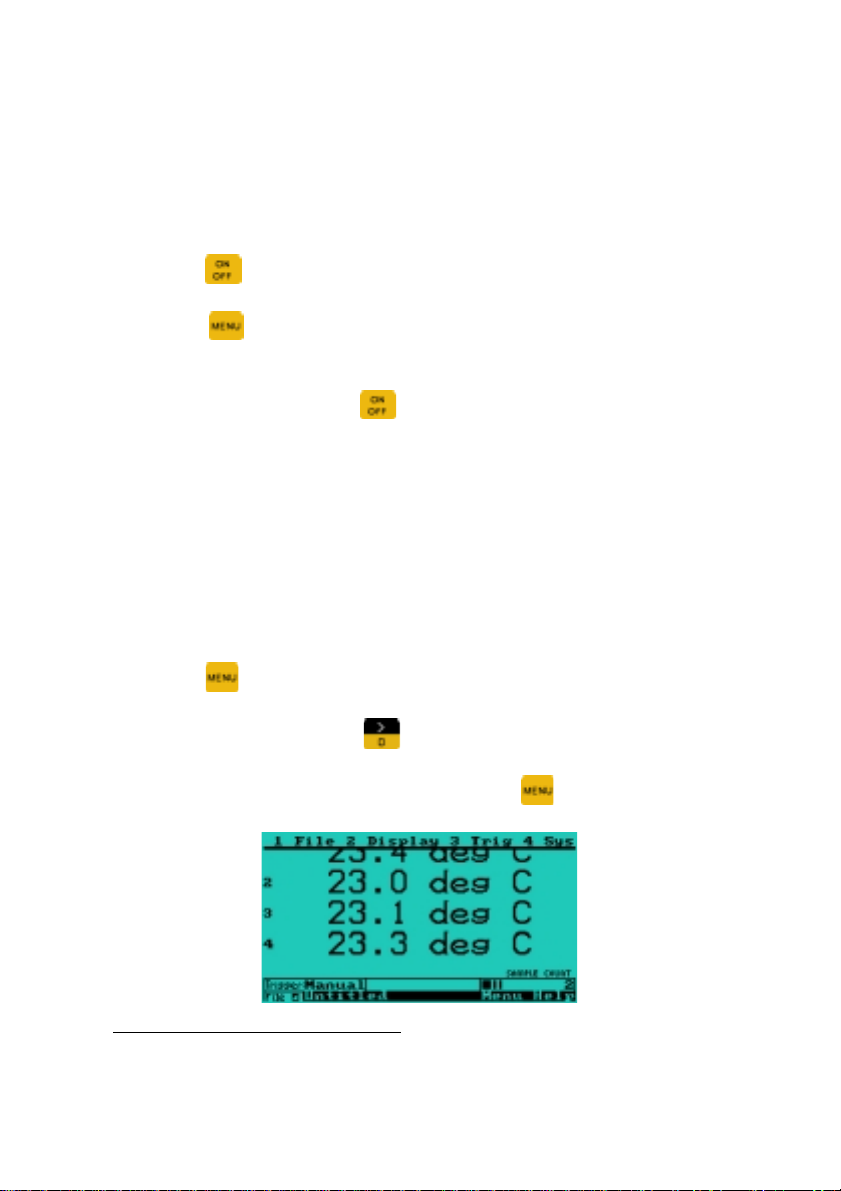
EXAMPLE
The drop down menu above shows the available options for the
Trigger menu. To c a n c e l a d r opdown menu, press
: to select the main menu item Trig, press
and to cycle to the menu it em then pr ess
.
.
2.1.4 Selecting an Option
The procedure for s electing an option in a dropdown m enu is similar
to selecting a main menu item i.e.
• Press the num ber preceding the opti on, or press
cycle to the option and then press
Selected options, where appropriate, are checked (!). Selecting
options with names ending with “…” br ings up windows that pr ovide
more options. These o ptions, and any further options they provide,
can be selected in the same manner. Most windows have selfexplanatory instruc tions. If more than one window is displayed, the
topmost is the one active. To cancel a window, press
or .
and to
.
17
Page 18

EXAMPLE:
to select Level Based… in the example below, press
18
Page 19
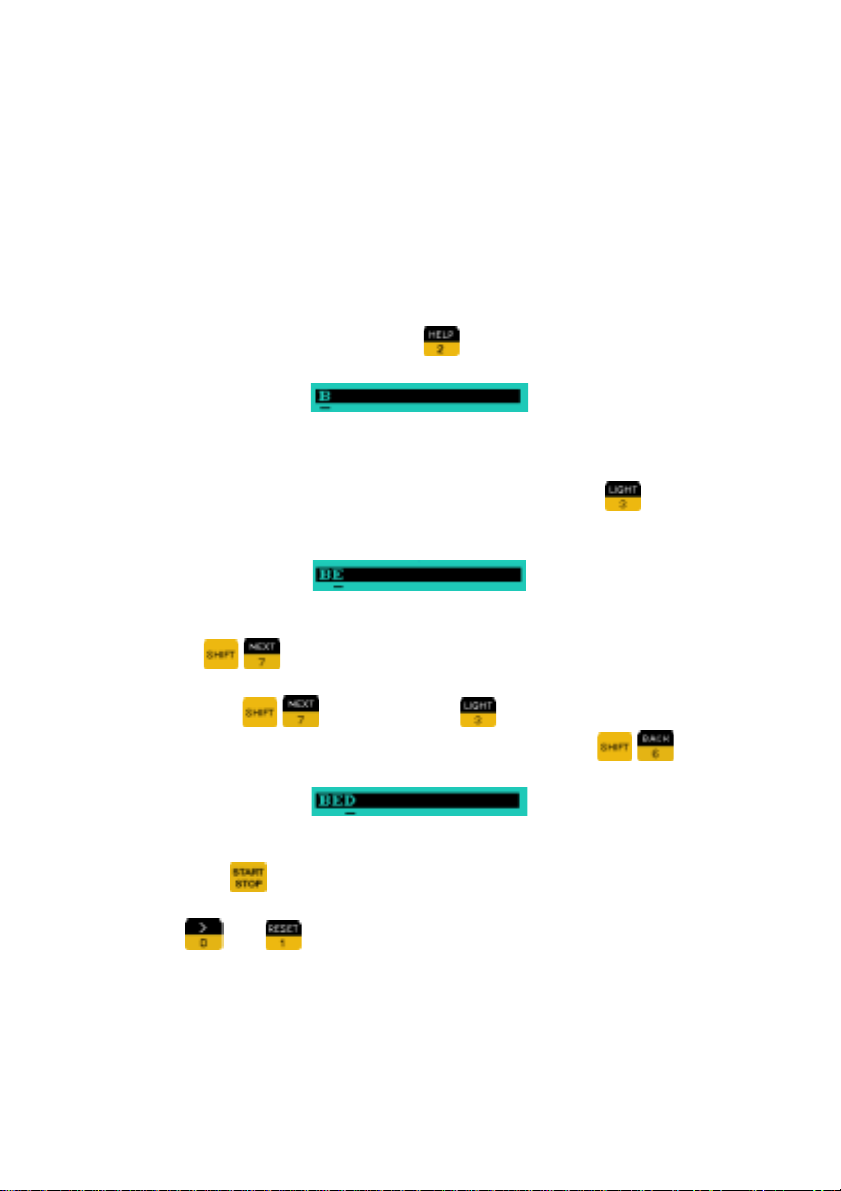
2.1.5 Editing Names
To enter characters in the text editing window:
• Select Display from the m ain m enu an d then se lect Edit Ch annel
Units or Edit Channel Names.
• Pres s the ke y with the character you want un til it appears above
the flashing cursor.
e.g. to enter the letter B, press
• The cursor advances automatically when you press the next key.
e.g. if the next letter you want to enter is E, press
displayed.
• If the next letter of the word is on the same key just pressed,
press
e.g. press
(The cursor can be moved backwards by pressing
• More editing options (and their shortcut keys) are available by
pressing
to advance the cursor position.
then press key until the letter D appears .
.
until the B is displayed.
until E is
).
Note
:
and can be used to enter the space character.
19
Page 20
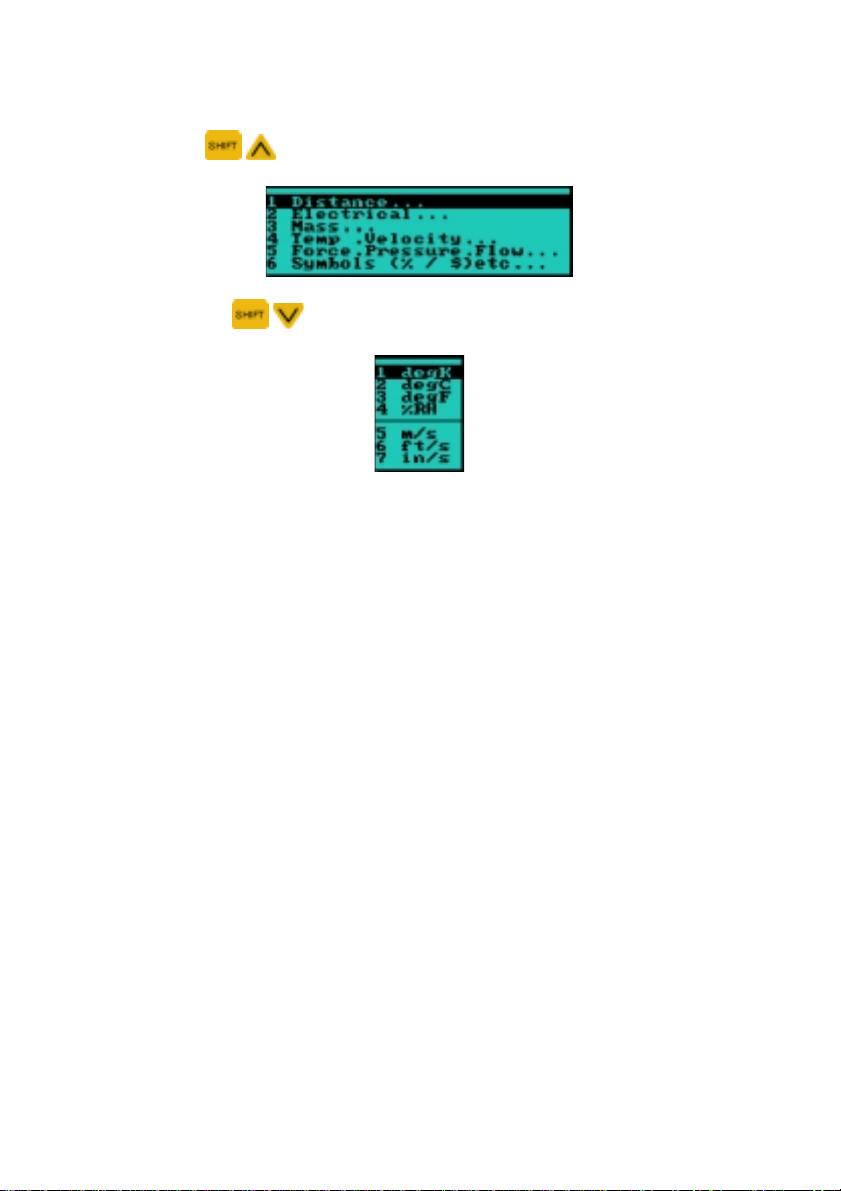
Libraries are available to make entering text easier.
• Press
• Pressing
to access the library categories.
will show the last text library selected.
20
Page 21
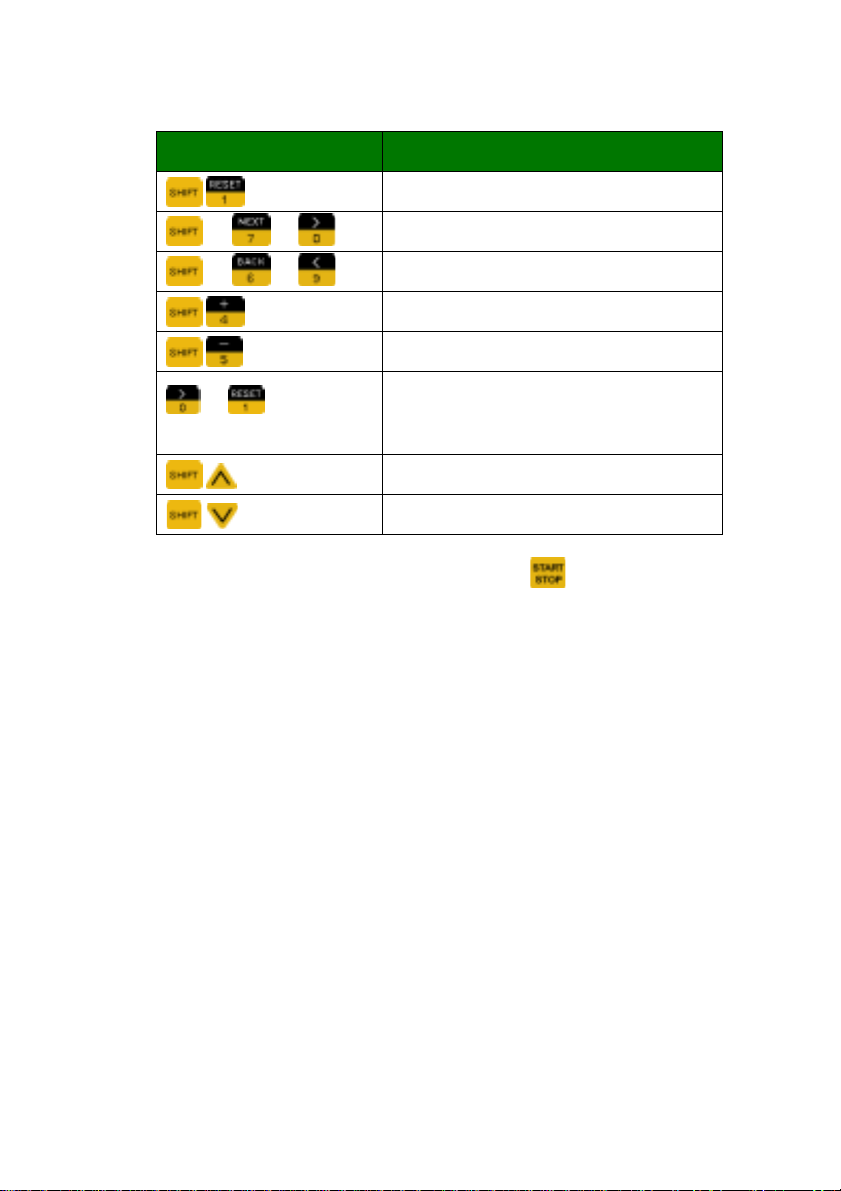
Table of Short Cut Keys
Short Cut Key Meaning
! or
! or
or
(press twice)
To toggle from upper to lower case press and choose the
desired case from the pop-up menu.
Folder, Recording and Channel names can have a maximum of 16
characters. Unit Names can have a maximum of 8 characters.
Clear all text
Move cursor forward
Move cursor back
Insert a space
Delete character
Can be used to enter a space
Text Library
Last Text Library
21
Page 22

2.1.6 Editing Numerical Values
• Select the numeric field to be edited (using the normal option
selection procedure outlined in section 2.1.4).
• Press the appropriate digit keys to enter the desire d value. Ent er
a decimal point by pressing
• To make the number negative/positive press
• Clear floating point num bers by pressing
point numbers can sometimes be incremented or decremented
by pressing
SAMPLING PERIOD.
or
, e.g. This is possible when setting the
.
.
. Non-floating
22
Page 23

2.2 SETTING UP INPUTS
T6V4
The
eight channels of data at a time. Due to the sharin g of channels 5
and 9, and of channels 6 and 0, the following conditions apply:
WARNING
1. Ensure that when using these shared channels, that only the
2. Never allow voltages of more than 10V between any two
3. Thermocouple channels 5 and 6 have a low input impedance
module is capable of sim ultaneous m easurem ents of up to
• Channels 5 and 9 cannot be simultaneously selected
• Channels 6 and 0 cannot be simultaneously selected
selected sensor type is connected. If a voltage source and
thermocouple of shared chan nels are sim ultaneous ly connected,
measurements will be erroneous.
thermocouple inputs, or 5V between an input and module
ground. This may damage the instrument.
due to the fact that the y are shared with voltage channe ls 9 and
0. If thermocouples of a resist ance higher than a few Ohms (eg.
Thermocouples with wire lengths longer than typically 2 to 3
meters) are used in these channels a small error will be
introduced. This error is proportional to the ratio of the
thermocouple resistance to the input impedance.
4. For best accuracy, all sources being measured should be
perfectly isolated from each other (including thermocouple
inputs)
† See Appendix Optimizing Temperature Accuracy.
†
.
23
Page 24
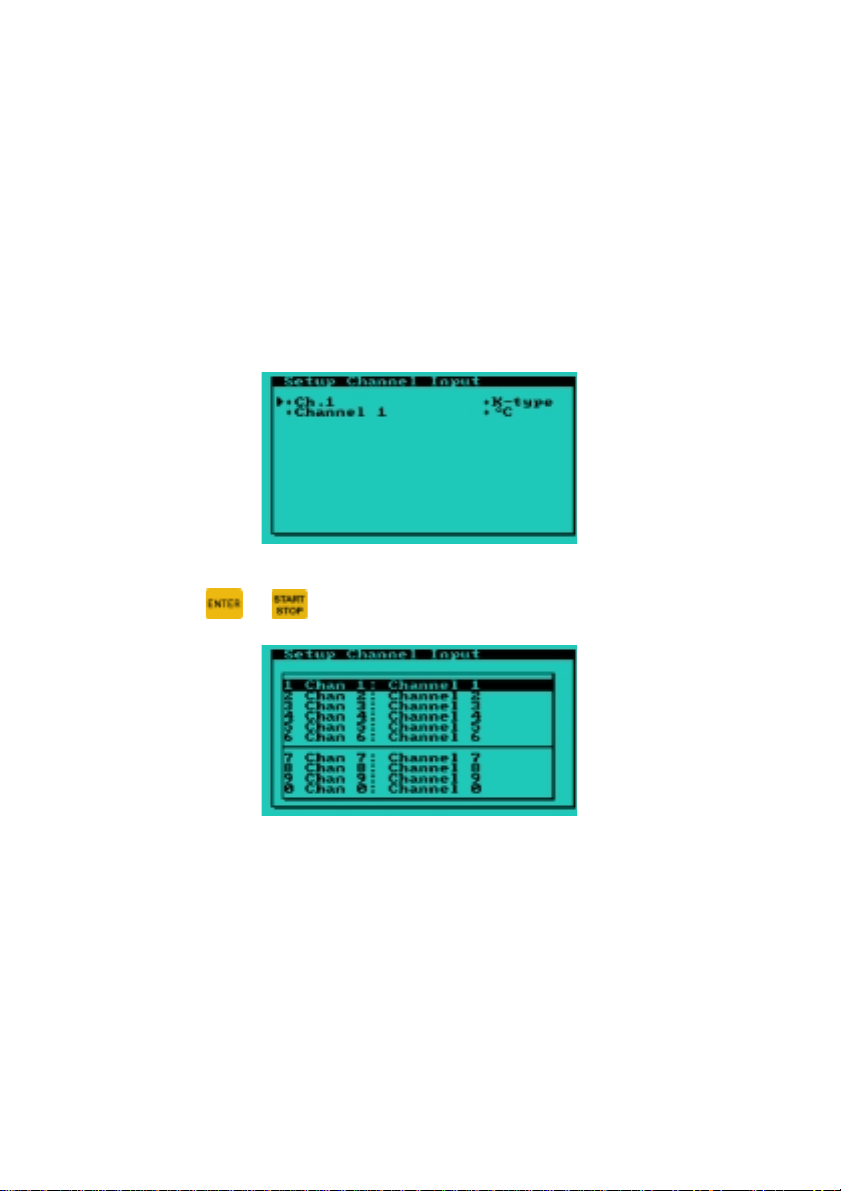
2.2.1 Channel Selection & Setup
The instrument needs to know what type of sensor is attached to
each input channel. You must set up the input channels one at a
time.
• Access the main menu (see section 2.1.2).
• Press Sys ! Setup Inputs… to display the “Setup Channel
Input” window.
• Press
• Select the channel you would like to setup.
Note:
24
or to display the channel drop down menu.
Channels can be named b y choosing “Edit/Names” from the
”Display” menu on the main menu bar (see section 2.1.2).
These names appear when downloading to a PC.
Page 25
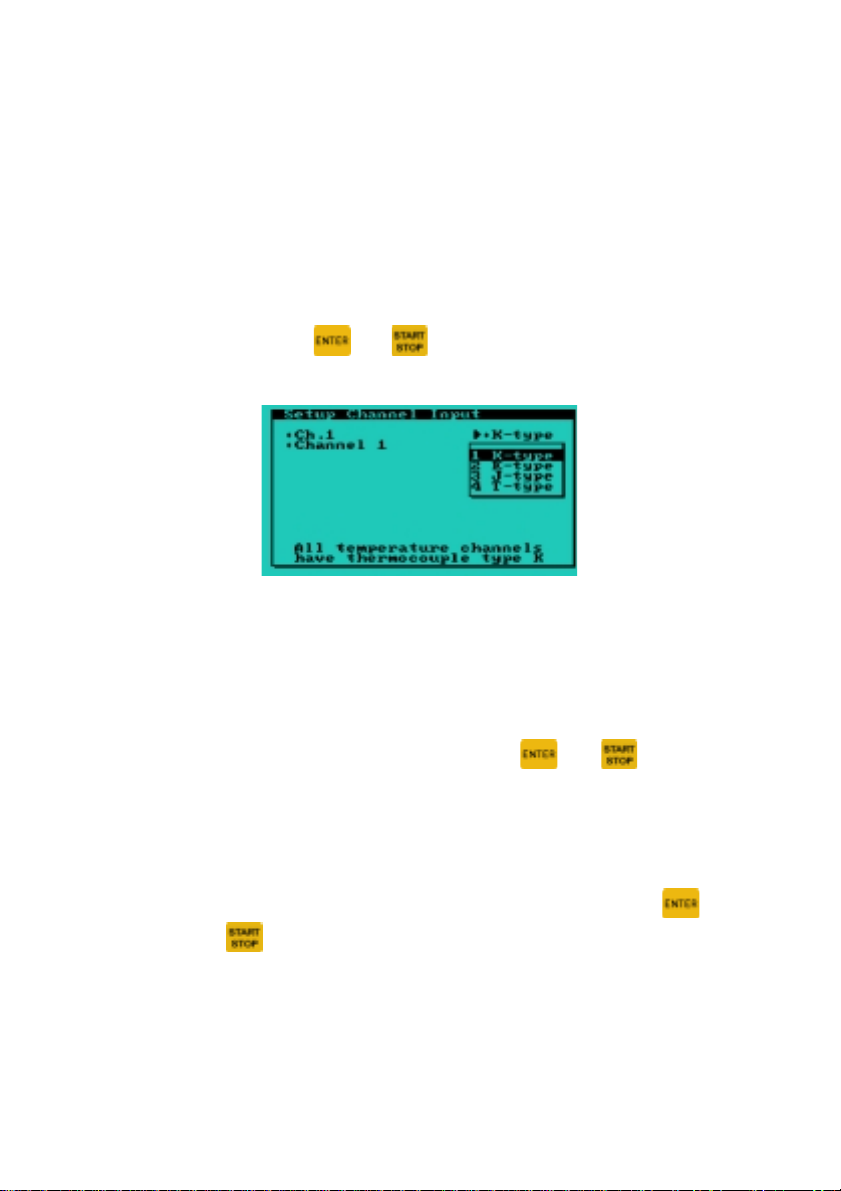
2.2.2 Channel Types
There are two types of channels on th e instrum ent, tem perature and
voltage. Each t ype of channel has differ ent configuration options as
follows:
Temperature Channels
Thermocouple type can be selected
• This can be done b y moving the cursor to the “K-type”
option in the “Setup Channel Input” window and
pressing
displayed.
• All thermocouples attac hed to the instrum ent m u st be of
the same type.
Units can be selected
• Move the cursor to the units displayed below the
thermocouple type and press
through the units, “
Voltage Channels
Voltage range can be selected
• Move the cursor to the “+/- 30V” and pressing
will toggle between “+/- 30V” and “+/- 5V”.
or . The following screen will be
o
C”, “oF”, and “User”.
or to cycle
or
Any change made to the voltage range will reset t he input a nd
output ranges to the default setup values.
25
Page 26

2.2.3 Matching Inputs to Se n sors
If you are using standard thermocouple or voltage inputs, then no
further setup is required. Ho wever for using other sensor s, you need
to match the inputs from the sensor to the values you would like
displayed.
EXAMPLE
: If you have a 0V – 24V proximity probe connected to
channel 8 that outputs:
0V at 1 mm
and 24V at 3.4 mm
then the following linear relationship is assumed:
3.4 mm
Measurement
to display
(mm)
2.0 mm
1.0 mm
10V = 2.0 mm
0 V
10 V
Sensor output-voltage
(V)
24 V
26
Page 27

2.2.4 Modifying the Input boxes
In this example we will setup the channel to match the following
sensor inputs:
• From the main menu, press Sys ! Setup Inputs… and select
the channel to be setup.
• Use the
input box you wish to edit.
• Press
or
or to display a list of edit options.
arrows to move the flashing cursor to the
Editing the Input Value:
• Select “Edit Input…” to enter the sensor input voltage in V.
• Press
or to accept the entered value.
27
Page 28
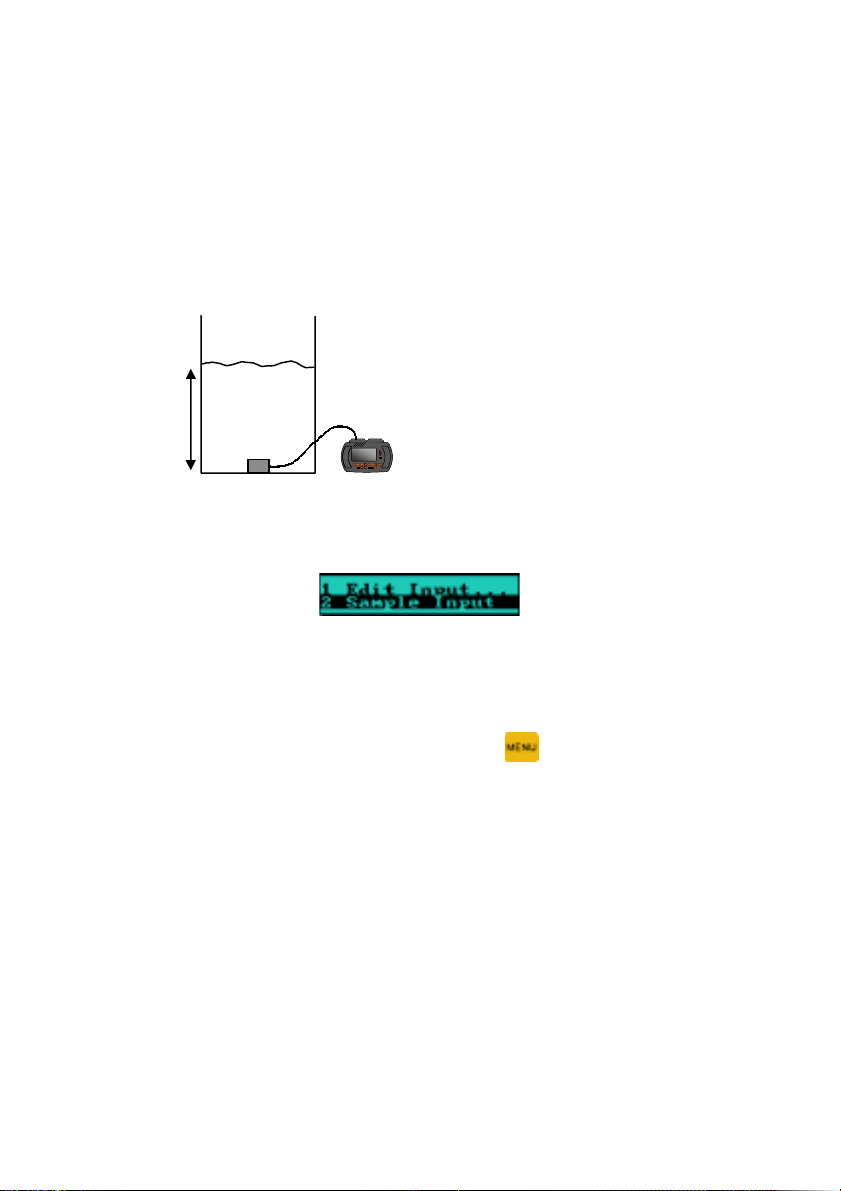
Sampling the Input value
:
It is also possible to s et the input boxes by sam pling the voltage or
temperature being monitor ed b y the instrument.
This is very useful if you know what you’re measuring, but do not
know what voltage / temperature your input sensor is providing.
e.g.
You have a sensor that can
measure the depth of water
based on pressure readings but
have no data that relates the
6ft
sensor output voltage to the
actual depth. However, you do
know that the present depth =
6ft.
• To match the input box follow the steps from the previous
example, but choose “Sample Input”.
• The input box will update with the sample taken being displayed
in the selected input box.
• If you are not happy with the sampled value keep selecting
“Sample Input” until you are, then press
to close the options
menu.
Note
: • The first input box reading must be lower than the
second input box.
28
• Input box readings must be more than 50
temperature and more than 1V apart for voltage.
o
apart for
Page 29

2.2.5 Modifying the Output boxes
• Use the
output box to be altered.
• Press
become highlighted, with its pr e v ious va lue c leare d. N ow enter in
the value, and press
• Now press
should flash beneath it).
• Press
or to accept this value.
Note
: Output box values • Can be positive or negative.
or
or to edit the value in this box. The box will
to begin editing. T ype in the number 3.4, and press
arrows to move the flashing cursor to the
or to accept this value.
arrow to select the nex t output box (The cursor
• Can contain decimal places.
• Can be in any order (i.e. box 1 can be
greater than box 2).
2.2.6 Modifying the Units
• To change the units (e.g. to mm), press
flashing cursors appear below the unit boxes.
• Press
window will appear (see section 2.1.5).
to begin editing the unit. The “Enter Channel Unit”
arrow until two
29
Page 30

2.3 SETTING UP CHANNELS
2.3.1 Setting Up Your Recording (The Trigger
Menu)
Most of the important information involved in your recording is
entered under the trigger menu. Trigger T ype, which Channels are
enabled, Sample Period, and Recording length/time.
Below are examples of all the trigger menu item s. Each item can be
configured by follo wing the pop-up m enus as per previous sections.
Timer and level b ased trigger optio ns can be selected by t he
arrows and pressing or .
The Trigger Type (how recordings are started).
or
There are three main types of trigger available:
•
Manual Trigger
•
Time Based Trigger
•
Level Based Trigger
30
Page 31

1 Manual Trigger
button.
- recording started and stopped by pressing
2 Timer Based Trigger
e.g. • Log data every day
Starting at 10:05:00am
• Record 5 samples
• Sample Period = 1 second
• After Recording
Power Down
(30 sec sensor warm up)
10:05:00am
Recording Period
W
Sample Period
= 1 second
Logging Period = 1 day
= 5 Samples
10:05:00am 10:05:00am
Warm up time
= 30 seconds
- data is recorded at regular intervals.
Log Period
Recording Period
Sampling Period
Stay Awake or Power
Down and Warm Up
Instructions
The user selectable warm
up time can be used to
allow sensors to stabilize
before recording begins.
W
Recording
W
Waiting
31
Page 32

3 Level Based Trigger
specified level.
- data is recorded if a sensor reaches a
6 m -
e.g. Trigger if lake level is
above 6m or below 2m.
2 m -
Outside Window Level
Available level trigger opt ions .
Trigger if signal is: Above Below Inside Outside
Level(s)
The Level based triggering option also allows for two more
types of triggering to be used:
•
Pre-Triggering
•
Post-Triggering
32
Page 33

4 Pre-Trigger
- record data for a specified time before a level
trigger occurs (level trigger must also be selected).
Chan 1
e.g.
Acidity
Crater Lake
Chan 2
Vibration
sensor
Instrument Settings
Channel 1 – No trigger setting
Channel 2 – Trigger if quake level is
above 6 on the Richter’s
scale
Pre-Trigger set to 1 hour
Sample period = 1 second
Record for 2 hours
Days/weeks etc. 1 hour data
Press
What is the acidity of a crater
lake 1 hour before an earth
quake?
“Quake”
signal
Quake triggers data logger
Pre-trigger Data after quake
recorded before
quake
2 hours data recorded
after quake
Once Pre-trigger is set, the d ata logger can be left for da ys, weeks
etc. When the specified trigger level occurs, pre-trigger data is
already saved in memory.
33
Page 34

5 Post Trigger
- start recording data to mem ory after a specified
time has elapsed once a level trigger has occurred.
Trigger occurs
Data recorded
Press
6 Enable Channels
record.
Note
: • Faster sampling rates are available if fewer channels
are selected.
• Less memory is used if few channels are enabled.
7 Sampling Period
Water level
Channel 1
Sample
recorded to
memory
Post-trigger time
- select the channels you would like to
- the amount of time between samples.
1 second
sampling
period
Note
: There is a fraction of a sec ond de lay bet ween chann el
1 second
sampling
period
1 second
sampling
period
1, 2, 3 etc. recordings.
34
Page 35

7 Record For…
of samples to take before recording automatically stops.
Note
:If “Auto Repeat Recordings” (under the file menu) is
- the amount of time to record for, or the number
selected and level trigger is also selected, a new file will
be created as soon as the recording time has finished.
This way you can get a separate file every time a lake
level goes into flood for example.
35
Page 36

2.3.2 Setting Display Opti ons
To specify how measured data is to be displayed:
• Access the main menu (see section 2.1.2).
• To display measured data in the form of text, press Display !
Text. The real-time readings are displayed for each enabled
channel.
• To display measured data in a text with minimum and maximum
values, press Display ! Min/Max.
• The min and max values are reset whenever a new recording is
started, or
• To edit the measurement unit for a channel, press Display !
Edit Units… In the Enter Channel Unit window, select the
channel by pressing
unit (see section 2.1.5).
• To edit the name of a channel, press Display ! Edit Names…
In the Enter Channel Name window, select the channel by
pressing
section 2.1.5).
is pressed.
or and then edit the name of the
or , and then edit the name of the channel (see
• To swap temperature units between degrees Celsius, degrees
Farenheit and User defined setup, pres s Display ! Temperature
Units:
Note
: It is possible to change the displayed Temperature units
during a recording by using the Display menu, but any
triggers that have been applied to Temperature channels
may accidentally trigger. The trigger levels that have been
set for any of the temperature channels are not converted
when you change your selection of Temperature units.
36
Page 37

2.3.3 Graph Controls
To view an xy-graph:
• Press Display ! Graph.
The following controls are available wh en viewing a graph. When a
file is being played back, additional cursor and zoom controls are
available.
Option Meaning
Active cursor moves right
(Playback only)*
Active cursor moves left
(Playback only)*
Toggle active cursor (Playback only)*
Zoom In and Out between cursors
(Playback only)*
KEYS 1 – 9, 0
(quick key press)
(quick key press)
(continuous key press)
(continuous key press)
Select channel 1 to 0
Increase y-axis scale
Decrease y-axis scale
Scroll graph up
Scroll graph down
Resets graph settings to default
37
Page 38

*(Playback only) - Cursors are available only when playing back a
file. For more inf orm ation on Playback mode please s ee sec tions 2.5
and 2.6.
o
Ch1 123.8
C !! 257
Channel being
examined
Note
: To leave the “Playback ” environment either press
Value at
active cursor
or select Display ! Exit Playback.
Sample
number at
active cursor
38
Page 39

2.4 RECORDING DATA
2.4.1 Setting Up the Filename
The data recorded in a single recordi ng session is stor ed as a file.
The name of the f ile into which data wil l be recorded is d isplayed at
the bottom of the data-display screen.
• T o edit the nam e of the file, pr ess File ! New Recording. In the
New Recording Setup window, select Filename and edit the
filename in the New File Name window (see section 2.1.5).
• File nam es are automatically num bered after the first recording
e.g. Lake level, Lake level 1, Lake level 2… etc.
2.4.2 Choosing a Folder
For identification purposes, it is convenient to group files that are
related under a common folder.
• To choose the folder under which the recording file is to be
grouped, press File ! New Recording. In the New Recording
Setup window, select Folder, and in the Save Recording in
Folder… window, select the folder.
• If a new folder is require d, pr ess Folder in the Save Recording in
Folder… window, sel ect the new f older, and then press Rename
to edit its name. Then select the newl y created folder in order to
place the recording file in it.
39
Page 40

2.4.3 Starting a Recording
• From the main display screen press
Data will be recorded and displayed according to how the inputs,
trigger, and display options were set up. The sample number is
updated on the bottom right of the screen as the samples are
collected.
The data is recorded into the file and f older you chose earlier (the
name of the file is displayed at the bottom of the screen).
to start the recording.
2.4.4 Auto-Repeating Recordings
If recordings are le vel-triggered, the ins trument can be instr ucted to
take recordings repeatedl y. This is us eful for captur ing the next level
trigger event.
To auto-repeat level-triggered recordings:
• Press File ! Auto Repeat Recordings to check (!) the option.
• To stop a recording press the
key.
40
Page 41

2.4.5 Chained Recordings
The instrument has a maximum capability of approx 60,000 data
points per individual recording. When this size is reached, another
file is created and recording c ontinues witho ut intervention or loss of
data.
Note
: Each sample of each channel uses up a data point, e.g. a 4
channel recording of length 10,000 samples uses up
40,000 data points.
Chained recordings are denoted with an x/ y extens ion. Which can be
interpreted as the xth number part of a total of y parts.
e.g. Untitled 1/2
Untitled 2/2
When transferring to
then the chained recordings will be recombined into a single long
recording.
MAS
, if the entire folder is selected and sent,
41
Page 42

2.5 PLAYING BACK
To play back a recording:
• Press File ! Examine files…
• In the Playback File window, select the recording to be played
back and press
Note
: Recordings can be played back in either the text, bar or
graph display modes, irrespec ti ve of the mode that the y were
recorded in.
• In the data-display screen, press
the samples and
the beginning of the recording ( the sample number is dis played
at the bottom right of the screen). The instrument beeps when
you have reached the first and last samples.
• T he display type and units can be altered i n the playback, any
changes made during p layback are only for the durati on of the
playback. This allows recordings to be viewed in an alternative
view from the way that they were recorded.
• T o exit Playback mode either press
Playback.
Note
: In the Playback File window, there are also options to
rename or erase a folder or recording, create a new folder
and collapse or expand the data tree.
42
.
to move forward through
to move backwards. Press to return to
or Display! Exit
Page 43

2.6 FILE UTILITIES
In the file selection window (File!Examine Files) the following
utilities are available:
Option Meaning
1. Shrink /
Expand
2. Folder
3. Rename
4. Copy
5. Lock
6. Erase
7. Snd to PC
or
Shrinks or Expands the File Folder structure to
make selecting a folder easier and quicker.
Creates a NEW FOLDER.
Renames a file or a folder.
Copies the selected file’s s etup (channel names,
units, trigger type etc.) so that the next
recording’s setup is the same.
Prevents a file from being erased with the
“ERASE” option. T his option can be used to loc k
your recordings so th eir setups are protected a nd
can then be copied at a later date. WARNING:
File! Erase All Memory will erase a locked file.
Erases the selected f ile or folder (does not erase
locked files/folders).
Sends the selected file or folder to the PC (see
section 4).
Selects a file for playback or selects the active
FOLDER to record int o (if Window Title is “Save
Recordings in Folder…”).
43
Page 44

2.7 OUTPUTTING SAMPLES
FROM RS232
Press File!Output Samples to RS232 to send real time data in
ASCII format from the instrument’s RS232 port.
This data can be captured by a PC (e.g. using HyperTerminal).
Channel Number Values
14.5000
6.8251
100.02
99.800
4.6000
6.8252
100.00
200.00
Format of Data
<channel number><space><channel value><CR><LF>
(8 data bits, no parity bit, 1 stop bit)
The default bit rate is 9600 bits/secon d, but it is p ossible to ha ve the
instrument send data at 57600 or 19200 bits/second.
Approximately 200ms between
channel readings
Cycle continuously repeats
To select a higher rate, send the instrument approximately 20 ’Q’
characters (e.g. pres s Q in HyperTerminal 20 times ) at the bit rate
you desire.
Note
: • ‘∗’ characters will be echoed while the ‘Q’ characters are
being transmitted.
• Operating the instrument’s menus may temporary
disrupt the transmission of samples from the RS232
port.
• Transferring files to
transmission.
• When using Timer Trigger, COMs will default to 9600
bits/second after the first wakeup.
44
MAS
cancels RS232 sample
Page 45

UTILITIES
This section outlines the procedure f or perform ing utility funct ions on
your instrument . You will learn to:
• reset the instrument ;
• adjust the instrument LCD;
• set the instrument clock;
• manage the instrument battery pack;
• manage memory usage on the instrument ; and
• troubleshoot the instrument .
WARNING
: Read section 1.4 before operating your instrument .
45
Page 46

3.1 RESETTING THE
INSTRUMENT
Sometimes, due to electrostatic discharge exceeding 8kV, the
instrument may not respond to any key presses (including
presses). In such cases, it is important to reset the instrument as
soon as possible. To reset the instrument :
• Press
simultaneously, once the initialization screen has been
displayed.
Once reset, the instrument displays the Initialization screen and
resumes normal operation. Res etting the instrument does no t erase
data or settings stored in the instrument .
while holding down and then release th em both
46
Page 47

3.2 ADJUSTING LCD
3.2.1 Adjusting Contrast
• Press Sys ! LCD-Contrast…
• To darken the LCD, press
• To restore the default contrast, press
If the screen flickers when cursors are moved, make the LCD darker.
. To lighten it, press .
then .
3.2.2 Turning Backlight On
To toggle the backlight ON and OFF press then .
47
Page 48

3.3 SETTING CLOCK
3.3.1 Checking Date and Time
• Press Sys !Clock.
All recordings are date and time stamped according to the clock
shown in the Date & Time window.
3.3.2 Setting Date and Tim e
• Press Sys ! Clock.
• To cycle to a particular field, press
• To edit the value of a field, press
• Press
If the am/pm hour f ormat is chosen, the hour s witches back to 1 at
the thirteenth hour. If the 24h format is chosen, the hour c ontinues
incrementing until 23 before switching back to 0.
48
when you have finished.
.
and .
Page 49

3.4 MANAGING BATTERY
3.4.1 Instrument Battery
The instrument is powered by a rechargeable Nickel-Cadmium (NiCad) batte ry pack. The normal operating voltage is 6.0 to 8.5 Volts.
Some automatic features have be en built into the inst rument to help
ensure that the battery pack is alwa ys suf f ic ientl y charge d. Be lo w 6.6
Volts, the instrument displays a flashing
corner of the screen and beeps once every minute as a reminder
that the battery pack needs to be charged. Below 6.1 Volts, the
instrument automatically turns off the backlight to prevent further
power draining. Below 80% battery capacity, the instrument
automatically begins to charge the batter y pack (if external power is
supplied). At 5.5 Volts, the instrument automatically powers down.
The power saver is anot her f eatur e tha t he lps c o nser ve po wer on the
instrument – see section 3.4.6.
There is also an internal backup battery that backs up data and
settings in the instrument in the event that the battery pack is
detached from the instrum ent . The backup battery is kept char ged
by the battery pack if the battery pack is functioning normally.
icon at the bottom right
WARNING
more than 2 hours as this will drain the backup battery, thereby
causing data and settings to be lost.
The battery pack can be charged by supplying 13.5 ± 1.5VDC, 1A
power to the instrument charger socket. The power transformer
supplied in the k it provides t his DC voltage . The optio nal car ad apter
charging lead may also be used to charge the battery pack in a
vehicle with a 12-Volt negative-chassis power system.
WARNING
transformer used is an approved ins trument po wer transform er (13.5
± 1.5VDC, 1A output) and that the voltage and frequency of your
mains AC power match that of the power transformer.
: Do not detach the ba ttery pack from the instrument for
: Before charging the batter y pack, ensure that th e power
49
Page 50

3.4.2 Checking Battery Capacity
• Press Sys
The remaining battery capacity and voltage are displayed.
3.4.3 Charging Powered-up instrument
WARNING
• Plug the instrument power transformer into a standard power
outlet and its connector to the instrum ent charger socket. If the
battery capacity is less than 80%, charging begins automatically.
• If charging does not begin automatically, press Sys ! Charge
Batt Charging, as ind icated b y the
begins.
If the
on. Charging stops automatically when complete or you can press
Sys ! Charge Batt to stop it. A full charging cycle takes
approximately 150 m inutes. All other functions are usable while the
battery pack is being charged.
: See the warnings in section 3.4.1.
icon in the dropdo wn menu,
icon is not displayed, ch eck that the mains power is turned
3.4.4 Charging Powered-down instrument
WARNING
• Plug the instrument power transformer into a standard power
outlet and its connector to the instrument charger socket. The
instrument powers up and charging, as indicated by the flashing
“CHARGING” message beside the Charge Batt option in the Sys
dropdown menu, begins.
: See the warnings in section 3.4.1.
If the instrument does not power up, reset the instrument (see
section 3.1), or unplug the power transformer connector and re-plug
it in. See also section 3.4.3 notes.
50
Page 51

3.4.5 Reconditioning Battery Pack
WARNING
Battery reconditioning is the process of first discharging and then
charging batteries. It reduces the undesirable memory effect in NiCad batteries. The batter y pack should be reconditioned when it is
first used (for its capacity to be displayed correctly) and monthly
thereafter (to prevent battery d egr adatio n). T o recondi tion th e batter y
pack:
• Plug the instrument power transformer into a standard power
outlet and its connector to the instrument charger socket.
• Press Sys ! Recondition Batt.
After discharging the battery pack, the instrument automatically
proceeds to charge it. See also section 3.4.3 notes.
: See the warnings in section 3.4.1.
3.4.6 Power Saver
Everytime the instrum ent is powered up, the power sa ver – a power
saving feature – is automatically turned on. With the power saver
turned on, the following occurs autom atically if no keys are pr essed
for a period of time, after 8 minutes the LCD is turned off (but any
key press will turn it on a ga in) a nd af ter 1 5 minutes, the instrument is
powered down. To turn the power saver on or off:
• Press Sys ! Power Saver.
51
Page 52

3.4.7 Replacing Battery Pack
• Lift the boot stand.
• Unscrew the battery pack and screw in the new one using a
suitable screwdriver or coin.
WARNING
not over-tightened – to the instrument .
: Ensure that the battery pack is securely fastened – but
52
Page 53

3.5 ERASING MEMORY
WARNING
ALL
recordings in the instrument .
Before erasing data, you may wish to archive it on your PC (see
section 4.3). To erase all folders and recordings:
• Press File ! Erase ALL Memory…
• In the Erase All ! window, press
for the data to be erased.
To erase only one particular recording or folder, see section 2.5.
WARNING:
default settings. All locked folders and files will be erased.
: Following the proce dure below erases
and together and wait
Erase All Memory will reset the instrument to factory
ALL
folders and
53
Page 54

3.6 TROUBLESHOOTING
3.6.1 Power Problems
Symptom Cause Remedy
Instrument cannot powerupLow battery capacity
Electrostatic discharge
(ESD) exceeding 8kV
Instrument powers down
when backlight turned on
Instrument powers down
shortly after powering up
Flashing icon and
beeping every minute
Low battery capacity Charge battery pack
Low battery capacity Charge battery pack
Low battery capacity Charge battery pack
Charge battery pack
Reset instrument
3.6.2 Data Problems
Symptom Cause Remedy
Data lost when battery
pack detached for more
than 2 hours
Data lost when battery
pack detached for less
than 2 hours
Flat backup battery Charge battery pack
Faulty backup battery Send instrument
authorized dealer for
servicing
to
“Insufficient memory”
displayed
Measured data seems
incorrect
54
No memory sp ace left
for recordings
Sensor wired wrongly
Faulty sensor
Erase obsolete
recordings (transfer to
PC first if necess a r y)
Wire as recommended
Replace sensor
Page 55

3.6.3 Data-Transfer Problems
Symptom Cause Remedy
“No PC ?” displayed, and
data cannot be transferred
to PC
MAS
-3000 unable to
transfer data and “Transfer
failed” or “
Dialog” displayed on PC
MAS
Error
Data-transfer cable not
properly connected
Data-transfer cable
connected to wrong PC
COM port
Baud rate setting in OM-
MAS
3000
Baud rate setting in OM3000
MAS
too high
too high
Re-secure cable
connections
Test COM port
availability and use
available port
Select a lower baud rate
in OM-3000
Select a lower baud rate
in OM-3000
MAS
MAS
3.6.4 Other Problems
Symptom Cause Remedy
Instrument does not
respond to any key press
“Module fault” displayed Module‡ damaged Send instrument to
Electrostatic discharge
exceeding 8kV
Reset instrument
authorized dealer for
servicing
“Switch off then connect
module” displayed
Module not properly
plugged into instrument
Power down instrument
then re-secure module,
making sure not to bend
the connection pins
The “module” is the measurement hardware unit of the instrument . It has the six
‡
temperature measurement channels and 4 voltage measurment channels att ached to
it and is fastened to the rest of the instrument
by means of two M3x0.5x12mm screws.
55
Page 56

56
Page 57

ANALYSIS
SOFTWARE
Recordings made on your instrument can be transferred to the
software running on a Windows
M
easurement Analysis Software.
analyse, print & export your recordings.
It is assumed that the user of
Windows
Windows
commands.
Note
WARNING
commands. Please ref er to the appropriate lit erature on
if clarification is needed on mouse and keyboard
Throughout
a comprehensive topic-specific
the right mouse but ton an ywhere in
up menu of the applicable commands.
: Read section 1.4 before operating your instrument .
MAS
, pressing F1 on your keyboard will bring up
based PC.
MAS
can be used to stor e, graph,
MAS
is already familiar with basic
Help screen
MAS
MAS
stands for
. Also, clicking
will bring up a po p-
MAS
57
Page 58

4.1 INSTALLING OM-3000
MAS
4.1.1 License Agreement
Please read the license and warrant y agreement printed on the CD
cover found in the jewel c ase that t he
MAS
is licensed for individual use and for installation on one
computer. The software contained on the CD-Rom remains the
intellectual proper ty of OMEGA Engineerin g who retain the tit le and
ownership of the software.
MAS
CD-Rom was suppli ed in.
4.1.2 PC System Requirements
The following are the minimum system requirements for installing
MAS
:
• Pentium or better
• 32MB RAM (64MB recommended)
• 10MB hard disk space
• CD-Rom drive
• Windows
• Windows
• Windows
• An unused COM Port for communication with the instrument
58
95, 98, Me, NT or 2000 operating system
compatible displa y and print er
compatible mouse or other pointing device
Page 59

4.1.3 Installing OM-3000
• Close all programs on your PC.
MAS
on PC
• Insert the
• Wait for the
OR
Run the
• Follow the instructions given to complete the installation.
MAS
CD-Rom into the CD-Rom drive.
MAS
Installation program to automatically start.
MAS
Install.exe program located on the CD-Rom.
59
Page 60

4.2 STARTING UP
MAS
4.2.1 Starting up
• Click Start ! Programs ! OM-3000 ! OM-3000 MA S 5.00
4.2.2 Configuring PC COM port
• To allow data transf er between the instrument and t he PC, you
must first configure your PC COM port as follows:
• Connec t the instrument to one of the COM ports usin g the data-
transfer cable and power up the instrument .
• Click Tools menu! Configure COM port.
• Select the COM port that the instrument is connected to.
• Select a baud rate. The baud rate is t he speed (in bits/secon d) at
which data is trans ferr ed. The lo wer t he baud rate, the less lik ely
are data-transfer err ors. Automatic is the default cho ice as it is
sufficient for normal transfers.
• Click Test port
• Click Yes in the Confirm window to test the connection.
Connection failure may be due to the selection of the wrong
COM port in
connectors being not p lugged in properly, or the PC serial port
being not set up properly. If the con nection is good, co ntinue as
follows:
• Click OK in the sec ond confirm windo w to acknowledge that t he
instrument is attached to the COM port.
• Click OK to leave the
60
MAS
, the instrument being not powered up,
MAS
Configuration window.
Page 61

4.3 TRANSFERRING DATA TO
THE PC
Data transferred to the PC is stored in
and have the .das extension.
To transfer data from the instrument to the PC:
• Turn on the instrument Check its battery capacit y and if less than
30%, charge the battery pack.
• Connect the RS232 por t of the instrument to the configured PC
COM port using the data-transfer cable. On the PC click the
Receive button.
• On the instrument , press File menu! Examine F iles… Use the
arrow keys to select the individual recording or folder to be
transfered. If a folder is highlighted, all recordings within the
folder will be transferred.
• Press
Once the data-transfer is complete, the data will appear in the
current file in
a new file.
• To append more data fr om the instrument to the c ur rent f i le, c lic k
the Receive button.
• Alt ernatively, to receive more data but in its own new file, click
File menu ! Receive from OM-3000 ! Transfer to a New File.
SndToPC to send the selected recording or folder.
MAS
or if no files wer e ope n, the d ata wi ll app ear i n
MAS
files. These are text files
• To save the data in the current file, click the Save button, nam e
the file and click Save. If the file was an already existing file,
clicking the Save button will autom aticall y save the fil e under th e
same name and in the same location on the PC.
61
Page 62

4.4 MANAGING DATA
4.4.1 Opening a File
• Click Open button and select the file.
4.4.2 Merging Two Files
• Open one of the files.
• Click File m enu! Import & Merge a file… and select the other
file to be merged into the open file.
The merged data can be viewed but is not autom atically saved on
the computer. To save it, click File menu! Save or Save As.
4.4.3 Using the Navigator
When a file is open, the navigator that consists of two boxes is
displayed on the left side of the s creen. The top box shows all the
folders in the file. The bottom box shows all the recordings in the
selected (highlighted) folder above.
4.4.4 Deleting Data from a Folder
• Select the folder in the Folder section of the navigator.
• Using the navigator, select the individual recordings and/or
channels to be deleted.
• Click File ! Delete, or press the Delete key. You will then be
prompted to confirm that you wish to delete the selected
recordings/channels
62
Page 63

4.4.5 Editing Recording De tails
• Select the folder, and th en the recordin gs and/or channels to be
edited.
• Click the Info tab to access the Info page wher e you can e dit the
User Details (eg. Company Name, instrum ent serial number…),
Folder Name, and the Recording Details (eg. recording name,
remarks, channel labels and un its …) .
• From the Edit User Details screen there is access to edit the
Default User Details. These values are written to all future
recordings, while they are being transferred from the instrument .
4.4.6 Viewing and Printing Da ta Values
• Open the file and using the navigator, select the recordings
and/or channels to be viewed and/or printed.
• Click the Values tab. T he data in the selec ted recordings and/or
channels can now be viewed.
• To change the value in a cell, clic k the cell and type in the new
value.
• To reduce the amount of data by averaging, click the Average
button.
• To print the data, click the Print button.
• To copy the values to a s preadshee t progr am , click the Copy (to
clipboard) button, go to the Spreadsheet program and use its'
"Paste" command.
• To print a report on the data, click File ! Summary Report
Full Report** and s elect the pr int option in the Data Summary or
Report Generator window that appears.
§ The Summary report produces a data summary about the selected
recordings/channels. For more information consult the MAS help file.
§
or
63
Page 64

4.4.7 Exporting data
• In the Navigator select the folders or r ecordings to be exported
as a .das file.
• Click File ! Export and select the option required.
• Provide the nam e and location of the export file t o be produced
and then click the Save button.
** The Full report produces an exact printout of the pages selected in the report
generator window. For more information consult the MAS help file.
64
Page 65

4.5 CALCULATING DATA
You can perform calculations on your r ecorded d ata b y creati ng ne w
"calculated" channels:
• Open the file and using the navigator, select the recordings
and/or channels to be used in calculations.
• Click the Values tab to displa y the data and click the Calculate
button to access the Calculate window.
• Each channel is automatically given a "
used to identif y the channel. It is a lett er of the alphabet t hat c an
be used to reference the values of a recording for use in
calculations.
• Expressions can then be derived using the provided functions
and the channel tags
eg. TempChange = ChangePerHr(B) with units degC/hr
This example will create a channel called
"TempChange" which is calculated as the rate of
change per hour of the channel which has tag 'B'.
• Constants can also be used in calculations. You may need to
use constants in your expressions, for example:
To find the "difference from the mean value" for a particular channel,
say the channel represented by "
A constant should be defined to provide the mean value of
channel 'D', "K0 = Mean(D)"
This constant is then used in the express ion,
"DiffFromMean = D – K0"
††
.
tag
" 'D'.
tag
" character that is
See Appendix OM-3000
††
MATH for a complete list of functions available.
MAS
65
Page 66

4.6 PLOTTING DATA
4.6.1 Plotting Single and Individual Charts
• Open the file and using the navigator, select the recordings
and/or channels to be plotted.
• Select the Chart tab and click the Plot button. You can also plot a
recording or channel by double-clicking it in the navigator.
• To display the selected recordings and/or channels on individual
charts, click the Individual button.
• To change the format of charts, click the Adjust button to access
the Adjust Axes & Colors window. This window allows for
changes to be made to the axes and colors of the plotted
recordings displa yed on the chart.
• To clear all plotted recordings, click Chart menu ! Clear Chart.
To retain existing plots when adding to the chart, click the Hold
button. A maximum of 16 plots can be displayed at a time
To enlarge a chart, you can hide the legend by clicking Chart menu
! Show Legend. You can also Hide the navigator by clicking
Window menu ! Show Navigator.
66
Page 67

4.6.2 Zooming & Panning
To zoom in on any part of a chart:
• Click a point to the left of that part of the chart and drag a
rectangle across and down to the right over the section to be
enlarged (while holding down the lef t mous e butt on) . Re le ase th e
mouse button to perform the zoom.
To zoom in horizontally:
• Proceed as above, but only move the m ouse direc tly up or down
to select the area to be enlarged. Two horizontal lines will be
displayed across the chart to indicate the selection.
To zoom in vertically:
• Proc eed as abov e, but onl y move the m ouse dir ectly lef t or ri ght
to select the area to be enlarged. Two vertical lines will be
displayed across the chart to indicate the selection.
To unzoom from any view:
• Left click on any point in the chart and drag a rectangle up and to
the left to display a rectangle with a cross in it. When the m ouse
button is released all zoom ing will be undone and the char t will
be returned to its original view.
Panning
• T he chart displayed can be dragged i n any direction to dis play
sections that are hidden from the current view. To pan around
the chart click and h old down th e right m ouse but ton in the chart
display. The curs or will turn into a pointing hand icon. Drag the
mouse pointer in the direction that you wish to move the chart.
Note:
If you move the cursor of f the chart, you will have to re lease
the right mouse button and return it to within the chart
boundaries to continue panning.
4.6.3 Printing Charts
• Click Print while the chart is displayed and choose the color
scheme for printin g (e.g. Black & White, Full Color or Color on
White bkgnd)
67
Page 68

4.6.4 Reading and Comparin g Values
To place cursors on charts to read the data values on curves:
• Plot the recordings and/or channels on a single chart.
• To place a cursor at a particular point on a curve, place the
mouse cursor at that point, follow the curve until a crosshair
appears, and then click the left mouse button. If the default
cursor options are used, the cursor com prises a hori zontal and a
vertical dashed l ine, and the values ind icated by the cursor are
displayed at the edge of the chart next to the dashed lines.
• To move the cursor to a differ ent point on t he sam e curve, pres s
the horizontal arro w k e ys. T o move in small steps , hol d d o wn the
Ctrl key when pressing t he horizontal arrow ke ys. You can also
move the cursor by clicking the left mouse button on the new
point (first allowing a crosshair to appear).
• To move the cursor t o a different curve, push the vertical arrow
keys. Alternativel y, click the left mouse button on the new curve,
or on the appropriate symbol on the legend.
• To place a second c ursor on the chart, place th e mouse cursor
at the point of interes t, foll ow the cur ve u ntil a cros shair ap pears ,
and then click the right mouse button. If the default cursor
options are used, the dif ference be tween th e values indicate d by
the cursors is shown at the t op right corner of th e char t. Curs or A
corresponds to left mouse button and cursor B to the right.
• To toggle the focus between t he cursors, push the spac e bar, a
cursor must be focused before it can be moved using th e arrow
keys. A cursor is focused if it has a rectangular target.
• To clear the cursors, push the Esc key.
• To change cursor options, click Chart menu ! Cursor Options....
68
Page 69

EXAMPLE
cursors displayed (using the default cursor options).
Each cursor displ ays the x and y axis va lues and the difference in
both the x and y axis values of the two cur sors in the top rig ht hand
side of the chart.
: a two-channelled temperature recording with both
69
Page 70

4.6.5 Plotting Waterfall Charts
• Plot the recordings and/or channels on a single chart.
• Click Chart menu ! Waterfall Chart and select the depth
required.
Waterfall charts are useful for trending data behaviour. As on
ordinary charts, cursor and zooming functions can be used on
waterfall charts.
EXAMPLE
to three sets of data pertaining to the same measurement point. It
can be seen that the peak value has a rising trend.
: the four curves on the waterfall chart below correspond
70
Page 71

4.7 UPGRADING FIRMWARE
When an upgraded instr um ent firm ware versio n is a vaila ble, it wil l be
posted on the OMEGA website. Once you have obtained the
firmware file, the firmware can be upgraded using the
reprogramming procedure below.
WARNING
• Check the instrum ent battery capacity and if it is less than 30%
charge the battery pack.
• Connect the RS232 por t of the instrument to the configured PC
COM port using the data-transfer cable.
• Po wer up the ins trument and tr ansfer an y data you wish to keep
to
• In
Reprogram window click the Reprogram button! Automatic
search.
: Upgrading the firmware erases all data in the instrument.
MAS
on a PC.
MAS
click Tools menu! Reprogram OM-3000. In the
• Click Select Drive to Search a nd select the drive wher e the ne w
firmware version is located.
71
Page 72

• Click Start S earch, and when the sear ch is com pleted select the
new firmware file.
• Click Start Reprogram using this file.
Once the reprogramm ing is complete, the instrument will be ep and
the Initialisation scr een will appe ar. If an error oc curs, check that the
data-transfer cable has been connected properly and that the
instrument is powered up.
72
Page 73

Appendix
SPECIFICATIONS
The following are the specifications for:
• instrument firmware version 2.10
MAS
•
These specifications may be changed in future versions.
software version 5.00
73
Page 74

Model:
OM3000-T6V4
Specifications
Range
T Type Thermocouple
E Type Thermocouple
J Type Thermocouple
K Type Thermocouple
Voltage
Common Mode Range
Resolution
Temperature
Voltage
Accuracy
Temperature
Voltage
Common Mode Error
Minimum Sampling
Interval
Data Logging
Data Storage Format
Data Storage
Folder Name
Display
Resolution
Viewing Area
Backlight
Repro gram Allows internal firmware to be upgraded via built -i n serial port
Communications
Baud Rate
Channel Organiz a tion
Termination
Temperature
Voltage
Input Impedance
Temperature
Voltage
Isolation
Battery
Type
Voltage
Capacity
Operating Time
Charger & Conditioner
Fast Charge Rate
Discharge Rate
Mechanical
Size
Weight
Environmental
Temperature/Humidity
Operating
Storage
EMC
© 2000 Omega Engineering Ltd,. The manufacturer reserves the right to modify specifications
6 Temperature Chan n els
Incorporating 4 Voltage Channels
-418 to +743°F (-250 to +395°C)
-418 to +1823°F (-250 to +995°C)
-346 to +2183°F (-210 to +1195°C)
-418 to +2498°F (-250 to +1370°C)
±5VDC and ±30VDC (user-selectable)
±30VDC (voltage channels only)
Above -148°F (-100°C): 0.1°F or °C
At or below -148°F (-100°C): 1°F or °C
±5VDC: 200µV (0.0002V) ±30VDC: 1mV (0.001V)
Above -148°F (-100°C): ±0.1% of reading ±0. 9°F ( 0.5°C)
At or below -148°F (-100°C): ±1% of reading ±0.9°F (0.5°C)
±5VDC: ±0.3% of reading ±0.6mV
±30VDC: ±0.3% of reading ±3mV
0.1% of common mode voltage
Number of channels
selected (userselectable)
1
2
3
4
5
6
7
8
Up to 50 named folders
Multiple recordings per folder
Recording length: 1 sample … entire memory
512 kilobytes – approximately 400, 000 indiv idual data points
Up to 16 alphanumeric characters
LCD with graphic capabilities
240 x 128 pixels
4.3" x 2.3" (110mm x 60mm)
Electro-luminescent
RS232
9600, 19200, 57600 bits per second
Any combination of up to 8 channels for any recording
Sockets accept miniature thermoc ouple twin blade plug
Screw terminals
Channels 1, 2, 3, & 4: greater than 100k
Channels 5 & 6: 30k
Channels 7, 8, 9, & 0: 2M
50VDC minimum Between inputs and
Custom Nickel-Cadmium pack
7.2V nominal
1500mAh nominal
13 hours nominal with backlight off, 7 hours nominal wi th backlight on
Built-in dual rate charger – automatic and m anual c ontrol
0.7A nominal
0.5A nominal
9.7" W x 6.1" L x 3.0" H (247mm x 154mm x 75mm)
4.4lb (2kg)
32°F to 122°F (0°C to 50°C) / 80% RH 32°F to 86°F
70% RH 32°F to 122°F
14°F to 140°F (-10°C to 60°C) / 95% RH
EN50081-1
EN50082-1
Voltage channels
only selected
(seconds)
0.2
0.3
0.4
0.5
Ω
Ω
Ω
Temperature or
temperature and
voltage channels
selected (seconds)
0.2
0.3
0.5
0.6
0.7
0.8
0.9
1.0
Remarks
Operating temperature range is determined by operating
range of thermocouple.
Differential inputs.
Voltage allowed between channels and input ground.
Effective resolution decreases at or below -148°F ( - 100°C).
Temperature measurement accuracy depends on
and thermocouple accuracy. Only
T6V4
accuracy is given here.
(23 ± 5°C), charger off. See Appendix Optimizing Temperature
Accuracy.
Minimum time to scan all
channel.
Sampling interval is programmable from 0.2 seconds to 60
hours.
User-specified name entered from keypad.
Each recording has unique time/date stamp.
Supports long recordings by chaining 60,000 data point
recordings. Each ample contains one data point per channel.
Non-volatile memory (battery backup). Number of samples
depends on the number of recordings and the variability of the
readings.
Download firmware updates from the Omega website.
15kV ESD protected. Cable with DB9 connector included.
Automatic baud rate selection.
Channels 5 & 9 and 6 & 0 are shared.
Blades spaced 5/16" (7.9mm) center-to- c enter.
Terminal-to-terminal.
Terminal-to-terminal (channels 5 & 9 and 6 & 0 are shared).
1MΩ per terminal to input ground.
No isolation between channels.
Power transformer (13.5 ± 1.5VDC, 1A output ) included in kit.
2.5 hours for complete charge nominal.
Combats Ni-Cad battery memory effect.
Including protective boot.
Including protective boot and strap.
Non-condensing.
Non-condensing.
Radiated and conducted emissions.
RF field, ESD and fast transient immunity.
OM3000-T6V4
OM3000-T6V4
temperature 73 ± 9°F
selected channels - not each
outputs e.g. RS232 port.
OM3000-
OM3000-T6V4
74
Page 75

Appendix
Application Notes
6.1 Application Note 1
Using the
Description
The internal circuitry of the
one of eight differential input channels (8 channel multiplexed differential
input A/D converter).
Four of these multiplexed inputs are dedicated to measuring
•
thermocouple voltages (CH1 to CH4).
Two multiplexed inputs are dedicated to measuring voltages up to
•
30VDC through resistive dividers (CH7, CH8).
The remaining two multiplexed inputs share resistive dividers (CH9 and
•
CH0) with an additional two thermocouple channels (CH5 and CH6
respectively). These inputs can be used for either (but not both) voltage
or temperature measurement, depending on the channel number
selected.
All channels (and the module ground) are isolated from instrument
circuitry and the serial cable, battery etc. If only one channel is connected,
then there is no need to consider the effects of common mode voltage or AC
noise.
Module’s Common Mode Inputs
T6V4
T6V4
module measures low-level signals from
internal
75
Page 76

However, the channels are not isolated from each other. Each channel has
differential inputs (ie. they measure the voltage between +ve to -ve), which
allows non-isolated voltage sources to be measured provided:
common mode voltage restrictions are observed;
•
the effect of common mode voltage on accuracy is understood; and
•
channel-to-channel leakage current through the
•
allowed.
Restrictions
T6V4
module is
For safety:
respect to ground potential) to any input pin. This includes thermocouples
that are not isolated but measuring the temperature of a metallic object at
high voltage.
WARNING: The isolation within the
To avoid damage:
thermocouple input pins, or greater than 5V between any thermocouple input
pin and module ground. (This will damage the protection diodes in the
multiplexer – see the “
Example: To measure the temperatures of both terminals of a 12V battery it
is essential to use isolated thermocouples.
To avoid incorrect readings:
input to exceed + or - 5V with respect to the module ground. (This ground
will float to some intermediate value depending on the voltages present on
voltage and thermocouple input pins.) If any one input pin goes out of this
range, all inputs may read incorrectly. Example: Measuring voltage from a
12V battery on CH7 while measuring temperature on CH1 from a nonisolated thermocouple at a potential greater than the battery positive –
current will flow in through the thermocouple wire, through the input of the
multiplexer, and out through the resistive divider of channel 7. This may
cause either or both of the readings to be completely incorrect.
Do not apply voltages greater than SELV (see Section 5) (with
module is not intended to
T6V4
protect the user from hazardous voltages.
Do not apply more than 10V between any of the 12
T6V4
Module Equivalent Input Circuit” diagram below).
Do not allow any voltage on any multiplexer
To minimize common mode errors:
channels is as small as possible, or at least smaller than the voltages being
measured. The best way to do this is to isolate the input sources, in that way
the instrument
voltage. Sometimes this is not possible, for example when measuring motor
current with a shunt and motor voltage, or measuring the temperature of
both sides of a power diode (less than 1V across it) by directly soldering on
thermocouples. In these cases, common mode errors need to be kept in
mind or checked (see examples 1 and 3).
input circuitry itself holds all input sources to the same
Ensure the voltage difference between
76
Page 77

To avoid problems with common mode noise:
(See Application Note 2)
When isolating signal sources, ensure that the impedance of this isolation is
significantly higher than the
instrument's
input impedance (for AC signals
too). If this is not so, common mode voltages applied may be larger than
when they were not isolated. Example: long cable and thermocouple runs,
when isolated, may act as aerials and pick up large AC voltages (say
50VAC) which would overload the input of the multiplexer, resulting in
erroneous readings or even damage.
Module Equivalent Input Circuit
T6V4
Protection
Diodes
(CH7, CH8, CH9, CH0)
+5V
Four Voltage
Inputs Like This
Two Sha r ed
Thermocouples
Four More
Dedicated
Thermocouple
Inputs Like This
-5V
Protection
Diodes
+5V
-5V
Switch
Array
A/D
Inputs
150k
Equivalent Input
Structure
Switch
Array
Ω
77
Page 78

Examples on Application Note 1
Differential measurements can be confusing to understand. The best way of
explaining is with examples.
Example 1:
+24V
- +
Example 2:
Measuring supply current and supply voltage to a DC motor.
24-Volt Motor
+ -
Max 30 Volts DC on Volta ge Inputs
123456
GND-7+-8+-9+-0+GND
Measuring signals in a multi-channel 4-20mA system.
78
Max 30 Volts DC on Voltage Inputs
123456
GND-7+-8+-9+-0+GND
Page 79

Example 3:
Measuring case temperature of both sides of a forward
conducting power diode while it is operating at SELV (saf ety extra
low voltage).
Ma x 30 Vol t s D C o n Vol ta ge Inp ut s
123456
GND-7+-8+-9+-0+GND
79
Page 80

6.2 Application Note 2
Instrument Grounding
In an industrial environment it is common to have AC and/or DC
voltages between conductive surfaces that are not bonded together.
Conductors that are assumed to be isolated may in fact have a DC
leakage, a 50Hz/60Hz AC voltage from inductive or capacitive coupling,
or a continual presence or bursts of r.f. voltage (emc).
When using the instrument to measure DC voltages that are not referenced
to ground (ie. one point bonded to ground by a low impedance), then
connecting a thermocouple to another conductive surface can cause the
voltage readings to alter (i.e. become incorrect). It is necessary to check for
errors, by observing the voltages while connecting the thermocouple.
In such an environment it is recommended that the metal surface to which
the thermocouple is connected, is grounded or wired to the GND terminal of
T6V4
the
module, as shown in examples 1 or 2.
Note
: 1. Because the GND terminal on the
of the allowable differential voltage range, if the ground of a
grounded PSU is connected to the GND terminal, the PSU
voltage may not exceed 30V (e.g. do not connect a grounded
48V supply to the instrument
2. Uninsulated thermocouples cannot be used for measuring
temperatures of conductive surfaces that are of different
voltages.
80
T6V4
module is the center
as in example 3).
Page 81

Examples on Application Note 2
Example 1:
+24V
- +
Example 2:
+24V
- +
Connecting an isolated PSU to the instrument with thermocouples
on a grounded or isolated conductive surface.
Max 30 Volts DC on Voltage Inputs
123456
Ground Wire
+12V
Connecting a grounded PSU to the instrument
GND-7+-8+-9+-0+GND
with
thermocouples on a conductive surface.
Optional Ground Connecti on
Max 30 Vo lts DC on Voltage Inputs
Ground
+12V
123456
GND-7+-8+-9+-0+GND
Ground
81
Page 82

Example 3:
Grounding to the instrument
GND terminal with a PSU with -ve to
ground.
Grounded PSU
Max 30 Volts DC on Vo ltage Inputs
123456
+ -
Ground
GND-7+-8+-9+-0+GND
Other Voltages
The PSU voltage is limited to +30V, and any other non-isolated voltages m easured
are limited to within the range of -30V to +30V relative to ground.
82
Page 83

Appendix
Optimizing Temperature
Accuracy
For optimum accuracy when measuring temperature, the
internal temperature needs to be stabilized.
This is best achieved by connecting the thermocouple, turning the
instrument
Begin your actual measurement or recording immediately after the 30-minute
stabilization period.
For optimum accuracy, the battery charger should not be operated while
measuring temperature.
The “power saver” must first be turned off – see Section 3.4.6 for more details.
‡‡
on and then leaving it on for 30 minutes‡‡.
instrument
83
Page 84

84
Page 85

Appendix
OM-3000
MAS
MAS
MASMAS
The following are the mathematical functions and operators that can be used
in OM-3000
The symbols A,B,C,… represent channel tags; and L1, L2, …, Ln represent
logical expressions (e.g. int(A) > 3).
The notation used for functions and operators is similar to that used in
common computer-programmin g lang uag es and spreadsheet programs.
MAS
calculations.
MATH
85
Page 86

8.1 FUNCTIONS
8.1.1 Mathematical Functions
Function Meaning
Abs(A) Absolute value
Cos(A) Cosine
Deg(A) Convert from radians to degrees
DegC_to_DegF(A) Converts Celsius to Fahrenheit
DegF_to_DegC(A) Converts Fahrenheit to Celsius
Exp1 Base of natural logarithm, e (constant)
Exp(A) Exponent
Frac(A) Fractional part
Int(A) Integer part
Ln(A) Natural logarithm
Log(A) Base 10 logarithm
Max(A, B, … ) Return the maximum value
Min(A, B, … ) Return the minimum value
N Sample number (starting from zero)
Pi
Power(base, power) base to the power of power e.g.
Rad(A) Convert from degrees to radians
Round(A) Rounded value
Sgn(A) Sign (-1 if negative; +1 if positive; 0 if zero)
Sin(A) Sine
(constant)
π
Pow(A,3) gives A
Pow(3,k1)
Pow(A,B)
3
86
Page 87

Function Meaning
Sqr(A) Square
Sqrt(A) Square root
Tan(A) Tangent
ChangePerDay(A)
ChangePerHrs(A)
ChangePerMin
ChangePerSec
SumOverDays
SumOverHrs
SumOverMins
SumOverSecs
Rate of change (differentiation)
e.g. If channel ‘A’ changes smoothly from 10 to
25 over a 1 minute period, then
ChangePerMin(A) will be 15 over that period.
Summation over time (integration)
e.g. If channel ‘A’ is a 2hr recording with all
values = 3.5, then SumOverHrs(A) changes
smoothly from 0 to 7 over the recording.
87
Page 88

8.1.2 Iterative Functions
The following iterative functions can be used for constants only. Cell level
expressions cannot contain iterative functions.
Function Meaning
Count(A) Number of sample s
Maxsample(A) Maximum sample value
Mean(A) Mean
Minsample(A) Minimum sample value
Stddev(A) Standard deviation
Sum(A) Sum
8.1.3 Logical Functions
Function Meaning
AND(L1, L2, …, Ln) Logical AND e.g.
AND(n = 10, k2 > 0.5, k3 > 0.5, k2 <> k3)
False Logical constant, has value 0
OR(L1, L2, …, Ln) Logical OR e.g.
OR(k0 = True, k1 < 3, n >= 30)
True Logical constant, has value 1
AOR(L1, L2, …, Ln) Logical AOR (exclusive OR) e.g.
AOR(k0 = True, k1 < 3, n >= 30)
NOT(L1, L2, …, Ln) Logical NOT e.g.
NOT(k1 =True, k2< 10, n>30)
88
Page 89

8.1.4 Conditional Functions
Function Meaning
IF(L1, true result, false result)
If logical expression L1 is true,
execute true result, otherwise
execute false result e.g.
IF(k2 > k3, k2*A, k3*A)
IF(k0 = True, n, n*2)
IF(n < 10, n, Log(n))
8.1.5 Date and Time Functions
In OM-3000
floating-point number. The integer part of the number represents the date: it
is the number of days since the first day of 1 AD. The fractional part of the
number represents the time: it is the proportion of time that has passed since
the beginning of the day.
Function Meaning
Date(year, month, day)
Time(hour, minute, second, ms)
Elapsed(sample number)
SampleDate(n) Date of the nth sample
SampleTime(n) Time of the nth sample
MAS
, the date and time value of when a sample is taken is a
Return the date in OM-3000
format e.g.
Date(1999, 07, 25)
Return the time in OM-3000
format e.g.
Time(16, 59, 31, 965)
Return the date and time of the
sample in OM-3000
DAT(36)
MAS
format e.g.
MAS
MAS
89
Page 90

8.2 OPERATORS
8.2.1 Logical Operators
Operator Meaning
< Less than
<= Less than or equal to
<> Not equal to
= Equal to
>= Greater than or equal to
> Greater than
8.2.2 Arithmetic Operators
Operator Meaning
+Addition
– Subtraction
/ Division
* Multiplication
The order of precedence is as in standard arithmetic (i.e. /, *, +, –). An
operand between two operators of different precedence is bound to the
operator with higher precedence. An operand between two equal operators
is bound to the one on its left. Expressions within parentheses are evaluated
before being treated as a single operand.
90
Page 91

 Loading...